thomas hamacher, john sheffield
TRANSCRIPT
Thomas Hamacher, John Sheffield
Development of Fusion Power: What role could
fusion power play in transitional and developing countries?
IPP 16/1 August 2004
Development of Fusion Power: What role could fusion power play in transitional and developing countries? Co-ordinated by Thomas Hamacher (IPP Garching) with support from the EFDA. Additional support provided by John Sheffield (JIEE at the University of Tennessee) with support from the US-DOE. Summary and conclusions The objective of the workshop was to investigate the possible role of fusion power in transitional countries like China and India. These countries are experiencing a dynamic development of their economies and an associated rapid increase in energy demand and electricity production that is expected to continue throughout this century. In this situation, fusion – the energy source of the sun and other stars – is seen as a potential contributor in the latter half of this century and beyond. Fusion energy could be an attractive option because it has good safety and environmental characteristics and the basic fuel, deuterium, is practically unlimited. It appears that fusion energy (only magnetic fusion was considered) could be deployed under the same international safeguards systems that are used for fission. In general, the future world energy demand, driven mainly by the need to raise standards of living across the world, will require the introduction of new energy technologies on a massive scale. When climate change considerations are taken into account this need becomes even more acute. Because these new technologies must be deployed extensively in the transitional and developing countries, a global development effort will be required in each case. The development of fusion energy, which has had a world-wide collaborative aspect for many decades is a model for how such ventures can be undertaken. It is particularly timely that the ITER project will be realised as a joint effort of many countries. It is timely also because the realisation of fusion energy is still many years away. A world effort will be needed to deploy it in time to affect energy production in this century and beyond, when it may be necessary to not only provide much more energy but also substantially reduce greenhouse gas emissions. The magnitude of the additional annual energy, and the associated increase in electricity production, required in the transitional and developing countries will be hard to achieve without the broadest range of options. New facilities will be required both to meet the increased demand but also to replace outdated equipment. All energy sources will be required to meet the varying needs of the different countries and to enhance the security of each one against the kind of energy crises that have occurred in the past. In fact, fusion energy is viewed as an important potential option in the latter half of this century for transitional and developing countries including China, India and Korea – more than a third of the world’s population.
1. Introduction 1.1 . Objectives Fusion – the energy source of the sun and other stars – is considered to be a practically unlimited source of heat and electricity. Fusion offers favourable safety and environmental characteristics. Catastrophic accidents can be excluded. The radioactive waste produced will decay on time scales of hundred years. First economic estimates show, that fusion could win considerable market shares in the future given that politics to reduce greenhouse gas emissions are set in force (Barabaschi, 1996). The development of fusion energy will reach a significant milestone with the construction of the International Thermonuclear Experimental Reactor (ITER). ITER will demonstrate the plasma conditions and use many of the technologies of a magnetic fusion power plant. Successful conclusion of the ITER program, and the parallel development of materials needed for fusion, would lead to the opportunity to develop and deploy fusion power plants. Questions then arise as to what conditions would be needed for the widespread use of fusion power. Numerous studies indicate that much of the future increase in energy demand will occur in the countries of Asia, Africa and Latin America. Therefore, it is important to understand the conditions under which fusion could play a role in these developing and transitional areas. This workshop addressed the potential role of fusion power in China and India. The evolution of fission power in Korea was discussed as an example of the introduction of a new energy source. Interestingly, China and Korea have joined the ITER project - since the workshop, India has indicated it will join as junior partner through the United Kingdom 1.2. Methodology A small number of experts were invited to a two and a half day meeting to hear presentations on the various aspects of the area and to establish the conditions under which fusion might play a significant role in the future. The principal topics were: The global energy situation and outlook. Future energy demand and supply in China and India. Opportunities for nuclear (fission) power in a carbon-free future. The evolution of fission power in Korea. The future availability of oil and gas. Fusion energy and ITER. Energy and geopolitics in Asia in the 21st Century. Proliferation: Can fusion energy be applied everywhere. The agenda of the meeting and the list of participants are in Appendices A and B respectively. 1.3. Key Questions It was assumed in the discussions that fusion energy would be available in the latter half of the 21st century. The important questions were then: • What would energy demand be in the various areas of the world at that time? • What energy resources would be available? Notably the fossil fuels that dominate today‘s supply. • The investment outlook for fossil fuels • What impact would environmental considerations play and the possible contribution of fission
(nuclear) power? • What would the geopolitical considerations be for China and India, that would have a combined
population of over 3 billion people and an expected massive growth in energy use? • Would concern about proliferation be a major obstacle to the widespread deployment of fusion
power plants? What could be learned from the actual deployment of fission power?
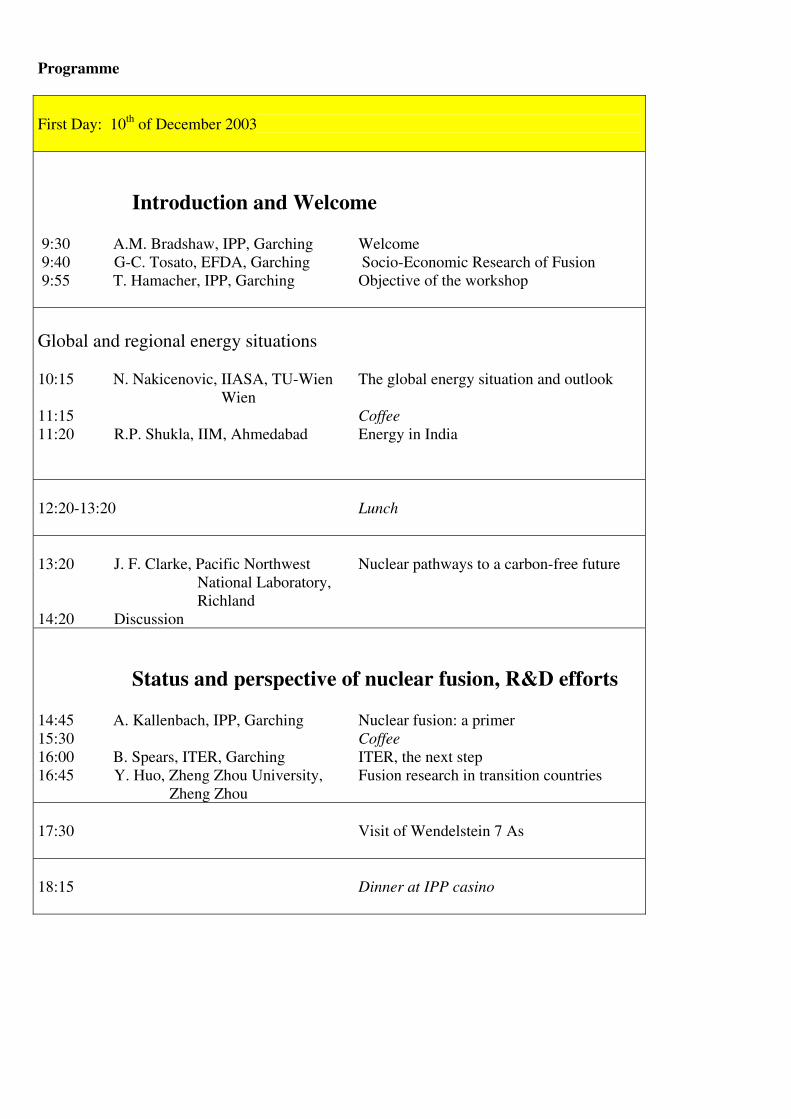
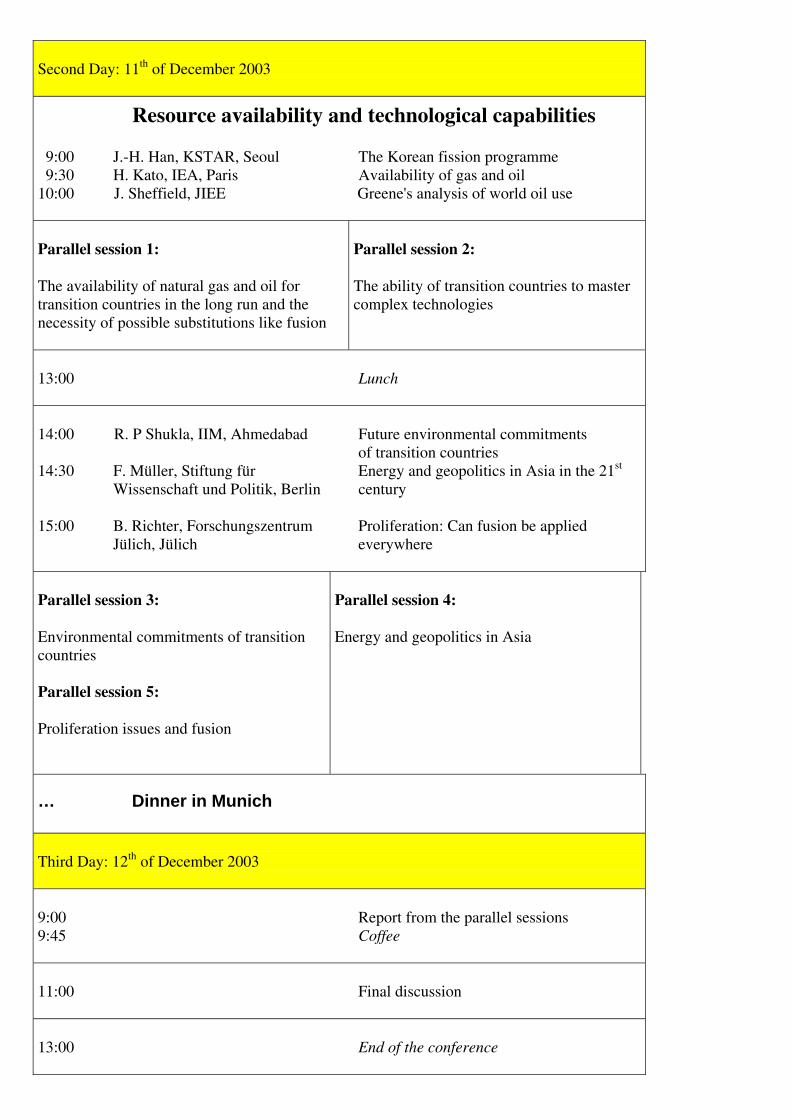
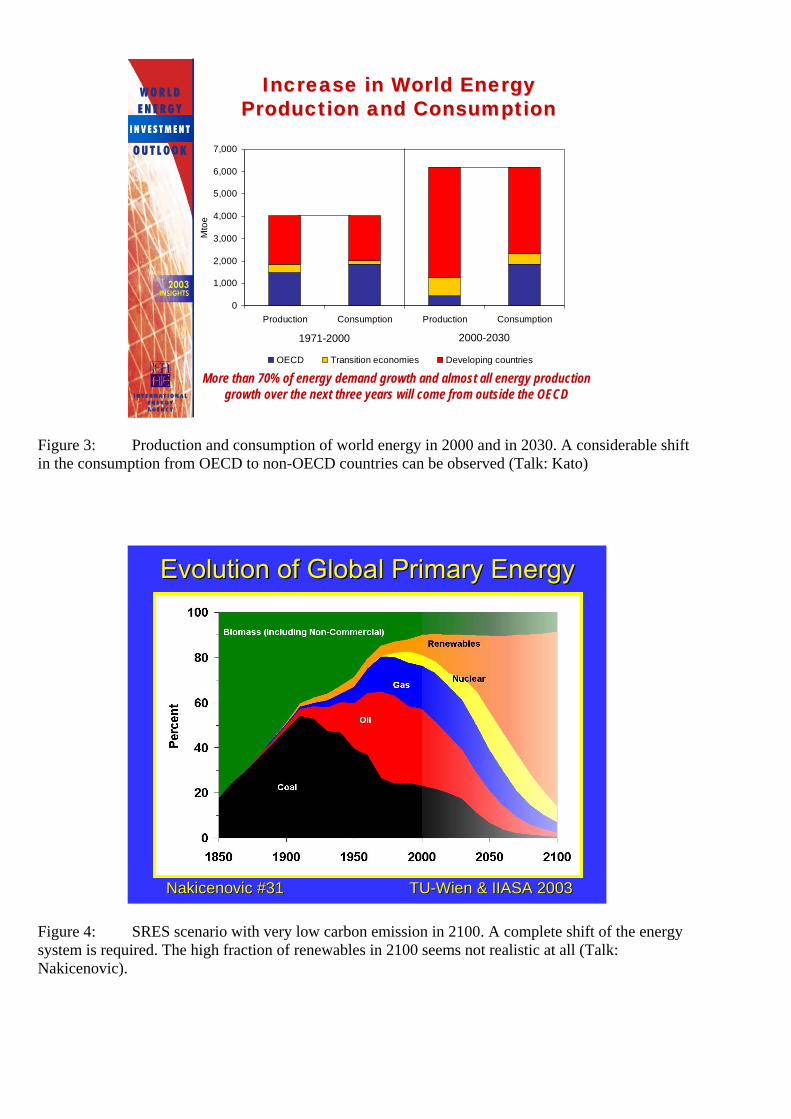
2. Findings in regard to world energy and environment 2.1. World Population and Energy Demand Over the 21st century it is expected that the world’s population will rise from 6 billion to around 11 (8-14) billion people, Figure 1. The need to raise the standard of living of the poorer people will lead to an increase in per capita energy use in the countries of the developing and transitional parts of the world. That such changes will occur is quite consistent with the history of the last two centuries, in which population increased 6 times, life expectancy 2 times, and energy use (mainly carbon based) 35 times. Interestingly, carbon intensity (grams per MegaJoule) decreased by a factor of nearly 2, because of the transition from wood to coal to oil to gas. Also, the energy intensity (MJ/$) has decreased substantially in the developed world. Extensive studies have been made of future world energy demand. The most comprehensive investigation was done within the framework of the IPCC. The IPCC issued in 2000 a special report on „Emission Scenarios“. Different modelling groups, using different tools worked out 40 different scenarios of the possible future development (SRES, 2000). The SRES studies, discussed in the workshop, cover a wide range of assumptions about driving forces and key relationships, encompassing an economic emphasis (category A) to an environmental emphasis (category B). Driving forces are population, economy, technology, energy, and agriculture (land-use). The energy demand of the various scenarios is in Figure 2. An important conclusion of these studies is that the bulk of the increase in energy demand will be in the non-OECD1 countries. In the period from 2003 to 2030, IEA studies suggest that 70% of demand growth will be in non-OECD countries, including 20% in China alone, see Figure 3. This change has already started with the shift of Mid-East oil delivery from being predominantly to Europe and the USA to being 60% to Asia. It seems from these studies that new and carbon-free energy sources, respectively, will be important for both extremes of a very high increase in energy demand and a lower increase in demand but with carbon emission restrictions. This is significant for a new carbon- free2 energy source such as fusion. The latter case is illustrated by the low-emissions scenario in Figure 4. A second important fact is that in most scenarios a substantial increase in electricity demand is expected. 2.2. Fossil Fuels The global resources of fossil fuels are immense, as shown in Table 1. The extent of the resource base compared to past use indicates that fossil fuel will not run out during the 21st century, even with a significant increase in use. However, there will be a shift in the case of oil, in particular, from conventional to unconventional sources. This change will be seen in a geographical shift in the regions supplying oil and to a gradual increase in oil price. Estimates of how the oil might be used to fill the needs of the SRES scenarios, allowing for the variation in resource estimates, suggest that peak production for conventional oil in countries outside OPEC will be between 2010 and 2030. Peak production for OPEC conventional oil will be between 2020 and 2050. In addition, the large increase expected in the demand for energy and oil in the non-OECD countries will require a major change in the distribution system. This change has already started. There are a wide range of estimates of oil resources of which the numbers in Table 1. are examples. This range is shown in Figure 5. Oil is mainly used for transportation and it is important to note that liquid fuels may also be made from gas, coal, and bio-mass. In summary, ample liquid fuels are available, in principle, and the main reason they might not be used would be a concern about emissions and global climate change.
1 OECD stands for Organisation for Economic Co-operation and Development. Member states are all EU states, the US, Canada, New Zealand, Turkey, Mexico, South-Korea, Japan, Australia, Czech Republic, Hungary, Poland and Slovakia. 2 Carbon-free means, that the energy source does not involve carbon. Of course, carbon fuels might be used in construction or operations, as they are in today's nuclear and renewable energy areas.
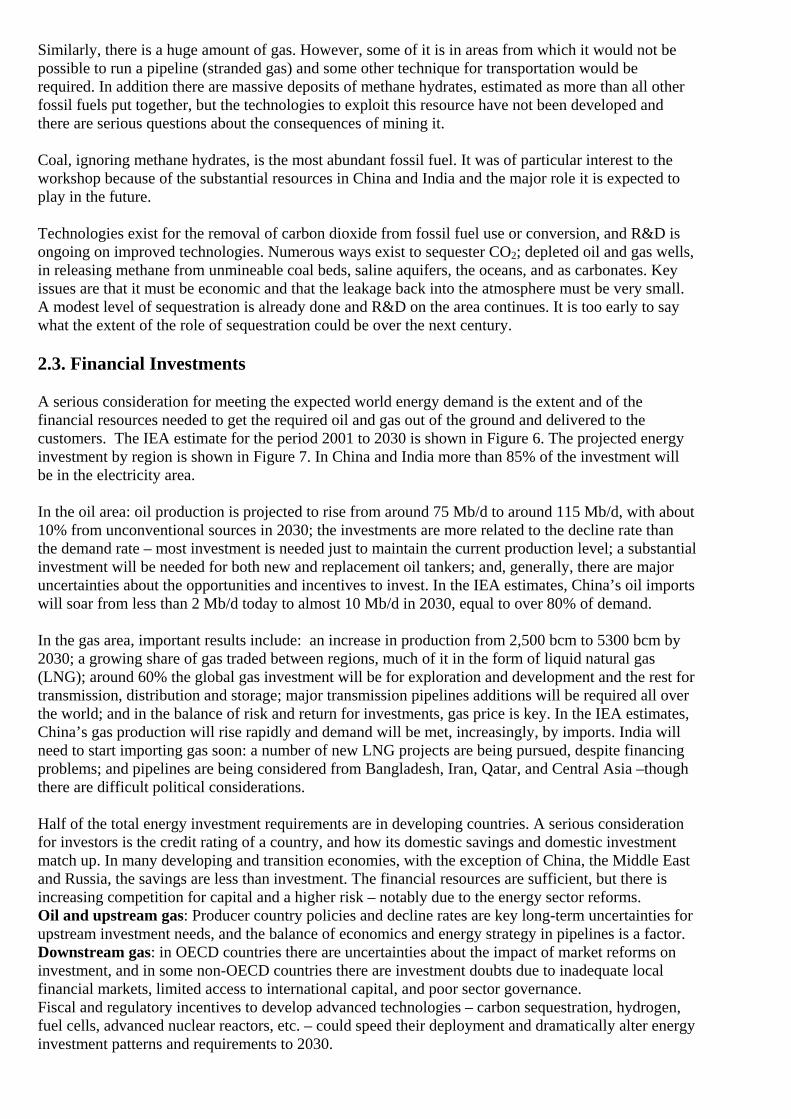
Similarly, there is a huge amount of gas. However, some of it is in areas from which it would not be possible to run a pipeline (stranded gas) and some other technique for transportation would be required. In addition there are massive deposits of methane hydrates, estimated as more than all other fossil fuels put together, but the technologies to exploit this resource have not been developed and there are serious questions about the consequences of mining it. Coal, ignoring methane hydrates, is the most abundant fossil fuel. It was of particular interest to the workshop because of the substantial resources in China and India and the major role it is expected to play in the future. Technologies exist for the removal of carbon dioxide from fossil fuel use or conversion, and R&D is ongoing on improved technologies. Numerous ways exist to sequester CO2; depleted oil and gas wells, in releasing methane from unmineable coal beds, saline aquifers, the oceans, and as carbonates. Key issues are that it must be economic and that the leakage back into the atmosphere must be very small. A modest level of sequestration is already done and R&D on the area continues. It is too early to say what the extent of the role of sequestration could be over the next century. 2.3. Financial Investments A serious consideration for meeting the expected world energy demand is the extent and of the financial resources needed to get the required oil and gas out of the ground and delivered to the customers. The IEA estimate for the period 2001 to 2030 is shown in Figure 6. The projected energy investment by region is shown in Figure 7. In China and India more than 85% of the investment will be in the electricity area. In the oil area: oil production is projected to rise from around 75 Mb/d to around 115 Mb/d, with about 10% from unconventional sources in 2030; the investments are more related to the decline rate than the demand rate – most investment is needed just to maintain the current production level; a substantial investment will be needed for both new and replacement oil tankers; and, generally, there are major uncertainties about the opportunities and incentives to invest. In the IEA estimates, China’s oil imports will soar from less than 2 Mb/d today to almost 10 Mb/d in 2030, equal to over 80% of demand. In the gas area, important results include: an increase in production from 2,500 bcm to 5300 bcm by 2030; a growing share of gas traded between regions, much of it in the form of liquid natural gas (LNG); around 60% the global gas investment will be for exploration and development and the rest for transmission, distribution and storage; major transmission pipelines additions will be required all over the world; and in the balance of risk and return for investments, gas price is key. In the IEA estimates, China’s gas production will rise rapidly and demand will be met, increasingly, by imports. India will need to start importing gas soon: a number of new LNG projects are being pursued, despite financing problems; and pipelines are being considered from Bangladesh, Iran, Qatar, and Central Asia –though there are difficult political considerations. Half of the total energy investment requirements are in developing countries. A serious consideration for investors is the credit rating of a country, and how its domestic savings and domestic investment match up. In many developing and transition economies, with the exception of China, the Middle East and Russia, the savings are less than investment. The financial resources are sufficient, but there is increasing competition for capital and a higher risk – notably due to the energy sector reforms. Oil and upstream gas: Producer country policies and decline rates are key long-term uncertainties for upstream investment needs, and the balance of economics and energy strategy in pipelines is a factor. Downstream gas: in OECD countries there are uncertainties about the impact of market reforms on investment, and in some non-OECD countries there are investment doubts due to inadequate local financial markets, limited access to international capital, and poor sector governance. Fiscal and regulatory incentives to develop advanced technologies – carbon sequestration, hydrogen, fuel cells, advanced nuclear reactors, etc. – could speed their deployment and dramatically alter energy investment patterns and requirements to 2030.
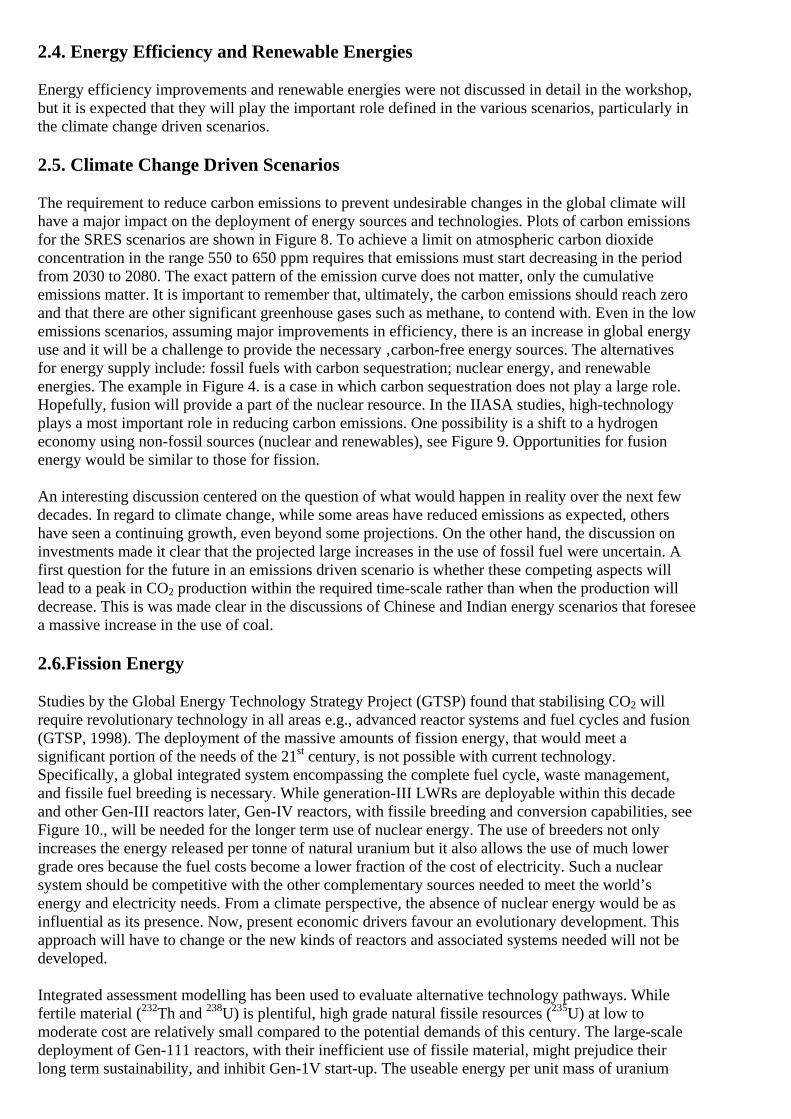
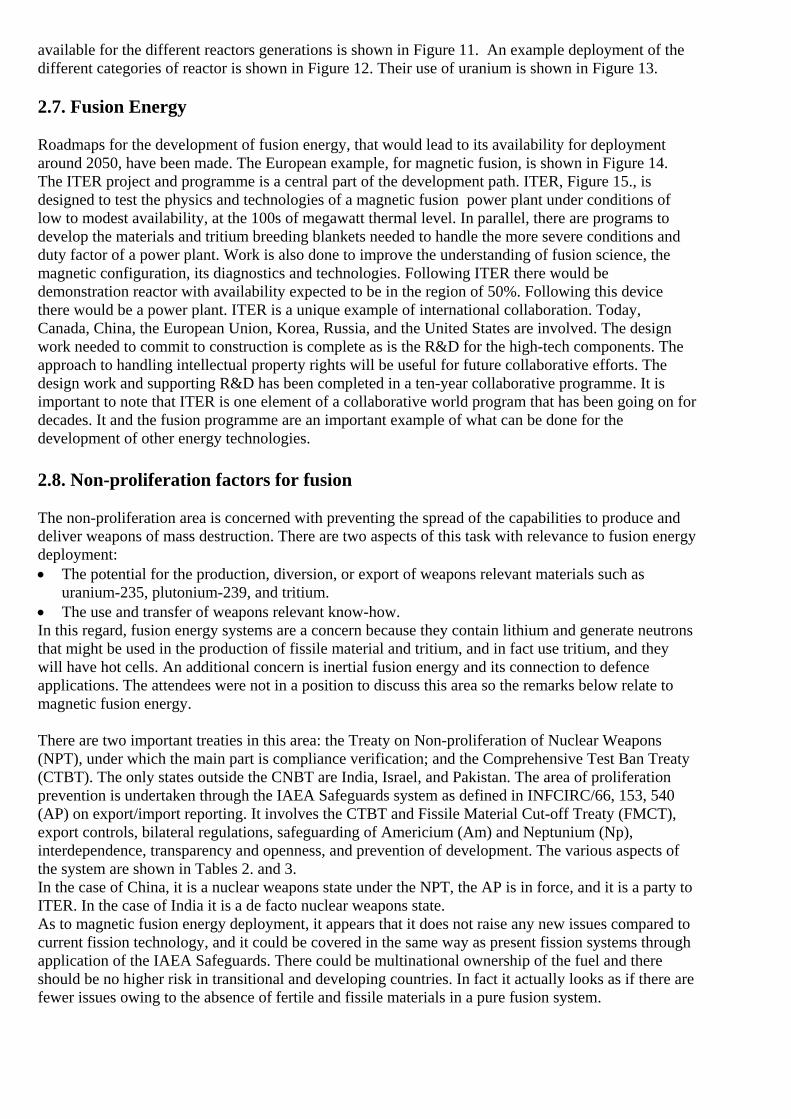
2.4. Energy Efficiency and Renewable Energies Energy efficiency improvements and renewable energies were not discussed in detail in the workshop, but it is expected that they will play the important role defined in the various scenarios, particularly in the climate change driven scenarios. 2.5. Climate Change Driven Scenarios The requirement to reduce carbon emissions to prevent undesirable changes in the global climate will have a major impact on the deployment of energy sources and technologies. Plots of carbon emissions for the SRES scenarios are shown in Figure 8. To achieve a limit on atmospheric carbon dioxide concentration in the range 550 to 650 ppm requires that emissions must start decreasing in the period from 2030 to 2080. The exact pattern of the emission curve does not matter, only the cumulative emissions matter. It is important to remember that, ultimately, the carbon emissions should reach zero and that there are other significant greenhouse gases such as methane, to contend with. Even in the low emissions scenarios, assuming major improvements in efficiency, there is an increase in global energy use and it will be a challenge to provide the necessary ‚carbon-free energy sources. The alternatives for energy supply include: fossil fuels with carbon sequestration; nuclear energy, and renewable energies. The example in Figure 4. is a case in which carbon sequestration does not play a large role. Hopefully, fusion will provide a part of the nuclear resource. In the IIASA studies, high-technology plays a most important role in reducing carbon emissions. One possibility is a shift to a hydrogen economy using non-fossil sources (nuclear and renewables), see Figure 9. Opportunities for fusion energy would be similar to those for fission. An interesting discussion centered on the question of what would happen in reality over the next few decades. In regard to climate change, while some areas have reduced emissions as expected, others have seen a continuing growth, even beyond some projections. On the other hand, the discussion on investments made it clear that the projected large increases in the use of fossil fuel were uncertain. A first question for the future in an emissions driven scenario is whether these competing aspects will lead to a peak in CO2 production within the required time-scale rather than when the production will decrease. This is was made clear in the discussions of Chinese and Indian energy scenarios that foresee a massive increase in the use of coal. 2.6.Fission Energy Studies by the Global Energy Technology Strategy Project (GTSP) found that stabilising CO2 will require revolutionary technology in all areas e.g., advanced reactor systems and fuel cycles and fusion (GTSP, 1998). The deployment of the massive amounts of fission energy, that would meet a significant portion of the needs of the 21st century, is not possible with current technology. Specifically, a global integrated system encompassing the complete fuel cycle, waste management, and fissile fuel breeding is necessary. While generation-III LWRs are deployable within this decade and other Gen-III reactors later, Gen-IV reactors, with fissile breeding and conversion capabilities, see Figure 10., will be needed for the longer term use of nuclear energy. The use of breeders not only increases the energy released per tonne of natural uranium but it also allows the use of much lower grade ores because the fuel costs become a lower fraction of the cost of electricity. Such a nuclear system should be competitive with the other complementary sources needed to meet the world’s energy and electricity needs. From a climate perspective, the absence of nuclear energy would be as influential as its presence. Now, present economic drivers favour an evolutionary development. This approach will have to change or the new kinds of reactors and associated systems needed will not be developed. Integrated assessment modelling has been used to evaluate alternative technology pathways. While fertile material (232Th and 238U) is plentiful, high grade natural fissile resources (235U) at low to moderate cost are relatively small compared to the potential demands of this century. The large-scale deployment of Gen-111 reactors, with their inefficient use of fissile material, might prejudice their long term sustainability, and inhibit Gen-1V start-up. The useable energy per unit mass of uranium
available for the different reactors generations is shown in Figure 11. An example deployment of the different categories of reactor is shown in Figure 12. Their use of uranium is shown in Figure 13. 2.7. Fusion Energy Roadmaps for the development of fusion energy, that would lead to its availability for deployment around 2050, have been made. The European example, for magnetic fusion, is shown in Figure 14. The ITER project and programme is a central part of the development path. ITER, Figure 15., is designed to test the physics and technologies of a magnetic fusion power plant under conditions of low to modest availability, at the 100s of megawatt thermal level. In parallel, there are programs to develop the materials and tritium breeding blankets needed to handle the more severe conditions and duty factor of a power plant. Work is also done to improve the understanding of fusion science, the magnetic configuration, its diagnostics and technologies. Following ITER there would be demonstration reactor with availability expected to be in the region of 50%. Following this device there would be a power plant. ITER is a unique example of international collaboration. Today, Canada, China, the European Union, Korea, Russia, and the United States are involved. The design work needed to commit to construction is complete as is the R&D for the high-tech components. The approach to handling intellectual property rights will be useful for future collaborative efforts. The design work and supporting R&D has been completed in a ten-year collaborative programme. It is important to note that ITER is one element of a collaborative world program that has been going on for decades. It and the fusion programme are an important example of what can be done for the development of other energy technologies. 2.8. Non-proliferation factors for fusion The non-proliferation area is concerned with preventing the spread of the capabilities to produce and deliver weapons of mass destruction. There are two aspects of this task with relevance to fusion energy deployment: • The potential for the production, diversion, or export of weapons relevant materials such as
uranium-235, plutonium-239, and tritium. • The use and transfer of weapons relevant know-how. In this regard, fusion energy systems are a concern because they contain lithium and generate neutrons that might be used in the production of fissile material and tritium, and in fact use tritium, and they will have hot cells. An additional concern is inertial fusion energy and its connection to defence applications. The attendees were not in a position to discuss this area so the remarks below relate to magnetic fusion energy. There are two important treaties in this area: the Treaty on Non-proliferation of Nuclear Weapons (NPT), under which the main part is compliance verification; and the Comprehensive Test Ban Treaty (CTBT). The only states outside the CNBT are India, Israel, and Pakistan. The area of proliferation prevention is undertaken through the IAEA Safeguards system as defined in INFCIRC/66, 153, 540 (AP) on export/import reporting. It involves the CTBT and Fissile Material Cut-off Treaty (FMCT), export controls, bilateral regulations, safeguarding of Americium (Am) and Neptunium (Np), interdependence, transparency and openness, and prevention of development. The various aspects of the system are shown in Tables 2. and 3. In the case of China, it is a nuclear weapons state under the NPT, the AP is in force, and it is a party to ITER. In the case of India it is a de facto nuclear weapons state. As to magnetic fusion energy deployment, it appears that it does not raise any new issues compared to current fission technology, and it could be covered in the same way as present fission systems through application of the IAEA Safeguards. There could be multinational ownership of the fuel and there should be no higher risk in transitional and developing countries. In fact it actually looks as if there are fewer issues owing to the absence of fertile and fissile materials in a pure fusion system.
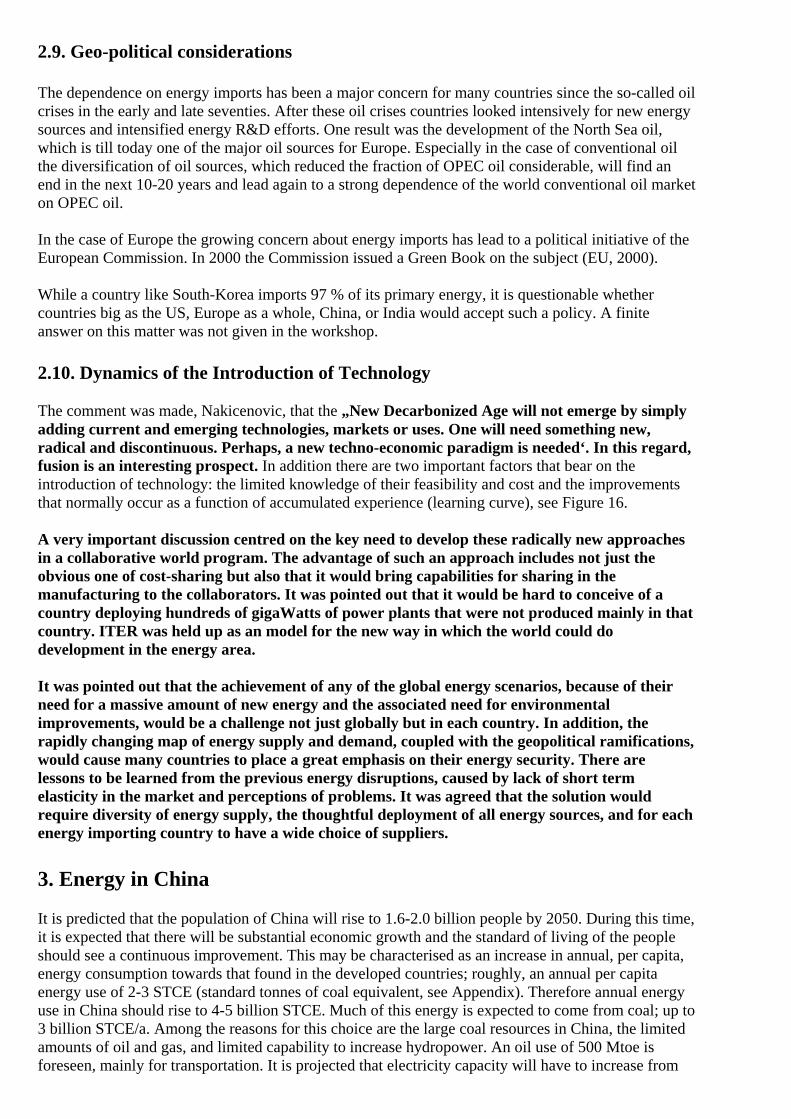
2.9. Geo-political considerations The dependence on energy imports has been a major concern for many countries since the so-called oil crises in the early and late seventies. After these oil crises countries looked intensively for new energy sources and intensified energy R&D efforts. One result was the development of the North Sea oil, which is till today one of the major oil sources for Europe. Especially in the case of conventional oil the diversification of oil sources, which reduced the fraction of OPEC oil considerable, will find an end in the next 10-20 years and lead again to a strong dependence of the world conventional oil market on OPEC oil. In the case of Europe the growing concern about energy imports has lead to a political initiative of the European Commission. In 2000 the Commission issued a Green Book on the subject (EU, 2000). While a country like South-Korea imports 97 % of its primary energy, it is questionable whether countries big as the US, Europe as a whole, China, or India would accept such a policy. A finite answer on this matter was not given in the workshop. 2.10. Dynamics of the Introduction of Technology The comment was made, Nakicenovic, that the „New Decarbonized Age will not emerge by simply adding current and emerging technologies, markets or uses. One will need something new, radical and discontinuous. Perhaps, a new techno-economic paradigm is needed‘. In this regard, fusion is an interesting prospect. In addition there are two important factors that bear on the introduction of technology: the limited knowledge of their feasibility and cost and the improvements that normally occur as a function of accumulated experience (learning curve), see Figure 16. A very important discussion centred on the key need to develop these radically new approaches in a collaborative world program. The advantage of such an approach includes not just the obvious one of cost-sharing but also that it would bring capabilities for sharing in the manufacturing to the collaborators. It was pointed out that it would be hard to conceive of a country deploying hundreds of gigaWatts of power plants that were not produced mainly in that country. ITER was held up as an model for the new way in which the world could do development in the energy area. It was pointed out that the achievement of any of the global energy scenarios, because of their need for a massive amount of new energy and the associated need for environmental improvements, would be a challenge not just globally but in each country. In addition, the rapidly changing map of energy supply and demand, coupled with the geopolitical ramifications, would cause many countries to place a great emphasis on their energy security. There are lessons to be learned from the previous energy disruptions, caused by lack of short term elasticity in the market and perceptions of problems. It was agreed that the solution would require diversity of energy supply, the thoughtful deployment of all energy sources, and for each energy importing country to have a wide choice of suppliers. 3. Energy in China It is predicted that the population of China will rise to 1.6-2.0 billion people by 2050. During this time, it is expected that there will be substantial economic growth and the standard of living of the people should see a continuous improvement. This may be characterised as an increase in annual, per capita, energy consumption towards that found in the developed countries; roughly, an annual per capita energy use of 2-3 STCE (standard tonnes of coal equivalent, see Appendix). Therefore annual energy use in China should rise to 4-5 billion STCE. Much of this energy is expected to come from coal; up to 3 billion STCE/a. Among the reasons for this choice are the large coal resources in China, the limited amounts of oil and gas, and limited capability to increase hydropower. An oil use of 500 Mtoe is foreseen, mainly for transportation. It is projected that electricity capacity will have to increase from
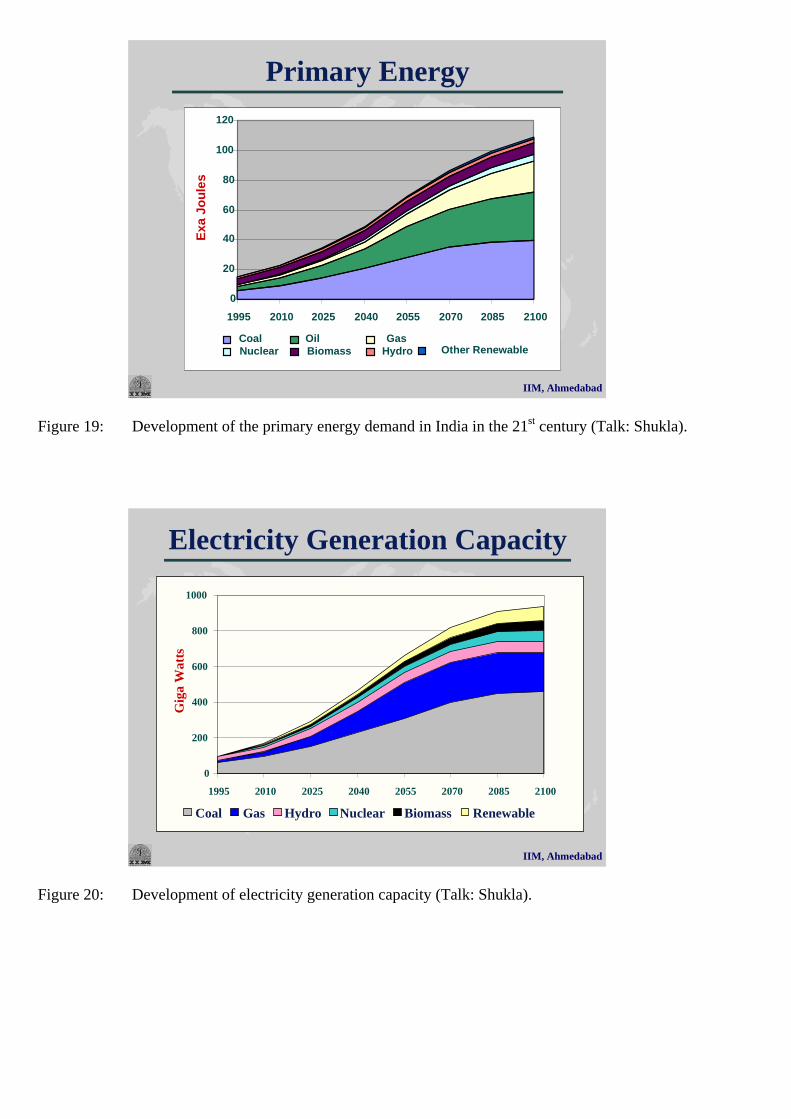
today’s 300 GWe to 600 GWe in 2020 and to at least 900 GWe in 2050 and 1300 GWe in 2100 depending on the population growth. It would be desirable to have approximately 1 kWe per person. Such a large increase means that a technology capable of not more than 100 GWe does not solve the problem. On the other hand, providing 100‘s of GWe by any one source will be a challenge. Nuclear power will play an important role, but realistically it can only provide a part of the projected increase. To put this in perspective, imagine that the nuclear capacity in China were raised to 400 GWe.. This would equal total world nuclear power today! In addition the issues, discussed above, of having a sustainable nuclear system come into play. China will need to be able to deploy Gen-1V power plants in an integrated nuclear system. Further, to realise multi-hundred megawatts of capacity will require that power plants will be mainly built in China (see the Korean example below). Thus nuclear energy development is an area like fusion which needs a world collaborative effort so that countries like China can install systems that are sustainable. This becomes a particularly acute issue if the low emissions scenarios are to be realised. In fact, in the present situation, it will be very difficult for China to raise its standard of living without increasing emissions substantially over the next decades. In most emissions limited scenarios, the peak in CO emissions should occur in the period 2030 to 2080. The Chinese believe that it will be important to have a broad portfolio of non-fossil energy sources to meet the needs of their country. In this context, fusion energy is viewed as having an important role in the latter half of this century. The Chinese fusion research program has progressed over the past few decades with a series of increasing scale experiments, mainly in the tokamak area. It has also involved collaboration with many countries. The research has always been directed at the energy goal. Initially with an emphasis on the development of a fusion-fission hybrid to maximise the use of indigenous uranium resources. The good collaboration between the Chinese fission and fusion programs continues. During their work on the hybrid system they came to realise that it would be very difficult for them to develop fusion energy independently. This motivated there interest in expanding their international collaborative efforts and to join ITER. They view ITER as a central part of the fusion development program. The research they had already started and the planned new facilities fit well with providing support to ITER in the area of long-pulse plasma operation. In addition, they are sending engineers to join the international team, and begin to join the ITPA, and ITER working groups, such as the diagnostic and test blanket module groups. Through negotiations, they have fixed the Chinese part of the possible procurement allocation. Their final aim is to know all the ITER scientific and technical information and all the experimental results, as if they had undertaken ITER alone. In the materials area, they are interested in joining the IFMIF project. They are also interested in high-power, millimetre wave technology, fusion reactor studies, safety issues, and the prospects for cheaper fusion technologies. The goal was mentioned to have 10% of their electricity from fusion by 2100. 4. Energy in India There has been a steady growth in energy use in India over the past decades, see Figure 17. Fossil fuels, particularly coal, are a major part of commercial energy, reflecting the existence of large coal resources in India. Substantial amounts of bio-mass energy are used, but only a part is viewed as commercial. While energy and carbon intensity are greater than the world average, they are decreasing and projected to continue to decrease. Projections for carbon emission in the various SRES scenarios are for a continuing increase over the next decades, see Figure 18. Future energy demand has been modelled using a variety of models; top-down (AIM etc.), bottom-up (MARKAL etc.), and local. The modelling includes the full range of energy sources, production and end-use, technologies, and energy and emissions databases, as well as considerations of environment, climate change, human health impacts and policy interventions. For the A2 case, the population of India is projected to rise to 1,650 million by 2100, GDP will rise by 62 times, and primary energy will increase from around 20 EJ in 2000 to around 110 EJ in 2100, see Figure 19. The electricity generating capacity will rise from around 100 GWe to over 900 GWe by 2100, see Figure 20. In this scenario, carbon emissions will increase 5 times between 2000 and 2100. Nevertheless, carbon emissions per capita ( 1 ton per person in 2100) would be less than in many countries of the developed world. The pressure to reduce local emissions like SO2 become stronger,
when the income of people passes a certain threshold. This relation is called Kuznets’ analysis. In the market reform case, there would be a much greater decrease in carbon intensity, although the electricity capacity in 2100 would be similar. In scenarios aimed at carbon concentration stabilisation, there would be a decrease in the use of fossil fuels for electricity production and a concomitant increase in the use of renewable energies and nuclear energy, including fusion. For a stabilisation at 650 ppm of CO2 the fusion capacity would be 35 GWe (4% of capacity) and for 550 ppm it would be 67 GWe (7% of capacity) by 2100. This assumes the availability of fusion power starting around 2050. The use of fusion energy would yield a cumulative mitigation of carbon of over 2 gigatonnes by 2100 in the 550 ppm case. Conclusions of the studies are that: nuclear fusion technology has the potential to penetrate during the latter half of the century (after 2070) under a 550 ppm GHG stabilisation regime; hydrogen technology will be a promising energy option by the year 2040, but the fuel choice for hydrogen production is critical for emissions reduction and infrastructure planning is vital for energy costs; and a South-Asia Regional Energy Market Integration can alter increase technology scales, reduce energy and electricity costs and also reduce emissions. 5. Climate change mitigation in developing countries A comparison of energy and emission characteristics for six developing countries with the world, OECD countries, and the USA is made in Table 4. The table illuminates the changes that will be needed to bring a greater equality in energy use and emissions in the world. In terms of emissions mitigation, these six countries have already taken significant measures over recent years for reasons other than climate change, with mitigation of 300 million tons of carbon. Compare this to the mitigation commitment of the developed countries under the Kyoto protocol (including the USA) of 392 million tons by 2010. The present emissions baseline of the six countries is 18% below what it would have been without these measures. Policy measures to support mitigation include areas such as; energy efficiency and conservation; renewable energy; clean transportation fuel; energy and electricity sector reforms; and forestry and land restoration. In the present situation the CDM (Clean Development Mechanism) holds only a limited prospect of increased financial flows from industrialised to developing countries, and there is no assurance of stable assistance from developed to developing countries. Market reforms are driven largely by a need for new development capital. Important principles in moving forward include: • Policy must tilt development choices toward climate-friendly options; • Operate at a scale large enough to alter emission trajectories; • Rather than discrete projects, measured against business as usual, aim to fundamentally shift
baselines. • Seek alliances of domestic firms/agencies, foreign investors, and Official Development Assistance
ODA providers; • Accelerate technology diffusion by targeting regional leaders. 6. Nuclear energy development in Korea Owing to a lack of domestic energy resources, Korea imports 97% of its energy. The cost of energy imports, $37B in 2000 (24% of total imports) was larger than the export value of both memory chips and automobiles. 80% of energy imports are oil from the Middle East. The growth rate of electricity averaged 10.3% annually from 1980 to 1999. The anticipated annual growth rate through 2015 is 4.9%. Such an increase takes place in a situation in which Korea’s total CO2 emissions rank 10-th in the world and are the highest per unit area. If it becomes necessary to impose a CO2 tax it is feared that exports will become uncompetitive. In these circumstances, the increasing use of nuclear energy is attractive. Fission is the approach today and for the many decades, and fusion is seen as an important complementary source when it is developed. There is close collaboration on R&D within the nuclear community. This collaboration has been enhanced by the involvement of Korea in the ITER project.
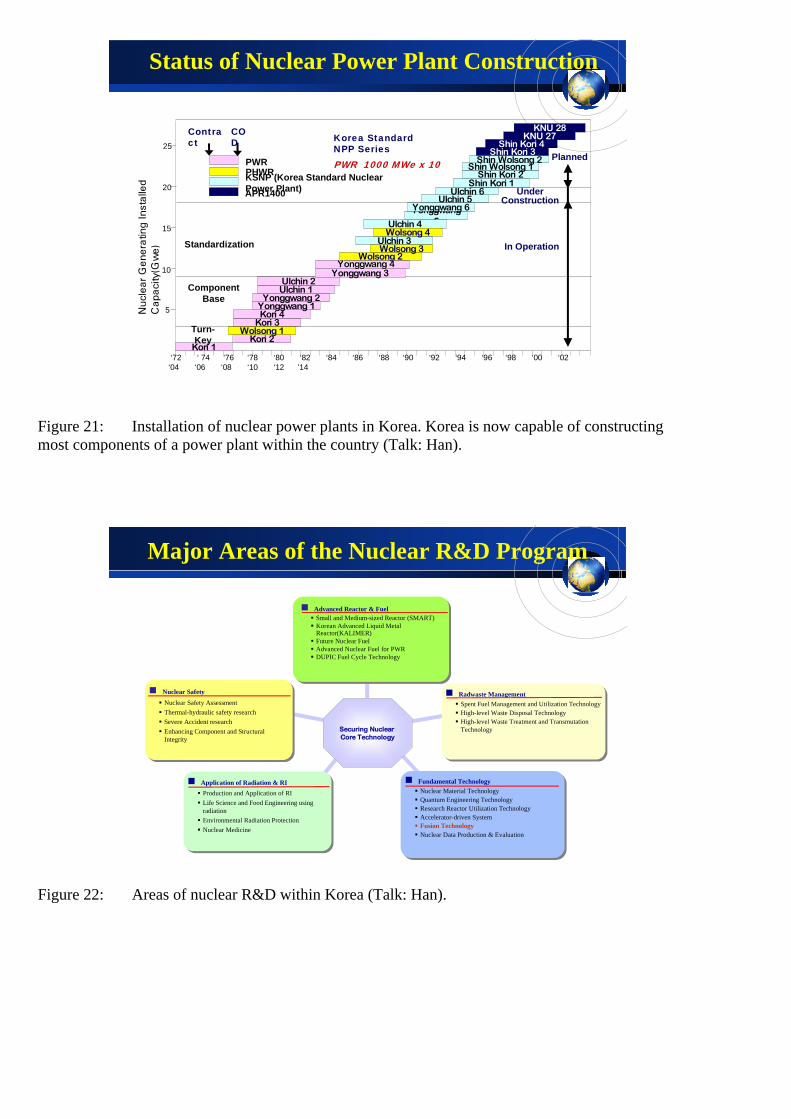
In Korea, the first commercial nuclear power plant, Kori Unit 1, started operation in 1978. Currently there are 14 PWR’s and 4 CANDU’s operating; with 6 of the PWR’s being Korean Standard Nuclear Plants. These power plants amount to 28.5% of installed capacity and provide 38.9% of electricity generation. It is planned that there will be 28 plants by 2015.The evolution of nuclear power in Korea is shown in Figure 21. Today, Korea is involved in many of the aspects of nuclear power development, see Figure 22., including the international Gen-IV collaborations. There goals are to develop sustainable systems for: the efficient use of uranium; the transmutation of wastes; and the production of the high temperatures favourable for desalination and hydrogen production. The R&D program has had a budget of around $ 200 M per and an additional average $ 100M per year for a period of 10 years is being committed for hydrogen production from nuclear energy. It is most significant that Korea has gone from having no nuclear power, to importing technologies, to having an in-house capability to produce modern PWR’s, and to be working at the forefront of today’s research within a 30 year timeframe. One area in which there remains reliance on foreign capabilities is the provision of fuel. The history of nuclear deployment and continuing development in Korea is an interesting model for fusion development and ultimate deployment. The Korean fusion program is a collaborative effort of universities, research institutes, and major industries, with a major emphasis on international collaboration. Key elements of the program are the KSTAR tokamak for steady-state developments, and ITER. In addition there are programs on materials development and tritium breeding blankets. 7. Conclusions The future world energy demand, driven mainly by the need to raise standards of living across the world, will require the introduction of new energy technologies on a massive scale. When climate change considerations are taken into account this need becomes even more acute. Because these new technologies must be deployed extensively in the transitional and developing countries, a global development effort will be required in each case. The development of fusion energy, which has had a world-wide collaborative aspect for many decades is a model for how such ventures can be undertaken. It is particularly timely that the ITER project will be realised as a joint effort of many countries. It is timely also because the realisation of fusion energy is still many years away. A world effort will be needed to deploy it in time to affect energy production in this century and beyond, when it may be necessary to not only provide much more energy but also substantially reduce greenhouse bas emissions. It appears that fusion energy (only magnetic fusion was considered) could be deployed under the same safeguards system that is used for fission. The magnitude the additional annual energy, and the associated increase in electricity production, required in the transitional and developing countries will be hard to achieve without the broadest range of options. New facilities will be required both to meet the increased demand but also to replace outdated equipment. All energy sources will be required to meet the varying needs of the different countries and to enhance the security of each one against the kind of energy crises that have occurred in the past. In fact, fusion energy is viewed as an important potential option in the latter half of this century for transitional and developing countries including China, India and Korea – more than a third of the world’s population. Acknowledgements The organisers appreciate the support of the EFDA for this meeting. Travel for the U.S. attendees was provided by the USDOE. The organisers are grateful to the attendees for supporting a most vigorous and productive meeting. Regrettably, circumstances prevented the attendance of two of the speakers. Fortunately they provided their input and it was presented for them.
Literature (Barabaschi, 1996) Fusion Programme Evaluation 1996, XII-373/96, November 1996 (SRES, 2000) Special Report on Emissions Scenarios, IPCC 2000 (GTSP, 1998) http://www.pnl.gov/gtsp/ (Greene, 2003) Greene et al., Running in and running out of Oil: Analyzing global oil depletion and transition through 2050 (EU, 2000) Towards a European Strategy for the security of energy supply, EU 2000 Annex OECD Countries Units: kJ kWh kgoe kgCe cm NG kJ 1 0,000278 0,000024 0,000034 0,000032 kWh 3600 1 0,086 0,123 0,113 kgoe 41,868 11,63 1 1,428 1,319 kgce 29,308 8,14 0,7 1 0,923 cm NG
31,736 8,816 0,758 1,083 1
1 barrel (bbl) = 159 l oil 7,3 bbl = 1 t oil Workshop
Development with fusion power. What role can nuclear fusion play in transition countries? 10th-12th of December 2003 in Garching Joint IPP-EFDA-JIEE Workshop H1 building, WL room Objective: The development of nuclear fusion is expected to reach a new quality with the construction of the ITER experiment. ITER will be able to bring the proof of principle for nuclear fusion. The question comes up, what kind of benefits and what kind of problems would be connected to the widespread use of nuclear fusion. The workshop will address this question especially for transitions countries, like India and China. Numerous prospective studies expect that the increase in energy demand will mainly happen in these countries in Asia, South America and Africa. Only a technology which can be applied in these new emerging markets will be able to have an impact on the overall global development. Methodology: A small number of invited experts will discuss for three days in plenary and parallel session. On the last day a first communiqué should be developed to summarise the major findings
Programme First Day: 10th of December 2003
Introduction and Welcome 9:30 A.M. Bradshaw, IPP, Garching Welcome 9:40 G-C. Tosato, EFDA, Garching Socio-Economic Research of Fusion 9:55 T. Hamacher, IPP, Garching Objective of the workshop Global and regional energy situations 10:15 N. Nakicenovic, IIASA, TU-Wien The global energy situation and outlook Wien 11:15 Coffee 11:20 R.P. Shukla, IIM, Ahmedabad Energy in India 12:20-13:20 Lunch 13:20 J. F. Clarke, Pacific Northwest Nuclear pathways to a carbon-free future National Laboratory, Richland 14:20 Discussion
Status and perspective of nuclear fusion, R&D efforts 14:45 A. Kallenbach, IPP, Garching Nuclear fusion: a primer 15:30 Coffee 16:00 B. Spears, ITER, Garching ITER, the next step 16:45 Y. Huo, Zheng Zhou University, Fusion research in transition countries Zheng Zhou 17:30 Visit of Wendelstein 7 As 18:15 Dinner at IPP casino
Second Day: 11th of December 2003
Resource availability and technological capabilities 9:00 J.-H. Han, KSTAR, Seoul The Korean fission programme 9:30 H. Kato, IEA, Paris Availability of gas and oil 10:00 J. Sheffield, JIEE Greene's analysis of world oil use Parallel session 1: The availability of natural gas and oil for transition countries in the long run and the necessity of possible substitutions like fusion
Parallel session 2: The ability of transition countries to master complex technologies
13:00 Lunch 14:00 R. P Shukla, IIM, Ahmedabad Future environmental commitments of transition countries 14:30 F. Müller, Stiftung für Energy and geopolitics in Asia in the 21st Wissenschaft und Politik, Berlin century 15:00 B. Richter, Forschungszentrum Proliferation: Can fusion be applied Jülich, Jülich everywhere Parallel session 3: Environmental commitments of transition countries Parallel session 5: Proliferation issues and fusion
Parallel session 4: Energy and geopolitics in Asia
… Dinner in Munich Third Day: 12th of December 2003 9:00 Report from the parallel sessions 9:45 Coffee 11:00 Final discussion 13:00 End of the conference
List of Participants
Name Institute/Organisation E-Mail
Eherer Christian TU-Graz/IPP-Garching [email protected]
Müller Friedmann SWP Berlin [email protected]
Richter Stephan IPP-Garching [email protected]
Biberacher Markus IPP-Garching [email protected]
Huo Yuping ZhongZhiu Univ. China [email protected]
Clarke John F. Joint Global Change Institute [email protected]
Nakicenovic N. TU-Wien & IIASA [email protected]
Milch Isabella IPP-Garching [email protected]
Tosato G. C. EFDA [email protected]
Casci F. R. EFDA [email protected]
Sheffield John TIEE [email protected]
Richter Bernd FZJ [email protected]
Han Tung-Hoon KBSI [email protected]
Bogusch Edgar Framatome ANP GmbH [email protected]
Lutz-LanzingDoris EFDA [email protected]
Düweke Jörg IPP-Garching [email protected]
Hamacher Thomas IPP-Garching [email protected]
Kato Hiroyuki IEA [email protected]
Raeder Jürgen ITER [email protected]
Tosato GianCarlo EFDA [email protected]
Nakicenovic #Nakicenovic #2424 TU-TU-Wien Wien & IIASA 2003& IIASA 2003
Global Population ProjectionsGlobal Population Projections
Figure 1: The figure shows different development patterns for the world population. (Talk: Nakicenovic)
Nakicenovic #Nakicenovic #3030 TU-TU-Wien Wien & IIASA 2003& IIASA 2003NakicenovicNakicenovic IIASA 2003IIASA 2003
Global Primary Energy ScenariosGlobal Primary Energy Scenarios
Figure 2: Possible development of the global primary energy demand in the 21st century. The possible range of demands in 2100 goes all the way from roughly a level of the demand in 2000 (400 EJ) all the way up to 2500 EJ (Talk: Nakicenovic)
Increase in World EnergyIncrease in World EnergyProduction and ConsumptionProduction and Consumption
More than 70% of energy demand growth and almost all energy productiongrowth over the next three years will come from outside the OECD
0
1,000
2,000
3,000
4,000
5,000
6,000
7,000
Production Consumption Production Consumption
Mto
e
OECD Transition economies Developing countries
1971-2000 2000-2030
Figure 3: Production and consumption of world energy in 2000 and in 2030. A considerable shift in the consumption from OECD to non-OECD countries can be observed (Talk: Kato)
Nakicenovic #Nakicenovic #3131 TU-TU-Wien Wien & IIASA 2003& IIASA 2003
Evolution of Global Primary EnergyEvolution of Global Primary Energy
Figure 4: SRES scenario with very low carbon emission in 2100. A complete shift of the energy system is required. The high fraction of renewables in 2100 seems not realistic at all (Talk: Nakicenovic).
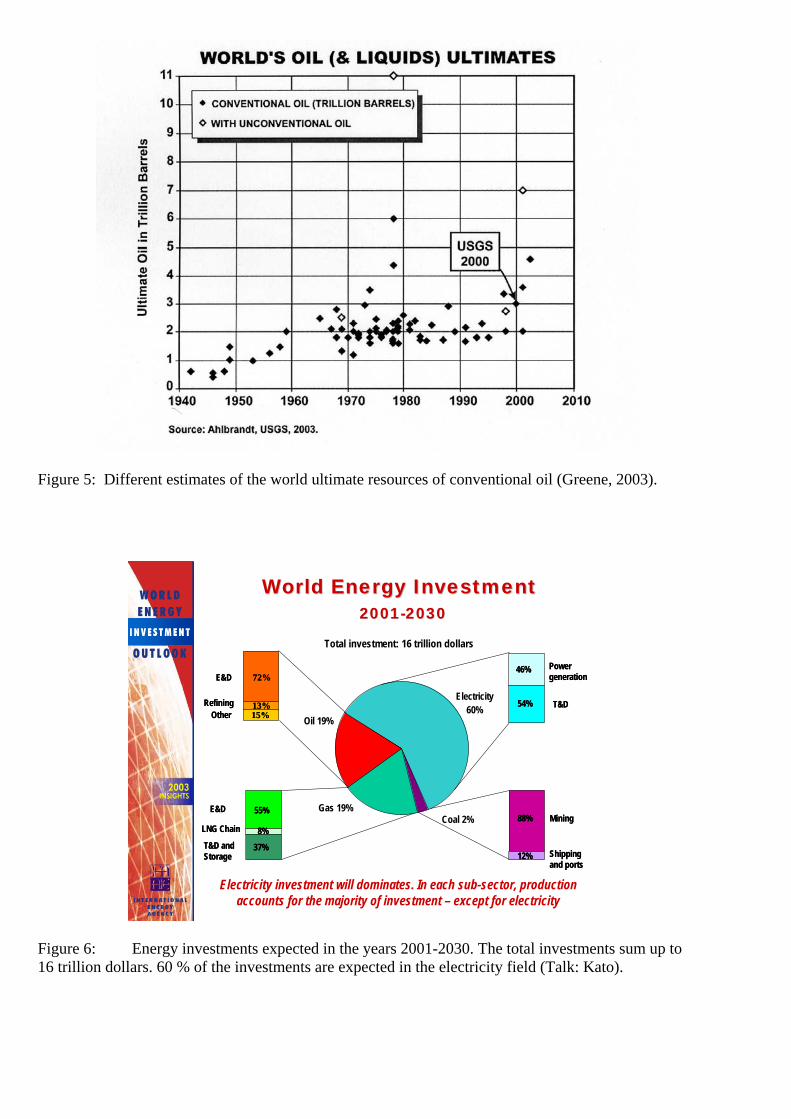
Figure 5: Different estimates of the world ultimate resources of conventional oil (Greene, 2003).
World Energy InvestmentWorld Energy Investment 2001-20302001-2030
Electricity investment will dominates. In each sub-sector, productionaccounts for the majority of investment – except for electricity
Total investment: 16 trillion dollars
Oil 19%
Electricity60%
Coal 2%Gas 19%
OtherRefining
E&D 72%
13%15%Other
Refining
E&D 72%
13%15%
E&D
LNG Chain
T&D and Storage
55%
37%
8%
E&D
LNG Chain
T&D and Storage
55%
37%
8%
Power generation
T&D54%
46% Power generation
T&D54%
46%
Mining
Shipping and ports
12%
88% Mining
Shipping and ports
12%
88%
Figure 6: Energy investments expected in the years 2001-2030. The total investments sum up to 16 trillion dollars. 60 % of the investments are expected in the electricity field (Talk: Kato).
Energy Investment by RegionEnergy Investment by Region2001-20302001-2030
Almost half of energy investment requirements of $16 trillion will beneeded in developing countries
0
500
1,000
1,500
2,000
2,500
3,000
3,500
4,000
OECDNorth
America
China OECDEurope
Other Asia Africa Russia Middle East OECDPacific
Other LatinAmerica
India Othertransition
economies
Brazil
cum
ulat
ive in
vest
men
t (bi
llion
dolla
rs)
0
5
10
15
20
share in global investment (%
)
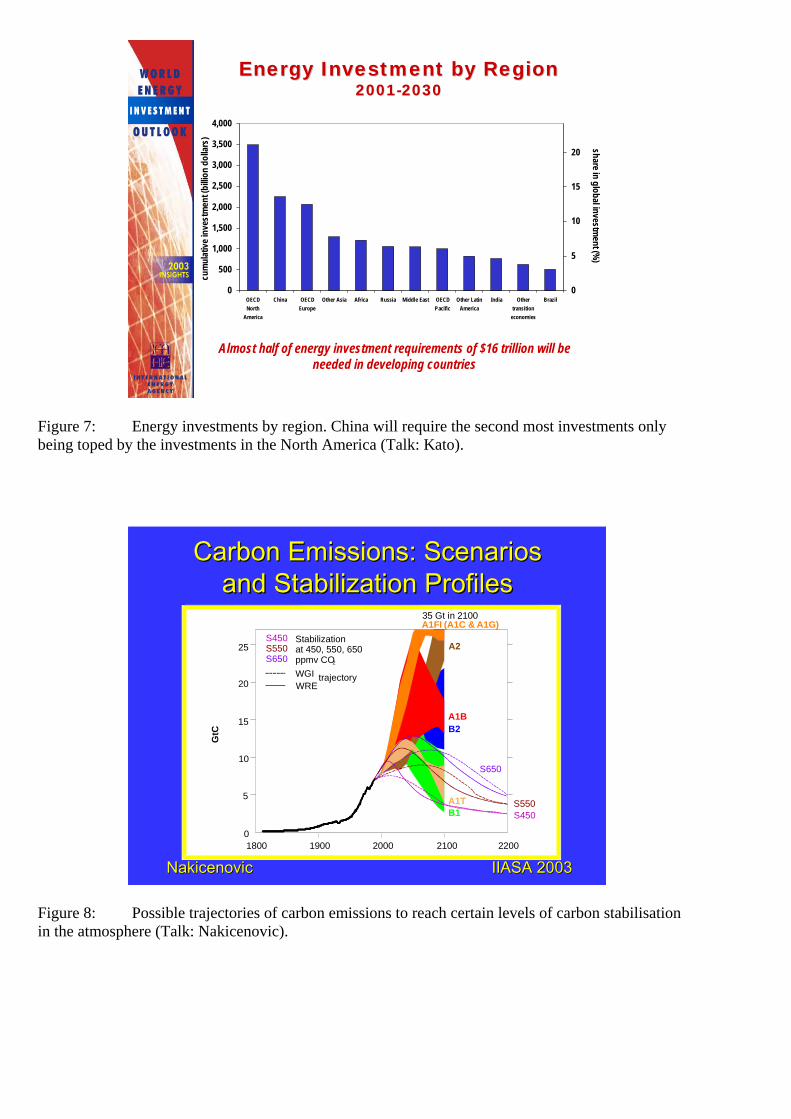
Figure 7: Energy investments by region. China will require the second most investments only being toped by the investments in the North America (Talk: Kato).
Nakicenovic #Nakicenovic #3636 TU-TU-Wien Wien & IIASA 2003& IIASA 2003NakicenovicNakicenovic IIASA 2003IIASA 2003
Carbon Emissions: Scenarios Carbon Emissions: Scenarios and Stabilization Profilesand Stabilization Profiles
25
20
15
10
5
01800 1900 2000 2100 2200
S450
GtC
S550
S650
WGIWRE
Stabilizationat 450, 550, 650ppmv CO2
S450S550S650
trajectory
B2
B1
A2
35 Gt in 2100
A1B
A1FI (A1C & A1G)
A1T
Figure 8: Possible trajectories of carbon emissions to reach certain levels of carbon stabilisation in the atmosphere (Talk: Nakicenovic).
IIASA 2000IIASA 2000NakicenovicNakicenovic
Hydrogen to Carbon Ratio of Primary EnergyHydrogen to Carbon Ratio of Primary Energy
Methane Economy
Hydrogen Economy
Gas = 4 : 1
Oil = 2 : 1Coals0.5- 1 : 1
Wood = 10 : 1
Source: Updated from Marchetti, 1985
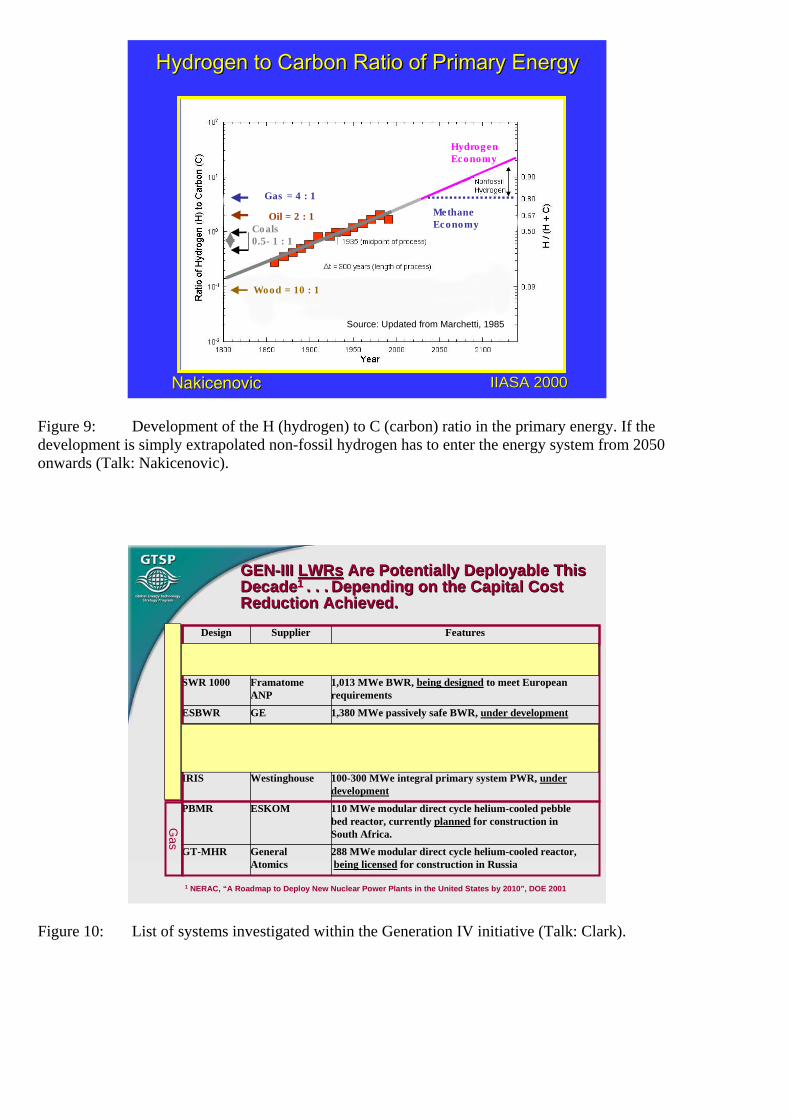
Figure 9: Development of the H (hydrogen) to C (carbon) ratio in the primary energy. If the development is simply extrapolated non-fossil hydrogen has to enter the energy system from 2050 onwards (Talk: Nakicenovic).
7
`
GEN-III GEN-III LWRsLWRs Are Potentially Deployable This Are Potentially Deployable ThisDecadeDecade1 1 . . .. . . Depending on the Capital CostDepending on the Capital CostReduction Achieved.Reduction Achieved.
288 MWe modular direct cycle helium-cooled reactor, being licensed for construction in Russia
GeneralAtomics
GT-MHR
110 MWe modular direct cycle helium-cooled pebblebed reactor, currently planned for construction inSouth Africa.
ESKOMPBMR
100-300 MWe integral primary system PWR, underdevelopment
WestinghouseIRIS
1,090 MWe PWR with passive safety featuresHigher capacity version of AP-600, not yet certified
WestinghouseAP1000
610 MWe passively safe PWR, design certified by NRC.WestinghouseAP600
1,380 MWe passively safe BWR, under developmentGEESBWR
1,013 MWe BWR, being designed to meet Europeanrequirements
FramatomeANP
SWR 1000
1,350 MWe BWR, design certified by NRC andbuilt and operating in Japan
GEABWR
FeaturesSupplierDesign
1 NERAC, “A Roadmap to Deploy New Nuclear Power Plants in the United States by 2010”, DOE 2001
Light Water
Gas
Figure 10: List of systems investigated within the Generation IV initiative (Talk: Clark).
13
( ) ( )
0
0
111 1
Nn n
Ce th n
tf Nat Nn ne e e B
Cne n n e
REJ BUF
T U R Rff RR R
µη
ε ε µε ε
=
=
⎛ ⎞⎜ ⎟
⎛ ⎞ ⎜ ⎟=⎜ ⎟ ⎜ ⎟⎛ ⎞− ⎛ ⎞⎝ ⎠ − + +⎜ ⎟⎜ ⎟ ⎜ ⎟⎜ ⎟− − ⎝ ⎠⎝ ⎠⎝ ⎠
∑
∑
Fissile Fuel Consumption Depends OnFuel Cycle and Reactor TechnologyDevelopment
Fissile Fuel Consumption Depends OnFissile Fuel Consumption Depends OnFuel Cycle Fuel Cycle andand Reactor Technology Reactor TechnologyDevelopmentDevelopment
Gen I
Gen II
Gen III
Gen IV
0 50 100 200 300 30,000Ftf (Exajoule/MMT Uranium)
NuclearFuelEfficiency
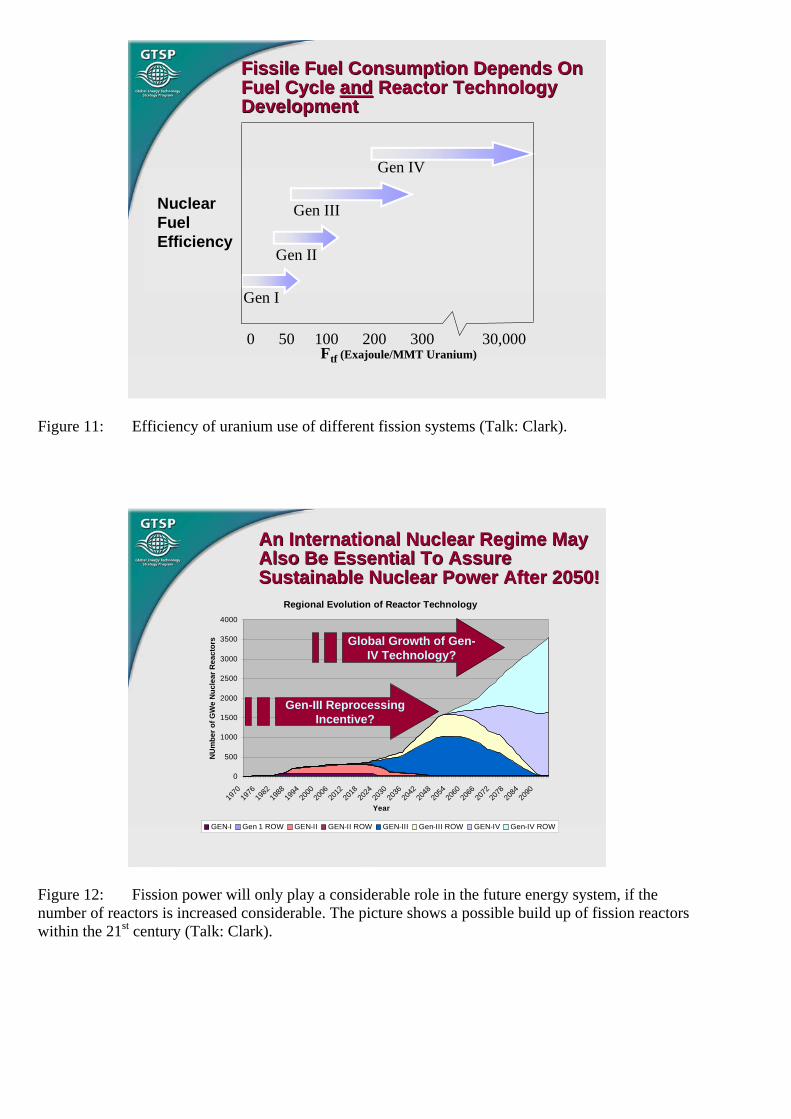
Figure 11: Efficiency of uranium use of different fission systems (Talk: Clark).
19
An International Nuclear Regime MayAlso Be Essential To AssureSustainable Nuclear Power After 2050!
An International Nuclear Regime MayAn International Nuclear Regime MayAlso Be Essential To AssureAlso Be Essential To AssureSustainable Nuclear Power After 2050!Sustainable Nuclear Power After 2050!
Regional Evolution of Reactor Technology
0
500
1000
1500
2000
2500
3000
3500
4000
1970
1976
1982
1988
1994
2000
2006
2012
2018
2024
2030
2036
2042
2048
2054
2060
2066
2072
2078
2084
2090
Year
NU
mbe
r of G
We
Nuc
lear
Rea
ctor
s
GEN-I Gen 1 ROW GEN-II GEN-II ROW GEN-III Gen-III ROW GEN-IV Gen-IV ROW
Global Growth of Gen-IV Technology?
Gen-III ReprocessingIncentive?
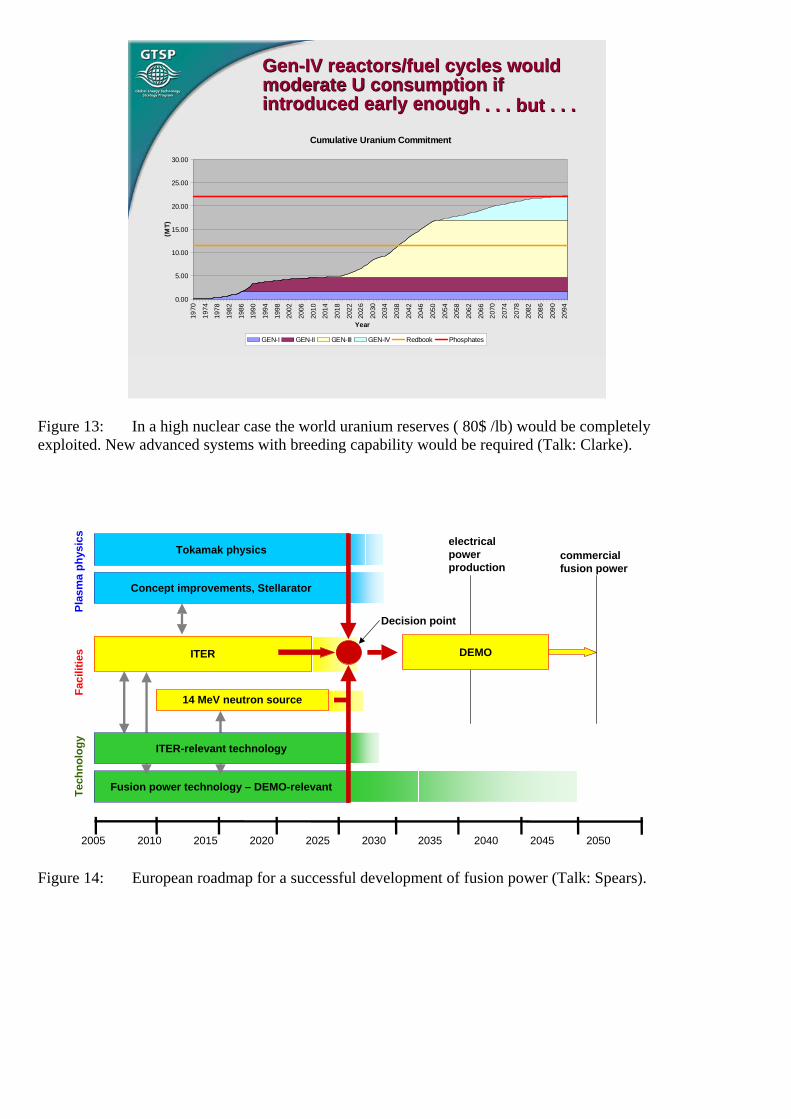
Figure 12: Fission power will only play a considerable role in the future energy system, if the number of reactors is increased considerable. The picture shows a possible build up of fission reactors within the 21st century (Talk: Clark).
18
Gen-IV reactors/fuel cycles wouldmoderate U consumption ifintroduced early enough
Gen-IV reactors/fuel cycles wouldGen-IV reactors/fuel cycles wouldmoderate U consumption ifmoderate U consumption ifintroduced early enoughintroduced early enough
Cumulative Uranium Commitment
0.00
5.00
10.00
15.00
20.00
25.00
30.00
1970
1974
1978
1982
1986
1990
1994
1998
2002
2006
2010
2014
2018
2022
2026
2030
2034
2038
2042
2046
2050
2054
2058
2062
2066
2070
2074
2078
2082
2086
2090
2094
Year
(MT)
GEN-I GEN-II GEN-III GEN-IV Redbook Phosphates
. . . but . . .. . . but . . .
Figure 13: In a high nuclear case the world uranium reserves ( 80$ /lb) would be completely exploited. New advanced systems with breeding capability would be required (Talk: Clarke).
2005 2010 2015 2020 2025 2030 2035 2040 2045 2050
Fusion power technology – DEMO-relevant
ITER
Plas
ma
phys
ics
Faci
litie
sTe
chno
logy
14 MeV neutron source
Decision point
Tokamak physics commercialfusion power
Concept improvements, Stellarator
ITER-relevant technology
electricalpowerproduction
DEMO
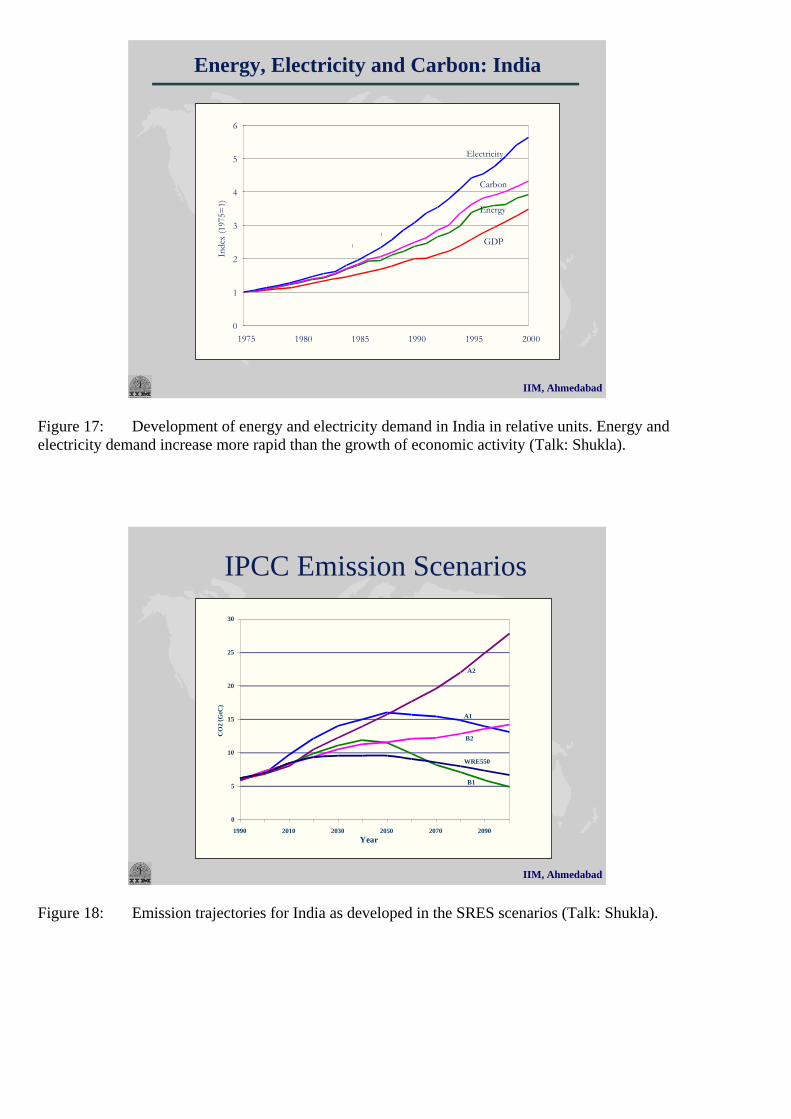
Figure 14: European roadmap for a successful development of fusion power (Talk: Spears).
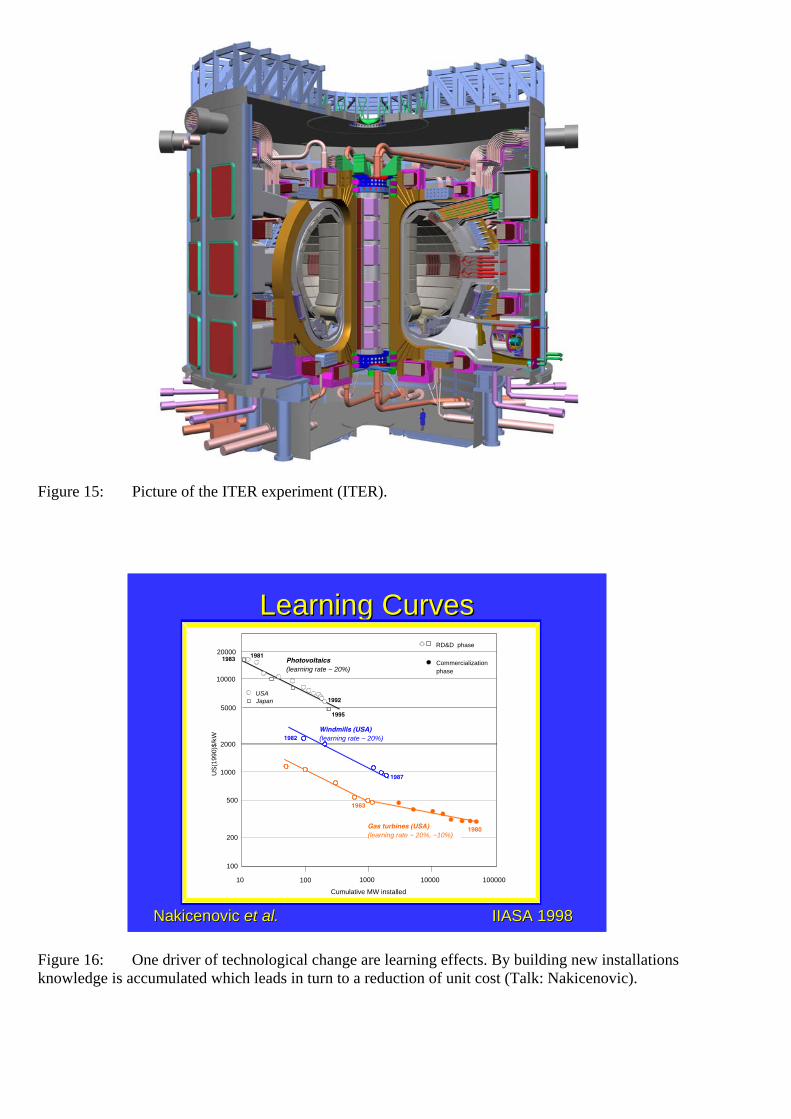
Figure 15: Picture of the ITER experiment (ITER).
Nakicenovic #Nakicenovic #6969 TU-TU-Wien Wien & IIASA 2003& IIASA 2003
Learning CurvesLearning Curves20000
10000
5000
1000
100
10 100 1000 10000 100000
1982
1987
1963
1980
Windmills (USA)(learning rate ~ 20%)
RD&D phase
Commercializationphase
USAJapan
Cumulative MW installed
19811983
500
Photovoltaics(learning rate ~ 20%)
Gas turbines (USA)(learning rate ~ 20%, ~10%)
US
(199
0)$/
kW
1995
1992
200
2000
Nakicenovic Nakicenovic et al.et al. IIASA 1998IIASA 1998
Figure 16: One driver of technological change are learning effects. By building new installations knowledge is accumulated which leads in turn to a reduction of unit cost (Talk: Nakicenovic).
IIM, Ahmedabad
Energy, Electricity and Carbon: India
0
1
2
3
4
5
6
1975 1980 1985 1990 1995 2000
Inde
x (1
975=
1)
Electricity
Energy
Carbon
GDP
Figure 17: Development of energy and electricity demand in India in relative units. Energy and electricity demand increase more rapid than the growth of economic activity (Talk: Shukla).
IIM, Ahmedabad
IPCC Emission Scenarios
Year
0
5
10
15
20
25
30
1990 2010 2030 2050 2070 2090
CO
2 (G
tC)
A1
A2
B1
B2
WRE550
Figure 18: Emission trajectories for India as developed in the SRES scenarios (Talk: Shukla).
IIM, Ahmedabad
Primary Energy
0
20
40
60
80
100
120
1995 2010 2025 2040 2055 2070 2085 2100
Exa
Joul
es
Coal Oil GasNuclear Biomass Hydro Other Renewable
Figure 19: Development of the primary energy demand in India in the 21st century (Talk: Shukla).
IIM, Ahmedabad
Electricity Generation Capacity
0
200
400
600
800
1000
1995 2010 2025 2040 2055 2070 2085 2100
Gig
a W
atts
Coal Gas Hydro Nuclear Biomass Renewable
Figure 20: Development of electricity generation capacity (Talk: Shukla).
Status of Nuclear Power Plant Construction
Shin Kori 1Shin Kori 2
Shin Wolsong 1Shin Wolsong 2
Shin Kori 3Shin Kori 4
KNU 28KNU 27
Planned
Yonggwang5
Yonggwang 6Ulchin 5
Ulchin 6 UnderConstruction
5
10
15
20
25
‘72 ‘ 74 ‘76 ‘78 ‘80 ‘82 ‘84 ‘86 ‘88 ‘90 ‘92 ‘94 ‘96 ‘98 ‘00 ‘02‘04 ‘06 ‘08 ‘10 ‘12 ’14
Nuc
lear
Gen
erat
ing
Inst
alle
dC
apac
ity(G
we)
Kori 3Kori 4Yonggwang 1
Yonggwang 2Ulchin 1Ulchin 2Component
Base
Kori 1Kori 2
Wolsong 1Turn-Key
Yonggwang 3
Wolsong 2
Ulchin 3
Ulchin 4
Wolsong 3
Wolsong 4
In OperationStandardization
PWRPHWRKSNP (Korea Standard NuclearPower Plant)APR1400
Contract
COD Korea Standard
NPP SeriesPWR 1000 MWe x 10
Yonggwang 4Yonggwang 4
Figure 21: Installation of nuclear power plants in Korea. Korea is now capable of constructing most components of a power plant within the country (Talk: Han).
Major Areas of the Nuclear R&D Program
Advanced Reactor & FuelSmall and Medium-sized Reactor (SMART)Korean Advanced Liquid MetalReactor(KALIMER)Future Nuclear FuelAdvanced Nuclear Fuel for PWRDUPIC Fuel Cycle Technology
Advanced Reactor & FuelSmall and Medium-sized Reactor (SMART)Korean Advanced Liquid MetalReactor(KALIMER)Future Nuclear FuelAdvanced Nuclear Fuel for PWRDUPIC Fuel Cycle Technology
Fundamental TechnologyNuclear Material TechnologyQuantum Engineering TechnologyResearch Reactor Utilization TechnologyAccelerator-driven SystemFusion TechnologyNuclear Data Production & Evaluation
Fundamental TechnologyNuclear Material TechnologyQuantum Engineering TechnologyResearch Reactor Utilization TechnologyAccelerator-driven SystemFusion TechnologyNuclear Data Production & Evaluation
Radwaste ManagementSpent Fuel Management and Utilization TechnologyHigh-level Waste Disposal TechnologyHigh-level Waste Treatment and TransmutationTechnology
Radwaste ManagementSpent Fuel Management and Utilization TechnologyHigh-level Waste Disposal TechnologyHigh-level Waste Treatment and TransmutationTechnology
Nuclear SafetyNuclear Safety AssessmentThermal-hydraulic safety researchSevere Accident researchEnhancing Component and StructuralIntegrity
Nuclear SafetyNuclear Safety AssessmentThermal-hydraulic safety researchSevere Accident researchEnhancing Component and StructuralIntegrity
Application of Radiation & RIProduction and Application of RILife Science and Food Engineering usingradiationEnvironmental Radiation ProtectionNuclear Medicine
Application of Radiation & RIProduction and Application of RILife Science and Food Engineering usingradiationEnvironmental Radiation ProtectionNuclear Medicine
Securing Nuclear Core Technology
Figure 22: Areas of nuclear R&D within Korea (Talk: Han).
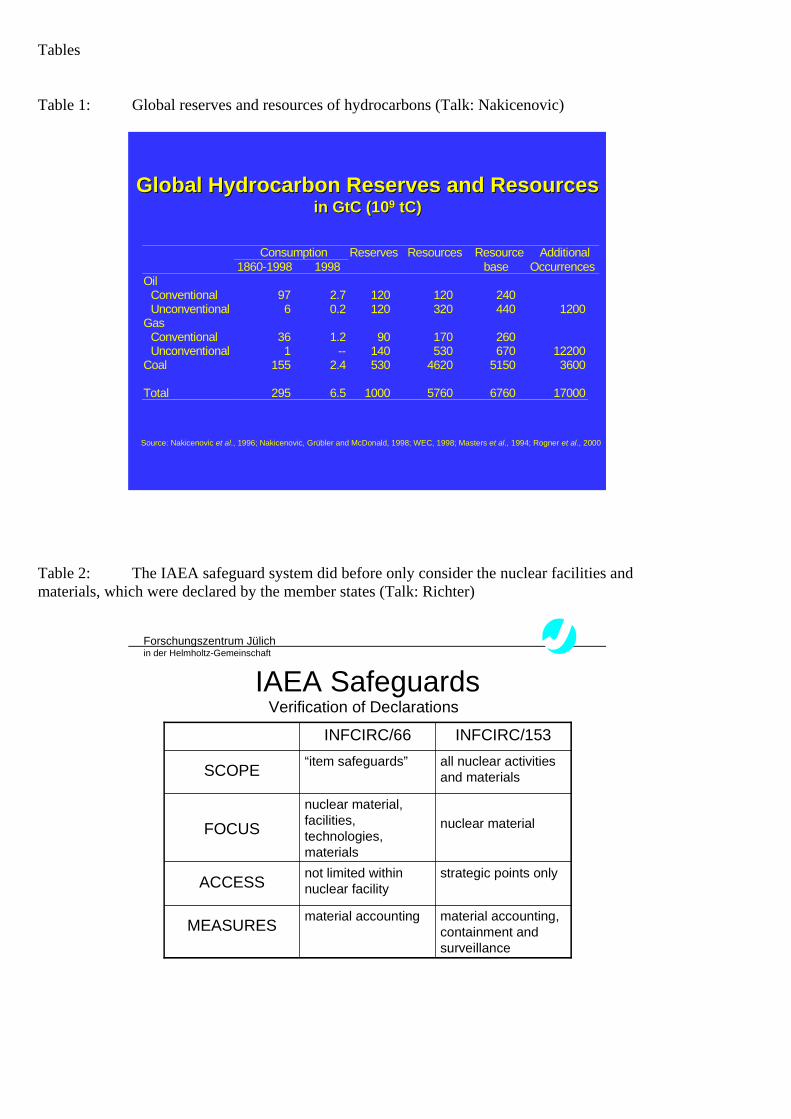
Tables Table 1: Global reserves and resources of hydrocarbons (Talk: Nakicenovic)
Global Hydrocarbon Reserves and ResourcesGlobal Hydrocarbon Reserves and Resourcesin GtC (10in GtC (1099 tCtC))
Consumption Reserves Resources Resource Additional 1860-1998 1998 base Occurrences
Oil Conventional 97 2.7 120 120 240 Unconventional 6 0.2 120 320 440 1200
Gas Conventional 36 1.2 90 170 260 Unconventional 1 -- 140 530 670 12200
Coal 155 2.4 530 4620 5150 3600
Total 295 6.5 1000 5760 6760 17000
Source: Nakicenovic et al., 1996; Nakicenovic, Grübler and McDonald, 1998; WEC, 1998; Masters et al., 1994; Rogner et al., 2000
Table 2: The IAEA safeguard system did before only consider the nuclear facilities and materials, which were declared by the member states (Talk: Richter)
Forschungszentrum Jülichin der Helmholtz-Gemeinschaft
IAEA Safeguards
material accounting,containment andsurveillance
material accountingMEASURES
strategic points onlynot limited withinnuclear facilityACCESS
nuclear materialnuclear material,facilities,technologies,materials
FOCUS
all nuclear activitiesand materials
“item safeguards”SCOPE
INFCIRC/153INFCIRC/66
Verification of Declarations
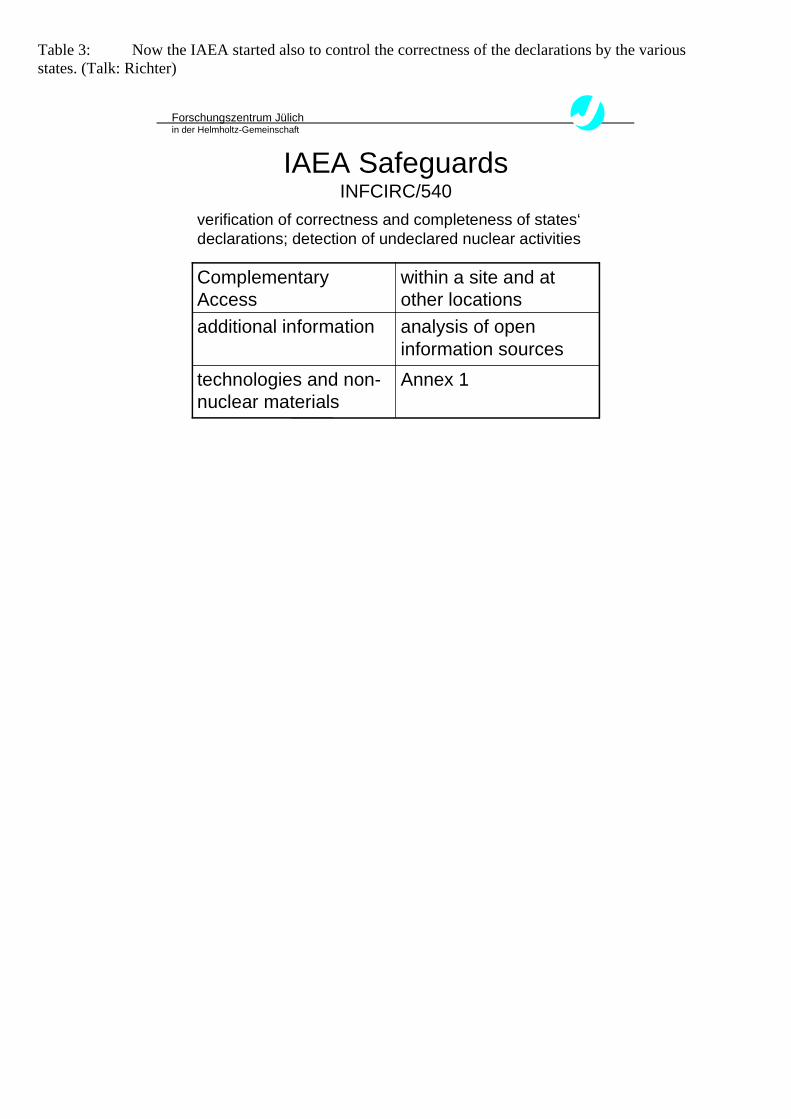
Table 3: Now the IAEA started also to control the correctness of the declarations by the various states. (Talk: Richter)
Forschungszentrum Jülichin der Helmholtz-Gemeinschaft
IAEA SafeguardsINFCIRC/540
Annex 1technologies and non-nuclear materials
analysis of openinformation sources
additional information
within a site and atother locations
ComplementaryAccess
verification of correctness and completeness of states‘declarations; detection of undeclared nuclear activities