thomas and goodwin changes in industrial and occupational structures of texas counties ... ·...
TRANSCRIPT

Thomas and Goodwin
CHANGES I N INDUSTRIAL AND OCCUPATIONAL STRUCTURES OF TEXAS COUNTIES, 1960-80
John K. Thomas and H. L. Goodwin, Jr. Departntent o f Rura l Sociology, Texas A I M U n i v e r s i t y
ABSTRACT Th is paper i d e n t i f i e s and examines i n d u s t r i a l and occupat ional changes t h a t have accompanied popu la t ion growth i n Texas. According t o t h e 1960 U.S. Census d e f i n i t i o n s f o r county s i z e , Texas coun t ies were grouped as met ropo l i tan , urban-nonrnetropol i tan, and ru ra l -nonmet ropo l i tan . Employment i n 13 i n d u s t r i a l and 9 occupat ional ca tegor ies was used t o measure sustenance d i f f e r e n t i a t i o n . I n d u s t r i a l employment (SDI) d i v e r s i f i e d i n bo th the s i x t i e s and seven t ies as nonrnetropol i tan coun t ies became more s t r u c t u r a l l y homogeneous. Occupational employment (SDO) decreased i n opera t i ve , l abor , and farmer- farm worker jobs and increased i n sa les, c r a f t s , c l e r i c a l , and p r o f e s s i o n a l - t e c h n i c a l - k i n d r e d jobs. A d d i t i o n a l l y , i n 1980 SDI and SDO were markedly l e s s c o r r e l a t e d than i n p rev ious years, suggest ing a change i n p rev ious s t r u c t u r a l r e l a t i o n s h i p s between i n d u s t r y and occupation. M i g r a t i o n r a t e s were much more h i g h l y c o r r e l a t e d w i t h SO1 than w i t h SO0 over t h e 20 years.
I n t r o d u c t i o n
The importance o f examining p o p u l a t i o n change has been demonstrated i n r e c e n t l i t e r a t u r e ( F r i s b i e and Poston 1975; Hawley 1968; Poindexter and C l i f f o r d 1983; S ly and Tayman 1977). Rogers (1982, p. 148) p o i n t s out , "Rapid growth overburdens e x i s t i n g comnunity f a c i l i t i e s and programs, c rea tes new expec ta t ions f rom in -mig ran ts , and produces a l a g between new s e r v i c e demands and t h e new t a x base needed t o pay f o r expansion." Moreover, i t a f f e c t s p a t t e r n s and p a r t i c i p a n t s i n resource u t i l i z a t i o n ( land , water , e t c . ) , housing, decisionmaking, and s o c i a l m o b i l i t y (D i l lman and Hobbs, 1982). Conversely, popu la t ion l o s s i n v o l v e s t y p i c a l p a t t e r n s i n which "youth leave, t h e average age r i s e s , t h e b i r t h r a t e f a l l s , and income d e c l i n e s " (Beale 1974; see a l s o Rogers 1982, p. 149). While p o p u l a t i o n change i s known t o a f f e c t these s o c i a l , se rv ice , and f i s c a l aspects o f coun t ies and t h e i r communities, more i n f o r m a t i o n i s needed about i t s i m p l i c a t i o n s f o r economic o rgan iza t ion . Th is paper examines t h e e x t e n t o f popu la t ion change and i t s r e l a t i o n s h i p t o i n d u s t r i a l and occupat ional changes i n Texas coun t ies f rom 1960 t o 1980.
Texas i s one o f severa l s t a t e s t h a t have b e n e f i t e d most from i n t e r r e g i n a l m i g r a t i n and associated i n t r a s t a t e growth i n nonmetropol i tan areas.' Since 1960 it has exper ienced a ---------------
I A vers ion o f t h i s paper was presented a t t h e 1985 meetings o f the Rural S o c i o l o g i c a l Society , August 21 -24, Blac$sburg, V i r g i n i a .
See Heaton and F u g u i t t (1980), Chalmers and Greenwood (1980), Poston (1980), and Wi l l i ams and McMi l len (1980) f o r d i scuss ions o f i n t e r r e g i o n a l m i g r a t i o n and popu la t ion change.
Thomas and Goodwin
48.5 percen t popu la t ion increase. Almost 35 percen t o f t h i s inc rease was a t t r i b u t e d t i n i g r a t i o n d u r i n g t h e pas t 20 years (Bowler e t a l . 1975).? Whi le some research has been conducted on in t radecade m i g r a t i o n p a t t e r n s and socioeconomic c h a r a c t e r i s t i c s o f persons m i g r a t i n g t o and w i t h i n Texas (Hwang e t a l . 1985; Murdock 1978), l i t t l e i n f o r m a t i o n has been r e p o r t e d about t h e corresponding changes and s t r u c t u r a l r e d i s t r i b u t i o n o f the Texas labor f o r c e i n nonmetropol i tan coun t ies , p a r t i c u l a r l y coun t ies h e a v i l y dependent on a g r i c u l t u r e .
Nowhere i s t h e r e l a t i o n s h i p between the i n d u s t r i a l economy and popu la t ion change so d e l i c a t e as i n r u r a l a g r i c u l t u r a l areas. For example, i n t h e i r examinat ion o f d e c l i n i n g farm and ranch employment i n Texas, Ladewig and A lb rech t (1983, p. 40) g i v e severa l reasons f o r the d e c l i n e : New and ex tens ive energy development; increased inc idence o f r u r a l res idence f o r p a r t - t i m e farming, re t i rement , and r e c r e a t i o n ; and r e l o c a t i o n o f i n d u s t r i e s t o r u r a l areas increased o f f - f a r m employment o p p o r t u n i t i e s o f t e n c rea ted competing demands f o r land, water, and o t h e r n a t u r a l resources c r i t i c a l t o a g r i c u l t u r a l p roduc t ion . They a l s o say t h a t w h i l e growth i n o t h e r economic sec to rs may h e l p small farmers remain i n a g r i c u l t u r e , by p r o v i d i n g o f f - f a r m employment, it reduces the l e v e l o f f u l l - t i m e fa rming and employment. According t o t h e Census o f A g r i c u l t u r e (U.S. Bureau o f the Census 1982), 57 percen t o f a l l Texas farm opera to rs were employed o f f t h e farm 100 o r more days i n 1978, compared w i t h 57 percen t i n 1982. As such changes occur, researchers have begun t o r a i s e quest ions and seek in f luences on and consequences o f o f f - f a r m employment on f a m i l y farm o r g a n i z a t i o n (A lb rech t and Ladewig, 1982; Rodefeld 1982) and c o r n u n i t y s t r u c t u r e s ( A l b r e c h t and Murdock 1984; Coughenour and Chr is tenson 1980; Hefferman e t a l . 1981; Green 1985).
I n our examination, we use d e f i n i t i o n s f rom the 1960 U.S. Census t o i d e n t i f y t h r e e types o f coun t ies - -met ropo l i tan , urban-nonmetropol i tan, and rural-nonmetropoli tan-- that prov ide the con tex t f o r change. Th is focus on in t ra -nonmet ropo l i tan change i s recen t i n t h e l i t e r a t u r e and emanates f rom evidence t h a t popu la t ion and economic growth may be d e c e n t r a l i z e d i n these areas and t h a t r u r a l growth r a t e s have been f a s t e r than urban r a t e s (Bender e t a l . 1985; L i c h t e r e t a l . 1985; Morr ison 1976; Schwarzwel ler 1979; Zuiches and Brown 1978). For our purposes, a m e t r o p o l i t a n county i s d e f i n e d as any county which has, o r i s cont iguous t o , a county hav ing a t l e a s t one c i t y o f 50,000 o r more res iden ts . Thus, m e t r o p o l i t a n coun t ies were those coun t ies loca ted i n t h e 1960 standard m e t r o p o l i t a n s t a t i s t i c a l areas. An urban-nonmetropol i tan county has a t l e a s t one c i t y w i t h a p o p u l a t i o n o f more than 2,500 bu t less then 50,000. F i n a l l y , a ru ra l -nonmet ropo l i tan county has no town w i t h 2,500 o r more popu la t ion .
--------------- Est imates by t h e Texas Department o f Hea l th (1980)
i n d i c a t e d t h a t i n - m i g r a t i o n o f i n d i v i d u a l s accounted f o r 40 percen t (n = 1,818,031) o f p o p u l a t i o n growth.
Thomas and Goodwin
E c o l o g i c a l ana l yses o f change
Researchers i n human eco logy have t r a d i t i o n a l l y r e l i e d on two models t o e x p l a i n s o c i a l change. The f i r s t emphasizes p o p u l a t i o n ( m i g r a t i o n ) as a response t o changes i n sus tenance o r g a n i z a t i o n s - f u n c t i o n a l a c t i v i t i e s d i r e c t e d toward t h e p r o d u c t i o n o f goods and s e r v i c e s ( F r i s b i e and Poston 1976) . Env i ronment and t e c h n o l o g y i n f l u e n c e p o p u l a t i o n i n d i r e c t l y t h r o u g h o r g a n i z a t i o n a l changes. T h i s o r g a n i z a t i o n a l model has been used i n t h e work o f S l y (1072 ) , F r i s b i e and Poston (1975 ) , Poston (1980 ) , and more r e c e n t l y by P o i n d e x t e r and C l i f f o r d (1983 ) . The second model p o s t u l a t e s t h a t p o p u l a t i o n change and m i q r a t i o n a r e a d i r e c t response t o env i ronmen ta l c o n d i t i o n s and t h a t t h e i n f l u e n c e s o f t e c h n o l o g y and o r g a n i z a t i o n on p o p u l a t i o n o p e r a t e i n d i r e c t l y t h r o u g h t h e i r e f f e c t s on t h e env i ronmen t . A c c o r d i n g l y , S l y and Tayman (1977) have l a b e l e d i t t h e env i ronmen ta l model.
Both models sha re s e v e r a l s i m i l a r i t i e s and p o s s i b l e l i m i t a t i o n s i n resea rch . F i r s t , most s t u d i e s u s i n g t h e s e models have focused on e i t h e r m e t r o p o l i t a n (Duncan and L i e b e r s o n 1970; S l y and Tayman 1977) o r n o n m e t r o p o l i t a n a reas ( F r i s b i e and Poston 1975; P o i n d e x t e r and C l i f f o r d 1983; S l y 1972). Consequent ly , changes i n r u r a l o r g a n i z a t i o n have been o v e r l o o k e d o r have been embedded i n aggregated n o n m e t r o p o l i t a n changes. Second, most s t u d i e s have emphasized r e g i o n a l o r n a t i o n a l l e v e l s o f ana l yses . Such e f f o r t s have r e s u l t e d i n few m e a n i n g f u l ana l yses o f m e t r o p o l i t a n and n o n m e t r o p o l i t a n areas w i t h i n p a r t i c u l a r s t a t e s e x p e r i e n c i n g s i g n i f i c a n t s h i f t s o f p o p u l a t i o n . F i n a l l y , p a s t e c o l o g i c a l s t u d i e s have t y p i c a l l y d e l i n e a t e d sustenance a c t i v i t i e s a c c o r d i n g t o t h e l a b o r f o r c e p a r t i c i p a t i o n i n a v a r i e t y o f i n d u s t r i e s and occupa t i ons . L i t t l e e f f o r t has been ex tended beyond i d e n t i f y i n g e lements c o m p r i s i n g sus tenance o r g a n i z a t i o n s t o d e t e r m i n e i n d u s t r i a l l y and o c c u p a t i o n a l l y s i n g l e and m u l t i - d i m e n s i o n a l a reas and t h e i r r e l a t i o n s h i p t o p o p u l a t i o n change (Bender e t a l . 1985; Ta rve r 1972).
Such l i m i t a t i o n s a r e addressed h e r e as i t i s h y p o t h e s i z e d t h a t t r e n d s i n i n c r e a s i n g p o p u l a t i o n change and r e d i s t r i b u t i o n a r e p o s i t i v e l y a s s o c i a t e d w i t h accompanying d i v e r s i f i c a t i o n o f i n d u s t r i a l and o c c u p a t i o n a l s t r u c t u r e s o f human e c o l o g i c a l o r g a n i z a t i o n w i t h i n d i f f e r e n t t ypes o f Texas c o u n t i e s . S p e c i f i c a l l y , r u r a l - n o n m e t r o p o l i t a n c o u n t i e s a r e expec ted t o be t h e l e a s t d i v e r s i f i e d o r g a n i z a t i o n a l l y and, as t h e y e x p e r i e n c e p o p u l a t i o n g row th , t o be t h e most l i k e l y t o change t h e i r sus tenance o r g a n i z a t i o n .
Data and p rocedu res
Oata used i n t h e a n a l y s i s i n c l u d e d p o p u l a t i o n , n e t m i g r a t i o n r a t e s , and employment by i n d u s t r i e s and occupa t i ons . P o p u l a t i o n and employment d a t a f o r 1960, 1970, and 1980 were o b t a i n e d f r o m t h e U.S. Bureau o f Census, and i n t e r d e c a d e m i g r a t i o n r a t e s f o r 1960-70 and 1970-80 were o b t a i n e d f r o m Bowles e t a l . (1975) and Hwang e t a l . (1985) . I t shou ld be n o t e d t h a t m a j o r changes i n Census Bureau c l a s s i f i c a t i o n s o f o c c u p a t i o n s o c c u r r e d i n 1980. To a d j u s t

Thomas and Goodwin
for these changes in classification, employment in the 1980 occupational groupings was traced backward with detailed standard industrial classification codes to the 1960 classifications. Although the majority of classification differences between 1960 and 1980 have been adjusted, some minor discrepancies may still exist.
Unlike previous studies which used multiple indicators of sustenance organization, number of individuals employ~d was used to identify industrial and occupational sustenance organizations. Research has consistently demonstrated level of employment to be among the most significant variables in factor analyses of organizational components (Frisbie and Poston 1976; Poindexter and Clifford 1983). Employment in the following industrial groups and subgroups was examined: 1) extractive (agriculture, forestry, mining), 2) production (manufacturing, construction), 3) utility services (transportation, conununications- utilities), 4 ) market services (retail-wholesale, finance-insurance-real estate, business repair services), 5) professional services (public administration, education, health, other professional services), and 6) personal services (Singelman and Browning 1980; Tienda and Englert 1982). In addition, we examined nine occupational groups identified by the U.S. Census Bureau: professional and technical, managerial and administrative, sales, clerical, services, crafts, operative, farmer and farm worker, and general labor.
Change in industrial and occupational sustenance organizations was measured between decades from 1960 and 1980 for the three types of counties. The year 1960 was selected as the base year for the 20-year period. By standardizing county status (metropolitan, etc.) to 1960, the status year and base year for calculating changes in industrial and occupational employment were made to coincide.
Measurement of sustenance differentiation
Differentiation of sustenance organizations has two components. "Structural differentiation" is the number and types of industries (occupations) in a county. "Distributive differentiation" is the distribution of the employed population among the categories of industries (occupations). Minimum structural differentiation occurs when there is a single source of industrial employment in a county, such as the case in many rural-nonmetropol itan counties that are extremely dependent on agriculture (Bender et al. 1985). Maximum distributive differentiation occurs when equal numbers of a county's working population are employed in numerous industries (occupations).
Sustenance differentiation values were calculated for the industrial and occupational organization of each county in the three censal years. Although many such measures exist (Clemente 1972; Frisbie and Poston 1978), we used the formula:
where X was the number of individuals employed in any one industry (occupation). This SD measure reflected both

Thomas and Goodwin
s t r u c t u r a l and d i s t r i b u t i v e d i f f e r e n t i a t i o n , whereas a l l bu t one o f t h e o ther measures d i d n o t (Gibbs and Poston 1975). Also, i t was i n t e r p r e t a b l e . A minimum value o f zero i n d i c a t e d l i t t l e d i s t r i b u t i o n and few ca tegor ies . Flaximum values depended on t h e number o f i n d u s t r i e s (occupa t ions ) i n a c o u t t y (Clemente 1972; Gibbs and Poston 1975; Poston 1980). The p o s s i b l e maximum values were .923 f o r i n d u s t r i a l d i f f e r e n t i a t i o n and .889 f o r occupa t iona l d i f f e r e n t i a t i o n f o r any g iven year. Counties w i t h no employment i n some i n d u s t r i e s (occupat ions) had fewer ca tegor ies r e s u l t i n g i n lower p o s s i b l e maximum values. Comparisons o f t h e mean SD values were conducted t o determine l e v e l s o f v a r i a t i o n and homogeneity. F i n a l l y i n d u s t r i a l and occupa t iona l sustenance d i f f e r e n t i a t i o n were c o r r e l a t e d w i t h s i z e o f p o p u l a t i o n f o r each decade and percentage n e t m i g r a t i o n r a t e s between decades.
Empirical r e s u l t s
Resul ts o f t h e a n a l y s i s f o r the t h r e e groups o f coun t ies a r e r e p o r t e d accord ing t o p a t t e r n s o f p o p u l a t i o n change, sustenance o r g a n i z a t i o n , and c o r r e l a t i o n a l r e l a t i o n s h i p s .
Pa t te rns o f p o p u l a t i o n change
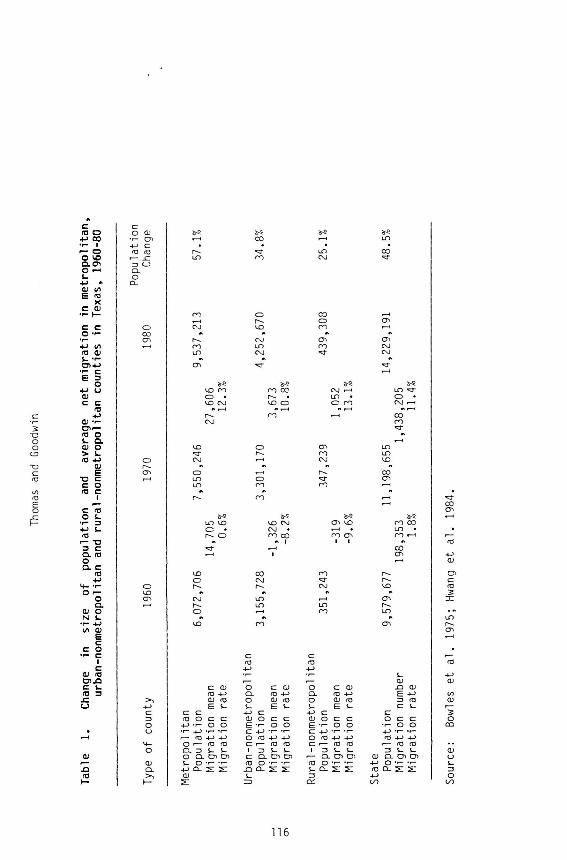
Popu la t ion growth was pervas ive i n Texas coun t ies . As shown i n Table 1, r u r a l - and urban-nonmetropol i tan coun t ies had 25 and 35. percen t growth, r e s p e c t i v e l y , d u r i n g the 20-yedr per iod. Major changes i n s i z e o f popu ta t ion were a t t r i b u t e d i n p a r t t o changes i n n e t m i g r a t i o n . From 1960 t o 1970, o n l y m e t r o p o l i t a n coun t ies had an inc rease i n p o p u l a t i o n due t o i n - m i g r a t i o n , whereas r u r a l and ---------------
Maximum SD va lue can be determined by the formula:
where nc equals t h e number o f i n d u s t r i a l (occupa t iona l ) ca tegor ies i n a county. There were a t o t a l o f 13 i n d u s t r i e s and 2 occupat ions used.
Net m i g r a t i o n est imates f o r 1960-70 were c a l c u l a t e d by Bowles e t a l . (1975) who used t h e census-surv iva l r a t i o s forward method w i t h age-sex-race data f o r each county. Rates f o r 1980 were c a l c u l a t e d s i m i l a r l y by Hwang, e t a l . (1985). These r a t e s were then averaged f o r each group o f count ies. The use o f census-surv iva l r a t e s t o c a l c u l a t e n e t m i g r a t i o n min imizes, i f n o t e l i m i n a t e s , t h e e f f e c t s o f enumerat ion d i f f e r e n c e s between the two decades (Hami l ton and Henderson 1944; Hwang e t a l . 1985; P r i c e 1953). However, i t does n o t a d j u s t f o r r e g i o n a l v a r i a t i o n s i n the q u a l i t y o f enumeration. Such d i f f e r e n c e s were in t roduced by t h e 1980 Census which "improved" i t s coverage o f coun t ies w i t h l a r g e p r o p o r t i o n s o f Hispanics ( l e g a l s and i l l e g a l s ) . Cur ren t l y , demographers have n o t agreed on an a p p r o p r i a t e approach t o es t imate n e t m i g r a t i o n w i t h t h i s enumerat ion d i f f e r e n c e . I n t h i s study, no adjustments t o 1970-80 m i g r a t i o n data were made. Consequently, we expect c o r r e l a t i o n s i n v o l v i n g 1970-80 m i g r a t i o n t o be somewhat on t h e conserva t i ve side.

Thomas and Goodwin
urban-nonmetropol i tan coun t ies experienced n e t ou t -m ig ra t ion . Rura l -nonmetropol i tan coun t ies had t h e h i g h e s t ne t m i g r a t i o n loss w i t h 9.6 per 100 people l e a v i n g these count ies. From 1970 t o 1980, p o p u l a t i o n growth i n a l l coun t ies g r e a t l y increased, w i t h s i g n i f i c a n t turnarounds i n m ig ra t ion . Rura l -nonmetropol i tan coun t ies had the h i g h e s t average r a t e , 13.1, f o l l o w e d by m e t r o p o l i t a n coun t ies w i t h 12.3 and urban-nonmetropol i tan coun t ies w i t h 10.8 per 100 people. Among a l l nonmetropol i tan coun t ies , 82 o f 225 increased t h e i r popu la t ions i n bo th decades. O f t he urban-nonmetropol i tan coun t ies , 38 percen t con t inuous ly increased i n popu la t ion , whereas 47 percen t experienced growth o n l y s ince 1970 and 12 percen t l o s t p o p u l a t i o n i n bo th decades. Three percent grew d u r i n g the s i x t i e s , b u t l o s t popu la t ion the f o l l o w i n g decade. O v e r a l l , 97 o f t h e 153 urban-nonmetropol i tan coun t ies increased p o p u l a t i o n s i zes i n t h e sevent ies above t h e i r 1960 l e v e l s .
Rural nonmetropol i tan (n=72) coun t ies d isp layed s i m i l a r p a t t e r n s . T h i r t y - t w o percent had continuous p o p u l a t i o n growth i n both decades, 39 percent grew o n l y d u r i n g the sevent ies, 26 percen t dec l ined i n bo th decades, and 3 percent gained i n p o p u l a t i o n s i z e f rom 1960 t o 1970 b u t d e c l i n e d i n the sevent ies.
Hence, when 1960 i s used as t h e base year, p o p u l a t i o n turnaround (growth) occurred i n 54 (24 percen t ) o f the 225 nonmetropol i tan count ies. Although t h i s turnaround was l e s s pervas ive than expected, 36 percen t o f urban and ru ra l -nonmet ropo l i tan coun t ies experienced CI 20-year t r e n d o f cont inuous increases i n p o p u l a t i o n s i ze .
I n d u s t r i a l sustenance d i f f e r e n t i a t i o n
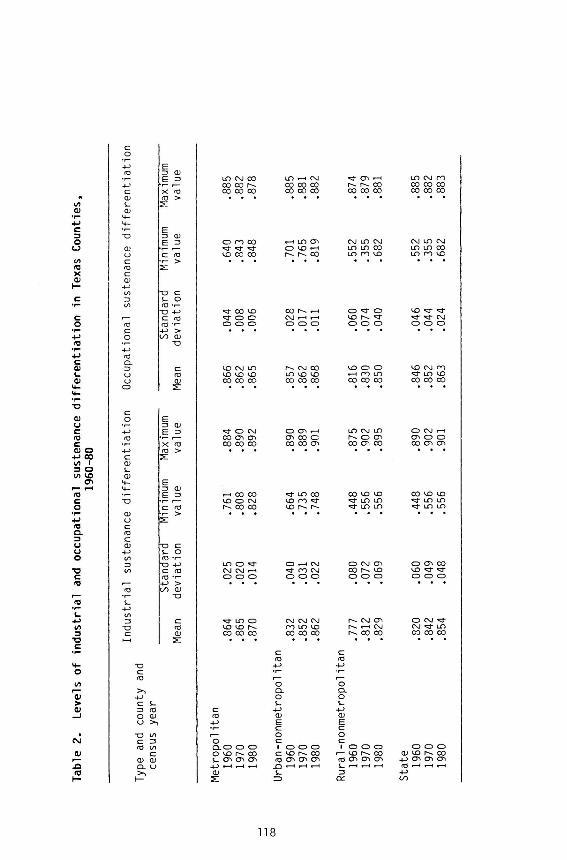
Sustenance d i f f e r e n t i a t i o n values f o r i n d u s t r i a l employment a re r e p o r t e d f o r each group o f coun t ies i n Table 2. The means i n d i c a t e the average l e v e l o f i n d u s t r i a l d i v e r s i t y based on employment; t h e s tandard d e v i a t i o n s i n d i c a t e t h e amounts o f v a r i a t i o n o r d i s p e r s i o n among coun t ies w i t h i n each group; and t h e minimum and maximum values i n d i c a t e the l e a s t and most d i v e r s i t y r e p o r t e d by count ies. Overa l l , growth i n i n d u s t r i a l d i f f e r e n t i a t i o n was p r e v a l e n t i n each group o f count ies. As expected, i n d u s t r i a l d i f f e r e n t i a t i o n was g r e a t e s t among m e t r o p o l i t a n coun t ies and l e a s t among r u r a l - n o n m e t r o p o l i t a n coun t ies f o r each o f the census years. M e t r o p o l i t a n coun t ies were t h e most homogeneous group, hav ing t h e l e a s t v a r i a t i o n i n i n d u s t r i a l d i f f e r e n t i a t i o n . I n comparison , r u r a l -nonmetropol i t a n coun t ies had the most v a r i a t i o n , w ides t range o f d i f f e r e n t i a t i o n va lues, and g r e a t e s t growth i n d i f f e r e n t i a t i o n (determined by t a k i n g the d i f f e r e n c e between 1960 and 1980 means). On c l o s e r examination, r u r a l - n o n m e t r o p o l i t a n coun t ies had a h i g h degree o f d i f f e r e n t i a t i o n , peaking i n 1980. Many o f these coun t ies were near m e t r o p o l i t a n areas and appeared t o have b e n e f i t e d from i n d u s t r i a l growth emanating from such areas. Counties w i t h t h e l e a s t d i v e r s i t y i n employment were l o c a t e d mos t l y i n West Texas, a t h i n l y populated area o f t h e s t a t e .
Among s p e c i f i c i n d u s t r i e s , e x t r a c t i v e ( i n c l u d i n g a g r i c u l t u r e ) and personal se rv ices sec to rs experienced a genera l d e c l i n e and market and p r o f e s s i o n a l se rv ices