this page is intentionally blank - twdb.texas.gov · proposed desired future conditions for a ......
TRANSCRIPT

This page is intentionally blank

GAM TASK 13-029: TOTAL ESTIMATED
RECOVERABLE STORAGE FOR AQUIFERS IN
GROUNDWATER MANAGEMENT AREA 6 by William Kohlrenken, Radu Boghici, P.G., and Jerry Shi, Ph.D., P.G.
Texas Water Development Board Groundwater Resources Division
Groundwater Availability Modeling Section (512) 463-82792
September 19, 2013
EXECUTIVE SUMMARY:
Texas Water Code, § 36.108 (d) (Texas Water Code, 2011) states that, before voting on the
proposed desired future conditions for a relevant aquifer within a groundwater management
area, the groundwater conservation districts shall consider the total estimated recoverable
storage as provided by the executive administrator of the Texas Water Development Board
(TWDB) along with other factors listed in §36.108 (d). Texas Administrative Code Rule §356.10
(Texas Administrative Code, 2011) defines the total estimated recoverable storage as the
estimated amount of groundwater within an aquifer that accounts for recovery scenarios that
range between 25 percent and 75 percent of the porosity-adjusted aquifer volume.
This report discusses the methods, assumptions, and results of an analysis to estimate the total
recoverable storage for the Blaine, Dockum, Trinity, Ogallala, and Seymour aquifers within
Groundwater Management Area 6. Tables 1 through 10 summarize the total estimated
recoverable storage required by the statute. Figures 2 through 6 indicate the extent of the
groundwater availability models used to estimate the total recoverable storage.
DEFINITION OF TOTAL ESTIMATED RECOVERABLE STORAGE:
The total estimated recoverable storage is defined as the estimated amount of groundwater
within an aquifer that accounts for recovery scenarios that range between 25 percent and 75
percent of the porosity-adjusted aquifer volume. In other words, we assume that between 25
and 75 percent of groundwater held within an aquifer can be removed by pumping.
2 This is the office telephone number for William Kohlrenken

GAM Task 13-026: Total Estimated Recoverable Storage for Aquifers in Groundwater Management Area 6 September 19, 2013
Page 4 of 23
The total recoverable storage was estimated for the portion of each aquifer within
Groundwater Management Area 6 that lies within the official lateral aquifer boundaries as
delineated by George and others (2011). Total estimated recoverable storage values may
include a mixture of water quality types, including fresh, brackish, and saline groundwater,
because the available data and the existing groundwater availability models do not permit the
differentiation of different water quality types. These values do not take into account the
effects of land surface subsidence, degradation of water quality, or any changes to surface
water-groundwater interaction as the result of extracting groundwater from the aquifer.
METHODS:
To estimate the total recoverable storage of an aquifer, we first calculated the total storage
in an aquifer within the official aquifer boundary in the groundwater management area. The
total storage is the volume of groundwater that can be removed by completely draining the
aquifer.
Aquifers can be either unconfined or confined (Figure 1). A well screened in an unconfined
aquifer will have a water level equal to the water level in the aquifer outside the well. Thus,
unconfined aquifers have water levels within the aquifers. A confined aquifer is bounded by
low permeable geologic units at the top and bottom, and the aquifer is under hydraulic
pressure above the ambient atmospheric pressure. The water level at a well screened in a
confined aquifer will be above the top of the aquifer. As a result, calculation of total storage
is also different between unconfined and confined aquifers. For an unconfined aquifer, the
total storage is equal to the volume of groundwater that makes the water level fall to the
aquifer bottom. For a confined aquifer, the total storage contains two parts. The first part is
the groundwater released from the aquifer when the water level falls from above the top of
the aquifer to the top of the aquifer. The reduction of hydraulic pressure in the aquifer by
pumping causes expansion of groundwater and deformation of aquifer solids. The aquifer is
still fully saturated to this point. The second part, just like unconfined aquifer, is the
groundwater released from the aquifer when the water level falls from the top to the bottom
of the aquifer. Given the same aquifer area and water level drop, the amount of water
released in the second part is much greater than the first part. The difference is quantified by
two parameters: storativity related to confined aquifer and specific yield related to
unconfined aquifer. For example, storativity values range from 10-5 to 10-3 for most confined

GAM Task 13-026: Total Estimated Recoverable Storage for Aquifers in Groundwater Management Area 6 September 19, 2013
Page 5 of 23
aquifers, while the specific yield values can be 0.01 to 0.3 for most unconfined aquifers. The
equations for calculating the total storage are presented below:
for unconfined aquifers
( )
for confined aquifers
o confined part
[ ( )]
or
[ ( ) ( )]
o unconfined part
[ ( )]
where:
= storage volume due to water draining from the formation (acre-feet)
= storage volume due to elastic properties of the aquifer and water(acre-feet)
Area = area of aquifer (acre)
Water Level = groundwater elevation (feet above mean sea level)
Top = elevation of aquifer top (feet above mean sea level)
Bottom = elevation of aquifer bottom (feet above mean sea level)
Sy = specific yield (no units)
Ss = specific storage (1/feet)
S = storativity or storage coefficient (no units)

GAM Task 13-026: Total Estimated Recoverable Storage for Aquifers in Groundwater Management Area 6 September 19, 2013
Page 6 of 23
FIGURE 1. SCHEMATIC GRAPH SHOWING THE DIFFERENCE BETWEEN UNCONFINED AND CONFINED AQUIFERS.
As presented in the equations, calculation of the total storage requires data, such as aquifer
top, aquifer bottom, aquifer storage properties, and water level. For the Blaine, Dockum,
Trinity, Ogallala, and Seymour aquifers in Groundwater Management Area 6, we extracted this
information from existing groundwater availability model input and output files on a cell-by-
cell basis. In the absence of groundwater availability model(s), the total storage will be
calculated using other approaches.
Python scripts and a FORTRAN-90 program were developed and used to expedite the storage
calculation. The total recoverable storage was calculated as the product of the total storage
and an estimated factor ranging from 25 percent to 75 percent.
GAM Task 13-026: Total Estimated Recoverable Storage for Aquifers in Groundwater Management Area 6 September 19, 2013
Page 7 of 23
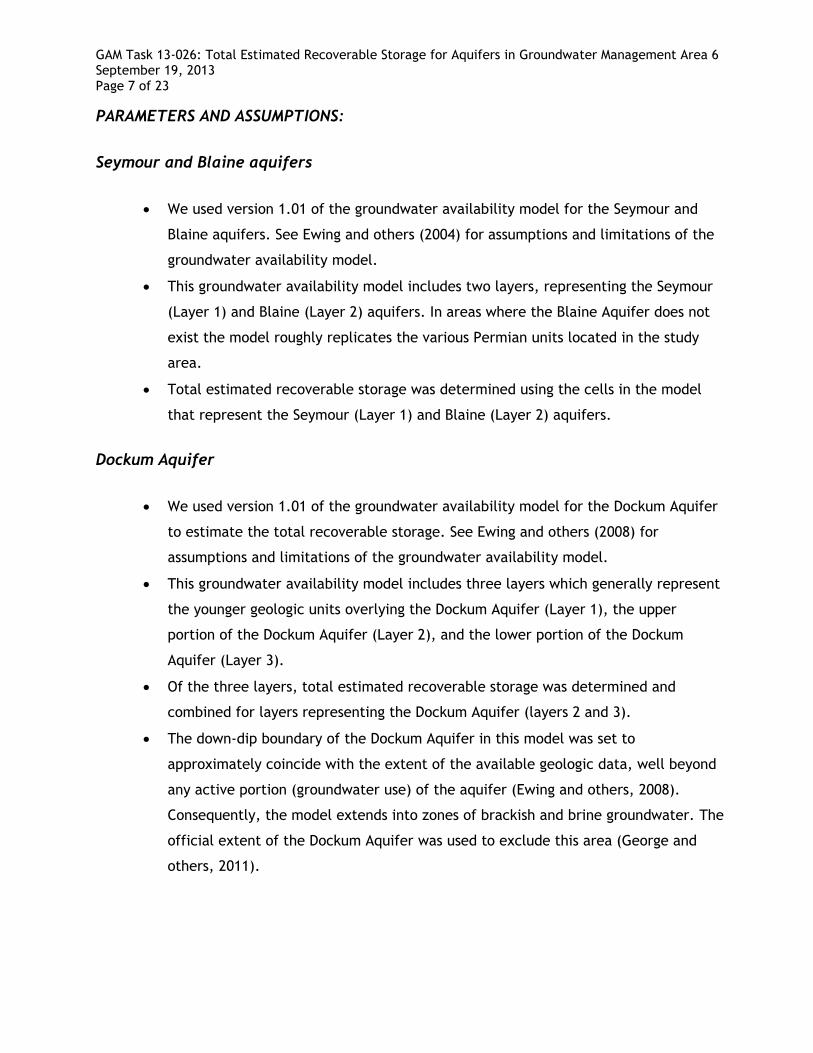
PARAMETERS AND ASSUMPTIONS:
Seymour and Blaine aquifers
We used version 1.01 of the groundwater availability model for the Seymour and
Blaine aquifers. See Ewing and others (2004) for assumptions and limitations of the
groundwater availability model.
This groundwater availability model includes two layers, representing the Seymour
(Layer 1) and Blaine (Layer 2) aquifers. In areas where the Blaine Aquifer does not
exist the model roughly replicates the various Permian units located in the study
area.
Total estimated recoverable storage was determined using the cells in the model
that represent the Seymour (Layer 1) and Blaine (Layer 2) aquifers.
Dockum Aquifer
We used version 1.01 of the groundwater availability model for the Dockum Aquifer
to estimate the total recoverable storage. See Ewing and others (2008) for
assumptions and limitations of the groundwater availability model.
This groundwater availability model includes three layers which generally represent
the younger geologic units overlying the Dockum Aquifer (Layer 1), the upper
portion of the Dockum Aquifer (Layer 2), and the lower portion of the Dockum
Aquifer (Layer 3).
Of the three layers, total estimated recoverable storage was determined and
combined for layers representing the Dockum Aquifer (layers 2 and 3).
The down-dip boundary of the Dockum Aquifer in this model was set to
approximately coincide with the extent of the available geologic data, well beyond
any active portion (groundwater use) of the aquifer (Ewing and others, 2008).
Consequently, the model extends into zones of brackish and brine groundwater. The
official extent of the Dockum Aquifer was used to exclude this area (George and
others, 2011).

GAM Task 13-026: Total Estimated Recoverable Storage for Aquifers in Groundwater Management Area 6 September 19, 2013
Page 8 of 23
Trinity Aquifer
We used version 1.01 of the groundwater availability model for the northern part of the
Trinity Aquifer and the Woodbine Aquifer to estimate the total recoverable storage for
the Trinity Aquifer. The Woodbine Aquifer is not present in Groundwater Management
Area 6. See Bené and others (2004) for assumptions and limitations of the groundwater
availability model.
This groundwater availability model includes seven layers which generally represent the
Woodbine Aquifer (Layer 1), the Washita and Fredericksburg Confining Unit (Layer 2),
the Paluxy Aquifer Unit of the Trinity Aquifer (Layer 3), the Glen Rose Confining Unit of
the Trinity Aquifer (Layer 4), the Hensell Sand Aquifer Unit of the Trinity Aquifer (Layer
5), the Twin Mountains Confining Units of the Trinity Aquifer (Layer 6), and the Hosston
Aquifer Unit of the Trinity Aquifer (Layer 7). To develop the estimates for the total
estimated recoverable storage, we used layers 3 through 7 (the Trinity Aquifer).
The down-dip boundary of the model is considered the Luling-Mexia-Talco Fault Zone,
which probably allows minimal groundwater flow across the fault zone (Bené and
others, 2004). The groundwater in the official extent of the northern portion of the
Trinity Aquifer aquifers ranges from fresh to moderately saline (brackish) in
composition (Bené and others, 2004).
Southern portion of the Ogallala Aquifer
We used version 2.01 of the groundwater availability model to estimate the total
recoverable storages of the southern portion of the Ogallala and Edwards-Trinity
(High Plains) aquifers. This model is an expansion on and update to the previously
developed groundwater availability model for the southern portion of the Ogallala
Aquifer described in Blandford and others (2003). See Blandford and others (2008)
and Blandford and others (2003) for assumptions and limitations of the groundwater
availability model.
This groundwater availability model includes 4 layers which represent the southern
portion of the Ogallala (Layer 1) and the Edwards-Trinity (High Plains) (primarily
Edwards, Comanche Peak, and Antlers Sand formations; layers 2-4).
Of the four layers, total estimated recoverable storage was determined for the
Ogallala Aquifer (Layer 1) in Groundwater Management Area 6.

GAM Task 13-026: Total Estimated Recoverable Storage for Aquifers in Groundwater Management Area 6 September 19, 2013
Page 9 of 23
Northern portion of the Ogallala Aquifer
We used version 3.01 of the groundwater availability model to estimate the total
recoverable storage for the northern portion of the Ogallala Aquifer which includes
the Rita Blanca Aquifer where it occurs in the model area. However, the Rita Blanca
Aquifer does not exist in Groundwater Management Area 6. This model is an update
to the previously developed groundwater availability model for the northern portion
of the Ogallala Aquifer described in Dutton and others (2001) and Dutton (2004).
See Kelley and others (2010), Dutton (2004), and Dutton and others (2001) for
assumptions and limitations of the model.
The model for the northern portion of the Ogallala Aquifer has one layer which for
Groundwater Management Area 6 represents the Ogallala Aquifer.
RESULTS:
Tables 1 through 10 summarize the total estimated recoverable storage required by statute.
The county and groundwater conservation district total estimates are rounded to two
significant figures. Figures 2 through 6 indicate the extent of the groundwater availability
models in Groundwater Management Area 6 for the Blaine, Dockum, Trinity, Ogallala, and
Seymour aquifers from which the storage information was extracted.

GAM Task 13-026: Total Estimated Recoverable Storage for Aquifers in Groundwater Management Area 6 September 19, 2013
Page 10 of 23
TABLE 1. TOTAL ESTIMATED RECOVERABLE STORAGE BY COUNTY FOR THE BLAINE AQUIFER WITHIN GROUNDWATER MANAGEMENT AREA 6. COUNTY TOTAL ESTIMATES ARE ROUNDED TO TWO
SIGNIFICANT FIGURES.
County Total Storage
(acre-feet)
25 percent of
Total Storage
(acre-feet)
75 percent of Total
Storage
(acre-feet)
Childress 18,000,000 4,500,000 13,500,000
Collingsworth 29,000,000 7,250,000 21,750,000
Cottle 22,000,000 5,500,000 16,500,000
Dickens 35,000 8,750 26,250
Foard 5,900,000 1,475,000 4,425,000
Hall 2,500,000 625,000 1,875,000
Hardeman 10,000,000 2,500,000 7,500,000
King 24,000,000 6,000,000 18,000,000
Knox 810,000 202,500 607,500
Motley 110,000 27,500 82,500
Fisher 15,000,000 3,750,000 11,250,000
Kent 490,000 122,500 367,500
Stonewall 36,000,000 9,000,000 27,000,000
Jones 880,000 220,000 660,000
Wilbarger 1,400 350 1,050
Total 164,726,400 41,181,600 123,544,800
GAM Task 13-026: Total Estimated Recoverable Storage for Aquifers in Groundwater Management Area 6 September 19, 2013
Page 11 of 23
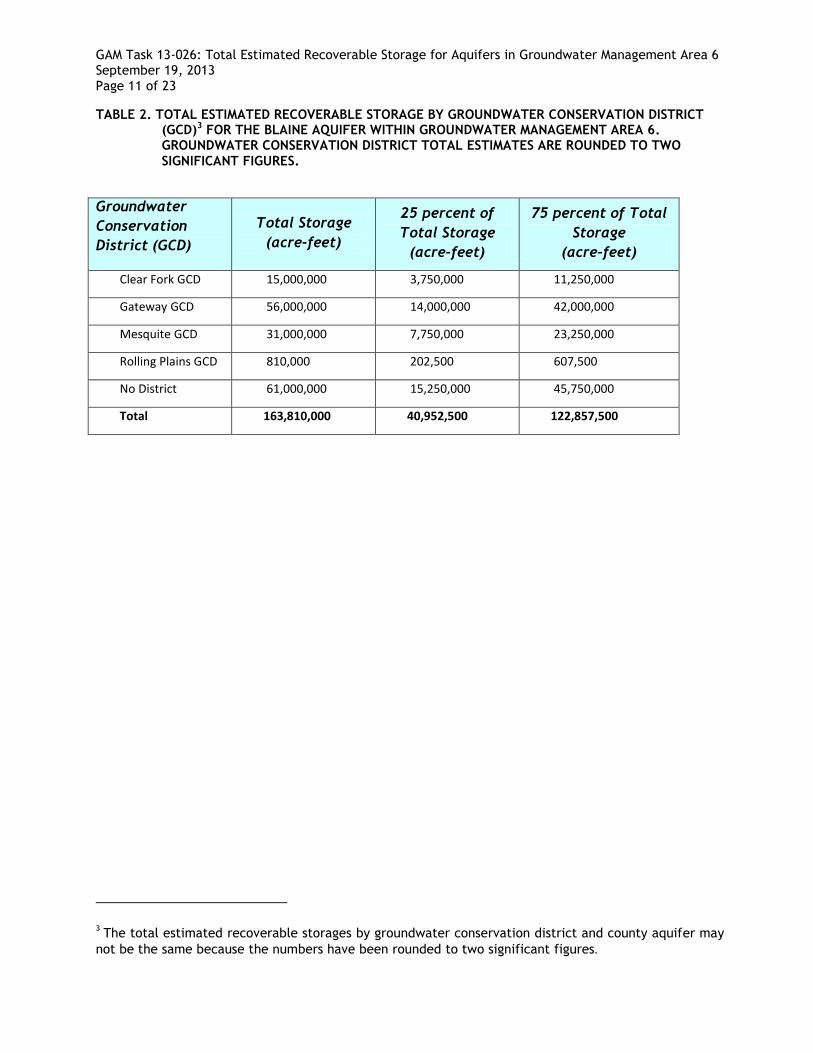
TABLE 2. TOTAL ESTIMATED RECOVERABLE STORAGE BY GROUNDWATER CONSERVATION DISTRICT (GCD)3 FOR THE BLAINE AQUIFER WITHIN GROUNDWATER MANAGEMENT AREA 6. GROUNDWATER CONSERVATION DISTRICT TOTAL ESTIMATES ARE ROUNDED TO TWO
SIGNIFICANT FIGURES.
3 The total estimated recoverable storages by groundwater conservation district and county aquifer may
not be the same because the numbers have been rounded to two significant figures.
Groundwater
Conservation
District (GCD)
Total Storage
(acre-feet)
25 percent of
Total Storage
(acre-feet)
75 percent of Total
Storage
(acre-feet)
Clear Fork GCD 15,000,000 3,750,000 11,250,000
Gateway GCD 56,000,000 14,000,000 42,000,000
Mesquite GCD 31,000,000 7,750,000 23,250,000
Rolling Plains GCD 810,000 202,500 607,500
No District 61,000,000 15,250,000 45,750,000
Total 163,810,000 40,952,500 122,857,500
GAM Task 13-026: Total Estimated Recoverable Storage for Aquifers in Groundwater Management Area 6 September 19, 2013
Page 12 of 23
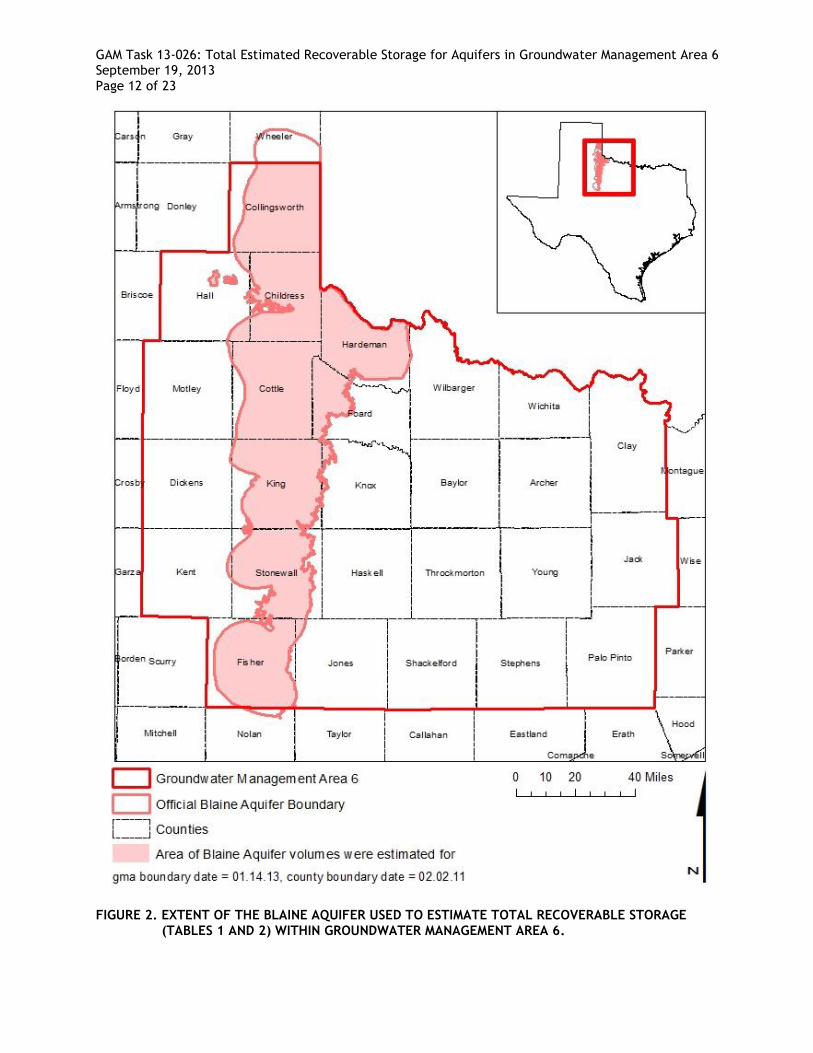
FIGURE 2. EXTENT OF THE BLAINE AQUIFER USED TO ESTIMATE TOTAL RECOVERABLE STORAGE
(TABLES 1 AND 2) WITHIN GROUNDWATER MANAGEMENT AREA 6.

GAM Task 13-026: Total Estimated Recoverable Storage for Aquifers in Groundwater Management Area 6 September 19, 2013
Page 13 of 23
TABLE 3. TOTAL ESTIMATED RECOVERABLE STORAGE BY COUNTY FOR THE DOCKUM AQUIFER WITHIN GROUNDWATER MANAGEMENT AREA 6. COUNTY TOTAL ESTIMATES ARE ROUNDED TO TWO
SIGNIFICANT FIGURES.
TABLE 4. TOTAL ESTIMATED RECOVERABLE STORAGE BY GROUNDWATER CONSERVATION DISTRICT (GCD) FOR THE DOCKUM AQUIFER WITHIN GROUNDWATER MANAGEMENT AREA 6. GROUNDWATER CONSERVATION DISTRICT TOTAL ESTIMATES ARE ROUNDED TO TWO
SIGNIFICANT FIGURES.
County Total Storage
(acre-feet)
25 percent of
Total Storage
(acre-feet)
75 percent of Total
Storage
(acre-feet)
Dickens 3,400,000 850,000 2,550,000
Fisher 1,300,000 325,000 975,000
Kent 1,400,000 350,000 1,050,000
Motley 1,800,000 450,000 1,350,000
Total 7,900,000 1,975,000 5,925,000
Groundwater
Conservation
District (GCD)
Total Storage
(acre-feet)
25 percent of
Total Storage
(acre-feet)
75 percent of Total
Storage
(acre-feet)
Clear Fork GCD 1,300,000 325,000 975,000
Gateway GCD 1,800,000 450,000 1,350,000
No District 4,800,000 1,200,000 3,600,000
Total 7,900,000 1,975,000 5,925,000

GAM Task 13-026: Total Estimated Recoverable Storage for Aquifers in Groundwater Management Area 6 September 19, 2013
Page 14 of 23
FIGURE 3. EXTENT OF THE GROUNDWATER AVAILABILITY MODEL FOR THE DOCKUM AQUIFER USED TO ESTIMATE TOTAL RECOVERABLE STORAGE (TABLES 3 AND 4) WITHIN GROUNDWATER MANAGEMENT AREA (GMA) 6.
GAM Task 13-026: Total Estimated Recoverable Storage for Aquifers in Groundwater Management Area 6 September 19, 2013
Page 15 of 23
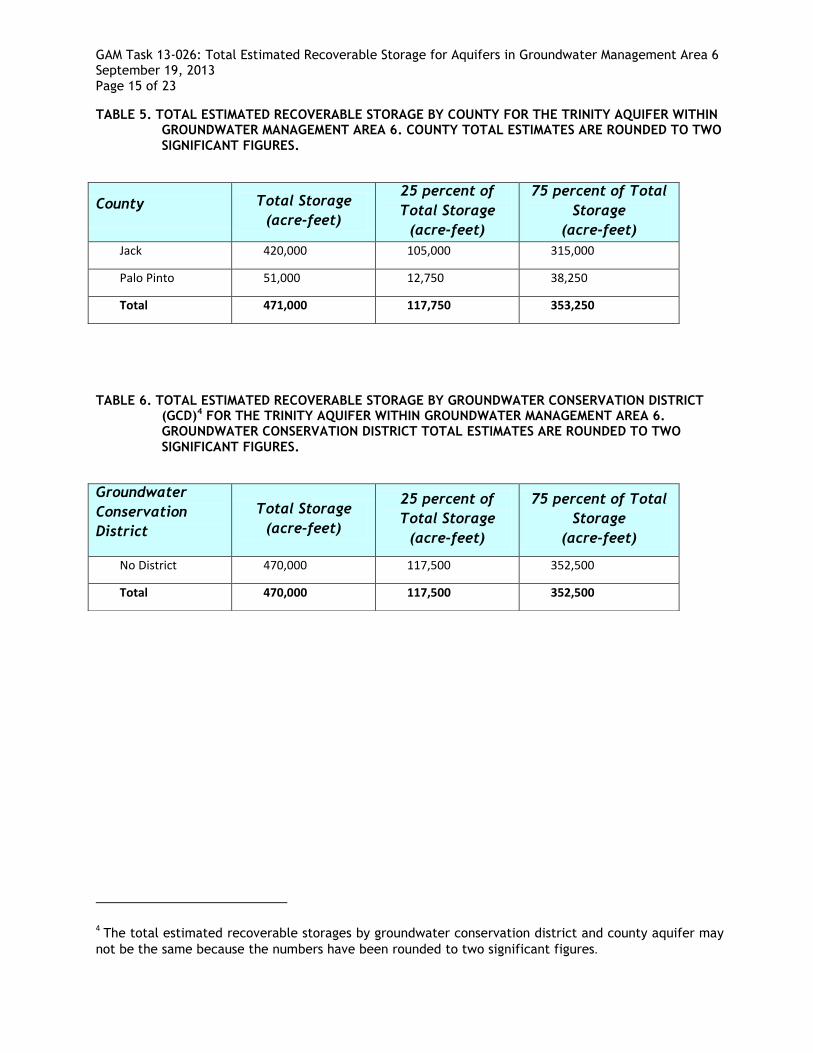
TABLE 5. TOTAL ESTIMATED RECOVERABLE STORAGE BY COUNTY FOR THE TRINITY AQUIFER WITHIN GROUNDWATER MANAGEMENT AREA 6. COUNTY TOTAL ESTIMATES ARE ROUNDED TO TWO
SIGNIFICANT FIGURES.
TABLE 6. TOTAL ESTIMATED RECOVERABLE STORAGE BY GROUNDWATER CONSERVATION DISTRICT (GCD)4 FOR THE TRINITY AQUIFER WITHIN GROUNDWATER MANAGEMENT AREA 6. GROUNDWATER CONSERVATION DISTRICT TOTAL ESTIMATES ARE ROUNDED TO TWO
SIGNIFICANT FIGURES.
4 The total estimated recoverable storages by groundwater conservation district and county aquifer may
not be the same because the numbers have been rounded to two significant figures.
County Total Storage
(acre-feet)
25 percent of
Total Storage
(acre-feet)
75 percent of Total
Storage
(acre-feet)
Jack 420,000 105,000 315,000
Palo Pinto 51,000 12,750 38,250
Total 471,000 117,750 353,250
Groundwater
Conservation
District
Total Storage
(acre-feet)
25 percent of
Total Storage
(acre-feet)
75 percent of Total
Storage
(acre-feet)
No District 470,000 117,500 352,500
Total 470,000 117,500 352,500
GAM Task 13-026: Total Estimated Recoverable Storage for Aquifers in Groundwater Management Area 6 September 19, 2013
Page 16 of 23
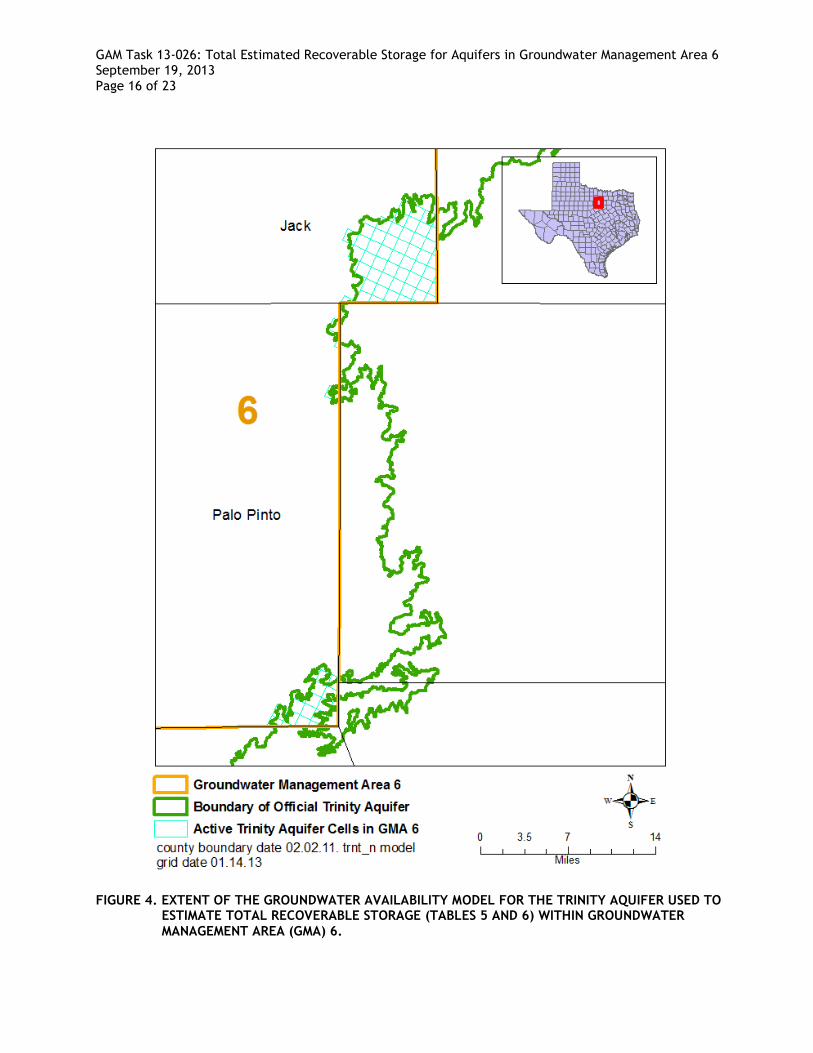
FIGURE 4. EXTENT OF THE GROUNDWATER AVAILABILITY MODEL FOR THE TRINITY AQUIFER USED TO ESTIMATE TOTAL RECOVERABLE STORAGE (TABLES 5 AND 6) WITHIN GROUNDWATER
MANAGEMENT AREA (GMA) 6.

GAM Task 13-026: Total Estimated Recoverable Storage for Aquifers in Groundwater Management Area 6 September 19, 2013
Page 17 of 23
TABLE 7. TOTAL ESTIMATED RECOVERABLE STORAGE BY COUNTY FOR THE OGALLALA AQUIFER WITHIN GROUNDWATER MANAGEMENT AREA 6. COUNTY TOTAL ESTIMATES ARE ROUNDED
TO TWO SIGNIFICANT FIGURES.
TABLE 8. TOTAL ESTIMATED RECOVERABLE STORAGE BY GROUNDWATER CONSERVATION DISTRICT (GCD) FOR THE OGALLALA AQUIFER WITHIN GROUNDWATER MANAGEMENT AREA 6. GROUNDWATER CONSERVATION DISTRICT TOTAL ESTIMATES ARE ROUNDED TO TWO SIGNIFICANT FIGURES.
County Total Storage
(acre-feet)
25 percent of
Total Storage
(acre-feet)
75 percent of Total
Storage
(acre-feet)
Collingsworth 85,000 21,250 63,750 Dickens 1,200,000 300,000 900,000 Motley 1,000,000 250,000 750,000 Total 2,285,000 571,250 1,713,750
Groundwater
Conservation
District (GCD)
Total Storage
(acre-feet)
25 percent of
Total Storage
(acre-feet)
75 percent of Total
Storage
(acre-feet)
Gateway GCD 1,000,000 250,000 750,000 Mesquite GCD 85,000 21,250 63,750 No District 1,200,000 300,000 900,000 Total 2,285,000 571,250 1,713,750
GAM Task 13-026: Total Estimated Recoverable Storage for Aquifers in Groundwater Management Area 6 September 19, 2013
Page 18 of 23
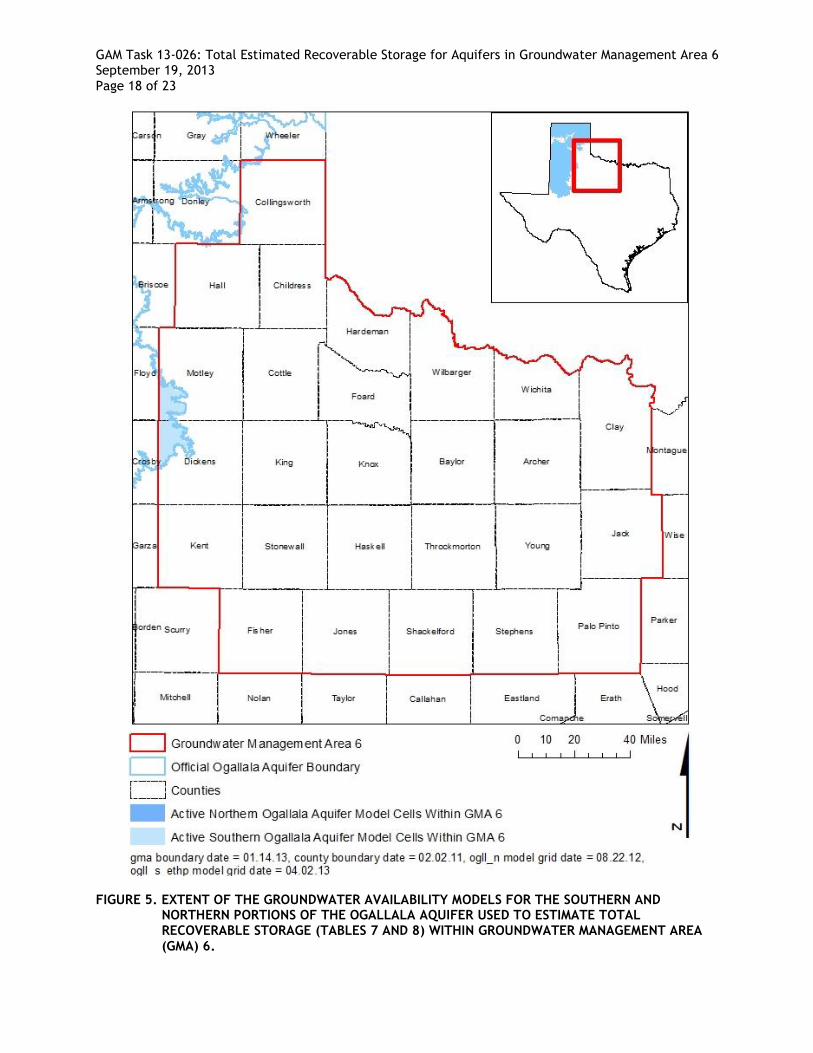
FIGURE 5. EXTENT OF THE GROUNDWATER AVAILABILITY MODELS FOR THE SOUTHERN AND NORTHERN PORTIONS OF THE OGALLALA AQUIFER USED TO ESTIMATE TOTAL RECOVERABLE STORAGE (TABLES 7 AND 8) WITHIN GROUNDWATER MANAGEMENT AREA
(GMA) 6.
GAM Task 13-026: Total Estimated Recoverable Storage for Aquifers in Groundwater Management Area 6 September 19, 2013
Page 19 of 23
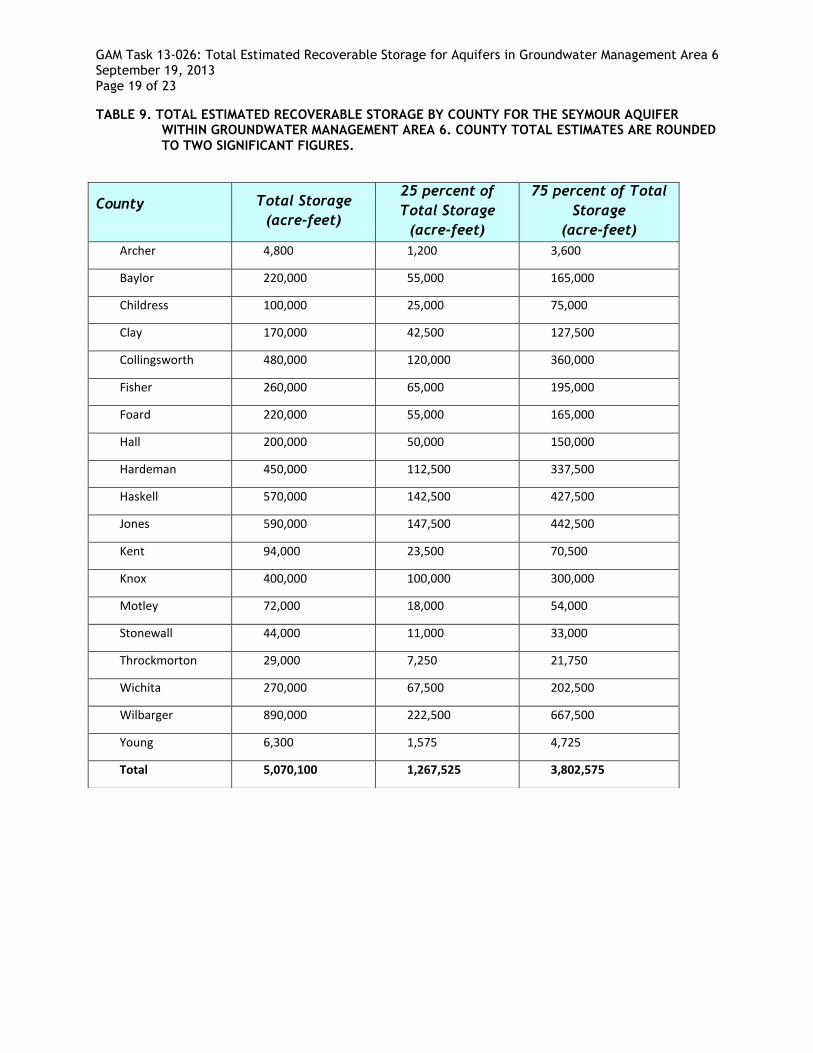
TABLE 9. TOTAL ESTIMATED RECOVERABLE STORAGE BY COUNTY FOR THE SEYMOUR AQUIFER WITHIN GROUNDWATER MANAGEMENT AREA 6. COUNTY TOTAL ESTIMATES ARE ROUNDED
TO TWO SIGNIFICANT FIGURES.
County Total Storage
(acre-feet)
25 percent of
Total Storage
(acre-feet)
75 percent of Total
Storage
(acre-feet)
Archer 4,800 1,200 3,600 Baylor 220,000 55,000 165,000 Childress 100,000 25,000 75,000 Clay 170,000 42,500 127,500 Collingsworth 480,000 120,000 360,000 Fisher 260,000 65,000 195,000 Foard 220,000 55,000 165,000 Hall 200,000 50,000 150,000 Hardeman 450,000 112,500 337,500 Haskell 570,000 142,500 427,500 Jones 590,000 147,500 442,500 Kent 94,000 23,500 70,500 Knox 400,000 100,000 300,000 Motley 72,000 18,000 54,000 Stonewall 44,000 11,000 33,000 Throckmorton 29,000 7,250 21,750 Wichita 270,000 67,500 202,500 Wilbarger 890,000 222,500 667,500 Young 6,300 1,575 4,725 Total 5,070,100 1,267,525 3,802,575

GAM Task 13-026: Total Estimated Recoverable Storage for Aquifers in Groundwater Management Area 6 September 19, 2013
Page 20 of 23
TABLE 10. TOTAL ESTIMATED RECOVERABLE STORAGE BY GROUNDWATER CONSERVATION DISTRICT (GCD)5 FOR THE SEYMOUR AQUIFER WITHIN GROUNDWATER MANAGEMENT AREA 6. GROUNDWATER CONSERVATION DISTRICT TOTAL ESTIMATES ARE ROUNDED TO TWO
SIGNIFICANT FIGURES.
5 The total estimated recoverable storages by groundwater conservation district and county aquifer may
not be the same because the numbers have been rounded to two significant figures.
Groundwater
Conservation
District (GCD)
Total Storage
(acre-feet)
25 percent of
Total Storage
(acre-feet)
75 percent of Total
Storage
(acre-feet)
Clear Fork GCD 260,000 65,000 195,000 Gateway GCD 850,000 212,500 637,500 Mesquite GCD 680,000 170,000 510,000 Rolling Plains GCD 1,200,000 300,000 900,000 No District 2,100,000 525,000 1,575,000 Total 5,090,000 1,272,500 3,817,500
GAM Task 13-026: Total Estimated Recoverable Storage for Aquifers in Groundwater Management Area 6 September 19, 2013
Page 21 of 23
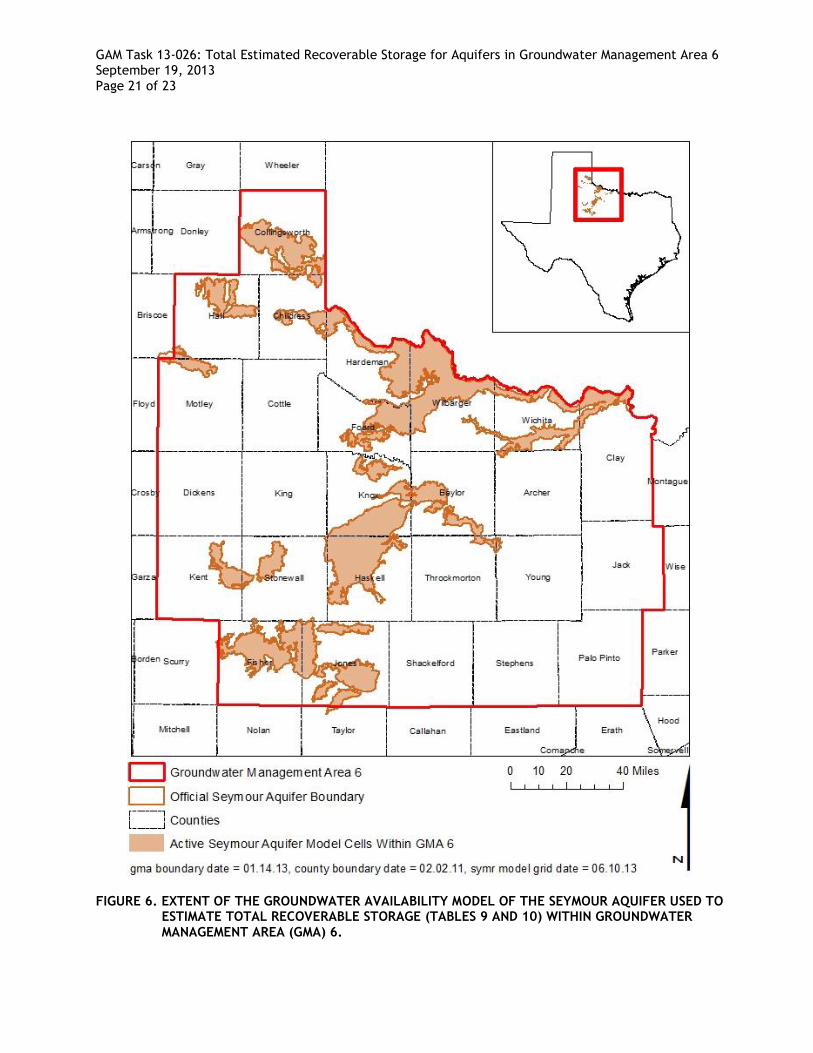
FIGURE 6. EXTENT OF THE GROUNDWATER AVAILABILITY MODEL OF THE SEYMOUR AQUIFER USED TO ESTIMATE TOTAL RECOVERABLE STORAGE (TABLES 9 AND 10) WITHIN GROUNDWATER
MANAGEMENT AREA (GMA) 6.
GAM Task 13-026: Total Estimated Recoverable Storage for Aquifers in Groundwater Management Area 6 September 19, 2013
Page 22 of 23
LIMITATIONS
The groundwater models used in completing this analysis are the best available scientific tools
that can be used to meet the stated objective(s). To the extent that this analysis will be used
for planning purposes and/or regulatory purposes related to pumping in the past and into the
future, it is important to recognize the assumptions and limitations associated with the use of
the results. In reviewing the use of models in environmental regulatory decision making, the
National Research Council (2007) noted:
“Models will always be constrained by computational limitations, assumptions, and
knowledge gaps. They can best be viewed as tools to help inform decisions rather than
as machines to generate truth or make decisions. Scientific advances will never make
it possible to build a perfect model that accounts for every aspect of reality or to
prove that a given model is correct in all respects for a particular regulatory
application. These characteristics make evaluation of a regulatory model more
complex than solely a comparison of measurement data with model results.”
Because the application of the groundwater model was designed to address regional scale
questions, the results are most effective on a regional scale. The TWDB makes no warranties
or representations relating to the actual conditions of any aquifer at a particular location or at
a particular time.
REFERENCES:
Bené, J., Harden, B., O’Rourke, D., Donnelly, A., and Yelderman, J., 2004, Northern
Trinity/Woodbine Groundwater Availability Model: contract report to the Texas Water
Development Board by R.W. Harden and Associates, 391 p.,
http://www.twdb.state.tx.us/gam/trnt_n/trnt_n.htm.
Blandford, T. N., Blazer, D. J., Calhoun, K. C., Dutton, A. R., Naing, T., Reedy, R. C., and
Scanlon, B.R., 2003, Groundwater availability of the southern Ogallala aquifer in Texas
and New Mexico—Numerical simulations through 2050: Final report prepared for the
Texas Water Development Board by Daniel B. Stephens & Associates, Inc., 158 p.,
http://www.twdb.texas.gov/groundwater/models/gam/ogll_s/OGLL_S_Full_Report.pdf
.
Blandford, T. N., Kuchanur, M., Standen, A., Ruggiero, R., Calhoun, K. C., Kirby, P., and Shah, G., 2008, Groundwater availability model of the Edwards-Trinity (High Plains) Aquifer in Texas and New Mexico: Final report prepared for the Texas Water Development Board

GAM Task 13-026: Total Estimated Recoverable Storage for Aquifers in Groundwater Management Area 6 September 19, 2013
Page 23 of 23
by Daniel B. Stephens & Associates, Inc., 176 p., http://www.twdb.texas.gov/groundwater/models/gam/ethp/ETHP_Model_Report.pdf.
Dutton, A., 2004, Adjustment of Parameters to Improve the Calibration of the Og-n Model of the Ogallala Aquifer, Panhandle Water Planning Area: Prepared for Freese and Nichols, Inc. and Panhandle Water Planning Group, 25 p., http://www.twdb.texas.gov/groundwater/models/gam/ogll_n/OGLL_N_Revision_Report.pdf.
Dutton, A. R., Reedy, R. C., and Mace, R. E., 2001, Saturated Thickness in the Ogallala Aquifer in the Panhandle Water Planning Area—Simulations of 2000 through 2050 Withdrawal Projections: Prepared for Panhandle Water planning Group, 130 p., http://www.twdb.texas.gov/groundwater/models/gam/ogll_n/OGLL_N_Model_Report.pdf.
Ewing, J. E., Jones, T. L., Pickens, J. F., Chastain-Howley, A., Dean, K. E., Spear, A. A., 2004, Groundwater availability model for the Seymour Aquifer: Final report prepared for the Texas Water Development Board by INTERA, Inc., 533 p., http://www.twdb.texas.gov/groundwater/models/gam/symr/SYMR_Model_Report.pdf.
Ewing, J. E., Jones, T. L., Yan, T., Vreugdenhil, A. M., Fryar, D. G., Pickens, J. F., Gordon, K., Nicot, J. P., Scanlon, B. R., Ashworth, J. B., and Beach, J., 2008, Groundwater Availability Model for the Dockum Aquifer – Final Report: contract report to the Texas Water Development Board, 510 p., http://www.twdb.texas.gov/groundwater/models/gam/dckm/DCKM_Model_Report.pdf.
Kelley, V.A., Jones [Dale], T., Fryar, D., Dutton, A.R., Deeds, N., 2010, Northern Ogallala Update to Support 2011 [Region A] Water Plan, 106 p., http://www.twdb.texas.gov/groundwater/models/gam/ogll_n/Appendix%20F%20_%20Update%20Northern%20Ogallala%20GAM.pdf.
George, P. G., Mace, R. E., and Petrossian, R, 2011, Aquifers of Texas, Texas Water Development Board Report 380, http://www.twdb.texas.gov/groundwater/aquifer/index.asp
National Research Council, 2007, Models in Environmental Regulatory Decision Making Committee on Models in the Regulatory Decision Process, National Academies Press, Washington D.C., 287 p., http://www.nap.edu/catalog.php?record_id=11972.
Texas Administrative Code, 2011, http://info.sos.state.tx.us/pls/pub/readtac$ext.viewtac
Texas Water Code, 2011, http://www.statutes.legis.state.tx.us/docs/WA/pdf/WA.36.pdf