this manuscript is a pre-print and has been submitted for
TRANSCRIPT

This manuscript is a pre-print and has been submitted for publication in Frontiers in Environmental
Science. Subsequent versions may have slightly different content. The DOI of the peer-reviewed
publication will be provided if accepted. Please contact the authors if you have any questions or
comments on this manuscript.

Meta-analysis Indonesia
2
Plastic pollution research in Indonesia: state of science and future
research directions to reduce impacts
Paul Vriend1,2*, Hidayat2, J. van Leeuwen11, M. R. Cordova3, N. P. Purba4, A. J. Löhr5, I. Faizal4, 1
N. Ningsih6, K. Agustina7, S. Husrin8, D. Suryono8, I. Hantoro5,9, B. Widianarko9, P. Lestari10,12, 2
B. Vermeulen1, T. van Emmerik1 3
1Hydrology and Quantitative Water Management Group, Wageningen University & Research, 4
Wageningen, Netherlands 5
2Research Center for Limnology, Indonesian Institute of Sciences (LIPI), Bogor, Indonesia 6
3Research Center for Oceanography, Indonesian Institute of Sciences (LIPI), Jl. Pasir Putih 1 Ancol, 7
Jakarta 14430, Indonesia 8
4Department of Marine Science, Faculty of Fishery and Marine Science, Universitas Padjadjaran, 9
Indonesia 10
5 Department of Environmental Sciences, Faculty of Science, Open University of the Netherlands, 11
Heerlen, The Netherlands 12
6 Oceanography Research Group, Faculty of Earth Sciences and Technology, Bandung Institute of 13
Technology, Bandung, Jawa Barat 40132, Indonesia 14
7World Resources Institute, Jakarta, Indonesia 15
8Marine Research Centre, Research Agency, and Human Resource Development, Ministry of Marine 16
Affairs and Fisheries, Jakarta, Indonesia 17
9Department of Food Technology, Faculty of Agricultural Technology, Soegijapranata Catholic 18
University, Semarang, Indonesia 19
10Department of Environmental Engineering, Faculty of Civil Planning and Geo Engineering, Sepuluh 20
Nopember Institute of Technology, Surabaya, Indonesia 21
11Wageningen University, Environmental Policy Group, Hollandseweg 1, 6706 KN, Wageningen, the 22
Netherlands 23
12Department of Agricultural and Biosystems Engineering, Faculty of Agricultural Technology, 24
Universitas Gadjah Mada, Yogyakarta, Indonesia 25
* Correspondence: 26
Corresponding Author 27

Meta-analysis Indonesia
3
Keywords: Macroplastic, Microplastic, Indonesia, Litter, Marine, River, Debris, Pollution 29
30
Abstract 31
Several studies have suggested Indonesia to be among the top plastic polluting countries globally. Data 32
on the presence and amounts of plastic pollution are required to help design effective plastic reduction 33
and mitigation strategies. Research quantifying plastic pollution in Indonesia has picked up in recent 34
years. However, a lack of central coordination in this research has led to research output with different 35
goals, methods, and data formats. In this study we present a meta-analysis of studies published on 36
plastic pollution in Indonesia to uncover gaps and biases in current research, and to use these insights 37
to suggest ways to improve future research to fill these gaps. Research gaps and biases identified 38
include a clear preference for marine research, and a bias towards certain environmental compartments 39
within the marine, riverine, and terrestrial systems that have easy to apply methods. Units of 40
measurement used to express results vary greatly between studies, making it difficult to compare data 41
effectively. Nevertheless, we identify polypropylene (PP) and polyethylene variants (PE, HDPE, 42
LDPE) to be among the most frequently found polymers in both macro- and microplastic pollution in 43
Indonesia, though polymer identification is lacking in a large part of the studies. Plastic research is 44
mostly done on Java Island (49 studies, 59%). We recommend research methods used to quantify 45
plastic pollution to be harmonized. Moreover, we recommend a shift in focus of research towards the 46
riverine and terrestrial environments and a shift of focus of environmental compartments analyzed 47
within these systems, an increase in spatial coverage of research across Indonesia, and lastly, a larger 48
focus on polymer characterization. With these changes we envision future research which can aid with 49
the design of more effective and targeted reduction and mitigation strategies. 50
1 Introduction 51
Plastic pollution has been a topic of rising environmental concern in recent years. Model estimates 52
show that between 0.8-30 million metric tonnes of plastic waste enter the marine environment annually 53
around the globe (Borrelle et al., 2020; Lau et al., 2020; Meijer et al., 2019). The majority of plastic 54
pollution is generated on land and transported through rivers to the marine environment (Lebreton & 55
Andrady, 2019; Schmidt et al., 2017; Pawar et al., 2016). Plastic pollution can have adverse effects in 56
all three of these systems, which include mortality of fauna through ingestion or entanglement, 57
reduction of livelihoods of those dependent on ecosystem health (e.g. fishing and tourism), 58
contamination of seafood with microplastics with implications for food safety and human health, 59
property damage, and an increased risk of floods in urban areas (van Emmerik & Schwarz, 2020; Gall 60
& Thompson, 2015; Hantoro et al., 2019; Koelmans et al., 2017; Conchubhair et al., 2019; Honingh 61
et al., 2020). 62
Indonesia is estimated to be among one of the top emitting countries of plastic pollution in the world 63
(Lebreton et al., 2017). This is supported by a comparative study of previously published field 64
observations, which ranked drains in Jakarta (Indonesia Capital City) among the highest polluting 65
rivers globally (van Calcar & van Emmerik, 2019). Plastic pollution found in the Indonesian Seas not 66

Meta-analysis Indonesia
4
only comes from inland, but also from several countries surrounding it. The ocean currents transport 67
this plastic pollution to the inner seas (Purba et al., 2021). High plastic emission rates are hypothesized 68
to be caused by Indonesia’s high population densities in coastal areas in combination with improper 69
waste management and insufficient service coverage (Lebreton & Andrady, 2019; Lestari & 70
Trihadiningrum; 2019). Indonesia is located within the Coral Triangle, a hotspot for global marine 71
biodiversity which is highly susceptible to the negative effects of plastic pollution (Tomascik et al., 72
1997; Spalding et al., 2001; Lasut et al., 2018). Reducing plastic emissions in Indonesia will therefore 73
have a large impact on both reduction of global plastic emissions to the oceans, and on protecting 74
global biodiversity. The Indonesian government has committed to reduce plastic pollution. To this end, 75
it has set a target to improve solid waste management (Presidential Decree No 97/2017) as well as the 76
goal to reduce marine plastic debris by 70% in 2025. This commitment is followed up by the 77
establishment of the national action plan for marine debris management 2018 – 2025 (Presidential 78
Decree No. 83/2018). 79
Reliable and frequent data on plastic pollution and its effects on fauna and ecosystems are required for 80
the development and assessment of policy measures aimed to reduce plastic emissions to the oceans 81
(Conchubhair et al., 2019; Owens & Kamil, 2020; Vriend et al., 2020). Moreover, data on exposure 82
and toxicity are needed to assess microplastics’ human health risks from exposure to, for example, 83
contaminated seafood (Hantoro et al., 2019). Plastic pollution has been extensively studied in Indonesia 84
(e.g. Uneputty et al., 1997; Rochman et al., 2015; Cordova & Wahyudi, 2016; Van Emmerik et al., 85
2019; Syakti et al., 2017). However, observations are scattered across the country and vary widely in 86
the methods that are used. To gather reliable and frequent data, a nationally coordinated monitoring 87
strategy is required which, in turn, will form the basis for prioritizing and designing effective plastic 88
pollution reduction and mitigation strategies. 89
This review study provides an overview of the current state of knowledge on plastic pollution in 90
Indonesia and provides insights into current research biases and knowledge gaps. We then use these 91
data to suggest ways forward for plastic research in Indonesia to overcome these gaps. This overview 92
was gathered through a review of current literature on plastic pollution in Indonesia, and through 93
performing a meta-analysis of the 83 identified peer-reviewed articles. The goal of this study is to 94
provide insights on what types of research questions should be answered to fill research gaps, with the 95
aim of having a clear picture for effective policy measures to be implemented and their efficacy to be 96
monitored. 97
2 Methodology 98
2.1 Literature review 99
The literature search was performed using a snowball method. First, a literature search was performed 100
in the Google Scholar and ResearchGate databases, using different combinations of the following 101
keywords: plastic, macroplastic, microplastic, litter, marine, river, Indonesia, debris, and waste. Studies 102
that quantified plastic pollution in Indonesia were selected. Second, selected articles were scanned for 103
references to other studies concerning plastic pollution in Indonesia. These studies were then also 104
added to the review. Lastly, a large group Indonesian researchers specialized in plastic pollution was 105

Meta-analysis Indonesia
5
asked to identify any literature missing in the review. These studies were also added to the literature 106
review. The literature search was concluded on October 1, 2020. Studies published after this date have 107
therefore not been included in the subsequent analysis. The corresponding author of this paper read all 108
identified literature (n = 83), and the following information was extracted to a unique dataset: 109
1) The environmental system which was studied for plastic pollution (e.g. terrestrial, river, ocean) 110
2) The compartment in the system that was studied for plastic pollution (e.g. floating plastic, in 111
the water column, beached plastic, plastic in biota) 112
3) The location of the study (coordinates) 113
4) The size of plastic that was studied (e.g. microplastic, macroplastic, or both) 114
5) The year the study was published 115
6) The institutions the authors were affiliated to 116
7) The top three most frequently found plastic polymer types and/or shapes that were reported in 117
the study 118
8) The units in which the data were reported 119
2.2 Meta-analysis 120
The dataset created through the literature review was used for several analyses, including a spatial 121
analysis of research locations, an analysis of research output over time, an analysis of units of 122
measurement in which the data were reported, and an analysis of most frequently found polymers and 123
shapes. 124
The majority of the literature identified during the review used a size classification that deviated from 125
more recent definitions. For example, van Emmerik & Schwarz (2020) define four size classes of 126
plastic pollution, these being macro- (>50 mm), meso- (5-50 mm), micro-(0.1 µm – 5 mm), and 127
nanoplastic (<0.1 µm). Most literature identified during the review aggregate nano- and microplastic 128
and call this size range microplastic (<5 mm), and aggregate meso- and macroplastic and call this size 129
range macroplastic (>5 mm). To avoid confusion during the analysis it was decided to use the same 130
terminology as used in the identified literature. 131
The spatial analysis of research locations was performed by importing the logged coordinates into 132
ESRI ArcMap, plotting the latitude and longitude data, and aggregating the point data to Indonesia’s 133
administrative sub-regions. The shapefiles on sub-regions of Indonesia were retrieved from DIVA-GIS 134
(n.d.). Point data within a specific region were then aggregated and summed to determine the total 135
amount of studies per region. Point data in the open sea were aggregated to their closest landmass. 136
For each study, where possible, the top three most frequently found shapes, and polymers were noted. 137
The number of studies in which each shape and polymer were present in the top three was then counted 138
to determine those most frequently found items in plastic pollution in Indonesia. 139
140

Meta-analysis Indonesia
6
3 Results and discussion 141
3.1 Research per size category and environmental system 142
A total of 83 studies were considered for the meta-analysis (Table 1). The majority of studies on plastic 143
pollution in Indonesia quantify macroplastic pollution (40), a smaller group quantified microplastics 144
(37), and a handful of studies quantified both (6). This is in contrast with the findings on global plastic 145
research by Blettler et al. (2018), who found that microplastic is most frequently studied on a globally. 146
We suspect that the lower number of microplastic studies is due to the limited availability of research 147
equipment and suited laboratories in Indonesia, as well as the absence of a standardized protocol for 148
monitoring microplastics (Michida et al., 2019). Plastic pollution is most frequently studied in the 149
marine environment, with 68 papers studying marine plastic, compared to 10 studies in the riverine 150
and 3 in the terrestrial environments. 151
Table 1 - Overview of studies included in the meta-analysis sorted by environmental system and 152
size class of plastic considered. Note, we only considered the categories microplastic (<0.5 cm) 153
and macroplastic (>0.5 cm). 154
155
Within environmental systems, there is a bias to study specific sub-compartments (Table 2). For 156
example, plastics on the beach and floating plastic are most frequently studied for the marine 157
environment (29 and 15 out of 77 studies respectively), while the water column (9 out of 77), seafloor 158
sediment (9 out of 77) biota (7 out of 77), and mangroves (4 out of 77) receive less attention. A similar 159
bias can be identified in riverine plastic research, where most research so far has been done on floating 160
plastics (5 out of 15) and plastics in the water column (4 out of 15), while research on other 161
Environmental
system
Number of
studies
Macroplastic Microplastic Macro- and
Microplastic
Terrestrial 3 3 0 0
Riverine 10 5 5 0
Marine 68 30 32 6
Riverine + Marine 1 1 0 0
Terrestrial + Riverine
+ Marine
1 1 0 0
Total 83 40 37 6
Meta-analysis Indonesia
7
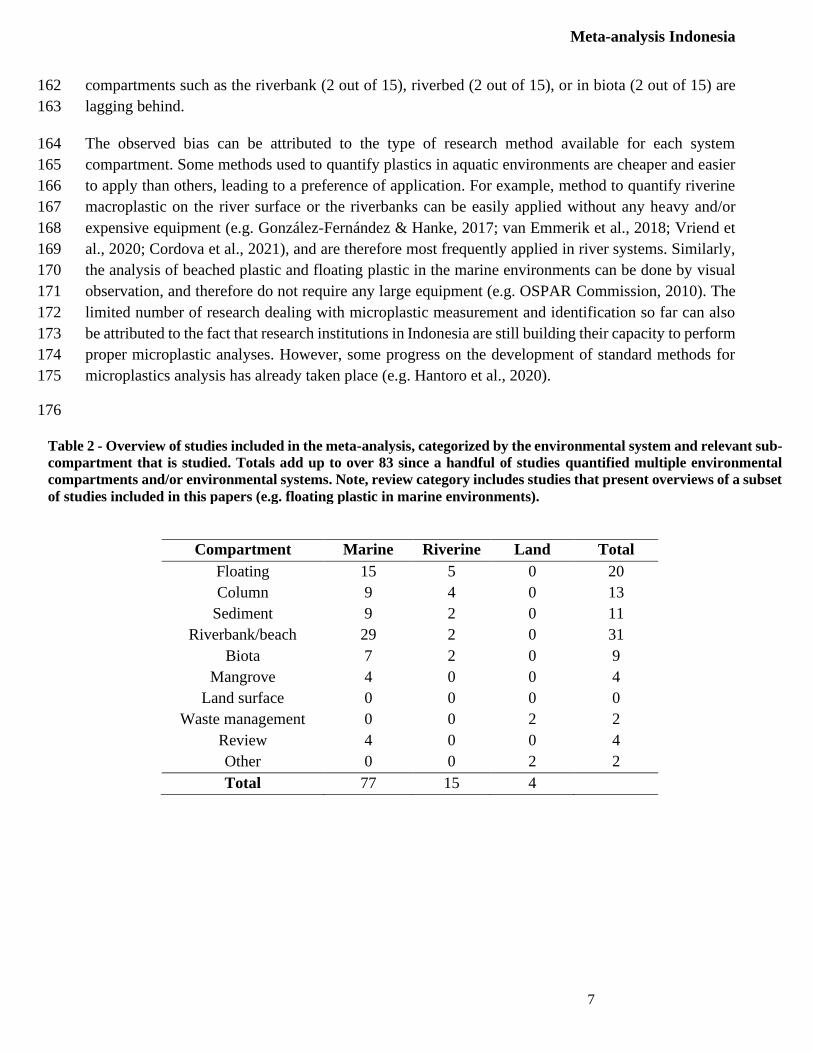
compartments such as the riverbank (2 out of 15), riverbed (2 out of 15), or in biota (2 out of 15) are 162
lagging behind. 163
The observed bias can be attributed to the type of research method available for each system 164
compartment. Some methods used to quantify plastics in aquatic environments are cheaper and easier 165
to apply than others, leading to a preference of application. For example, method to quantify riverine 166
macroplastic on the river surface or the riverbanks can be easily applied without any heavy and/or 167
expensive equipment (e.g. González-Fernández & Hanke, 2017; van Emmerik et al., 2018; Vriend et 168
al., 2020; Cordova et al., 2021), and are therefore most frequently applied in river systems. Similarly, 169
the analysis of beached plastic and floating plastic in the marine environments can be done by visual 170
observation, and therefore do not require any large equipment (e.g. OSPAR Commission, 2010). The 171
limited number of research dealing with microplastic measurement and identification so far can also 172
be attributed to the fact that research institutions in Indonesia are still building their capacity to perform 173
proper microplastic analyses. However, some progress on the development of standard methods for 174
microplastics analysis has already taken place (e.g. Hantoro et al., 2020). 175
176
Compartment Marine Riverine Land Total
Floating 15 5 0 20
Column 9 4 0 13
Sediment 9 2 0 11
Riverbank/beach 29 2 0 31
Biota 7 2 0 9
Mangrove 4 0 0 4
Land surface 0 0 0 0
Waste management 0 0 2 2
Review 4 0 0 4
Other 0 0 2 2
Total 77 15 4
Table 2 - Overview of studies included in the meta-analysis, categorized by the environmental system and relevant sub-
compartment that is studied. Totals add up to over 83 since a handful of studies quantified multiple environmental
compartments and/or environmental systems. Note, review category includes studies that present overviews of a subset
of studies included in this papers (e.g. floating plastic in marine environments).

Meta-analysis Indonesia
8
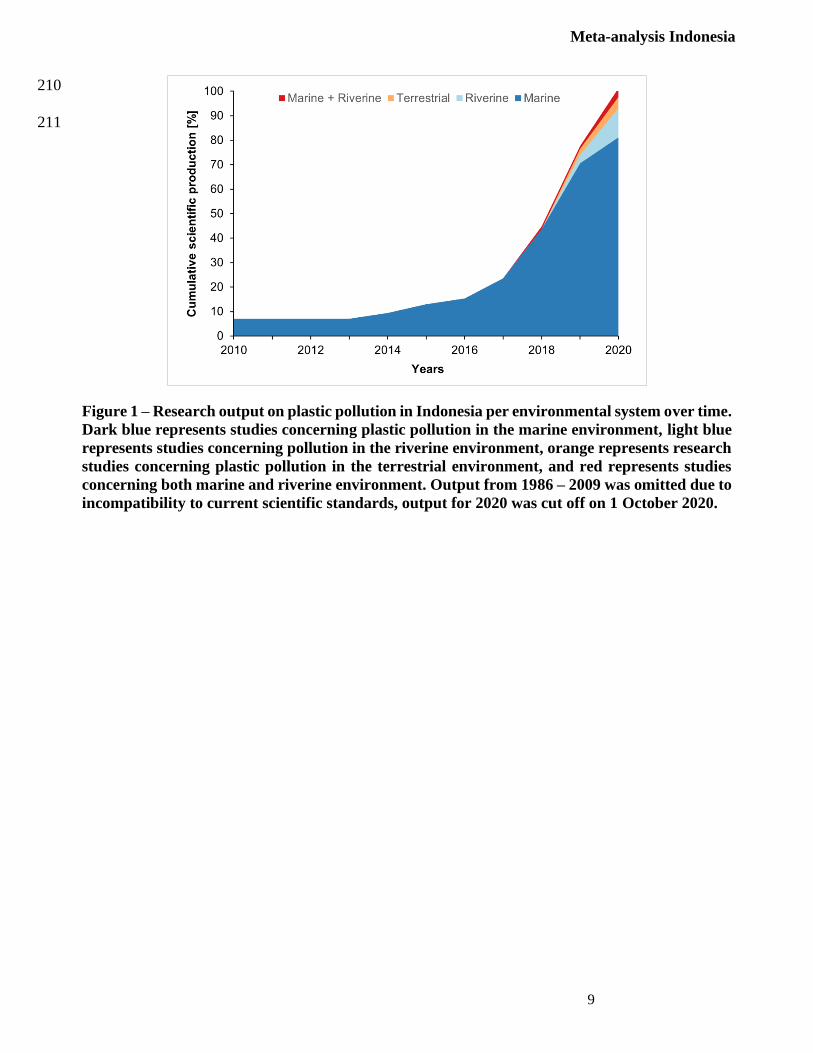
3.2 Research output over time 177
Similar to findings by Blettler et al. (2018), Indonesian plastic pollution research has been dominated 178
by marine plastic research. Plastic pollution in the Indonesian marine environment was observed and 179
reported starting from 1986 (Willoughby, 1986), with a total of six papers that flagged plastic pollution 180
on Indonesia beaches being published in the period between 1986 and 2013. These studies were 181
qualitative in nature and did not quantify the plastics which were observed. Papers that quantified 182
plastic pollution started to be published around the year 2013 (Fig. 1). Since 2013, 77 papers on plastic 183
pollution were published in peer reviewed journals, of which 67 were focused on the marine 184
environment. Studies on plastic pollution in the riverine environment started being published in 2018, 185
with 18 studies quantifying riverine plastic pollution. The terrestrial environment is the least studied 186
system, with only four studies having been identified, all of which were published since 2019. 187
The focus on plastic pollution can be explained by the fact that a large portion of the Indonesian 188
population’s livelihoods depends on it. Approximately 16.11 million tourists visited the country in 189
2019 (Statistics Indonesia, 2020), with the pristine beaches and coral reefs being an essential part of 190
their visit (Akhlas, 2020). Marine plastic pollution can negatively impact tourism revenue (Jang et al., 191
2014; Petten et al., 2020), which can explain the fact that studies quantifying plastic pollution in the 192
marine environment outnumber studies quantifying plastic pollution in the riverine and terrestrial 193
environments. Another explanation to the marine environment bias is that microplastic is considered a 194
novel contaminant expected to pose food safety risks due to consumption of coastal seafood, i.e. 195
bivalves, shellfish and fish (Hantoro et al., 2019). Accordingly, several studies have found 196
microplastics contamination in commercial edible fishes and bivalves in Indonesia (Rochman et al., 197
2015; Khoironi et al., 2018; Hastuti et al., 2019; Cordova et al., 2020). 198
To better understand potential sources of plastic pollution, more research is needed to determine the 199
type and sources of pollution in the riverine and terrestrial systems of Indonesia. Rivers are widely 200
regarded as the largest sources of marine plastics (Li et al., 2016; van Emmerik & Schwarz, 2020). 201
Plastic pollution is in turn produced through the consumption and improper disposal of waste on land, 202
and is transported to the oceans by rivers (Lebreton & Andrady, 2019, Schmidt et al., 2017; Lestari & 203
Trihadiningrum. 2019). Here, plastic pollution is dispersed over a large volume of water, which causes 204
the plastic pollution to be more diluted in the ocean compared to plastic pollution in the riverine and 205
terrestrial environments. Quantifying plastic pollution earlier in its journey from land to sea allows for 206
the quantification of more plastic while using fewer resources. We, therefore, underscore the 207
importance of the shift towards the monitoring of plastic pollution in the riverine and terrestrial 208
environments. 209
Meta-analysis Indonesia
9
210
211
Figure 1 – Research output on plastic pollution in Indonesia per environmental system over time.
Dark blue represents studies concerning plastic pollution in the marine environment, light blue
represents studies concerning pollution in the riverine environment, orange represents research
studies concerning plastic pollution in the terrestrial environment, and red represents studies
concerning both marine and riverine environment. Output from 1986 – 2009 was omitted due to
incompatibility to current scientific standards, output for 2020 was cut off on 1 October 2020.
Meta-analysis Indonesia
10
3.3 Units of measurement in plastic research 212
While all research considered in this study quantifies plastic pollution in some capacity, the units of 213
measurements in which they report their findings differ greatly. Such differences create difficulties 214
when comparing data from multiple studies since some units are not compatible with each other. 215
Studies on macroplastic pollution in Indonesia generally use two types of units to express their results 216
in. They either express results in items per area, volume or sample, or in a mass per area, volume or 217
sample (Table 3). While some studies report in both types of units (e.g. van Emmerik et al., 2018; 218
Cordova & Nurhati, 2019; Cordova et al., 2021), a large part only reports in one type. 219
The usage of different units in macroplastic research leads to two challenges when trying to compare 220
data from different studies. First, data expressed in items per sampling unit cannot be directly converted 221
into data expressed in mass (e.g. kg) per sampling unit. Previous studies on floating macroplastic 222
pollution in rivers have tried to solve this issue using a conversion rate based on the average mass of 223
macroplastics in rivers (Castro-Jimenez et al., 2019). However, this increases uncertainty in the results 224
due to the variability in plastic pollution characteristics between different locations. A second problem 225
relates to the sampling unit used. When ignoring the fact that data are expressed in either items or kg, 226
a range of sampling units is used, including macroplastic per volume, per area, and per sample (Table 227
3). These differences stem from the use of different methods to quantify plastic pollution across 228
environmental compartments (e.g. a sample of water is expressed in volume while a beach sample is 229
taken in a certain area). 230
Similarly, data presented in microplastic research are difficult to compare because a wide range of 231
sampling units are used. While most microplastic research expresses their results in terms of particles 232
per sampling unit (Table 3), the sampling units range from particles per volume, mass, and mass of 233
tissue. Again, these differences are caused by the methods that are utilized for each environmental 234
compartment: volumetric samples are mostly taken in the water column, tissue samples are taken from 235
biota, and area samples are taken from riverbanks, beaches, and from sediment at the bottom of the 236
waterbody (Table 3). While these units allow for the comparison of data between studies that examine 237
the same environmental compartment, the differences in sampling units do not allow for an integrated 238
comparison of plastic pollution in all river compartments. 239
Besides the size class, the differences in the presentation of data also hinder comparing data between 240
different environmental systems. The nature of the measurements that are done in each system differ. 241
For example, plastic pollution in the marine environment is often quantified in terms of concentration 242
(e.g. kg or items per sample), while plastic pollution in the riverine environment is mostly quantified 243
in terms of flux (e.g. kg/day, items/day) (Table 3). These differences are caused by the environmental 244
system itself since rivers are often seen as a “conveyor belt” for pollution to be transported to the 245
oceans. It is therefore important to consider these factors when trying to compare data between the two 246
environmental systems. 247
Standardization of protocols is needed to allow for better data comparison. Such a protocol should 248
include what units should be used for reporting data in each environmental compartment. This would 249
facilitate combining and analyzing data from different studies on the same environmental 250

Meta-analysis Indonesia
11
compartments. Such analysis would lead to better insights into the plastic pollution problem across 251
Indonesia. Standardization would also allow for a more convenient comparison of data between 252
different environmental compartments. For example, by ensuring that the mass of items found is 253
included in such a protocol, data can be expressed in both items and kg per sampling unit. 254
Table 3 - Overview of units used to express plastic pollution in marine and riverine systems and 255
each of the environmental compartments. The terrestrial environment was excluded from this 256
table due to the low number of studies performed in this system. 257
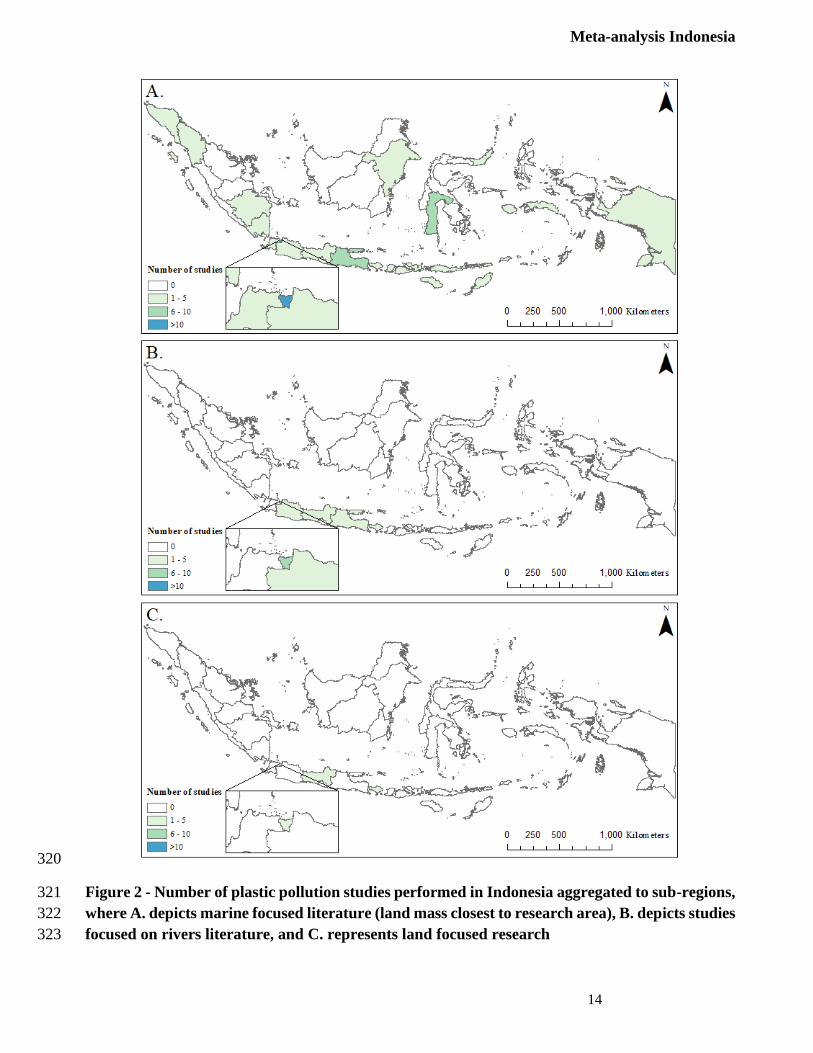
258
Ocean River
Compartment Micro Macro Micro Macro
Floating particles/m3 items/m2 particles/m3 kg/year
particles/m2 kg/100m2 particles/l tons/day
kg/survey
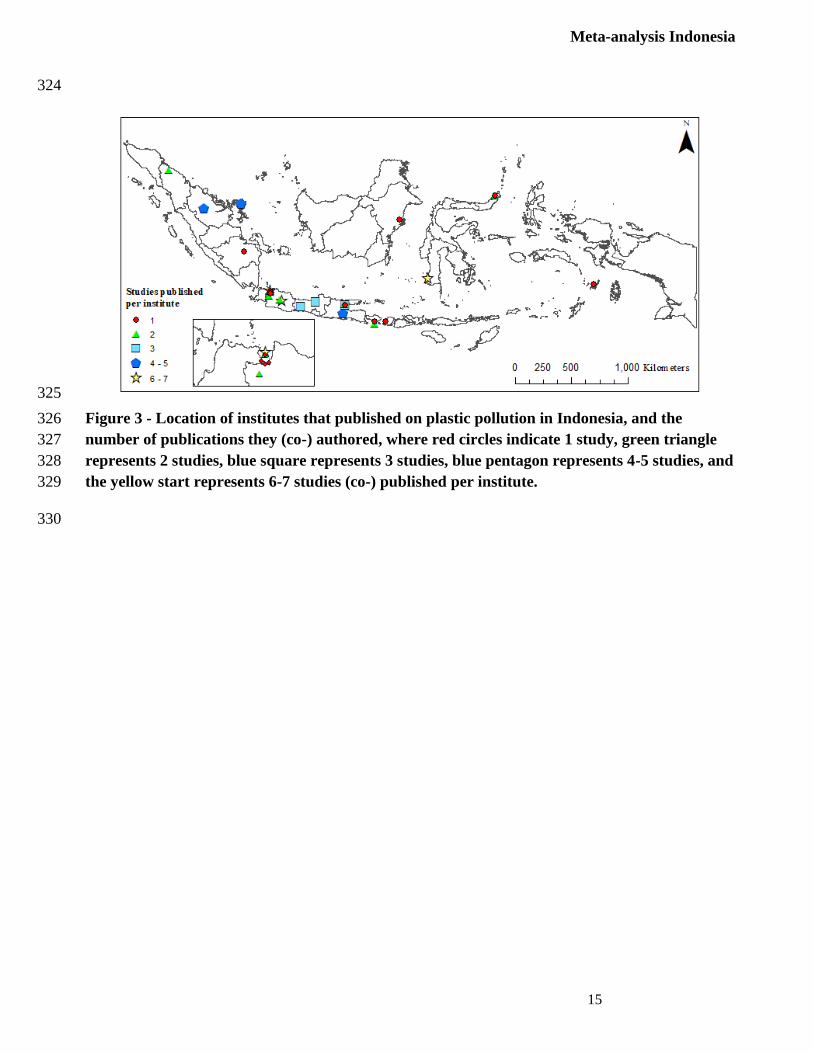
Riverbank/beach particles/m3 items/m2 - kg/m2
particles/kg m3/m2 kg/hour
kg/m2
Column particles/l Items/m3 particles/l -
particles/m3
Sediment particles/sample kg/sample particles/m3
particles/kg item/sample particles/100g sediment
particles/100 g dry weight Biota particles/organ - particles/fish -
particles/animal particles/m3
particles/g dry weight
Mangrove particles/m2 items/kg dry weight - -
kg/m2

Meta-analysis Indonesia
12
3.4 Frequently found materials and shapes 259
A small portion of studies quantifying plastic pollution in Indonesia report polymer types of the plastic 260
(9 out of 46 for macroplastic, 10 out of 43 for microplastic, Table 4). When polymers are reported, 261
polypropylene (PP) is the most often found polymer type in both macroplastic (56%) and microplastic 262
(90%) pollution. Polyethylene (PE), and its high- and low-density variants (HDPE, LDPE) are also 263
among the most abundant plastics for both macro- and microplastic. Other polymers found in 264
Indonesian aquatic environments include polystyrene (PS) and expanded polystyrene (EPS). 265
Polymer characterization makes plastic research more labor-intensive, but should be included more 266
frequently in plastic pollution studies. Polymer characterization is easier for macroplastic than for 267
microplastic since certain items have identification codes or logos indicating what polymer types they 268
are made of. Besides, macroplastic characterization can be simplified by grouping difficult to 269
distinguish polymers, or by using an item list that indicates what polymers items are most frequently 270
made of (e.g. van Emmerik et al., 2018; Vriend et al., 2020). Microplastic polymers are often 271
characterized using a form of spectroscopy (e.g. Fourier transform infrared, Raman) and thermal 272
analysis (e.g. py-GC-MS), which greatly increases the labor required to gather data (Shim et al., 2017). 273
The characterization of polymers is one of the few ways to compare macroplastic and microplastic 274
presence directly. Besides, polymer types may give an indication of possible sources of plastic 275
pollution. Polymer characterization should therefore be encouraged to be included in studies on plastic 276
pollution in Indonesia more often. 277
Table 4 - Count of polymers found in top three most abundant polymers per study, with 278
abbreviations for the following polymer types: polypropylene (PP), polystyrene (PS), low density 279
polyethylene (LDPE), expandable polystyrene (EPS), polyethylene terephthalate (PET), 280
polyethylene (PE), high density polyethylene (HDPE), and polyamide (also known as nylon, PA). 281
Studies that
reported
polymers
Percentage of studies that present polymer types in
top 3 frequently found polymers
PP PS LDPE EPS PET PE PA HDPE
Macro (n=46) 9 56% 33% 33% 22% 11% 22% 0% 11%
Micro (n=43) 10 90% 20% 30% 10% 0% 40% 20% 0%
282
More than half of the studies that studied microplastic pollution characterized the shape of the particles 283
(24 out of 43, Table 5). This is in line with the fraction of global microplastic studies that report shapes 284
found by Koelmans et al. (2019). Among the top three most abundant particles, shapes that are more 285
frequently are fragments (71%), fibers (63%), and films (46%). Shapes that are less frequently found 286
among the top three most abundant shapes are granules and foams (both 21%). The shape of particles 287
can be an indication of the possible sources of the microplastic, though the applicability of this is still 288
limited. Several potential sources of particular shapes of microplastic particles have been studied by 289
Free et al. (2014). However, no studies considered in this meta-analysis tried to identify sources based 290
on the shape of particles. Moreover, Kooi & Koelmans (2019) argue that the shape of particles is 291
Meta-analysis Indonesia
13
continuous, and therefore no classification will be able to accurately capture the full variability of 292
shapes. One of the particular reasons for this situation is complex degradation mechanisms 293
(photodegradation, mechanical-physical, weathering, even biodegradation) that continuously occur in 294
nature, which may breakdown larger plastics into microplastics (Kooi et al., 2019). 295
296
Table 5 - Count of microplastic shapes found in the top three most abundant shapes per study. 297
Percentage of studies that present each shape in the top
3 most abundant shapes
Reported shape Fragment Fiber Film Granule Foam
Micro (n=43) 24 71% 63% 46% 21% 21%
3.5 Locations of studies 298
Plastic research for all size classes and environmental systems is highly localized on Java Island, 299
especially for riverine and terrestrial focused studies (Fig. 2). Studies that quantify plastic pollution in 300
the marine environment are more evenly spread across Indonesia, though Java Island is still represented 301
in almost half of all studies (32 out of 67) focused on marine plastic pollution in seas near Java. Studies 302
quantifying plastic pollution in rivers are either performed on Java (14 out of 15) or Bali Islands (1 out 303
of 15). The same goes for terrestrial focused studies, with so far only 3 being done on Java and 1 on 304
Bali Islands. 305
Although a larger spread would be ideal, this strong focus on Java Island is reasonable since it houses 306
a large part of the Indonesian population. Lebreton et al. (2017) identified Java and Sumatra Islands to 307
be areas of concern with their estimates predicting these islands to be responsible for 14.2% of global 308
annual plastic exports to the oceans. More recently, Meijer et al. (2019) identify 51 rivers on Java 309
Island to be among the global top 1000 most polluting river. However, Java is not the only Indonesian 310
island with high rates of plastic pollution. Data from all Indonesian islands are required to design and 311
prioritize reduction and mitigation strategies, requiring a larger spatial spread of studies. 312
Another factor that could explain the research focus on Java is the location of Indonesian institutes that 313
research plastic pollution. Many of these institutes are located on Java island, especially in the Jakarta 314
metropolitan area (Fig. 3). Besides Java, institutes with relatively large plastic research output are 315
located on Sumatra, Bali, and Sulawesi Islands, and the city of Makassar (Fig. 3). When comparing the 316
locations of these institutes with the numbers of studies aggregated to the regional level (Fig. 2), it can 317
be concluded that regions with large amounts of studies coincide with the locations of specialized 318
institutes, indicating that research is mostly done close to these institutes. 319
Meta-analysis Indonesia
14
320
Figure 2 - Number of plastic pollution studies performed in Indonesia aggregated to sub-regions, 321
where A. depicts marine focused literature (land mass closest to research area), B. depicts studies 322
focused on rivers literature, and C. represents land focused research 323
Meta-analysis Indonesia
15
324
325
Figure 3 - Location of institutes that published on plastic pollution in Indonesia, and the 326
number of publications they (co-) authored, where red circles indicate 1 study, green triangle 327
represents 2 studies, blue square represents 3 studies, blue pentagon represents 4-5 studies, and 328
the yellow start represents 6-7 studies (co-) published per institute. 329
330

Meta-analysis Indonesia
16
4 Future plastic pollution research directions in Indonesia 331
Based on the biases and gaps identified in the meta-analysis, we propose four directions for future 332
research: 1) Standardization of research methods, 2) expansion of environmental system focus, 3) 333
expansion in spatial coverage, and 4) expansion in plastic characterization methods. These suggestions 334
aim to ensure reliable and intercomparable data on plastic pollution in Indonesia, which can aid the 335
design of plastic removal and mitigation strategies. 336
4.1 Harmonization of research methods and data 337
We recommend establishing standard research methods for each environmental system and sub-338
compartment in Indonesia. Standardizing methods ensures homogeneity in the data gathered and 339
shared by different studies. Current methods differ per study, geographical area, and research group, 340
which causes data to be expressed in different units of measurement and plastic items to be categorized 341
differently. This complicates the comparison of data between studies. Standardized methods can 342
alleviate this problem and would supply easier to interpret data for policy makers, which will hopefully 343
lead to tailored mitigation and removal strategies. 344
We suggest a national Indonesian scientific authority to set these standard methods in collaboration 345
with local and international experts. First efforts for standardization have been recently published by 346
the Indonesian Institute of Sciences (LIPI) (Nurhati & Cordova, 2019). Moreover, three institutions 347
(LIPI, DCA, and Universitas Padjadjaran) have built marine debris database to centralize data 348
(https://marinedebris.id). We recommend this process to be further expanded for method 349
standardization and data harmonization of plastic in all environmental systems and sub-compartments. 350
4.2 Expansion of environmental system focus 351
A shift in research prioritization on specific environmental systems is required to get an accurate 352
overview of plastic pollution in Indonesia. In the current form, plastic research mainly focuses on the 353
marine environment, which is in line with global research trends (Blettler et al., 2018). However, plastic 354
pollution abundance in the marine environment is diluted compared to riverine pollution. For example, 355
macroplastic pollution concentrations on riverbanks in Indonesia found in this meta-analysis ranged 356
between 0.007-0.029 kg/m2, or 7000 – 29000 kg/km2 (Widyarsana et al., 2020; Owens & Kamil. 2020), 357
while concentrations of floating macroplastics in the great pacific garbage patch are estimated to range 358
between 10 – 100 kg/km2 (Lebreton et al. 2018). Such dilution makes the determination of possible 359
sources, and the removal of plastic pollution more difficult. Therefore, knowledge on plastic pollution 360
transport earlier in its presence is important for the design of effective removal and mitigation 361
strategies. The research focus should, therefore, be moved higher up in the transport chain, ideally at 362
the source, as well. 363
The focus of future research should also diversify in terms of compartments within environmental 364
systems. The meta-analysis shows that specific compartments within environmental system are studied 365
more than others (e.g. beaches in the marine environment, floating and riverbank in the riverine 366
environment). This is mainly due to these compartments being more accessible and having easy to 367
apply methods. However, only quantifying plastic pollution in these compartments gives a biased view 368

Meta-analysis Indonesia
17
of the problem. Therefore, we recommend to keep observing pollution in these compartments while 369
also expanding to lesser studied compartments such as sub-surface plastics in the marine and riverine 370
environments, and surface pollution in the terrestrial environment. 371
4.3 Expansion in spatial coverage 372
Plastic research in all environmental systems should have a broader spatial coverage in Indonesia. 373
While plastic pollution has been quantified at least once in places with high population densities, 374
research is biased towards Java Island. This bias is more pronounced in riverine and terrestrial research 375
where all but one study has been performed on Java Island. While Java Island is predicted to have a 376
considerable contribution towards plastic exports to the ocean by models (e.g. Lebreton et al., 2017), 377
data on plastic pollution in all of Indonesia’s geographic areas are required in order to set priorities for 378
mitigation and removal strategies. We, therefore, recommend expanding the spatial coverage to all 379
major islands of Indonesia, while keeping research focus on areas with predicted high pollution rates 380
such as Java and Sumatra Islands. Additionally, Purba et al. (2021) mention that plastic pollution is a 381
transboundary issue in south-east Asian countries. We therefore also suggest that research should 382
expand to boundary seas. Indonesia has six surrounding countries and more collaboration is needed to 383
mitigate plastic pollution. Increasing insight into how plastic pollution transboundary patterns would 384
help stress the urgency and direction of this transnational collaboration. 385
4.4 Expansion in plastic characterization methods 386
We recommend both macro- and microplastic characterization to be expanded by performing research 387
on both size categories at the same location. 77 out of 83 studies in this meta-analysis characterize just 388
one plastic size category (macro- or microplastic). Integrating macro- and microplastic research at the 389
same location allows for comparisons to be made between the two size classes. This would, in turn, 390
allow for more accurate determination of possible sources of plastic pollution, and provide insights in 391
the relation between presence of macro- and microplastic. Such insights could allow for macroplastic 392
research to act as a proxy for microplastic pollution and reduce the need for microplastic research, 393
possibly saving valuable time and resources (Vriend et al. 2020). However studies on microplastics 394
occurence and distribution might still be of value since they can portray the past behaviour of the 395
community in plastic use and disposal. 396
Characterization methods can be further expanded by including polymer analysis more frequently. 19 397
out of 83 studies considered in this meta-analysis characterized plastic polymers found. Increasing the 398
number of studies that identify polymers allows for data to be more easily compared between different 399
environmental systems, compartments, and size classes. This data can in turn be used for the design of 400
more targeted mitigation and removal strategies. We, therefore, recommend increasing the frequency 401
of polymer analysis in future research. 402
403
Meta-analysis Indonesia
18
5 Conclusions 404
Indonesia is suspected to be among the top plastic polluting countries in the world. A large body of 405
research has been published that quantifies plastic pollution with the aim to facilitate the design of 406
effective mitigation and removal strategies. In this study we perform a meta-analysis of this body of 407
literature to identify research biases and gaps, with the goal to streamline future research. 408
The majority of the research output on plastic pollution in Indonesia has focused on the marine 409
environment (70 out of 83 studies), with first efforts to quantify plastic pollution in other environmental 410
systems (riverine and terrestrial environments) recently being undertaken on Java Island. Research 411
within environmental systems is biased towards compartments that are easy to access and have already 412
established research methods. These compartments include the beach for marine plastic pollution, and 413
floating and riverbank plastics for riverine plastic pollution. Considering research output since 2010, 414
macroplastic pollution has been studied more frequently than microplastics (43 and 40 studies 415
respectively), and research within environmental systems is biased towards a size class as well. For 416
example, microplastic is mostly characterized in the marine environment, while macroplastic is mostly 417
studied in the riverine environment. Methods, and with it the measurement units in which data is 418
expressed, vary widely between studies, which complicates comparison between studies. Last, the 419
plastic research focus is highly area focused, with almost half of all studies being focused on Java 420
Island. 421
We recommend four good practices for future research which can provide data that can aid the 422
Indonesian government with designing monitoring strategies to reduce plastic pollution more 423
effectively. These being 1) the harmonization of research methods, and therefore units used, for each 424
environmental systems and sub-compartments across Indonesia, 2) a shift in research focus expanding 425
beyond the marine environment towards riverine and terrestrial plastic pollution research, 3) an 426
expansion in spatial coverage to ensure more representative research taking place in the whole of 427
Indonesia, and 4) an expansion in methods used to characterize plastic pollution, especially in terms of 428
polymer type. 429
6 Author Contributions 430
PV, TvE, and H conceived the idea. PV performed the literature search, extracted data from the 431
identified literature, performed the data analysis, and prepared the initial draft. All authors identified 432
missing literature and wrote the final manuscript. 433
7 Acknowledgements 434
The work of TvE is supported by the Veni research program The River Plastic Monitoring Project with 435
project number 18211, which is (partly) financed by the Dutch Research Council (NWO). This work 436
has been done as part of the Post-Plastic Paradise Project, funded by the ANGIN program of the Royal 437
Netherlands Academy of Arts and Sciences. 438

Meta-analysis Indonesia
19
8 List of references 439
Akhlas, A. W. (2020) Indonesia welcomes 16.1m foreign tourists in 2019, coronavirus clouds 440
tourism outlook. The Jakarta Post. Accessed on 27-10-2020 via: 441
https://www.thejakartapost.com/news/2020/02/03/indonesia-welcomes-16-1m-foreign-tourists-in-442
2019-coronavirus-clouds-tourism-outlook.html 443
Blettler, M. C., Abrial, E., Khan, F. R., Sivri, N., & Espinola, L. A. (2018). Freshwater plastic pollution: 444
Recognizing research biases and identifying knowledge gaps. Water research, 143, 416-424. 445
Borrelle, S. B., Ringma, J., Law, K. L., Monnahan, C. C., Lebreton, L., McGivern, A., ... & Eriksen, 446
M. (2020). Predicted growth in plastic waste exceeds efforts to mitigate plastic 447
pollution. Science, 369(6510), 1515-1518. 448
Castro-Jiménez, J., González-Fernández, D., Fornier, M., Schmidt, N., & Sempéré, R. (2019). Macro-449
litter in surface waters from the Rhone River: Plastic pollution and loading to the NW Mediterranean 450
Sea. Marine pollution bulletin, 146, 60-66. 451
Conchubhair, D. Ó., Fitzhenry, D., Lusher, A., King, A. L., van Emmerik, T., Lebreton, L., ... & 452
O’Rourke, E. (2019). Joint effort among research infrastructures to quantify the impact of plastic debris 453
in the ocean. Environmental Research Letters, 14(6), 065001. 454
Cordova, M. R., & Wahyudi, A. (2016). Microplastic in the deep-sea sediment of southwestern 455
Sumatran Waters. Marine Research in Indonesia, 41(1), 27-35. 456
Cordova, M. R., & Nurhati, I. S. (2019). Major sources and monthly variations in the release of land-457
derived marine debris from the Greater Jakarta area, Indonesia. Scientific Reports, 9(1), 1-8. 458
Cordova, M. R., Riani, E., & Shiomoto, A. (2020). Microplastics ingestion by blue panchax fish 459
(Aplocheilus sp.) from Ciliwung Estuary, Jakarta, Indonesia. Marine Pollution Bulletin, 161, 111763. 460
https://doi.org/https://doi.org/10.1016/j.marpolbul.2020.111763 461
Cordova, M. R., Nurhati, I. S., Riani, E., Nurhasanah, & Iswari, M. Y. (2021). Unprecedented plastic-462
made personal protective equipment (PPE) debris in river outlets into Jakarta Bay during COVID-19 463
pandemic. Chemosphere, 268, 129360. 464
https://doi.org/https://doi.org/10.1016/j.chemosphere.2020.129360 465
Free, C.M., Jensen, O.P., Mason, S.A., Eriksen, M., Williamson, N.J., Boldgiv, B. (2014). High levels 466
of microplastic pollution in a large, remote, mountain lake. Marine Pollution Bulletin, 85, 156-163. 467
Gall, S. C., & Thompson, R. C. (2015). The impact of debris on marine life. Marine pollution 468
bulletin, 92(1-2), 170-179. 469
DIVA-GIS (n.a.). Indonesia – Administrative areas. Accessed on 16-10-2020 via: http://www.diva-470
gis.org/gData 471
Meta-analysis Indonesia
20
González-Fernández, D., & Hanke, G. (2017). Toward a harmonized approach for monitoring of 472
riverine floating macro litter inputs to the marine environment. Frontiers in Marine Science, 4, 86. 473
Hantoro, I., Löhr, A. J., Van Belleghem, F. G., Widianarko, B., & Ragas, A. M. (2019). Microplastics 474
in coastal areas and seafood: implications for food safety. Food Additives & Contaminants: Part 475
A, 36(5), 674-711. 476
Hantoro, I., Widianarko, Y. B., & Retnaningsih, C. (2020). Protokol HW1-TP UNIKA: Metode 477
Deteksi dan Identifikasi Mikroplastik dengan ATR-FTIR Mikroskopi pada Sampel Hasil Laut. Wahana 478
Resolusi, Yogyakarta. Unika Repository. 479
Hastuti, A. R., Lumbanbatu, D. T., & Wardiatno, Y. (2019). The presence of microplastics in the 480
digestive tract of commercial fishes off Pantai Indah Kapuk coast, Jakarta, Indonesia. Biodiversitas 481
Journal of Biological Diversity, 20(5). 482
Honingh, D., van Emmerik, T., Uijttewaal, W., Kardhana, H., Hoes, O., & van de Giesen, N. (2020). 483
Urban river water level increase through plastic waste accumulation. FrEaS, 8, 28. 484
Jang, Y. C., Hong, S., Lee, J., Lee, M. J., & Shim, W. J. (2014). Estimation of lost tourism revenue in 485
Geoje Island from the 2011 marine debris pollution event in South Korea. Marine Pollution 486
Bulletin, 81(1), 49-54. 487
Khoironi, A., & Anggoro, S. (2018, March). The existence of microplastic in Asian green mussels. 488
In IOP Conference Series: Earth and Environmental Science (Vol. 131, No. 1, p. 012050). IOP 489
Publishing. 490
Koelmans, A. A., Nor, N. H. M., Hermsen, E., Kooi, M., Mintenig, S. M., & De France, J. (2019). 491
Microplastics in freshwaters and drinking water: critical review and assessment of data quality. Water 492
research, 155, 410-422. 493
Koelmans, A. A., Besseling, E., Foekema, E., Kooi, M., Mintenig, S., Ossendorp, B. C., ... & Scheffer, 494
M. (2017). Risks of plastic debris: unravelling fact, opinion, perception, and belief. 495
Kooi, M., & Koelmans, A. A. (2019). Simplifying microplastic via continuous probability distributions 496
for size, shape, and density. Environmental Science & Technology Letters, 6(9), 551-557. 497
Lau, W. W., Shiran, Y., Bailey, R. M., Cook, E., Stuchtey, M. R., Koskella, J., ... & Thompson, R. C. 498
(2020). Evaluating scenarios toward zero plastic pollution. Science, 369(6510), 1455-1461. 499
Lasut, M. T., Weber, M., Pangalila, F., Rumampuk, N. D., Rimper, J. R., Warouw, V., ... & Lott, C. 500
(2018). From coral triangle to trash triangle—how the hot spot of global marine biodiversity is 501
threatened by plastic waste. In Proceedings of the International Conference on Microplastic Pollution 502
in the Mediterranean Sea (pp. 107-113). Springer, Cham. 503
Lebreton, L. C., Van Der Zwet, J., Damsteeg, J. W., Slat, B., Andrady, A., & Reisser, J. (2017). River 504
plastic emissions to the world’s oceans. Nature communications, 8, 15611. 505
Meta-analysis Indonesia
21
Lebreton, L., Slat, B., Ferrari, F., Sainte-Rose, B., Aitken, J., Marthouse, R., ... & Noble, K. (2018). 506
Evidence that the Great Pacific Garbage Patch is rapidly accumulating plastic. Scientific reports, 8(1), 507
1-15. 508
Lebreton, L., & Andrady, A. (2019). Future scenarios of global plastic waste generation and 509
disposal. Palgrave Communications, 5(1), 1-11. 510
Lestari, P., and Trihadiningrum, Y. (2019). The impact of improper solid waste management to plastic 511
pollution in Indonesian coast and marine environment. Marine Pollution Bulletin, 149, 110505. 512
LI, W. C., Tse, H. F., & Fok, L. (2016). Plastic waste in the marine environment: A review of sources, 513
occurrence and effects. Science of the Total Environment, 566, 333-349. 514
Meijer, L. J. J., van Emmerik, T., Lebreton, L., Schmidt, C., & van der Ent, R. (2019). Over 1000 rivers 515
accountable for 80% of global riverine plastic emissions into the ocean. 516
Michida, Y., Chavanich, S., Chiba, S., Cordova, M. R., Cozsar Cabanas, A., Glagani, F., et al. (2019). 517
Guidelines for Harmonizing Ocean Surface Microplastic Monitoring Methods. Version 1.1. Chiyoda-518
ku, Tokyo, Japan: Ministry of the Environment Japan. https://doi.org/http://dx.doi.org/10.25607/OBP-519
867 URI 520
Nurhati, I. S., & Cordova, M. R. (2020). Marine plastic debris in Indonesia: baseline estimates (2010-521
2019) and monitoring strategy (2021-2025). Marine Research in Indonesia, 45(2). 522
OSPAR Commission (2010). Guideline for monitoring Marine Litter on the Beachers in the OSPAR 523
Maritime Area. London: OSPAR commission 524
Owens, K. A., & Kamil, P. I. (2020). Adapting coastal collection methods for river assessment to 525
increase data on global plastic pollution: Examples from India and Indonesia. Frontiers in 526
Environmental Science, 7, 208. 527
Pawar, P.R., Shirgaonkar, S.S., Patil, R.B. (2016). Plastic marine debris: sources, distribution, and 528
impacts on coastal and ocean biodiversity. PENCIL Publication on Biological Sciences 3(1), 40–54. 529
530
Petten, L., Schalekamp, J., Viool, V., Gupta, A. (2020). The price tag of plastic pollution – An 531
economic assessment of river plastic. Deloitte. Accessed on 04-11-2020 via: 532
https://www2.deloitte.com/nl/nl/pages/strategy-analytics-and-ma/articles/the-price-tag-of-plastic-533
pollution.html 534
Purba, N. P., Faizal, I., Cordova, M. R., Abimanyu, A., Afandi, N. K., Indriawan, D., & Khan, A. M. 535
(2021). Marine Debris Pathway Across Indonesian Boundary Seas. Journal of Ecological 536
Engineering, 22(3), 82-98. 537

Meta-analysis Indonesia
22
Rochman, C. M., Tahir, A., Williams, S. L., Baxa, D. V., Lam, R., Miller, J. T., ... & Teh, S. J. (2015). 538
Anthropogenic debris in seafood: Plastic debris and fibers from textiles in fish and bivalves sold for 539
human consumption. Scientific reports, 5, 14340. 540
Schmidt, C., Krauth, T., & Wagner, S. (2017). Export of plastic debris by rivers into the 541
sea. Environmental science & technology, 51(21), 12246-12253. 542
Shim, W. J., Hong, S. H., & Eo, S. E. (2017). Identification methods in microplastic analysis: a 543
review. Analytical Methods, 9(9), 1384-1391. 544
Spalding, M., Spalding, M. D., Ravilious, C., & Green, E. P. (2001). World atlas of coral reefs. Univ 545
of California Press. 546
Statistics Indonesia. (2020). International visitor arrival statistic 2019. Catalog: 8401011. Publication 547
Number: 06330.2003. ISSN: 2085-9309. xii+61 PP. Jakarta, Indonesia 548
Syakti, A. D., Bouhroum, R., Hidayati, N. V., Koenawan, C. J., Boulkamh, A., Sulistyo, I., ... & Wong-549
Wah-Chung, P. (2017). Beach macro-litter monitoring and floating microplastic in a coastal area of 550
Indonesia. Marine Pollution Bulletin, 122(1-2), 217-225. 551
Tomascik, T. (1997). The ecology of the Indonesian seas. Oxford University Press. 552
Uneputty, P., & Evans, S. M. (1997). The impact of plastic debris on the biota of tidal flats in Ambon 553
Bay (eastern Indonesia). Marine Environmental Research, 44(3), 233-242. 554
van Calcar, C. J., & Van Emmerik, T. H. M. (2019). Abundance of plastic debris across European and 555
Asian rivers. Environmental Research Letters, 14(12), 124051. 556
van Emmerik, T., & Schwarz, A. (2020). Plastic debris in rivers. Wiley Interdisciplinary Reviews: 557
Water, 7(1), e1398. 558
van Emmerik, T., Kieu-Le, T. C., Loozen, M., van Oeveren, K., Strady, E., Bui, X. T., ... & Schwarz, 559
A. (2018). A methodology to characterize riverine macroplastic emission into the ocean. Frontiers in 560
Marine Science, 5, 372. 561
van Emmerik, T., Loozen, M., Van Oeveren, K., Buschman, F., & Prinsen, G. (2019). Riverine plastic 562
emission from Jakarta into the ocean. Environmental Research Letters, 14(8), 084033. 563
Vriend, P., Roebroek, C. T. J., van Emmerik, T. (2020). Same but different: A framework to Design 564
and Compare Riverbank Plastic Monitoring Strategies. Frontiers in water, 2, 31. 565
Widyarsana, I. M. W., Damanhuri, E., Ulhusna, N., & Agustina, E. (2020). A Preliminary Study: 566
Identification of Stream Waste Quantity and Composition in Bali Province, Indonesia. In E3S Web of 567
Conferences (Vol. 148, p. 05005). EDP Sciences. 568

Meta-analysis Indonesia
23
Willoughby, N. G. (1986). Man-made litter on the shores of the Thousand Island Archipelago, 569
Java. Marine Pollution Bulletin, 17(5), 224-228. 570