this is the peer reviewed version of the following article...
TRANSCRIPT

This is the peer reviewed version of the following article: Blyth, D., Tabrett, S., Bourne, N. and
Glencross, B. (2015), Comparison of faecal collection methods and diet acclimation times for the
measurement of digestibility coefficients in barramundi (Lates calcarifer). Aquaculture Nutrition, 21:
248–255. doi: 10.1111/anu.12159, which has been published in final form at
http://dx.doi.org/10.1111/anu.12159. This article may be used for non-commercial purposes in
accordance With Wiley Terms and Conditions for self-archiving.

1
Comparison of faecal collection methods, and diet acclimation times for the measurement of 1
digestibility coefficients in barramundi (Lates calcarifer) 2
3
David Blyth1,3, Simon Tabrett1,2, Nicholas Bourne1,2, Brett Glencross1,2* 4
5
1CSIRO Food Futures Flagship, GPO Box 2583 Brisbane, QLD 4001, Australia 6
2CSIRO Marine and Atmospheric Research, GPO Box 2583 Brisbane, QLD 4001, Australia 7
3CSIRO Marine and Atmospheric Research, Bribie Island Research Centre, Woorim, 8
Australia 9
10
Running Title: Digest methodology for barramundi 11
12
*Correspondence to: (p) 61-7-3833-5926 13
(e) [email protected] 14
15
16
Key words: Asian seabass, Stripping collection, Settlement collection, Diet 17
acclimatisation, Digest methodology 18
19
20
Submit to: Aquaculture Nutrition 21
22
23
24

2
Abstract 25
26
This study aimed to investigate the effects of two faecal collection methods (stripping and 27
settlement) on the apparent digestibility coefficients (ADC) of dry matter, protein and energy 28
of three different diets fed to barramundi. In a second experiment, the effect of acclimation 29
time (i.e. number of days fed the diet) on the calculation of ADCs was also investigated. Each 30
tank of fish was fed one of three diets for 12 days. Faeces were collected by both stripping 31
and settlement, though only settlement was used prior to day seven of the acclimation period. 32
Faeces were collected using the settlement method at regular intervals from day one to day 33
12. Comparisons between faecal collection methods were only made based on faecal material 34
collected over a similar acclimation period. The collection of faeces by stripping produced 35
more conservative ADCs, which were also more consistent than those obtained using the 36
settlement technique. The calculated ADCs typically fluctuated for the first three days of 37
collection before the variability diminished. Barramundi should be acclimated to diets for a 38
minimum of four days before collection of faecal material, and collection by stripping is 39
recommended to obtain the most reliable digestibility data. 40
41

3
Introduction 42
The basis for sound diet formulation depends on having accurate and reliable data on 43
the digestible nutrient and energy value of raw materials that are used to make those diets 44
(reviewed by Glencross et al., 2007). The determination of the digestible nutrient and energy 45
value of raw materials depends on having a viable method to measure the digestibility of 46
these parameters from the diets (Choubert et al., 1982; Suigura et al., 1998; Weatherup & 47
McCracken, 1998). However, the assessment of the digestibility of aquaculture diets can be 48
highly variable and the digestibility values are known to vary significantly depending on the 49
different methods used (reviewed by Glencross et al., 2007). It is well recognised that faecal 50
collection is an integral part of the process for calculating digestibility values, and the 51
collection process can have a significant effect on the determination of the digestibility values 52
of diets (Windell et al., 1978; Weatherup & McCracken, 1998; Vandenberg & de la Noue, 53
2001; Glencross et al., 2005). 54
Faecal collection methods can be grouped under two main methods; collection of un-55
defecated digesta, and collection of faeces settled from the water column. The three most 56
common techniques to collect un-defecated digesta are intestinal dissection, suction, and 57
stripping (Austreng et al., 1978; Vandenberg & de la Noue, 2001; Glencross et al., 2005; 58
Aslaksen et al., 2007). Collection of faeces from the water column involves either syphoning 59
faeces from the bottom of the tank, collection of decanted faeces, or continuous collection 60
(Choubert et al., 1982; Cho & Kaushik, 1990; Vandenberg & de la Noue, 2001; Glencross et 61
al., 2005). 62
Collection of un-defecated digesta is generally more labour intensive than collecting 63
faeces from the water column and is also restricted by fish size (i.e. fish can be too small or 64
large to handle). Moreover, samples are collected at one point in time providing a snapshot of 65
the ADC and the amount of sample collected can be limiting. In contrast, the collection of 66
faeces from the water column is typically less labour intensive, and can be applied to fish of 67
any size, and does not inflict stress on the animals (reviewed by Glencross et al., 2007). 68
However, owing to passive nature of this collection method, there is a risk of the sample 69
being contaminated by scales, mucous and other exogenous material as well as leaching of 70
nutrients into the water column (reviewed by Glencross et al., 2007). While each method has 71
advantages and disadvantages, it has been suggested that the collection of un-defecated 72
digesta results in a reduced Apparent Digestibility Coefficient (ADC) values (Vandenberg & 73
de la Noue, 2001; Glencross et al., 2005). Although there have been comparisons of methods 74
for other species, there have been no direct comparisons for barramundi when faeces have 75

4
been collected by stripping or settlement methods (Vandenberg & de la Noue, 2001; 76
Glencross et al., 2005; Glencross, 2006). 77
Most studies allow fish to adapt to new diets before commencement of faecal 78
sampling; with times varying between five days and 14 days for a range of temperate and 79
tropical species (Glencross et al., 2005; Barrows et al., 2007; Glencross et al., 2012). This is 80
done supposedly to allow the fish to adapt to the chemical composition of a new diet and 81
establish an equilibrium within the animals gut in terms of the absorption efficiencies from 82
that new diet before any sampling is initiated. However, although it is widely accepted that 83
fish require a period of time to acclimate to new diets, there have been limited studies 84
published that actually investigate the time that it actually take to adapt to introduction of a 85
new a diet or indeed variable levels of feed intake (reviewed by Glencross et al., 2007). 86
Given the importance of accurately determining the digestibility of diets and raw ingredients, 87
this is an area which requires further attention. 88
Therefore, the present study was conducted to examine two key methodological issues 89
for digestibility assessment with barramundi (Lates calcarifer). In the first experiment, 90
differences in the digestibilities of dry matter, protein and energy of three diets (basal, starch 91
and lupin-meal based) were evaluated after faeces were collected by stripping or settlement 92
methods. In the second experiment, the variability of ADCs were evaluated over the first 14 93
days when barramundi were introduced to a new diet, using faeces collected by settlement 94
collection methods. 95
96
97
98
5
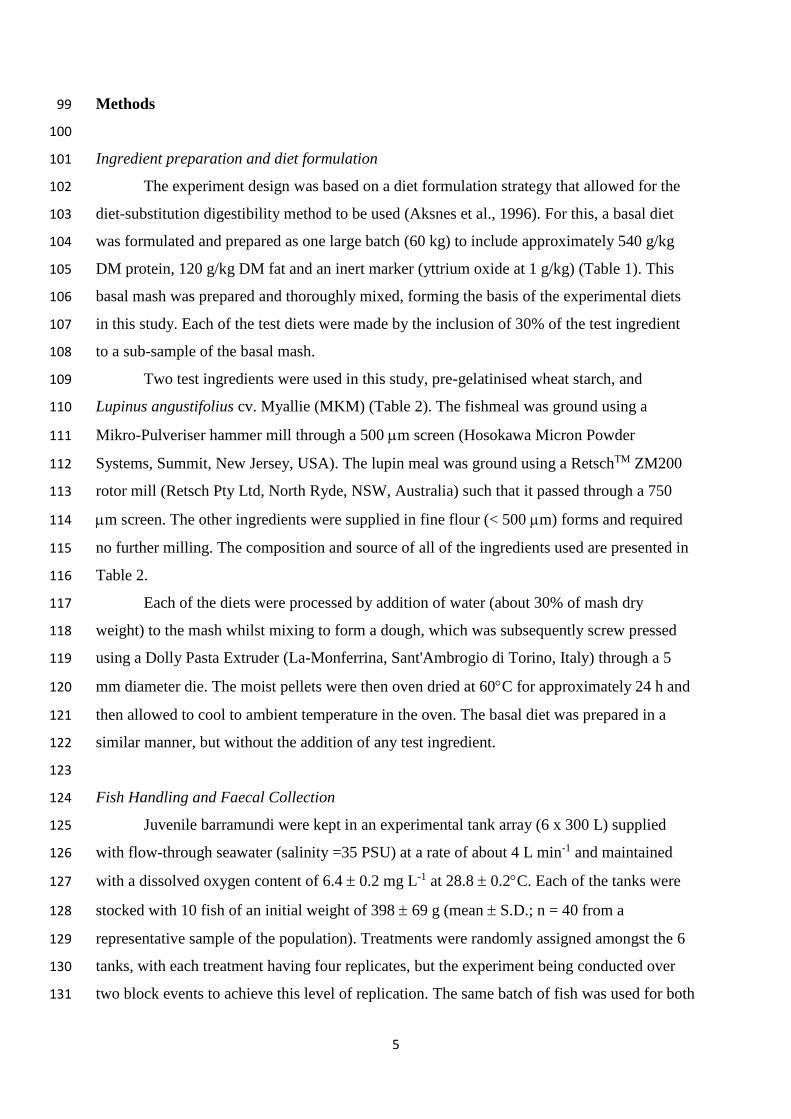
Methods 99
100
Ingredient preparation and diet formulation 101
The experiment design was based on a diet formulation strategy that allowed for the 102
diet-substitution digestibility method to be used (Aksnes et al., 1996). For this, a basal diet 103
was formulated and prepared as one large batch (60 kg) to include approximately 540 g/kg 104
DM protein, 120 g/kg DM fat and an inert marker (yttrium oxide at 1 g/kg) (Table 1). This 105
basal mash was prepared and thoroughly mixed, forming the basis of the experimental diets 106
in this study. Each of the test diets were made by the inclusion of 30% of the test ingredient 107
to a sub-sample of the basal mash. 108
Two test ingredients were used in this study, pre-gelatinised wheat starch, and 109
Lupinus angustifolius cv. Myallie (MKM) (Table 2). The fishmeal was ground using a 110
Mikro-Pulveriser hammer mill through a 500 m screen (Hosokawa Micron Powder 111
Systems, Summit, New Jersey, USA). The lupin meal was ground using a RetschTM ZM200 112
rotor mill (Retsch Pty Ltd, North Ryde, NSW, Australia) such that it passed through a 750 113
m screen. The other ingredients were supplied in fine flour (< 500 m) forms and required 114
no further milling. The composition and source of all of the ingredients used are presented in 115
Table 2. 116
Each of the diets were processed by addition of water (about 30% of mash dry 117
weight) to the mash whilst mixing to form a dough, which was subsequently screw pressed 118
using a Dolly Pasta Extruder (La-Monferrina, Sant'Ambrogio di Torino, Italy) through a 5 119
mm diameter die. The moist pellets were then oven dried at 60C for approximately 24 h and 120
then allowed to cool to ambient temperature in the oven. The basal diet was prepared in a 121
similar manner, but without the addition of any test ingredient. 122
123
Fish Handling and Faecal Collection 124
Juvenile barramundi were kept in an experimental tank array (6 x 300 L) supplied 125
with flow-through seawater (salinity =35 PSU) at a rate of about 4 L min-1 and maintained 126
with a dissolved oxygen content of 6.4 0.2 mg L-1 at 28.8 0.2C. Each of the tanks were 127
stocked with 10 fish of an initial weight of 398 69 g (mean S.D.; n = 40 from a 128
representative sample of the population). Treatments were randomly assigned amongst the 6 129
tanks, with each treatment having four replicates, but the experiment being conducted over 130
two block events to achieve this level of replication. The same batch of fish was used for both 131

6
blocks, but a complete randomised design applied to each block to ensure experimental 132
validity. The fish were allowed to acclimate to their allocated dietary treatment for at least 133
seven days before stripping faecal collection commenced. 134
All fish were manually fed the basal diet for 1 week prior to the commencement of the 135
trial. On commencement, the fish were fed their respective diets to apparent satiety as 136
determined by the loss of feeding activity after being offered food on three independent 137
feeding episodes over a ninety-minute period once daily (1530 to 1700), seven days a week. 138
Faeces were then collected the following morning (0830 – 1030) from each fish within each 139
tank using stripping techniques based on those reported by Glencross (2011). Fish were 140
anesthetised using AQUI-S™ (0.02 mL L-1). Once loss of equilibrium by the fish was 141
observed, close attention was then paid to the relaxation of the ventral abdominal muscles of 142
the fish to enable the fish to be removed from the water prior to the faecal pellet being 143
expelled. The faeces were then removed from the distal intestine using gentle abdominal 144
pressure during this muscle relaxation. Hands were rinsed between handling each fish to 145
ensure that the faeces were not contaminated by urine or mucous. Fish were also not stripped 146
on consecutive days in order to minimise stress on the animal (as determined by loss of 147
appetite and physical damage, of which none was observed) and maximise feed intake prior 148
to faecal collection. Faecal samples from different days were pooled within tank, and kept 149
frozen at –20C before being freeze-dried in preparation for analysis. Faeces were collected 150
from three separate stripping events within one week. 151
Settled faeces were collected overnight from the same tanks and fish using settlement 152
methods based on those reported by Cho & Kaushik (1990) on days 1, 2, 3, 4, 6, 8, 10, and 153
12. The collection chamber was flushed 1 hour after feeding to remove any feed partials 154
before a chiller jacket (tube with a frozen block of water inside and a hole to allow for the 155
faecal collection tube to be inserted) was placed over the collection tube. Faeces were 156
removed from the ice-chilled collection tube at 0830 on each day, prior to the fish being 157
stripped, and transferred into a large vial before being stored at -18˚C. 158
For comparison of faecal collection methods, the stripped faecal data was compared against 159
the data from the last four days of settlement collection so as to ensure that the samples were 160
from a similar period of acclimation to the diets. 161
162
Chemical and digestibility analysis 163

7
1001
dietfaeces
faecesdiet
dietParameterY
ParameterYAD
Faecal, ingredient and diet samples were analysed for dry matter, yttrium, nitrogen 164
and gross energy content. All methods were done in accordance with AOAC methodology 165
(2005). In addition, diet and ingredient samples were analysed for ash and total lipids and 166
carbohydrate content calculated. Dry matter content was calculated following oven drying at 167
105ºC for 24 h. Total yttrium concentrations were determined using inductively coupled 168
plasma mass spectrophotometry (ICP-MS) after mixed acid digestion based on the method 169
described by (McQuaker et al., 1979). Protein was determined based on measurement of total 170
nitrogen by CHNOS auto-analyser, and then multiplied by 6.25. Total lipid content of the 171
diets was determined gravimetrically following extraction of the lipids using 172
chloroform:methanol (2:1). Gross ash content was determined gravimetrically following loss 173
of mass after combustion of a sample in a muffle furnace at 550C for 12 h. Gross energy 174
was determined by adiabatic bomb calorimetry. Total carbohydrates were calculated based on 175
the dry matter content of a sample minus the protein, lipid and ash. Amino acid composition 176
of samples was determined by an acid hydrolysis prior to separation via HPLC. The acid 177
hydrolysis destroyed tryptophan making it unable to be determined using this method. 178
The apparent digestibility (ADdiet) for each of the nutritional parameters examined in 179
each diet was calculated based on the following formula (Maynard & Loosli, 1979): 180
181
182
183
where Ydiet and Yfaeces represent the yttrium content of the diet and faeces respectively, and 184
Parameterdiet and Parameterfaeces represent the nutritional parameter of concern (dry matter, 185
protein or energy) content of the diet and faeces respectively. Ingredient digestibility values 186
were not determined for the present study. 187
188
Statistical analysis 189
All figures are mean ± SE unless otherwise specified. Effects of diet and collection 190
method were examined by two-way ANOVA. Levels of significance were determined using a 191
Tukey’s HSD test, with critical limits being set at P < 0.05. Effects of sampling time on the 192
digestibility parameters were also analysed by two-way ANOVA. All statistical analyses 193
were done using the software package Statistica™ (Statsoft, Tulsa, OA, USA) although 194
graphically presented using Microsoft Excel (Microsoft Corporation, USA). 195
196

8
Results 197
198
Faecal collection methods 199
Faecal collection method (settlement or stripping) affected the digestibility of dry 200
matter, protein and energy (P<0.05; Table 3). When faeces were collected by settlement 201
compared with stripping the dry matter digestibilities were higher, but both protein and 202
energy digestibilities were lower. 203
For faeces collected by stripping, the DM digestibility varied between diets (P<0.05) 204
with the digestible DM of the MKM diet being significantly lower than that of the Starch 205
based diet (P<0.05; Table 4). Protein digestibility was not different between diets when 206
faeces were collected by stripping (P>0.05; Table 4) although energy digestibility differed 207
significantly among each of the diets. The energy digestibility was lowest for the MKM diet 208
compared with the basal and starch diets, and the basal diet energy digestibility was 209
significantly higher than the digestible energy of the starch diet (P<0.05; Table 4). 210
Collection of faeces by settlement displayed similar results, with the digestible DM of 211
the MKM diet being significantly lower than both the basal and starch based diets (P<0.05; 212
Table 4). No differences were observed between protein digestibility (P>0.05; Table 4), 213
whilst energy digestibility was significantly lower for the MKM diet compared with the basal 214
and starch diets, and the digestibility of the basal diet was significantly higher than that of the 215
starch based diet (P<0.05; Table 4). 216
There was good correlation between both the stripping and settlement faecal 217
collection methods and this can be seen by the high R2 values in Figure 2. Correlation was 218
strongest with energy digestibility (R2=0.979), followed by dry matter digestibility 219
(R2=0.823) and protein digestibility (R2=0.655). 220
221
Temporal variation in digestibility values 222
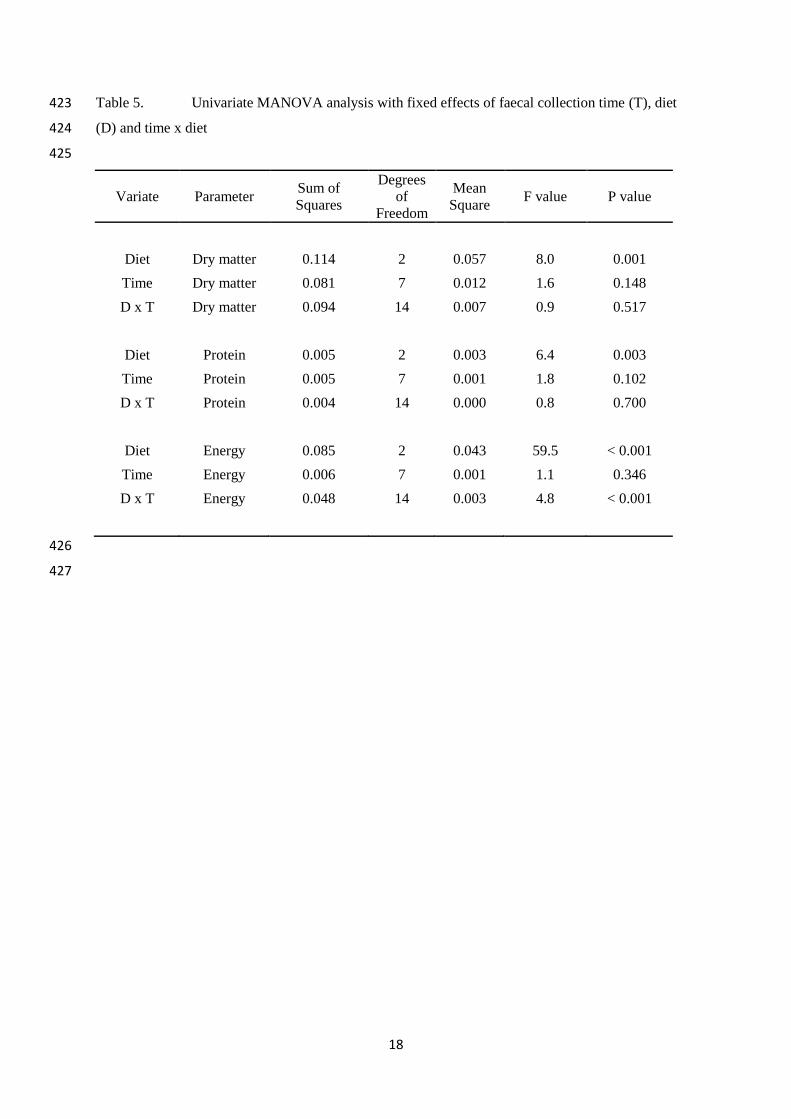
Statistically there was no temporal variation (P=0.148) or interaction effect (P=0.517) 223
with time and diet in the DM digestibility, but it did vary between diets (P=0.001; Table 5). 224
Protein digestibility was also different between diets (P=0.003), but not over time (P=0.102) 225
and again there was no interaction effect (P=0.700; Table 5). Energy digestibility differed 226
significantly with diet (P<0.001), but not with time (P=0.346).In contrast to the other two 227
digestibility parameters the energy digestibility did exhibit an interaction effect between diet 228
and time (P<0.001; Table 5). 229
9
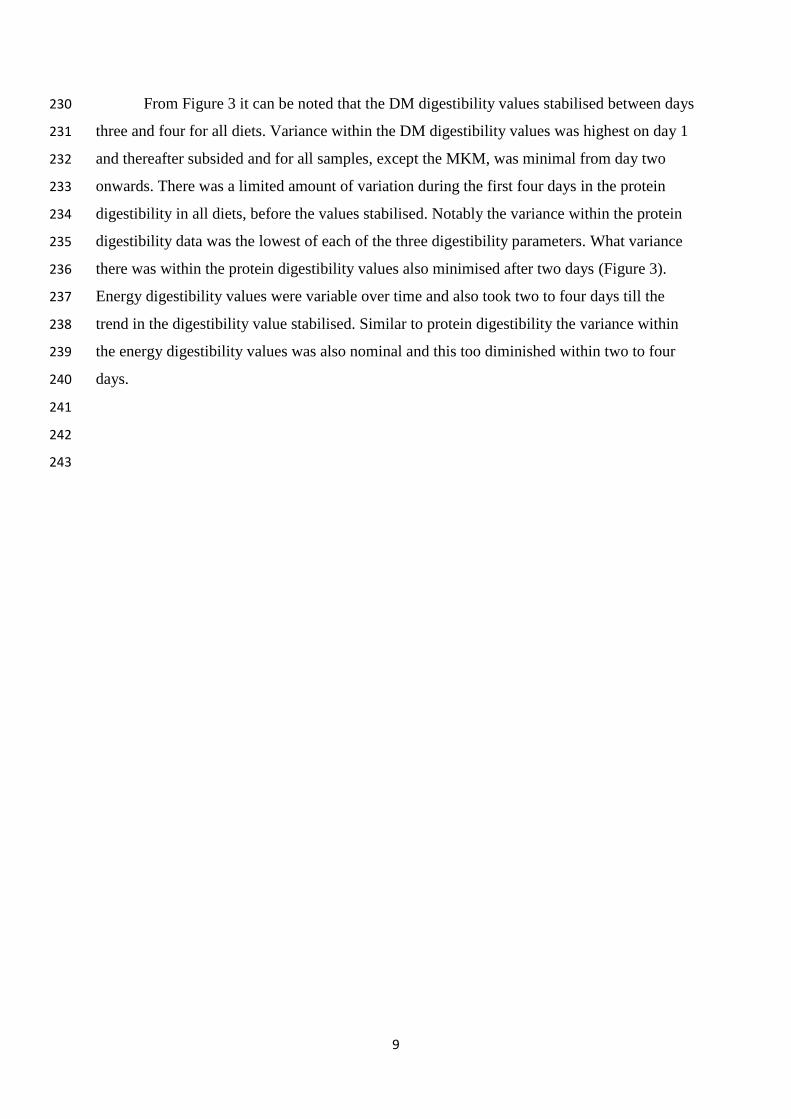
From Figure 3 it can be noted that the DM digestibility values stabilised between days 230
three and four for all diets. Variance within the DM digestibility values was highest on day 1 231
and thereafter subsided and for all samples, except the MKM, was minimal from day two 232
onwards. There was a limited amount of variation during the first four days in the protein 233
digestibility in all diets, before the values stabilised. Notably the variance within the protein 234
digestibility data was the lowest of each of the three digestibility parameters. What variance 235
there was within the protein digestibility values also minimised after two days (Figure 3). 236
Energy digestibility values were variable over time and also took two to four days till the 237
trend in the digestibility value stabilised. Similar to protein digestibility the variance within 238
the energy digestibility values was also nominal and this too diminished within two to four 239
days. 240
241
242
243

10
Discussion 244
245
The key foci of this study were methodological, in that the study sought to define the effects 246
of faecal collection method and also acclimation time to diets, on the digestibility values determined 247
in barramundi. Although studies have been performed comparing the determination of whole diet 248
digestibilities based on faeces collected using either settlement or stripping techniques in salmonids 249
(Windell et al., 1978; Weatherup & McCracken, 1998; Vandenberg & de la Noue, 2001; Glencross et 250
al., 2005), this is the first study to compare the influence of these faecal collection methods with 251
barramundi. Additionally, the study also examines the variation in digestibility over time to establish 252
what is the best acclimation time to diets prior to faecal collection. Similar such data from other 253
species could not be found. 254
255
Faecal collection method influences 256
There has been much debate on the positives and negatives associated with either faecal 257
collection method used in digestibility studies (reviewed by Glencross et al., 2007). However, it is 258
widely acknowledged that the two faecal collection methods do result in different diet digestibility 259
value determinations (Windell et al., 1978; Weatherup & McCracken, 1998; Vandenberg & de la 260
Noue, 2001; Glencross et al., 2005). These differences imply that there are compositional differences 261
in the faeces collected which immediately have connotations on the use of each faecal collection 262
method. Despite being more laborious and costly to collect, the data produced from faeces collected 263
using the stripping method was more conservative than the data produced from faeces collected using 264
the settlement method. This factor alone means that when provided with the option to use either data 265
set the rational decision is to use the data from the stripping method because of this conservatism. 266
It was noted in the earlier work of Glencross et al. (2005) that the greatest differences 267
between the nutrient digestibility assessments from the two faecal collection methods were those 268
ingredients with higher levels of carbohydrates. A similar result was also observed in the present 269
study with a greater number of significant differences in the digestibility of the Starch diet than either 270
the Basal or MKM diets. It is likely that this is due to high levels of carbohydrates in the faeces 271
decreasing faecal integrity and as such increases the dissolution of the faecal matter collected using 272
settlement techniques. 273
274
Temporal variation in digestibility values 275
One of the key elements of this study was to determine the time period over which the fish 276
should be fed a diet before faecal collection is initiated. Unfortunately there was little literature with 277
which to compare our data in this part of the study. Therefore, in assessing this question the key 278
parameter was considered to be the level of variability (as noted by the magnitude of the standard 279
error) in the data collected and also how the data at any time point compares to that data obtained at 280

11
the longest acclimation time point. This was based on the assumption that by this time point the fish 281
would have acclimated to the diet. The different digestibility parameters (dry matter, protein, energy) 282
were also subtly different in how they responded over time with respect to the variability and also 283
how they fared compared to the digestibility values from day 12 of the study. Fish fed the MKM diet 284
took the longest to acclimate to it and there was a higher level of data variance within the dry matter 285
digestibilities determined from that diet even up to day 10. However the protein and energy 286
digestibility parameters for that diet showed little variance and were relatively consistent from day 287
four onwards based on Figure 3. 288
An important observation in this study though is the level of variability seen of the data from 289
the Basal diet. As indicated in the methods, the fish were fed this diet for one week before any faecal 290
collection commenced, yet on day one of faecal collection a decline in dry matter digestibility was 291
observed relative to the longer-term mean (Figure 3). In fact throughout the two week study period 292
there was an inconsistency in the digestibility values determined for dry matter from this diet (and the 293
other two) which perhaps indicates that some variation in digestibility might be a natural feature 294
independent of acclimation time. 295
296
Conclusions 297
The two faecal collection methods used in this study are the two main methods used by fish 298
nutritionists worldwide and this study provides a good estimate of how well each method compares 299
when used with barramundi. The faecal stripping collection method is the more conservative of the 300
two assessments used in this study and therefore is the one we recommend for use with this species. 301
When assessing the variability in digestibility over time, it was observed that in the first three 302
days after a new diet is introduced, that the digestibility data obtained using the faecal settlement 303
methods, was particularly variable. After this time this variability diminished and values became more 304
uniform. We therefore recommend at least four days acclimation to new diets for barramundi before 305
any faeces are collected for digestibility studies. 306
307
308
12
References 309
310
Aksnes, A., Hjertnes, T. & Opstvedt, J. (1996) Comparison of two assay methods for determination of 311
nutrient and energy digestibility in fish. Aquaculture 140, 343-359. 312
313
AOAC (Association of Official Analytical Chemists). (2005) Official Methods of Analysis of the 314
Association of Official Analytical Chemists. 16th edition. Association of Official Analytical Chemists. 315
Washington, DC, USA. 316
317
Austreng, E. (1978) Digestibility determination in fish using chromic oxide marking and analysis of 318
different segments of the gastrointestinal tract. Aquaculture 13, 265-272. 319
320
Burel, C., Boujard, T., Tulli, F. & Kaushik, S., (2000) Digestibility of extruded peas, extruded lupin, 321
and rapeseed meal in rainbow trout (Oncorhynchus mykiss) and turbot (Psetta maxima). Aquaculture 322
188, 285-298. 323
324
Cho, C.Y. & Kaushik, S.J. (1990) Nutritional energetics in fish: Energy and protein utilisation in 325
rainbow trout (Salmo gairdnerii). World Review of Nutrition and Dietetics 61, 132-172. 326
327
Choubert, G., De la Noue, J. & Luquet, P. (1982) Digestibility in fish: improved device for the 328
automatic collection of feces. Aquaculture 29, 185-189. 329
330
Cheng, Z.J. & Hardy, R.W., (2003) Effects of extrusion processing of feed ingredients on apparent 331
digestibility coefficients of nutrients for rainbow trout (Oncorhynchus mykiss) Aquaculture Nutrition 332
9, 77-87. 333
334
Glencross, B.D., (2011) A comparison of the diet and raw material digestibilities between rainbow 335
trout (Oncorhynchus mykiss) and barramundi (Lates calcarifer) – Implications for inferences of 336
digestibility among species. Aquaculture Nutrition 17, e207-e215. 337
338
Glencross, B., Evans, D., Dods, K., McCafferty, P., Hawkins, W., Maas, R. & Sipsas, S. (2005) 339
Evaluation of the digestible value of lupin and soybean protein concentrates and isolates when fed to 340
rainbow trout, Oncorhynchus mykiss, using either stripping or settlement faecal collection methods. 341
Aquaculture 245, 211-220. 342
343
Glencross, B.D., Booth, M. & Allan, G.L. (2007) A feed is only as good as its ingredients – A review 344
of ingredient evaluation for aquaculture feeds. Aquaculture Nutrition 13, 17 – 34. 345

13
346
Glencross, B.D., Rutherford, N.R. & Jones, J.B., (2011) Fishmeal replacement options for juvenile 347
barramundi (Lates calcarifer). Aquaculture Nutrition 17; e722–e732. 348
349
Glencross, B.D., Blyth D., Tabrett, S.J., Bourne, N., Irvin, S., Fox-Smith, T. & Smullen, R.P., (2012). 350
An examination of digestibility and technical qualities of a range of cereal grains when fed to juvenile 351
barramundi (Lates calcarifer) in extruded diets. Aquaculture Nutrition 18, 388-399. 352
353
Hillebrand, W.F., Lundell, G.E.F., Bright, H.A. & Hoffman, J.I., (1953) Applied Inorganic Analysis. 354
Wiley, New York, USA. 355
356
Maynard, L.A., Loosli, J.K. (1979) Animal Nutrition, 6th Edition. New York, NY: McGraw-Hill Book 357
Co. 358
359
Sugiura, S.H., Dong, F.M., Rathbone, C.K. & Hardy, R.W. (1998) Apparent protein digestibility and 360
mineral availabilities in various feed ingredients for salmonid feeds. Aquaculture 159, 177-202. 361
362
Vandenberg, G.W. & de la Noue, J. (2001) Apparent digestibility comparison in rainbow trout 363
(Oncorhynchus mykiss) assessed using three methods of faeces collection and three digestibility 364
markers. Aquaculture Nutrition 7, 237-245. 365
366
Weatherup, R.N. & McCracken, K.J., (1998) Comparison of the estimation of digestibility of two 367
diets for rainbow trout, Oncorhynchus mykiss (Walbaum), using two markers and two methods of 368
faeces collection. Aquaculture Research 29, 527-533. 369
370
Windell, J.T., Foltz, J.W. & Sarokon, J.A., (1978) Methods of fecal collection and nutrient leaching in 371
digestibility studies. Progressive Fish Culturist 40, 51-55. 372
373
14
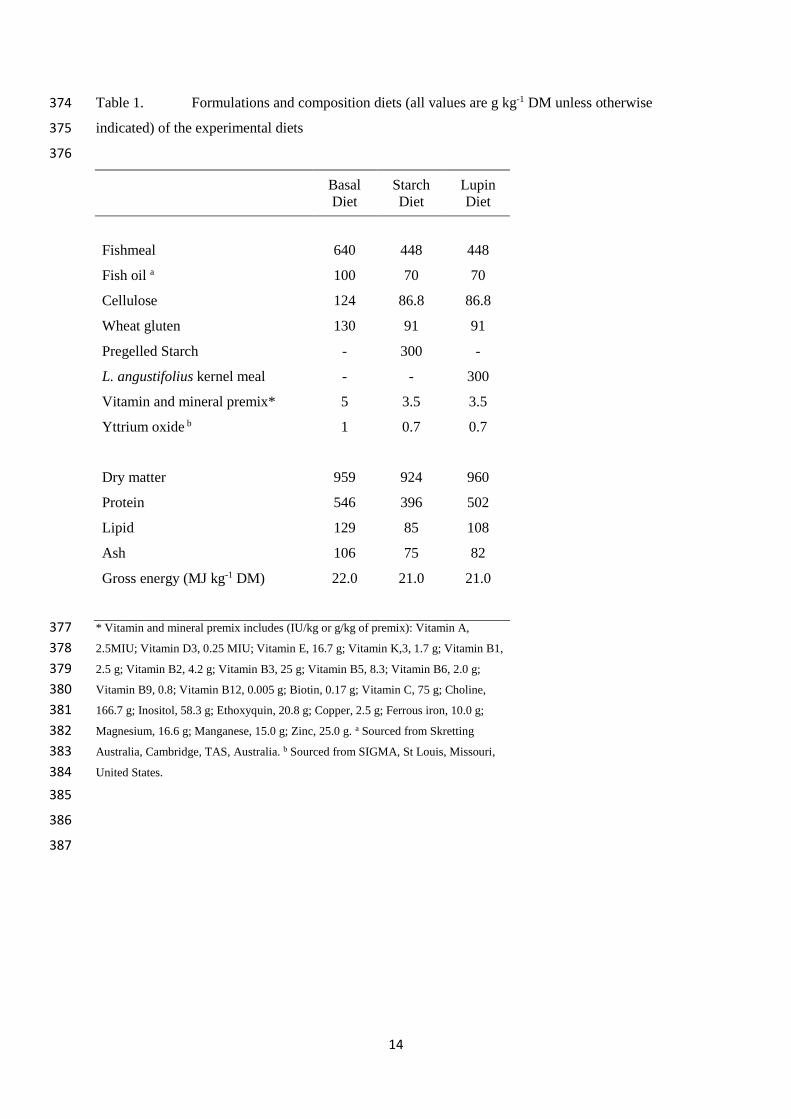
Table 1. Formulations and composition diets (all values are g kg-1 DM unless otherwise 374
indicated) of the experimental diets 375
376
Basal
Diet
Starch
Diet
Lupin
Diet
Fishmeal 640 448 448
Fish oil a 100 70 70
Cellulose 124 86.8 86.8
Wheat gluten 130 91 91
Pregelled Starch - 300 -
L. angustifolius kernel meal - - 300
Vitamin and mineral premix* 5 3.5 3.5
Yttrium oxide b 1 0.7 0.7
Dry matter 959 924 960
Protein 546 396 502
Lipid 129 85 108
Ash 106 75 82
Gross energy (MJ kg-1 DM) 22.0 21.0 21.0
* Vitamin and mineral premix includes (IU/kg or g/kg of premix): Vitamin A, 377
2.5MIU; Vitamin D3, 0.25 MIU; Vitamin E, 16.7 g; Vitamin K,3, 1.7 g; Vitamin B1, 378
2.5 g; Vitamin B2, 4.2 g; Vitamin B3, 25 g; Vitamin B5, 8.3; Vitamin B6, 2.0 g; 379
Vitamin B9, 0.8; Vitamin B12, 0.005 g; Biotin, 0.17 g; Vitamin C, 75 g; Choline, 380
166.7 g; Inositol, 58.3 g; Ethoxyquin, 20.8 g; Copper, 2.5 g; Ferrous iron, 10.0 g; 381
Magnesium, 16.6 g; Manganese, 15.0 g; Zinc, 25.0 g. a Sourced from Skretting 382
Australia, Cambridge, TAS, Australia. b Sourced from SIGMA, St Louis, Missouri, 383
United States. 384
385
386
387

15
Table 2. Chemical characterisation of the key raw materials used in this study. All values are g 388
kg-1 DM unless otherwise detailed. 389
390
391 Ingredient origins are as follows: a Fishmeal (Anchovetta meal of Peruvian origin): Ridley Aquafeeds, Narangba, QLD, Australia. d 392 L. angustifolius cv. Myallie Kernel Meal: Coorow Seed Cleaners, Coorow, WA, Australia. e Wheat gluten and prelatinised wheat 393 starch :Manildra, , Auburn, NSW, Australia. f Sourced from SIGMA, St Louis, Missouri, United States. 394 395
Nutrient aFishmeal dLupin meal eGluten fCellulose eStarch
Dry matter (g/kg) 907 902 924 927 907
Protein 744 383 710 7 10
Total lipid 75 54 46 1 1
Ash 162 34 8 2 3
Carbohydrates 19 530 236 991 986
Gross Energy (MJ/kg DM) 20.9 20.6 22.9 17.0 17.1
Alanine 47 13 20 0 0
Arginine 42 44 27 0 0
Aspartate 70 41 27 0 0
Cysteine 8 8 22 0 0
Glutamate 93 87 289 0 0
Glycine 43 16 26 0 0
Histidine 23 7 12 0 0
Isoleucine 31 16 28 0 0
Leucine 56 27 54 0 0
Lysine 55 14 10 0 0
Methionine 24 3 12 0 0
Phenylalanine 30 16 41 0 0
Proline 36 22 84 0 0
Serine 30 22 40 0 0
Taurine 7 0 0 0 0
Threonine 32 15 22 0 0
Tyrosine 24 16 28 0 0
Valine 36 15 29 0 0

16
Table 3. Univariate MANOVA analysis with fixed effects of faecal collection method, diet 396
and method (M) x diet (D) 397
398
Variate Parameter Sum of
Squares
Degrees
of
Freedom
Mean
Square F value P value
Method Dry matter 0.017 1 0.017 12.48 0.002
Diet Dry matter 0.029 2 0.015 10.51 < 0.001
M x D Dry matter 0.003 2 0.002 1.07 0.363
Method Protein 0.003 1 0.003 5.83 0.027
Diet Protein 0.001 2 0.001 1.55 0.238
M x D Protein 0.000 2 0.000 0.19 0.830
Method Energy 0.004 1 0.004 13.84 0.002
Diet Energy 0.025 2 0.013 41.66 < 0.001
M x D Energy 0.000 2 0.000 0.45 0.647
399
400

17
Table 4. Digestibility (%) specifications of diets as determined using either stripping or 401
settlement faecal collection methods. Data are mean with pooled SEM. Values within a row 402
(a,b) or between collection methods (x,y) with a different superscript are significantly 403
different (P<0.05). 404
405
406
407
408
409
410
411
412
413
414
415
416
417
418
419
420
MKM : Lupin kernel meal cv. Myallie. 421
422
Nutrient Basal Starch MKM Pooled SEM
Stripping
Dry matter 66.7ab, x 69.8a,x 59.3b,x 1.60
Protein 92.6a,x 91.2a,x 92.7a,x 0.77
Energy 82.7a,x 80.5b,x 74.5c,x 1.20
Settlement
Dry matter 62.3a,x 61.3ab,y 56.0b,x 1.35
Protein 94.1a,x 93.3a,x 95.5a,x 0.43
Energy 85.3a,y 82.3b,y 78.0c,y 0.94
18
Table 5. Univariate MANOVA analysis with fixed effects of faecal collection time (T), diet 423
(D) and time x diet 424
425
Variate Parameter Sum of
Squares
Degrees
of
Freedom
Mean
Square F value P value
Diet Dry matter 0.114 2 0.057 8.0 0.001
Time Dry matter 0.081 7 0.012 1.6 0.148
D x T Dry matter 0.094 14 0.007 0.9 0.517
Diet Protein 0.005 2 0.003 6.4 0.003
Time Protein 0.005 7 0.001 1.8 0.102
D x T Protein 0.004 14 0.000 0.8 0.700
Diet Energy 0.085 2 0.043 59.5 < 0.001
Time Energy 0.006 7 0.001 1.1 0.346
D x T Energy 0.048 14 0.003 4.8 < 0.001
426
427
19
428
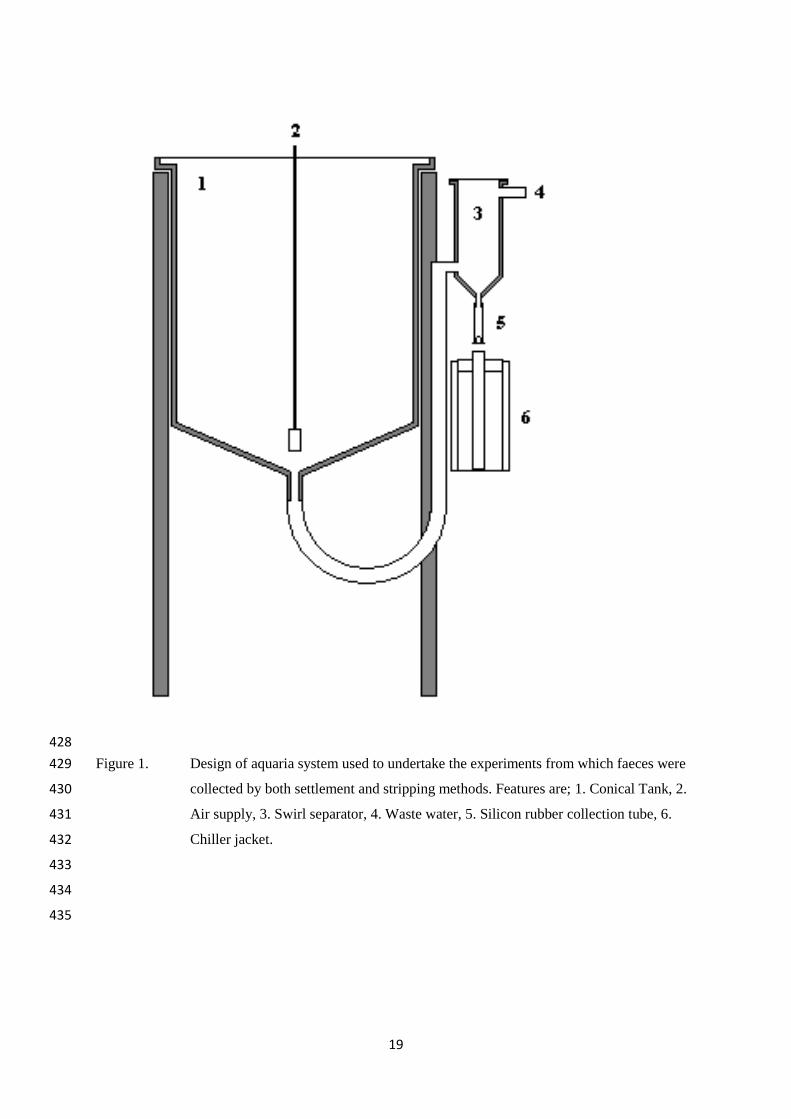
Figure 1. Design of aquaria system used to undertake the experiments from which faeces were 429
collected by both settlement and stripping methods. Features are; 1. Conical Tank, 2. 430
Air supply, 3. Swirl separator, 4. Waste water, 5. Silicon rubber collection tube, 6. 431
Chiller jacket. 432
433
434
435

20
y = 0.5661x + 0.2292R² = 0.823
y = 1.0407x - 0.0161R² = 0.6549
y = 0.8528x + 0.143R² = 0.9795
0.500
0.600
0.700
0.800
0.900
1.000
0.500 0.600 0.700 0.800 0.900 1.000
Dry Matter
Protein
Energy
436
437
438
439
440
441
442
443
444
445
446
447
448
449
450
451
452
453
Figure 2. Correlations between apparent digestibility coefficient (ADC) values from each of 454
the different faecal collection methods. 455
456
457
458
459
460
461
462
463
464
ADC - Stripping
AD
C -
Se
ttle
me
nt

21
0.300
0.400
0.500
0.600
0.700
0.800
0.900
1.000
0 2 4 6 8 10 12 14
0.300
0.400
0.500
0.600
0.700
0.800
0.900
1.000
0 2 4 6 8 10 12 14
0.300
0.400
0.500
0.600
0.700
0.800
0.900
1.000
0 2 4 6 8 10 12 14
465
466
467
468
469
470
471
472
473
474
475
476
477
478
479
480
481
482
483
484
485
486
487
488
489
490
491
492
493
494
495
496
497
498
Figures 3a-c Temporal variation in digestibility values determined for energy (○), protein (●) and 499
dry matter (●) for each diet (basal : a, starch : b, MKM : c) over a 13 day period. 500
501
a
b
c