this chapter is version 1 - cochrane methods · 9.1 introduction the extent to which the results of...
TRANSCRIPT

© Copyright The Cochrane Collaboration 2009
i
This Chapter is Version 1.0
This Chapter has undergone review, editing and formatting, and now constitutes agreed formal directions for Cochrane authors.
Please cite this version as:
Reitsma JB, Rutjes AWS, Whiting P, Vlassov VV, Leeflang MMG, Deeks JJ,. Chapter 9: Assessing methodological quality. In: Deeks JJ, Bossuyt PM, Gatsonis C (editors), Cochrane Handbook for Systematic Reviews of Diagnostic Test Accuracy Version 1.0.0. The Cochrane Collaboration, 2009. Available from: http://srdta.cochrane.org/.
This chapter was edited by Jon Deeks on 27th October 2009.
Table of Contents
9 Assessing Methodological Quality .............................................................................. 1 Key Points .................................................................................................................................................................. 1 9.1 Introduction ................................................................................................................................................. 2 9.2 What is bias? ............................................................................................................................................... 3
9.2.1 Bias and imprecision .............................................................................................................................. 3 9.2.2 ‘Risk of bias’ and ‘Quality assessment’ .................................................................................................. 3 9.2.3 Establishing empirical evidence of bias .................................................................................................. 4
9.3 Tools for assessing quality and risk of bias ................................................................................................. 5 9.3.1 Types of tools ......................................................................................................................................... 5 9.3.2 Existing quality assessment tools ........................................................................................................... 5 9.3.3 Collecting information about study quality ............................................................................................ 7
9.4 Individual quality items ............................................................................................................................... 8 9.4.1 Patients’ spectrum (item 1) ..................................................................................................................... 8 9.4.2 Reference standard (item 2) .................................................................................................................. 10 9.4.3 Disease progression (item 3)................................................................................................................. 11 9.4.4 Partial verification (item 4) ................................................................................................................... 12 9.4.5 Differential verification (item 5) ........................................................................................................... 13 9.4.6 Incorporation (item 6) ........................................................................................................................... 14 9.4.7 Test and diagnostic review (items 7 and 8) ........................................................................................... 15 9.4.8 Clinical review (item 9) ........................................................................................................................ 16 9.4.9 Uninterpretable results (item 10) .......................................................................................................... 17 9.4.10 Withdrawals (item 11) ..................................................................................................................... 18
9.5 Presentation of assessments of methodological quality assessments ......................................................... 19 9.6 Summary assessments of methodological quality ..................................................................................... 21 9.7 Incorporating assessments into the review ................................................................................................ 21
9.7.1 Exploring the impact of poor methodological quality .......................................................................... 21 9.7.2 Including quality assessments in meta-analyses ................................................................................... 22 9.7.3 Using quality assessments to make recommendations for future research............................................ 23
9.8 Chapter information................................................................................................................................... 23 9.9 References ................................................................................................................................................. 24

© Copyright The Cochrane Collaboration 2009
1
9 Assessing Methodological Quality Hans Reitsma, Anne Rutjes, Penny Whiting, Vasiliy Vlassov, Mariska Leeflang, Jon Deeks.
Key Points
• Problems in the design, conduct and reporting of studies of diagnostic test accuracy can lead to bias and cause differences between findings of primary studies. This is supported by empirical evidence.
• The assessment of methodological quality of primary diagnostic test accuracy studies is a necessary step in a Cochrane review to guide the analysis and interpretation of the results.
• The Cochrane Collaboration recommends using a checklist approach to assess the quality of primary studies based on the QUADAS instrument. We recommend assessing 11 of the 14 original quality items of the QUADAS tool, and adding items important for each particular context and topic. We recommend against using scales that yield a summary score.
• Key domains of quality assessment include representativeness of the study sample, the soundness of the verification procedure, blinding of test interpretation, and missing data.
• Authors need to define up front what quality items they will be assessing and how these items will be used specific to their review. Piloting the quality assessment form is recommended in order to test and update the use of the items. Assessments should be undertaken by at least two authors, and there should be an explicit procedure to resolve disagreements.
• Plots and tables of the results of the quality assessment of individual studies can be created in RevMan for publication in Cochrane reviews. Authors may be able to investigate whether quality differences are potential sources of heterogeneity, should adequate data be available.
• Detailed considerations for the assessment of individual quality items are provided in this chapter.

© Copyright The Cochrane Collaboration 2009
2
9.1 Introduction The extent to which the results of a Cochrane Systematic Review of Diagnostic Test Accuracy can draw conclusions about the accuracy of a test, or relative accuracy of different tests, depends (amongst other things) on whether the included studies are valid. The evaluation of the validity of included studies is therefore an essential component of any Cochrane review, and should influence the analysis, interpretation and conclusions of the review.
The validity of a study may be considered to have two dimensions. The first dimension is whether there is a risk of bias in a study. Similar to intervention studies there are key issues in the design and execution of a diagnostic accuracy study that can produce incorrect results within a study. This is often described as ‘internal validity’. Examples of threats to internal validity are the use of an inappropriate reference standard or partial verification.
Even if there are no apparent flaws directly leading to bias, a diagnostic accuracy study may generate results that are not valid for the particular diagnostic question that the review tries to answer. The patients in the study may not be similar to those in whom the test is used, the test may be used at a different point in the care pathway, or the test may be used in a different way than in practice. This refers to the issue of external validity or generalizability of results. Both aspects of validity are important in systematic reviews of diagnostic test accuracy, and will be discussed in this chapter.
The issue of study validity is considered at four points in the systematic review process. First, the eligibility criteria are chosen to ensure that the included studies meet some minimal validity standards. For example, it may be required that all studies use a particular reference standard. The selection of eligibility criteria is discussed in Chapter 6. Second, detailed assessment of the validity of all the studies selected for inclusion in the review is undertaken and the results reported. This process is addressed here in Chapter 9. Third, in the analysis phase, studies may be grouped according to characteristics related to validity. This can be done in both investigations of heterogeneity that estimate the influence of aspects of study validity and investigate the degree of variability in results attributable to aspects of study methodology, and in sensitivity analyses which limit the impact of studies of questionable rigor on study estimates, as described in Chapter 10. Finally, the strength of evidence that can be attributed to the review’s conclusions depends on the overall validity of the evidence-base, and recommendations for future research are made noting particular methodological deficiencies in the existing studies, as outlined in Chapter 11. If the results of individual studies are biased and are synthesised without any consideration of validity, then it is clear that the results of the review will also be biased.
The focus of this chapter is on assessing the validity of the individual studies. Further considerations need to be made concerning validity when making comparisons between tests. For example, comparisons between two tests made within studies where all individuals receive all tests will be regarded as more valid than comparisons made between studies where the two tests are evaluated in different samples (see Chapter 5). The validity of test comparisons is not directly considered in this chapter, but it is of utmost importance when drawing conclusions about comparisons of tests, and is discussed in depth in Chapter 10 and Chapter 11.
Thus the assessment of validity, both internal and external, has an important role throughout the systematic review process, and is evident in the report of the review through the detailed reporting of individual quality items of all included studies, the structuring of the analysis and the interpretation of results.

© Copyright The Cochrane Collaboration 2009
3
9.2 What is bias? 9.2.1 Bias and imprecision Bias is a systematic error or deviation from the truth, either in the results or in their inferences. Biases can act in either direction, leading to overestimates or underestimates of test accuracy. It is impossible to know for certain whether a study is biased, or the direction or magnitude of a bias. However, when weaknesses are identified, judgements can be made of the risk of bias in an individual study, and occasionally its likely direction and size can be hypothesised. Biases can arise through problems in the design or execution of the study (which are primarily issues of internal validity), through recruiting the wrong participants, or using the wrong test, or the test in the wrong way (primarily issues of external validity).
Bias must not be confused with imprecision. Imprecision arises when an estimate is based on a small sample. Imprecision is caused by random error, whereas bias is caused by systematic error. Statistical analysis appropriately describes the uncertainty in an estimate caused through random error by using confidence intervals, but it cannot describe the uncertainty caused by systematic error. In a systematic review we assess study validity to describe the risk of bias and estimate confidence intervals (or regions) to describe imprecision. Both processes are essential in all systematic reviews.
9.2.2 ‘Risk of bias’ and ‘Quality assessment’ The process of assessing study validity in systematic reviews has been described by the phrase assessment of methodological quality for many years (Moher 1996, Ioannidis 1998, Verhagen 2001) but was replaced by assessment of risk of bias in Cochrane Systematic Reviews of Interventions from 2008. Risk of bias focuses squarely on addressing the issue of whether the results of a study are valid and should be believed (Higgins 2008) limiting assessment to judging whether the methods used could introduce a risk of systematic error or bias. This refers solely to aspects of internal validity.
Cochrane Systematic Reviews of Diagnostic Test Accuracy retain the broader concept of assessing methodological quality to describe the process of assessing the design and conduct of the included studies, and reporting the degree to which we are sure that the included studies can be believed, are relevant to the review objective, and cause variation in its findings. This is for three reasons: first, for several design features the potential for bias may depend on the particular topic and research question at hand; second, the increased importance of aspects of external validity; and third, the major problems in primary research studies with poor reporting.
In test accuracy research identifying the ideal study is not straightforward. We lack clear empirical evidence of the degree of bias that suboptimal choices of design can create, we have evidence that the importance of particular features of study design are context dependent, and we struggle with some aspects of study design in identifying the ideal choice with which a comparison can be made. For example, whilst we know that the choice of reference standard matters, and we can assess whether different reference standards in a review cause variation giving different results, we cannot always identify which reference standard is the most valid choice.
In test accuracy research external validity is of importance, as the magnitude of estimates of accuracy differ with population characteristics (Ransohoff 1978, Mulherin 2002). Furthermore, the same diagnostic test can be applied in many more variations than a therapy for a given condition. For example, positron emission tomography–computed tomography (PET-CT) could be used as an add-on test after physical examination, X-ray examination and magnetic resonance imaging (MRI) to detect additional metastases in colorectal cancer patients with negative findings on these earlier tests. On the other hand, PET-CT could also be used as the first additional test in patients just diagnosed with colorectal cancer. Both are
© Copyright The Cochrane Collaboration 2009
4
relevant questions, but different studies need to be undertaken to answer the two research questions.
For some aspects of study methodology, poor reporting in test accuracy studies frequently prevents assessment of key features of design or conduct, making it impossible to judge whether the study methodology has been adequate (Reid 1995, Bossuyt 2003a, Lumbreras-Lacarra 2004, Smidt 2005). When aspects of study design or execution are not reported, it is impossible for the reader to differentiate between studies using good methodology but inadequate reporting, and studies applying poor methods leading to biased results. If an item is frequently not reported, we are forced to assess the quality of reporting as a proxy assessment for the quality of the study methods. This is not ideal, but is the best that can be achieved until study reporting is routinely improved. There are signs that the publication of the STARD statement (STAndards for the Reporting of Diagnostic accuracy studies) in 2003 (Bossuyt 2003a, Bossuyt 2003b) has led to better quality of reporting of diagnostic accuracy studies, and it is hoped this trend will continue (Smidt 2006).
Referring to our concept of assessment of methodological quality, it must be made clear that our interpretation is not a critical appraisal type process of judging the competence with which a primary study has been undertaken. For example, in contexts such as detecting solid tumours, differential verification of index test positives (often with biopsy) and negatives (often with follow-up) is the best that can be achieved as it is impossible to biopsy a tumour you cannot find. However, as there is no suitable reference test that can be applied to both groups, concern about the quality (and a risk of bias) for such a study will be flagged, as even though it is the best that can be achieved, the problems associated with differential verification of disease status remain.
9.2.3 Establishing empirical evidence of bias Biases associated with particular characteristics may be assessed using a research technique known as meta-epidemiology (Naylor 1997, Sterne 2002). A meta-epidemiological study analyses a collection of meta-analyses. In each one, the studies are divided into two groups according to whether or not they adhere to a particular methodological characteristic. The bias associated with each characteristic is first estimated within each meta-analysis by comparing the results of studies which do possess the characteristic with those that do not (estimating a ratio of diagnostic odds ratios, or ratios of sensitivities or specificities). These estimates from each meta-analysis are then pooled in an overall meta-analysis to obtain a more precise estimate of the bias. More advanced analyses consider the variation in results and bias within and between topics, as a lack of methodological rigor may increase variability in findings as well as (or instead of) introducing a directional systematic bias.
Whilst estimation and detection of the effects of bias have been well studied using meta-epidemiological techniques for randomized controlled trials, only a few such studies have been undertaken for test accuracy studies (Lijmer 1999, Rutjes 2006). Concern about bias for many aspects of study methodology are based on case studies or theoretical reasoning (Whiting 2004). Where meta-epidemiological evidence of bias for particular quality items exist, we profile this in the sections which follow.
© Copyright The Cochrane Collaboration 2009
5
9.3 Tools for assessing quality and risk of bias 9.3.1 Types of tools Tools for quality assessment exist in three general styles: checklists, scales and levels of evidence. All three tools involve assessing each study against a pre-stated set of key quality items.
Checklists report compliance of each study with each item using ratings such as ‘yes’, ‘no’ and ‘unclear’. This enables the construction of critiques of individual studies, and an overview describing the overall compliance of a body of evidence for each quality item. This is the approach that is used in all Cochrane reviews. Scales are checklists where each quality item is scored numerically and the scores totalled to give an overall measurement of quality. In the levels of evidence approach, checklists are again used and studies are assigned a level or grade according to whether they fulfil a predefined set of quality items. Levels of evidence are more typically used in the preparation of guidelines where the body of evidence contains studies with a variety of designs.
There are a number of limitations with both the quality score and levels of evidence approaches. The numerical weights used in a quality score reflect judgements of the relative importance of the individual items. The importance of individual items and the direction of potential biases associated with these items often vary according to the context in which they are applied, but this is ignored in most quality scales (Jüni 2001, Jüni 1999). Thus the quality ratings given may not truly reflect the quality of a study, and may hide particular aspects of poor study conduct and design. In the levels of evidence approach each level incorporates several different quality items and so it is not possible to assess which of the individual quality items a study fulfils.
Due to these problems we recommend using a checklist approach to assess the quality of each individual item for all primary studies included in Cochrane Systematic Reviews of Diagnostic Test Accuracy. This approach does create challenges in incorporating quality assessments in the analysis, but ensures full reporting of study quality without unjustified assumptions being made about the relative importance of particular items.
9.3.2 Existing quality assessment tools A large number of quality assessment instruments are available for diagnostic accuracy studies; a review on quality assessment in diagnostic reviews identified over 90 instruments (Whiting 2005). The content of these tools differed significantly with respect to the number of items included, and whether items related to bias, variability, and analysis or reporting were included. Most tools were developed for use in a specific diagnostic review rather than as a general tool for the quality assessment of diagnostic test accuracy studies.
We recommend using the QUADAS checklist as a starting point for the quality assessment of studies included in Cochrane Systematic Review of Diagnostic Test Accuracy, and its structure has been incorporated into the Cochrane RevMan 5 software. QUADAS is a generic tool developed specifically for use in diagnostic test accuracy reviews (Whiting 2003) . It was developed using a formal consensus method informed by empirical evidence, and has since been evaluated and modified (Whiting 2006) . The original publication of the QUADAS tool identified 14 items for assessment, 11 of these are included in the Cochrane version of the tool. The three excluded QUADAS items relate to the quality of reporting rather than methodology. The evaluation of QUADAS recommends that two additional items undergo coding changes and we have followed these recommendations. Authors are recommended to assess all 11 QUADAS items as listed in Table 9.1, even when they are also used as eligibility criteria. The benefit of reassessing such criteria as part of the quality evaluation includes documenting the evidence that the criterion was met, and clearly reporting all aspects of study quality in the review report. Items should never be excluded from

© Copyright The Cochrane Collaboration 2009
6
assessment if it is impossible for any studies to meet a particular quality criterion. In such instances it is essential to report that all studies were at risk of the associated bias.
Table 9.1 Recommended quality items derived from QUADAS tool (Whiting 2003) 1. Was the spectrum of patients representative of the patients who will receive the test in
practice? (representative spectrum)
2. Is the reference standard likely to classify the target condition correctly? (acceptable reference standard)
3. Is the time period between reference standard and index test short enough to be reasonably sure that the target condition did not change between the two tests? (acceptable delay between tests)
4. Did the whole sample or a random selection of the sample, receive verification using the intended reference standard? (partial verification avoided)
5. Did patients receive the same reference standard irrespective of the index test result? (differential verification avoided)
6. Was the reference standard independent of the index test (i.e. the index test did not form part of the reference standard)? (incorporation avoided)
7. Were the reference standard results interpreted without knowledge of the results of the index test? (index test results blinded)
8. Were the index test results interpreted without knowledge of the results of the reference standard? (reference standard results blinded)
9. Were the same clinical data available when test results were interpreted as would be available when the test is used in practice? (relevant clinical information)
10. Were uninterpretable/ intermediate test results reported? (uninterpretable results reported)
11. Were withdrawals from the study explained? (withdrawals explained)
Review authors should also consider whether any additional quality items require assessment for a particular review. Some additional generic quality items are listed in Table 9.2. Particular topic areas may raise additional quality issues, for example those related to obtaining, storing and transporting samples. Also, the QUADAS tool is tailored for assessing studies having a cross-sectional design, and does not explicitly consider studies that compare several tests. Additional quality items should be added for studies with delayed verification (requiring longitudinal follow-up of participants) and test comparisons (concerning avoidance of selection bias and independence of multiple test assessments).
Whilst many quality assessment items are naturally related to the quality of the study (and will be the same for all tests evaluated in a comparative study) others could possibly take different values for different tests within a study, even when they are evaluated on the same participants. The structure of the quality assessment table of a Cochrane Systematic Review of Diagnostic Test Accuracy does have the functionality to deal with this by enabling the assessment of quality for different tests separately.

© Copyright The Cochrane Collaboration 2009
7
Table 9.2 Potential additional quality items 1. Were cut-off values established before the study was started? 2. Is the technology of the index test unchanged since the study was carried out? 3. Did the study provide a clear definition of what was considered to be a ‘positive’ result? 4. Had test operators had appropriate training? 5. Was treatment withheld until both the index test and reference standard were performed? 6. Were data on observer variation reported and within an acceptable range?
7. Were data on instrument variation reported and within an acceptable range? 8. Were objectives pre-specified? 9. Was the study free of commercial funding?
9.3.3 Collecting information about study quality The process of collecting information about study quality involves stages of 1) selecting the quality items to be coded and developing coding guidelines for each quality item tailored to your review, 2) developing a coding form, 3) testing and refining the form, 4) collecting the data and 5) resolving disagreements and clarifying ambiguous or missing data.
Stage 1 is required to produce the protocol for a systematic review, and involves writing definitions for the coding of the QUADAS items, and any additional items selected for review. All items included in Table 9.1 have been phrased in such a way that they each relate to a single aspect of quality and can be judged as ‘yes’, ‘no’, or ‘unclear’. A judgement of ‘yes’ always refers to the optimal methodological characteristic; the judgement of ‘no’ always refers to the less than optimal characteristic. The underlying principle is that the less than optimal methodological characteristics have the potential to introduce bias or limit applicability. If authors decide to add their own additional items to the checklist, they must phrase their items in the same way to facilitate standard reporting and interpreting of quality in the review. Several quality items require a subjective judgement of the assessor, while other items are more black-and-white. For the more subjective items, like patient spectrum, it is essential that clear guidelines are formulated on how to judge these items in each review, keeping the underlying research question of the review in mind. Application of the QUADAS tool in a particular review involves predefining the exact criteria that correspond to judgements of ‘yes’, ‘no’ and ‘unclear’, particularly for items 1, 2, 3 and 9. These should all be documented in a protocol and piloted. Details of what is required are given in the sections which follow.
For each quality item the Cochrane version of the data collection tool requires recording both a description and the judgement for each quality assessment item. The description is a succinct summary of the stated facts given in the study report upon which the judgement is made. Where possible the description should include verbatim quotes from study reports or correspondence. Any assumptions made in reaching the judgement should be stated. Both the description and the judgement are mandatory components and published in the Assessment of Study Methodology Table in the review. Review authors may find it useful to note where the description is taken from (e.g. the exact location within an article) for their own reference purposes, although there is no need to publish this information.
Once the quality items to include in the quality checklist are selected and defined, the next step is to produce a methodological quality data collection form which will be completed for each included study. This form should incorporate clear instructions on how each item should be coded, allowing space for both the description and judgement to be recorded. Providing

© Copyright The Cochrane Collaboration 2009
8
clear instructions in the form will help consistency in interpretation between reviewers, and the instructions can also be included in a Table in your review so that interested readers can see how quality was assessed. Instructions for some items can be taken from this chapter, but always ensure that you adapt them where necessary to make them specific to your review. A period of testing and training is essential to improve the quality of forms, to rephrase items, and calibrate answers between review authors, thereby lowering the number of future disagreements. It is usually a good idea for review authors to pilot the quality checklist independently on a sample of at least five papers and then to meet and discuss any discrepancies in rating of the items.
At least two review authors should independently perform the quality assessment. The review authors should have relevant knowledge of both the methodological issues of diagnostic accuracy studies and the clinical topic area. There should be an explicit procedure for resolving disagreement among review authors. This may involve discussion between review authors or referral to a third review author if agreement cannot be reached. Reporting the number of disagreements is recommended.
Blinding for journal, and/or names of authors is not recommended, as it can be difficult in practice, time-consuming, and its benefit is uncertain (Jadad 1996, Berlin 1997, Kjaergard 2001).
Poor reporting is a major obstacle to quality assessment because it obscures whether a design feature was correctly applied but not reported, or was inappropriately applied, potentially introducing bias. There is growing evidence that reports of diagnostic studies frequently omit important methodological details (Reid 1995, Lijmer 1999, Lumbreras-Lacarra 2004, Rutjes 2006). Contacting authors for further information is one method of dealing with poor reporting (Pai 2003), however, this may be a time consuming process, especially for a large review. Nevertheless, this process may provide useful information and so is worthwhile undertaking if time and resources allow. To reduce the risk of overly positive answers, caution should be exercised in ensuring that authors are not asked leading questions. For example, it is better to ask the authors to describe their processes, such as “how did you decide whether an individual underwent biopsy?” or “what information was the radiologist given about a patient?” rather than directly asking them to make a judgement as to whether their study was susceptible to bias.
9.4 Individual quality items This section presents the quality items selected from the QUADAS tool, directions for coding, together with a brief discussion of the situations in which bias might arise if a study fails to meet a specific item. Each item includes information about the details which need to be pre-specified in the review protocol and suggested generic coding instructions that should be adapted and used on the quality assessment data extraction forms. Comprehensive overviews of the various sources of bias and variation in accuracy studies are given elsewhere (Begg 1987, Whiting 2004).
9.4.1 Patients’ spectrum (item 1) Was the spectrum of patients representative of the patients who will receive the test in practice?
There are two aspects to this item, first whether the right patient group was recruited to the study to address the review question, and second whether the method of sampling patients for inclusion from this group was likely to yield a representative sample. Studies which differ in the demographic and clinical characteristics of samples may produce measures of diagnostic accuracy that can vary considerably (Ransohoff 1978, Mulherin 2002). Whether

© Copyright The Cochrane Collaboration 2009
9
the right patient group has been selected can be assessed both by looking at the study inclusion and exclusion criteria, and the tables of characteristics of the recruited sample. Particular characteristics to look out for include patient demographics, severity of disease/symptoms, alternative diseases, co-morbid conditions, healthcare setting, prevalence, and selection based on prior test results.
The sensitivity of a test will often vary according to the severity of disease. For instance, larger tumours are more easily seen with imaging tests than smaller ones, and larger myocardial infarctions lead to higher levels of cardiac enzymes than small infarctions making them easier to detect. Test specificity may decrease due to the presence of specific alternative diseases (Ransohoff 1978, Philbrick 1982) or increase when healthy individuals are inappropriately included. Alternative diseases may produce similar pathophysiological changes as induced by the target condition, leading to false-positive test results. One example is the production of tumour markers by urinary infection rather than cancer, when these markers are used to identify patients with bladder cancer (Glas 2003). Co-morbid conditions can also hinder the detection of the target condition as in the example of existing lung disease causing false-negative results in the use of ventilation/perfusion (V/Q) scans for the detection of pulmonary embolisms (Stein 1993).
Differences in patient spectrum can arise through different mechanisms, including the healthcare setting where the study was conducted and specific inclusion and exclusion criteria. Inclusion criteria may be defined in such a way that the spectrum of patients in the study is very different from the spectrum of patients in whom the test will be used in practice. For example, a study may be restricted to a specific age group or to patients presenting with a certain set of symptoms generally associated with more severe disease. Settings and referral processes influence both patient spectrum and disease prevalence. Thus, prevalence in some instances is used as a marker of spectrum (commonly with high prevalence being interpreted as indicative of more severe disease linked to observing higher sensitivity). However there are several alternative mechanisms which link prevalence to both increased and decreased sensitivity (Leeflang 2009) and thus it should be used as a marker of spectrum with a degree of caution.
Index tests may be promoted for different roles, such as add-on tests or replacement tests (Chapter 6), and as such need to be evaluated in different patient groups. For example, consideration of a test as a replacement will involve evaluating its performance in all patients considered suitable for testing with the existing tests. Whereas, if a test is used as an additional test, it may only be recommended in those with a particular result from earlier tests. Identifying how selection relates to the results of prior testing is therefore important in checking whether the right sample has been recruited for the purpose for which the test is being evaluated. If a review assesses a test for several purposes, different studies will be more or less relevant for the different roles.
Additionally, the methods used to sample patients for the study may lead to the inclusion of patients different from the spectrum in which the test will be used in practice. The ideal diagnostic accuracy study would prospectively include a consecutive series of patients fulfilling all selection criteria. Such a study is often referred to as a consecutive series study (Chapter 5). If other sampling methods are employed then there is the risk of introducing bias into the study. For example, if rather than including consecutive patients, more difficult cases are excluded from the study, this would be expected to lead to a lower number of false positive or false negative test results and hence to increased estimates of specificity and sensitivity. This is known as the limited challenge bias (Philbrick 1982). Another sampling method that can produce biased estimates of accuracy is known as the diagnostic case-control. Such studies use two separate selection processes to sample patients with the target condition and patients without the target condition (Rutjes 2005). Studies including severe cases and healthy controls overestimate diagnostic performance (Lijmer 1999, Pai 2003). The inclusion of healthy controls can be expected to decrease the likelihood of false positive test results compared to the inclusion of patients with symptoms that suggest the presence of the

© Copyright The Cochrane Collaboration 2009
10
target condition, but are caused by other mechanisms. A hybrid design in which cases and controls are separately, retrospectively, randomly sampled from a single consecutive series (akin to a nested case-control study in aetiological research) should be coded as if it were a random sample from a consecutive series as it avoids the biases of other diagnostic case-control studies (Pepe 2008).
Reported estimates of diagnostic accuracy may have limited clinical applicability (generalisability) if the spectrum of tested patients is not similar to the patients in whom the test will be used in practice. It is therefore important that diagnostic test evaluations include an appropriate spectrum of patients for the test under investigation, and also that a clear description is provided of the population actually included in the study.
Was the spectrum of patients representative of the patients who will receive the test in practice?
Pre-specify in protocol: An appropriate patient spectrum should be defined in light of the research question, stating key factors that could affect test accuracy such as setting, disease severity and prevalence, and prior testing. Where it is possible that a small proportion of inappropriate patients would be tolerated, this proportion should be stated. In some reviews exclusion of inappropriate sampling methods may be part of the eligibility criteria (for example exclusion of studies that have employed a group of healthy controls).
Code this item: Yes If the characteristics of the spectrum of patients fulfilled the pre-stated
requirements and the method of recruitment was consecutive, or random samples were taken from consecutive series.
No If the sample does not fit with what was pre-specified as acceptable or if groups with and without the target disorder were recruited separately, particularly with healthy controls.
Unclear If there is insufficient information available to make a judgement either about the spectrum or the method of sampling.
Where facts may be found: Spectrum should be assessed from the study inclusion criteria, descriptions of the setting and prior testing, and tables of the reported characteristics of the recruited sample. The method of sampling is most likely to be described in the methods section.
Description required: Describe the method by which the sample was obtained. Describe any key inclusion or exclusion criteria, the setting, prevalence and observations of who was recruited. Full details of the characteristics of the sample are not required as these are tabulated in the Characteristics of Included Studies table.
9.4.2 Reference standard (item 2) Is the reference standard likely to classify the target condition correctly?
The choice of an optimal reference standard is crucial, since it is used to determine the presence or absence of the target condition (disease status). Indicators of diagnostic accuracy are calculated by comparing the results of the index test with the outcome of the reference standard. If there are any disagreements between the reference standard and the index test then it is assumed that the index test is incorrect. Thus these estimates of accuracy are calculated based on the assumption that the reference standard is 100% sensitive and specific. Unfortunately, perfect reference standards are rare, and errors due to imperfect reference

© Copyright The Cochrane Collaboration 2009
11
standards can potentially bias the estimation of the diagnostic accuracy of the index test (Boyko 1988). This verification bias can either overestimate or underestimate test accuracy. Underestimation can occur when the index test and the reference standard measure different aspects of disease (such that errors in the reference standard are unrelated to errors in the index test), and it might be overestimated when they measure similar aspects of the disease (such that errors in the reference standard are likely to occur together with errors in the index test) (Biesheuvel 2007, van Rijkom 1995). Reviews are likely to restrict inclusion of studies on the basis of the use of one or more acceptable reference standards.
Where there is serious concern that the index test may out-perform the available reference standards the paradigm of assessing test accuracy will not be helpful. Reviews of diagnostic test accuracy should not be undertaken in these circumstances without careful consideration of the methodological issues (Glasziou 2008, Reitsma 2009).
Is the reference standard likely to classify the target condition correctly?
Pre-specify in protocol: Acceptable reference standards need to be predefined in the review protocol. Judgements as to the accuracy of the reference standard are often not straightforward and require clinical experience of the topic area to know whether a test or test combination is an appropriate reference standard. In some research areas consensus reference standards have been defined. If a mixture of reference standards are used you may have to consider carefully whether these were all acceptable.
Code this item: Yes All reference standards used meet the pre-stated criteria. No One or more reference standards used do not meet the pre-stated
criteria. Unclear It is unclear exactly what reference standard was used. Where facts may be found: The methods section of the paper should describe the reference
standards that were used. Description required: Report the reference standard(s) used.
9.4.3 Disease progression (item 3) Is the time period between reference standard and index test short enough to be reasonably sure that the target condition did not change between the two tests?
Ideally the results of the index test and the reference standard are collected on the same patients at the same time. If this is not possible and a delay ensues, misclassification due to spontaneous recovery, benefit from treatment, progression to a more advanced stage of disease, or occurrence of new disease may occur. The phrases disease progression bias and recovery bias (amongst others) have been used to describe the associated potential biases. Where effective treatment of those found positive on the first test undertaken leads them to be negative for the later test, a particular phenomenon known as the treatment paradox can occur (Whiting 2004). The length of the time period that may cause such bias will vary between conditions. For example, a delay of a few days is unlikely to be a problem for chronic conditions, but may be unacceptable for acute infections. This bias is a possibility in diseases where a (final) diagnosis can only be achieved after prolonged follow-up (known as delayed verification), sometimes even waiting until autopsy results are available following death (for example, confirming a diagnosis of Alzheimer’s disease). After a long delay it sometimes is unclear whether the disease was truly present when the index test was

© Copyright The Cochrane Collaboration 2009
12
undertaken, and in some instances it may be possible for recovery to have occurred.
Is the time period between reference standard and index test short enough to be reasonably sure that the target condition did not change between the two tests?
Pre-specify in protocol: You will have to make judgements regarding what is considered ‘short enough’ for the condition which you are considering, and pre-state this in the review protocol. The time period will depend on the speed of progression and possible resolution of the disease, and the speed with which treatments can be administered and be effective. This is likely to be longer for chronic diseases than acute diseases. You should state whether all patients are required to be assessed within this interval, whether it is based on mean or maximum times, or whether it is acceptable for a pre-specified proportion to be outside the required interval.
Code this item: Yes If the time between tests was shorter than that required, at least for an
acceptably high proportion of patients. No If the time between tests was longer than that required for an
unacceptably high proportion of patients. Unclear If information on timing of tests is not provided. Where facts may be found: The planned timing of tests may be described in the methods of the
study, the observed timings may be in the results. Description required: The observed timing of the tests if available, if not, then the planned
scheduling.
9.4.4 Partial verification (item 4) Did the whole sample or a random selection of the sample, receive verification using the intended reference standard?
Partial verification bias (also known as work-up bias, (primary) selection bias, or sequential ordering bias) can occur when not all of the study patients are verified by the reference standard. Where the choice of patients for verification is not random, particularly if it is then influenced by the results of the index test, biased estimates of test performance may arise. The effect of partial verification is complicated to predict because it depends on whether test-positive or test-negative patients are not verified, whether unverified patients are omitted from the 2×2 table or classified as true negatives or true positives, and whether unverified patients are random samples of index test negatives and positives (Begg 1983, Diamond 1991). There is no correct way of handling unverified patients in an analysis – sensitivity analysis in which they are alternately considered as different combinations of test-positives and test-negatives may allow the potential magnitude of any bias to be ascertained.
Random sampling of patients for verification is sometimes undertaken for reasons of efficiency, particularly where diseases are rare. If patients are randomly selected to receive the reference standard (either across the whole sample, or more commonly separately sampled within those found to be positive or negative to the index test) unbiased estimates of overall diagnostic performance of the test can be obtained by using methods that compensate for the sampling plan (Zhou 1998), even when those who are index test positive and index test negative are differentially sampled.

© Copyright The Cochrane Collaboration 2009
13
One particular study design, where partial verification initially appears to be problematic, is a paired-screen-positive study which compares two or more index tests, but only verifies individuals who are positive to one or more of the tests. Such studies may be deployed where verification is invasive and hence ethically unsound in those with low chance of disease. However, despite the lack of verification of those who are negative to both tests it is possible to obtain unbiased estimates of the relative sensitivity and false positive rates of the index tests, but not to directly estimate each test’s sensitivity and specificity (Chock 1997, Pepe 2001).
Did the whole sample or a random selection of the sample, receive verification using the intended reference standard?
Pre-specify in protocol: No details are usually needed, although some review authors may like to pre-specify the smallest proportion not verified which would be regarded as raising concern.
Code this item: Yes If all patients, or a random selection of patients, who received the
index test went on to receive verification of their disease status using a reference standard, even if the reference standard was not the same for all patients.
No If some of the patients who received the index test did not receive verification of their true disease state, and the selection of patients to receive the reference standard was not random.
Unclear If this information is not reported by the study. Where facts may be found: The plans for verification may be described in the methods, and
the numbers verified given in the results. Some recent studies may include a patient flow diagram which indicates who was not verified.
Description required: The proportions not verified (if possible according to index test result) and any explanation of how decisions about verification were made, and whether unverified patients were excluded from the 2×2 tables.
9.4.5 Differential verification (item 5) Did patients receive the same reference standard irrespective of the index test result?
Differential verification occurs when some patients are verified by one type of reference standard and other patients by a different standard. This is particularly of concern when those positive to the index test use one method of verification, and those negative receive a second. For example, in evaluating imaging tests to detect solid cancer tumours the reference standard is often a histological investigation based on biopsy samples in those in whom a tumour was seen, and follow-up for disease in those where no tumour was seen. Where the reference standard is a composite test (involving a panel of tests and other information) differential verification will not occur if all individuals receive all tests, but may be problematic should only selected test information for each individual be available, and the extent of that information relates to the index test finding. In other situations, differential verification may occur because different tests are available in different centres.
Differential verification poses a problem if the reference standards differ in accuracy (maybe because they define the target condition differently, for example histopathology of the appendix and follow-up for the detection of appendicitis) and if the choice of reference

© Copyright The Cochrane Collaboration 2009
14
standard relates to the results of the index test. This usually occurs when patients testing positive on the index test receive a more accurate (and often invasive) reference standard than those testing negative. Such a situation often occurs when it is deemed unethical to use an invasive reference test in those negative to the index tests as they have a very low risk of disease. The link between a particular (negative) index test result and being verified by a less accurate reference standard will affect measures of test accuracy. When errors of the index test are correlated with errors of the (imperfect) reference standard, test accuracy will be overestimated (Mol 1999). If errors are unrelated, it is more complicated to predict if bias is expected to occur, and its direction.
An extreme form of differential verification is when a fraction of index test negatives are classified as true negatives without undergoing any verification at all, leading to overestimates of both sensitivity and specificity. Whether this should be classified as partial verification or differential verification is hard to define.
The empirical study by Lijmer et al and Rutjes et al flagged differential verification as an important source of bias, finding an up to two-fold overestimation of the diagnostic odds ratio in studies hampered by differential verification (Lijmer 1999, Rutjes 2006). To gauge the risk of differential verification introducing severe bias it is important to understand the reasons why different individuals were verified by different tests and the difference in quality of the two (or more) reference standards being applied. If the choice is related to the index test result, or to the clinical probability of the disease of interest, bias is a real possibility.
Did patients receive the same reference standard irrespective of the index test result?
Pre-specify in protocol: No details are usually needed. Code this item: Yes If the same reference standard was used in all patients. No If the choice of reference standard varied between individuals. Unclear If it is unclear whether different reference standards were used. Where facts may be found: Details of the choice of reference standard may be described in the
methods section, illustrated in patient flow diagrams or reported in the results.
Description required: A list of the different reference standards and an explanation of how the choice of reference standard for each patient was determined should be given. The proportions using each of the different reference standards should be noted, if possible according to the index test results.
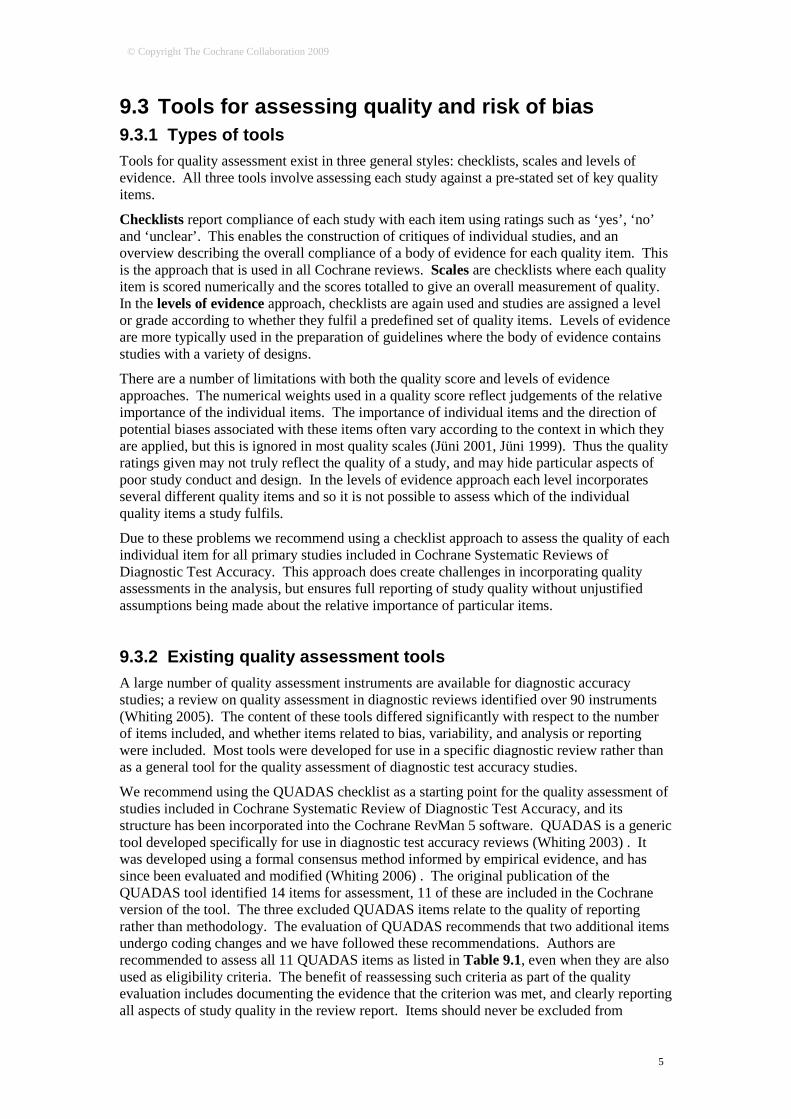
9.4.6 Incorporation (item 6) Was the reference standard independent of the index test (i.e. the index test did not form part of the reference standard)?
In some primary studies, the reference standard is ascertained through a panel of tests, or on the basis of information collected over a prolonged period of investigation (for example, as in a hospital discharge diagnosis). When the result of the index test is used in establishing the reference standard, incorporation bias may occur (Ransohoff 1978, Worster 2008). Incorporation of the index test in the reference standard panel is likely to increase the amount of agreement between index test results and the reference standard thereby overestimating diagnostic accuracy. An example would be a study examining the accuracy of magnetic resonance imaging (MRI) in diagnosing multiple sclerosis where the reference standard is the
© Copyright The Cochrane Collaboration 2009
15
final diagnosis based on all available information, including MRI results, cerebrospinal fluid (CSF) analysis and clinical follow-up of patients. Lack of blinding of the results of the index test to the reference standard (see next item) alone does not automatically imply that these results are a formal part of the reference standard, although the distinction between incorporation bias and review bias is sometimes difficult to make (Mower 1999).
Was the reference standard independent of the index test (i.e. the index test did not form part of the reference standard)?
Pre-specify in protocol: No details are usually needed. Code this item: Yes If the index test did not form part of the reference standard. No If the reference standard formally included the result of the
index test. Unclear If it is unclear whether the results of the index test were used in
the final diagnosis. Where facts may be found: Definitions of the reference standard in the methods section. What detail needs to be reported: Statements from the study about the tests used in the reference
standard procedure.
9.4.7 Test and diagnostic review (items 7 and 8) Were the reference standard results interpreted without knowledge of the results of the index test? Were the index test results interpreted without knowledge of the results of the reference standard?
These items are similar to the issue of ‘blinded outcome assessment’ in intervention studies. Interpretation of the results of the index test may be influenced by knowledge of the results of the reference standard (known as test review bias), and vice versa (known as diagnostic review bias) (Ransohoff 1978). The extent to which test results can be influenced depends on the degree of subjectivity involved in interpreting the test. When an index test requires a more subjective reading, interpreters are more likely to be influenced by the results of the reference standard than for a fully automated test. It is therefore important to consider the topic area that you are reviewing and to determine whether the interpretation of the index test or reference standard could be influenced by knowledge of the results of the other test. Empirical evidence shows that both diagnostic and test review bias increase sensitivity, but no systematic effect on specificity has been noted (Whiting 2004). Whether or not blinding was undertaken in a study may not be stated explicitly, but where index and reference tests are undertaken and interpreted in a clear order, it will be evident that the first test must have been undertaken blind to the results of the second. Where index and reference tests were undertaken by different individuals a degree of ambiguity may exist as to what information was available for each test. In some instances, knowledge of standard laboratory practices may allow reasonable assumptions to be made (for example, where samples are sent in batches to an independent laboratory), but confirmation from the authors is always desirable.
Where a study compares two or more index tests extra issues of the degree of blinding between index tests arise. Whether or not this is required will depend on the proposed role of the test. If one test is proposed as a replacement for the other, then blinding is needed; if it is proposed as an additional test the requirement for blinding is not so justifiable and may be in conflict with the next quality item.

© Copyright The Cochrane Collaboration 2009
16
Were the reference standard results interpreted without knowledge of the results of the index test? Were the index test results interpreted without knowledge of the results of the reference standard?
Pre-specify in protocol: No details are usually needed. Code this item: Yes If test results (index or reference standard) were interpreted blind to
the results of the other test, or blinding is dictated by the test order, or meets the pre-stated assumptions.
No If it is clear that one set of test results was interpreted with knowledge of the other.
Unclear If it is unclear whether blinding took place. Where facts may be found: Details of blinding and processes may be described in the methods
section outlining testing methods. Description required: Any clear order of the tests, and methods used to ensure blinding (such
as using code numbers, retrospective testing of samples) should be described. Any ambiguous phrases which are interpreted as indicating or not indicating blinding should be stated.
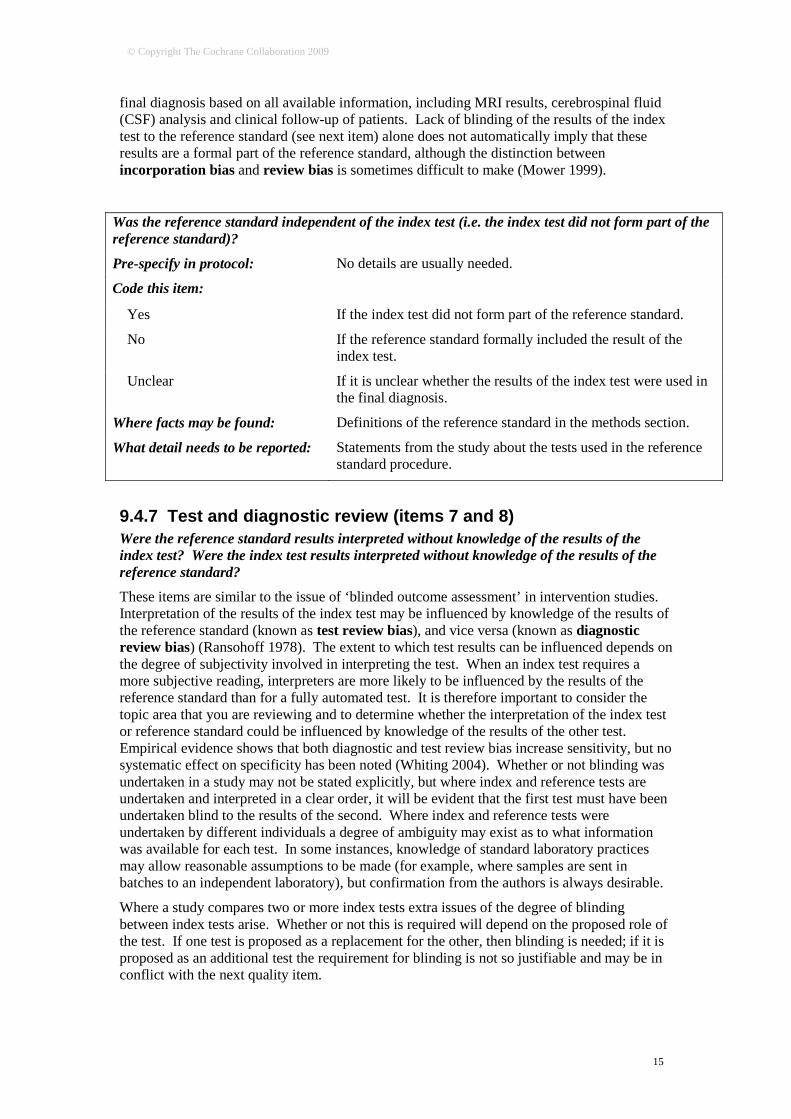
9.4.8 Clinical review (item 9) Were the same clinical data available when test results were interpreted as would be available when the test is used in practice?
For some index tests, the availability or absence of relevant patient information (such as age, gender, presence and severity of symptoms, and other test results) when the test is undertaken may affect its performance (Whiting 2004, Mower 1999). For example, the examination of many images is guided by knowledge of the nature and location of presenting symptoms. Where tests report an objective measurement (such as a biochemical assay) which is unaltered by external information, an unbiased estimate of test accuracy may be obtained by interpreting it in isolation from other clinical information.
Where diagnostic accuracy may be enhanced by the context given by clinical information, it is important that index tests are evaluated with the same clinical information available as would occur in practice. However, there can then be difficulties in separating the diagnostic value of the pre-existing clinical information from the added value of the index test, unless a comparison can be made to isolate the incremental value of the new test. This should be considered when choosing the comparator in the review objectives. Studies have shown that the availability of clinical information to the person interpreting the results of the index test increases sensitivity with less effect on specificity (Whiting 2004, Loy 2004).
© Copyright The Cochrane Collaboration 2009
17
Were the same clinical data available when test results were interpreted as would be available when the test is used in practice?
Pre-specify in protocol: Pre-specify key clinical data which are normally available in practice when tests are undertaken and interpreted, or state that no data are usually available if that is the case.
Code this item: Yes If the clinical data available met the pre-specified criteria. No If clinical data usually available were withheld, or if more
information than is usually available was provided. Unclear If information about the clinical data available was not stated. Where facts may be found: The description of the tests’ processes in the methods section may
include this information. Description required: Key data that were available when tests were interpreted.
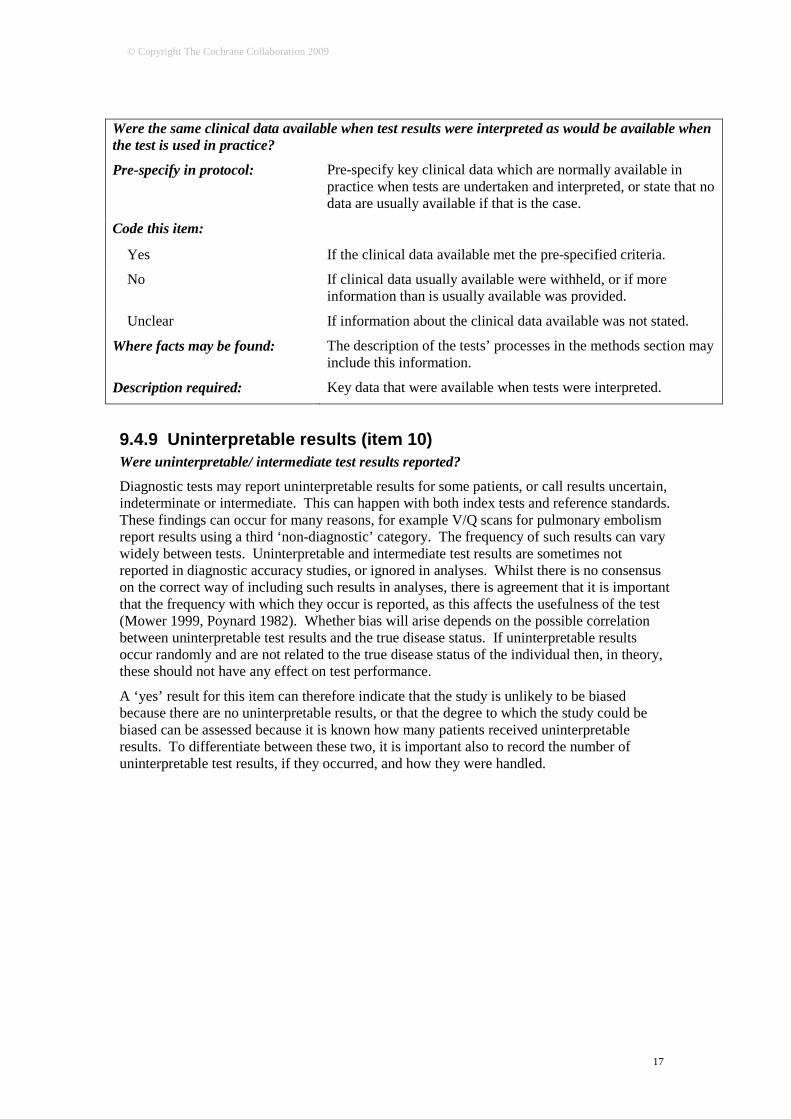
9.4.9 Uninterpretable results (item 10) Were uninterpretable/ intermediate test results reported?
Diagnostic tests may report uninterpretable results for some patients, or call results uncertain, indeterminate or intermediate. This can happen with both index tests and reference standards. These findings can occur for many reasons, for example V/Q scans for pulmonary embolism report results using a third ‘non-diagnostic’ category. The frequency of such results can vary widely between tests. Uninterpretable and intermediate test results are sometimes not reported in diagnostic accuracy studies, or ignored in analyses. Whilst there is no consensus on the correct way of including such results in analyses, there is agreement that it is important that the frequency with which they occur is reported, as this affects the usefulness of the test (Mower 1999, Poynard 1982). Whether bias will arise depends on the possible correlation between uninterpretable test results and the true disease status. If uninterpretable results occur randomly and are not related to the true disease status of the individual then, in theory, these should not have any effect on test performance.
A ‘yes’ result for this item can therefore indicate that the study is unlikely to be biased because there are no uninterpretable results, or that the degree to which the study could be biased can be assessed because it is known how many patients received uninterpretable results. To differentiate between these two, it is important also to record the number of uninterpretable test results, if they occurred, and how they were handled.

© Copyright The Cochrane Collaboration 2009
18
Were uninterpretable/ intermediate test results reported?
Pre-specify in protocol: No details are usually needed. Code this item: Yes If the number of uninterpretable test results is stated, or if the
number of results reported agrees with the number of patients recruited (indicating no uninterpretable test results).
No If it states that uninterpretable test results occurred or were excluded and does not report how many.
Unclear If it is not possible to work out whether uninterpretable results occurred.
Where facts may be found:
The numbers of uninterpretable test results may be reported in the results section, and in patient flow diagrams. How uninterpretable results were handled in the analysis may be stated in the statistical methods section.
Description required: It is important to record the number of uninterpretable test results, and to describe how they have been handled in the analysis.
9.4.10 Withdrawals (item 11) Were withdrawals from the study explained?
Withdrawals occur when patients drop out from the study before the results of either or both of the index test and reference standard are known. In truly cross-sectional studies this is unlikely to occur, but where the reference standard includes a degree of follow-up it is a possibility. Patients may also be excluded post-hoc from the study if they are found to contravene the protocol (either because they are later found to be ineligible, or the tests are not undertaken in the manner or at the time specified), or data and samples may be lost. All withdrawals and missing data in this item occur through problems in the execution of the study. This distinguishes it from ‘uninterpretable results’ (item 10) where missing data occurs because of problems inherent in the test.
If patient loss to follow-up somehow relates to disease state or to any test result, then estimates of test performance may be biased. The approach to handling losses has great potential for biasing the results, but again, incomplete reporting hampers the empiric evaluation of this problem.
As with the previous item, a ‘yes’ result can indicate that the study is unlikely to be biased because there are no withdrawals or missing results, or that the degree to which the study could be biased can be assessed because it is known how many patients withdrew or had missing results. To differentiate between these two, it is again important also to record the number of withdrawals or missing test results, if they occurred, and to describe how they were handled.

© Copyright The Cochrane Collaboration 2009
19
Were withdrawals from the study explained?
Pre-specify in protocol: No details are usually needed. Code this item: Yes If it is clear what happened to all patients who entered the
study, for example if a flow diagram of study participants is reported explaining any withdrawals or exclusions, or the numbers recruited match those in the analysis.
No If it appears that some of the patients who entered the study did not complete the study, i.e. did not receive both the index test and reference standard, and these patients were not accounted for.
Unclear If it is unclear how many patients entered and hence whether there were any withdrawals.
Where facts may be found: Details of withdrawals may be mentioned in the results section, and documented in a patient flow diagram, if available.
Description required: Numbers withdrawing from the study and reasons, if known.
9.5 Presentation of assessments of methodological quality assessments
Results of methodological quality assessments can be presented in three ways in Cochrane Systematic Reviews of Diagnostic Test Accuracy. The Characteristics of Included Studies Table contains two sections for each study, first a description of the study characteristics (see Chapter 4), and second a tabulation of the methodological quality items. In the tabulation of Methodological Quality each item is presented with both the judgement and the description as explained in the discussion of each of the QUADAS items. If no description is entered for an item, the item is automatically coded as unclear and will not be included in the published review.
Whilst tabulation of the full details of the study methodology is important to document all features of the included studies, the tables do not provide a useful succinct synthesis of the key quality concerns. Two graphical methods are available to do this in Cochrane reviews. A methodological quality summary figure (Figure 9.1) presents, for each included study, the ‘yes’, ‘no’ and ‘unclear’ judgements for each quality assessment item in graphical form. A methodological quality graph (Figure 9.2) presents, for each quality assessment item, the percentage of included studies that rate the item ‘yes’, ‘no’ and ‘unclear’ in a stacked bar chart. The methodological quality graph gives readers a quick overview of the study quality within the whole review.

© Copyright The Cochrane Collaboration 2009
20
Figure 9.1
Methodological quality summary
(from Leeflang 2008)
Figure 9.2
Methodological quality graph
(from Leeflang 2008)

© Copyright The Cochrane Collaboration 2009
21
9.6 Summary assessments of methodological quality In addition to presenting the data, it is essential that a textual summary of the quality concerns is included in the review. This summary places the results of the methodological quality assessment in the clinical context, and provides a narrative guide to the likely severity and direction of the possible biases.
Some quality concerns flagged by the ‘no’ judgements in the assessment process may have little impact. This will be the case if the magnitude of the concern is small (for example, if there was partial verification or withdrawals, but only a very small number of individuals were involved) or if analytical methods were employed to correct for the problem (for example, adjustments for partial verification of index test positives and negatives).
Moreover, some of the ‘yes’ judgements may hide problems. For example, the indeterminate results and withdrawal items in QUADAS can be coded ‘yes’ if there are many withdrawals or indeterminate results.
Another concern that may arise in test accuracy studies is that aspects of quality may trade off against each other. For example, if the best reference standard for a target condition is a highly invasive test (such as findings at surgery), studies which use it may be compromised because they can only recruit participants with a limited spectrum of disease (here only patients likely to benefit from surgery). Thus it may be challenging to identify studies of higher quality.
In preparing a narrative summary the review author needs to reconsider each quality item, the frequency of ‘no’ and ‘unclear’ judgements, the empirical evidence that exists about bias being produced by that mechanism, the way in which the bias would act in the particular clinical situation, and report a considered judgement of the degree to which the results of each test in the review may be compromised. Where test accuracy appears likely to vary with patient characteristics it may be best to investigate effects and pool subgroups of studies as described Chapter 10 for investigations of heterogeneity,
9.7 Incorporating assessments into the review Once the methodological quality of the studies included in the review has been assessed and documented a review author should consider how the information collated should be considered in the analysis and when drawing conclusions from the review. Below we consider this in three stages. First, a review author can investigate whether there are relationships evident in the review between the quality concerns and study findings, either by graphical or statistical methods (meta-regression). Second, a review author needs to decide on a strategy by which the overall estimates of the accuracy of the test or comparisons of tests are made given the knowledge of the methodological quality of the included studies, and relationships between quality and risk of bias. Finally, the inadequacies of the existing studies need to be considered when making proposals for future research.
9.7.1 Exploring the impact of poor methodological quality A systematic review provides an opportunity to attempt to investigate how features of study design, execution and reporting may impact on study findings. A major challenge to these investigations is the small number of studies often available.
9.7.1.1 Graphing results Two different plots, the paired forest plot, and the summary ROC plot can be used in Cochrane reviews to report the results of the individual studies (see Chapter 10). The basic forest plot reports the study results both numerically and graphically. It is possible to add

© Copyright The Cochrane Collaboration 2009
22
information about methodological quality to the paired forest plots. This can be done by either adding a column to report the quality judgements for each study, or by grouping or ordering studies according to the values of one or more quality items. Although it is often difficult to observe patterns in a paired forest plot, large effects may be evident.
On a summary ROC plot each study is plotted at its observed sensitivity and specificity values. Studies on ROC plots can also be grouped according to judgements for quality items, which can be indicated on the plot by using different colours and plotting symbols. If separate meta-analyses are undertaken for studies in each subgroup the related summary ROC curves can also be plotted. From such plots, it may be possible to discern the manner in which quality criteria impact on sensitivity and specificity, if there is a clear effect and adequate numbers of studies.
9.7.1.2 Meta-regression analyses This method of incorporating quality into the review involves the consideration of individual quality items as potential sources of heterogeneity. The meta-analysis model is extended by including the quality assessment item as a covariate. Multilevel regression models then enable the meta-analyst to estimate the impact of a quality item on test accuracy, and test whether there are statistically significant differences in accuracy between subgroups of studies with and without a certain quality feature. It is normal in such analyses to consider each item as a binary indicator, most likely by combining the ‘unclear’ judgements with the ‘no’ judgements. In the hierarchical summary ROC model (HSROC), differences in the diagnostic odds ratio, the threshold parameter and the shape of the curves can be tested, whereas the bivariate model can estimate the impact of the quality item on sensitivity and specificity. Such analyses, however, are restricted by the number of studies available, and often have inadequate power to detect the impact of aspects of quality on accuracy estimates (Westwood 2005, Leeflang 2007). Detection of effects may often be better achieved through meta-epidemiological studies. In most circumstances it is sensible to try to model the impact of each quality item individually. Only when large numbers of studies are available is it possible to consider several items simultaneously.
A more detailed discussion of methods for investigating heterogeneity is provided in Chapter 10. Please read this Chapter carefully when deciding how to investigate individual quality items as potential sources of heterogeneity.
9.7.2 Including quality assessments in meta-analyses Inevitably a review ends up trading off a desire to minimise bias with a desire to increase precision. Precision is most likely to be increased by including as many studies as possible, whereas bias is likely to be minimised by restricting the number of studies to those with the fewest concerns.
Possible analysis strategies include the following: 9.7.2.1 Present all studies with a narrative summary of quality The simplest approach to incorporating quality in an analysis, is to pool all the studies, and to make a judgement from the overall assessment of study quality as to the likelihood that the meta-analytical estimates are both relevant and close to the truth. The particular biases to which the overall result may be susceptible can be delineated and discussed. However, such an approach can be difficult when different studies are susceptible to different biases, and the concerns about the possible biases are likely to be ignored when the results of the study are considered for application for policy purposes.

© Copyright The Cochrane Collaboration 2009
23
9.7.2.2 Primary analysis restricted to high quality studies only Another approach is to exclude studies that fail to meet some standard of quality or level of evidence. This is a sensitivity analysis (see Chapter 10 for more details), and focuses on identifying the most valid answer to the review question, at the cost of increasing imprecision. If this approach is undertaken, the particular important biases threatening the primary studies in a given field need to be specified, and the subgroup of studies which are not susceptible identified. Such an analysis can be argued as important to ensure that the results of the best studies are not compromised by including poorer research in the analysis.
9.7.2.3 Present multiple analyses Given the lack of consensus on the critical quality domains, it may be tempting to include in a review multiple analyses produced by making different assumptions as to what constitutes acceptable quality. Whilst such an exercise may be academically illuminating, it may be confusing to a reader, who may fail to identify which of the various answers to the review questions should be used.
9.7.2.4 Other methods of incorporating quality in the analysis (not
recommended for Cochrane reviews) There are a number of methods for incorporating quality into a review that require the use of quality scores or a ‘levels of evidence’ approach. As discussed above, there are methodological issues in assigning weights to quality items to produce a quality score, and in selecting the criteria to define each level of evidence. For these reasons we do not support the use of these methods.We merely name these methods to give readers an overview of all methods that have been used in either the therapeutic or the diagnostic field.
A direct method of incorporating quality is to use the quality score to weight the statistical pooling. The usual study weights (inverse of the variance of the effect estimate or sample size) are multiplied by the quality score, meaning that ‘high quality’ studies receive more weight and the impact of ‘lower quality’ studies is decreased. Whilst such analyses have been undertaken for randomized trials of interventions, we are not aware of the method being applied in systematic reviews of diagnostic test accuracy.
More advanced Bayesian methodology has also been applied in the synthesis of intervention studies which include estimates of the likely bias to give less weight to poorer quality studies. In theory, these methods could also be applied in reviews of test accuracy.
Another approach would be to use the summary quality score in a regression analysis to investigate the association of quality with estimates of test performance. Levels of evidence can also be used as a variable in a regression analysis, or sensitivity analyses can be carried out in which the results of studies fulfilling different ‘levels’ are compared.
9.7.3 Using quality assessments to make recommendations for future research
One final method of incorporating quality into the review is for recommendations for future research. The quality assessment will highlight the methodological flaws in current studies in the review area. These can be highlighted as factors that should be considered and improved in future studies in the area.
9.8 Chapter information Authors: Hans Reitsma, Anne Rutjes, Penny Whiting, Vasiliy Vlassov, Mariska Leeflang and Jon Deeks.
© Copyright The Cochrane Collaboration 2009
24
This chapter should be cited as: Reitsma JB, Rutjes AWS, Whiting P, Vlassov VV, Leeflang MMG, Deeks JJ. Chapter 9: Assessing methodological quality. In: Deeks JJ, Bossuyt PM, Gatsonis C (editors), Cochrane Handbook for Systematic Reviews of Diagnostic Test Accuracy Version 1.0.0. The Cochrane Collaboration, 2009. Available from: http://srdta.cochrane.org/. Acknowledgements:
Anne Eisinga for detailed proof reading.
9.9 References Begg 1987 Begg CB. Biases in the assessment of diagnostic tests. Statistics in Medicine 1987; 6: 411-423.
Begg 1983 Begg CB, Greenes RA. Assessment of diagnostic tests when disease verification is subject to selection bias. Biometrics 1983; 39: 207-215.
Berlin 1997 Berlin JA. Does blinding of readers affect the results of meta-analyses? University of Pennsylvania Meta-analysis Blinding Study Group. The Lancet 1997; 350: 185-186.
Biesheuvel 2007 Biesheuvel C, Irwig L, Bossuyt P. Observed differences in diagnostic test accuracy between patient subgroups: is it real or due to reference standard misclassification? Clinical Chemistry 2007; 53: 1725-1729.
Bossuyt 2003a Bossuyt PM, Reitsma JB, Bruns DE, Gatsonis CA, Glasziou PP, Irwig LM, Lijmer JG, Moher D, Rennie D, de Vet HC. Towards complete and accurate reporting of studies of diagnostic accuracy: The STARD Initiative. Annals of Internal Medicine 2003; 138: 40-44.
Bossuyt 2003b Bossuyt PM, Reitsma JB, Bruns DE, Gatsonis CA, Glasziou PP, Irwig LM, Moher D, Rennie D, de Vet HC, Lijmer JG. The STARD statement for reporting studies of diagnostic accuracy: explanation and elaboration. Annals of Internal Medicine 2003; 138: W1-12.
Boyko 1988 Boyko EJ, Alderman BW, Baron AE. Reference test errors bias the evaluation of diagnostic tests for ischemic heart disease. Journal of General Internal Medicine 1988; 3: 476-481.
Chock 1997 Chock C, Irwig L, Berry G, Glasziou P. Comparing dichotomous screening tests when individuals negative on both tests are not verified. Journal of Clinical Epidemiology 1997; 50: 1211-1217.
Diamond 1991 Diamond GA. Affirmative actions: can the discriminant accuracy of a test be determined in the face of selection bias? Medical Decision Making 1991; 11: 48-56. Glas 2003 Glas AS, Roos D, Deutekom M, Zwinderman AH, Bossuyt PM, Kurth KH. Tumor markers in the diagnosis of primary bladder cancer. A systematic review. Journal of Urology 2003; 169: 1975-1982. Glasziou 2008 Glasziou P, Irwig L, Deeks JJ. When should a new test become the current reference standard? Annals of Internal Medicine 2008; 149: 816-822.

© Copyright The Cochrane Collaboration 2009
25
Higgins 2008 Higgins JPT, Altman DG (editors). Chapter 8: Assessing risk of bias in included studies. In: Higgins JPT, Green S (editors). Cochrane Handbook for Systematic Reviews of Interventions. (Cochrane Book Series). Chichester, UK: The Cochrane Collaboration and John Wiley & Sons, 2008: 187-241.
Ioannidis 1998 Ioannidis JP, Lau J. Can quality of clinical trials and meta-analyses be quantified? The Lancet 1998; 352: 590-591.
Jadad 1996 Jadad AR, Moore RA, Carroll D, Jenkinson C, Reynolds DJ, Gavaghan DJ, McQuay HJ. Assessing the quality of reports of randomized clinical trials: is blinding necessary? Controlled Clinical Trials 1996; 17: 1-12.
Jüni 2001 Jüni P, Altman DG, Egger M. Systematic reviews in health care: Assessing the quality of controlled clinical trials. BMJ 2001; 323: 42-46.
Jüni 1999 Jüni P, Witschi A, Bloch R, Egger M. The hazards of scoring the quality of clinical trials for meta-analysis. JAMA 1999; 282: 1054-1060.
Kjaergard 2001 Kjaergard LL, Villumsen J, Gluud C. Reported methodologic quality and discrepancies between large and small randomized trials in meta-analyses. Annals of Internal Medicine 2001; 135: 982-989.
Leeflang 2007 Leeflang M, Reitsma J, Scholten R, Rutjes A, Di Nisio M, Deeks J, Bossuyt P. Impact of adjustment for quality on results of metaanalyses of diagnostic accuracy. Clinical Chemistry 2007; 53: 164-172.
Leeflang 2008 Leeflang MM, Debets-Ossenkopp YJ, Visser CE, Scholten RJ, Hooft L, Bijlmer HA, Reitsma JB, Bossuyt PM, Vandenbroucke-Grauls CM. Galactomannan detection for invasive aspergillosis in immunocompromized patients. Cochrane Database of Systematic Reviews 2008;(4):CD007394.
Leeflang 2009 Leeflang MM, Bossuyt PM, Irwig L. Diagnostic test accuracy may vary with prevalence: implications for evidence-based diagnosis. Journal of Clinical Epidemiology 2009; 62: 5-12.
Lijmer 1999 Lijmer JG, Mol BW, Heisterkamp S, Bonsel GJ, Prins MH, van der Meulen JH, Bossuyt PM. Empirical evidence of design-related bias in studies of diagnostic tests. JAMA 1999; 282: 1061-1066.
Loy 2004 Loy CT, Irwig L. Accuracy of diagnostic tests read with and without clinical information: a systematic review. JAMA 2004; 292: 1602-1609.
Lumbreras-Lacarra 2004 Lumbreras-Lacarra B, Ramos-Rincón JM, Hernández-Aguado I. Methodology in diagnostic laboratory test research in clinical chemistry and clinical chemistry and laboratory medicine. Clinical Chemistry 2004; 50: 530-536.
Moher 1996 Moher D, Jadad AR, Tugwell P. Assessing the quality of randomized controlled trials. Current issues and future directions. International Journal of Technology Assessment in Health Care 1996; 12: 195-208.

© Copyright The Cochrane Collaboration 2009
26
Mol 1999 Mol BW, Lijmer JG, van der Meulen J, Pajkrt E, Bilardo CM, Bossuyt PM. Effect of study design on the association between nuchal translucency measurement and Down syndrome. Obstetrics and Gynecology 1999; 94: 864-869.
Mower 1999 Mower WR. Evaluating bias and variability in diagnostic test reports. Annals of Emergency Medicine 1999; 33: 85-91.
Mulherin 2002 Mulherin SA, Miller WC. Spectrum bias or spectrum effect? Subgroup variation in diagnostic test evaluation. Annals of Internal Medicine 2002; 137: 598-602.
Naylor 1997 Naylor CD. Meta-analysis and the meta-epidemiology of clinical research. BMJ 1997; 315: 617-619.
Pai 2003 Pai M, Flores LL, Pai N, Hubbard A, Riley LW, Colford JM, Jr. Diagnostic accuracy of nucleic acid amplification tests for tuberculous meningitis: a systematic review and meta-analysis. The Lancet Infectious Diseases 2003; 3: 633-643.
Pepe 2001 Pepe MS, Alonzo TA. Comparing disease screening tests when true disease status is ascertained only for screen positives. Biostatistics 2001; 2: 249-260.
Pepe 2008 Pepe MS, Feng Z, Janes H, Bossuyt PM, Potter JD. Pivotal evaluation of the accuracy of a biomarker used for classification or prediction: standards for study design. Journal of the National Cancer Institute 2008; 100: 1432-1438.
Philbrick 1982 Philbrick JT, Horwitz RI, Feinstein AR, Langou RA, Chandler JP. The limited spectrum of patients studied in exercise test research. Analyzing the tip of the iceberg. JAMA 1982; 248: 2467-2470.
Poynard 1982 Poynard T, Chaput JC, Etienne JP. Relations between effectiveness of a diagnostic test, prevalence of the disease, and percentages of uninterpretable results. An example in the diagnosis of jaundice. Medical Decision Making 1982; 2: 285-297.
Ransohoff 1978 Ransohoff DF, Feinstein AR. Problems of spectrum and bias in evaluating the efficacy of diagnostic tests. New England Journal of Medicine 1978; 299: 926-930.
Reid 1995 Reid MC, Lachs MS, Feinstein AR. Use of methodological standards in diagnostic test research. Getting better but still not good. JAMA 1995; 274: 645-651.
Reitsma 2009 Reitsma JB, Rutjes AW, Khan KS, Coomarasamy A, Bossuyt PM. A review of solutions for diagnostic accuracy studies with an imperfect or missing reference standard. Journal of Clinical Epidemiology 2009; 62: 797-806.
Rutjes 2005 Rutjes AW, Reitsma JB, Vandenbroucke JP, Glas AS, Bossuyt PM. Case-control and two-gate designs in diagnostic accuracy studies. Clinical Chemistry 2005; 51: 1335-1341.
Rutjes 2006 Rutjes AW, Reitsma JB, Di Nisio M, Smidt N, van Rijn JC, Bossuyt PM. Evidence of bias and variation in diagnostic accuracy studies. CMAJ 2006; 174: 469-476.

© Copyright The Cochrane Collaboration 2009
27
Smidt 2005 Smidt N, Rutjes AW, van der Windt DA, Ostelo RW, Reitsma JB, Bossuyt PM, Bouter LM, de Vet HC. Quality of reporting of diagnostic accuracy studies. Radiology 2005; 235: 347-353.
Smidt 2006 Smidt N, Rutjes AW, van der Windt DA, Ostelo RW, Bossuyt PM, Reitsma JB, Bouter LM, de Vet HC. The quality of diagnostic accuracy studies since the STARD statement: has it improved? Neurology 2006; 67: 792-797.
Stein 1993 Stein PD, Gottschalk A, Henry JW, Shivkumar K. Stratification of patients according to prior cardiopulmonary disease and probability assessment based on the number of mismatched segmental equivalent perfusion defects. Approaches to strengthen the diagnostic value of ventilation/perfusion lung scans in acute pulmonary embolism. Chest 1993; 104: 1461-1467.
Sterne 2002 Sterne JA, Juni P, Schulz KF, Altman DG, Bartlett C, Egger M. Statistical methods for assessing the influence of study characteristics on treatment effects in 'meta-epidemiological' research. Statistics in Medicine 2002; 21: 1513-1524.
van Rijkom 1995 van Rijkom HM, Verdonschot EH. Factors involved in validity measurements of diagnostic tests for approximal caries--a meta-analysis. Caries Research 1995; 29: 364-370.
Verhagen 2001 Verhagen AP, de Vet HC, de Bie RA, Boers M, van den Brandt PA. The art of quality assessment of RCTs included in systematic reviews. Journal of Clinical Epidemiology 2001; 54: 651-654.
Westwood 2005 Westwood ME, Whiting PF, Kleijnen J. How does study quality affect the results of a diagnostic meta-analysis? BMC Medical Research Methodology 2005; 5: 20.
Whiting 2003 Whiting P, Rutjes AW, Reitsma JB, Bossuyt PM, Kleijnen J. The development of QUADAS: a tool for the quality assessment of studies of diagnostic accuracy included in systematic reviews. BMC Medical Research Methodology 2003; 3: 25.
Whiting 2004 Whiting P, Rutjes AW, Reitsma JB, Glas AS, Bossuyt PM, Kleijnen J. Sources of variation and bias in studies of diagnostic accuracy: a systematic review. Annals of Internal Medicine 2004; 140: 189-202.
Whiting 2005 Whiting P, Rutjes AW, Dinnes J, Reitsma JB, Bossuyt PM, Kleijnen J. A systematic review finds that diagnostic reviews fail to incorporate quality despite available tools. Journal of Clinical Epidemiology 2005; 58: 1-12.
Whiting 2006 Whiting PF, Westwood ME, Rutjes AW, Reitsma JB, Bossuyt PN, Kleijnen J. Evaluation of QUADAS, a tool for the quality assessment of diagnostic accuracy studies. BMC Medical Research Methodology 2006; 6: 9.
Worster 2008 Worster A, Carpenter C. Incorporation bias in studies of diagnostic tests: how to avoid being biased about bias. CJEM 2008; 10: 174-175.
Zhou 1998 Zhou XH. Correcting for verification bias in studies of a diagnostic test's accuracy. Statistical Methods in Medical Research 1998; 7: 337-353.