third quarterly project tracking report … 2017 quarterly project tracking... · $979 $545 $1,748...
TRANSCRIPT

THIRD QUARTERLY
PROJECT TRACKING
REPORT 2017 July 2017

Southwest Power Pool, Inc.
CONTENTS
Executive Summary ................................................................................................................................................................ 3
NTC Project Summary ........................................................................................................................................................... 5
NTC Issuance................................................................................................................................................................................................ 7
NTC Withdraw ............................................................................................................................................................................................. 7
Completed Projects ................................................................................................................................................................................... 8
Project status summary ........................................................................................................................................................................ 10
Priority Projects ..................................................................................................................................................................... 12
Out-of-Bandwidth Projects ................................................................................................................................................ 14
Responsiveness Report ....................................................................................................................................................... 16
Appendix 1 ............................................................................................................................................................................... 18

Southwest Power Pool, Inc.
Q3 2017 Project Tracking Report 3
EXECUTIVE SUMMARY
SPP actively monitors and supports the progress of transmission expansion projects, emphasizing
the importance of maintaining accountability for areas such as regional grid reliability standards,
firm transmission commitments, and Tariff cost recovery.
SPP staff solicits quarterly feedback from the project owners to determine the progress of each
approved transmission project. This quarterly report charts the progress of all SPP Transmission
Expansion Plan (STEP) projects approved by the SPP Board of Directors (Board) or through a FERC
filed service agreement under the SPP Open Access Transmission Tariff (OATT).
The reporting period is February 1, 2017 through April 30, 2017. Table 1 provides a summary of all
projects in the current Project Tracking Portfolio (PTP), which includes all Network Upgrades in
which construction activities are ongoing, or construction has completed but not all the close-out
requirements have been fulfilled in accordance with Section 13 of Business Practice 7060. The PTP
includes all active Network Upgrades including transmission lines, transformers, substations, and
devices.
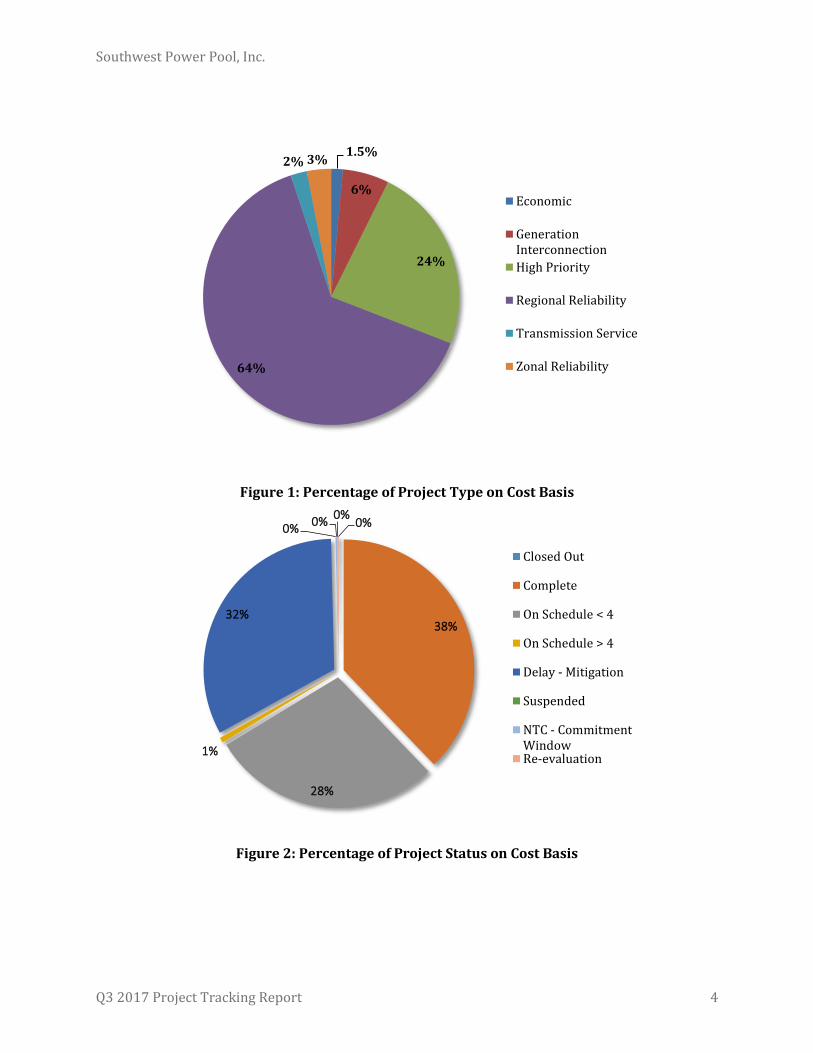
Table 1 below summarizes the PTP for this quarter. Figures 1 reflects the percentage cost of each
upgrade type in the PTP. Figure 2 shows the percentage cost of each project status in the PTP.
Upgrade Type No. of Upgrades Estimated Cost Miles of
New Miles of Rebuild
Miles of Voltage
Conversion
Economic 20 $71,937,774 5.6 0.0 28.8
High Priority 61 $1,140,193,631 757.7 5.1 0.0
Regional Reliability 316 $3,097,128,342 1554.5 377.1 457.1
Transmission Service 18 $100,558,093 12.9 15.3 0.0
Zonal Reliability 9 $147,436,190 34.7 26.9 0.0
NTC Projects Subtotal 424 $4,557,254,031 2365.5 424.3 485.9
Generation Interconnection 84 $283,332,302 0.0 0.0 0.0 Regional Reliability - Non
OATT 1 $7,107,090 0.0 0.0 0.0
TO - Sponsored 2 $14,519,000 10.7 0.0 0.0
Non-NTC Projects Subtotal 87 $304,958,392 10.7 0.0 0.0
Total 511 $4,862,212,422 2376.2 424.3 485.9
Table 1: Q3 2017 Portfolio Summary
Southwest Power Pool, Inc.
Q3 2017 Project Tracking Report 4
Figure 1: Percentage of Project Type on Cost Basis
Figure 2: Percentage of Project Status on Cost Basis
1.5%
6%
24%
64%
2% 3%
Economic
GenerationInterconnection
High Priority
Regional Reliability
Transmission Service
Zonal Reliability
0%
38%
28%
1%
32%
0%0%
0%
Closed Out
Complete
On Schedule < 4
On Schedule > 4
Delay - Mitigation
Suspended
NTC - CommitmentWindowRe-evaluation

Southwest Power Pool, Inc.
Q3 2017 Project Tracking Report 5
NTC PROJECT SUMMARY
In adherence to the OATT and Business Practice 7060, SPP issues Notifications to Construct (NTCs)
to Designated Transmission Owners (DTOs) to begin work on Network Upgrades that have been
approved or endorsed by the SPP Board to meet the construction needs of the STEP, OATT, or
Regional Transmission Organization (RTO).
Figure 3 reflects project status within each source study, and Table 2 provides the supporting data.
Figure 4 shows the amount of estimated cost by in-service year for all Network Upgrades that have
been issued an NTC or Notifications to Construct with Conditions (NTC-C). Note: Figures 3 and 4,
and Table 2 provide data for all projects for which SPP has issued an NTC or NTC-C,
regardless of completion date, and therefore include data from Network Upgrades no longer
included in PTP.
Figure 3: Project Status by NTC Source Study
Figure 3: Project Status by NTC Source Study
$0
$200
$400
$600
$800
$1,000
$1,200
$1,400On Schedule
Suspended
Delayed
Complete
$ M
illi
on

Southwest Power Pool, Inc.
Q3 2017 Project Tracking Report 6
Source Study Complete Delayed Suspended On Schedule Total
2006 STEP $202,493,500 $0 $0 $0 $202,493,500
2007 STEP $498,733,734 $1,050,000 $0 $0 $499,783,734
2008 STEP $415,126,157 $0 $0 $0 $415,126,157 Balanced Portfolio $834,724,320 $0 $0 $0 $834,724,320
2009 STEP $533,469,214 $1,441,050 $0 $0 $534,910,264 Priority Projects $1,272,261,003 $0 $0 $76,500,000 $1,348,761,003
2010 STEP $109,968,782 $4,041,273 $0 $0 $114,010,055
2012 ITPNT $182,110,561 $4,363,510 $0 $0 $186,474,071
2012 ITP10 $105,901,240 $342,148,981 $0 $314,259,556 $762,309,777
2013 ITPNT $328,940,158 $135,172,767 $0 $41,462,612 $505,575,537
2014 ITPNT $146,012,531 $333,951,469 $0 $104,457,095 $584,421,095
HPILS $222,670,305 $80,624,129 $0 $379,788,613 $683,083,046
2015 ITPNT $74,216,215 $133,497,595 $0 $6,976,873 $214,690,683
2015 ITP10 $0 $0 $0 $50,536,991 $50,536,991 IS Integration Study $223,284,902 $38,000,000 $0 $111,000,000 $372,284,902
2016 ITPNT $75,638,261 $426,300,387 $0 $38,230,111 $540,168,759
2017 ITP10 $0 $0 $0 $9,735,964 $9,735,964
Ag Studies $690,017,190 $104,038,769 $0 $83,957,379 $878,013,338
DPA Studies $179,431,455 $5,270,233 $0 $16,842,293 $201,543,981
GI Studies $618,129,114 $20,000 $0 $160,077,233 $778,226,347
Total $6,713,128,642 $1,609,920,163 $0 $1,393,824,718 $9,716,873,524
Table 2: Project Status by NTC Source Study
Figure 4: Estimated Cost for NTC Project per In-Service Year
$0
$200
$400
$600
$800
$1,000
$1,200
$1,400
$1,600
$1,800
$58 $59$186
$340
$391
$348
$979
$545
$1,748
$737
$1,412
$613
$1,179$885
$198$55
New Q3 2017 NTC
Modified Q3 2017 NTC
Previous NTC
$ M
illi
on
Southwest Power Pool, Inc.
Q3 2017 Project Tracking Report 7
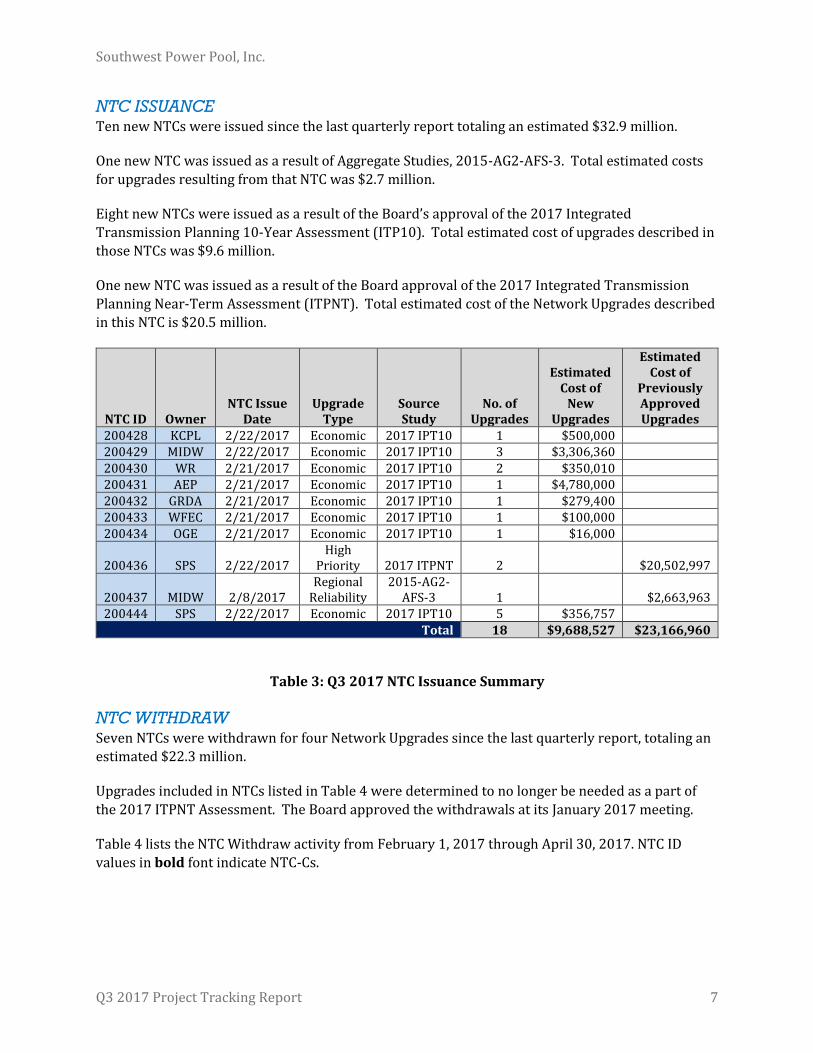
NTC ISSUANCE Ten new NTCs were issued since the last quarterly report totaling an estimated $32.9 million.
One new NTC was issued as a result of Aggregate Studies, 2015-AG2-AFS-3. Total estimated costs
for upgrades resulting from that NTC was $2.7 million.
Eight new NTCs were issued as a result of the Board’s approval of the 2017 Integrated
Transmission Planning 10-Year Assessment (ITP10). Total estimated cost of upgrades described in
those NTCs was $9.6 million.
One new NTC was issued as a result of the Board approval of the 2017 Integrated Transmission
Planning Near-Term Assessment (ITPNT). Total estimated cost of the Network Upgrades described
in this NTC is $20.5 million.
NTC ID Owner NTC Issue
Date Upgrade
Type Source Study
No. of Upgrades
Estimated Cost of
New Upgrades
Estimated Cost of
Previously Approved Upgrades
200428 KCPL 2/22/2017 Economic 2017 IPT10 1 $500,000 200429 MIDW 2/22/2017 Economic 2017 IPT10 3 $3,306,360 200430 WR 2/21/2017 Economic 2017 IPT10 2 $350,010 200431 AEP 2/21/2017 Economic 2017 IPT10 1 $4,780,000 200432 GRDA 2/21/2017 Economic 2017 IPT10 1 $279,400 200433 WFEC 2/21/2017 Economic 2017 IPT10 1 $100,000 200434 OGE 2/21/2017 Economic 2017 IPT10 1 $16,000
200436 SPS 2/22/2017 High
Priority 2017 ITPNT 2 $20,502,997
200437 MIDW 2/8/2017 Regional
Reliability 2015-AG2-
AFS-3 1 $2,663,963 200444 SPS 2/22/2017 Economic 2017 IPT10 5 $356,757
Total 18 $9,688,527 $23,166,960
Table 3: Q3 2017 NTC Issuance Summary
NTC WITHDRAW Seven NTCs were withdrawn for four Network Upgrades since the last quarterly report, totaling an
estimated $22.3 million.
Upgrades included in NTCs listed in Table 4 were determined to no longer be needed as a part of
the 2017 ITPNT Assessment. The Board approved the withdrawals at its January 2017 meeting.
Table 4 lists the NTC Withdraw activity from February 1, 2017 through April 30, 2017. NTC ID
values in bold font indicate NTC-Cs.

Southwest Power Pool, Inc.
Q3 2017 Project Tracking Report 8
NTC ID Owner
NTC Withdraw
Date Upgrade Type Source Study No. of
Upgrades
Estimated Cost of
Withdrawn Upgrades
200436 SPS 2/22/2017 High Priority 2017 ITPNT 3 $7,647,477 200438 SPS 2/22/2017 Regional Reliability 2017 ITPNT 1 $3,659,456 200439 WR 2/22/2017 Regional Reliability 2017 ITPNT 1 $767,165 200440 WR 2/22/2017 Regional Reliability 2017 ITPNT 1 $1,390,166 200442 OPPD 2/22/2017 Regional Reliability 2017 ITPNT 1 $3,141,600 200443 GRDA 2/22/2017 Regional Reliability 2017 ITPNT 2 $295,000 200435 SPS 2/22/2017 Regional Reliability 2017 ITPNT 5 $5,362,750
Total 14 $22,263,614
Table 4: Q3 2017 NTC Withdraw Summary
COMPLETED PROJECTS Four Network Upgrades with NTCs were verified as completed during the reporting period, totaling an estimated $20.6 million.
Table 5 lists the Network Upgrades reported and confirmed as completed during the reporting
period. Table 6 summarizes the completed projects over the previous year, including Network
Upgrades not yet confirmed as completed. Figure 5 reflects the completed projects by upgrade type
on a cost basis for the current year and the following year based on current projected in-service
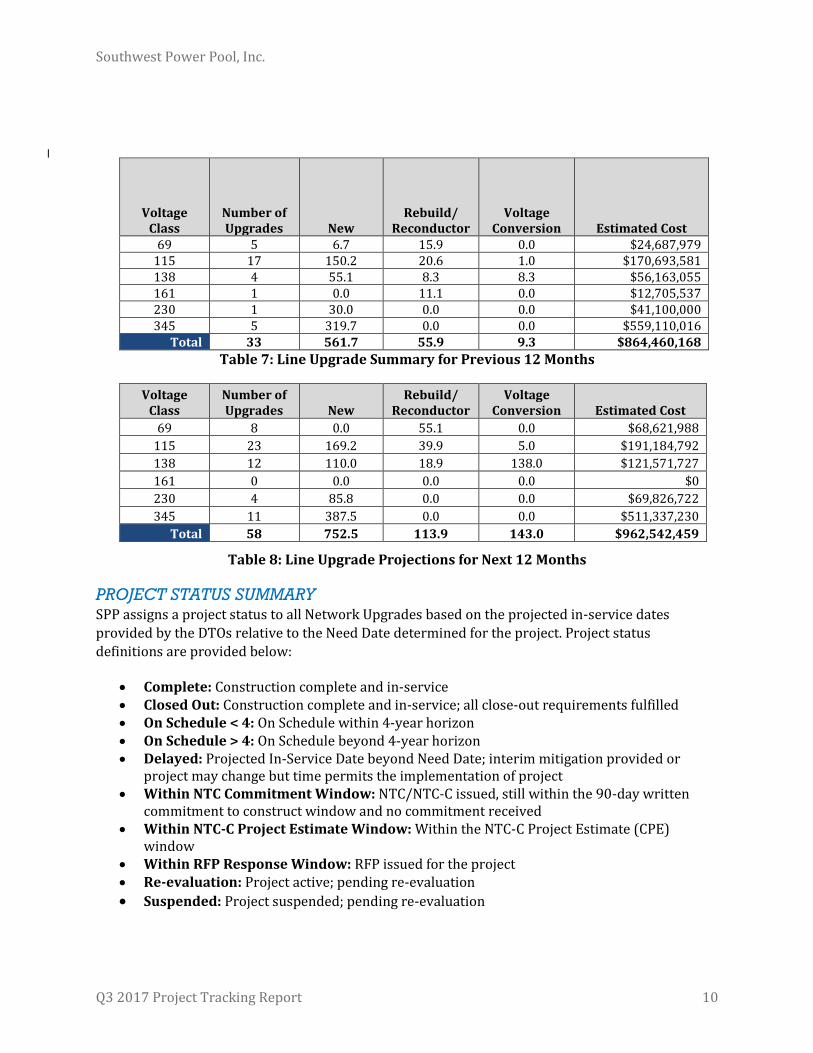
dates. Tables 7 and 8 summarize all Network Upgrades that include construction of transmission
lines, both for the current year and the following year. Note: Previous quarter’s updated results
are listed as the Transmission Owners may make adjustments to final costs and status of
projects completed during the year.
UID Network Upgrade Name Owner NTC Source
Study Cost Estimate
10604 Arkansas City - Paris 69 kV Terminal Upgrades
WR Ag Studies $229,690
10649 Brownlee - North Market 69 kV Ckt 1 AEP 2013 ITPNT $16,401,035
51331 Antelope - County Line - 115kV Rebuild NPPD GI Studies $2,047,174
51340 Battle Creek - County Line 115kV Rebuild NPPD GI Studies $1,952,826
Total $20,630,725
Table 5: Q3 2017 Completed Network Upgrades

Southwest Power Pool, Inc.
Q3 2017 Project Tracking Report 9
Upgrade Type Q4 2016 Q1 2017 Q2 2017 Q3 2017 Total
Regional Reliability 13 9 16 14 52
Regional Reliability $157,765,704 $98,219,377 $121,481,442 $58,548,510 $436,015,033
Transmission Service 2 0 1 0 3
Transmission Service $560,758 $0 $229,690 $0 $790,448
High Priority 0 8 0 5 13
High Priority $0 $522,455,363 $0 $41,095,660 $563,551,023
Economic 0 0 0 0 0
Economic $0 $0 $0 $0 $0
Zonal Reliability 0 0 0 1 1
Zonal Reliability $0 $0 $0 $13,512,897 $13,512,897
Generation Interconnection
18 12 8 7 45
Generation Interconnection
$64,317,751 $38,294,567 $29,852,689 $15,673,080 $148,138,087
Table 6: Completed Project Summary as of 3Q 2017
Figure 5: Completed Upgrades by Type per Quarter
$0.0
$100.0
$200.0
$300.0
$400.0
$500.0
$600.0
$700.0
$800.0
Q4 2016 Q1 2017 Q2 2017 Q3 2017 Q4 2017Projected
Q1 2018Projected
Q2 2018Projected
Q3 2018Projected
Generation Interconnection
Zonal Reliability
Economic
High Priority
Balanced Portfolio
Transmission Service
Regional Reliability$ M
illi
on
Southwest Power Pool, Inc.
Q3 2017 Project Tracking Report 10
Voltage Class
Number of Upgrades New
Rebuild/ Reconductor
Voltage Conversion Estimated Cost
69 5 6.7 15.9 0.0 $24,687,979 115 17 150.2 20.6 1.0 $170,693,581 138 4 55.1 8.3 8.3 $56,163,055 161 1 0.0 11.1 0.0 $12,705,537 230 1 30.0 0.0 0.0 $41,100,000 345 5 319.7 0.0 0.0 $559,110,016
Total 33 561.7 55.9 9.3 $864,460,168
Table 7: Line Upgrade Summary for Previous 12 Months
Voltage Class
Number of Upgrades New
Rebuild/ Reconductor
Voltage Conversion Estimated Cost
69 8 0.0 55.1 0.0 $68,621,988
115 23 169.2 39.9 5.0 $191,184,792
138 12 110.0 18.9 138.0 $121,571,727
161 0 0.0 0.0 0.0 $0
230 4 85.8 0.0 0.0 $69,826,722
345 11 387.5 0.0 0.0 $511,337,230
Total 58 752.5 113.9 143.0 $962,542,459
Table 8: Line Upgrade Projections for Next 12 Months
PROJECT STATUS SUMMARY SPP assigns a project status to all Network Upgrades based on the projected in-service dates
provided by the DTOs relative to the Need Date determined for the project. Project status
definitions are provided below:
Complete: Construction complete and in-service Closed Out: Construction complete and in-service; all close-out requirements fulfilled On Schedule < 4: On Schedule within 4-year horizon On Schedule > 4: On Schedule beyond 4-year horizon Delayed: Projected In-Service Date beyond Need Date; interim mitigation provided or
project may change but time permits the implementation of project Within NTC Commitment Window: NTC/NTC-C issued, still within the 90-day written
commitment to construct window and no commitment received Within NTC-C Project Estimate Window: Within the NTC-C Project Estimate (CPE)
window Within RFP Response Window: RFP issued for the project Re-evaluation: Project active; pending re-evaluation
Suspended: Project suspended; pending re-evaluation
Southwest Power Pool, Inc.
Q3 2017 Project Tracking Report 11
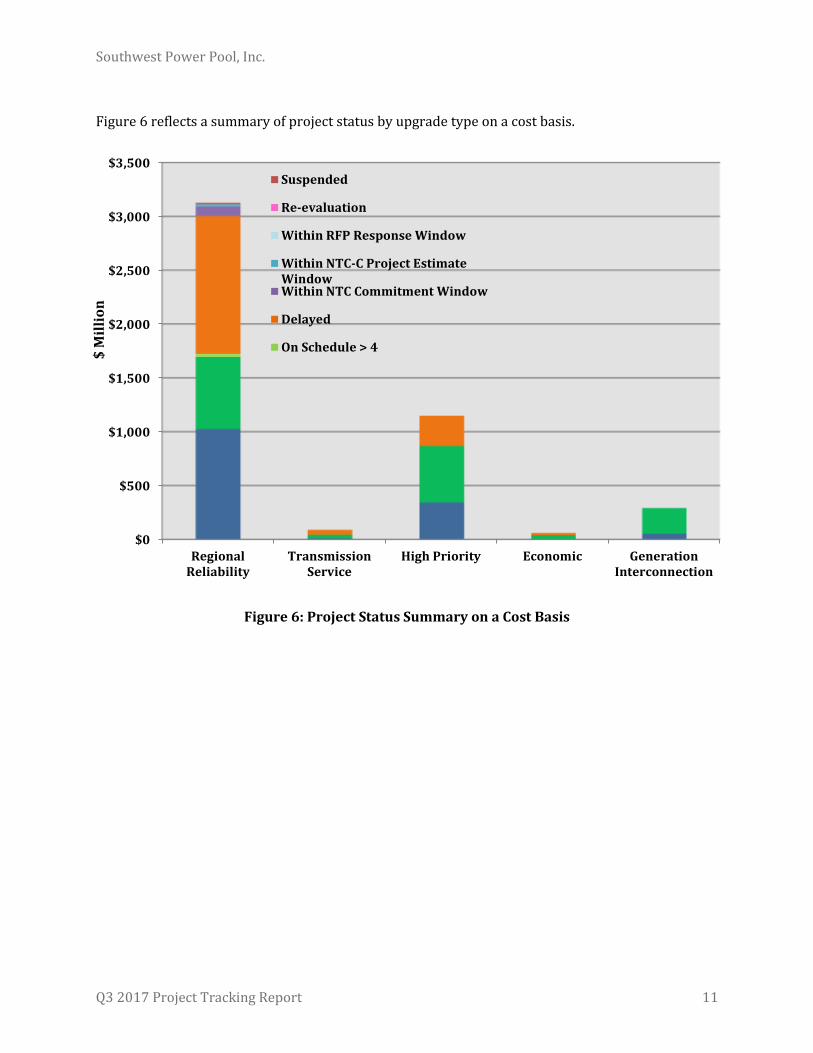
Figure 6 reflects a summary of project status by upgrade type on a cost basis.
Figure 6: Project Status Summary on a Cost Basis
$0
$500
$1,000
$1,500
$2,000
$2,500
$3,000
$3,500
RegionalReliability
TransmissionService
High Priority Economic GenerationInterconnection
Suspended
Re-evaluation
Within RFP Response Window
Within NTC-C Project EstimateWindowWithin NTC Commitment Window
Delayed
On Schedule > 4
$ M
illi
on

Southwest Power Pool, Inc.
Q3 2017 Project Tracking Report 12
PRIORITY PROJECTS
In April 2010, the Board and Members Committee approved for construction a group of "priority"
high voltage electric transmission projects estimated to bring benefits of at least $3.7 billion to the
SPP region over 40 years. The projects issued NTCs as a result of the study were estimated to add
291 miles of new single circuit 345 kV transmission line and 435 miles of double circuit 345 kV
transmission to the SPP region.
In October 2010, the Board approved an overall cost increase for the Priority Projects due to line
rerouting and addition costs for reactive compensation. The total cost estimate for the Priority
Projects after the variances were approved was $1.42 billion.
The total cost estimate of $1.37 billion for the projects included in the Priority Projects report
increased by 4.4% from the previous quarter’s total.
Figure 8 below depicts a historical view of the total estimated cost of the Priority Projects. Table 10
provides a project summary of the projects making up the Priority Projects. Table 11 lists
construction status updates for the Priority Projects not yet completed.
Figure 7: Priority Project Cost Estimate Trend
$1,144.9
$1,416.3
$1,449.7
$1,388.2$1,381.0
$1,387.9$1,374.5
$1,325.8
$1,348.8
$1,348.8
$1,100.0
$1,150.0
$1,200.0
$1,250.0
$1,300.0
$1,350.0
$1,400.0
$1,450.0
$1,500.0
PP
Rep
ort
4/2
010
Ori
gin
al N
TCs
6/2
010
2010
Q3
Q4
2011
Q1
Q2
Q3
Q4
2012
Q1
Q2
Q3
Q4
2013
Q1
Q2
Q3
Q4
2014
Q1
Q2
Q3
Q4
2015
Q1
Q2
Q3
Q4
2016
Q1
Q2
Q3
Q4
2017
Q1
Q2
Q3
Additional Costs Approved by Board
$1,416.3 $ M
illi
on

Southwest Power Pool, Inc.
Q3 2017 Project Tracking Report 13
Project ID(s)
Project Owner
(s) Project
Est. Line
Length
BOD Approved Estimates (10/2010)
Q2 2017 Cost Estimates
Q3 2017 Cost Estimates
Var. %
937 AEP Tulsa Power Station 138 kV Reactor
N/A $842,847 $614,753 $614,753 0.0%
940/941 SPS/ OGE
Hitchland – Woodward District 345 kV Dbl Ckt
128.8 $221,572,283 $229,797,229 $229,797,229 0.0%
942/943 PW/ OGE
Thistle – Woodward District 345 kV Dbl Ckt
106.6 $201,940,759 $185,403,885 $185,403,885 0.0%
945 ITCGP
Spearville – Ironwood – Clark Co. – Thistle 345 kV Dbl Ckt
122.5 $293,235,000 $318,469,400 $318,469,400 0.0%
946 PW/ WR
Thistle – Wichita 345 kV Dbl Ckt
77.5 $163,488,000 $120,016,474 $120,016,474 0.0%
936 AEP Valliant – NW Texarkana 345 kV
76.3 $131,451,250 $185,751,250 $185,751,250 0.0%
938/939 OPPD/GMO
Nebraska City – Mullin Creek – Sibley 345 kV
215 $403,740,000 $308,708,013 $308,708,013 0.0%
Total 726.7 $1,416,270,139 $1,348,761,003 $1,348,761,003 0.0%
Table 9: Priority Projects Summary
Pro
ject
ID
Pro
ject
Na
me
Pro
ject
ed
In
-Se
rvic
e
Da
te
En
gin
ee
rin
g
Sit
ing
an
d R
ou
tin
g
En
vir
on
me
nta
l S
tud
ies
Pe
rmit
s
Ma
teri
al
Pro
cure
me
nt
Co
nst
ruct
ion
C Complete
936 Valliant – NW Texarkana 345 kV 12/16/2016 C C C C C C
IP In Progress
938 Nebraska City – Mullin Creek – Sibley 345 kV (TSMO)
12/31/2016 C C C C C IP
NS Not Started
939 Nebraska City – Mullin Creek – Sibley 345 kV (OPPD)
12/31/2016 C C C C C C
N/A Not Applicable
Table 90: Priority Projects Construction Status

Southwest Power Pool, Inc.
Q3 2017 Project Tracking Report 14
OUT-OF-BANDWIDTH PROJECTS
In adherence to the Business Practice 7060, SPP reports projects that have updated cost values that exceed their established baseline values based upon a ±20% bandwidth. Variances are determined
by total project cost.
Ten projects with a cost estimate greater than $5 million were identified as having exceeded the ±20% bandwidth requirement during the reporting period.
Table 12 provides summary information and Table 13 lists cost detail for out-of-bandwidth
projects for 3Q 2017.
PID Project Name Owner NTC Source
Study Upgrade Type
In-Service Date
30160 XFR - Ft Smith 500/161 kV Ckt 3
(Legacy Project) OGE
SPP-2006-AG3-AFS-11
Transmission Service
5/1/2018
30361 Multi - Chisholm - Gracemont 345
kV AEP/ OGE
2012 ITP10 Regional
Reliability 3/1/2018
30374 Multi - Hoskins - Neligh 345 kV NPPD 2014 ITPNT Regional
Reliability 4/1/2018
30484 Multi - Viola 345/138kV
Transformer and 138 kV Lines to Clearwater and Gill
WR 2013 ITPNT Regional
Reliability 12/31/2018
30497 Line - Buffalo - Buffalo Bear - Ft.
Supply 69 kV WFEC DPA Studies
Regional Reliability
12/19/2014
30580 Line - Crestview - Kenmar 69 kV WR 2014 ITPNT Regional
Reliability 11/13/2015
30694 Multi - Ponderosa - Ponderosa
Tap 115 kV SPS HPILS High Priority 6/1/2017
30873 Line - Southwestern Station - Carnegie 138kV Ckt 1 Rebuild
AEP 2015 ITPNT Regional
Reliability 12/31/2017
30988 Sub - Eddy Co. 230 kV Bus Tie SPS Ag Studies Transmission
Service 6/1/2019
909 Multi - Payne Switching Station -
OU 138 kV conversion WFEC 2013 ITPNT
Regional Reliability
7/1/2016
Table 11: Out-of-Bandwidth Project Summary

Southwest Power Pool, Inc.
Q3 2017 Project Tracking Report 15
PID Baseline
Cost Estimate
Baseline Cost Estimate Year
Baseline Cost Estimate With
Escalation
Latest Estimate or Final Cost
Variance Variance
%
30160 $14,000,000 2014 $15,076,469 $25,635,637 $10,559,168 70.04%
30361 $162,952,357 2013 $179,868,913 $127,678,129 $(52,190,784) -29.02%
30374 $98,697,720 2014 $106,286,649 $81,544,519 $(24,742,130) -23.28%
30484 $77,566,974 2013 $85,619,425 $67,066,974 $(18,552,451) -21.67%
30497 $7,500,000 2013 $7,687,500 $5,054,787 ($2,632,713) -34.2%
30580 $14,558,745 2014 $9,192,357 $15,573,396 $6,381,039 69.4%
30694 $5,170,931 2014 $5,568,527 $13,944,319 $8,375,792 150.4%
30873 $15,821,763 2015 $16,622,740 $9,397,311 ($7,225,429) -43.5%
30988 $10,425,309 2016 $10,685,942 $15,963,986 $5,278,044 49.4%
909 $6,355,000 2013 $6,758,277 $8,282,218 $1,523,942 22.5%
Table 12: Out-of-Bandwidth Project Cost Detail

Southwest Power Pool, Inc.
Q3 2017 Project Tracking Report 16
RESPONSIVENESS REPORT
Table 14 and Figures 9 and 10 provide insight into the responsiveness of DTOs constructing
Network Upgrades within SPP in the Quarterly Project Tracking Report for Q2 2017. Note:
Network Upgrades with statuses of “Suspended”, “Re-evaluation”, “Within NTC Commitment
Window”, “Within NTC-C Project Estimate Window”, and “Within RFP Response Window”
were excluded from this analysis.
Project Owner
Number of
Upgrades
Number of
Upgrades Reviewed
Reviewed %
In-Service
Date Changes
ISD Change
% Cost Changes
Cost Change
% AEP 59 59 100% 0 0% 0 0%
BEPC 24 0 0% 0 0% 0 0% GMO 2 2 100% 0 0% 0 0%
GRDA 11 2 18% 0 0% 0 0% ITCGP 8 0 0% 0 0% 0 0% KCPL 5 5 100% 0 0% 0 0% LES 0 0 100% 0 100% 0 100%
MIDW 9 7 78% 0 0% 0 0% MKEC 7 7 100% 0 0% 0 0% NPPD 36 20 56% 0 0% 0 0% OGE 45 2 4% 1 2% 0 0%
OPPD 14 14 100% 0 0% 0 0% SPS 170 168 99% 5 3% 0 0%
TSMO 7 7 100% 0 0% 1 14% WFEC 36 0 0% 0 0% 0 0%
WR 33 33 100% 0 0% 0 0% Total 479 330 69% 6 1% 1 0%
Table 13: Responsiveness Summary by Project Owner

Southwest Power Pool, Inc.
Q3 2017 Project Tracking Report 17
Figure 8: In-Service Date Changes by Project Owner
Figure 7: Cost Changes by Project Owner
0
20
40
60
80
100
120
140
160
180
In-Service Date Changes
0
20
40
60
80
100
120
140
160
180
Cost Changes

Southwest Power Pool, Inc.
Q3 2017 Project Tracking Report 18
APPENDIX 1
{See accompanying list of active Applicable Projects}