third quarter fiscal 2016 earnings -...
TRANSCRIPT

Third Quarter Fiscal 2016 Earnings
July 20, 2016
2
In addition to the historical information contained herein, this presentation and the conference call that accompanies it contain forward-looking statements that are inherently subject to risks and uncertainties, including but not limited to statements regarding executing on our strategic priorities to position the Company for profitable growth; benefiting from a strong product cycle across tiers; expanding our presence in IoT and other adjacent areas; investing to lead the industry in 5G and other cutting-edge technologies; our Strategic Realignment Plan, including our cost reduction initiatives, and our progress and expectations related thereto; our capital return targets; our licensing compliance and reporting challenges in China and our progress, expectations and intentions with respect to resolving those challenges, and the timing thereof, as well as the impact on our business, financial results and guidance; the Korean Fair Trade Commission investigation of our licensing practices; demand for our chipsets; second sourcing at our large modem customer; our proposed joint venture with TDK and our expectations regarding the benefits, timing and financial implications thereof; business and growth opportunities and initiatives, including in RF front end and adjacent businesses such as automotive, networking, mobile compute and IoT, and our positioning to take advantage thereof; 5G, its benefits, features and capabilities, and our leadership therein; our strategic plans and our execution on those plans; our technologies and technology leadership, products and product leadership, and product roadmap; industry trends; operational performance; our business and financial drivers, outlook and expectations; and our expectations, estimates and guidance related to revenues, earnings per share (EPS), MSM chip shipments, operating margins, combined R&D and SG&A expenses, effective tax rates, externally implied royalty rates, 3G/4G device average selling prices (ASPs), sales and shipments, both globally and which we expect to be reported to us (Total Reported Device Sales or TRDS), and the factors and assumptions underlying such expectations, estimates and guidance. Forward-looking statements are generally identified by words such as “estimates,” “guidance,” “expects,” “anticipates,” “intends,” “plans,” “believes,” “seeks” and similar expressions. Actual results may differ materially from those referred to in the forward-looking statements due to a number of important factors, including but not limited to risks associated with commercial network deployments, expansions and upgrades of CDMA, OFDMA and other communications technologies, our customers’ and licensees’ sales of products and services based on these technologies and our ability to drive our customers’ demand for our products and services; competition in an environment of rapid technological change; our dependence on a small number of customers and licensees; attacks on our licensing business model, including current and future legal proceedings or actions of governmental or quasi-governmental bodies or standards or industry organizations; the enforcement and protection of our intellectual property rights; the continued and future success of our licensing programs; government regulations and policies, or adverse rulings in enforcement or other proceedings; the commercial success of our new technologies, products and services; our dependence on a limited number of third-party suppliers; claims by third parties that we infringe their intellectual property; acquisitions, strategic transactions and investments; the execution of our Strategic Realignment Plan; our stock price and earnings volatility; our indebtedness; our ability to attract and retain qualified employees; foreign currency fluctuations; global economic conditions that impact the mobile communications industry; and failures in our products or services or in the products or services of our customers or licensees, including those resulting from security vulnerabilities, defects or errors. These and other risks are set forth in the Company’s Quarterly Report on Form 10-Q for the quarter ended June 26, 2016 filed with the SEC. Our reports filed with the SEC are available on our website at www.qualcomm.com. We undertake no obligation to update, or continue to provide information with respect to, any forward-looking statement or risk factor, whether as a result of new information, future events or otherwise.
This presentation includes “non-GAAP financial measures” as that term is defined in Regulation G. Further discussion regarding our use of non-GAAP financial measures, as well as the most directly comparable GAAP financial measures and information reconciling these non-GAAP financial measures to our financial results prepared in accordance with GAAP, are included at the end of this presentation.
We refer to “Qualcomm” for ease of reference. However, in connection with our fiscal 2013 reorganization, Qualcomm Incorporated continues to operate QTL and own the vast majority of our
patent portfolio, while Qualcomm Technologies, Inc., its wholly-owned subsidiary, now operates, along with its subsidiaries, substantially all of our products and services businesses, including QCT, and substantially all of our research and development functions.
Safe Harbor
3
• We delivered strong results this quarter, with EPS well ahead of our guidance
based on meaningful progress with licensees in China.
• Our chipset business is also benefiting from a strong new product ramp across
tiers, particularly with fast growing OEMs in China.
• We are executing well on our strategic priorities, and we remain confident that our
focused investments in 5G and other advanced technologies will create a strong
foundation for long-term earnings growth.
Quarter ended June 26, 2016
Qualcomm Reports Third Quarter Fiscal 2016 Earnings
4
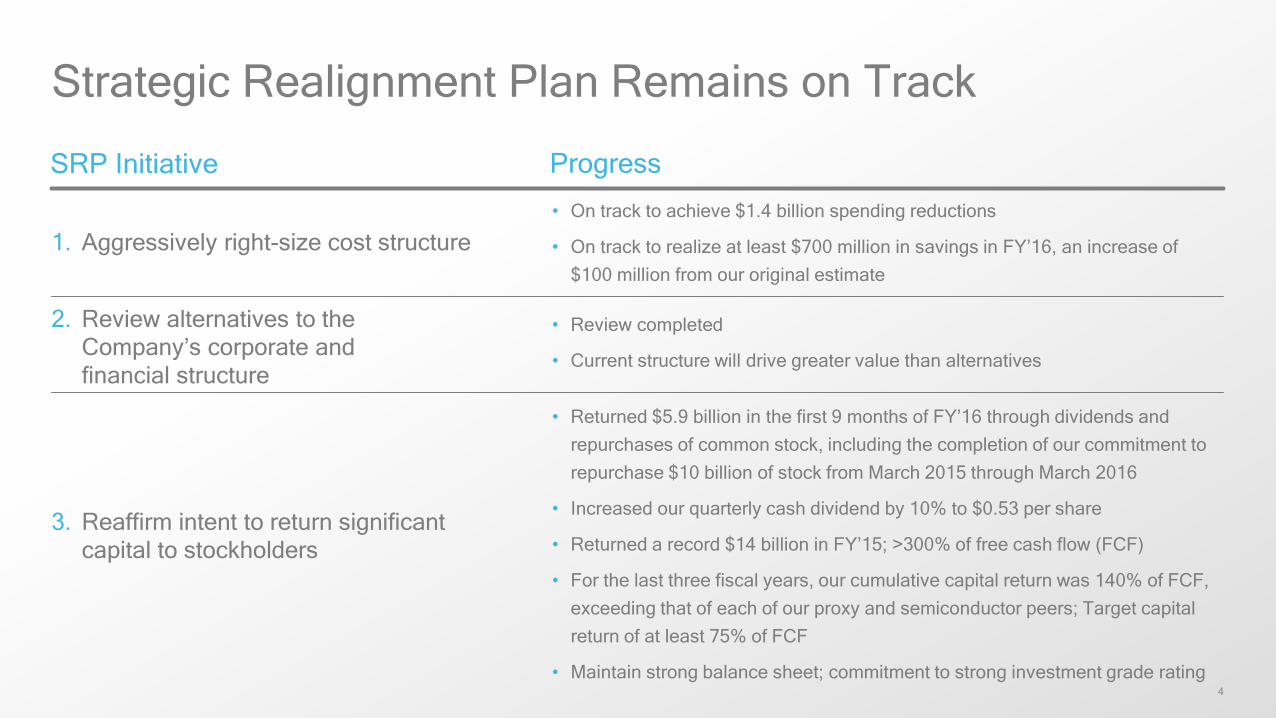
Strategic Realignment Plan Remains on Track
SRP Initiative Progress
1. Aggressively right-size cost structure
2. Review alternatives to the
Company’s corporate and
financial structure
3. Reaffirm intent to return significant
capital to stockholders
• On track to achieve $1.4 billion spending reductions
• On track to realize at least $700 million in savings in FY’16, an increase of
$100 million from our original estimate
• Review completed
• Current structure will drive greater value than alternatives
• Returned $5.9 billion in the first 9 months of FY’16 through dividends and
repurchases of common stock, including the completion of our commitment to
repurchase $10 billion of stock from March 2015 through March 2016
• Increased our quarterly cash dividend by 10% to $0.53 per share
• Returned a record $14 billion in FY’15; >300% of free cash flow (FCF)
• For the last three fiscal years, our cumulative capital return was 140% of FCF,
exceeding that of each of our proxy and semiconductor peers; Target capital
return of at least 75% of FCF
• Maintain strong balance sheet; commitment to strong investment grade rating
5
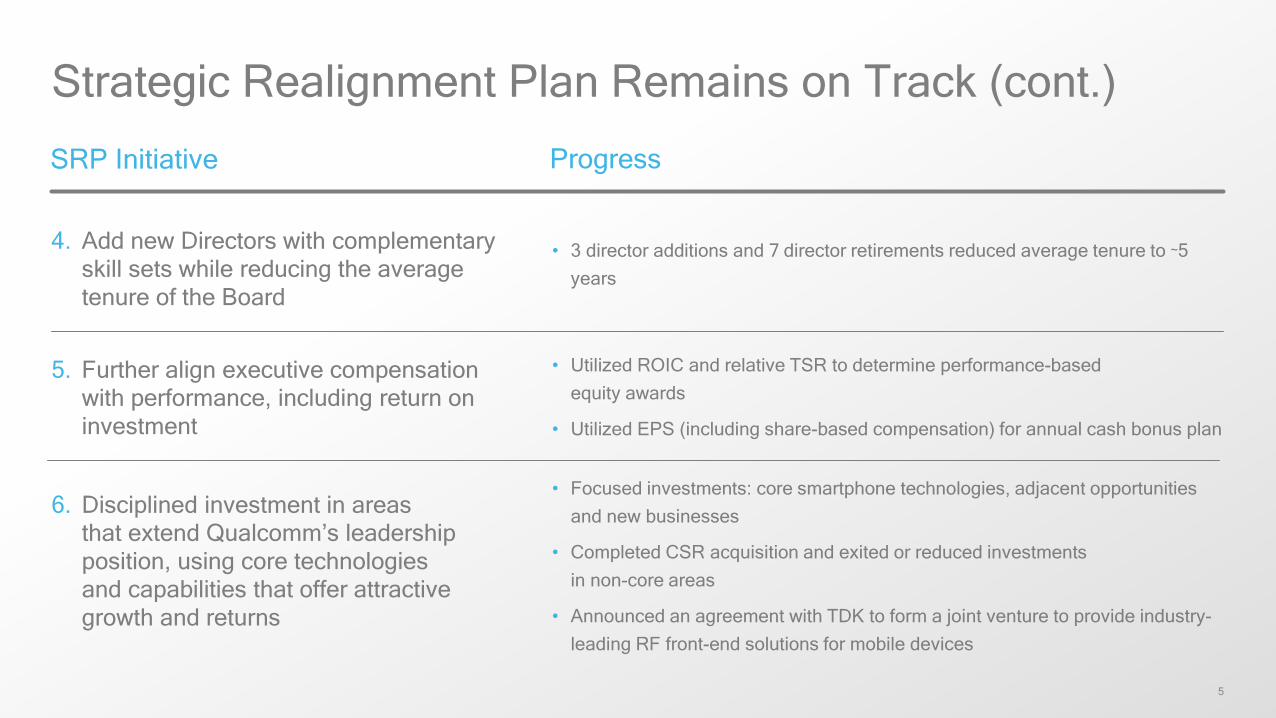
Strategic Realignment Plan Remains on Track (cont.)
4. Add new Directors with complementary
skill sets while reducing the average
tenure of the Board
5. Further align executive compensation
with performance, including return on
investment
6. Disciplined investment in areas
that extend Qualcomm’s leadership
position, using core technologies
and capabilities that offer attractive
growth and returns
• 3 director additions and 7 director retirements reduced average tenure to ~5
years
• Utilized ROIC and relative TSR to determine performance-based
equity awards
• Utilized EPS (including share-based compensation) for annual cash bonus plan
• Focused investments: core smartphone technologies, adjacent opportunities
and new businesses
• Completed CSR acquisition and exited or reduced investments
in non-core areas
• Announced an agreement with TDK to form a joint venture to provide industry-
leading RF front-end solutions for mobile devices
SRP Initiative Progress
6
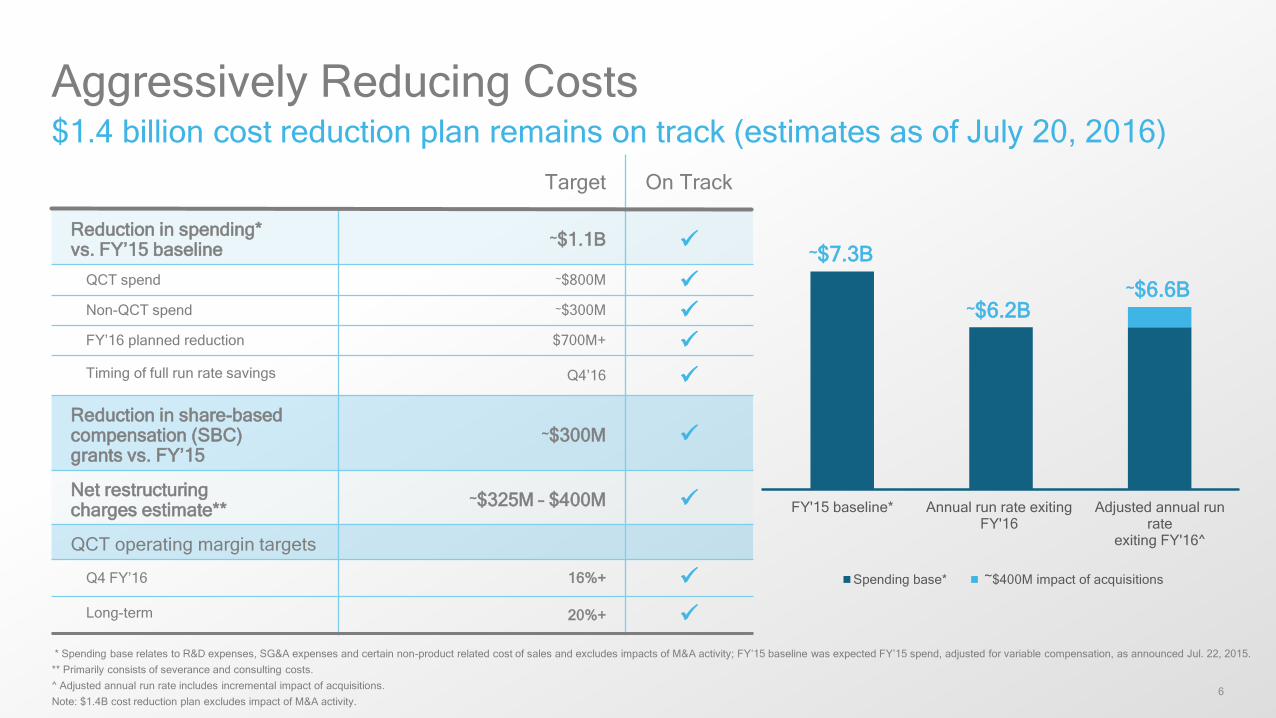
Aggressively Reducing Costs$1.4 billion cost reduction plan remains on track (estimates as of July 20, 2016)
* Spending base relates to R&D expenses, SG&A expenses and certain non-product related cost of sales and excludes impacts of M&A activity; FY’15 baseline was expected FY’15 spend, adjusted for variable compensation, as announced Jul. 22, 2015.
** Primarily consists of severance and consulting costs.
^ Adjusted annual run rate includes incremental impact of acquisitions.
Note: $1.4B cost reduction plan excludes impact of M&A activity.
FY'15 baseline* Annual run rate exitingFY'16
Adjusted annual runrate
exiting FY'16^
Spending base* ~$400M impact of acquisitions
~$6.6B
~$7.3B
~$6.2B
Target On Track
Reduction in spending*vs. FY’15 baseline
~$1.1B
QCT spend ~$800M
Non-QCT spend ~$300M
FY’16 planned reduction $700M+
Timing of full run rate savings Q4’16
Reduction in share-based compensation (SBC) grants vs. FY’15
~$300M
Net restructuring charges estimate**
~$325M – $400M
QCT operating margin targets
Q4 FY’16 16%+
Long-term 20%+

7
Third Quarter Fiscal 2016 Results vs. Guidance
* Prior guidance as of Apr. 20, 2016.
(1), (2), (3) & (4) See Footnotes page at the end of the presentation.
Q3’16Guidance*
Q3’16 Results
Revenues $5.2B - $6.0B $6.0B
Non-GAAP(1) diluted EPS(2) $0.90 – $1.00 $1.16
MSMTM chip shipments 175M – 195M 201M
Total reported device sales(3) (Mar. Qtr.(4)) $52.0B – $60.0B $62.6B
Est. reported 3G/4G device shipments(3) (Mar. Qtr.(4)) not provided 321M – 325M
Est. reported 3G/4G device ASP(3) (Mar. Qtr.(4)) not provided $191 – $197
8
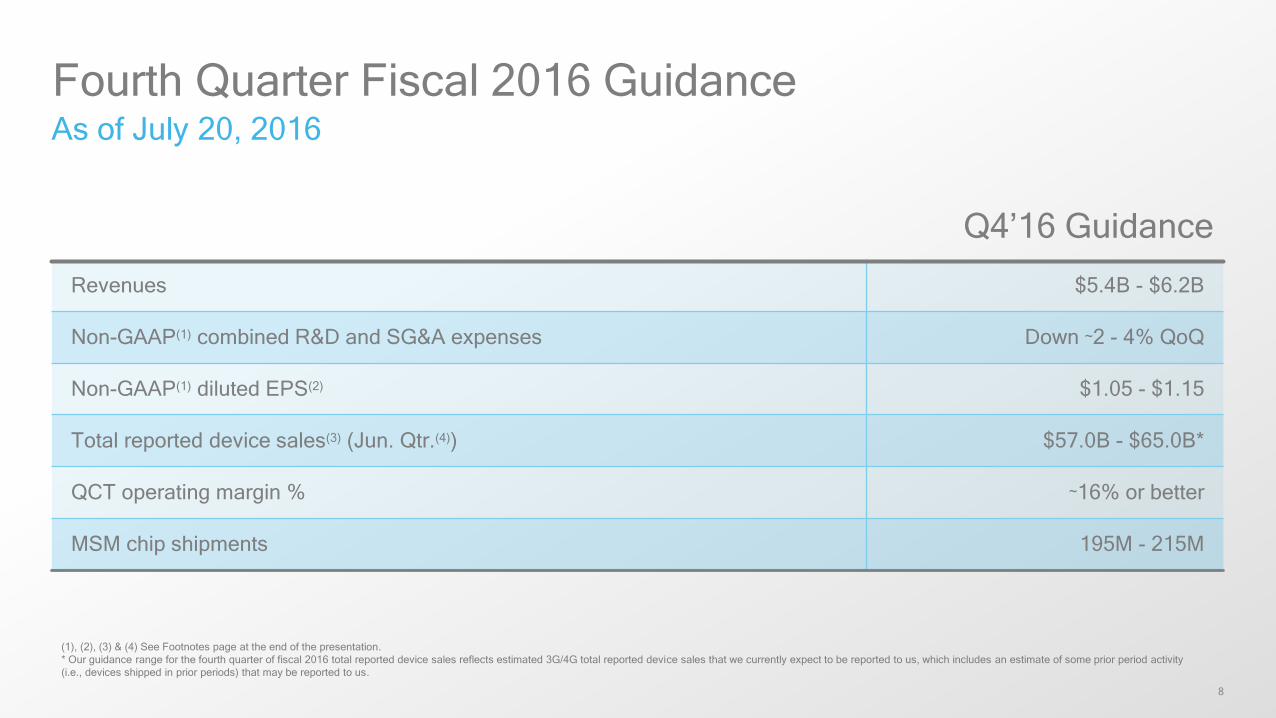
Fourth Quarter Fiscal 2016 GuidanceAs of July 20, 2016
(1), (2), (3) & (4) See Footnotes page at the end of the presentation.
* Our guidance range for the fourth quarter of fiscal 2016 total reported device sales reflects estimated 3G/4G total reported device sales that we currently expect to be reported to us, which includes an estimate of some prior period activity
(i.e., devices shipped in prior periods) that may be reported to us.
Q4’16 Guidance
Revenues $5.4B - $6.2B
Non-GAAP(1) combined R&D and SG&A expenses Down ~2 - 4% QoQ
Non-GAAP(1) diluted EPS(2) $1.05 - $1.15
Total reported device sales(3) (Jun. Qtr.(4)) $57.0B - $65.0B*
QCT operating margin % ~16% or better
MSM chip shipments 195M - 215M

9
Fiscal 2016 Supplemental GuidanceAs of July 20, 2016
^ Global 3G/4G device sales represent our estimate of CDMA-based, OFDMA-based and CDMA/OFDMA multimode subscriber devices shipped globally, excluding TD-SCDMA devices that do not implement LTE. We continue to believe that
certain licensees in China are not fully complying with their contractual obligations to report their sales of licensed products to us, and certain companies, including unlicensed companies, are delaying execution of new license agreements. As a
result, we do not believe that all global 3G/4G device shipments are currently being reported to us.
(1) See Footnotes page at the end of the presentation.
FY’16 Guidance
Global 3G/4G device sales^ (Sep - Jun. Qtr.) Grow at a low single-digit % YoY
QTL revenue range ~ $7.4B - $7.8B
Non-GAAP(1) combined R&D and SG&A expenses Down ~2% - 4% YoY
Non-GAAP(1) effective tax rate ~ 18%
10
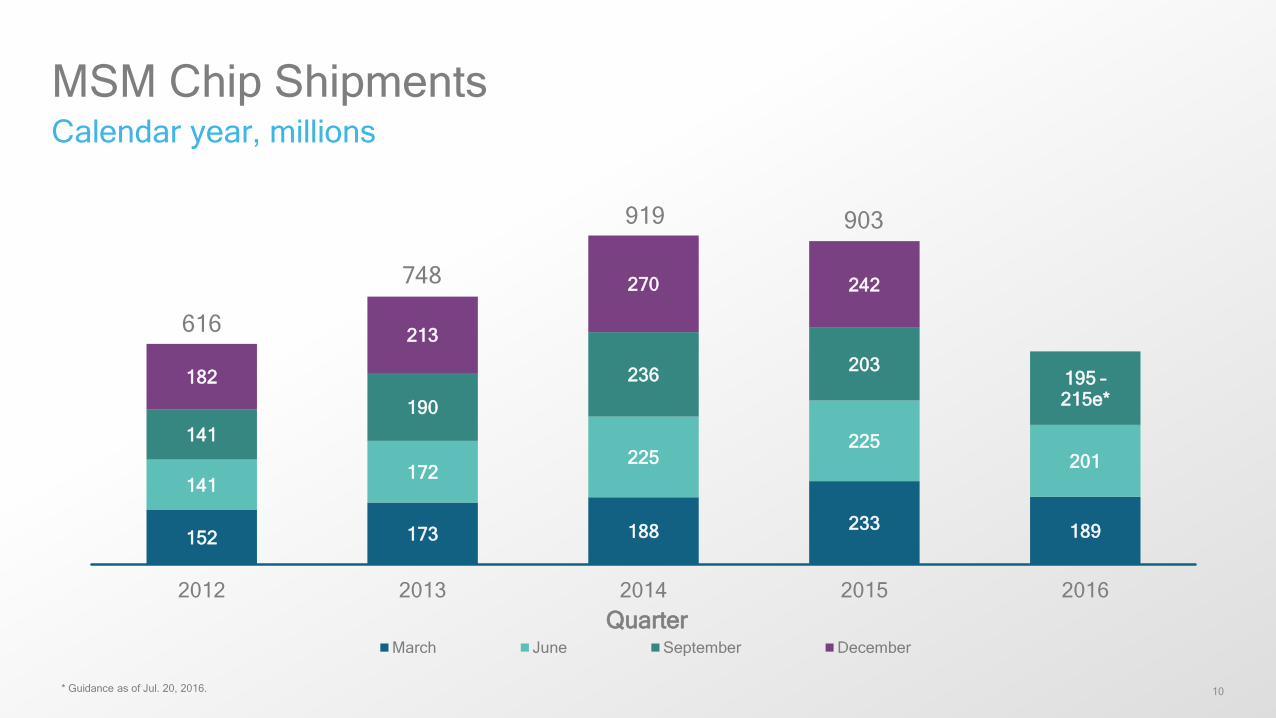
MSM Chip ShipmentsCalendar year, millions
* Guidance as of Jul. 20, 2016.
152 173 188 233 189
141172
225225
201
141
190
236203
195 –215e*
182
213
270 242
2012 2013 2014 2015 2016
QuarterMarch June September December
919 903
616
748
11
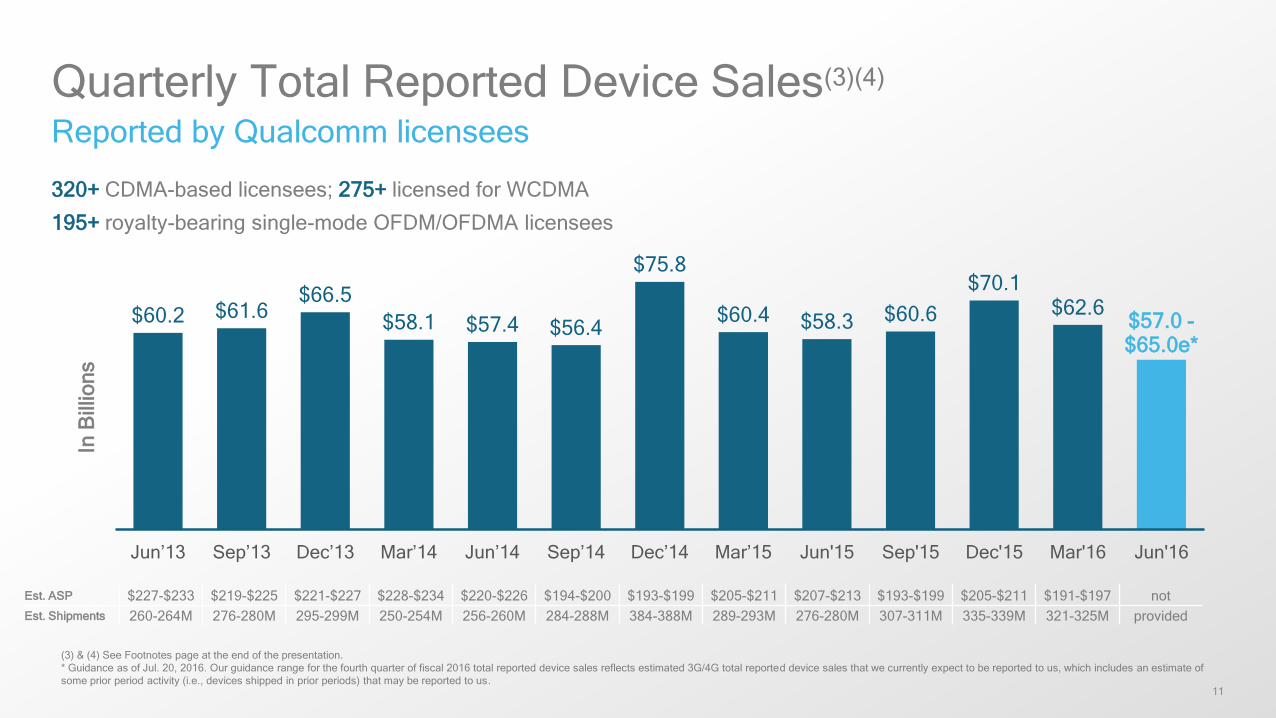
Quarterly Total Reported Device Sales(3)(4)
Reported by Qualcomm licensees
(3) & (4) See Footnotes page at the end of the presentation.
* Guidance as of Jul. 20, 2016. Our guidance range for the fourth quarter of fiscal 2016 total reported device sales reflects estimated 3G/4G total reported device sales that we currently expect to be reported to us, which includes an estimate of
some prior period activity (i.e., devices shipped in prior periods) that may be reported to us.
$60.2 $61.6$66.5
$58.1 $57.4 $56.4
$75.8
$60.4 $58.3 $60.6
$70.1$62.6
$57.0 -$65.0e*
Jun’13 Sep’13 Dec’13 Mar’14 Jun’14 Sep’14 Dec’14 Mar’15 Jun'15 Sep'15 Dec'15 Mar'16 Jun'16
In B
illio
ns
Est. ASP $227-$233 $219-$225 $221-$227 $228-$234 $220-$226 $194-$200 $193-$199 $205-$211 $207-$213 $193-$199 $205-$211 $191-$197 not
Est. Shipments 260-264M 276-280M 295-299M 250-254M 256-260M 284-288M 384-388M 289-293M 276-280M 307-311M 335-339M 321-325M provided
320+ CDMA-based licensees; 275+ licensed for WCDMA
195+ royalty-bearing single-mode OFDM/OFDMA licensees

12
* Global 3G/4G device shipments represent our estimate of CDMA-based, OFDMA-based and CDMA/OFDMA multimode subscriber devices shipped globally, excluding TD-SCDMA devices that do not implement LTE. We continue to believe
that certain licensees in China are not fully complying with their contractual obligations to report their sales of licensed products to us, and certain companies, including unlicensed companies, are delaying execution of new license agreements.
As a result, we do not believe that all global 3G/4G device shipments are currently being reported to us.
2014 2015 2016
Global 3G/4G Device Shipment* EstimatesCalendar year, as of July 20, 2016
~ +13%
~ 1.37B
~ 1.55B
~ 1.625B -
1.725Be
~ +5 - 11%

13
Supplemental Information, 3G/4G Device Estimates*As of July 20, 2016
(3) & (4) See Footnotes page at the end of the presentation.
* Global 3G/4G device shipments represent our estimate of CDMA-based, OFDMA-based and CDMA/OFDMA multimode subscriber devices shipped globally, excluding TD-SCDMA devices that do not implement LTE. We continue to believe
that certain licensees in China are not fully complying with their contractual obligations to report their sales of licensed products to us, and certain companies, including unlicensed companies, are delaying execution of new license agreements.
As a result, we do not believe that all global 3G/4G device shipments are currently being reported to us.
FY’15 FY’16 CY’15 CY’16
3G/4G Units
Global ~ 1.55B ~ 1.625B - 1.725B
Reported(3)(4)~ 1,233M – 1,249M ~ 1,207M – 1,223M
3G/4G ASP
Global ~ $181 - $191
Reported(3)(4)~ $199 - $205
3G/4G Device Sales
Global ~ $271B - $280B ~ Grow at a low single-digit % YoY
Reported(3)(4)~ $250.9B
14
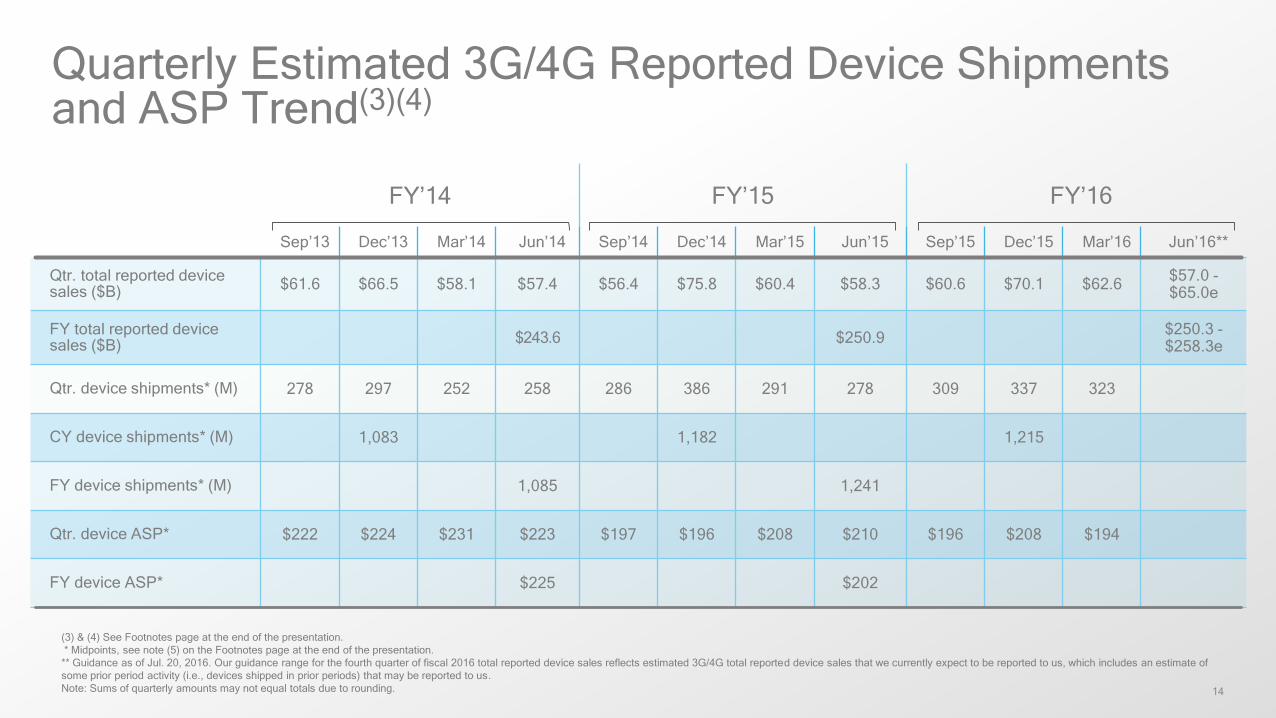
FY’14 FY’15 FY’16
Sep’13 Dec’13 Mar’14 Jun’14 Sep’14 Dec’14 Mar’15 Jun’15 Sep’15 Dec’15 Mar’16 Jun’16**
Qtr. total reported device sales ($B)
$61.6 $66.5 $58.1 $57.4 $56.4 $75.8 $60.4 $58.3 $60.6 $70.1 $62.6$57.0 -$65.0e
FY total reported device sales ($B)
$243.6 $250.9$250.3 -$258.3e
Qtr. device shipments* (M) 278 297 252 258 286 386 291 278 309 337 323
CY device shipments* (M) 1,083 1,182 1,215
FY device shipments* (M) 1,085 1,241
Qtr. device ASP* $222 $224 $231 $223 $197 $196 $208 $210 $196 $208 $194
FY device ASP* $225 $202
Quarterly Estimated 3G/4G Reported Device Shipments and ASP Trend(3)(4)
(3) & (4) See Footnotes page at the end of the presentation.
* Midpoints, see note (5) on the Footnotes page at the end of the presentation.
** Guidance as of Jul. 20, 2016. Our guidance range for the fourth quarter of fiscal 2016 total reported device sales reflects estimated 3G/4G total reported device sales that we currently expect to be reported to us, which includes an estimate of
some prior period activity (i.e., devices shipped in prior periods) that may be reported to us.
Note: Sums of quarterly amounts may not equal totals due to rounding.
15
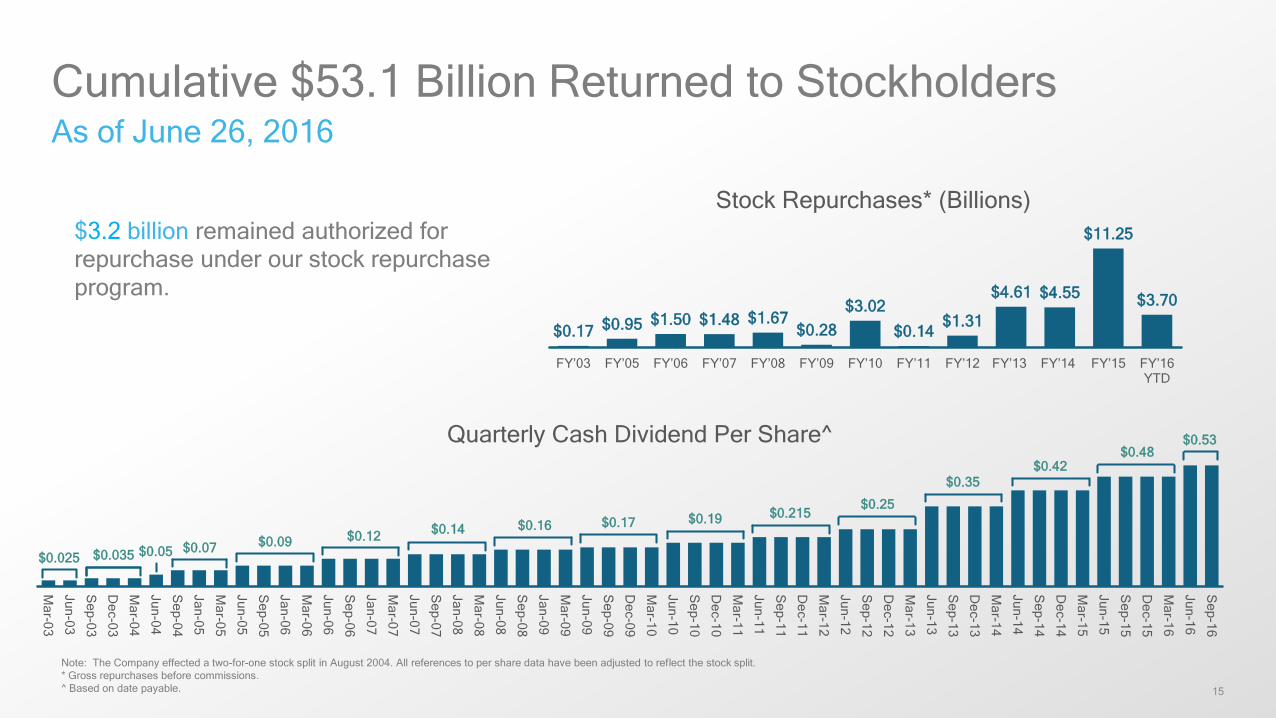
Cumulative $53.1 Billion Returned to Stockholders As of June 26, 2016
$0.17 $0.95 $1.50 $1.48 $1.67$0.28
$3.02
$0.14$1.31
$4.61 $4.55
$11.25
$3.70
FY’03 FY’05 FY’06 FY’07 FY’08 FY’09 FY’10 FY’11 FY’12 FY’13 FY’14 FY’15 FY’16 YTD
Stock Repurchases* (Billions)
Note: The Company effected a two-for-one stock split in August 2004. All references to per share data have been adjusted to reflect the stock split.
* Gross repurchases before commissions.
^ Based on date payable.
Ma
r-03
Ju
n-0
3
Se
p-0
3
De
c-0
3
Ma
r-04
Ju
n-0
4
Se
p-0
4
Ja
n-0
5
Ma
r-05
Ju
n-0
5
Se
p-0
5
Ja
n-0
6
Ma
r-06
Ju
n-0
6
Se
p-0
6
Ja
n-0
7
Ma
r-07
Ju
n-0
7
Se
p-0
7
Ja
n-0
8
Ma
r-08
Ju
n-0
8
Se
p-0
8
Ja
n-0
9
Ma
r-09
Ju
n-0
9
Se
p-0
9
De
c-0
9
Ma
r-10
Ju
n-1
0
Se
p-1
0
De
c-1
0
Ma
r-11
Ju
n-1
1
Se
p-1
1
De
c-1
1
Ma
r-12
Ju
n-1
2
Se
p-1
2
De
c-1
2
Ma
r-13
Ju
n-1
3
Se
p-1
3
De
c-1
3
Ma
r-14
Ju
n-1
4
Se
p-1
4
De
c-1
4
Ma
r-15
Ju
n-1
5
Se
p-1
5
De
c-1
5
Ma
r-16
Ju
n-1
6
Se
p-1
6
Quarterly Cash Dividend Per Share^
$0.025 $0.035 $0.05 $0.07 $0.09 $0.12$0.14 $0.16 $0.17 $0.19 $0.215
$0.25
$0.35
$0.48$0.42
$3.2 billion remained authorized for
repurchase under our stock repurchase
program.
$0.53
16
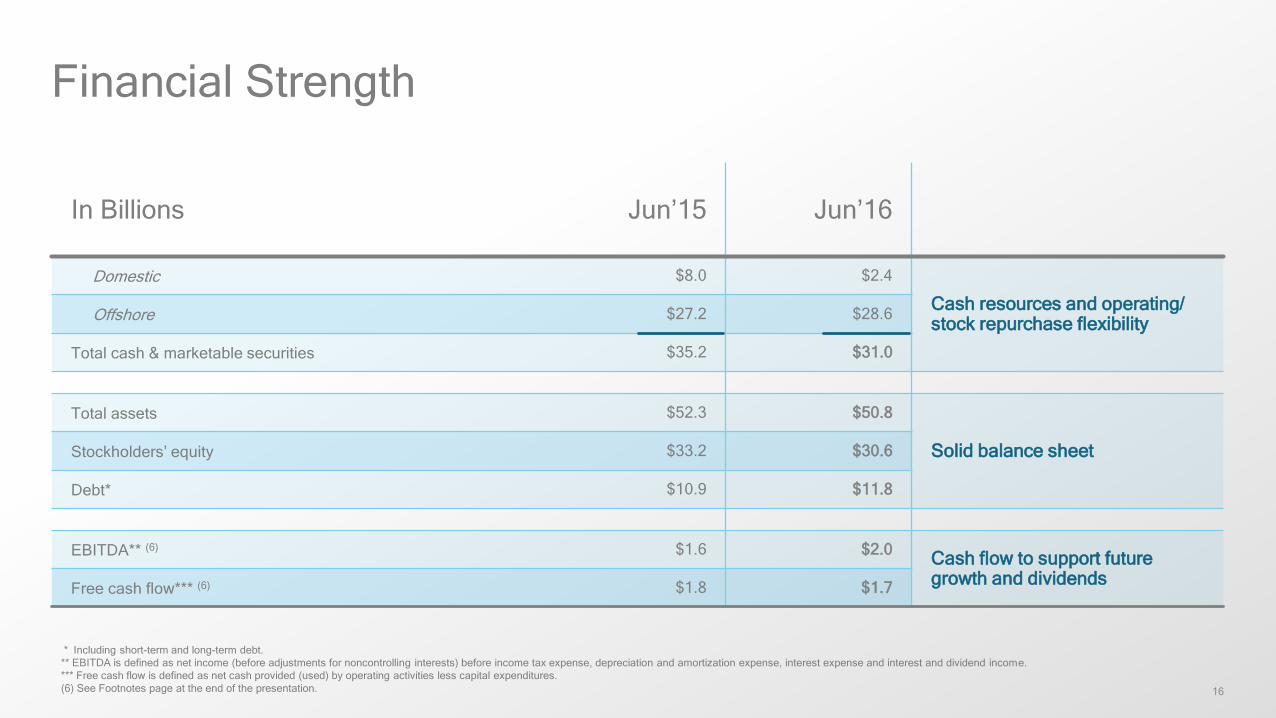
Financial Strength
* Including short-term and long-term debt.
** EBITDA is defined as net income (before adjustments for noncontrolling interests) before income tax expense, depreciation and amortization expense, interest expense and interest and dividend income.
*** Free cash flow is defined as net cash provided (used) by operating activities less capital expenditures.
(6) See Footnotes page at the end of the presentation.
In Billions Jun’15 Jun’16
Domestic $8.0 $2.4
Cash resources and operating/stock repurchase flexibility
Offshore $27.2 $28.6
Total cash & marketable securities $35.2 $31.0
Total assets $52.3 $50.8
Solid balance sheetStockholders’ equity $33.2 $30.6
Debt* $10.9 $11.8
EBITDA** (6) $1.6 $2.0Cash flow to support futuregrowth and dividends
Free cash flow*** (6) $1.8 $1.7

17
1. Non-GAAP results exclude the QSI (Qualcomm Strategic Initiatives) segment and certain share-based compensation, acquisition-related items, tax items and other items. Further discussion
regarding the Company’s use of Non-GAAP financial measures and detailed reconciliations between GAAP and Non-GAAP results are included in this presentation.
2. Throughout this presentation, net income and diluted earnings per share (EPS) are attributable to Qualcomm (i.e., after adjustments for noncontrolling interests), unless otherwise stated.
3. Total reported device sales is the sum of all reported sales in U.S. dollars (as reported to us by our licensees) of all licensed CDMA-based, OFDMA-based and CDMA/OFDMA multimode subscriber
devices (including handsets, modules, modem cards and other subscriber devices) by our licensees during a particular period (collectively, 3G/4G devices). The reported quarterly estimated ranges
of average selling prices (ASPs) and unit shipments are determined based on the information as reported to us by our licensees during the relevant period and our own estimates of the selling prices
and unit shipments for licensees that do not provide such information. Not all licensees report sales, selling prices and/or unit shipments the same way (e.g., some licensees report sales net of
permitted deductions, including transportation, insurance, packing costs and other items, while other licensees report sales and then identify the amount of permitted deductions in their reports), and
the way in which licensees report such information may change from time to time. In addition, certain licensees may not report (in the quarter in which they are contractually obligated to report) their
sales of certain types of subscriber units, which (as a result of audits, legal actions or for other reasons) may be reported in a subsequent quarter. Accordingly, total reported device sales, estimated
unit shipments and estimated ASPs for a particular period may include prior period activity that was not reported by the licensee until such particular period.
4. Royalties are recognized when reported, generally one quarter following shipment.
5. The midpoints of the estimated ranges are used for comparison purposes only and do not indicate a higher degree of confidence in the midpoints.
6. The following should be considered in regards to the year-over-year comparisons:
• The third quarter of fiscal 2016 GAAP and Non-GAAP results included:
o $235 million of revenues, or $0.11 per share, due to the recognition of previously deferred royalty revenues related to the dismissal of the arbitration with LG Electronics, Inc.
• The third quarter of fiscal 2015 GAAP results included:
o $142 million of charges, or $0.08 per share, that resulted from an impairment of goodwill and long-lived assets related to one of our display businesses.
Footnotes

Reconciliations
19
The Non-GAAP financial information presented herein should be considered in addition to, not as a substitute for or superior to, financial measures calculated in accordance with GAAP. In addition,
“Non- GAAP” is not a term defined by GAAP, and as a result, the Company’s measure of Non-GAAP results might be different than similarly titled measures used by other companies. Reconciliations
between GAAP and Non-GAAP results follow.
The Company uses the Non-GAAP financial information: (i) to evaluate, assess and benchmark the Company’s operating results on a consistent and comparable basis; (ii) to measure the performance
and efficiency of the Company’s ongoing core operating businesses, including the QCT (Qualcomm CDMA Technologies) and QTL (Qualcomm Technology Licensing) segments; and (iii) to compare
the performance and efficiency of these segments against competitors. The Company is able to assess what it believes is a more meaningful and comparable set of financial performance measures for
the Company and its business segments by using Non-GAAP information. In addition, the Compensation Committee of the Board of Directors uses certain Non-GAAP financial measures in establishing
portions of the performance-based incentive compensation programs for our executive officers. The Company presents Non-GAAP financial information to provide greater transparency to investors with
respect to its use of such information in financial and operational decision-making. This Non-GAAP financial information also is used by institutional investors and analysts in evaluating our business and
assessing trends and future expectations. Non-GAAP measures include revenues, cost of equipment and services revenues, R&D expenses, SG&A expenses, combined R&D and SG&A expenses,
other income or expenses, operating income, interest expense, net investment income, income or earnings before income taxes, effective tax rate, net income, diluted earnings per share, operating
cash flow, free cash flow, operating cash flow as a % of revenues, free cash flow as a % of revenues and return of capital as a % of free cash flows.
Non-GAAP information used by management excludes QSI and certain share-based compensation, acquisition-related items, tax items and other items.
• QSI is excluded because the Company expects to exit its strategic investments in the foreseeable future, and the effects of fluctuations in the value of such investments and realized gains or losses
are viewed by management as unrelated to the Company’s operational performance.
• Share-based compensation expense primarily relates to restricted stock units. Management believes that excluding non-cash share-based compensation from the Non-GAAP financial information
allows management and investors to make additional comparisons of the operating activities of the Company’s ongoing core businesses over time and with respect to other companies.
• Certain other items are excluded because management views such expenses as unrelated to the operating activities of the Company’s ongoing core businesses, as follows:
o Acquisition-related items include amortization of certain intangible assets, recognition of the step-up of inventories to fair value and the related tax effects of these items starting with acquisitions
completed in the third quarter of fiscal 2011, as well as any tax effects from restructuring the ownership of such acquired assets. Additionally, the Company excludes expenses related to the
termination of contracts that limit the use of the acquired intellectual property and third-party acquisition and integration services costs.
o The Company excludes certain other items that management views as unrelated to the Company’s ongoing business, such as major restructuring and restructuring-related costs, goodwill and
indefinite- and long-lived asset impairments and litigation settlements and/or damages.
o Certain tax items that are unrelated to the fiscal year in which they are recorded are excluded in order to provide a clearer understanding of the Company’s ongoing Non-GAAP tax rate and after
tax earnings.
Note Regarding Use of Non-GAAP Financial Measures
20
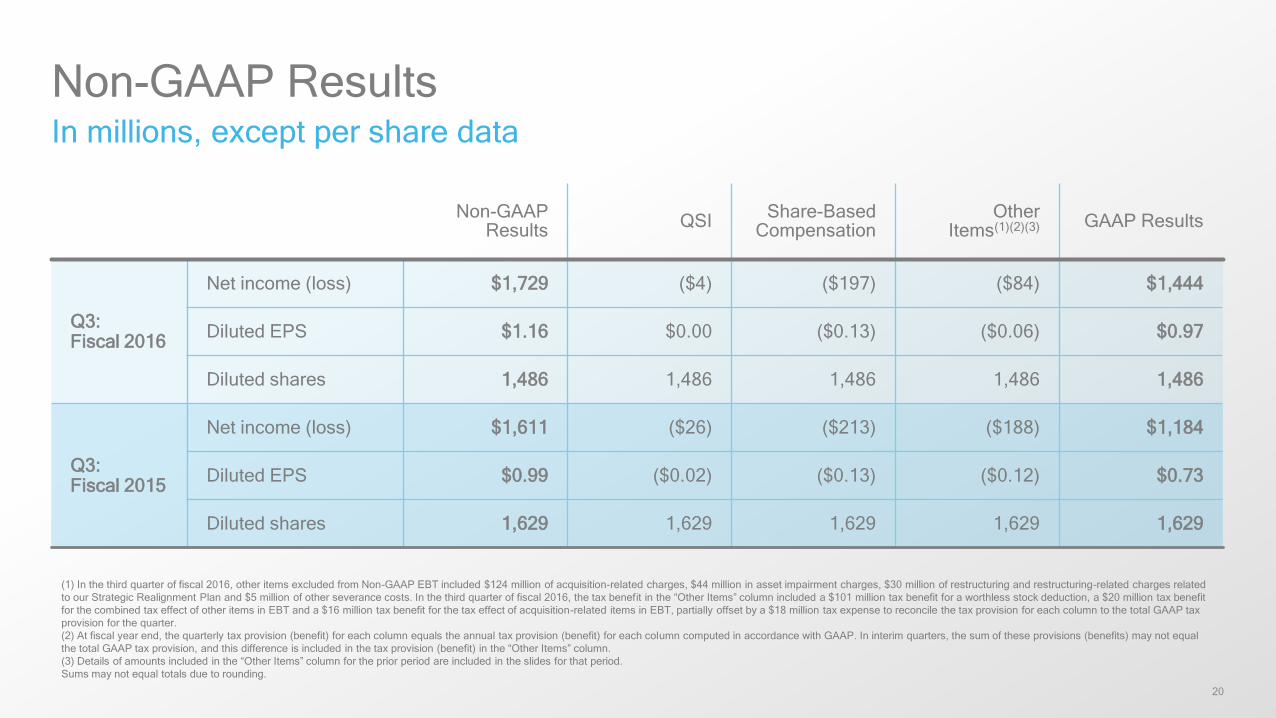
Non-GAAP ResultsIn millions, except per share data
Non-GAAP Results
QSIShare-Based
CompensationOther
Items(1)(2)(3) GAAP Results
Q3: Fiscal 2016
Net income (loss) $1,729 ($4) ($197) ($84) $1,444
Diluted EPS $1.16 $0.00 ($0.13) ($0.06) $0.97
Diluted shares 1,486 1,486 1,486 1,486 1,486
Q3: Fiscal 2015
Net income (loss) $1,611 ($26) ($213) ($188) $1,184
Diluted EPS $0.99 ($0.02) ($0.13) ($0.12) $0.73
Diluted shares 1,629 1,629 1,629 1,629 1,629
(1) In the third quarter of fiscal 2016, other items excluded from Non-GAAP EBT included $124 million of acquisition-related charges, $44 million in asset impairment charges, $30 million of restructuring and restructuring-related charges related
to our Strategic Realignment Plan and $5 million of other severance costs. In the third quarter of fiscal 2016, the tax benefit in the “Other Items” column included a $101 million tax benefit for a worthless stock deduction, a $20 million tax benefit
for the combined tax effect of other items in EBT and a $16 million tax benefit for the tax effect of acquisition-related items in EBT, partially offset by a $18 million tax expense to reconcile the tax provision for each column to the total GAAP tax
provision for the quarter.
(2) At fiscal year end, the quarterly tax provision (benefit) for each column equals the annual tax provision (benefit) for each column computed in accordance with GAAP. In interim quarters, the sum of these provisions (benefits) may not equal
the total GAAP tax provision, and this difference is included in the tax provision (benefit) in the “Other Items” column.
(3) Details of amounts included in the “Other Items” column for the prior period are included in the slides for that period.
Sums may not equal totals due to rounding.
21
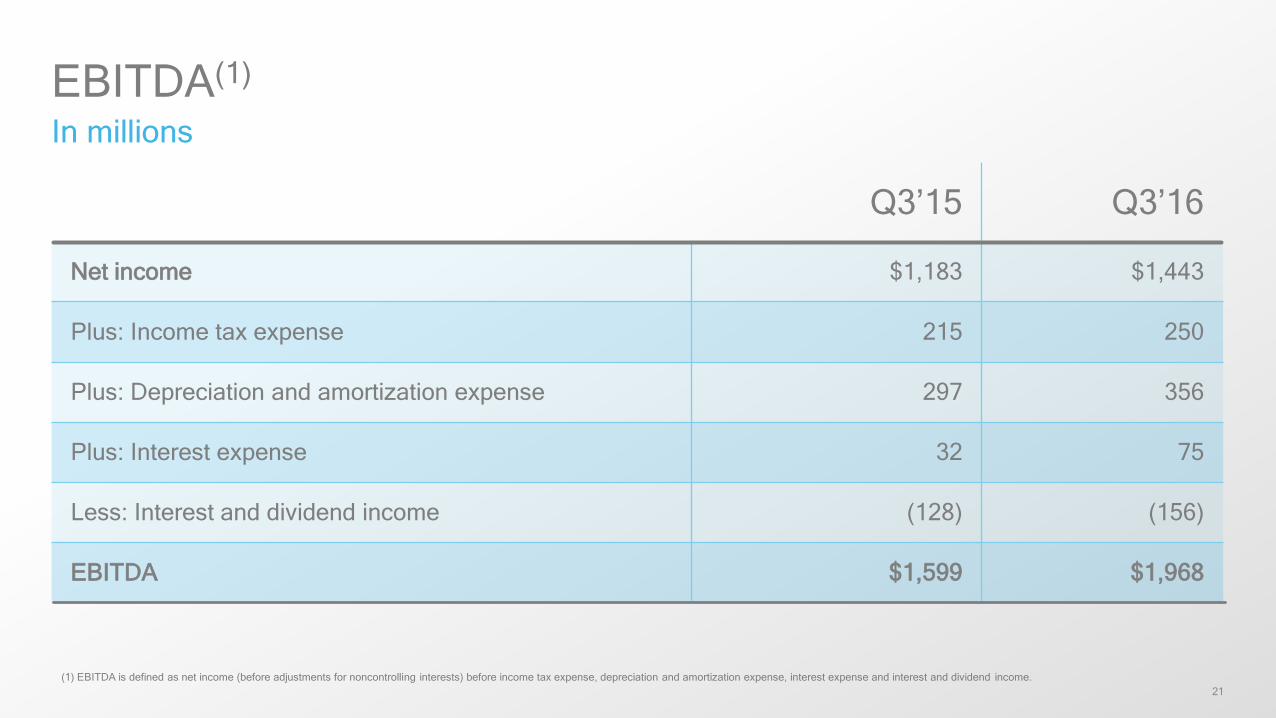
EBITDA(1)
In millions
(1) EBITDA is defined as net income (before adjustments for noncontrolling interests) before income tax expense, depreciation and amortization expense, interest expense and interest and dividend income.
Q3’15 Q3’16
Net income $1,183 $1,443
Plus: Income tax expense 215 250
Plus: Depreciation and amortization expense 297 356
Plus: Interest expense 32 75
Less: Interest and dividend income (128) (156)
EBITDA $1,599 $1,968
22
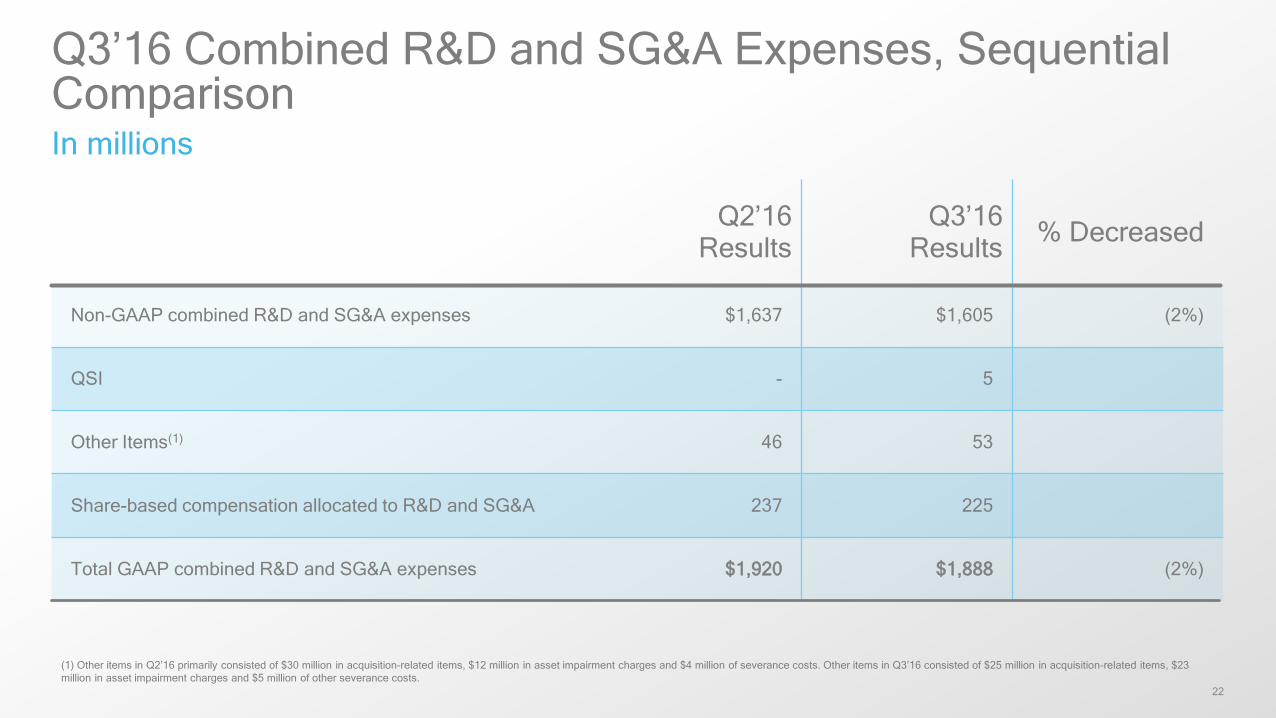
Q3’16 Combined R&D and SG&A Expenses, Sequential ComparisonIn millions
(1) Other items in Q2’16 primarily consisted of $30 million in acquisition-related items, $12 million in asset impairment charges and $4 million of severance costs. Other items in Q3’16 consisted of $25 million in acquisition-related items, $23
million in asset impairment charges and $5 million of other severance costs.
Q2’16 Results
Q3’16 Results
% Decreased
Non-GAAP combined R&D and SG&A expenses $1,637 $1,605 (2%)
QSI - 5
Other Items(1) 46 53
Share-based compensation allocated to R&D and SG&A 237 225
Total GAAP combined R&D and SG&A expenses $1,920 $1,888 (2%)
23
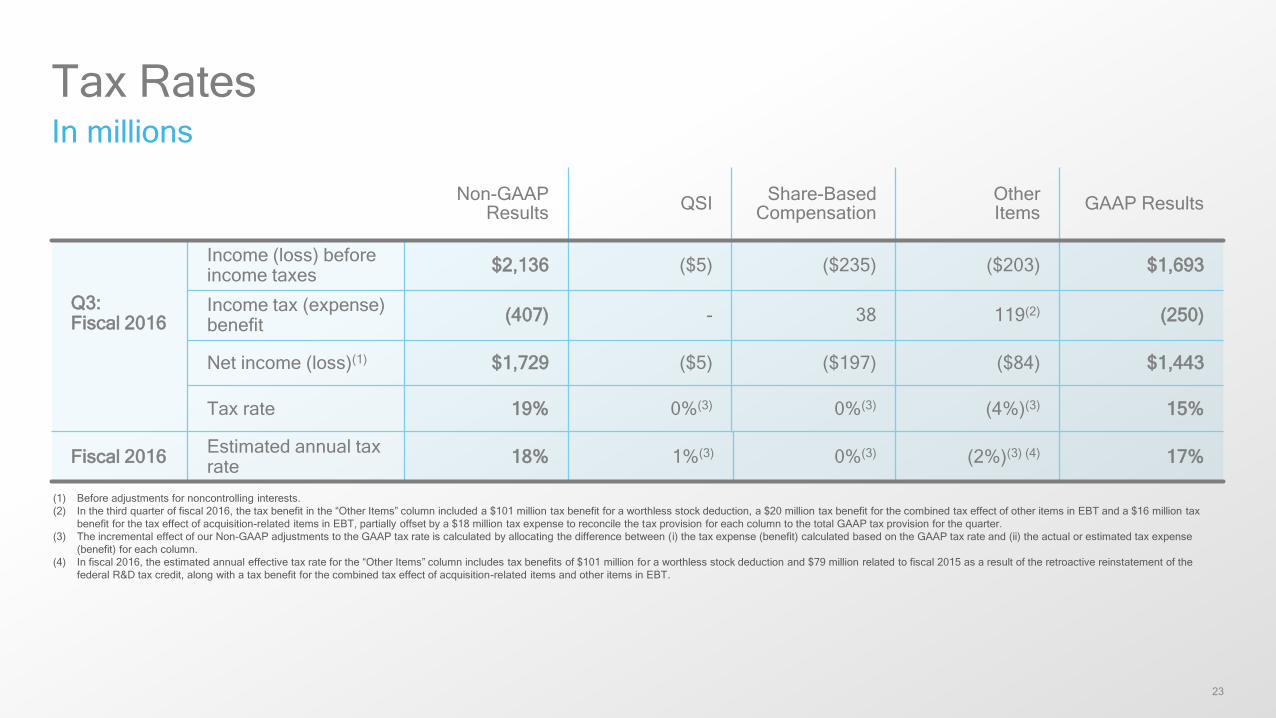
Tax RatesIn millions
Non-GAAP Results
QSIShare-Based
CompensationOther Items
GAAP Results
Q3: Fiscal 2016
Income (loss) before income taxes
$2,136 ($5) ($235) ($203) $1,693
Income tax (expense) benefit
(407) - 38 119(2) (250)
Net income (loss)(1) $1,729 ($5) ($197) ($84) $1,443
Tax rate 19% 0%(3) 0%(3) (4%)(3) 15%
(1) Before adjustments for noncontrolling interests.
(2) In the third quarter of fiscal 2016, the tax benefit in the “Other Items” column included a $101 million tax benefit for a worthless stock deduction, a $20 million tax benefit for the combined tax effect of other items in EBT and a $16 million tax
benefit for the tax effect of acquisition-related items in EBT, partially offset by a $18 million tax expense to reconcile the tax provision for each column to the total GAAP tax provision for the quarter.
(3) The incremental effect of our Non-GAAP adjustments to the GAAP tax rate is calculated by allocating the difference between (i) the tax expense (benefit) calculated based on the GAAP tax rate and (ii) the actual or estimated tax expense
(benefit) for each column.
(4) In fiscal 2016, the estimated annual effective tax rate for the “Other Items” column includes tax benefits of $101 million for a worthless stock deduction and $79 million related to fiscal 2015 as a result of the retroactive reinstatement of the
federal R&D tax credit, along with a tax benefit for the combined tax effect of acquisition-related items and other items in EBT.
Fiscal 2016Estimated annual tax rate
18% 1%(3) 0%(3) (2%)(3) (4) 17%
24
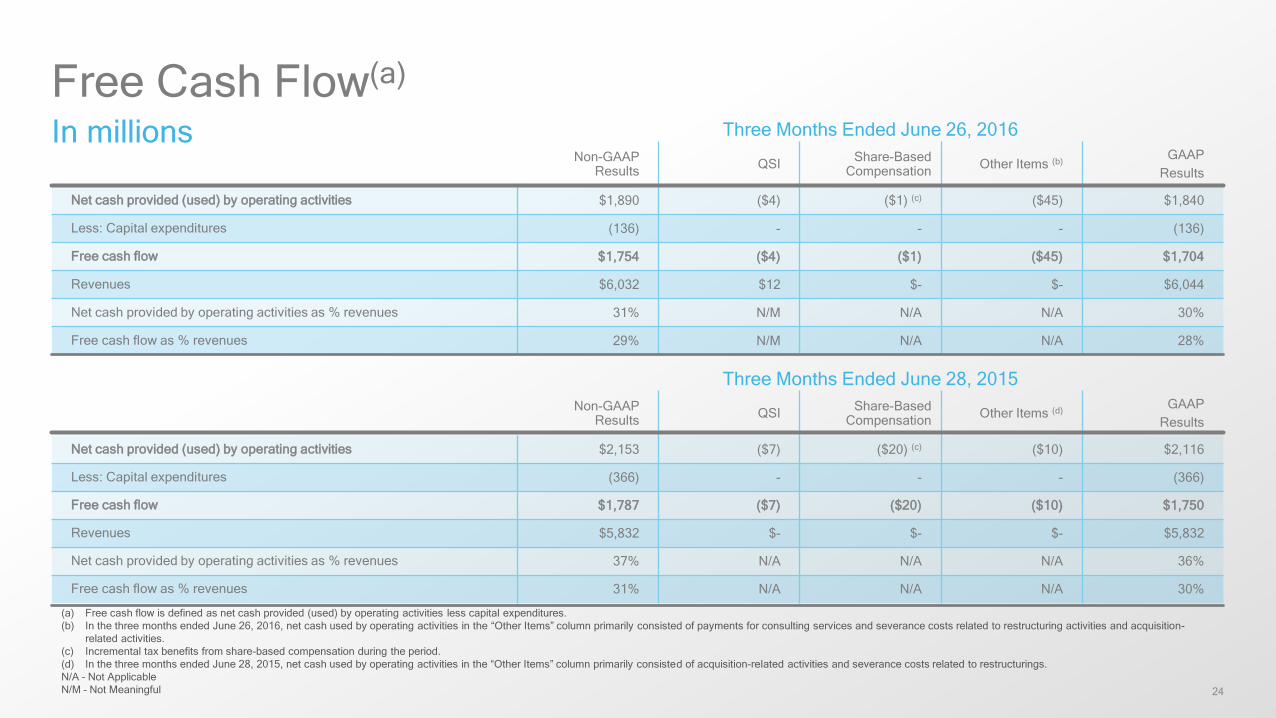
Three Months Ended June 26, 2016
Non-GAAP Results
QSIShare-Based
CompensationOther Items (b)
GAAP
Results
Net cash provided (used) by operating activities $1,890 ($4) ($1) (c) ($45) $1,840
Less: Capital expenditures (136) - - - (136)
Free cash flow $1,754 ($4) ($1) ($45) $1,704
Revenues $6,032 $12 $- $- $6,044
Net cash provided by operating activities as % revenues 31% N/M N/A N/A 30%
Free cash flow as % revenues 29% N/M N/A N/A 28%
Three Months Ended June 28, 2015
Non-GAAP Results
QSIShare-Based
CompensationOther Items (d)
GAAP
Results
Net cash provided (used) by operating activities $2,153 ($7) ($20) (c) ($10) $2,116
Less: Capital expenditures (366) - - - (366)
Free cash flow $1,787 ($7) ($20) ($10) $1,750
Revenues $5,832 $- $- $- $5,832
Net cash provided by operating activities as % revenues 37% N/A N/A N/A 36%
Free cash flow as % revenues 31% N/A N/A N/A 30%
Free Cash Flow(a)
In millions
(a) Free cash flow is defined as net cash provided (used) by operating activities less capital expenditures.
(b) In the three months ended June 26, 2016, net cash used by operating activities in the “Other Items” column primarily consisted of payments for consulting services and severance costs related to restructuring activities and acquisition-
related activities.
(c) Incremental tax benefits from share-based compensation during the period.
(d) In the three months ended June 28, 2015, net cash used by operating activities in the “Other Items” column primarily consisted of acquisition-related activities and severance costs related to restructurings.
N/A – Not Applicable
N/M – Not Meaningful

25
Nine Months Ended June 26, 2016
GAAP Results
Net cash provided by operating activities $5,316
Less: Capital expenditures (389)
Free cash flow $4,927
Cash paid to repurchase shares of our common stock (before commissions) $3,697
Cash dividends paid 2,208
Total return of capital to stockholders $5,905
Total return of capital to stockholders as a % of net cash provided by operating activities 111%
Total return of capital to stockholders as a % of free cash flow 120%
Free Cash Flow(a)
In millions
(a) Free cash flow is defined as net cash provided by operating activities less capital expenditures.
26
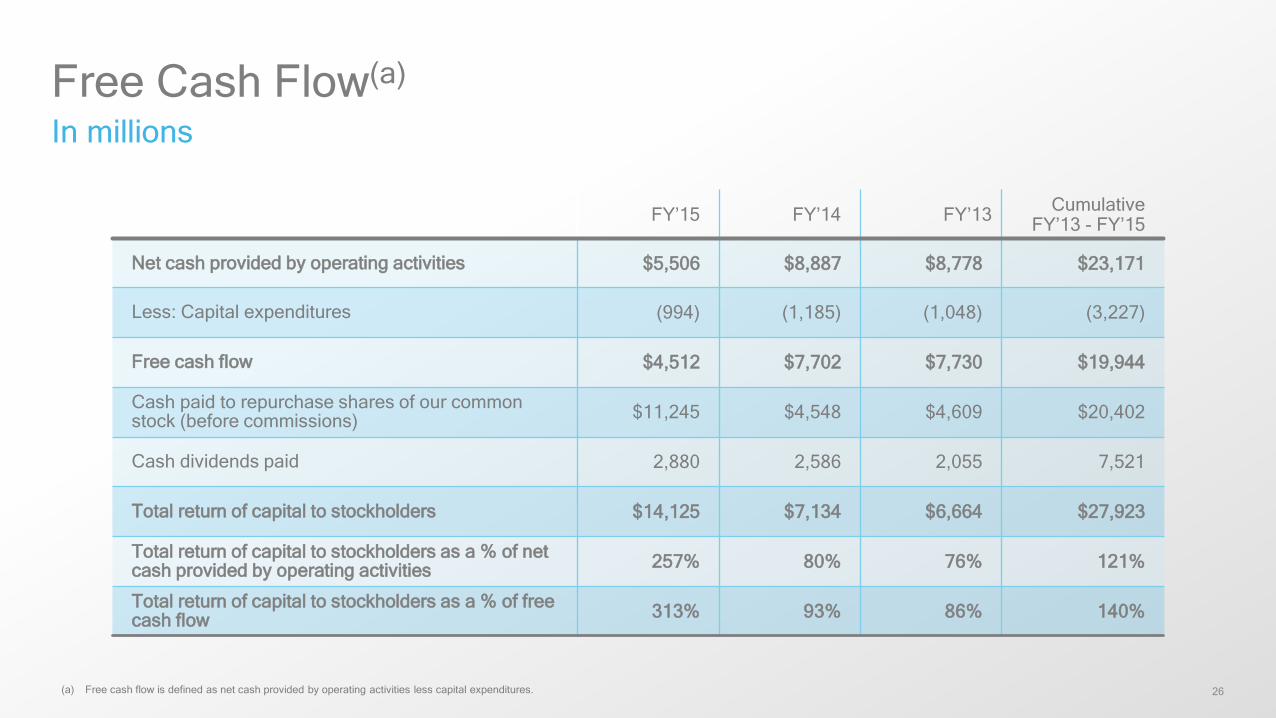
FY’15 FY’14 FY’13Cumulative
FY’13 - FY’15
Net cash provided by operating activities $5,506 $8,887 $8,778 $23,171
Less: Capital expenditures (994) (1,185) (1,048) (3,227)
Free cash flow $4,512 $7,702 $7,730 $19,944
Cash paid to repurchase shares of our commonstock (before commissions)
$11,245 $4,548 $4,609 $20,402
Cash dividends paid 2,880 2,586 2,055 7,521
Total return of capital to stockholders $14,125 $7,134 $6,664 $27,923
Total return of capital to stockholders as a % of net cash provided by operating activities
257% 80% 76% 121%
Total return of capital to stockholders as a % of free cash flow
313% 93% 86% 140%
Free Cash Flow(a)
In millions
(a) Free cash flow is defined as net cash provided by operating activities less capital expenditures.
27
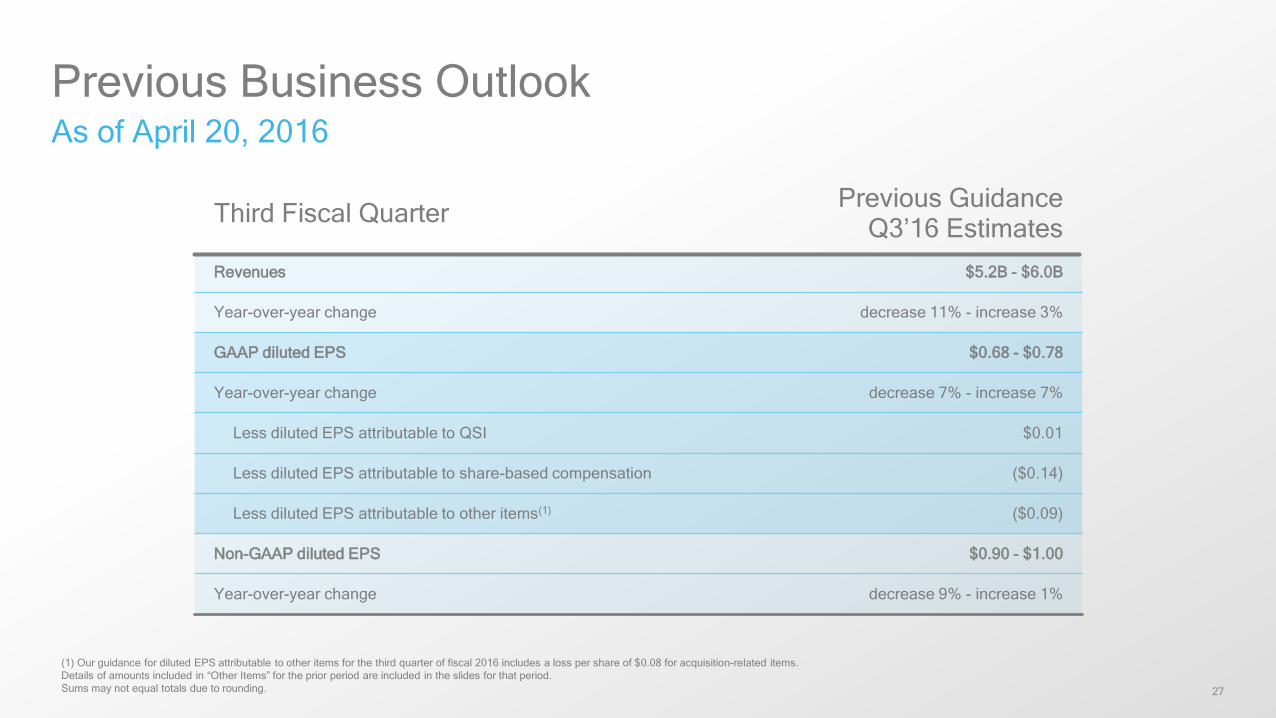
Previous Business OutlookAs of April 20, 2016
(1) Our guidance for diluted EPS attributable to other items for the third quarter of fiscal 2016 includes a loss per share of $0.08 for acquisition-related items.
Details of amounts included in “Other Items” for the prior period are included in the slides for that period.
Sums may not equal totals due to rounding.
Third Fiscal QuarterPrevious Guidance
Q3’16 Estimates
Revenues $5.2B - $6.0B
Year-over-year change decrease 11% - increase 3%
GAAP diluted EPS $0.68 - $0.78
Year-over-year change decrease 7% - increase 7%
Less diluted EPS attributable to QSI $0.01
Less diluted EPS attributable to share-based compensation ($0.14)
Less diluted EPS attributable to other items(1) ($0.09)
Non-GAAP diluted EPS $0.90 - $1.00
Year-over-year change decrease 9% - increase 1%

28
Business OutlookAs of July 20, 2016
(1) Our guidance for diluted EPS attributable to other items for the fourth quarter of fiscal 2016 includes a loss per share of $0.07 for acquisition-related items.
Details of amounts included in “Other Items” for the prior period are included in the slides for that period.
Sums may not equal totals due to rounding.
Fourth Fiscal Quarter Q4’15 ResultsCurrent Guidance
Q4’16 Estimates
Revenues $5.5B $5.4B - $6.2B
Year-over-year change decrease 1% - increase 14%
GAAP diluted EPS $0.67 $0.84 - $0.94
Year-over-year change increase 25% - 40%
Less diluted EPS attributable to QSI ($0.01) $0.01
Less diluted EPS attributable to share-based compensation ($0.12) ($0.13)
Less diluted EPS attributable to other items(1) ($0.12) ($0.09)
Non-GAAP diluted EPS $0.91 $1.05 - $1.15
Year-over-year change increase 15% - 26%
29
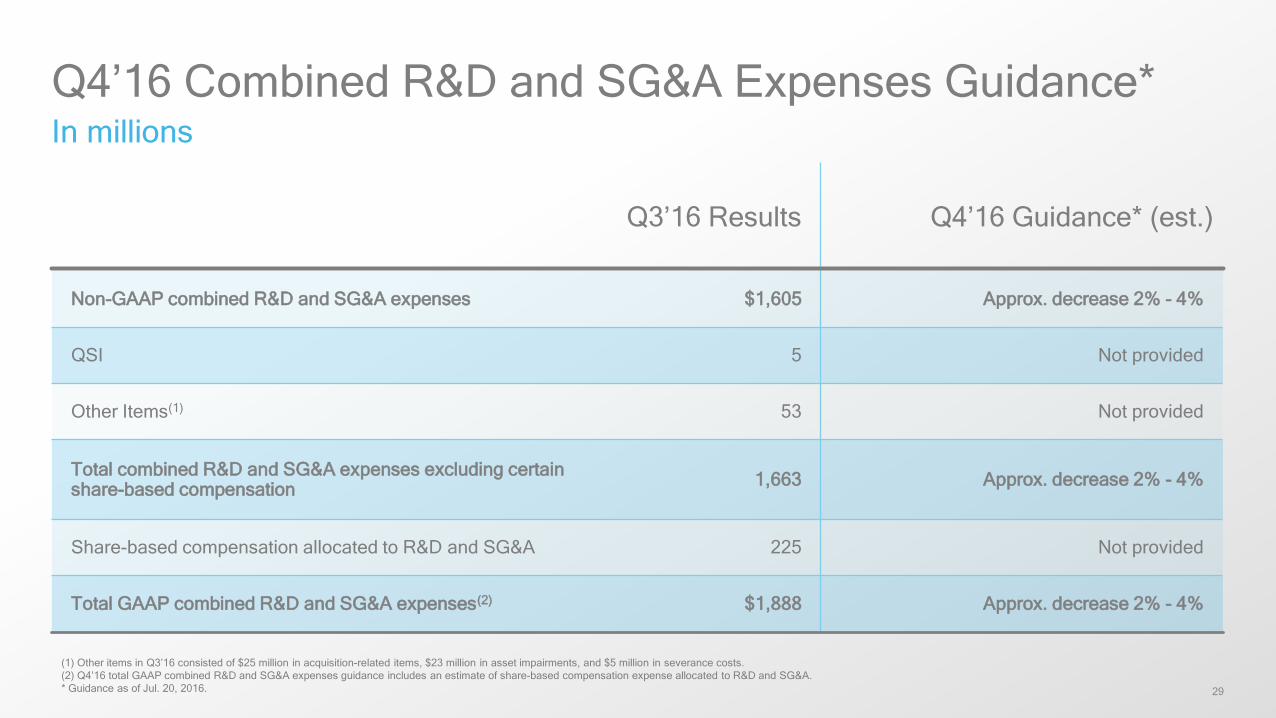
Q4’16 Combined R&D and SG&A Expenses Guidance*In millions
Q3’16 Results Q4’16 Guidance* (est.)
Non-GAAP combined R&D and SG&A expenses $1,605 Approx. decrease 2% - 4%
QSI 5 Not provided
Other Items(1) 53 Not provided
Total combined R&D and SG&A expenses excluding certain share-based compensation
1,663 Approx. decrease 2% - 4%
Share-based compensation allocated to R&D and SG&A 225 Not provided
Total GAAP combined R&D and SG&A expenses(2) $1,888 Approx. decrease 2% - 4%
(1) Other items in Q3’16 consisted of $25 million in acquisition-related items, $23 million in asset impairments, and $5 million in severance costs.
(2) Q4’16 total GAAP combined R&D and SG&A expenses guidance includes an estimate of share-based compensation expense allocated to R&D and SG&A.
* Guidance as of Jul. 20, 2016.
30
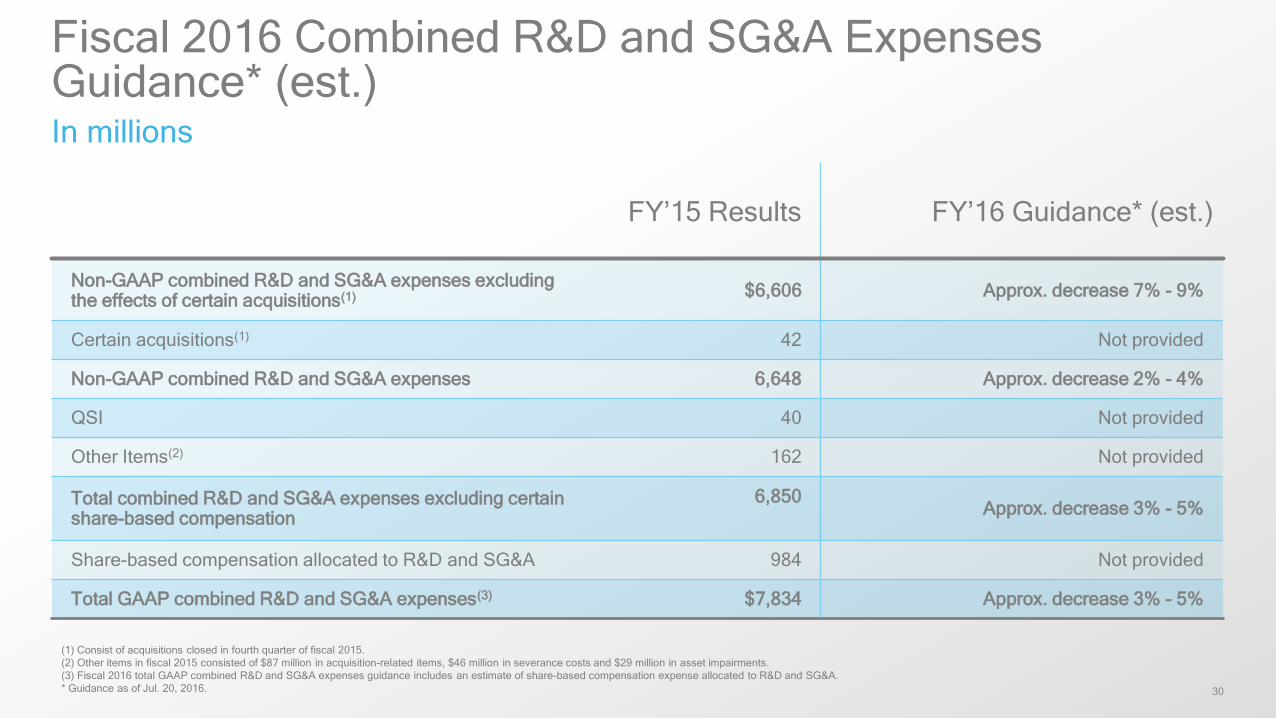
Fiscal 2016 Combined R&D and SG&A Expenses Guidance* (est.)In millions
(1) Consist of acquisitions closed in fourth quarter of fiscal 2015.
(2) Other items in fiscal 2015 consisted of $87 million in acquisition-related items, $46 million in severance costs and $29 million in asset impairments.
(3) Fiscal 2016 total GAAP combined R&D and SG&A expenses guidance includes an estimate of share-based compensation expense allocated to R&D and SG&A.
* Guidance as of Jul. 20, 2016.
FY’15 Results FY’16 Guidance* (est.)
Non-GAAP combined R&D and SG&A expenses excluding the effects of certain acquisitions(1) $6,606 Approx. decrease 7% - 9%
Certain acquisitions(1) 42 Not provided
Non-GAAP combined R&D and SG&A expenses 6,648 Approx. decrease 2% - 4%
QSI 40 Not provided
Other Items(2) 162 Not provided
Total combined R&D and SG&A expenses excluding certain share-based compensation
6,850Approx. decrease 3% - 5%
Share-based compensation allocated to R&D and SG&A 984 Not provided
Total GAAP combined R&D and SG&A expenses(3) $7,834 Approx. decrease 3% - 5%

Nothing in these materials is an offer to sell any of the components or devices referenced herein.
©2016 Qualcomm Technologies, Inc. and/or its affiliated companies. All Rights Reserved.
Qualcomm is a trademark of Qualcomm Incorporated, registered in the United States and other countries, used with permission. Other products and brand names may be trademarks or registered trademarks of their respective owners.
References in this presentation to “Qualcomm” may mean Qualcomm Incorporated, Qualcomm Technologies, Inc., and/or other subsi diaries or business units within the Qualcomm corporate structure, as applicable.
Qualcomm Incorporated includes Qualcomm’s licensing business, QTL, and the vast majority of its patent portfolio. Qualcomm Technologies, Inc., a wholly-owned subsidiary of Qualcomm Incorporated, operates, along with its subsidiaries, substant ially all of Qualcomm’s engineering, research and development functions, and substantially all of its product and services businesses, inc luding its semiconductor business, QCT.
Thank you
Follow us on:
For more information, visit us at:
www.qualcomm.com & www.qualcomm.com/blog