third quarter financial results fiscal year 2017 (ending ... · industrial products ... pc, other...
TRANSCRIPT

© SEIKO EPSON CORPORATION 2018. All rights reserved.
Third Quarter Financial ResultsFiscal Year 2017(Ending March 2018)
January 31, 2018
1
Disclaimer regarding forward-looking statements
Note regarding business profit
The foregoing statements regarding future results reflect the Companyʼs expectations based on information available at the time of announcement. The information contains certain forward-looking statements that are subject to known and unknown risks and uncertainties that could cause actual results to differ materially from those expressed or implied by such statements. Such risks and uncertainties include, but are not limited to, the competitive environment, market trends, general economic conditions, technological changes, exchange rate fluctuations and our ability to continue to timely introduce new products and services.
Numerical values presented hereinNumbers are rounded down to the unit indicated. Percentages are rounded off to one decimal place.
Business profit is calculated by deducting cost of sales and SGA expenses from revenue.Although not defined in the statement of consolidated comprehensive income, this indicator is very similar to the concept of operating income under J-GAAP. Epson will present this information as a reference, as the Company believes users of financial statements will find it useful when evaluating Epson's financial performance.

2
1. FY2017 Q3 Financial Results
2. FY2017 Financial Outlook
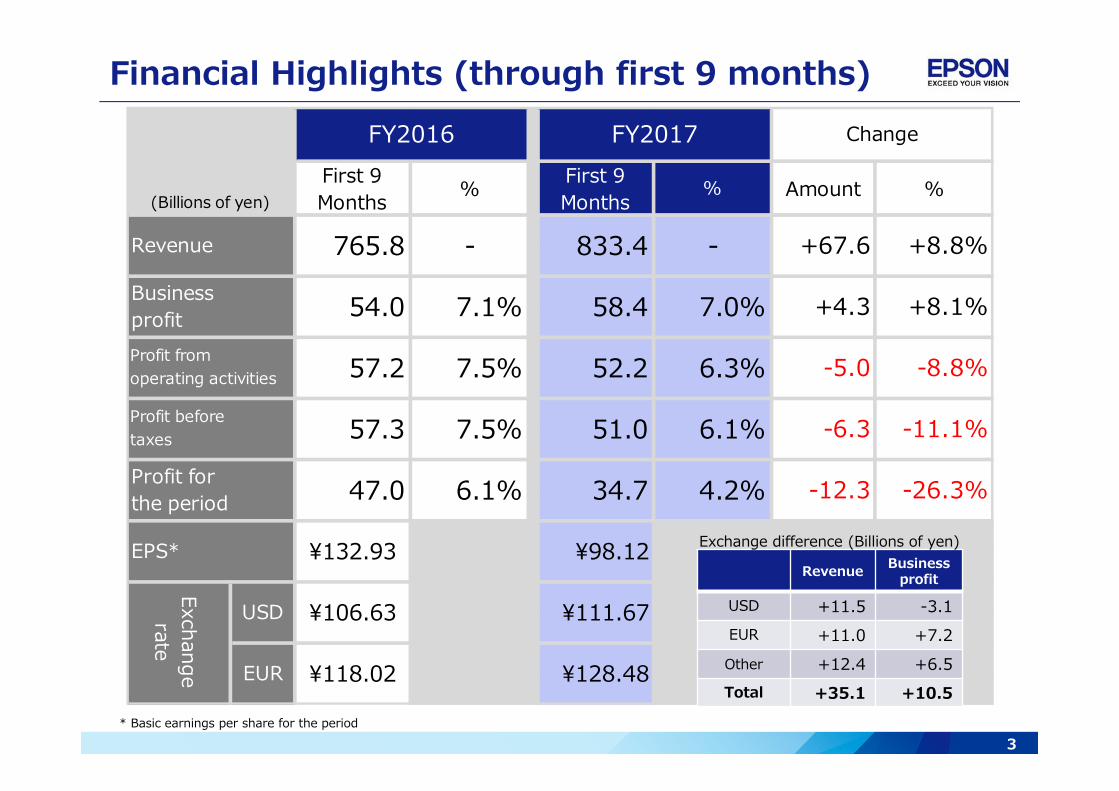
3
First 9Months % First 9
Months% Amount %
(Billions of yen)
FY2016
833.4 - +67.6
FY2017 Change
+8.8%
Businessprofit 54.0
Revenue 765.8 -
7.1% 58.4 7.0% +4.3 +8.1%
-8.8%Profit fromoperating activities 57.2 7.5% 52.2
7.5% 51.0 6.1% -6.3
6.3% -5.0
EPS* ¥132.93 ¥98.12
-11.1%
Profit forthe period 47.0
Profit beforetaxes 57.3
6.1% 34.7 4.2% -12.3 -26.3%
¥111.67
EUR ¥118.02 ¥128.48
Exchangerate
USD ¥106.63
Financial Highlights (through first 9 months)
* Basic earnings per share for the period
Revenue Business profit
USD +11.5 -3.1EUR +11.0 +7.2Other +12.4 +6.5Total +35.1 +10.5
Exchange difference (Billions of yen)

4
Q3 Actual % Q3 Actual % Amount %
FY2016
+10.0%
FY2017 Change
+27.8278.2 - 306.1 -Revenue
(Billions of yen)
9.9%
-3.3%
+1.9 +6.9%
Profit fromoperating activities
Businessprofit 28.3 10.2% 30.3
29.5 10.6% 28.5 9.3% -0.9
9.2%
-31.3%
-2.2 -7.5%
Profit forthe period
Profit beforetaxes 30.3 10.9% 28.0
28.4 10.2% 19.5 6.4% -8.9
EUR ¥117.78 ¥132.96
EPS* ¥81.03 ¥55.57
Exchangerate
USD ¥109.30 ¥112.92
Financial Highlights (Third Quarter)
* Basic earnings per share for the period
Revenue Business profit
USD +2.8 -0.7EUR +6.0 +4.2Other +4.6 +2.1Total +13.5 +5.5
Exchange difference (Billions of yen)

5
Quarterly Revenue Trend By business segment
157.3 161.3192.3 175.6 165.9 176.1
211.6
41.6 46.0
45.9 46.0 46.3
52.8
51.6 40.4 40.5
39.837.7 43.0
43.2
42.30.3 0.3
0.40.4 0.2
0.2
0.2
0.0
50.0
100.0
150.0
200.0
250.0
300.0
350.0
2016/Q1Actual
2016/Q2Actual
2016/Q3Actual
2016/Q4Actual
2017/Q1Actual
2017/Q2Actual
2017/Q3Actual
(Billionsof yen)
Y/Y +5.7
Y/Y +19.2
Y/Y +27.8
Y/Y +2.5
Y/Y +0.5
Consolidated total
Corporate,Adjustment
Other
Visual Communications
Printing Solutions
Wearable & Industrial Products
-0.6 0.1 -0.3 -0.7 -0.8 0.0 0.2
239.0 248.4 278.2 259.0 254.8 272.5 306.1
6
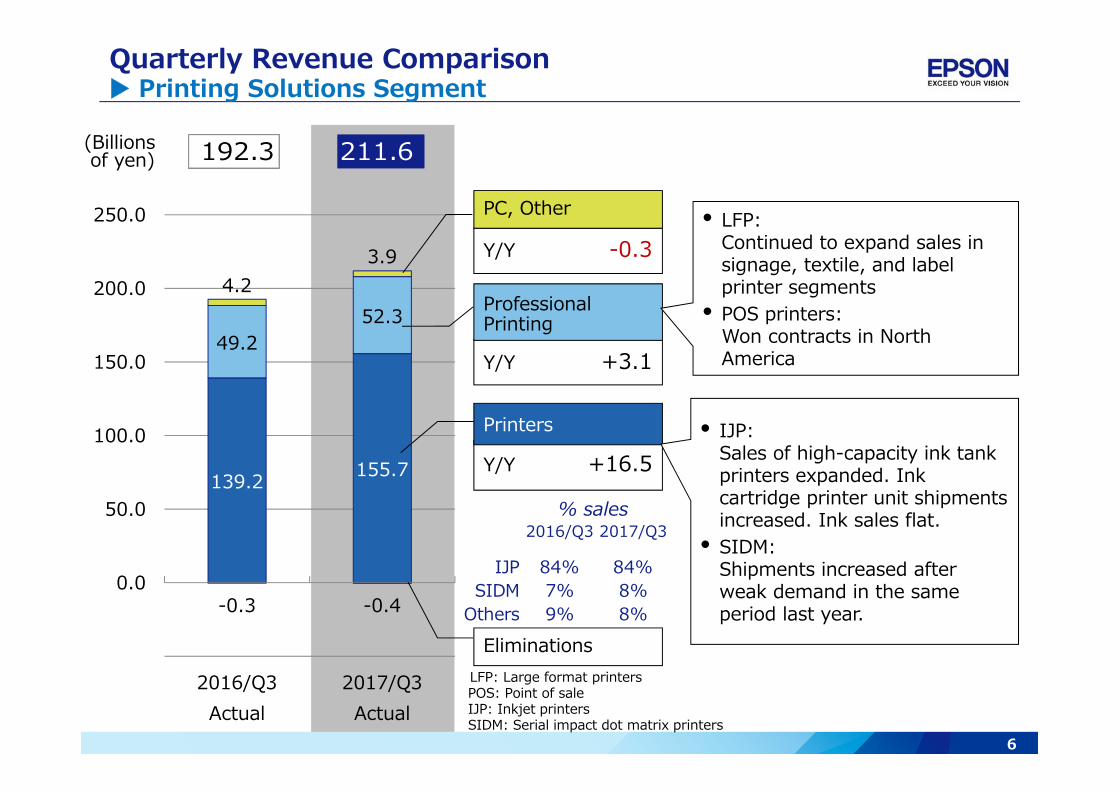
Quarterly Revenue Comparison Printing Solutions Segment
139.2 155.7
49.252.3
4.23.9
-0.3 -0.40.0
50.0
100.0
150.0
200.0
250.0
2016/Q3Actual
2017/Q3Actual
LFP: Large format printersPOS: Point of saleIJP: Inkjet printersSIDM: Serial impact dot matrix printers
Y/Y +16.5
Eliminations
% sales
Printers
2016/Q3 2017/Q3
IJP 84% 84%SIDM 7% 8%
Others 9% 8%
192.3 211.6(Billionsof yen)
Y/Y +3.1
Y/Y -0.3
Professional Printing
PC, Other
• IJP: Sales of high-capacity ink tank printers expanded. Ink cartridge printer unit shipments increased. Ink sales flat.
• SIDM:Shipments increased after weak demand in the same period last year.
• LFP: Continued to expand sales in signage, textile, and label printer segments
• POS printers:Won contracts in North America

7
Expansion of High-Capacity Ink Tank Printers The global market for high-capacity ink tank printers is steadily expanding,
and they have established a presence in the A4 printer* market. Epsonʼs unit shipments have continued to grow even after competitors
entered the market.
0
50
100
150
200
250
300Company CCompany BCompany AEpson
Epsonʼsshare:approx.
70%
0%
10%
20%
30%
40%
50%
60%
70%
80%
90%
100%
Global unit shipments of high-capacity ink tank printers
Global A4 printer* market trend(10k units)Inkjet printers (ink cartridge models)
Inkjet printers (high-capacity ink tank models)
Source: Seiko Epson, based on IDC Worldwide Quarterly Hardcopy Peripherals Tracker 2017Q3Reproduction or republication of this data is prohibited.
Source: Seiko Epson, based on IDC Worldwide Quarterly Hardcopy Peripherals Tracker 2017Q3Reproduction or republication of this data is prohibited.
Laser printers (21 ppm or more)Laser printers (1-20 ppm)
* Printers include multifunction printers.

8
Global launch completed by December
Continue to strengthen the sales organization and promotions in every region. Hire specialist sales and support staff. Create more opportunities to
demonstrate performance. Strengthen relationships with
dealers/distributors.
Respond to new customer needs. Effectively promote environmental
benefits to growing number of companiesinterested in reducing office environmental impacts.
Add functions requested by customers.
High-Speed Linehead Inkjet MFP Initiatives

9
Quarterly Revenue Comparison Visual Communications Segment
45.951.6
0.0
10.0
20.0
30.0
40.0
50.0
60.0
2016/Q3Actual
2017/Q3Actual
Visual Communications
Y/Y +5.7
45.9 51.6(Billionsof yen)
• Projectors: Unit shipments increased.
Conceptual image of a possible projector use

10
Quarterly Revenue Comparison Wearable & Industrial Products Segment
13.0 13.2
3.6 5.3
24.425.4
-1.2 -1.60.0
10.0
20.0
30.0
40.0
50.0
2016/Q3Actual
2017/Q3Actual
(Billionsof yen) 39.8 42.3
Y/Y +0.1
Y/Y +1.7
Y/Y +0.9
Eliminations
Microdevices,Other
Robotics Solutions
Wearable Products
• Crystal devices: Sales to consumer products manufacturers declined.
• Semiconductors: Internal sales, external sales & foundry orders were all strong.
• Watches: Revenue flat year on year
• Robots: Revenue continued to expand on growth in sales of robots for mobile product assembly applications in Greater China and automotive parts and electronics parts in Europe.

11
Quarterly Selling, General and Administrative Expenses
(% revenue)
23.6 22.7 23.9 25.5 25.6 25.6 26.0
12.5 13.7 13.4 12.9 12.3 12.0 12.86.2 6.7 7.7 8.5 6.6 8.3 9.64.0 4.8 5.4 6.6
3.9 5.3 6.323.6 23.7
26.027.5
25.829.7
30.4
29.4% 28.9% 27.6%31.4% 29.2% 29.8%
27.9%
0
10
20
30
40
50
60
70
80
90
100
2016/Q1 2016/Q2 2016/Q3 2016/Q4 2017/Q1 2017/Q2 2017/Q3
76.670.1 74.5 85.371.9(Billionsof yen) 81.4 81.1
Y/Y +4.4
Y/Y +0.8
Y/Y +1.9
Y/Y +2.1
Y/Y +8.7
Y/Y -0.6
Research &Development
Salaries & Wages
Sales Promotions
Advertising
Other
Consolidated total

12
Quarterly Business Profit Trend By business segment
12.821.0
31.7
18.4 22.113.8
35.12.1
5.0
4.7
4.25.2
7.4
5.6
1.6
2.3
2.5
1.22.3
2.4
1.9
-0.2 -0.0 -0.1 -0.0 -0.1 -0.1 -0.1 -9.9 -9.0 -10.5 -12.1 -12.8 -12.2 -12.3
0.0
10.0
20.0
30.0
40.0
50.0
2016/Q1Actual
2016/Q2Actual
2016/Q3Actual
2016/Q4Actual
2017/Q1Actual
2017/Q2Actual
2017/Q3Actual
Y/Y +0.9
Y/Y +3.4
Y/Y +1.9
Y/Y -0.5
Y/Y -1.7
Consolidated total
Corporate,Adjustment
Other
Printing Solutions
Wearable & Industrial Products
Visual Communications
(Billionsof yen) 6.4 19.2 28.3 11.7 16.7 11.3 30.3
13
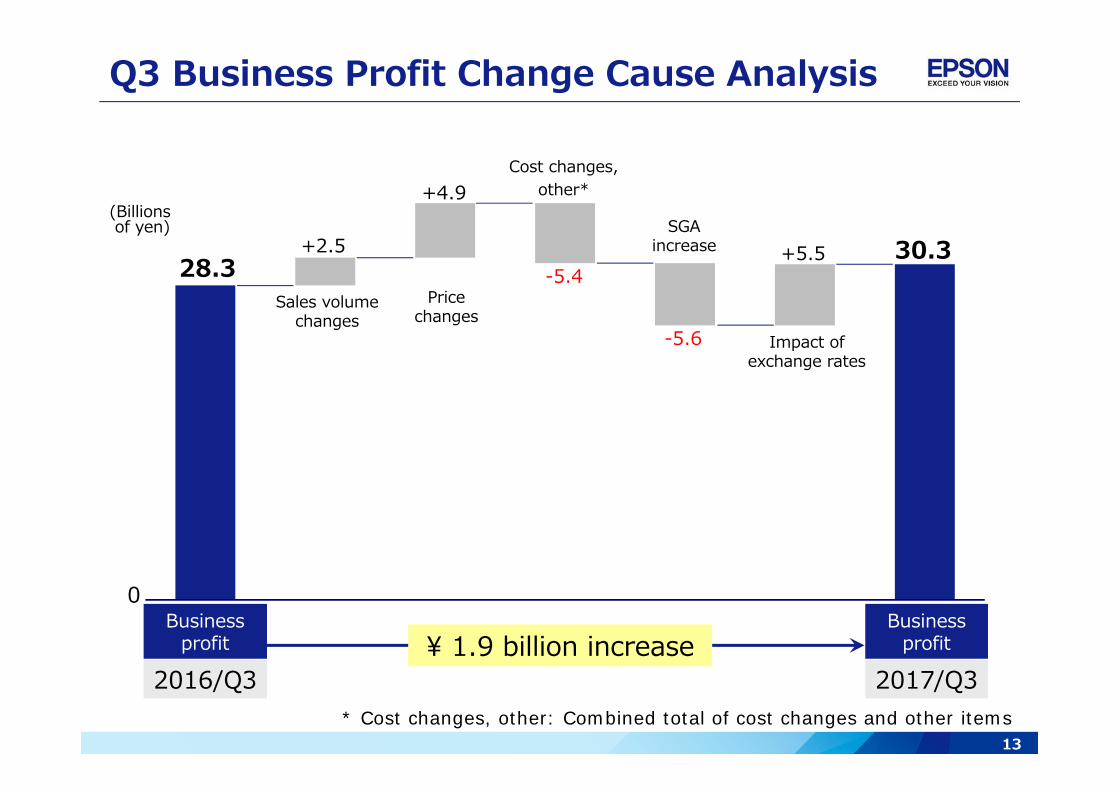
2017/Q3
Q3 Business Profit Change Cause Analysis
0
2016/Q3
Business profit
Business profit¥ 1.9 billion increase
* Cost changes, other: Combined total of cost changes and other items
30.3+2.5
-5.6
+4.9
28.3 -5.4+5.5
Impact of exchange rates
Sales volume changes
Pricechanges
Cost changes,other*
SGA increase
(Billionsof yen)
14
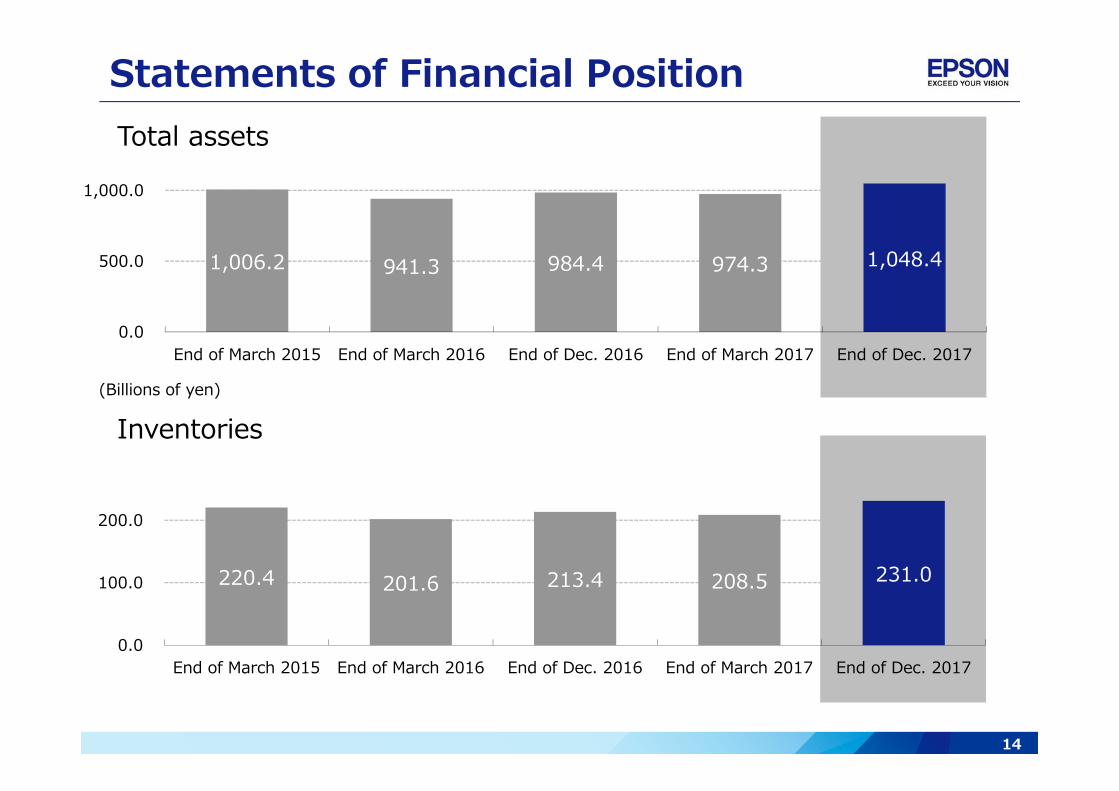
Statements of Financial Position
1,006.2 941.3 984.4 974.3 1,048.4
0.0
500.0
1,000.0
End of March 2015 End of March 2016 End of Dec. 2016 End of March 2017 End of Dec. 2017
220.4 201.6 213.4 208.5 231.0
0.0
100.0
200.0
End of March 2015 End of March 2016 End of Dec. 2016 End of March 2017 End of Dec. 2017
Total assets
Inventories(Billions of yen)

15
Statements of Financial Position
185.9 141.7 140.6 146.5 176.4
18.5% 15.1% 14.3% 15.0% 16.8%
0.0
200.0
400.0
End of March 2015 End of March 2016 End of Dec. 2016 End of March 2017 End of Dec. 2017
494.3 467.8 488.4 492.1 525.3
49.1% 49.7% 49.6% 50.5% 50.1%
0.0
200.0
400.0
600.0
End of March 2015 End of March 2016 End of Dec. 2016 End of March 2017 End of Dec. 2017
Interest-bearing liabilities and ratio of interest-bearing liabilities
Equity and equity ratio attributable to owners of the parent company
(Billions of yen)

16
1. FY2017 Q3 Financial Results
2. FY2017 Financial Outlook

17
Actual % 10/26Outlook % 1/31
Outlook % Y/Y Vs.10/26 outlook
+85.1 +40.0+8.3% +3.7%+13.1 ±0
+20.0% ±0%+4.1 -4.0
+6.1% -5.3%+4.5 -4.0
+6.7% -5.3%+2.5 -7.0
+5.3% -12.1%
Businessprofit 65.8 6.4% 79.0 7.4%
¥144.79
¥111.00
¥129.00
72.0 6.5%
51.0 4.6%
¥136.82
¥108.38
¥118.79
¥164.67
¥110.00
¥125.00
67.4 6.6%
48.4 4.7%
Change(amount, %)
76.0
76.0 6.5%
7.1%
Profit fromoperating activities 7.1% 72.067.8 6.6%
EPS*1
Exchangerate
USD
EUR
Profit beforetaxes
Profit forthe year
(Billionsof yen)
FY2016 FY2017
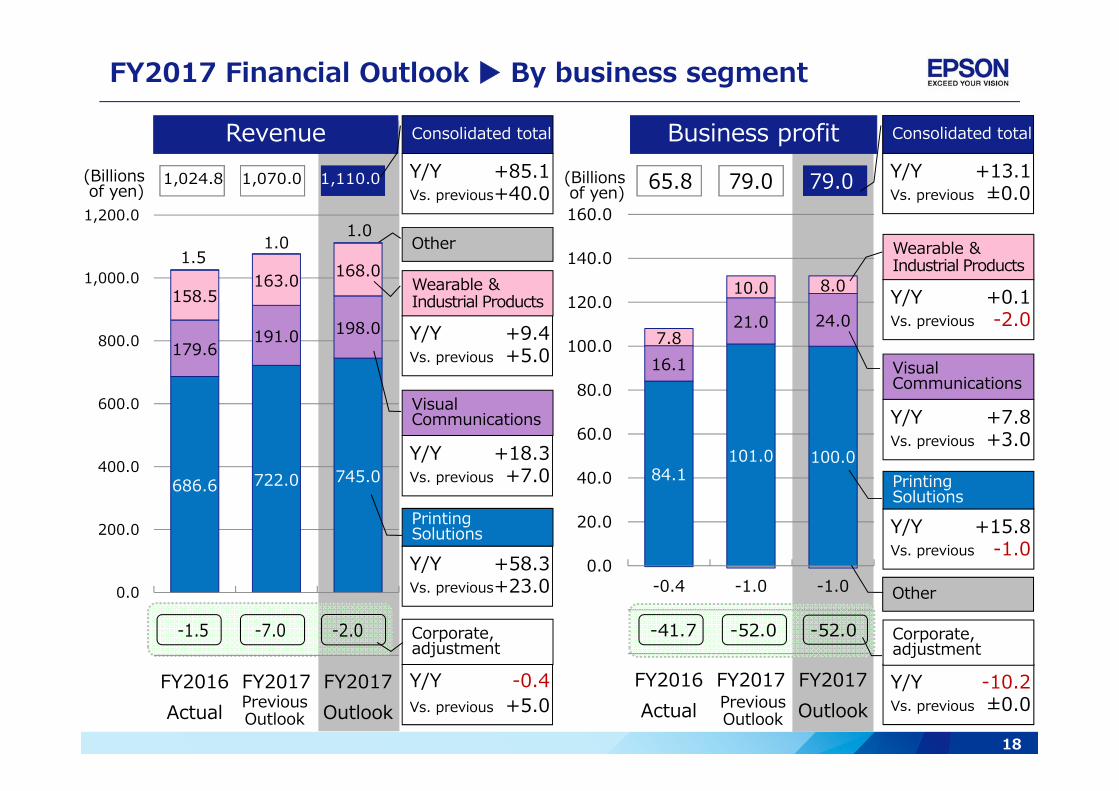
Revenue 1,024.8 - 1,070.0 - 1,110.0 -
7.1%
58.0 5.4%
79.0
FY2017 Financial Outlook
Exchange rate assumptions from Q4
USD ¥110
EUR ¥130Exchange
sensitivity *2Revenue Business
profit
USD -3.0 +0.4
EUR -1.5 -1.0
Other -2.8 -1.1*1: Basic earnings per share for the year*2: Annual impact of a 1-yen increase in the value of the yen versus the USD & EUR (in billions of yen)
Annual impact of a 1% increase in the value of the yen versus other currencies (in billions of yen)
18
Revenue Business profit
84.1101.0 100.0
16.1
21.0 24.07.8
10.0 8.0
-0.4 -1.0 -1.00.0
20.0
40.0
60.0
80.0
100.0
120.0
140.0
160.0
FY2016Actual
FY2017 FY2017Outlook
686.6 722.0 745.0
179.6191.0 198.0
158.5163.0 168.0
1.51.0
1.0
0.0
200.0
400.0
600.0
800.0
1,000.0
1,200.0
FY2016Actual
FY2017 FY2017Outlook
FY2017 Financial Outlook By business segment
1,024.8 1,070.0 1,110.0(Billionsof yen)
(Billionsof yen)
-1.5 -7.0 -2.0
PreviousOutlook
PreviousOutlook
Y/Y +18.3Vs. previous +7.0
Y/Y +9.4Vs. previous +5.0
Y/Y -0.4Vs. previous +5.0
Y/Y +58.3Vs. previous+23.0
Y/Y +85.1Vs. previous+40.0
Consolidated total
Other
Wearable & Industrial Products
Visual Communications
Printing Solutions
Corporate,adjustment
-41.7 -52.0 -52.0
65.8 79.0 79.0
Y/Y +7.8Vs. previous +3.0
Y/Y +0.1Vs. previous -2.0
Y/Y -10.2Vs. previous ±0.0
Y/Y +15.8Vs. previous -1.0
Y/Y +13.1Vs. previous ±0.0
Consolidated total
Other
Wearable & Industrial Products
Visual Communications
Printing Solutions
Corporate,adjustment

19
Key Factors Shaping the FY2017 Financial Outlook
Progress in initiatives to drive growth Continued expansion in sales of high-capacity ink tank printers Launched high-speed linehead inkjet MFPs globally Sales growth in signage, textile & label LFPs, projectors, and
robots Changes in business environment factored in
Foreign exchange assumptions revised (Q4:USD ¥110/EUR ¥130) Prices for parts and materials to rise further Printers: Environmental changes to affect ink cartridge printer
and ink sales Microdevices (quartz): Fluctuating demand from mobile device
manufacturers in China Wearable products: Sluggish sales for some new productsThe business environment has changed but growth-
generating revenue is expanding, and we will continue to invest in future growth.
20
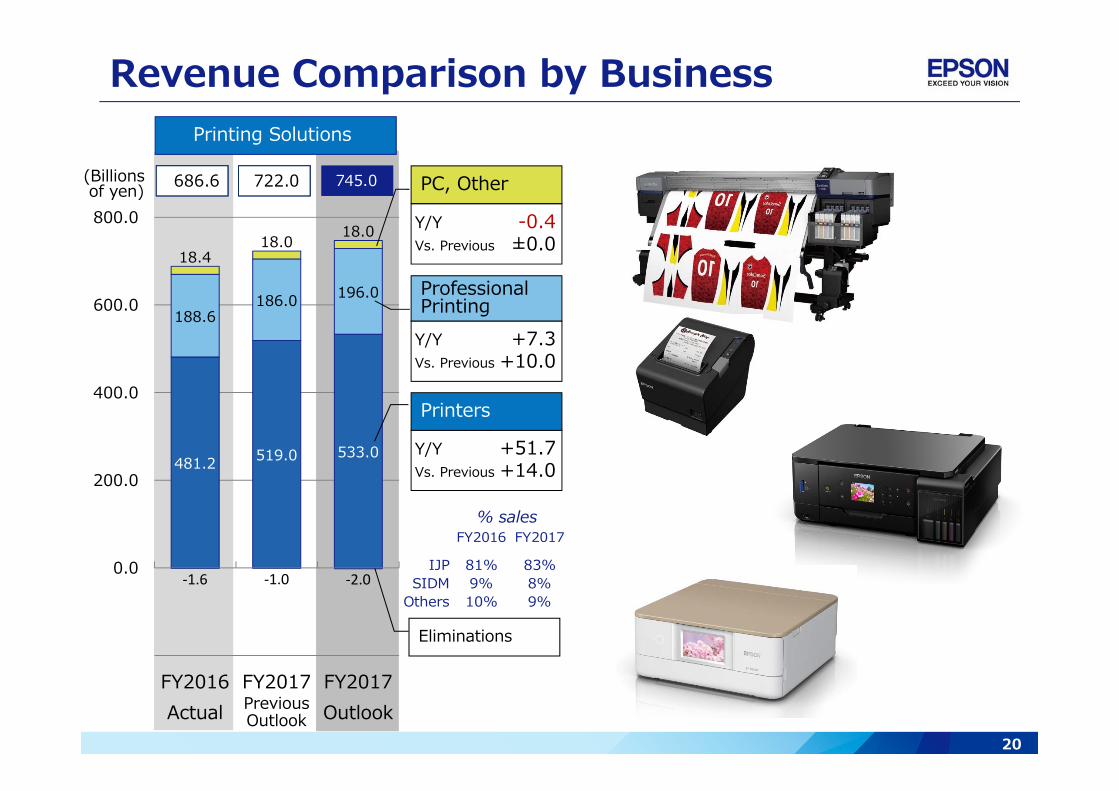
Revenue Comparison by Business Printing Solutions
481.2 519.0 533.0
188.6186.0 196.0
18.418.0 18.0
‐1.6 ‐1.0 ‐2.00.0
200.0
400.0
600.0
800.0
FY2016Actual
FY2017 FY2017Outlook
686.6 722.0 745.0
PreviousOutlook
(Billionsof yen)
Y/Y +51.7Vs. Previous +14.0
Y/Y +7.3Vs. Previous +10.0
Y/Y -0.4Vs. Previous ±0.0
Printers
PC, Other
Professional Printing
Eliminations
% salesFY2016 FY2017
IJP 81% 83%SIDM 9% 8%
Others 10% 9%

21
Revenue Comparison by Business Wearable &
Industrial Products
50.7 48.0 49.0
16.9 22.0 25.0
96.5 98.0 100.0
-5.6 -5.0 -6.00.0
20.0
40.0
60.0
80.0
100.0
120.0
140.0
160.0
180.0
200.0
FY2016Actual
FY2017 FY2017Outlook
Visual Communications
179.6 191.0 198.0
0.0
50.0
100.0
150.0
200.0
250.0
FY2016Actual
FY2017 FY2017Outlook
(Billionsof yen)
(Billionsof yen)
PreviousOutlook
PreviousOutlook
179.6 191.0 198.0 158.5 163.0 168.0
Y/Y +18.3Vs. Previous +7.0
Visual Communications
Y/Y -1.7Vs. Previous +1.0
Y/Y +8.0Vs. Previous +3.0
Y/Y +3.4Vs. Previous +2.0
Eliminations
Microdevices,Other
Robotics Solutions
Wearable Products

22
48.8 47.8 53.1 52.7 54.0
0.0
50.0
FY2013 FY2014 FY2015 FY2016 FY2017
Research & Development
R&D Costs, Capital Expenditure andDepreciation and Amortization Expenses
ActualActualActual Actual Outlook
(Billionsof yen)
(Billionsof yen)
ActualActualActual Actual Outlook
37.8 45.4
69.4 75.3 78.0
40.7 44.4 45.3 43.2 47.0
0.0
50.0
FY2013 FY2014 FY2015 FY2016 FY2017
Capital expendituresDepreciation and amortization
Capex breakdown by segment
FY2016Actual
FY2017Outlook
Printing Solutions 43.9 44.0 Visual Communications 10.2 14.0Wearable & Industrial Products 9.1 10.0Other, Corporate 11.9 10.0

23
114.8 108.8 113.0 96.8
106.0
-41.2 -32.7
-51.5
-75.7 -78.0
73.6 76.061.4
21.1 28.0
-100.0
0.0
100.0
FY2013 FY2014 FY2015 FY2016 FY2017
Free Cash Flows(Billions of yen) Cash flows from operating activities
Cash flows from investing activitiesFree cash flows
ActualActualActual Actual Outlook

24
10.4 10.68.7
6.9 7.88.9 9.3 7.8
6.4 7.1
27.726.3
9.5 10.1 9.9
0.0
10.0
20.0
30.0
40.0
FY2013 FY2014 FY2015 FY2016 FY2017
ROA:ROS:ROE:
(%)
Main Management Indicators
Business profit/ total assets (avg. balance)
Business profit/ revenue
Profit for the period attributable to owners of the parent company/Equity attributable to owners of the parent company (avg. balance)
ActualActualActual Actual Outlook

25
Shareholder Returns Epsonʼs first priority is to invest in growth, but we are also striving to build a
robust financial structure that is capable of withstanding changes in the business environment and to proactively reward shareholders.
Epson has set a consolidated dividend payout ratio*1 in the range of 40% as a medium-term target. We intend to be more active in giving back to shareholders by agilely repurchasing shares as warranted by share price, the capital situation, and other factors.
Dividends
1335
30 30 30 3037
8030 30 30 32
FY2013 FY2014 FY2015 FY2016 FY2017
Year-endInterim
Dividend per share (yen)*2
*1: The ratio is based on profit after an amount equivalent to the statutory effective tax rate is deducted from business profit, a profit category that shows profit from the Company's main operations (and which is very similar to the concept of operating income under J-GAAP both conceptually and numerically).
*2: Epson declared a 2-for-1 stock split, effective April 1, 2015. The graph height shows the level after the split.
Actual ActualActual Actual Previous Outlook
Current Outlook
FY2017 annual dividend outlook 62 yen(30-yen interim dividend & 32-yen year-end dividend outlook)

26
Reference

27
Product FY2016 Full year(Actual)
FY2017/Q1(Actual)
FY2017/Q2 (Actual)
FY2017/Q3 (Actual)
FY2017 Full year(Outlook)
Exchangerate USD / EUR ¥108.38 / ¥118.79 ¥111.08 / ¥122.12 ¥111.00 / ¥130.36 ¥112.92 / ¥132.96 ¥111.00 / ¥129.00
IJP
Volume +5% +7% +4% +13% +10%
Office/ high-capacity ink tank as % of total unit sales
Approx. 20%/Approx. 40% - - - Less than 20%/
Less than 50%
ASP - high single-digit % + low teen % + mid-teen % + low teen % + mid-teen %
Revenue - low single-digit % + high teen % Around +20% + mid 20% + high 20%
IJP ink
Volume (packs) -4% -2% -3% -7% -
ASP - low single-digit % + mid-single-digit % + high single-digit %
+ high single-digit % -
Revenue - mid-single-digit % + low single-digit % + mid-single-digit % Flat YoY + low single-
digit %
SIDMprinters
Volume +4% -25% -15% +19% -9%
ASP - high teen % + low single-digit % + high single-digit % Flat YoY + low single-
digit %
Revenue - mid-teen % - low 20% - high single-digit % + high teen % - high single-digit %
Projectors
Volume +6% -2% +1% +5% +3%
ASP - high single-digit % + mid-teen % + mid-teen % + high single-digit %
+ high single-digit %
Revenue - low single-digit % + low teen % + mid-teen % + low teen % Around +10%
Main Product Sales TrendsResults & outlook vs. previous fiscal year ASP (average selling prices) and sales amounts after conversion to yen
The indicators in this document are based on values tracked internally by Epson.

28
Major Business Indicators
Category FY2016Actual
FY2017Outlook
FY2018Target
Exchange rate USD ¥108.38 ¥111.00 ¥115.00EUR ¥118.79 ¥129.00 ¥125.00
Printing Solutions
Revenue 686.6 745.0 805.0
Business profit 84.1 100.0 -
Visual Communications
Revenue 179.6 198.0 200.0
Business profit 16.1 24.0 -
Wearable & Industrial Products
Revenue 158.5 168.0 195.0
Business profit 7.8 8.0 -
Other Revenue 1.5 1.0 0.0
Business profit -0.4 -1.0 -
Corporate,Adjustment
Revenue -1.5 -2.0 0.0
Business profit -41.7 -52.0 -Consolidated total Revenue 1,024.8 1,110.0 1,200.0
Business profit 65.8 79.0 96.0
ROS 6.4% 7.1% 8%
ROE 10.1% 9.9%Sustain at
at least 10%
(Billions of yen) (Billions of yen)
Category FY2016Actual
FY2017Outlook
3-yearcumulative
(FY2016-18 business plan)
USD ¥108.38 ¥111.00 ¥115.00EUR ¥118.79 ¥129.00 ¥125.00Operating CF 96.8 106.0 Approx.
330.0
FCF 21.1 28.0 Approx.120.0
Capitalexpenditure 75.3 78.0 Approx.
210.0
R&D costs 52.7 54.0 Invest aggressively

29