third quarter 2021 investor call
TRANSCRIPT
1
Third Quarter 2021 Investor CallCorning Reports Third-Quarter 2021 Results As Sales Reach All-Time High
Core sales and EPS grew 21% and 30% year over year, respectively, with free cash flow of $0.5 billion
Company on track to reach $14 billion in sales and over $2 in EPS for 2021
Sales and EPS growth with strong cash generation expected to continue in 2022
October 26, 2021

2
3© 2021 Corning Incorporated
Forward-Looking and Cautionary StatementsThe statements in this presentation that are not historical facts or information and contain words such as “will,” “believe,” “anticipate,” “expect,” “intend,” “plan,” “seek,” “see,” “would,” and “target” and similar expressions are forward-looking statements. These forward-looking statements are made pursuant to the safe harbor provisions of the Private Securities Litigation Reform Act of 1995 and include estimates and assumptions related to economic, competitive and legislative developments. Such statements relate to future events that by their nature address matters that are, to different degrees, uncertain. These forward-looking statements relate to, among other things, the Company’s future operating performance, the Company's share of new and existing markets, the Company's revenue and earnings growth rates, the Company’s ability to innovate and commercialize new products, and the Company’s implementation of cost-reduction initiatives and measures to improve pricing, including the optimization of the Company’s manufacturing capacity. These statements are subject to change and uncertainty which are, in many instances, beyond our control. There can be no assurance that future developments will be in accordance with management’s expectations. Actual results could differ materially from those expected by us, depending on the outcome of various factors. We do not undertake to update forward-looking statements.
Although the Company believes that these forward-looking statements are based upon reasonable assumptions regarding, among other things, current estimates and forecasts, general economic conditions, its knowledge of its business, and key performance indicators that impact the Company, actual results could differ materially. Some of the risks, uncertainties and other factors that could cause actual results to differ materially from those expressed in or implied by the forward looking statements include, but are not limited to: the duration and severity of the COVID-19 pandemic, and its impact across our businesses on demand, operations, our global supply chains and stock price; the effects of acquisitions, dispositions and other similar transactions; global economic trends, competition and geopolitical risks, or an escalation of sanctions, tariffs or other trade tensions between the U.S. and China or other countries, and related impacts on our businesses' global supply chains and strategies; changes in macroeconomic and market conditions and market volatility (including developments and volatility arising from the COVID-19 pandemic), including inflation, interest rates, the value of securities and other financial assets, precious metals, oil, natural gas and other commodity prices and exchange rates (particularly between the U.S. dollar and the Japanese yen, new Taiwan dollar, euro, Chinese yuan and South Korean won), and the impact of such changes and volatility on our financial position and businesses; product demand and industry capacity; competitive products and pricing; availability and costs of critical components and materials; new product development and commercialization; order activity and demand from major customers; the amount and timing of our cash flows and earnings and other conditions, which may affect our ability to pay our quarterly dividend at the planned level or to repurchase shares at planned levels; possible disruption in commercial activities or our supply chain due to terrorist activity, cyber-attack, armed conflict, political or financial instability, natural disasters, international trade disputes or major health concerns; loss of intellectual property due to theft, cyber-attack, or disruption to our information technology infrastructure; unanticipated disruption to our supply chain, equipment, facilities, IT systems or operations; effect of regulatory and legal developments; ability to pace capital spending to anticipated levels of customer demand; our ability to increase margins through implementation of operational changes and other cost reduction measures; rate of technology change; ability to enforce patents and protect intellectual property and trade secrets; adverse litigation; product and components performance issues; retention of key personnel; customer ability to maintain profitable operations and obtain financing to fund ongoing operations and manufacturing expansions and pay receivables when due; loss of significant customers; changes in tax laws and regulations; the impacts of audits by taxing authorities; and the potential impact of legislation, government regulations, other government action and investigations; and other risks detailed in Corning’s SEC filings.
For a complete listing of risks and other factors, please reference the risk factors and forward-looking statements described in our annual reports on Form 10-K and quarterly reports on Form 10-Q.
4© 2021 Corning Incorporated
Use of Non-GAAP Financial Information
Corning has included non-GAAP financial measures in this presentation to supplement Corning’s consolidated financial statements presented on a GAAP basis. In managing the Company and assessing our financial performance, we adjust certain measures provided by our consolidated financial statements to exclude specific items to arrive at core performance measures.
In managing the Company and assessing our financial performance, certain measures provided by our consolidated financial statements are adjusted to exclude specific items to report core performance measures. These items include gains and losses on our translated earnings contracts, acquisition-related costs, certain discrete tax items and other tax-related adjustments, restructuring, impairment losses, and other charges and credits, certain litigation-related expenses, pension mark-to-market adjustments and other items which do not reflect on-going operating results of the Company or our equity affiliates. Corning utilizes constant-currency reporting for our Display Technologies, Environmental Technologies, Specialty Materials and Life Sciences segments for the Japanese yen, South Korean won, Chinese yuan, new Taiwan dollar and the euro. The Company believes that the use of constant-currency reporting allows investors to understand our results without the volatility of currency fluctuations and reflects the underlying economics of the translated earnings contracts used to mitigate the impact of changes in currency exchange rates on earnings and cash flows. Corning also believes that reporting core performance measures provides investors greater transparency to the information used by the management team to make financial and operational decisions.
Core performance measures are not prepared in accordance with Generally Accepted Accounting Principles in the United States (“GAAP”). We believe investors should consider these non-GAAP measures in evaluating results as they are more indicative of our core operating performance and how management evaluates operational results and trends. These measures are not, and should not be viewed as a substitute for GAAP reporting measures. With respect to the Company’s outlook for future periods, it is not possible to provide reconciliations for these non-GAAP measures because the Company does not forecast the movement of foreign currencies against the U.S. dollar, or other items that do not reflect ongoing operations, nor does it forecast items that have not yet occurred or are out of the Company’s control. As a result, the Company is unable to provide outlook information on a GAAP basis.

3
5© 2021 Corning Incorporated
FX Hedge AccountingQ3 GAAP Earnings
• Recorded unrealized, non-cash, after-tax loss of $16M in Q3 2021 on mark-to-market adjustments associated with currency-hedging contracts and foreign debt
– Translation hedges reduce our economic exposure to currency fluctuations, providing higher certainty for our earnings and cash flow, our growth investments, and our future shareholder distributions
– Hedge contracts settled in any given quarter substantially offset changes in earnings and cash flow due to currency fluctuations
Third Quarter 2021 Investor CallCorning Reports Third-Quarter 2021 Results As Sales Reach All-Time High
Core sales and EPS grew 21% and 30% year over year, respectively, with free cash flow of $0.5 billion
Company on track to reach $14 billion in sales and over $2 in EPS for 2021
Sales and EPS growth with strong cash generation expected to continue in 2022
October 26, 2021

4
7© 2021 Corning Incorporated
Third Quarter 2021 Core Performance
“Strong execution resulted in another outstanding quarter as sales reached a new all-time high. For the full year, we are on pace to reach $14B in sales and over $2 in EPS. We are
successfully capturing a compelling set of long-term growth opportunities by innovating, extending commercial relationships, and scaling operations to meet robust demand. We are
advancing our market leadership and expect to grow again in 2022.”
- Wendell Weeks, Chairman and CEO
$0.56Q3 Core EPS
30% Increase YoY
$497MQ3 Free Cash Flow
$$3.6B
Q3 Core Sales21% Increase YoY
38.3%Q3 Gross MarginExpanded 70 bps YoY
8© 2021 Corning Incorporated
Focus >80% of resources on opportunities that leverage capabilities from at least two of three columns
Foundation for Sustained GrowthFocused and Cohesive PortfolioFocused and Cohesive Portfolio

5
9© 2021 Corning Incorporated
$1.1BQ3 Net Sales
Up 24% YoY
$139MQ3 Net Income
Up 21% YoY
Optical CommunicationsQ3 Highlights
• Demand on networks is at an all-time high
• Stage set for significant investments by operators
• Corning’s capacity expansions will allow AT&T to extend investments in fiber infrastructure, expand U.S. broadband networks, and accelerate 5G deployment
10© 2021 Corning Incorporated
$556MQ3 Net Sales
$107MQ3 Net Income
Mobile Consumer ElectronicsQ3 Highlights
• Delivering more content and capturing higher revenue per device
• Samsung introduced its Galaxy Z Fold3 5G and Galaxy Z Flip3 5G, both featuring Corning® Gorilla® Glass Victus®
• These devices also feature Corning® Gorilla® Glass with DX for device cameras, marking Corning’s entrance into a new product category

6
11© 2021 Corning Incorporated
$60MQ3 Net Income
AutomotiveQ3 Highlights
• Addressing a combined $100-per-car content opportunity
• 2021 Jeep® Wrangler and 2021 Jeep® Gladiator available with Corning® Gorilla® Glass windshield as a factory-installed option
• Environmental Technologies continues to deliver more content per vehicle; since 2017, sales increased more than 40% while global car sales decreased 20%
12© 2021 Corning Incorporated
$956MQ3 Net Sales
Up 16% YoY
$247MQ3 Net Income
Up 26% YoY
Display Technologies Q3 Highlights
• The market for large-sized TVs is projected to grow at a double-digit compound annual growth rate through 2024
• Gen 10.5 glass provides the most economical approach for larger sets, and Corning is the leader in Gen 10.5
• Glass demand at retail is expected to be up by a high-single digit percentage in 2022
• Expect the glass pricing environment to remain favorable in the fourth quarter and in 2022
7
13© 2021 Corning Incorporated
$305MQ3 Net Sales
Up 37% YoY
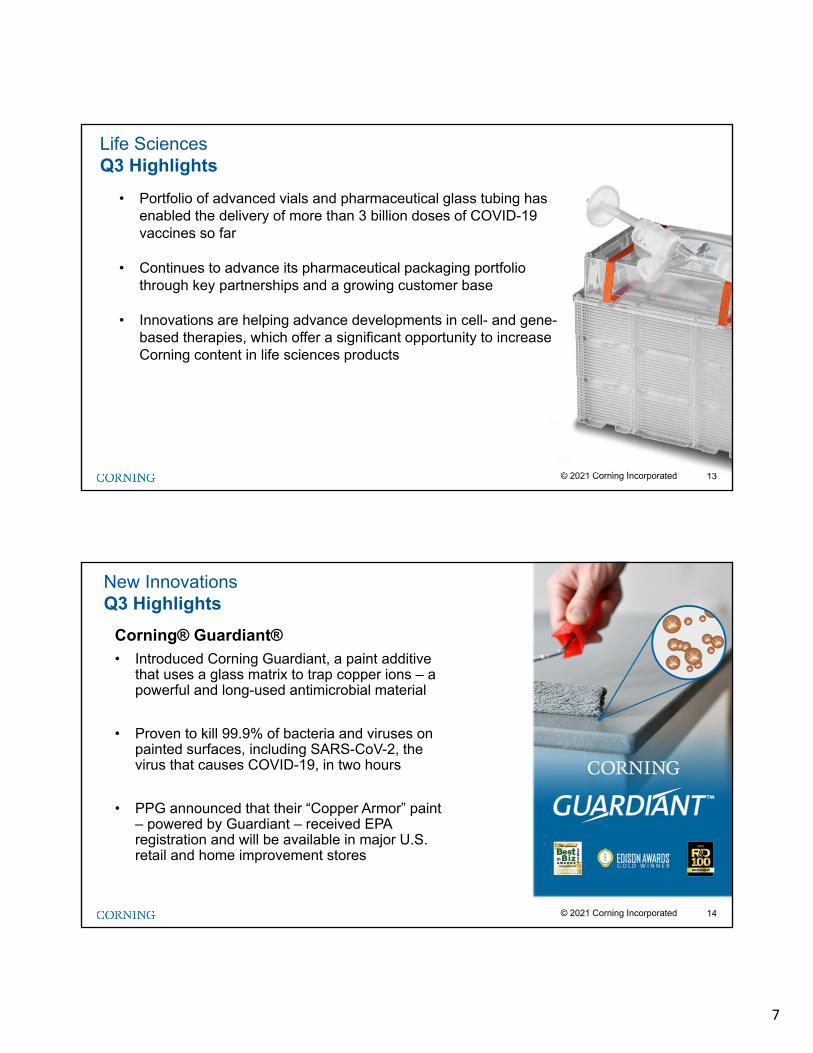
Life SciencesQ3 Highlights
• Portfolio of advanced vials and pharmaceutical glass tubing has enabled the delivery of more than 3 billion doses of COVID-19 vaccines so far
• Continues to advance its pharmaceutical packaging portfolio through key partnerships and a growing customer base
• Innovations are helping advance developments in cell- and gene-based therapies, which offer a significant opportunity to increase Corning content in life sciences products
14© 2021 Corning Incorporated
Corning® Guardiant®
• Introduced Corning Guardiant, a paint additive that uses a glass matrix to trap copper ions – a powerful and long-used antimicrobial material
• Proven to kill 99.9% of bacteria and viruses on painted surfaces, including SARS-CoV-2, the virus that causes COVID-19, in two hours
• PPG announced that their “Copper Armor” paint – powered by Guardiant – received EPA registration and will be available in major U.S. retail and home improvement stores
New InnovationsQ3 Highlights

8
15© 2021 Corning Incorporated
CEO Summary
16© 2021 Corning Incorporated
CFO Perspective
$0.56Q3 Core EPS
30% Increase YoY
$497MQ3 Free Cash Flow
$$3.6B
Q3 Core Sales21% Increase YoY
$14B in Sales and over $2 in EPS in 2021
38.3%Q3 Gross MarginExpanded 70 bps YoY

9
17© 2021 Corning Incorporated
Supply Assurance Actions Price Increases Underway in All Businesses
“In the third quarter, we continued to execute well in a complex environment. A key driver of that execution was our global supply management and operations teams maintaining a steady supply of raw materials and finding creative shipping strategies. Their actions enabled us to deliver effectively for our customers. At the same time, we incurred additional costs that were elevated by inflation. To help offset
these costs, we have price increases underway in all of our businesses.”
- Tony Tripeny, EVP and CFO
18© 2021 Corning Incorporated 18© 2021 Corning Incorporated
Q3 Results• Q3 Sales were $956M, up 16%YoY
• Sequentially, display glass volume was up slightly and glass prices increased moderately, as expected
Observations• Expect Q4 glass prices to be consistent with Q3
• Long-term trends for TV retail intact
• Expect retail demand to be up by a high-single digit percentage in 2022
$956MQ3 Net Sales
Up 16% YoY
$247MQ3 Net Income
Up 26% YoY
Display Technologies Expect Q4 Glass Prices to be Consistent, Sequentially
Display TechnologiesExpect Q4 Glass Pricing Consistent with Q3
10
19© 2021 Corning Incorporated 19© 2021 Corning Incorporated
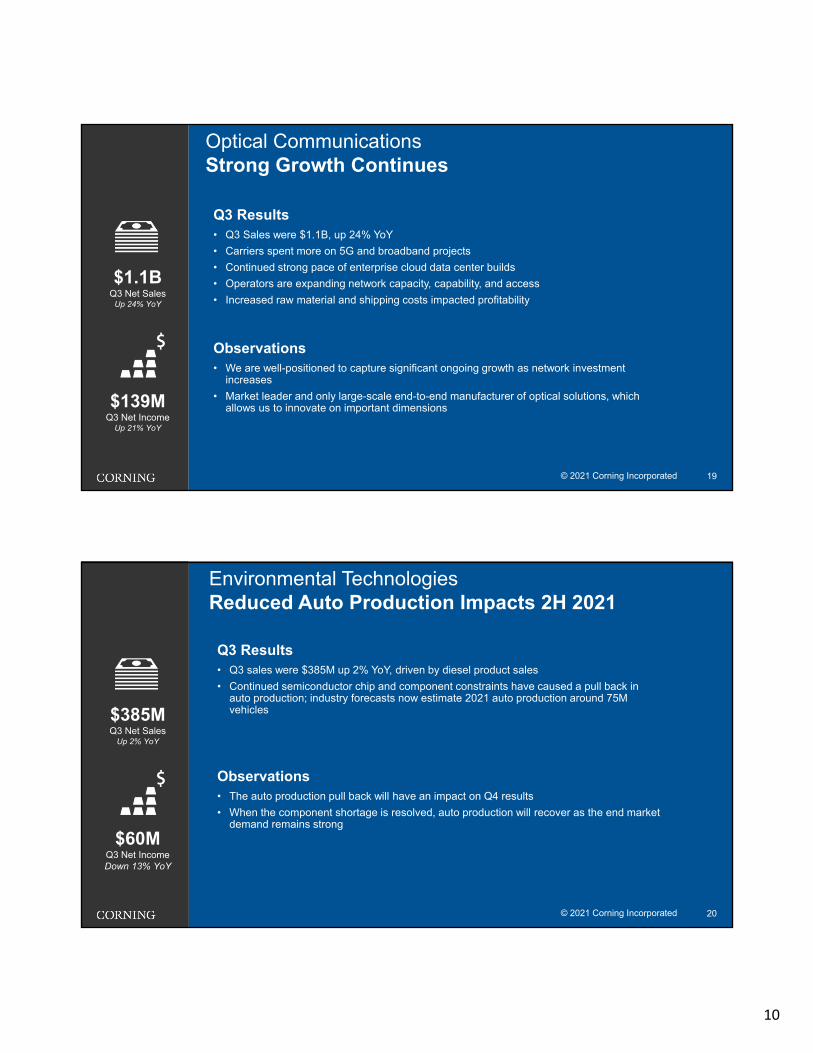
Q3 Results• Q3 Sales were $1.1B, up 24% YoY
• Carriers spent more on 5G and broadband projects
• Continued strong pace of enterprise cloud data center builds
• Operators are expanding network capacity, capability, and access
• Increased raw material and shipping costs impacted profitability
Observations• We are well-positioned to capture significant ongoing growth as network investment
increases
• Market leader and only large-scale end-to-end manufacturer of optical solutions, which allows us to innovate on important dimensions
$1.1BQ3 Net Sales
Up 24% YoY
$139MQ3 Net Income
Up 21% YoY
Optical CommunicationsStrong Growth Continues
Optical CommunicationsStrong Growth Continues
20© 2021 Corning Incorporated 20© 2021 Corning Incorporated
Q3 Results• Q3 sales were $385M up 2% YoY, driven by diesel product sales
• Continued semiconductor chip and component constraints have caused a pull back in auto production; industry forecasts now estimate 2021 auto production around 75M vehicles
Observations• The auto production pull back will have an impact on Q4 results
• When the component shortage is resolved, auto production will recover as the end market demand remains strong
$385MQ3 Net Sales
Up 2% YoY
$60MQ3 Net IncomeDown 13% YoY
Environmental TechnologiesReduced Auto Production Impacts 2H 2021Environmental TechnologiesReduced Auto Production Impacts 2H 2021

11
21© 2021 Corning Incorporated 21© 2021 Corning Incorporated
Q3 Results• Sales of $556 million, up 15% sequentially and in line with a strong third quarter in 2020,
when Ceramic Shield was introduced
• Continued to see strong demand for our premium cover materials
• Investments in innovations resulted in lower net income than in 2020
Observations• Specialty sales have grown every year since 2016 despite smartphone unit sales being
roughly flat
• Demand remains strong for our advanced optics content used in semiconductor manufacturing, as the broader end market continues to experience robust growth
• In Q4, expect typical volume declines following the builds supporting large customer product launches
$556MQ3 Net SalesDown 2% YoY
$107MQ3 Net IncomeDown 27% YoY
Specialty MaterialsDelivering More Content per Device
Specialty MaterialsDelivering More Content Per Device
22© 2021 Corning Incorporated 22© 2021 Corning Incorporated
Q3 Results• Q3 sales were $305M, up 37% year over year
• Sales growth driven by ongoing demand to support the global pandemic response, continued recovery in academic and pharmaceutical research labs, and strong demand for bioproduction vessels and diagnostic-related consumables$305M
Q3 Net SalesUp 37% YoY
$45MQ3 Net Income
Up 61% YoY
Life SciencesOngoing Strong Demand for Bioproduction Products
Observations• 3-year sales CAGR of 9%, outpacing the industry
Life SciencesOngoing Strong Demand

12
23© 2021 Corning Incorporated
CFO Outlook
© 2021 Corning Incorporated 23
Q4 2021
• Core Sales: $3.5B - $3.7B
• Core EPS: $0.50 - $0.55
FY2021
• Top- and bottom- line growth with significant free cash flow
FY 2022
• Expect sales and EPS growth
• Continued strong cash generation
24© 2021 Corning Incorporated
2020-2023: Market-Access Platform Growth Goals
~2X Passive Optical Market GrowthOptical Communications 5G and Hyperscale
Double Sales by 2023Automotive GPF and Auto Glass Solutions
Continue on Path to DoublingMobile Consumer Electronics More Value per Device
Life Sciences >2X Industry Growth and Valor® Glass Franchise Launch
Cell and Gene Therapy; Customer and Regulatory Adoption
Display Stable Returns Gen 10.5 and Moderate Price Declines
Objective Drivers
24

13
25© 2021 Corning Incorporated
Our strategy is working.
Q&A Session

14
27© 2021 Corning Incorporated 27© 2021 Corning Incorporated
Corning’s 2021 Investor Outreach Plans
• Virtual Conference Plans:– Nov.10: Baird Virtual Global Industrial Conference
– Dec. 1: Credit Suisse Annual Technology Conference
– Dec. 7: Barclays Virtual Global Technology, Media and Telecommunications Conference
• Management visits to investor offices in select cities
• Scheduled virtual visits to Corning locations for hosted tours
Appendix

15
29© 2021 Corning Incorporated 29© 2021 Corning Incorporated
2021 Corporate Metrics (as of October 26, 2021)(1)(2)
Q4 2021
• Sales: $3.5B - $3.7B
• EPS: $0.50 - $0.55
Full-Year 2021
• Other income/expense: (~$220M) net expense
• Non-controlling interest: ($35M-$40M)
• Gross equity earnings: ~$35M
• Tax rate: ~20%-21%
• Capital expenditures: slightly more than in 2020
• Significantly increased free cash flow generation
(1) Corning does not forecast the movement of foreign currencies against the U.S. dollar, or other items that do not reflect ongoing operations. As a result, the company is unable to provide guidance on a GAAP basis.
(2) Core performance measures are non-GAAP measures. Definitions and reconciliations are provided on our website.
30© 2021 Corning Incorporated
Q3 2021 Core Performance
Core performance measures are non-GAAP measures. Definitions and reconciliations are provided on our website.
$ in millions, except EPS Q3
2021Q2
2021Q3
2020
Core Net Sales $3,639 $3,504 $3,007Core Gross Margin $1,394 $1,326 $1,130 Gross Margin % 38% 38% 38%Core SG&A $483 $449 $369 % of Sales 13% 13% 12%Core RD&E $252 $236 $212 % of Sales 7% 7% 7%Core Operating Margin $659 $641 $549 Operating Margin % 18% 18% 18%Core Gross Equity Earnings $17 $8 $9 Core Net Profit Before Taxes $618 $583 $476 Core Net Income $485 $459 $380 Core EPS $0.56 $0.53 $0.43 Weighted-Average Shares Outstanding 866 869 889

16
31© 2021 Corning Incorporated
Q3 2021 Operating Performance by Segment
Core performance measures are non-GAAP measures. Definitions and reconciliations are provided on our website.
Segment Net Sales$ in millions
Q32021
Q22021
%change
Q32020
%change
Segment Net Income$ in millions
Q32021
Q22021
%change
Q32020
%change
Display Technologies $956 $939 2% $827 16% Display Technologies $247 $248 (0%) $196 26%Optical Communications $1,131 $1,075 5% $909 24% Optical Communications $139 $148 (6%) $115 21%
Carrier Network $855 $773 11% $676 26% Specialty Materials $107 $81 32% $146 (27%)Enterprise Network $276 $302 (9%) $233 18% Environmental Technologies $60 $81 (26%) $69 (13%)
Specialty Materials $556 $483 15% $570 (2%) Life Sciences $45 $52 (13%) $28 61%Environmental Technologies $385 $407 (5%) $379 2% All Other ($5) ($15) 67% ($50) 90%
Automotive $223 $240 (7%) $255 (13%) Total Segment Net Income $593 $595 (0%) $504 18%Diesel $162 $167 (3%) $124 31%
Life Sciences $305 $312 (2%) $223 37%All Other $306 $288 6% $99 209%
Total Segment Net Sales $3,639 $3,504 4% $3,007 21%
32© 2021 Corning Incorporated
Year-to-Date 2021 Core Performance
Core performance measures are non-GAAP measures. Definitions and reconciliations are provided on our website.
$ in millions, except EPS YTD
Q3 2021YTD
Q3 2020Core Net Sales $10,406 $8,124 Core Gross Margin $3,887 $2,837 Gross Margin % 37% 35%Core SG&A $1,320 $1,072 % of Sales 13% 13%Core RD&E $708 $678 % of Sales 7% 8%Core Operating Margin $1,859 $1,087 Operating Margin % 18% 13%Core Gross Equity Earnings $33 $78 Core Net Profit Before Taxes $1,711 $985 Core Net Income $1,346 $775 Core EPS $1.53 $0.88 Weighted-Average Shares Outstanding 878 883
17
33© 2021 Corning Incorporated
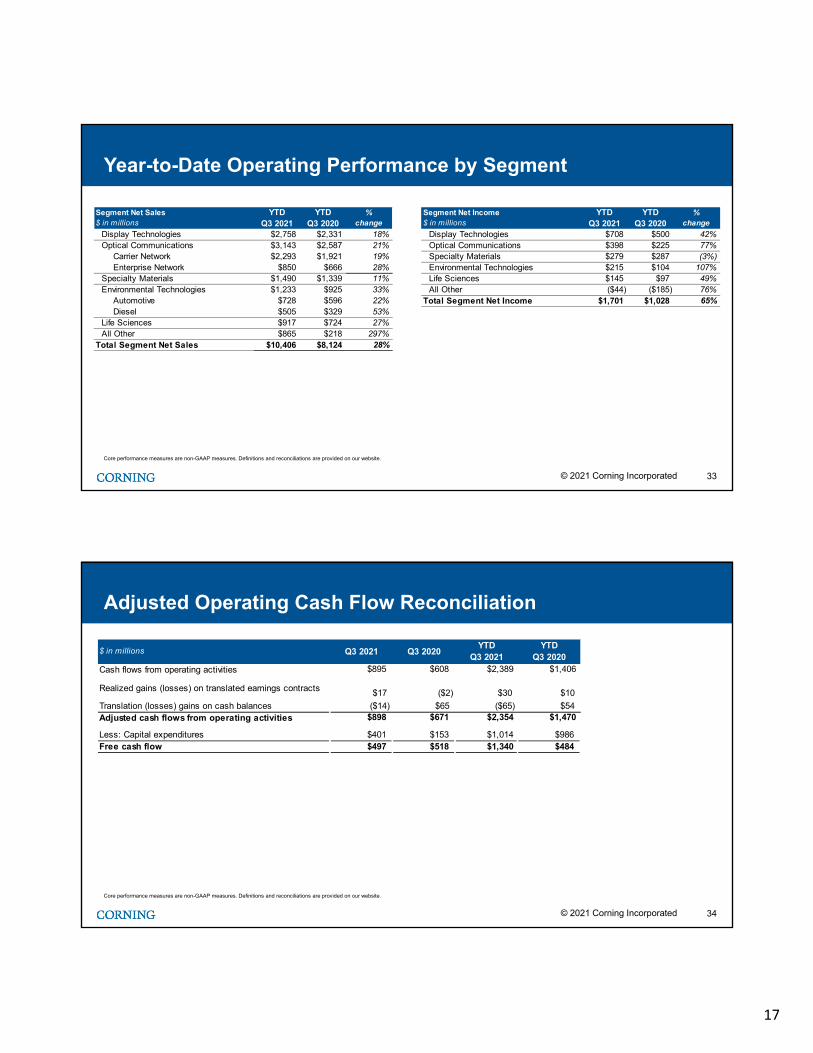
Year-to-Date Operating Performance by Segment
Core performance measures are non-GAAP measures. Definitions and reconciliations are provided on our website.
Segment Net Sales$ in millions
YTDQ3 2021
YTDQ3 2020
%change
Segment Net Income$ in millions
YTDQ3 2021
YTDQ3 2020
%change
Display Technologies $2,758 $2,331 18% Display Technologies $708 $500 42%Optical Communications $3,143 $2,587 21% Optical Communications $398 $225 77%
Carrier Network $2,293 $1,921 19% Specialty Materials $279 $287 (3%)Enterprise Network $850 $666 28% Environmental Technologies $215 $104 107%
Specialty Materials $1,490 $1,339 11% Life Sciences $145 $97 49%Environmental Technologies $1,233 $925 33% All Other ($44) ($185) 76%
Automotive $728 $596 22% Total Segment Net Income $1,701 $1,028 65%Diesel $505 $329 53%
Life Sciences $917 $724 27%All Other $865 $218 297%
Total Segment Net Sales $10,406 $8,124 28%
34© 2021 Corning Incorporated
Adjusted Operating Cash Flow Reconciliation
Core performance measures are non-GAAP measures. Definitions and reconciliations are provided on our website.
$ in millions Q3 2021 Q3 2020YTD
Q3 2021YTD
Q3 2020
Cash flows from operating activities $895 $608 $2,389 $1,406
Realized gains (losses) on translated earnings contracts $17 ($2) $30 $10
Translation (losses) gains on cash balances ($14) $65 ($65) $54 Adjusted cash flows from operating activities $898 $671 $2,354 $1,470
Less: Capital expenditures $401 $153 $1,014 $986 Free cash flow $497 $518 $1,340 $484
18
35© 2021 Corning Incorporated
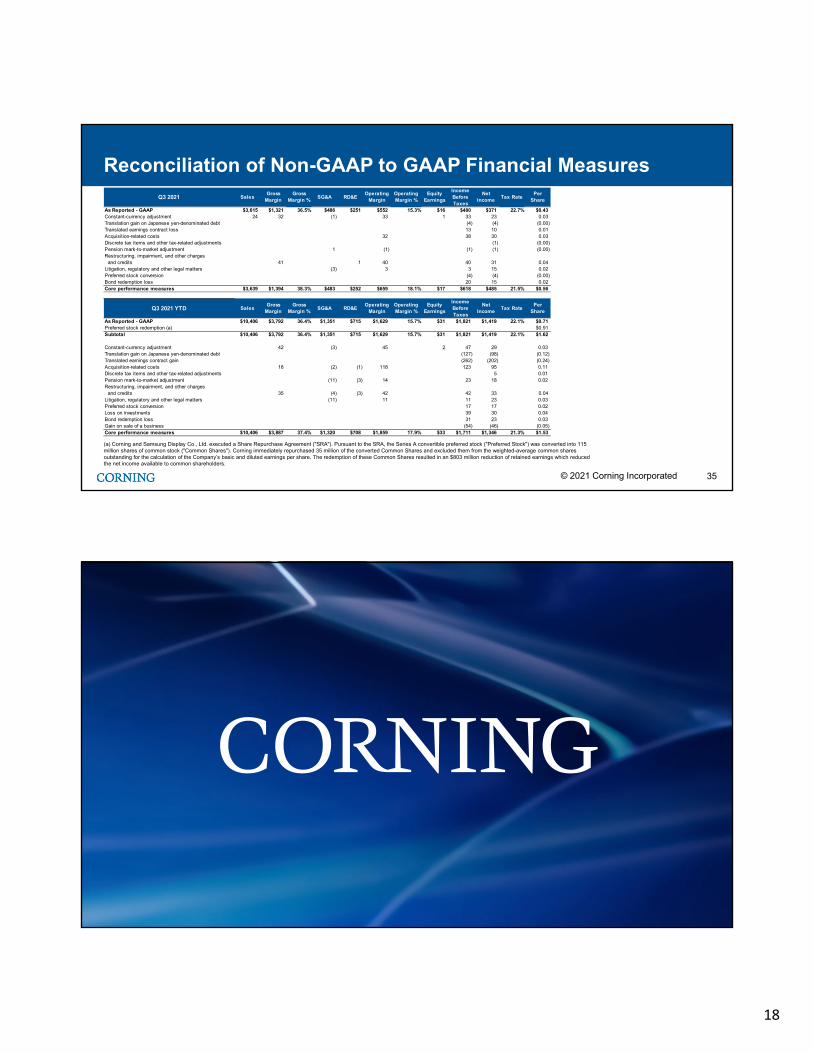
Reconciliation of Non-GAAP to GAAP Financial Measures
(a) Corning and Samsung Display Co., Ltd. executed a Share Repurchase Agreement ("SRA"). Pursuant to the SRA, the Series A convertible preferred stock ("Preferred Stock") was converted into 115 million shares of common stock ("Common Shares"). Corning immediately repurchased 35 million of the converted Common Shares and excluded them from the weighted-average common shares outstanding for the calculation of the Company’s basic and diluted earnings per share. The redemption of these Common Shares resulted in an $803 million reduction of retained earnings which reduced the net income available to common shareholders.
Q3 2021 SalesGross
MarginGross
Margin %SG&A RD&E
OperatingMargin
Operating Margin %
EquityEarnings
Income Before Taxes
Net Income
Tax RatePer
Share
As Reported - GAAP $3,615 $1,321 36.5% $486 $251 $552 15.3% $16 $480 $371 22.7% $0.43Constant-currency adjustment 24 32 (1) 33 1 33 23 0.03 Translation gain on Japanese yen-denominated debt (4) (4) (0.00) Translated earnings contract loss 13 10 0.01 Acquisition-related costs 32 38 30 0.03 Discrete tax items and other tax-related adjustments (1) (0.00) Pension mark-to-market adjustment 1 (1) (1) (1) (0.00) Restructuring, impairment, and other charges and credits 41 1 40 40 31 0.04 Litigation, regulatory and other legal matters (3) 3 3 15 0.02 Preferred stock conversion (4) (4) (0.00) Bond redemption loss 20 15 0.02 Core performance measures $3,639 $1,394 38.3% $483 $252 $659 18.1% $17 $618 $485 21.5% $0.56
0 $0.00
Q3 2021 YTD SalesGross
MarginGross
Margin %SG&A RD&E
OperatingMargin
Operating Margin %
EquityEarnings
Income Before Taxes
Net Income
Tax RatePer
Share
As Reported - GAAP $10,406 $3,792 36.4% $1,351 $715 $1,629 15.7% $31 $1,821 $1,419 22.1% $0.71Preferred stock redemption (a) $0.91Subtotal $10,406 $3,792 36.4% $1,351 $715 $1,629 15.7% $31 $1,821 $1,419 22.1% $1.62
Constant-currency adjustment 42 (3) 45 2 47 29 0.03 Translation gain on Japanese yen-denominated debt (127) (98) (0.12)Translated earnings contract gain (262) (202) (0.24)Acquisition-related costs 18 (2) (1) 118 123 95 0.11 Discrete tax items and other tax-related adjustments 5 0.01 Pension mark-to-market adjustment (11) (3) 14 23 18 0.02 Restructuring, impairment, and other charges and credits 35 (4) (3) 42 42 33 0.04 Litigation, regulatory and other legal matters (11) 11 11 23 0.03 Preferred stock conversion 17 17 0.02 Loss on investments 39 30 0.04 Bond redemption loss 31 23 0.03 Gain on sale of a business (54) (46) (0.05)Core performance measures $10,406 $3,887 37.4% $1,320 $708 $1,859 17.9% $33 $1,711 $1,346 21.3% $1.53