third-eye: a mobilephone-enabled crowdsensing system for air...
TRANSCRIPT

20
Third-Eye: A Mobilephone-Enabled Crowdsensing System for AirQuality Monitoring
LIANG LIU1, WU LIU1, YU ZHENG2, HUADONG MA1, CHENG ZHANG1∗,1 Beijing Key Laboratory of Intelligent Telecommunications Software and Multimedia,
Beijing University of Posts and Telecommunications, Beijing 10086, China2 Microsoft Research Asia, Beijing 100080, China
Air pollution has raised people’s public health concerns in major cities, especially for Particulate Matter under2.5µm (PM2.5) due to its significant impact on human respiratory and circulation systems. In this paper, wepresent the design, implementation, and evaluation of a mobile application, Third-Eye, that can turn mobilephones into high-quality PM2.5 monitors, thereby enabling a crowdsensing way for fine-grained PM2.5 monitoringin the city. We explore two ways, crowdsensing and web crawling, to efficiently build large-scale datasets of theoutdoor images taken by mobile phone, weather data, and air-pollution data. Then, we leverage two deep learningmodels, Convolutional Neural Network (CNN) for images and Long Short Term Memory (LSTM) network forweather and air-pollution data, to build an end-to-end framework for training PM2.5 inference models. Our Apphas been downloaded more than 2,000 times and runs more than 1 year. The real user data based evaluationshows that Third-Eye achieves 17.38 µg/m3 average error and 81.55% classification accuracy, which outperforms5 state-of-the-art methods, including three scattered interpolations and two image based estimation methods. Theresults also demonstrate how Third-Eye offers substantial enhancements over typical portable PM2.5 monitorsby simultaneously improving accessibility, portability, and accuracy.
CCS Concepts: • Human-centered computing → Ubiquitous and mobile computing;
Additional Key Words and Phrases: Air quality, PM2.5 monitoring, crowdsensing, CNN, LSTM
ACM Reference Format:Liang Liu1, Wu Liu1, Yu Zheng2, Huadong Ma1, Cheng Zhang1. 2018. Third-Eye: A Mobilephone-EnabledCrowdsensing System for Air Quality Monitoring. Proc. ACM Interact. Mob. Wearable Ubiquitous Technol. 2, 1,Article 20 (March 2018), 26 pages.https://doi.org/10.1145/3191752
1 INTRODUCTION
Rapid urbanization results in severe air pollution problem, especially for cities in developing countries.Air quality monitoring is of great importance to support air pollution control and protect humans
∗Authors’ addresses: Liang Liu, Wu Liu, Huadong Ma, and Cheng Zhang, Box 139, No.10 Xitucheng Road, HaidianDistrict, Beijing 100876, China, liangliu, liuwu, mhd, [email protected]; Yu Zheng, Building 2, No.5 DanlingStreet, Haidian District, Beijing 100080, China, [email protected].
Permission to make digital or hard copies of all or part of this work for personal or classroom use is granted without feeprovided that copies are not made or distributed for profit or commercial advantage and that copies bear this notice and
the full citation on the first page. Copyrights for components of this work owned by others than ACM must be honored.Abstracting with credit is permitted. To copy otherwise, or republish, to post on servers or to redistribute to lists, requiresprior specific permission and/or a fee. Request permissions from [email protected].
© 2018 Association for Computing Machinery.2474-9567/2018/3-ART20 $$15.00https://doi.org/10.1145/3191752
Proceedings of the ACM on Interactive, Mobile, Wearable and Ubiquitous Technologies, Vol. 2, No. 1, Article 20.
Publication date: March 2018.

20:2 • L. Liu et al.
(a) (b) (c)
Fig. 1. (a) Air quality monitoring site; (b) portable PM2.5 monitor; (c) mobile phone camera enabled PM2.5 monitoring.
from damage by air pollution. As a typical indicator for urban air quality, PM2.5 (particulate matterwith a diameter of 2.5 micrometers or less), has gained considerable attention recently because of itssignificant impact on people’s respiratory systems [3] and even circulation systems [22]. Understandingthe consequences of urban PM2.5 change will require an effort of comprehensive long-term data collectionand synthesis that mainly relies on networked monitoring sites. However, the monitoring sites are usuallyinsufficient such that it is difficult to obtain fine-grained city wide PM2.5 status over the whole city. TakeBeijing for example, only 35 sites are deployed in the 16, 000 km2 region, i.e., 457 km2 per site. Asdemonstrated in Fig. 1(a), an air quality monitoring site usually requires a large land of foortprint withnon-trivial money (about 200,000 USD for construction and 30,000 USD per year for maintenance) andlabor efforts [32].In order to obtain fine-grained data, it is necessary to infer a location’s PM2.5 without monitoring sites.
Scattered interpolation is a typical method that uses spatial variance signals’ in order to infer missinginformation. However, existing research reveals that PM2.5 has considerable spatial variations. Paper [32]finds that the PM2.5 reported by stations are quite different sometimes though they are geospatially close.It further illustrates the distribution of the deviation among 22 stations in Beijing over 3 months (Feb.8 to May 27, 2013). Over 39 percent of the cases have a deviation greater than 100. We also analyze15 months’ PM2.5 data (Jun. 21, 2016 to Sep. 23, 2017) which comes from 14 sites in the main city ofBeijing. The average distance among the 14 sites is 9.4km. Each site generates one PM2.5 record perhour. We calculate the maximum deviation and the standard deviation of the 14 sites’ data per day. Theresults are illustrated in Fig. 2. The average maximum deviation and standard deviation are 147.80 and30.94, respectively. Our results also demonstrate the dynamic nature of PM2.5 in urban spaces.
Thus, the sparse and preferentially located monitoring sites make spatial interpolation inaccurate inmany cases. From the urban perspective, it is urgent to develop new monitoring techniques for effectivelygenerating fine-grained PM2.5 data with high accuracy. From the individual perspective, the sparse sitesalso lead to the release of publicly-available PM2.5 data at the city-space or district-level that cannotmeasure the quality of the actual air quality that people breathe in. As a result, people need a new wayto obtain reliable and accurate measurement of PM2.5 in their immediate environment. That also canhelp users to take appropriate actions. For example, a runner may stay at home if the current PM2.5
reading is too high; and a man who has respiratory disease may wear a surgical mask once the currentPM2.5 concentration exceeds a threshold.Mobile sensing or crowdsensing [11, 13, 18], a new concept in ubiquitous computing where every
owner of a portable sensing device in an urban area can be regarded as a sensing component, hasbrought us to a tipping point in the field of urban sensing. With development of embedded technology
Proceedings of the ACM on Interactive, Mobile, Wearable and Ubiquitous Technologies, Vol. 2, No. 1, Article 20.
Publication date: March 2018.

Third-Eye: A Mobilephone-Enabled Crowdsensing System for Air Quality Monitoring • 20:3
(b) Standard Deviation(a) Maximum Deviation
Fig. 2. Statistical results of 15 months’ PM2.5 data from 14 sites in the main city of Beijing (June 21, 2016 to Sep.23, 2017).
and the miniaturization of air quality sensors, several manufacturers such as Dylos and Aeroqual haverecently introduced handheld devices. These devices can be carried by pedestrians for personal useand measure main air pollutants including PM2.5. However, crowdsensing of PM2.5 data is facing abottleneck: the measurement quality of portable devices is relatively low. High-quality measurement isachieved by both high-precision sensors and strict measurement rules. As shown in Fig. 1(a), devicesfor accurate sensing of PM2.5 are not portable. In addition, these devices need long periods of sensingtime (e.g., 1 hour) before generating accurate results. In contrast, considering the factors of cost andsize, many sensors in consumer portable devices have large errors. Moreover, it is difficult to guaranteethat device owners follow professional measurement rules. We collected 3 months’ PM2.5 data nearbya monitoring site in Beijing using Dylos 1700 (see Fig. 1(b)) that is extensively used in research ofPM2.5 crowdsensing [6, 12, 24]. Compared the measurements of Dylos 1700 with the monitoring site’sdata which can be regarded as ground truth, the average error is as high as 43.4 (the unit of PM2.5 isµg m3 in the entire paper). Besides low quality measurement, another shortage is that the crowdsensingparticipant needs to carry around a special device that adds extra burden for participants. The size ofDylos 1700 is 178mm ×114mm×76mm, and the weight is 544g. Very few people want to carry aroundsuch device when they go out.This paper aims to provide people a convenient way to determine the real-time PM2.5 concentrations of
their current locations, while provide cities with a means to crowdsense fine-grained PM2.5 measurement.In order to achieve this goal, however, we face three specific challenges.The first challenge is how to design a truly portable PM2.5 monitoring device for users? Inspired by
existing works about image based visibility or haze level analysis in the field of image processing [14, 21],we utilize mobile phone photos taken from outdoors to estimate the PM2.5 concentration (see Fig. 1(c)).That means a mobilephone camera serves as the PM2.5 sensor on the basis of the physical principle thatlight intensity attenuates because of the particulate matter scattering. Based on the dark channel priorwhich has been well studied in the field of image haze removal [14], we utilize pairs of dark channel imageand PM2.5 ground truth to train both regression and classification models. The regression error is 33.81and the classification accuracy is 61.52%.1
The second challenge is how to further promote the quality of mobile phone based PM2.5 monitoring?According to existing studies [25, 27], some other categories of data, such as the weather, traffic flow,and road networks, strongly correlate with air quality. In prior work by Zheng [32], these data arecoupled with machine learning and data mining techniques to infer fine-grained air quality. After that,
1By reference to the international AQI standard, we set 6 levels of PM2.5 concentration.
Proceedings of the ACM on Interactive, Mobile, Wearable and Ubiquitous Technologies, Vol. 2, No. 1, Article 20.
Publication date: March 2018.

20:4 • L. Liu et al.
some studies [6, 19] attempt to predict and monitor air quality from various data sources, ranging fromdeployed physical sensors to social media. In this paper, we also find that PM2.5 is highly related toother kinds of air-pollution data, such as NO2, CO, SO2, and O3 levels. Thus, we combine weatherdata and air-pollution data (W&A data for short) to assist PM2.5 inference. Considering the correlationmay have a delayed effect (i.e., the current PM2.5 may be affected by the weather and air-pollutionconditions several hours ago), we use 48 hours’ W&A data (include the current hour and prior 47 hours)to construct a vector sequence, and then train the regression and classification models which achieve22.06 regression error and 78.29% classification accuracy, respectively. After fusing the results from theimage based model and W&A data based model, the final result achieves 17.38 average error and 81.55%classification accuracy.The third challenge is how to design a concise and practical machine learning framework to train
these models? Theoretically speaking, the more kinds of correlated data utilized for training, the betterinference results would be achieved. But it also becomes more difficult for modeling the correlationamong a variety of data sources, as it relies on sophisticated models, well-designed features, mass trainingdata, and costly calculation. For a practical application, it is important to tradeoff inference accuracy,conciseness, efficiency, and economy. Therefore, we choose the outdoor image data, weather data, andair-pollution data, which are easily obtained by mobile phone users or on the Internet. We also designtwo solutions, crowdsensing and web crawling, to efficiently collect large-scale data and automaticallygenerate labeled training data. We further exploit two well-known deep learning models, convolutionalneural network (CNN) for image data and long short term memory network (LSTM) for W&A data, toprovide an end-to-end framework for training models with little pre/post-processing.The contribution of this paper lies in the following four aspects:
• Framework. The proposed framework performs PM2.5 concentration inference across Beijing, China,using outdoor-images and temporally-related weather/air-pollutant data. Moreover, our frameworkprovides a complete solution including dataset generation, offline learning, and online inference. Itexploits two phases crowdsensing - one phase for crowdsensing training dataset, and the other forcrowdsensing fine-grained PM2.5 situation over the city. This framework contributes to not onlythe PM2.5 monitoring application but also the general problem of air quality inference.
• Model. We utilize CNN and LSTM to model the dark channel image and weather/air factors thatinfluence PM2.5. By directly learning an end-to-end models from these data, the network providesa concise and practical solution with little pre/post-processing.
• Dataset. We collected 31,601 labeled outdoor images around 8 monitoring sites in Beijing overone year. To the best of our knowledge, this is the largest outdoor images dataset for air qualityinference. We also build a dataset of weather/air-pollution in Beijing which includes more than150,000 records.
• Application. We develop an APP (including three versions for Android, iOS, and WeChat) formobilephone users in Beijing. It has been downloaded more than 2,000 times. User data analysisverify that our APP outperforms 5 state-of-the-art methods and 4 popular portable devices.
We name our APP “Third-eye” which is a mystical and esoteric concept of a speculative invisibleeye which provides perception beyond ordinary sight. This name implies that this APP could make themobilephone’s camera become the third eye of people which is able to see PM2.5 value. This study isuseful for helping realize real-time monitoring, analysis and pre-warning of PM2.5 and it also helps tobroaden the application of crowdsensing and the multi-source data mining methods.
Proceedings of the ACM on Interactive, Mobile, Wearable and Ubiquitous Technologies, Vol. 2, No. 1, Article 20.
Publication date: March 2018.

Third-Eye: A Mobilephone-Enabled Crowdsensing System for Air Quality Monitoring • 20:5
2 RELATED WORK
This study is closely related to multiple research fields, ranging from sensor technology, data mining, andimage processing. We group related studies into three categories and survey the literature in detail.
2.1 Portable Device Based Crowdsensing
Air quality monitoring is a typical application of crowdsensing. In the early studies, as a mobile platform,vehicles are commonly used to carry air quality devices. The authors of [1] designed a wireless distributedmobile air pollution monitoring system which utilized city buses with air pollution sensors array tocollect pollutant gases (e.g., CO, NO2, and SO2) in the city of Sharjah, UAE. The authors of [2] builtan environmental air quality sensing system and deployed it on street sweeping vehicles to monitor airquality in San Fransisco. The authors of [8] presented a vehicular-based mobile approach for realtimepollution measurement (dust concentration and Carbon monoxide concentrations). They desinged amobile sensing box, deployable on public transportation and a personal sensing device (NODE) that canbe used to create a social pollution sensing. These works did not collect the PM2.5 data as it is difficultto be measured.Recently, various attempts have been made to design and employ low-cost portable PM2.5 monitor
to achieve fine-grained sensory data. The authors of [6] present a client-cloud system, for pervasive andpersonal air-quality monitoring at low cost. They proposed two types of PM2.5 monitors, AQM andminiAQM, with designed mechanical structures for optimal air-flow. Based on a carefully tuned airflowstructure and a GPS-assisted filtering method, the authors of [12] built a PM2.5 monitoring device,Mosaic-Nodes, with a novel constructive airflow-disturbance design. They also deployed eight Mosaic-Nodes to the selected buses to collect air quality data in Hangzhou, China. The authors of [24] developeda personal and portable particle counter device under $50. Its design can be readily adapted into a rangeof form factors, including a small wrist worn device. The authors also conducted a preliminary user studyto report on the overall user experience of this device.However, these portable PM2.5 monitors make users bring along additional devices. Even a small wrist
worn device may cause the user much inconvenience in many cases. Accuracy is another bottleneck.Considering the factors of cost and size, many sensors in portable devices have large errors.
2.2 Multisource Data Based Inference
Compared with the direct monitoring approaches, the multisource data based inference approaches re-ceived more and more attention in the past of recent years. Because many other categories of data, whichhave strong correlations with air quality, can provide information source complementary to monitoringsites. The authors of [4] proposed a big spatio-temporal data framework for the analysis of China SevereSmog. They collected about 35,000,000 detailed historical and real-time air quality records (containingthe concentrations of PM2.5 and the other air pollutants including SO2, CO, NO2, O3 and PM10) and30,000,000 meteorological records in 77 major cities of China through air quality and weather stations.It conducts scalable correlation analysis to find the possible short-term and long-term factors to PM2.5.Based on the back propagation neural network model, the authors of [19] realized the correlation analysisof PM2.5 concentrations in Beijing. They found that the value of average wind speed, the concentrationsof CO, NO2, PM10, and the daily number of microblog entries with key words “Beijing; Air pollution”show high mathematical correlation with PM2.5 concentrations.In the prior work by Yu Zheng [32], a co-training-based semi-supervised learning approach is proposed
to infer the fine-granularity air quality. This work is on the basis of the AQIs reported by a few airquality monitor stations and four datasets (meteorological data, taxi trajectories, road networks, and
Proceedings of the ACM on Interactive, Mobile, Wearable and Ubiquitous Technologies, Vol. 2, No. 1, Article 20.
Publication date: March 2018.

20:6 • L. Liu et al.
POIs) observed in the city. Inspired by this work, the authors of [6] also created an air-quality analyticsengine that learned and created models of air-quality based on a fusion of multisource data. This engineis used to calibrate AQMs and miniAQMs in real-time, and infers PM2.5 concentrations.The authors of [5] integrated social web data and device web data to build standard health hazard
rating reference, and trained smog-health models for health hazard prediction. They applied the ratingreference and models to online and location-sensitive smog disaster monitoring. In [8], the authors alsoproposed a method for air quality estimation from social media post such as Weibo text content basedon a series of progressively more sophisticated machine learning models.The authors of [23] presented a novel spatial interpolation framework to incorporate diverse data
sources and model the spatial processes explicitly at multiple resolutions. For a set of heterogeneous dataacross different domains, spectral analysis is deployed to generate features at multiple spatial resolutions.The interpolation is formulated into a regression problem, and a spatial Gaussian Process is proposed tosolve the regression problem. The framework is applied to the estimation of PM2.5 concentrations acrossCalifornia.Above works attempt to predict and monitor the air quality from a variety of data sources, including
the weather, traffic flow, road networks, physical sensors, social media, etc. But some kinds of these dataare not easily obtained. For a practical application, it is important to tradeoff among inference accuracy,conciseness, efficiency, and economy. On the other hand, these works exploit some traditional machinelearning and data mining techniques, which rely on sophisticated models and well-designed features, tomodel the correlation among a variety of data sources. There is still room to promote inference accuracy.
2.3 Outdoor-image Based Estimation
Airborne particulate matter brought by the air pollution is the primary cause for visibility degradationin urban metropolitan areas. Towards this end, several works try to estimate air quality level throughanalyzing outdoor image’s visibility or haze level. For example, the authors of [16] employed the state-of-the-art computer vision techniques to estimate haze level (clear, light, or heavy) via photos acquiredfrom online social media. Moreover, the authors [20] designed a mobile APP, AirTick, which leveragesimage analytics and deep learning techniques to estimate the Pollutant Standards Index (PSI). Theyextract the haziness component from the images captured by the users and pass the component to thedeep neural network for air quality estimation.In our prior works [30, 31], we have presented an approach that directly inferences PM2.5 level via a
single image. We extracted several image features such as dark channel, medium transmission, sky color,power spectrum slope, contrast, and saturation. To effectively fuse these heterogeneous and complemen-tary features, we utilized multikernel learning to learn an adaptive classifier based on multiple kernels.The authors [28] exploited a convolutional neural network to estimate air quality (PM2.5 and PM10 level)based on photos. They designed a negative log-log ordinal classifier to fit the ordinal output well and amodified activation function for air pollution level estimation.Overall, these works have shown the promise of image-based approaches to estimate and monitor air
pollution. But estimating the PM2.5 value even level accurately via images is challenging. Because itis difficult to build a precise model to describe the inner relationship between PM2.5 and image pixels.Abundant outdoor images with correct label are needed for training the model. However, the sizes ofimage datasets utilized in existing works are relatively small. Moreover, some works such as [16] and [28]exploited one site’s data or the average data to label images from the whole city, that would cause manywrong labels. On the other hand, it is also necessary to combine the image based models and some otherdata based model to further improve accuracy.
Proceedings of the ACM on Interactive, Mobile, Wearable and Ubiquitous Technologies, Vol. 2, No. 1, Article 20.
Publication date: March 2018.

Third-Eye: A Mobilephone-Enabled Crowdsensing System for Air Quality Monitoring • 20:7
Dataset Building Offline Learning Online Inference
Dark channel
images
Outdoor
images
W&A recordsW&A vector
sequence
PM2.5 records
Incentive
Mobile phone users
W&A data
PM2.5 data
outdoor images
Web
crawler
CNN
LSTM
Visual model
W&A model
W&A data
extraction
Dark channel
extraction
Dark channel
extraction
Dark channel
images
Inference
Inference
W&A data
extraction
W&A vector
sequence
Image
based result
Weather
based result
Late
fusion
Final
result
Crowdsensing for
outdoor images
Crowdsensing for
PM2.5 monitoring
Official
websites
Fig. 3. Framework of the Third-Eye system.
Different from the above related works, we estimate the PM2.5 with outdoor-images and temporally-related weather/air-pollutant data. The proposed framework provides a complete solution includingdataset generation, offline learning, and online inference. Our work implement combination of accuracy,low cost, portability, and convenience into a single design.
3 SYSTEM OVERVIEW
In this paper, we utilize the outdoor-images taken by mobilephones, weather data, and air-pollutantdata to inference PM2.5 level and value via machine learning technologies. Thus, as shown in Fig. 3, theframework of our system consists of three major parts: dataset generation, offline learning, and onlineinference.
3.1 Dataset Generation
In order to comprehensively investigate the air quality monitoring problem, a sufficient dataset, whichcontains large-scale systemic data collected from expansive location and long period, is necessary. Tobuilt such datasets containing outdoor-images, weather and air-pollutant (W&A in short) records, andPM2.5 reords, we explore two ways as follows:
• Crowdsensing for outdoor-images. The system gives mobilephone users around monitoringsites an incentive to take outdoor-images and send them to the outdoor-image dataset. The systemalso save the photo-op and place information (which monitoring site the mobilephone user is around)into the outdoor-image dataset.
• Crawling for W&A and PM2.5 data. The system deploys web crawlers to obtain W&A data andPM2.5 data which are generated by weather/air-quality monitoring sites and released by the officialwebsites per hour. We exploit 6 categories of weather data and 4 categories of air-pollution data.For each W&A and PM2.5 record, the system also saves the time and space (site ID) information.
Proceedings of the ACM on Interactive, Mobile, Wearable and Ubiquitous Technologies, Vol. 2, No. 1, Article 20.
Publication date: March 2018.

20:8 • L. Liu et al.
Because the PM2.5 data generated by monitoring sites is accurate enough to be regarded as the groundtruth. Then, for an image sample or W&A sample, it is easy to find the corresponding label, i.e., PM2.5
ground truth, via the saved spatio-temporal meta data. See Section 4 for details.
3.2 Offline Training
In this part, the system first preprocesses the collected raw data before training the models. For theoutdoor-images, we transform the raw RGB images into the dark channel images which is based on thedark channel prior : most local patches in haze-free outdoor images contain some pixels which have verylow intensities in at least one color channel [14]. Compared with RGB image, the dark channel imagedirectly reflects the haze level. That means it is more suitable for training the PM2.5 inference model.The W&A data is temporally-related, i.e., the value varies with time. Considering that the currentPM2.5 may be affected by the weather and air-pollution condition several hours ago, we use 48 hours’W&A data (include the current hour and prior 47 hours) to construct a vector sequence. Then, the darkchannel images and W&A vector sequence are automatically labeled by querying the PM2.5 ground truthdataset. Because of the different characters, our system exploits two deep learning models to train theoutdoor-images and W&A data, respectively.
• Convolutional Neural Network (CNN) for outdoor-images. As demonstrated as an effec-tive model to automatically learn the visual features and understand image content, CNN attractsgrowing interests in many computer vision and machine learning tasks. In our system, we trainan end-to-end CNN network with dark channel prior to inference the PM2.5. Compared with themanually designed features, the features learned by CNN are more robust and effective. Moreover,the dark channel image can remove the most noisy information while keeping the major PM2.5 char-acters, which can help deep neural network quickly capture the discriminative visual informationin PM2.5 monitoring. Detailed in Section 5.
• Long short-term memory (LSTM) network for W&A data. Different from images, theW&A data is a type of sequence data. For the sequence data forest problem, i.e., the W&A basedPM2.5 inference, it is hard to determine the referred length of the historical sequence to minethe common patterns. Recently, the LSTM network is widely used to explore the dependencyand continuity from the sequential data. Due to the hidden layer, LSTM can selectively learntemporal pattern from historical sequence. Therefore, we simply choose a long enough historicalW&A data, i.e., 48 hours, as the input. Then the LSTM Network is trained to automatically extractan expressive PM2.5 changing information from the long W&A sequence data. Detailed in Section6.
Then, the offline training generates two types of models: outdoor-images based regression/classificationmodels (visual models for short) and W&A data based regression/classification models (W&A modelsfor short).
3.3 Online Inference
We provide mobilephone users a free APP with friendly interface. When a user takes an outdoor-imageusing this APP, the image and corresponding time and location information are sent back to the backendserver. Then, the system generates the dark channel image and queries W&A data of the latest 48 hoursin user’s location. After that, the system respectively feeds the dark channel image and W&A vectorsequence into the CNN based image model and the LSTM based W&A model, and inferences two resultsof PM2.5 level or value. According to the evaluation, the visual and meteorological models play differentroles in different situations. For most of the time, the meteorological model is stable and accurate.
Proceedings of the ACM on Interactive, Mobile, Wearable and Ubiquitous Technologies, Vol. 2, No. 1, Article 20.
Publication date: March 2018.
Third-Eye: A Mobilephone-Enabled Crowdsensing System for Air Quality Monitoring • 20:9
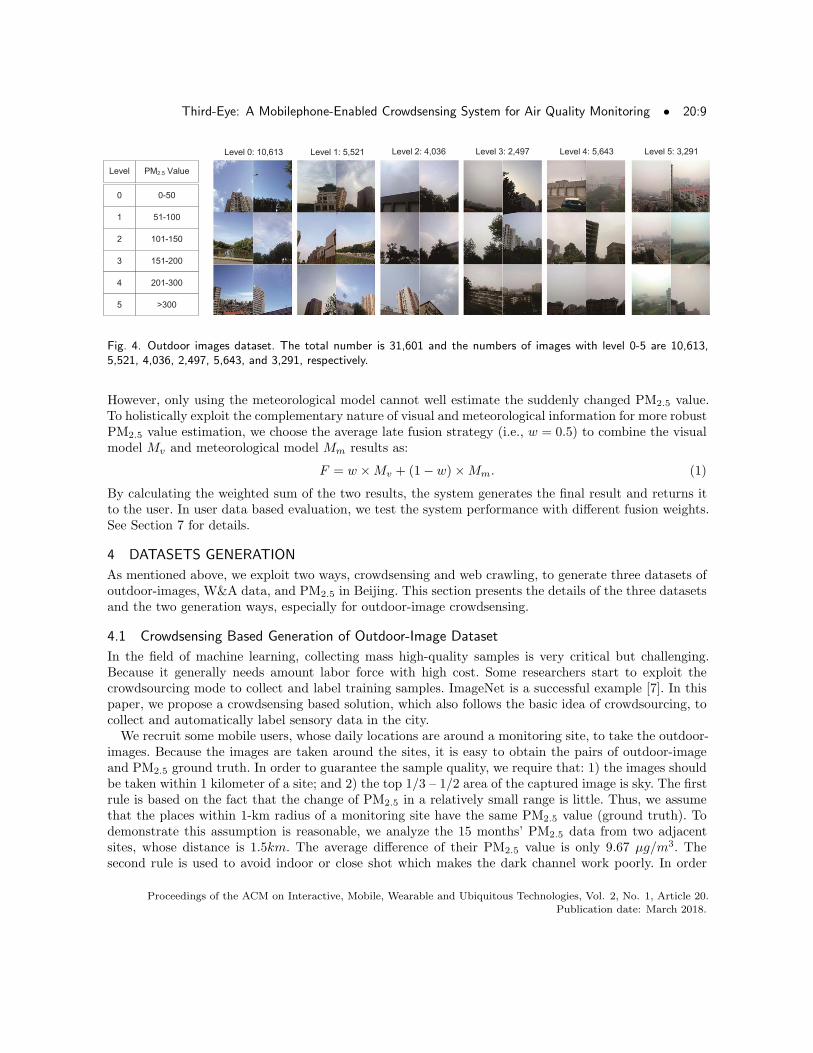
Level PM2.5 Value
0 0-50
1 51-100
2 101-150
3 151-200
4 201-300
5 >300
Level 0: 10,613 Level 1: 5,521 Level 2: 4,036 Level 3: 2,497 Level 4: 5,643 Level 5: 3,291
Fig. 4. Outdoor images dataset. The total number is 31,601 and the numbers of images with level 0-5 are 10,613,5,521, 4,036, 2,497, 5,643, and 3,291, respectively.
However, only using the meteorological model cannot well estimate the suddenly changed PM2.5 value.To holistically exploit the complementary nature of visual and meteorological information for more robustPM2.5 value estimation, we choose the average late fusion strategy (i.e., w = 0.5) to combine the visualmodel Mv and meteorological model Mm results as:
F = w ×Mv + (1− w)×Mm. (1)
By calculating the weighted sum of the two results, the system generates the final result and returns itto the user. In user data based evaluation, we test the system performance with different fusion weights.See Section 7 for details.
4 DATASETS GENERATION
As mentioned above, we exploit two ways, crowdsensing and web crawling, to generate three datasets ofoutdoor-images, W&A data, and PM2.5 in Beijing. This section presents the details of the three datasetsand the two generation ways, especially for outdoor-image crowdsensing.
4.1 Crowdsensing Based Generation of Outdoor-Image Dataset
In the field of machine learning, collecting mass high-quality samples is very critical but challenging.Because it generally needs amount labor force with high cost. Some researchers start to exploit thecrowdsourcing mode to collect and label training samples. ImageNet is a successful example [7]. In thispaper, we propose a crowdsensing based solution, which also follows the basic idea of crowdsourcing, tocollect and automatically label sensory data in the city.We recruit some mobile users, whose daily locations are around a monitoring site, to take the outdoor-
images. Because the images are taken around the sites, it is easy to obtain the pairs of outdoor-imageand PM2.5 ground truth. In order to guarantee the sample quality, we require that: 1) the images shouldbe taken within 1 kilometer of a site; and 2) the top 1/3 – 1/2 area of the captured image is sky. The firstrule is based on the fact that the change of PM2.5 in a relatively small range is little. Thus, we assumethat the places within 1-km radius of a monitoring site have the same PM2.5 value (ground truth). Todemonstrate this assumption is reasonable, we analyze the 15 months’ PM2.5 data from two adjacentsites, whose distance is 1.5km. The average difference of their PM2.5 value is only 9.67 µg/m3. Thesecond rule is used to avoid indoor or close shot which makes the dark channel work poorly. In order
Proceedings of the ACM on Interactive, Mobile, Wearable and Ubiquitous Technologies, Vol. 2, No. 1, Article 20.
Publication date: March 2018.

20:10 • L. Liu et al.
Table 1. Incentive strategies
Strategy DescriptionLinear Reward Strategy The value of each task equals 0.2 RMB. The reward is proportional to
the number of tasks participant has accomplished.Competitive Strategy We rank participants via the number of completed tasks every day, and
choose the top-5 participants to pay 30, 15, 8, 4 and 3 RMB, respectively.Red Envelope Strategy When a participant completes a task, he/she will received a red envelope
with a random value as the reward. The average value of red envelopes is0.2 RMB.
Table 2. The order of incentive strategies used in the three universities.
1-2 week 3-4 week 5-6 weekBUPT Linear Reward Strategy Red Envelope Strategy Competitive StrategyBIT Competitive Strategy Linear Reward Strategy Red Envelope StrategyBJU Red Envelope Strategy Linear Reward Strategy Competitive Strategy
(a) The number of participates very two weeks (b) The average number of images collected by each participant very two weeks
4
6
8
10
12
14
16
18
Week 1~2 Week 3~4 Week 5~6
Th
e N
um
be
r o
f U
se
rs
BUPT
BIT
BJU
0
50
100
150
200
250
300
350
Week 1~2 Week 3~4 Week 5~6
Th
e N
um
be
r o
f Im
ag
es
BUPT
BIT
BJU
Fig. 5. Comparison of linear reward strategy, competitive strategy, and red envelope strategy.
to reduce the communication and calculation cost, the qualified image is resized as 256× 256, and thensent to the outdoor-image dataset. Some examples of the collected images are shown in Fig. 4. Referringto the AQI standards, we classified these images into six categories according to their real PM2.5 value.At first, some students in our lab were willing to be the volunteers. But they lost their passion
soon. Therefore, how to design a proper incentive strategy to attract participants and keep them activeis a key problem for crowdsensing outdoor-images. Incentive is a well-studied problem in the fields ofcrowdsourcing [26] and crowdsensing [29]. However, many existing incentive strategies are designed forindependent tasks. But our system cares about not only the number of completed tasks (taking a out-doorimage can be regarded as a task) but also the temporal-spatial distribution of samples. That implies thatthe dataset should include images taken at different times and places. Moreover, many existing worksabout incentive focus on ideal models based theoretical analysis, thus they cannot be utilized in realapplication directly.
Proceedings of the ACM on Interactive, Mobile, Wearable and Ubiquitous Technologies, Vol. 2, No. 1, Article 20.
Publication date: March 2018.

Third-Eye: A Mobilephone-Enabled Crowdsensing System for Air Quality Monitoring • 20:11
L2
L4
L3
L1
L5
L6L7
L8
Fig. 6. Distribution of the 8 monitoring sites covered by the outdoor-image dataset.
By following three classical incentive types, we design three incentive strategies, listed in Table 1,and compare them according to an empirical research of 6 weeks. To make an objective comparison, werecruit some students in three universities: Beijing University of Posts and Telecommunications (BUPT),Beijing Jiaotong University (BJU), and Beijing Institute of Technology in Liangxiang (BIT). The threeuniversities are all nearby a monitoring site (L1, L2, and L3 in Fig. 6). In each university, we change theincentive strategy every two weeks. The detailed schedule is listed in Table 2.2 Under the total budgetof 60 RMB per day for one university, the expected number of images is 300. In order to distributecollected images over the whole day, we release 30 tasks every hour from 9:00 am to 6:00 pm. There are75 students involved in our experiment. The statistical results of the participant number and averagenumber collected by each participant are illustrated as Figs. 5 (a) and (b), respectively. From the results,we observe that: 1) no matter the order of incentive strategies, the number of participants graduallyreduces during the long-term crowdsensing application; 2) from the perspective of average number ofimage collected by each participant, the competitive strategy is the best one.We finally recruit more than 200 participants in total to take the outdoor images and build up a
large-scale dataset. Overall, the dataset has the following featured properties.Scale. The outdoor image dataset consists of 31,601 images captured by more than 200 participants fromMay 2015 to April 2016. These images are captured around 8 monitoring stations and 735 km2 in theBeijing City (see Fig. 6), which makes the dataset scalable enough for large-scale air quality inference andother related researches. According to our knowledge, our dataset is one of the most comprehensive PM2.5
dataset in three aspects: 1) the large image scale–31,601 real-world images captured by 200 people; 2) thelong time span–one whole year data; and 3) the massive multisource information–image, time, location,device type, and W&A.
2Each participant installs an APP developed by our group for taking/uploading images and recording the earnings. ThisApp also pushes the detailed rules of the incentive strategies to participants beforehand, and notifies them of the changeof incentive strategy at each stage.
Proceedings of the ACM on Interactive, Mobile, Wearable and Ubiquitous Technologies, Vol. 2, No. 1, Article 20.
Publication date: March 2018.

20:12 • L. Liu et al.
Accuracy. To get the accurate PM2.5 ground truth value, we require the participants should be in the1-km radius area from the monitoring stations. The distance control is implemented through the GPSpositioning of mobilephone. Moreover, the image quality is also controlled by our staffs to ensure itsquality and meet our standards.Diversity. The images are captured in real-world unconstrained scene and tagged with a variety ofattributes including PM2.5, captured time, location, weather condition, and settings of mobile device.Moreover, the outdoor-image dataset is collected under a wide variety of air pollution condition, seasons,weather and illumination conditions with 73 different types of mobile phones. So complicated modelscan be learnt and evaluated for PM2.5 inference.
4.2 Web Crawling Based Generation of W&A Dataset and PM2.5 Dataset
In this paper, we exploit 6 categories of weather data: temperature (TE), pressure (PR), humidity (HU),wind speed (WS), wind direction (WD);3 and weather condition (WC),4 and 4 categories of air-pollutiondata: carbon monoxide (CO), nitrogen dioxide (NO2), ozone (O3), and sulfur dioxide (SO2). These data,generated by meteorological sites and air-quality monitoring sites, can be easily obtained on the Internet.We implement two web crawlers: one captures the weather data of Beijing’s 13 districts which is
released by National Meteorological Center;5 the other one captures the air pollution data from 35monitoring sites which is released by Beijing Municipal Environmental Monitoring Center.6 We extractthe 35 monitoring sites’ PM2.5 data from the air pollution data for building the PM2.5 dataset, and mapthe data of CO, NO2, O3, and SO2 into 13 districts. Then, for each district, we generate a W&A recordwith 10 dimensions per hour. Overall, we collect W&A records and PM2.5 records from May 2015. Tillnow, there are more than 150,000 W&A records in our dataset.
5 THE VISUAL MODEL LEARNING
5.1 Dark Channel Prior
Outdoor-images are usually degraded by the particulate matter, which is one of the main air pollutionsources. In the process of transmission, light intensity attenuated because of the particulate matterscattering. Definitely, we are able to infer the air quality via haze degree relying on the atmosphericscattering model and statistics derived from various crowdsensing images. Specifically, the model [14]widely used to describe the formation of a fog/haze image is as follows:
I(x) = t(x)J(x) + (1− t(x))A, (2)
where I is the observed image, J denotes the scene radiance, A denotes the atmospheric light, and tdenotes the medium transmission describing the portion of the light that is not scattered and reachesthe camera. When the atmosphere is homogenous, the medium transmission t can be expressed as hazedegree:
t(x) = e−βd(x), (3)
where β is the scattering coefficient of the atmosphere and d is the scene depth. This equation indicatesthat the scene radiance is attenuated exponentially with the depth. Based on this model, significantprogress has been made in haze removal from a single image.
3The values of wind direction include east, west, south, north, unstable, southeast, northeast, southwest, and northwest.4The values of weather condition include sunny, cloudy, overcast, rainy, sprinkle, moderate rain, heaver rain, rain storm,thunder storm, freezing rain, snowy light snow, moderate snow, foggy, sand storm, and dusty.5http://www.nmc.cn/publish/forecast/ABJ/beijing.html6http://zx.bjmemc.com.cn/getAqiList.shtml
Proceedings of the ACM on Interactive, Mobile, Wearable and Ubiquitous Technologies, Vol. 2, No. 1, Article 20.
Publication date: March 2018.

Third-Eye: A Mobilephone-Enabled Crowdsensing System for Air Quality Monitoring • 20:13
(a) Original Color Images with Different PM2.5 (b) Dark Channel Images with Different PM2.5 (c) Convolutional Neural Network Architecture
Inp
ut
Th
um
bn
ail
Convolutional
Filtering
Layers
Fu
lly-C
on
ne
ctio
n L
aye
r (F
C1
)
Fu
lly-C
on
ne
ctio
n L
aye
r (F
C2
)
Ou
tpu
t La
ye
r
Fig. 7. The framework of Dark Channel Prior based CNN.
The dark channel prior has been well studied in the field of single image haze removal. The authorsof [14] found that, in most of the non-sky patches, at least one color channel has some pixels with verylow intensity and close to zero, called dark channel prior. Equivalently, the minimum intensity in such apatch is close to zero. The low intensity in the dark channel is mainly due to shadows, colorful objects,and dark surfaces in the images. Formally, for an arbitrary image J , its dark channel Jdark is given by
Jdark(x) = miny∈Ω(x)
( minc∈r,g,b
Jc(y)), (4)
where Jc is a color channel of J and Ω(x) is a local patch centered at x. Using the concept of a darkchannel, the observation says that if J is an outdoor haze-free image, the intensity of J ’s dark channelis low and tends to be zero:
Jdark → 0. (5)
However, due to the additive illumination, a hazy image is brighter than its haze-free version wherethe transmission t is low. So, the dark channel of a hazy image will have higher intensity in regions withdenser haze. We can estimated the medium transmission by
t(x) = 1−minc
( miny∈Ω(x)
(Jc(y)
Ac)). (6)
Fig. 7 shows several ourdoor-images and corresponding dark channels. From these examples, we can findthat the PM2.5 degree is directly reflected on the dark channel images. Therefore, we try to develop adark channel based CNN to automatically extract robust and discriminative features to infer the PM2.5
situation.
5.2 Dark Channel Prior Based CNN
As an effective model to understand image content and tackle tasks, CNN attracts growing interests inthe fields of computer vision and machine learning [10, 15, 17]. CNN is a biologically-inspired variantof multilayer perceptron, which can imitate the human brain through multiple transformation and ab-straction. As connecting the stages of feature extracting and classier training, the CNN is trained endto end from raw pixel values to classifier outputs. Therefore, in our framework, we exploit CNN as ourclassifiers to estimate the PM2.5.For conventional CNN architecture, the raw images are directly input into the convolutional layers
to extract the visual features. Compared with the manually designed features, the features learned byCNN are more robust and effective. However, the CNN requires to learn sufficient features from a massof training data for all the categories, e.g., millions of images for image classification. On the other hand,for the applications of air quality monitoring, people may capture the images from diverse place, e.g.,
Proceedings of the ACM on Interactive, Mobile, Wearable and Ubiquitous Technologies, Vol. 2, No. 1, Article 20.
Publication date: March 2018.

20:14 • L. Liu et al.
city, mountain, forest, sea, even indoor. Therefore, it is very hard to collect enough data to supportthe air quality feature learning from the raw images. To solve the challenge, instead of direct using theraw captured images, we input the dark channel image into the CNN to learn sufficient features. Thedark channel image can remove the most noisy information while keeping the major maze characters.Therefore, the dark channel image representation, which is robust to the visual content changes, can helpdeep neural network quickly capture the discriminative visual information in air quality monitoring.
5.3 Implementation
The implementation of our Dark Channel Prior based CNN has three main parts: network architec-ture, offline network training and online prediction. For the network architecture, we leverage the CNNarchitecture as discussed in [15] by adapting their publicly released Caffe-BLVC model 7 as its goodperformance on ImageNet dataset. The original CNN consists of two parts: 1) the input layers, fiveconvolution layers and maxpooling layers, and 2) two fully connection layers and the output layers whichproduces probabilities over the 1,000 class labels. For the PM2.5 classification, we directly change the1,000 label output to the number of air quality categories (i.e., 6). Differently, for the PM2.5 regressiontask, we change the classification loss layer to the regression loss layer.In the training state, our training algorithm adopts the mini-batch stochastic gradient descent for
optimizing the objective function. After transforming the original RGB images into the dark channelimages, the training data is divided into mini-batches. Training errors are calculated upon each mini-batch in the loss layer and backward propagated to the lower layers. The network weights are updatedsimultaneously. We set learning rate policy to “step”. We initialize the learning rate to 10−2 and gammato 10−1. Momentum, weight decay and stepsize are set to 9× 10⁻¹, 5× 10⁻⁴ and 4.5× 10⁵ respectively.After training, the well optimized models can be used for online classification and regression. Specifi-
cally, we first utilize the pre-trained model to initialize the network. Then we send the target image intothe CNNs, and compute the feed-forward network based on the matrix multiplication for one time toextract discriminative features. Finally, we are able to obtain the probabilities of 6 air quality categoriesand regression value through the corresponding loss functions.
5.4 Evaluations of the Visual Model
In the experiments, we evaluate the proposed Dark Channel Prior based CNN model on the collected31,601 images in crowdsensing based dataset. The evaluations are given in three different settings: 1)random division, 2) temporal division, and 3) spatial division. Firstly, the random division randomlydivides all the images captured at 8 different monitoring sites from May 2015 to April 2016 to training,validation and test dataset. The training set contains 26,680 images, test set contains 1,121 images, andthe validation contains 4,921 images. This is a baseline division in which the images captured in nearlocations and time are randomly divided. It means that for each test image, the learned model maysee the similar images in the training set. Next, temporal division divides the training, validation andtest images according to different shooting time. The goal of temporal division is to evaluate whetherthe model trained on the historical data can accurately estimate the real-time PM2.5 value. The imagescaptured in the front three weeks of each month are selected as the training data, the rest images areset as the testing data. As we have 12 month data, it is a 12-fold validation. We divided the data ineach month as we online update our model with the past three weeks PM2.5 history in the real-worldimplementation. Finally, in the location division, we choose the images from the seven different places astraining date to train the visual model. Then the model is exploited to estimate PM2.5 value in the rest
7 “Caffe Model Zoo,” http://caffe.berkeleyvision.org/model zoo.html
Proceedings of the ACM on Interactive, Mobile, Wearable and Ubiquitous Technologies, Vol. 2, No. 1, Article 20.
Publication date: March 2018.

Third-Eye: A Mobilephone-Enabled Crowdsensing System for Air Quality Monitoring • 20:15
(a) Random Division (b) Temporal Division (c) Location Division
Fig. 8. The confusion matrix of visual model evaluation in different divisions.
one location. The goal of spatial division is to evaluate the expansibility of the proposed model—whetherthe model can perform well in the place where there is no training data. As we described before, theimages from different places have significant diverse visual content. The diversity is a great challengefor visual information based PM2.5 estimation. We alternately set each place as testing and totally do 8groups of experiments. So it is a 8-fold validation.The experimental results of random division and temporal division are shown in Fig. 8 and Table 3.
The Fig. 8 shows the confusion matrix of different division. The rows of the matrix are the real PM2.5
categories. The columns are the predicted PM2.5 categories. We can see that in the random division,the proposed visual model can well discriminate the 6 different categories. In the temporal division, theperformances on the middle categories are worse than the two ends. The comparative results in Table 3show that the proposed Dark Channel Prior based CNN is better than the color images based one onwhether the classification accuracy or regression error. It demonstrates that the dark channel prior canhelp CNN better detect the PM2.5 pollution and be more robust to the visual content change. Specially,the results of temporal division shows that the model trained on the historical data can be exploited toestimate the real-time PM2.5 value.For the spatial division, we alternately set each place as testing and totally do 8 groups of experiments.
The average classification accuracy and regression error is shown in Fig. 9. The results demonstrate thatalthough the model do not see the data from that place, it can still well estimate its PM2.5 value. Forexample, from Fig. 6, we can find that L2 is the farthest place from each other. Its classification accuracy(73.54%) is still higher than the average accuracy (72.04%). The experimental results of spatial divisiondemonstrate that the usable range of the proposed system is not limited to the proposed eight locationswith training data.
6 THE W&A MODEL LEARNING
6.1 W&A Data Extraction
Through dark channel prior based CNN, we can extract a discriminative high-level visual information toestimate the PM2.5 value. However, in the air quality monitoring problem, as we discussed before, thevisual information still has poor robustness on wide varieties of captured images with different viewpoints,illusion, and background. Besides, because of 1) the great semantic gap between PM2.5 and dark channelvisual information, and 2) the diversity visual content of different training images as shown in Fig. 4, it ishard to learn a general mapping model from limited image data. On the other hand, W&A data is widely
Proceedings of the ACM on Interactive, Mobile, Wearable and Ubiquitous Technologies, Vol. 2, No. 1, Article 20.
Publication date: March 2018.

20:16 • L. Liu et al.
Table 3. The classification accuracy and regression error of visual model evaluation in different divisions.
Division Methods Classification Accuracy Regression Error
Random divisionColor Image based CNN 74.65% 24.89Dark Channel based CNN 77.92% 22.89
Temporal divisionColor Image based CNN 59.39% 39.74Dark Channel based CNN 62.05% 37.21
Spatial divisionColor Channel based CNN 69.84% 29.86Dark Channel based CNN 72.04% 27.37
(a) The PM2.5 Classification Accuracies in Different Locations (b) The PM2.5 Regression Errors in Different Locations
73.84% 73.54%
63.81%
92.31%
79.74%75.62%
73.08%
78.52%
0.00
0.10
0.20
0.30
0.40
0.50
0.60
0.70
0.80
0.90
1.00
L1 L2 L3 L4 L5 L6 L7 L8
Cla
ssif
ica
tio
n A
ccu
racy
Locations
26.57 26.88
35.71
12.78
20.46
23.12
25.93
21.95
0.00
5.00
10.00
15.00
20.00
25.00
30.00
35.00
40.00
L1 L2 L3 L4 L5 L6 L7 L8
Re
gre
ssio
n E
rro
r
Locations
Fig. 9. The results of the spatial division based visual model evaluations.
used to forecast local air quality [4]. Because the urban air quality varies by different weather conditions.For example, gale wind always help to reduce the concentration of PM2.5. Therefore, to achieve moreaccurate and robust Air Quality Monitoring performance, we extract W&A vectors to supplement thevisual information.
The W&A data contains two meaningful information, spatial-based local weather condition andtemporal-based weather changing situation. For the spatial information, taking Beijing City as a casestudy, we can obtain the W&A information through weather forecast on the scale of districts in everyone hour. Then, the extracted W&A features will reflect the current air quality condition in the specificregions. For the temporal one, we observe that the historical weather condition has great influence onthe posterior air quality index. As shown in Section 3.1, we collect 10 types of fine-grained W&A data,consisting of weather condition, temperature, pressure, humidity, wind speed and direction, concentra-tions of CO, NO2, O3 and SO2 from Beijing Municipal Environmental Monitoring Center and NationalMeteorological Center. Moreover, from the historical PM2.5 data, we observed the phenomenon that thevalue of the PM2.5 in each day is hard to be the same, but the variation mostly follows a similar changingpattern, because of the traffic flow or human mobility in rush hour. So we bring extra time stamp feature,which represents the relevant information instead of the raw traffic or human mobility information, foravoiding introducing additional semantic gap. Finally, we can obtain a 11-dimensional feature vector to
Proceedings of the ACM on Interactive, Mobile, Wearable and Ubiquitous Technologies, Vol. 2, No. 1, Article 20.
Publication date: March 2018.

Third-Eye: A Mobilephone-Enabled Crowdsensing System for Air Quality Monitoring • 20:17
represent W&A information at one specific time point as:
W&A V ector =< WC,TE, PR,HU,WS,WD,CO,NO2, O3, SO2, T ime > .
By integrating spatial and temporal W&A data, our framework has great potentials to achieve accurateand robust air quality analysis.
6.2 W&A Based LSTM Network
For covering the semantic gap between the PM2.5 information and visual information, we attempt tobuild another homogenous mapping model from readily available W&A data to PM2.5 data. However,we discovered that the directly mapping model from available W&A data to exact PM2.5 still cannothandle the dramatically PM2.5 changing situation or singular value point. Therefore, we wish to distillthe changing pattern of the historical W&A information to help predicting the current PM2.5 value. Thetraditional sequence prediction models, such as Hidden Markov Model and Dynamic Bayesian NetworkSystem, require to refer fixed-length history data. However, for PM2.5 estimation, it is very hard todetermine how long history data is needed in the predictive model. The length is determined accordingto different weather condition.Fortunately, Recurrent Neural Network (RNN), a special type of neural network, is exposed of remark-
able memory ability in Natural Language Processing (NLP) problems. Indeed, the primary aim of RNNis exploring the dependency and continuity from the sequential data. Due to the hidden layer, RNN canselectively learn temporal information from historical sequence. In the air monitoring problem, althoughthe exact PM2.5 value is hard to be predicted by discrete W&A data, the variation of PM2.5 still followsa consecutive pattern because of the diffusion of atmosphere, which brings RNN an unmissable oppor-tunity to obtain the W&A temporal information. So in this paper, we adopt the primary idea of RNNto design a temporal framework for extracting an expressive W&A changing information.To model a long term W&A change pattern from the readily available data, we adopt the typical
Long Short-Term Memory Network (LSTM), an effective RNN model, on the 11 (dimensional) × 48(hour) readily available W&A data matrix obtained from monitoring station. Different from standardtanh-RNN, the special gate mechanism in LSTM can handle the vanishing gradient problems, and withthe help of memory cell, it can memorize or forget the historical W&A information in each timestep. Inthis paper, we select the 2-layer LSTM architecture with 128 hidden cells as described in [9].At each timestep t, we input the 11 dimensional W&A feature, like air temperature, pressure, humidity,
wide speed and direction, weather condition, the concentrations of CO, NO2, O3 and SO2, and the timestamp feature as xt. The output feature ht contains the temporal W&A information we interested. Ware the input weighted matrices, R are the recurrent weighted matrices, and b are the bias vectors. Thesigma and tanh are nonlinear activation functions, mapping real values to (0,1) and (-1,1). The ⊙ and⊕ represents the dot product and the sum of two vectors respectively. Given xt and ht−1, LSTM unitupdates for timestep t are:
gt = ϕ(Wgxt +Ught−1 + bg)
it = σ(Wixt +Uiht−1 + bi)
ft = σ(Wfxt +Ufht−1 + bf )
ct = gt⊙it + ct−1⊙ft
ot = σ(Woxt +Uoht−1 + bo)
ht = ϕ(ct)⊙ot
Proceedings of the ACM on Interactive, Mobile, Wearable and Ubiquitous Technologies, Vol. 2, No. 1, Article 20.
Publication date: March 2018.

20:18 • L. Liu et al.
LSTM LSTM LSTM
LSTM LSTM LSTM
Time
Stamp
PM2.5
Ground Truth
Mean Square
Weather:
WC TE PR
HU WS WD
Air-pollutant:
CO NO2 O3 SO2
Current TimeCurrent Time - 46 HourCurrent Time - 47 Hour
Fig. 10. The framework of W&A based LSTM model.
As shown in Fig. 10, our framework of the W&A based LSTM model adopts a successive estimationstrategy. In order to estimate the current PM2.5, a 47-hour historical meteorological sequence data andthe current meteorological data are required. For training the LSTM temporal estimation model, we splitthe whole meteorological data into several 48-hour continuous sequence according to their time stamp.The training data is consisted of 10 dimensional feature, which contains the available meteorologicaldata like air temperature, pressure, humidity, wide speed and direction, the concentrations of CO, NO2,O3, SO2, and the weather code transformed from raw weather condition. Then we supplement each 10dimensional meteorological data with their corresponding time stamp to form the 11 dimensional W&Avector. Therefore, in the training process, we define a 48 time step LSTM model with 128 hidden neuronsand feed the 11 dimensional vector in each iteration. Besides, the L2 loss is calculated by Eq. (7) uponeach N mini-batch and backward propagated through time.
L =1
N
∑i
|predi − labeli|2, i ∈ 0, 1...N − 1. (7)
For optimizing the stochastic functions, we adopt the Adam algorithm [9] and initialize the learning rateto 0.001, the exponential decay rate for the 1st moment estimates to 0.9, the exponential decay rate forthe 2st moment estimates to 0.999 and the epsilon to 1× e−8.
6.3 Evaluations of the W&A Model
In the experiments, we evaluate the proposed W&A features and models on the collected 13 districts’weather data from May 2015 to July 2017. The records in the front three weeks of each month areselected as training, and the left records are selected as testing. To evaluate the effects of different W&Afeatures, we divide the W&A features into three different groups: 1) Weather (W): weather condition,temperature, pressure, humidity, wind speed, and wind direction; 2) Air Quality (A): CO, NO2, O3, andSO2; and 3) Time Stamp (T). We compare different combinations of the W&A features.The confusion matrix of classification results are shown in Fig. 11. The rows of the matrix are the real
PM2.5 categories. The columns are the predicted PM2.5 categories. The average classification accuraciesand regression errors of different methods are shown in Table 4. From the results, we can find that moremeteorological features are utilized, higher estimation performance is achieved. This demonstrate thatall the selected meteorological features are useful to estimate the PM2.5. In detail, from the confusionmatrix, we can find that if only using the weather information, most of the records are classified intothe G and M categories. It means that if only using whether information, it is hard to detect thePM2.5 situation. Moreover, after adding the air quantity information, classification accuracy is greatly
Proceedings of the ACM on Interactive, Mobile, Wearable and Ubiquitous Technologies, Vol. 2, No. 1, Article 20.
Publication date: March 2018.

Third-Eye: A Mobilephone-Enabled Crowdsensing System for Air Quality Monitoring • 20:19
Table 4. The comparison of different W&A feature based LSTM models.
Methods Classification Accuracy Regression Error
W 62.43% 36.54A 70.26% 28.50
W+A 72.96% 26.52W+A+T 75.21% 23.72
W A W+A W+A+T
Fig. 11. The confusion matrix of different W&A feature based LSTM models.
improved. The confusion matrix also more obviously shows the improvements. Different from weatherinformation, the false classifications mainly appear in the adjacent categories. Furthermore, the additionof T can further decrease the obviously wrong situation. According to our further observation, the wrongsituations mainly appear in the boundary of each categories. The regression errors also demonstrate thisconclusion. Finally, the proposed W&A model can achieve 75.21% classification accuracy with only 23.72regression error.
7 APPLICATION AND EVALUATION
Based on our framework and models, we develop a mobile APP - Third-Eye. This is an analogy thatthe camera of mobilephone works like the third eye of users. Using “the third eye”, users are able tosee the real-time PM2.5 concentration. We have developed three versions for Andriod, iOS, and WeChat,respectively. All these versions are downloaded more than 2,000 times. An ideal personal air monitornecessitates the combination of accuracy, low cost, portability, and convenience into a single design. Inthis section, we show the application of Third-Eye, and demonstrate how Third-Eye offers substantialenhancements over some other commercial PM2.5 monitors by simultaneously improving accessibility,portability, and accuracy.
7.1 Interface
As shown in Fig. 12, this APP provides a very concise and friend interaction interface. When a useropens the APP, it automatically launches the rear camera of mobilephone soon. The APP interface (seeFig. 12(b)) guides the user to take the quantified outdoor images. It provides a white box which is asuggested sky area of the image. We need the outdoor-image including a part of sky, because it can avoidindoor or close shot which makes the dark channel work poorly. After pressing the capture button, theimage is taken, and then resized as 256×256 pixels. The image is sent to the back-end server which runs
Proceedings of the ACM on Interactive, Mobile, Wearable and Ubiquitous Technologies, Vol. 2, No. 1, Article 20.
Publication date: March 2018.

20:20 • L. Liu et al.
Sky part
Non-sky part
Capture
button
Cancel
button
PM2.5 value
(a) (b) (c)
Fig. 12. Screenshot of Third-eye. (a) The boot screen. The three Chinese characters mean opening the third eye. (b)The interface of capturing outdoor-image. (c) The interface of returning result.
the inference models (regression models based on outdoor-image and W&A data). The server calculatesthe PM2.5 value and returns it to user’s mobilephone. Fig. 12(c) illustrates the interface of result display.
7.2 Accuracy
Next, we further evaluate the performance of Third-Eye via user data analysis. The beta version ofThird-Eye (for Android) has started running from July 2016. We choose the data generated by usersaround monitoring sites, and then obtain 1,198 records of user data with PM2.5 ground truth from July2016 to July 2017. We first compare the APP results with the ground truth. As shown in Fig. 13, formost time the difference between APP result and the ground truth is very small. The average error is17.38 and the classification accuracy is 81.55%.
We further evaluate different fusion weights to investigate the effects of visual and W&A models in thefinal system. We change the weight w from 0 to 1 with the step of 0.05, and calculate the correspondingregression error and classification accuracy for each value of w. The results are illustrated in Fig. 14. Whenw = 0, i.e., only using W&A model, the regression error and classification accuracy are 22.06 and 78.29%,respectively; when w = 1, i.e., only using visual model, the regression error and classification accuracy are33.81 and 61.52%, respectively. That means the combination of the two models can significantly improvethe inference performance. From Fig. 14, we also observe that when w is around 0.5, the relatively lowregression error and high classification accuracy are achieved. This result is consistent with the settingof w = 0.5.
7.3 Computational Time
To evaluate the computational complexity of the proposed system, we further calculate the processingtime of the 1,198 user records. The results are shown in Fig. 15. Because the user scale is not large, theserver-side is now executed on the computer with Intel Xeon E5-2620v3 2.4GHz CPU and 16G memorywithout any GPU devices. From the Fig. 15, we can find that most of the computational time is lessthan 2 seconds. The average computation time is 1.31 seconds. We also test the system on the graphic
Proceedings of the ACM on Interactive, Mobile, Wearable and Ubiquitous Technologies, Vol. 2, No. 1, Article 20.
Publication date: March 2018.

Third-Eye: A Mobilephone-Enabled Crowdsensing System for Air Quality Monitoring • 20:21
0
50
100
150
200
250
300
350
400
450
500
J-16 J-16 A-16 S-16 O-16 N-16 D-16 J-17 F-17 M-17 A-17 M-17 J-17 J-17
PM
2.5
Va
lue
Record Date
Third-Eye GroundTruth
Fig. 13. The real-world PM2.5 inference accuracy of the proposed system.
0
5
10
15
20
25
30
35
40
0.00
0.10
0.20
0.30
0.40
0.50
0.60
0.70
0.80
0.90
0.00 0.10 0.20 0.30 0.40 0.50 0.60 0.70 0.80 0.90 1.00
Re
gre
ssio
n E
rro
r
Cla
ssif
ica
tio
n A
ccu
racy
Fusion Weight w
Classification Accuracy
Regression Error
Fig. 14. Fusion results of visual and W&A models with different weights.
workstation with Intel Xeon E5-2660v3 2.6GHz CPU, four NVIDIA K80m GPU cards, 256G memory,and 1T SSD disk. The average computation time is 210ms. We think the computation time can be limitedin 100ms after optimizing the code.
7.4 Comparison
First of all, we compare the proposed Third-Eye with the following state-of-the-art air quality monitoringsolutions:
• PAPLE [28]. PAPLE exploits a CNN to estimate air quality based on photos. They designed anegative log-log ordinal classifier to fit the ordinal output and a modified activation function forair pollution level estimation.
Proceedings of the ACM on Interactive, Mobile, Wearable and Ubiquitous Technologies, Vol. 2, No. 1, Article 20.
Publication date: March 2018.

20:22 • L. Liu et al.
0
0.5
1
1.5
2
2.5
3
3.5
4
J-16 J-16 A-16 S-16 O-16 N-16 D-16 J-17 F-17 M-17 A-17 M-17 J-17
Co
mp
uta
tio
na
lTim
e
Record Date
Fig. 15. The real-world computation time for PM2.5 inference.
• AirTick [20]. AirTick is a mobile APP which leverages image analytics and deep learning tech-niques to produce accurate estimates of air quality with camera enabled smart mobile device.
• Scattered Interpolation. With the PM2.5 values from 34 monitoring sites (exclude the groundtruth monitoring site), three commonly used scattered interpolation methods, Linear Interpolation,Nearest Neighbor Interpolation, and Natural Neighbor Interpolation, are employed to estimate thePM2.5 of the ground truth monitoring site.
• Dark Channel based CNN. This is the proposed visual model.• W+A+T based LSTM. This is the proposed W&A model.• Third-Eye. This is the proposed mobilephone-enable system combined the visual model with theW&A model.
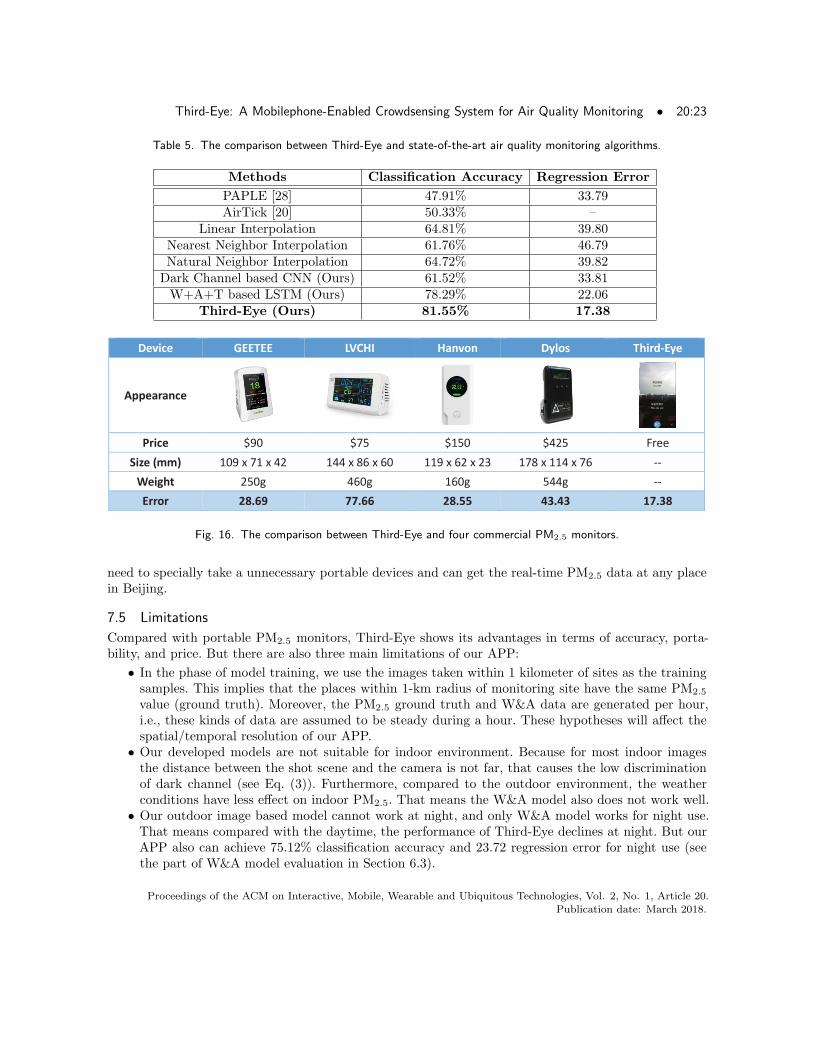
The evaluations are performed on the 1,198 records of user data with PM2.5 ground truth capturedfrom July 2016 to July 2017. The compared results, i.e., classification accuracy and regression error,are listed in Table 5. From the results, we can find that compared with the state-of-the-art visualinformation based methods (i.e., PAPLE and AirTick), the proposed dark channel based CNN achievesthe better performance. It demonstrate that the proposed dark channel prior can remove the mostnoisy information while keeping the major maze characters, which leads the CNN to effectively extractthe discriminative and robust features for PM2.5 estimation. Moreover, compared with the traditionalinterpolation methods, our W&A model also has much better accuracy. This demonstrates that theproposed W&A model can extract expressive features from long consecutive W&A changing patternswith the LSTM. Finally, compared with all the state-of-the-art solutions, the proposed Third-Eye, whichcombines the Dark Channel based CNN and W+A+T based LSTM, achieves the best performance.Moreover, we also compare the performances between Third-Eye and 4 popular commercial PM2.5
monitors. We bring these devices to the places nearby a monitoring site (L1 in Fig. 6), and collectmore than 6,000 measurements over three months. Compared with the ground truth, we find the PM2.5
measurements generated by portable devices are with relatively large errors and low stability. TakingDylos 1700 for example, it is commonly used in many research works to provide high quality PM2.5
data. But its average error is 43.43 in our tests. As shown in Fig. 16, our system achieves the bestresults with only 17.38 average error. Fig. 16 also lists the price, size, and weight of each device. As themobilephone become the indispensable tool for each people, our APP is near zero cost. The users do not
Proceedings of the ACM on Interactive, Mobile, Wearable and Ubiquitous Technologies, Vol. 2, No. 1, Article 20.
Publication date: March 2018.
Third-Eye: A Mobilephone-Enabled Crowdsensing System for Air Quality Monitoring • 20:23
Table 5. The comparison between Third-Eye and state-of-the-art air quality monitoring algorithms.
Methods Classification Accuracy Regression Error
PAPLE [28] 47.91% 33.79AirTick [20] 50.33% –
Linear Interpolation 64.81% 39.80Nearest Neighbor Interpolation 61.76% 46.79Natural Neighbor Interpolation 64.72% 39.82Dark Channel based CNN (Ours) 61.52% 33.81W+A+T based LSTM (Ours) 78.29% 22.06
Third-Eye (Ours) 81.55% 17.38
Device GEETEE LVCHI Hanvon Dylos Third-Eye
Appearance
Price $90 $75 $150 $425 Free
Size (mm) 109 x 71 x 42 144 x 86 x 60 119 x 62 x 23 178 x 114 x 76 --
Weight 250g 460g 160g 544g --
Error 28.69 77.66 28.55 43.43 17.38
Fig. 16. The comparison between Third-Eye and four commercial PM2.5 monitors.
need to specially take a unnecessary portable devices and can get the real-time PM2.5 data at any placein Beijing.
7.5 Limitations
Compared with portable PM2.5 monitors, Third-Eye shows its advantages in terms of accuracy, porta-bility, and price. But there are also three main limitations of our APP:
• In the phase of model training, we use the images taken within 1 kilometer of sites as the trainingsamples. This implies that the places within 1-km radius of monitoring site have the same PM2.5
value (ground truth). Moreover, the PM2.5 ground truth and W&A data are generated per hour,i.e., these kinds of data are assumed to be steady during a hour. These hypotheses will affect thespatial/temporal resolution of our APP.
• Our developed models are not suitable for indoor environment. Because for most indoor imagesthe distance between the shot scene and the camera is not far, that causes the low discriminationof dark channel (see Eq. (3)). Furthermore, compared to the outdoor environment, the weatherconditions have less effect on indoor PM2.5. That means the W&A model also does not work well.
• Our outdoor image based model cannot work at night, and only W&A model works for night use.That means compared with the daytime, the performance of Third-Eye declines at night. But ourAPP also can achieve 75.12% classification accuracy and 23.72 regression error for night use (seethe part of W&A model evaluation in Section 6.3).
Proceedings of the ACM on Interactive, Mobile, Wearable and Ubiquitous Technologies, Vol. 2, No. 1, Article 20.
Publication date: March 2018.
20:24 • L. Liu et al.
8 CONCLUSION
In this paper, we propose a mobilephone-enabled crowdsensing system named Third-Eye to estimate thePM2.5. First of all, we recruit more than 200 participants with various crowdsensing incentive strategiesto collect one of the most comprehensive PM2.5 estimation dataset, which includes 31,601 labeled outdoorimages, one whole year time span, and the 150,000 W&A records. Moreover, with these valuable data,we holistically train two different end-to-end models: the dark channel prior based CNN model and theW&A based LSTM model. In the first model, the dark channel prior is computed to remove the mostnoisy information while keeping the major maze characters, and the CNN is learnt to estimate the PM2.5
from the dark channel image. Meanwhile, the W&A based LSTM model exploits the recurrent neuralnetwork to extract the PM2.5 changing pattern from the historical meteorology sequence information.Finally, the two complementary models are combined by the late fusion strategy. To evaluate the proposedsystem, we release three applications for Andriod, iOS, and WeChat users, respectively. Through onemore year real-world evaluation based on crowdsensing incentive strategies, more than 2,000 users inBeijing downloaded our system and supply the actual usage data. The user data analysis sufficientlyverify that our APP significantly outperforms 5 state-of-the-art methods and 4 popular portable devices.
Furthermore, although in this paper we only test the Third-Eye in Beijing, the evaluations demonstratethat the proposed system has the adequate expansibility to be used in other cites. In the future, we willtry to develop its global version to help more users conventionally monitor the air quality and protecttheir health.
ACKNOWLEDGMENTS
This work is partially supported by National Key R&D Program of China Grant (No.2017YFB1003000),and National Natural Science Foundation of China Grant (No.61332005, No.61720106007, and No.61632008).
REFERENCES[1] AR Al-Ali, Imran Zualkernan, and Fadi Aloul. 2010. A mobile GPRS-sensors array for air pollution monitoring. IEEE
Sensors Journal 10, 10 (2010), 1666–1671.[2] Paul M. Aoki, R. J. Honicky, Alan M. Mainwaring, Chris Myers, Eric Paulos, Sushmita Subramanian, and Allison
Woodruff. 2009. A vehicle for research: using street sweepers to explore the landscape of environmental communityaction. In Proceedings of the 27th International Conference on Human Factors in Computing Systems, Boston, MA,USA. 375–384.
[3] Elena Boldo, Sylvia Medina, Alain Le Tertre, Fintan Hurley, Hans-Guido Mucke, Ferran Ballester, Inmaculada Aguil-
era, and others. 2006. Apheis: Health impact assessment of long-term exposure to PM2. 5 in 23 European cities.European journal of epidemiology 21, 6 (2006), 449–458.
[4] Jiaoyan Chen, Huajun Chen, Jeff Z. Pan, Ming Wu, Ningyu Zhang, and Guozhou Zheng. 2013. When big data meetsbig smog: a big spatio-temporal data framework for China severe smog analysis. In Proceedings of the 2nd ACM
SIGSPATIAL International Workshop on Analytics for Big Geospatial Data, Orlando, FL, USA. 13–22.[5] Jiaoyan Chen, Huajun Chen, Guozhou Zheng, Jeff Z. Pan, Honghan Wu, and Ningyu Zhang. 2014. Big smog meets
web science: smog disaster analysis based on social media and device data on the web. In 23rd International WorldWide Web Conference, Seoul, Republic of Korea. 505–510.
[6] Yun Cheng, Xiucheng Li, Zhijun Li, Shouxu Jiang, Yilong Li, Ji Jia, and Xiaofan Jiang. 2014. AirCloud: a cloud-basedair-quality monitoring system for everyone. In Proceedings of the 12th ACM Conference on Embedded Network SensorSystems, Memphis, Tennessee, USA. 251–265.
[7] Jia Deng, Wei Dong, Richard Socher, Li-Jia Li, Kai Li, and Li Fei-Fei. 2009. Imagenet: A large-scale hierarchical
image database. In IEEE Conference on Computer Vision and Pattern Recognition. IEEE, 248–255.[8] Srinivas Devarakonda, Parveen Sevusu, Hongzhang Liu, Ruilin Liu, Liviu Iftode, and Badri Nath. 2013. Real-time air
quality monitoring through mobile sensing in metropolitan areas. In Proceedings of the 2nd ACM SIGKDD Interna-
tional Workshop on Urban Computing, Chicago, Illinois, USA. 15:1–15:8.[9] Jeff Donahue, Lisa Anne Hendricks, Marcus Rohrbach, Subhashini Venugopalan, Sergio Guadarrama, Kate Saenko,
Proceedings of the ACM on Interactive, Mobile, Wearable and Ubiquitous Technologies, Vol. 2, No. 1, Article 20.
Publication date: March 2018.
Third-Eye: A Mobilephone-Enabled Crowdsensing System for Air Quality Monitoring • 20:25
and Trevor Darrell. 2017. Long-Term Recurrent Convolutional Networks for Visual Recognition and Description. IEEETrans. Pattern Anal. Mach. Intell. 39, 4 (2017), 677–691.
[10] Chuang Gan, Naiyan Wang, Yi Yang, Dit-Yan Yeung, and Alexander G. Hauptmann. 2015. DevNet: A Deep EventNetwork for multimedia event detection and evidence recounting. In IEEE Conference on Computer Vision andPattern Recognition. 2568–2577.
[11] Raghu K. Ganti, Fan Ye, and Hui Lei. 2011. Mobile crowdsensing: current state and future challenges. IEEE Com-
munications Magazine 49, 11 (2011), 32–39.[12] Yi Gao, Wei Dong, Kai Guo, Xue Liu, Yuan Chen, Xiaojin Liu, Jiajun Bu, and Chun Chen. 2016. Mosaic: A low-cost
mobile sensing system for urban air quality monitoring. In 35th Annual IEEE International Conference on ComputerCommunications, San Francisco, CA, USA. 1–9.
[13] Bin Guo, Zhu Wang, Zhiwen Yu, Yu Wang, Neil Y. Yen, Runhe Huang, and Xingshe Zhou. 2015. Mobile CrowdSensing and Computing: The Review of an Emerging Human-Powered Sensing Paradigm. ACM Comput. Surv. 48, 1(2015), 7:1–7:31.
[14] Kaiming He, Jian Sun, and Xiaoou Tang. 2011. Single Image Haze Removal Using Dark Channel Prior. IEEE Trans.
Pattern Anal. Mach. Intell. 33, 12 (2011), 2341–2353.[15] Alex Krizhevsky, Ilya Sutskever, and Geoffrey E. Hinton. 2012. ImageNet Classification with Deep Convolutional
Neural Networks. In 26th Annual Conference on Neural Information Processing Systems, Lake Tahoe, Nevada, United
States. 1106–1114.[16] Yuncheng Li, Jifei Huang, and Jiebo Luo. 2015. Using user generated online photos to estimate and monitor air
pollution in major cities. In Proceedings of the 7th International Conference on Internet Multimedia Computing andService, Zhangjiajie, Hunan, China. 79:1–79:5.
[17] Wu Liu, Tao Mei, Yongdong Zhang, Cherry Che, and Jiebo Luo. 2015. Multi-task deep visual-semantic embeddingfor video thumbnail selection. In IEEE Conference on Computer Vision and Pattern Recognition, Boston, MA, USA.3707–3715.
[18] Huadong Ma, Dong Zhao, and Peiyan Yuan. 2014. Opportunities in mobile crowd sensing. IEEE Communications
Magazine 52, 8 (2014), 29–35.[19] XY Ni, H Huang, and WP Du. 2017. Relevance analysis and short-term prediction of PM 2.5 concentrations in Beijing
based on multi-source data. Atmospheric Environment 150 (2017), 146–161.[20] Zhengxiang Pan, Han Yu, Chunyan Miao, and Cyril Leung. 2017. Crowdsensing Air Quality with Camera-Enabled Mo-
bile Devices. In Proceedings of the Thirty-First AAAI Conference on Artificial Intelligence, San Francisco, California,USA. 4728–4733.
[21] Sameera Poduri, Anoop Nimkar, and Gaurav S Sukhatme. 2010. Visibility monitoring using mobile phones. AnnualReport: Center for Embedded Networked Sensing (2010), 125–127.
[22] Mette Sørensen, Bahram Daneshvar, Max Hansen, Lars O Dragsted, Ole Hertel, Lisbeth Knudsen, and Steffen Loft.2003. Personal PM2. 5 exposure and markers of oxidative stress in blood. Environmental Health Perspectives 111, 2(2003), 161.
[23] Mengfan Tang, Xiao Wu, Pranav Agrawal, Siripen Pongpaichet, and Ramesh Jain. 2017. Integration of Diverse DataSources for Spatial PM2.5 Data Interpolation. IEEE Trans. Multimedia 19, 2 (2017), 408–417.
[24] Rundong Tian, Christine Dierk, Christopher Myers, and Eric Paulos. 2016. MyPart: Personal, Portable, Accurate,Airborne Particle Counting. In Proceedings of the 2016 CHI Conference on Human Factors in Computing Systems,
San Jose, CA, USA. 1338–1348.[25] Sotiris Vardoulakis, Bernard EA Fisher, Koulis Pericleous, and Norbert Gonzalez-Flesca. 2003. Modelling air quality
in street canyons: a review. Atmospheric environment 37, 2 (2003), 155–182.[26] Dejun Yang, Guoliang Xue, Xi Fang, and Jian Tang. 2012. Crowdsourcing to smartphones: incentive mechanism
design for mobile phone sensing. In The 18th Annual International Conference on Mobile Computing and Networking,Istanbul, Turkey. 173–184.
[27] Jing Yuan, Yu Zheng, and Xing Xie. 2012. Discovering regions of different functions in a city using human mobility andPOIs. In Proceedings of the 18th ACM SIGKDD international conference on Knowledge discovery and data mining.
ACM, 186–194.[28] Chao Zhang, Junchi Yan, Changsheng Li, Xiaoguang Rui, Liang Liu, and Rongfang Bie. 2016b. On Estimating
Air Pollution from Photos Using Convolutional Neural Network. In Proceedings of the 2016 ACM Conference on
Multimedia Conference, Amsterdam, The Netherlands,. 297–301.[29] Xinglin Zhang, Zheng Yang, Wei Sun, Yunhao Liu, Shaohua Tang, Kai Xing, and XuFei Mao. 2016c. Incentives for
Mobile Crowd Sensing: A Survey. IEEE Communications Surveys and Tutorials 18, 1 (2016), 54–67.[30] Zheng Zhang, Huadong Ma, Huiyuan Fu, Liang Liu, and Cheng Zhang. 2016a. Outdoor Air Quality Level Inference
Proceedings of the ACM on Interactive, Mobile, Wearable and Ubiquitous Technologies, Vol. 2, No. 1, Article 20.
Publication date: March 2018.

20:26 • L. Liu et al.
via Surveillance Cameras. Mobile Information Systems 2016 (2016), 9825820:1–9825820:10.[31] Zheng Zhang, Huadong Ma, Huiyuan Fu, and Xinpeng Wang. 2015. Outdoor Air Quality Inference from Single Image.
In 21st International Conference on MultiMedia Modeling, Sydney, NSW, Australia,. 13–25.[32] Yu Zheng, Furui Liu, and Hsun-Ping Hsieh. 2013. U-Air: when urban air quality inference meets big data. In The 19th
ACM SIGKDD International Conference on Knowledge Discovery and Data Mining, Chicago, IL, USA. 1436–1444.
Received August 2017; Revised November 2017; Accepted January 2018
Proceedings of the ACM on Interactive, Mobile, Wearable and Ubiquitous Technologies, Vol. 2, No. 1, Article 20.
Publication date: March 2018.