thiopaq report - final.doc | us epa archive document · natco group, inc. (natco), located in...
TRANSCRIPT

SRIUSEPA-GHG-VR-32 September 2004
Environmental Technology Verification Report
NATCO Group Inc ndash Paques THIOPAQ Gas Purification Technology
Prepared by
Greenhouse Gas Technology CenterSouthern Research Institute
Under a Cooperative Agreement With US Environmental Protection Agency
EPA REVIEW NOTICE
This report has been peer and administratively reviewed by the US Environmental Protection Agency and approved for publication Mention of trade names or commercial products does not constitute endorsement or recommendation for use
THE ENVIRONMENTAL TECHNOLOGY VERIFICATION PROGRAM
SOUTHERN RESEARCH US Environmental Protection Agency I N S T I T U T E
ETV Joint Verification Statement TECHNOLOGY TYPE Sour Gas Processing System
APPLICATION Biogas Purification
TECHNOLOGY NAME Paques THIOPAQ
COMPANY NATCO Group Inc
ADDRESS Brookhollow Central III 2950 N Loop West Suite 100 Houston Texas 77092
WEB ADDRESS wwwnatcogroupcom
The US Environmental Protection Agency (EPA) has created the Environmental Technology Verification (ETV) program to facilitate the deployment of innovative or improved environmental technologies through performance verification and dissemination of information The goal of the ETV program is to further environmental protection by accelerating the acceptance and use of improved and cost-effective technologies ETV seeks to achieve this goal by providing high-quality peer-reviewed data on technology performance to those involved in the purchase design distribution financing permitting and use of environmental technologies
ETV works in partnership with recognized standards and testing organizations stakeholder groups that consist of buyers vendor organizations and permitters and with the full participation of individual technology developers The program evaluates the performance of technologies by developing test plans that are responsive to the needs of stakeholders conducting field or laboratory tests collecting and analyzing data and preparing peer-reviewed reports All evaluations are conducted in accordance with rigorous quality assurance protocols to ensure that data of known and adequate quality are generated and that the results are defensible
The Greenhouse Gas Technology Center (GHG Center) one of six verification organizations under the ETV program is operated by Southern Research Institute in cooperation with EPArsquos National Risk Management Research Laboratory A technology area of interest to some GHG Center stakeholders is reliable renewable energy sources The generation of heat and power at industrial petrochemical agricultural and waste-handling facilities with renewable energy sources such as anaerobic digester gas (biogas) or landfill gas is a particular interest Removal of the harmful components of biogases (primarily
S-1
hydrogen sulfide and other sulfurous compounds) while minimizing the creation of secondary waste streams and effluents is essential to development of these renewable energy sources NATCO Group Inc (NATCO) located in Houston Texas has requested that the GHG Center perform an independent performance verification of the Paques THIOPAQ technology ndash a gas purification system
TECHNOLOGY DESCRIPTION
The following technology description is based on information provided by NATCO and Paques and does not represent verified information This technology developed in The Netherlands by Paques BioSystems is designed to safely and efficiently remove hydrogen sulfide (H2S) from biogas and other sour gases while minimizing the generation of harmful emissions or effluents The process is suitable to applications where the processed biogas can be utilized as fuel The system also allows the production of elemental sulfur for subsequent sale or use A variation of this technology is the Shell-Paques system which operates on the same principles as THIOPAQ but includes system components that can process low- medium- and high-pressure natural gas as well as acid gas and Claus tail gas
The Paques desulfurization technology is a caustic scrubber-based system designed to maintain a high level of H2S removal while addressing several shortcomings of conventional technologies This technology is designed by Paques Biosystems to (1) reduce hazardous effluents from the scrubber by aerobically digesting the waste into a more benign sulfurous product and (2) regenerate and recycle sodium hydroxide (NaOH) needed in the scrubber The THIOPAQ system is specifically designed for low-pressure biogas streams
The THIOPAQ process begins with the input of biogas or sour gas into an absorber unit (or scrubber) at ambient pressure Scrubber design is site-specific in regards to vessel size construction specifications and gas and solution flow capacities System pH ranges from 82 to 9 The counter-current scrubber design washes the sour gas or biogas with caustic solution in a packed bed or packed beds containing 2shyinch Pall rings Treated gas (sweet gas) exits the scrubber top enters a knockout drum and is routed for on-site use or to a sales gas stream
The liquid stream is then sent to the bioreactor (ambient pressure) where caustic solution is regenerated through a series of chemical reactions and biological oxidation of dissolved sulfide A blower supplies air to a distribution header in the bottom section of the reactor to enhance mixing Some of the oxygen is consumed in reactions with sulfide to produce sulfur by the actions of the Thiobacillus bacteria The bacteria are maintained using a continuous feed of proprietary nutrients supplied by Paques These nutrients are pumped into the bioreactor with a small metering pump Regenerated solvent from the bioreactor is pumped back to the scrubber for reuse
VERIFICATION DESCRIPTION
The GHG Center tested a THIOPAQ system installed and operating at a 40 million gallons per day (MGD) water pollution control facility (WPCF) designed to process industrial wastewater streams from numerous local companies including grain and food processing plants and a paper mill Approximately three MGD of flow coming from the paper mill is pretreated in three upflow anaerobic sludge blankets (UASBs) Each UASB generates around 100 to 200 cubic feet per minute (cfm) of biogas (generally 60 percent CH4 38 percent CO2 and 1 to 2 percent H2S) The gas generated in each UASB is collected and used to fuel a sludge incinerator within the plant that is capable of consuming all of the biogas generated on-site under normal plant operations The biogas is flared during rare occurrences when the incinerator is not operating or is being fueled with natural gas
S-2
Field tests were performed on June 29 through July 1 2004 on the THIOPAQ system to independently verify the performance of this technology One-month (June 1 through July 1 2004) of process monitoring data was provided by the facility to allow the GHG Center to evaluate system operations over a longer term The verification included evaluation of both environmental and operational performance of the system
Environmental Performance bull Air Emissions bull Liquid Effluent
Operational Performance bull H2S Removal Efficiency bull Gas Composition and Quality bull NaOH Consumption bull Sulfur Product Purity
Nine grab samples were collected during the verification period to directly measure the concentrations of H2S and other sulfur compounds emitted to the atmosphere from the bioreactor vent Vent gas flow rates were not determined due to difficulties with cyclonic and highly variable flow Therefore vent gas emissions are reported as estimates only Seven bioreactor slurry samples were collected to determine the sulfates sulfides and total suspended solids (TSS) content of liquids disposed from the system as wastewater
For verification of operational performance nine corresponding biogas grab samples were collected on both the upstream and downstream sides of the THIOPAQ system and submitted for analysis Results of the analyses were used with biogas flow rates through the system to evaluate system removal efficiency for H2S and other sulfur compounds The results also allowed the center to evaluate the effects of the system on biogas composition and heating value NaOH consumption rates were monitored and reported and composite solid waste samples from the system were collected for determination of elemental sulfur content Plans to measure the amount of solids produced by the system were abandoned during field testing The facility only wastes solids every three weeks or so on an as-needed basis The frequency and amount of solids removed varies widely depending on the amount of solids removed through the liquid effluent Removal of solids cake at this facility was operator specific and infrequent therefore it was deemed too arbitrary for verification here Because of this a sulfur mass balance could not be completed for the system
Quality assurance (QA) oversight of the verification testing was provided following specifications in the ETV Quality Management Plan (QMP) The GHG Centerrsquos quality manager conducted a technical systems audit (TSA) and an audit of data quality (ADQ) on at least 10 percent of the data generated during this verification Two performance evaluation audits (PEAs) were also conducted The GHG Center field team leader and project manager have reviewed the data from the verification testing and have concluded that the data quality objectives specified in the Test and Quality Assurance Plan were attained for the verification parameters that were evaluated (excluding vent gas emission rates and solids production rates)
S-3
VERIFICATION OF PERFORMANCE
Environmental Performance
bull Concentrations of H2S and total sulfur compounds in the air vented from the bioreactor were very low averaging 929 and 1961 ppbv respectively H2S typically comprised about half of the total sulfur compound concentrations and methyl mercaptan dimethyl sulfide and dimethyl disulfide were the other prominent compounds
bull Vent gas flow rates were not determined due to difficulties with cyclonic and highly variable flow Using air flow rates into the reactor logged by the facility the estimated average reactor vent emission rates for H2S and total sulfur compounds were 00012 and 00026 pounds per hour respectively
bull The average sulfate sulfide and TSS concentrations in the bioreactor effluent were 3480 2030 and 20130 milligrams per liter respectively
bull The average bioreactor effluent disposal rate during the 1-month monitoring period was 110 gallons per hour or about 2600 gallons per day Resulting sulfate sulfide and TSS effluent disposal rates are 77 45 and 444 pounds per day respectively
Operational Performance
bull Biogas flow rates through the system during the three-day sampling period ranged from 119 to 504 standard cubic feet per minute (scfm) and averaged 322 scfm [or approximately 464 thousand cubic feet per day (103cfd)]
bull Table S-1 summarizes the sour and processed gas average composition H2S content and heat content for nine samples collected before and after the THIOPAQ system The average H2S removal efficiency on a mass basis was 998 percent Biogas lower heating value (LHV) increased by approximately 86 percent due to changes in gas composition specifically removal of some of the CO2 from the sour biogas
Table S-1 Composition and Properties of Sour and Processed Biogas - Dry Basis
Gas Composition Higher and lower heating values (Btuscf)
Relative Density
Compres-sibility CH4 () CO2 () N2 () H2S (ppm)
Total S (ppm) HHV LHV
Avg Sour Gas 6244 3375 189 19318 19336 6339 5686 08970 09970
Avg Processed Gas 6889 2871 203 275 429 6856 6172 08454 09972
bull During a continuous NaOH tank level monitoring period of 376 hours a total of 947 gallons of 50shypercent NaOH solution was consumed for an average consumption rate of 252 galhr (605 galday) The average sour biogas feed rate during that monitoring period was 355 scfm (or 511 x 103cfd) with an average 193 percent sulfur content The average 50-percent NaOH consumption normalized to biogas feed rate was 012 gallons per thousand cubic foot of biogas processed or 044 lb NaOH per lb sulfur
bull The average elemental sulfur content of the solids cake samples was 436 percent (wet basis) On a dry basis elemental sulfur averaged 592 percent
S-4
Details on the verification test design measurement test procedures and Quality AssuranceQuality Control (QAQC) procedures can be found in the Test Plan titled Test and Quality Assurance Plan ndash Paques THIOPAQ and Shell-Paques Gas Purification Technology (SRI 2004) Detailed results of the verification are presented in the Final Report titled Environmental Technology Verification Report for The Paques THIOPAQ Gas Purification Technology (SRI 2004) Both can be downloaded from the GHG Centerrsquos web-site (wwwsri-rtpcom) or the ETV Program web-site (wwwepagovetv)
Signed by Lawrence W Reiter PhD 92904 Signed by Stephen D Piccot 92004
Lawrence W Reiter PhD Acting Director National Risk Management Research Laboratory Office of Research and Development
Stephen D Piccot Director Greenhouse Gas Technology Center
Southern Research Institute
Notice GHG Center verifications are based on an evaluation of technology performance under specific predetermined criteria and the appropriate quality assurance procedures The EPA and Southern Research Institute make no expressed or implied warranties as to the performance of the technology and do not certify that a technology will always operate at the levels verified The end user is solely responsible for complying with any and all applicable Federal State and Local requirements Mention of commercial product names does not imply endorsement or recommendation
EPA REVIEW NOTICE
This report has been peer and administratively reviewed by the US Environmental Protection Agency and approved for publication Mention of trade names or commercial products does not constitute endorsement or recommendation for use
S-5
SRIUSEPA-GHG-VR-32 September 2004
Greenhouse Gas Technology Center A US EPA Sponsored Environmental Technology Verification ( ) Organization
Environmental Technology Verification Report
NATCO Group Inc ndash Paques THIOPAQ Gas Purification Technology
Prepared By Greenhouse Gas Technology Center
Southern Research Institute PO Box 13825
Research Triangle Park NC 27709 USA Telephone 919806-3456
Under EPA Cooperative Agreement CR 829478
US Environmental Protection Agency Office of Research and Development
National Risk Management Research Laboratory Air Pollution Prevention and Control Division
Research Triangle Park NC 27711 USA
EPA Project Officer David A Kirchgessner
TABLE OF CONTENTS Page
LIST OF FIGURES iii LIST OF TABLES iii ACKNOWLEDGMENTS iv ACRONYMS AND ABBREVIATIONSv
10 INTRODUCTION 1-211 BACKGROUND 1-212 PAQUES THIOPAQ TECHNOLOGY DESCRIPTION 1-3
121 THIOPAQ Process1-3122 Process Chemistry1-4123 Host Facility Description and THIOPAQ Integration 1-5
13 PERFORMANCE VERIFICATION OVERVIEW1-7131 Environmental Performance Parameters1-7132 Operational Performance Parameters1-8133 Modifications to TQAP1-9
Vent Flow Measurement 1-9Collection of Vent Gas1-10Collection of sour and processed biogas samples 1-10Liquid NaOH Solution Flow Measurement 1-10
20 VERIFICATION RESULTS2-121 ENVIRONMENTAL PERFORMANCE2-1
211 Air Emissions2-1212 Liquid Effluent2-3
22 OPERATIONAL PERFORMANCE 2-4221 Gas Composition Gas Quality and H2S Removal Efficiency2-4222 NaOH Consumption2-6223 Sulfur Production and Purity2-7
30 DATA QUALITY ASSESSMENT3-131 DATA QUALITY OBJECTIVES 3-132 ENVIRONMENTAL PERFORMANCE PARAMETERS 3-133 OPERATIONAL PERFORMANCE PARAMETERS3-334 VERIFICATION AUDITS 3-4
40 TECHNICAL AND PERFORMANCE DATA SUPPLIED BY NATCO GROUP 4-1
50 REFERENCES 5-1
LIST OF FIGURES Page
Figure 1-1 Simplified THIOPAQ System Schematic 1-3 Figure 1-2 THIOPAQ System Tested 1-5 Figure 2-1 Biogas and Reactor Air Flow Rates During Testing 2-2 Figure 2-2 Biogas Composition Before and After the THIOPAQ 2-5 Figure 2-3 NaOH Consumption During Verification Period 2-6
LIST OF TABLES Page
Table 1-1 Host Site THIOPAQ Monitoring Instrumentation 1-6 Table 2-1 Sampling Matrix 2-1 Table 2-2 Summary of Sulfur Compounds in Vent Gas Samples 2-2 Table 2-3 Total Sulfate Total Suspended Solids and Total Sulfides in Reactor Slurry 2-3 Table 2-4 Composition and Properties of Sour and Processed Biogas 2-4 Table 2-4 Composition of Solids Removed From the THIOPAQ Process 2-6 Table 3-1 Verification Reference Methods 3-1Table 3-2 Summary of Vent Gas Analytical QAQC Checks 3-2 Table 3-3 Summary of Effluent Sulfate and Sulfide Analytical QAQC Checks 3-3
ACRONYMS AND ABBREVIATIONS
ADQ Audit of Data Quality ASTM American Society for Testing and Materials Btu British thermal units Btuscf British thermal units per standard cubic foot CAR Corrective Action Report cfm cubic feet per minute DQI data quality indicator DQO data quality objective EPA Environmental Protection Agency ETV Environmental Technology Verification gal US gallons galday gallons per day galhr gallons per hour GHG Center Greenhouse Gas Technology Center lb pound lbhr pounds per hour lbday pounds per day LHV lower heating value mgl milligrams per liter MGD million gallons per day NATCO NATCO Group Inc PEA Performance Evaluation Audit ppbv parts per billion volume ppmv parts per million volume QAQC Quality AssuranceQuality Control QMP Quality Management Plan scfm standard cubic feet per minute TQAP Test and Quality Assurance Plan TSA 103cfd
technical systems audit thousand cubic feet per day
UASB upflow anaerobic sludge blanket WPCF Water Pollution Control Facility
10 INTRODUCTION
11 BACKGROUND
The US Environmental Protection Agencyrsquos Office of Research and Development operates the Environmental Technology Verification (ETV) program to facilitate the deployment of innovative technologies through performance verification and information dissemination The goal of ETV is to further environmental protection by accelerating the acceptance and use of improved and innovative environmental technologies Congress funds ETV in response to the belief that there are many viable environmental technologies that are not being used for the lack of credible third-party performance data With performance data developed under this program technology buyers financiers and permitters in the United States and abroad will be better equipped to make informed decisions regarding environmental technology purchase and use
The Greenhouse Gas Technology Center (GHG Center) is one of six verification organizations operating under the ETV program The GHG Center is managed by EPArsquos partner verification organization Southern Research Institute (Southern) which conducts verification testing of promising greenhouse gas mitigation and monitoring technologies The GHG Centerrsquos verification process consists of developing verification protocols conducting field tests collecting and interpreting field and other data obtaining independent peer-reviewed input and reporting findings Performance evaluations are conducted according to externally reviewed verification Test and Quality Assurance Plans (TQAP) and established protocols for quality assurance
The GHG Center is guided by volunteer groups of stakeholders These stakeholders guide the GHG Center in selecting technologies that are most appropriate for testing help to disseminate results and review test plans and technology verification reports A technology area of interest to some GHG Center stakeholders is reliable renewable energy sources The generation of heat and power at industrial petrochemical agricultural and waste-handling facilities with renewable energy sources such as anaerobic digester gas (biogas) or landfill gas is a particular interest These gases when released to the atmosphere contribute millions of tons of methane emissions annually in the US Cost-effective technologies are available that can curb these emissions by processing the gases to remove harmful constituents recovering the methane and using it as an energy source Removal of the harmful components of biogases (primarily hydrogen sulfide and other sulfurous compounds) while minimizing the creation of secondary waste streams and effluents is essential to development of these renewable energy sources
NATCO Group Inc (NATCO) located in Houston Texas requested that the GHG Center perform an independent performance verification of the Paques THIOPAQ technology ndash a gas purification system This technology developed in The Netherlands by Paques BioSystems is designed to safely and efficiently remove hydrogen sulfide (H2S) from biogas and other sour gases while minimizing the generation of harmful emissions or effluents The process is suitable to applications where the processed biogas can be utilized as fuel The system also allows the production of elemental sulfur for subsequent sale or use A variation of this technology is the Shell-Paques system which operates on the same principles as THIOPAQ but includes system components that can process low- medium- and highshypressure natural gas as well as acid gas and Claus tail gas The Shell-Paques version is of particular interest to the natural gas petrochemical and refining industries The two versions of the technology are similar in principle and operation but this verification applies only to the Paques THIOPAQ version A
1-2
THIOPAQ system installed and operating at a midwestern water pollution control facility (WPCF) was selected for this verification
Field tests were performed on the Paques THIOPAQ system to independently verify the performance of this technology The verification included evaluations of both environmental and operational performance of the system Details of the verification test design measurement test procedures and Quality AssuranceQuality Control (QAQC) procedures can be found in the Test and Quality Assurance Plan (TQAP) titled Test and Quality Assurance Plan ndash Paques THIOPAQ and Shell-Paques Gas Purification Technology [1] The TQAP describes the rationale for the experimental design the testing and instrument calibration procedures planned for use and specific QAQC goals and procedures The TQAP was reviewed and revised based on comments received from industry experts and the EPA Quality Assurance Team The TQAP meets the requirements of the GHG Centers Quality Management Plan (QMP) and satisfies the ETV QMP requirements
The remainder of Section 10 describes the THIOPAQ system technology and test facility and outlines the performance verification procedures that were followed Section 20 presents test results and Section 30 assesses the quality of the data obtained Section 40 submitted by NATCO presents additional information regarding the THIOPAQ system Information provided in Section 40 has not been independently verified by the GHG Center
12 PAQUES THIOPAQ TECHNOLOGY DESCRIPTION
Renewable biogas produced from the management of municipal and farm waste is a potentially viable energy source Operational performance data is needed to verify the ability of technologies to remove contaminants in biologically generated gas streams Biogas can be made more usable and environmentally benign if contaminants (primarily H2S) are removed prior to their use as an energy source Conventional H2S removal technologies such as caustic scrubbers are available but these systems may be costly to operate and produce hazardous effluents Redox processes are also available but these require use of chelating agents and generate potentially hazardous effluents
121 THIOPAQ Process
THIOPAQ is a biotechnological process for removing H2S from gaseous streams by absorption into a mild alkaline solution followed by the oxidation of the absorbed sulfide to elemental sulfur by naturally occurring microorganisms THIOPAQ is licensed by Paques for biogas applications The Shell- Paques version of the technology is used for refinery gas and other high pressure applications
The Paques desulfurization technology is a caustic scrubber-based system designed to maintain a high level of H2S removal while addressing several shortcomings of conventional technologies According to NATCO this technology is designed to (1) reduce hazardous effluents from the scrubber by aerobically digesting the waste into a more benign sulfurous product and (2) regenerate and recycle sodium hydroxide (NaOH) needed in the scrubber The THIOPAQ system is specifically designed for lowshypressure biogas streams NATCO states that H2S to sulfur conversion efficiency is expected to be between 95 to 99 percent
The THIOPAQ process begins with the input of biogas or sour gas into an absorber unit (or scrubber) at ambient pressure Scrubber design is site-specific in regards to vessel size construction specifications and gas and solution flow capacities System pH ranges from 82 to 9 The counter-current scrubber design washes the sour gas (or biogas) in a packed bed or packed beds containing 2-inch Pall rings A total draw-off tray combined with a liquid redistribution tray in-between the packed beds ensures proper
1-3
Scrubber
AerobicBioreactor
pH 82 9P 1 bar
SettlingTank
Vacuum FilterVacuum Filter
liquid redistribution Treated gas (sweet gas) exits the scrubber top enters a knockout drum and is routed to the sales gas stream
The liquid stream is then sent to the bioreactor (ambient pressure) A blower supplies air to a distribution header in the bottom section of the reactor enhancing mixing Some of the oxygen is consumed in reactions with sulfide to produce sulfur by the actions of the Thiobacillus bacteria The bacteria are maintained using a continuous feed of proprietary nutrients supplied by Paques These nutrients are pumped into the bioreactor with a small metering pump
Regenerated solvent from the bioreactor is pumped back to the scrubber for reuse A portion of the solvent from the bioreactor is also pumped to a settling tank where solids are separated from the solution and collected gravimetrically NATCO estimates a potential elemental sulfur purity of 95 percent in the sludge cake from the vacuum filter press The solution is then recycled back to the bioreactor for reuse A general process flow diagram of the THIOPAQ process is shown in Figure 1-1
ProcessedProcessedGas Out Air VentGas Out Air Vent
Figure 1-1 Simplified THIOPAQ System Schematic
122 Process Chemistry
The reactions that drive these processes occur primarily in the scrubber and the bioreactor The first main reaction in the scrubber (at feed gas pressure) is H2S absorption The H2S is absorbed by the dilute caustic scrubber solution (NaOH) in the scrubber according to the following chemical reaction
H2S + NaOH rarr NaHS + H2O (a)
Reaction (a) shows that solution alkalinity is consumed during this process The solution leaving the scrubber (NaHS + H2O) is directed to the bioreactor
NaOH
Effluent Bleed Water and
sodium salts
Sulfur Product
Sour Gas In
Circulation Pump
Air Nutrients
= ndash =
Recycled Caustic
NaOH
Effluent BleedWater and
sodium salts
Sulfur Product
SourGas In
Scrubber
CirculationPump
Air
Aerobic Bioreactor
Nutrients
pH = 82 ndash 9 P = 1 bar
Settling Tank
Vacuum Filter
Recycled Caustic
1-4
Hydroxide ions are also consumed in the scrubber during a CO2 absorption step
CO2 + OHndash rarr HCO3ndash (b)
and a carbonate formation step
ndash HCO3 + OHndash rarr CO32ndash + H2O (c)
Note According to NATCO the actual amount of CO2 removed from the sour gas generally is small The carbonate bicarbonate buffer moderates the solution pH to the appropriate range providing hydroxide ions for H2S removal and allowing for the selective removal of H2S and the slip of CO2
The liquid stream loses the OHndash ion in the scrubber and gains the OHndash ion back in the bioreactor The bioreactor operates near atmospheric pressure and is aerated (constant mix) with a controlled inflow of ambient air The bacteria react with the spent scrubber solution and convert the dissolved sulfide to solid elemental sulfur as follows
NaHS + 12O2 rarr So + NaOH (d)
This step relies on the biological oxidation of the dissolved sulfide into elemental sulfur using aerobic bacteria (Thiobacillus) A small portion of the dissolved sulfide (less than 5 percent) is completely oxidized to sulfate as follows
2NaHS +4O2 rarr 2NaHSO4 harr Na2SO4 + H2SO4 (e)
Solution alkalinity is partially regenerated in the bioreactor via the reactions in equation (d) Caustic solution regeneration eliminates the need for a large supply of NaOH to maintain pH above 82 Solution regeneration is not 100 percent as shown in equation (e) so additional make-up NaOH is required A controlled amount of 50-percent NaOH is added to the system continuously using a small metering pump An automated level sensor detects when bioreactor solution level is high and a controlled amount of system effluent is bled to the wastewater treatment plant influent stream restoring proper solution level This bleed stream also prevents the accumulation of sulfate ions Air leaving the bioreactor is vented to atmosphere
According to NATCO the sulfur produced has a hydrophilic nature which significantly reduces the chance of equipment fouling or blocking This characteristic also makes the product suitable for agricultural use as fertilizer Alternatively the sulfur can be melted to yield a high-purity product which meets international Claus sulfur specifications
123 Host Facility Description and THIOPAQ Integration
The WPCF that hosted the THIOPAQ verification is a 40-million gallon per day (MGD) wastewater treatment facility specifically designed to process industrial wastewater streams from numerous local industries including grain and food processing plants and a paper mill Approximately three MGD of flow coming from the paper mill is characterized as low-flow high biological oxygen demand-type waste The facility uses three Biothane upflow anaerobic sludge blankets (UASBs) to pre-treat this wastewater stream The system was designed to handle an average of 818 and a maximum 1184 cubic feet per minute (cfm) and was built in anticipation of future plant expansion Currently the three UASBs generate around 300 to 600 cfm of biogas [or around 432 to 864 thousand cubic feet per day (103cfd)]
1-5
AerobicBioreactor
Scrubber
Biogas composition can vary but is generally 60 percent CH4 38 percent CO2 and 1 to 15 percent H2S The gas generated in each UASB is collected combined compressed and used to fuel a sludge incinerator within the plant The sludge incinerator will consume all of the biogas generated on-site under normal plant operations The biogas is flared during rare occurrences when the incinerator is not operating or is being fueled with natural gas
The facility installed a THIOPAQ system in 2001 to efficiently scrub H2S from the biogas prior to its use as fuel or incineration in the flares (Figure 1-2)
Aerobic Bioreactor
Scrubber
Figure 1-2 THIOPAQ System Tested
The THIOPAQ system tested here has a biogas treatment capacity of 1000 cubic feet per minute is largely automated and PLC-controlled and includes numerous monitoring devices to record the system parameters shown in Figure 1-1 Table 1-1 summarizes some of the monitoring instrumentation used at the plant
The system at this facility decants a liquid effluent batch only about once per week Solids are removed by a vacuum filter press (made by Straight-Line Filter Press) approximately once every three weeks The facility has not yet found a buyer or user of the solid waste containing sulfur so the solids are collected in a large bin and disposed of in a landfill The bioreactor vent is a two-foot diameter rain-capped vent emitting directly to atmosphere
1-6
Table 1-1 Host Site THIOPAQ Monitoring Instrumentation
Parameter Typical Range Instrumentation Location Biogas flow (generation) rate
100 - 200 acfm per each UASB
Fluid Components International Model ST98 thermal mass flow meters (three total)
One on the outlet of each UASB
Scrubber solution flow rate
800 to 1000 gpm Promag 5053W electromagnetic flow monitor
Scrubber pump discharge
NaOH consumption rate
Approximately 1500 lbday
Milltronics level sensor NaOH holding tank
13 PERFORMANCE VERIFICATION OVERVIEW
Field tests were performed on a Paques THIOPAQ system to independently verify the performance of this technology Field testing by the GHG Center was conducted over a three-day period at the facility A one-month period of process monitoring data including biogas flow rate NaOH consumption bioreactor tank level and air flow rates into the bioreactor was provided by the facility These data allowed the GHG Center to evaluate these system operations over a longer term The verification included evaluation of both environmental and operational performance of the system
Environmental Performance bull Air Emissions bull Liquid Effluent
Operational Performance bull H2S Removal Efficiency bull Gas Composition and Quality bull NaOH Consumption bull Sulfur Purity
Sections 131 and 132 briefly describe the sampling and analytical procedures Detailed descriptions of the sample collection handling custody and analytical procedures that were followed during this verification can be found in the TQAP Several modifications to the sampling and analytical procedures specified in the TQAP were implemented during field testing These changes in test procedures are discussed in Section 133
131 Environmental Performance Parameters
Air Emissions The bioreactor vent continuously releases vent gases to the atmosphere The GHG Center conducted measurements on this vent to independently verify concentrations H2S and other sulfur compounds if any that are liberated from the vent GHG Center personnel collected three vent air samples in Tedlar bags on each of three consecutive days for analysis Collected samples were express shipped to Air Toxics Ltd in Folsom California for next day analysis Concentrations of H2S and other sulfur compounds were quantified following ASTM Method D5504 [2] and reported in units of parts per billion by volume (ppbv) Vent gas flow rates were not independently verified (see Section 133) However the plant continuously monitors the amount of air injected into the bioreactor These data were
1-7
provided to the GHG Center for use here as a surrogate for the vent air release rate since the maximum vent volumetric flow rate should be equivalent to or less than the volumetric air input
Liquid Effluent The THIOPAQ system includes only one liquid effluent point ndash the effluent bleed stream used to regulate solution conductivity The THIOPAQ system reduces the volume of hazardous liquid effluent associated with conventional wet scrubbers but small amounts of effluent must be bled from the system intermittently to maintain proper system pH and conductivity This effluent consisting mainly of water and small amounts of sulfate and sulfides is directed back to the wastewater treatment facility Under normal plant operations it is only necessary to remove liquid effluent from the system every week or so Rather than attempt to capture these events and measure the volume of effluent removed the facility provided tank level data for a one-month period These data allowed the GHG Center to calculate the amount of liquid removed from the system and then determine an average weekly effluent rate
A total of seven liquid effluent samples were collected during the verification period and analyzed for total sulfates (EPA Method 3000) total sulfides (EPA Method 3761) and total suspended solids (EPA Method 1602) by CT Laboratories of Baraboo Wisconsin
132 Operational Performance Parameters
H2S Removal Efficiency The Center conducted three tests per day to determine the systems H2S removal efficiency This was done in conjunction with the environmental testing outlined above Timeshyintegrated biogas samples were collected in Tedlar bags simultaneously at the inlet and outlet of the scrubber during each test Collected samples were express-shipped to Empact Analytical in Brighton Colorado for determination of H2S and 17 other sulfur-based compounds by ASTM Method 5504 Results of each species in each sample were standardized and reported in units of parts per million by volume (ppmv) Removal efficiency was calculated based on the measured inlet and outlet concentrations and the biogas throughput values provided by facility instrumentation
Gas Composition and Quality Gas processing by the THIOPAQ system is not expected to significantly impact gas composition or quality other than removal of H2S The center examined gas quality before and after treatment in the THIOPAQ to verify that gas quality was not significantly affected by treatment The same sets of integrated biogas samples used to determine H2S removal were analyzed by Empact to determine gas composition according to ASTM Method D1945 [3] and lower heating value using ASTM D3588 [4] Results of the analysis were examined to determine if the composition and lower heating value (LHV) of the gas are significantly changed by THIOPAQ processing
NaOH Consumption Rate The THIOPAQ system reduces NaOH consumption through NaOH regeneration in the bioreactor The host facility uses a metering pump to add NaOH to the process and a NaOH tank level sensor to continuously monitor consumption The center evaluated the NaOH tank level data for a one-month period to report the NaOH consumption rate at this facility
Sulfur Production and Purity The sulfur containing solids cake generated by the THIOPAQ system represents a potentially salable product The center collected a total of five solids cake samples from the vacuum press for determination of moisture content and to estimate elemental sulfur content Samples were submitted to Core Laboratories of Houston Texas for analysis
Process Operations Several key operational parameters that are logged by the facility were provided to the GHG Center to aid in post-testing data analysis These included biogas flow rate through the system scrubber water flow rate bioreactor level NaOH tank level and air flow rate to the bioreactor These
1-8
data all collected by site metering equipment (Table 1-1) are not used as primary verification parameters but are included in this report to document system operations during testing They also allowed the center to evaluate operational stability or variation during the verification test periods
133 Modifications to TQAP
The procedures and protocols described in the TQAP were selected prior to visiting the WPCF When the testing began at the site several changes were necessary for successful implementation These changes were needed to adapt the procedures to site-specific operating practices and the characteristics of the process streams that were measured The changes to the verification protocol are described in Corrective Action Reports that were submitted to the GHG Center QA Manager and filed at the GHG Center A summary of the changes that were adopted is presented here
Upon arrival at the test site it was noted that the settling tank described in the system design documentation was no longer an active component of the process Consequently suspended solids in the bioreactor were higher than anticipated in the test plan It was also noted that solids removal did not occur daily but rather every three weeks or so after manual measurements of suspended solids passed a threshold value These operations were highly operator dependant and were not conducted on a regular basis Some operators would instead route the solids slurry back to the plant and not to the filter press for recovery Therefore regular meaningful measurements of solids recovery were not possible Liquid bleed for pH and conductivity control was still triggered by the bioreactor tank level and was roughly a fixed volume (approximately 6 inches in tank level or 1590 gallons per event) This revision of the discharge schedule prevented the planned measurement of smaller flows as presented in the TQAP These process modifications and other corrections of the initial information from the plant required changes in verification parameters and test methods In each case the proposed changes were reviewed by the project QA Manager and approved upon his recommendation by GHG Center management
These configuration and operational changes in the THIOPAQ process were addressed by the following changes in experimental design and methods
bull Elimination of direct measurement of solids production rate as non-meaningful
bull Use of plant measurements for bioreactor vent flow rate with spot verification using vane anemometer
bull Change in procedure for effluent disposal rate using non-verified plant data The planned gravimetric measurement was deleted as unworkable and replaced with data from the plant process instruments to detect bleed event record the level change and to quantify the resulting volume that was removed from the reactor (a 6-inch drop equals 1590 gallons)
bull Addition of total suspended solids measurement to liquid sample analysis and change of sample schedule
bull Addition of extended data period (one month of hourly averages) for plant process measurements
Other changes in the sampling and measurements approach were implemented in the field and are described below Documentation and QC checks were followed as outlined in the TQAP for setup and measurement procedures for sample acquisition and sample handling
Vent Flow Measurement The field team leader attempted measurements and found that a standard pitot traverse was impractical due to cyclonic flow duct configuration wind and low flow rate The
1-9
measurement plan was changed to use plant process data with confirmatory check runs using vane anemometer
Collection of Vent Gas Integrated 1-liter bag samples were collected over a 3- to 4- minute period rather than the one-hour sample specified in the TQAP
Collection of sour and processed biogas samples In consultation with the analytical laboratory cylinder samples for gas quality were eliminated and the analyses were performed on bag samples used for sulfur species (ASTM 5504) analysis Use of Tedlar bags minimizes H2S sample deterioration In addition the 24-30 hour hold time limit was exceeded Due to logistical issues such as sample packaging and shipping samples were held for up to 48 hours before analysis This extended holding time may have caused sample degradation or losses of H2S in the bags Although the extent of the degradation if any cannot be quantified it is expected to be minimal This is because results reported here are consistent with sour and processed biogas H2S concentrations measured at the facility which are analyzed within an hour of collection
Liquid NaOH Solution Flow Measurement The QC check was changed to use an onsite volume check device(graduated sight glass)
1-10
20 VERIFICATION RESULTS
The verification period was June 1 through July 1 2004 Field testing was conducted by GHG Center personnel over a 3-day test period from June 29 through July 1 2004 Bioreactor vent gas sour biogas processed biogas liquid effluent and solids samples collected during this 3-day test period are summarized in Table 2-1 Follow-up effluent and solids samples were collected by facility personnel on July 14 Key THIOPAQ operational data including biogas throughput reactor air flow reactor level and NaOH tank level were logged by the facility over the entire one-month verification period and provided to the GHG Center Results of the verification of THIOPAQ environmental and operational performance are presented in Sections 21 and 22 The laboratory reports detailing sample analyses are on file at the GHG Center and available on request but too voluminous for inclusion here A sulfur mass balance for the technology could not be calculated because operational procedures at the facility were not appropriate for measuring the sulfur solids production rate
Table 2-1 Sampling Matrix
Date
Sample Type (Sample ID and time collected) Bioreactor Vent Gas Sour Biogas
Processed Biogas Liquid Effluent Solids Cake
62904 Vent 1 (0920) Sour gas 1 (0945) P gas 1 (0945) Effluent 1 (1000) Vent 2 (1115) Sour gas 2 (1125) P gas 2 (1120) Vent 3 (1315) Sour gas 3 (1325) P gas 3 (1320)
63004 Vent 4 (1030) Sour gas 4 (1055) P gas 4 (1050) Effluent 2 (1030) Vent 5 (1130) Sour gas 5 (1200) P gas 5 (1155) Vent 6 (1320) Sour gas 6 (1330) P gas 6 (1325) Effluent 3 (1315)
7104 Vent 7 (0840) Sour gas 7 (0850) P gas 7 (0845) Solids 1 (0900) Vent 8 (0950) Sour gas 8 (1000) P gas 8 (0955) Effluent 4 (1100) Solids 2 (1000) Vent 9 (1120) Sour gas 9 (1135) P gas 9 (1130) Effluent 5 (1130) Solids 3 (1100)
71404a Effluent 6 Solids 4 Effluent 7 Solids 5
a Samples were collected by facility personnel on 71404 Collection times were not recorded
21 ENVIRONMENTAL PERFORMANCE
211 Air Emissions
Three vent gas samples were collected from the bioreactor on each of the three test days of the technology verification The schedule of vent gas sampling is included in Table 2-1 The results of the analyses of these samples are summarized in Table 2-2 Full documentation of the laboratory analyses are maintained in the GHG Center files As shown in Table 2-2 concentrations of H2S and total sulfur compounds were very low averaging 929 and 1961 ppbv respectively H2S typically comprised about half of the total sulfur compound concentrations Methyl mercaptan dimethyl sulfide and dimethyl disulfide were the other prominent sulfur compounds
2-1
Table 2-2 Summary of Sulfur Compounds in Vent Gas Samples
Date Time H2S ppbv
Total S Compounds ppbv
62904 0920 990 2154 1115 95 1235 1315 72 903
63004 1030 240 1105 1130 200 738 1320 1300 2523
7104 0840 3900 5120 0950 430 1494 1120 1200 2381
Average 929 1961
Difficulties with direct vent gas flow rate measurement forced the Center to use plant process data for the air blower flow rates as a surrogate for the vent gas flow After analyzing these data it is apparent that the air flow through the reactor is highly variable The flow rates logged during the 3-day sampling period are plotted as Figure 2-1 and summarized as follows
Bioreactor Vent Gas Flow Rate Statistics
StatisticAverage
MaximumMinimum
Standard Deviation
Value (scfm) 2463
4320 910 565
This level of variability was evident over the entire 1-month verification period and is reported by the facility to be typical for this gas stream The variable speed air blower is regulated by the THIOPAQ control system to respond to changes in biogas throughput Biogas flow rates through the system also plotted in Figure 2-1 are also highly variable These variabilities complicated evaluation of vent gas flow rates GHG Center personnel also obtained vane anemometer readings in the vent as an independent check on the air blower process data The agreement between the two data sets is poor further complicating this measurement Since the flow rate data is poor only the concentrations of sulfur compounds in the vent gas are summarized in Table 2-2
To provide potential THIOPAQ system users with an estimate of potential bioreactor emissions the average concentrations shown in table 2-2 and the average vent gas flow rate for the 3-day test period were used to calculate estimated average emission rates in units of pounds per hour (lbhr) The average estimated H2S and total sulfur (quantified as H2S) emission rates for the bioreactor vent were 00012 and 00026 lbhr respectively
2-2
THIO
PAQ
Flo
w R
ates
(scf
m)
600
500
400
300
200
100
-
Biogas Air
62904 000 62904 1200 63004 000 63004 1200 7104 000 7104 1200 7204 000
Figure 2-1 Biogas and Reactor Air Flow Rates During Testing
212 Liquid Effluent
A total of seven samples of THIOPAQ effluent (reactor slurry) were collected during the verification for determination of total sulfides total sulfates and total suspended solids Results are summarized in Table 2-3
Results of the sulfide analyses were much higher than expected and after investigation of ion chromatographs run by the laboratory it is evident that thiosulfate was present in the samples Thiosulfate is a potential interference for the analytical method used here so results presented here are possibly biased high by the presence of thiosulfate
One hour average tank levels were provided by the facility over the entire 1-month verification period A total of 81600 gallons of effluent were released during the verification period Based on these data the average effluent rate was approximately 110 gallons per hour (galhr) or about 2600 gallons per day (galday) These values were not independently verified by the GHG Center but are used to estimate mass emissions of sulfate sulfide and solids during the period
2-3
The average sulfate sulfide and TSS concentrations shown in Table 2-3 and the average effluent rate of 2600 galday during the period were then used to estimate discharge rates The estimated liquid disposal rates for sulfate sulfide and solids during the verification period are 77 45 and 444 lbday respectively
Table 2-3 Total Sulfate Total Suspended Solids and Total Sulfide in Reactor Slurry
Date Sample Total Sulfate
mgl
Total Suspended Solids mgl
Total Sulfidea
mgl 62904 Effluent 1 3740 22150 1680 63004 Effluent 2 3710 20940 1770
Effluent 3 3730 21180 2000 7104 Effluent 4 4020 21560 1820
Effluent 5 3610 20730 1880 71404 Effluent 6 2850 16800 2470
Effluent 7 2690 17560 2560 Average 3480 20130 2030
a Potential thiosulfate interference causing high bias in total sulfide test results
22 OPERATIONAL PERFORMANCE
221 Gas Composition Gas Quality and H2S Removal Efficiency
The primary purpose of the THIOPAQ technology is to safely and efficiently remove H2S from sour gas A total of nine sour and processed biogas samples were collected by GHG Center personnel during the 3shyday verification period and analyzed for H2S content Biogas flow rate through the system during the test period ranged from 119 to 504 scfm and averaged 322 scfm (or 464 x 103cfd) The average throughput was approximately 39 percent of design average capacity
Average H2S removal efficiency (mass ) is calculated based on the average measured concentrations of H2S in the sour biogas and the treated biogas as well as the average measured flow rate of biogas into the scrubber and an estimated flow rate out of the scrubber Changes in gas flow rate into and out of the scrubber were expected to be negligible Therefore an equivalent biogas input and output flow rate was assumed in the TQAP for determining the mass flows of H2S in and out of the scrubber and the resulting mass removal efficiency for the system However the biogas flow rate out of the scrubber is slightly less than the input flow rate due to the removal of H2S and a portion of the CO2 in the scrubber The biogas flow rate out of the scrubber was estimated based on a material balance for the components of the biogas (N2 and CH4) that were not impacted by the scrubber Material balance calculations yield a maximum change in biogas flow rate of 97
Although significant changes were observed in biogas flow rate due to the scrubbing of the H2S and CO2 a sensitivity analysis indicates that the maximum impact of the reduced biogas flow rate on the H2S removal efficiency calculation is 001 because of the large change in H2S concentration Therefore the assumption of equivalent flow rates in calculation of the H2S removal efficiency does not significantly
2-4
impact the data quality and is used in this report H2S removal efficiency is then calculated as the change in concentration of H2S across the scrubber
The same samples were analyzed for basic gas composition and heating value to evaluate if gas treatment by THIOPAQ impacted the quality of the gas Results are summarized in Table 2-4 Figure 2-2 illustrates the gas composition before and after the treatment
Table 2-4 Composition and Properties of Sour and Processed Biogas - Dry Basis
Sample ID
Gas Composition Heat Content (Btuscf)
Relative Density
Compres-sibility CH4 () CO2 () N2 () H2S (ppm)
Total S (ppm) HHV LHV
Sour Gas 1 6184 3528 162 12603 12619 6208 5588 09088 09970
Processed Gas 1 6751 3071 142 376 538 6719 6048 08604 09971
Sour Gas 2 6223 346 180 13869 13885 6250 5626 09032 09970
Processed Gas 2 6759 3057 147 361 519 6727 6055 08592 09971
Sour Gas 3 6273 3457 106 16489 16503 6334 5701 09005 09970
Processed Gas 3 7000 2870 108 212 350 6967 6271 08385 09972
Sour Gas 4 618 3466 183 17156 17170 6251 5627 09045 09970
Processed Gas 4 6912 2883 185 260 398 6879 6192 08430 09972
Sour Gas 5 6085 3451 297 16781 16792 6147 5533 09078 09970
Processed Gas 5 6875 2802 294 164 328 6842 6159 08400 09973
Sour Gas 6 6213 3469 127 19180 19199 6292 5664 09033 09970
Processed Gas 6 6676 3171 128 317 474 6645 5981 08690 09971
Sour Gas 7 6357 3142 258 24352 24369 6647 5803 08794 09971
Processed Gas 7 6914 2818 221 282 443 6881 6193 08397 09972
Sour Gas 8 6352 3206 182 25957 25987 6469 5823 08824 09971
Processed Gas 8 7081 2639 236 315 486 7047 6343 08227 09973
Sour Gas 9 6325 3195 207 27472 27497 6450 5805 08827 09971
Processed Gas 9 7032 2527 369 191 325 6997 6298 08188 09974
Avg Sour Gas 6244 3375 189 19318 19336 6339 5686 08970 09970
Avg Processed Gas 6889 2871 203 275 429 6856 6172 08454 09972
H2S concentrations in the sour biogas averaged 193 percent Processed gas contained an average 275 ppm H2S Based on these average concentrations average H2S removal efficiency was 998 percent Analysis of the gas compositional data also indicates that the THIOPAQ system reduces the CO2 concentration of the biogas by an average 15 percent This change in gas composition creates an increase in methane concentration and heating value The average LHV of the processed biogas was approximately 86 percent higher than the sour gas
2-5
Sour Biogas Processed Biogas
338 CO2287 CO2624 CH4 689 CH4
19 N2 19 H2S19 N2 19 H2S 20 N220 N2
Sour Biogas Processed Biogas
338 CO2 624 CH4 287 CO2 689 CH4
Figure 2-2 Biogas Composition Before and After THIOPAQ
222 NaOH Consumption
A primary benefit of THIOPAQ is the potential reduction in NaOH consumption and subsequent operating costs NaOH consumption rates are site specific and will vary depending on the gas processing rate sour gas H2S concentrations and the desired removal efficiency Data presented here are representative of the conditions experienced at this facility during the verification period
Final adjustments to the NaOH feed rate were made by the facility engineer on June 16 2004 One-hour average tank level data collected from that point in time to the end of the verification period are plotted in Figure 2-3 and are used to report NaOH consumption during the verification Unless additional adjustments are made to system operations the NaOH feed rate is constant as illustrated in the figure During the 376-hour period shown a total of 947 gallons of 50-percent NaOH solution were consumed for an average consumption rate of 252 galhr (605 galday) This rate was field verified by GHG Center personnel (see Section 332) The average sour biogas feed rate during the monitoring period was 355 scfm (511 x 103cfd) or about 39 percent of design capacity The sour gas was an average 193 percent sulfur The average 50-percent NaOH consumption normalized to biogas feed rate was 012 gallons per thousand cubic feet of biogas processed or 044 lb NaOH per lb sulfur
2-6
Consumption of 50-percent NaOH solution averaged252 galhr
NaO
H T
ank
Volu
me
(gal
lons
)N
aOH
Tank
Vol
ume
(gal
lons
)24002400
22002200
20002000
18001800
16001600
14001400
12001200
1000100061404 000 61604 000 61804 000 62004 000 62204 000 62404 000 62604 000 62804 000 63004 000 7204 000 7404 00061404 000 61604 000 61804 000 62004 000 62204 000 62404 000 62604 000 62804 000 63004 000 7204 000 7404 000
Consumption of 50-percent NaOH solution averaged 252 galhr
Figure 2-3 NaOH Tank Volume During Verification Period
223 Sulfur Production and Purity
A total of five samples of THIOPAQ solids cake were collected during the verification for estimation of elemental sulfur and moisture content The remaining solids were not identified Results are plusmn 10 percent and are summarized in Table 2-5
Table 2-5 Composition of the Solids Removed From the THIOPAQ Process
Date Time Sulfur
Other Solids
Water
7104 1000 58 22 20 1030 53 19 27 1100 53 18 29
71404 1000 26 48 26 1030 28 44 27
Average 44 30 26
The average elemental sulfur content of the samples as collected was 44 percent On a dry basis elemental sulfur averaged 59 percent of the solids collected
2-7
Plans to measure the amount of solids produced by the system were abandoned during field testing The facility only removes solids every three weeks or so on an as-needed basis The frequency and amount of solids removed varies widely depending on the amount of solids removed through the liquid effluent (the amount of liquids bled and the total suspended solids content of the liquid) Removal of solids cake at this facility was so operator specific and infrequent that it was deemed too arbitrary for verification here Because of this a sulfur mass balance could not be completed for the system
Analysis of the liquid effluent composition and disposal rate indicated that the average total suspended solids disposal rate via the effluent is 444 lbday These solids are the same material that is collected on as solids cake on the vacuum press so it is estimated that 592 percent of the solids disposed of as effluent (or 263 lbs) is recoverable elemental sulfur Since the THIOPAQ system tested here is not configured to maximize solids recovery rate the GHG Center could not determine how much of that sulfur is recoverable for subsequent use
2-8
30 DATA QUALITY ASSESSMENT
31 DATA QUALITY OBJECTIVES
The GHG Center selects methodologies and instruments for all verifications to ensure that the desired level of data quality in the final results is obtained The GHG Center specifies DQOs for each verification parameter before testing starts and uses these goals as a statement of data quality Ideally quantitative DQOs are established based on the level of confidence in results needed by stakeholders or potential users of a technology In some cases such as this verification quantitative DQOs are not well defined and therefore qualitative DQOs are established
During this verification determination of each of the primary verification parameters was conducted based on published reference methods The methods used are summarized in Table 3-1
Table 3-1 Verification Reference Methods
Verification Parameter Required Measurements Applicable Reference
Methods
H2S air emissions (vent) H2S Concentrations Modified ASTM D5504
Sulfate emissions Sulfates in water EPA Method 3000 Sulfide emissions Sulfides in water EPA Methods 3761 Total suspended solids TSS in water EPA Method 1602 H2S removal efficiency Sour gas H2S content
ASTM D5504Processed gas H2S content Gas Quality Gas composition ASTM D1945
Gas heating value ASTM D3588 NaOH consumption rate NaOH consumption rate None see Section 332 Sulfur production Solids moisture content Internal laboratory
proceduresSolids sulfur content
The qualitative DQOs for this verification then are to meet all of the QAQC requirements of each method In some cases the laboratory conducting the analyses has internal QAQC checks that are performed in addition to the method requirements The analytical methods used here were introduced in Section 13 Additional details regarding these methods can be found in the TQAP A summary of the QAQC requirements and results for each method are provided in the following sections
32 ENVIRONMENTAL PERFORMANCE PARAMETERS
The primary verification parameters for environmental performance were concentrations of H2S in the vent gas and sulfate and sulfide concentrations in the effluent QAQC requirements for the methods used to verify these two parameters are discussed below
3-1
321 H2S Concentrations in Vent Gas
Vent gas sample collection date time run number and bag IDs were logged and laboratory chain of custody forms were completed and shipped with the samples Copies of the chain of custody forms and results of the analyses are stored in the GHG Center project files Collected samples were express shipped to Air Toxics Ltd on each of the three days of sampling for next day analysis A coordinated effort minimized sample holding times which ranged from 22 to 33 hours Air Toxics analyzed collected samples in accordance with a modified version of ASTM Method 5504 The QAQC procedures specified in the method were followed and are summarized in Table 3-2
Table 3-2 Summary of Vent Gas Analytical QAQC Checks
QC Check Minimum Frequency
Acceptance Criteria Results Achieved
Five point instrument calibration (ICAL)
Prior to sample analysis
Relative standard deviation lt 30 Results acceptable
Laboratory control sample (LCS)
After each ICAL 90 percent of the compounds quantified must be within 70 ndash 130 of expected values
H2S within the range of 90 to 120 of expected values
Laboratory blank After the ICAL Results lower than reporting limit All compounds below reporting limit
Duplicate analyses 10 of the samples
Relative percent difference of lt 25 for compounds detected 5 times higher than reporting limits
Relative difference lt 25 for compounds detected
As an additional QC check the GHG Center supplied one blindaudit air sample to the laboratory for analysis The audit gas was an independent Reference Standard of H2S in air manufactured by Scott Specialty Gases with a certified analytical accuracy of 25 ppm plusmn 5 percent The audit sample was collected handled and analyzed using the same procedures and equipment as the vent gas samples The laboratory result was 21 ppm or approximately plusmn 16 percent of the certified concentration This QC check served as a performance evaluation audit (PEA) for this verification and was reported to the Southern QA manager for inclusion in the audit report
322 Sulfate and Sulfide Effluent Emissions
Concentrations of sulfates and sulfides in the liquid effluent samples were determined by CT Laboratories using the methods identified in Table 3-1 The QAQC procedures specified in the methods were followed and are summarized in Table 3-3 Documentation from CT Laboratories that each of these QC checks were conducted indicates that the qualitative DQO was met
3-2
Table 3-3 Summary of Effluent Sulfate and Sulfide Analytical QAQC Checks
QC Check Minimum Frequency Acceptance Criteria Results Achieved Three-point instrument calibration
Before analyses Nonendashestablishes instrument calibration curve
Calibration conducted
Daily single-point calibration
Daily prior to sample analyses
Result within 10 of expected values
Result within 10
Duplicate analysis Two samples Not specified Repeatability within 2
Daily single-point calibration reanalysis
Daily after sample analyses
Result within 5 of initial response
Result within 5
33 OPERATIONAL PERFORMANCE PARAMETERS
The primary verification parameters for operational performance were concentrations of H2S in the sour and processed biogas the biogas compositional analyses and the NaOH consumption determination QAQC requirements for the methods used to verify these two parameters are discussed below
331 Biogas H2S Composition and Heating Value
For all biogas samples collected (Table 2-1) sample collection date time run number and canister ID were logged and laboratory chain of custody forms were completed and shipped with the samples Copies of the chain of custody forms and results of the analyses are stored in the GHG Center project files Collected samples were shipped to Empact for compositional analysis and determination of LHV per ASTM Methods D1945 and D3588 as well as H2S analyses according to Method D5504 All samples were analyzed within 48 hours of collection which exceeds the 24 hour method recommendation Empact maintains strict continuous calibration criteria on the instrumentation used for the sulfur and compositional analyses using certified reference standards Copies of these calibration data are stored in the GHG Center project files As independent calibration checks blind audits were submitted to Empact on two similar verifications within the past year to evaluate analytical accuracy on the methane analyses [5 6] These audits qualified as PEAs as required by the ETV QMP Both audits indicated analytical accuracy within 30 Since the same sampling and analytical procedures were used here by the same laboratory analyst the audit was not repeated a third time
In addition to the blind audit samples duplicate analyses were conducted on two of the sour biogas samples and two of the processed biogas samples Duplicate analysis is defined as the analysis performed by the same operating procedure and using the same instrument for a given sample volume Results of the duplicate analyses showed an average analytical repeatability of 003 percent for both methane and LHV Duplicate analyses were also conducted on the sour gas samples to demonstrate H2S repeatability Average repeatability was approximately 4 percent
332 NaOH Consumption
NaOH consumption rates were determined using data provided by the facility GHG Center personnel conducted a field check to verify the accuracy of the tank level sensor used to log NaOH consumption The NaOH tank is equipped with a graduated sight glass Two sets of manual sight glass readings were recorded along with the elapsed time of a given change in level Calculated NaOH consumption rate based on the manual readings averaged 262 galhr The average rate reported by the facility (Section 222) was 252 galhr a difference of approximately 4 percent
3-3
34 VERIFICATION AUDITS
In addition to the QAQC activities discussed here several audit activities were conducted in support of this verification Southernrsquos QA manager conducted an on-site technical systems audit (TSA) of the measurement equipment techniques and methods to ensure compliance with the requirements of the TQAP During the TSA the QA manager and GHG Center field technician noted and documented all of the changes in the TQAP procedures due to site operational differences on corrective action reports These reports are filed at the GHG Center
Southernrsquos QA manager also conducted an audit of data quality (ADQ) for this verification The ADQ is an evaluation of the measurement processing and data evaluation steps to determine if systematic errors have been introduced The QA manager randomly selected approximately 10 percent of the data and followed through the analysis processing and reporting of the data to ensure accuracy The ADQ also included review of any problems changes or corrective actions documented during the test program to verify that their impact on data quality has been assessed and documented
Finally the PEAs described in Sections 321 and 331 satisfied the PEA requirement from the GHG Centerrsquos QMP
3-4
40 TECHNICAL AND PERFORMANCE DATA SUPPLIED BY NATCO GROUP
Note This section provides an opportunity for NATCO and Paques to provide additional comments concerning the THIOPAQ System and its features not addressed elsewhere in the Report The GHG Center has not independently verified the statements made in this section
In anticipation of future plant expansion the THIOPAQ system tested here was designed for higher biogas throughputs than currently available This means that the unit is currently operating at just 30 to 50 percent of capacity (50 to 70 percent turndown) According to NATCO and Paques air blower control is less efficient at these capacities and the technology will likely operate more efficiently at throughputs closer to design capacity It is expected that performance results presented here might further improve at sulfur loads closer to design capacity System turndown can also have a negative impact on NaOH consumption rates The rate verified here (036 lb NaOH per lb sulfur) may also improve at gas throughput rates closer to design capacity
4-1
50 REFERENCES
[1] Southern Research Institute Test and Quality Assurance Plan ndash Paques THIOPAQ and Shell-Paques Gas Purification Technology SRIUSEPA-GHG-QAP-32 wwwsri-rtpcom Greenhouse Gas Technology Center Southern Research Institute Research Triangle Park NC June 2004
[2] American Society for Testing and Materials Standard Practice for Determination of Sulfur Compounds in Natural Gas by Gas Chromatography and Chemiluminescense ASTM D5504-01 West Conshohocken PA 2001
[3] American Society for Testing and Materials Standard Test Method for Analysis of Natural Gas by Gas Chromatography ASTM D1945-98 West Conshohocken PA 2001
[4] American Society for Testing and Materials Standard Practice for Calculating Heat Value Compressibility factor and Relative Density of Gaseous Fuels ASTM D3588-98 West Conshohocken PA 2001
[5] Southern Research Institute Environmental Technology Verification Report Combined Heat and Power at a Commercial Supermarket ndash Capstone 60 kW Microturbine CHP System SRIUSEPA-GHG-QAP-27 wwwsri-rtpcom Greenhouse Gas Technology Center Southern Research Institute Research Triangle Park NC September 2003
[6] Southern Research Institute Environmental Technology Verification Report Residential Electric Power Generation Using the Plug Power SU1 Fuel Cell System SRIUSEPA-GHG-QAP-25 wwwsri-rtpcom Greenhouse Gas Technology Center Southern Research Institute Research Triangle Park NC September 2003
5-1
EPA REVIEW NOTICE
This report has been peer and administratively reviewed by the US Environmental Protection Agency and approved for publication Mention of trade names or commercial products does not constitute endorsement or recommendation for use
THE ENVIRONMENTAL TECHNOLOGY VERIFICATION PROGRAM
SOUTHERN RESEARCH US Environmental Protection Agency I N S T I T U T E
ETV Joint Verification Statement TECHNOLOGY TYPE Sour Gas Processing System
APPLICATION Biogas Purification
TECHNOLOGY NAME Paques THIOPAQ
COMPANY NATCO Group Inc
ADDRESS Brookhollow Central III 2950 N Loop West Suite 100 Houston Texas 77092
WEB ADDRESS wwwnatcogroupcom
The US Environmental Protection Agency (EPA) has created the Environmental Technology Verification (ETV) program to facilitate the deployment of innovative or improved environmental technologies through performance verification and dissemination of information The goal of the ETV program is to further environmental protection by accelerating the acceptance and use of improved and cost-effective technologies ETV seeks to achieve this goal by providing high-quality peer-reviewed data on technology performance to those involved in the purchase design distribution financing permitting and use of environmental technologies
ETV works in partnership with recognized standards and testing organizations stakeholder groups that consist of buyers vendor organizations and permitters and with the full participation of individual technology developers The program evaluates the performance of technologies by developing test plans that are responsive to the needs of stakeholders conducting field or laboratory tests collecting and analyzing data and preparing peer-reviewed reports All evaluations are conducted in accordance with rigorous quality assurance protocols to ensure that data of known and adequate quality are generated and that the results are defensible
The Greenhouse Gas Technology Center (GHG Center) one of six verification organizations under the ETV program is operated by Southern Research Institute in cooperation with EPArsquos National Risk Management Research Laboratory A technology area of interest to some GHG Center stakeholders is reliable renewable energy sources The generation of heat and power at industrial petrochemical agricultural and waste-handling facilities with renewable energy sources such as anaerobic digester gas (biogas) or landfill gas is a particular interest Removal of the harmful components of biogases (primarily
S-1
hydrogen sulfide and other sulfurous compounds) while minimizing the creation of secondary waste streams and effluents is essential to development of these renewable energy sources NATCO Group Inc (NATCO) located in Houston Texas has requested that the GHG Center perform an independent performance verification of the Paques THIOPAQ technology ndash a gas purification system
TECHNOLOGY DESCRIPTION
The following technology description is based on information provided by NATCO and Paques and does not represent verified information This technology developed in The Netherlands by Paques BioSystems is designed to safely and efficiently remove hydrogen sulfide (H2S) from biogas and other sour gases while minimizing the generation of harmful emissions or effluents The process is suitable to applications where the processed biogas can be utilized as fuel The system also allows the production of elemental sulfur for subsequent sale or use A variation of this technology is the Shell-Paques system which operates on the same principles as THIOPAQ but includes system components that can process low- medium- and high-pressure natural gas as well as acid gas and Claus tail gas
The Paques desulfurization technology is a caustic scrubber-based system designed to maintain a high level of H2S removal while addressing several shortcomings of conventional technologies This technology is designed by Paques Biosystems to (1) reduce hazardous effluents from the scrubber by aerobically digesting the waste into a more benign sulfurous product and (2) regenerate and recycle sodium hydroxide (NaOH) needed in the scrubber The THIOPAQ system is specifically designed for low-pressure biogas streams
The THIOPAQ process begins with the input of biogas or sour gas into an absorber unit (or scrubber) at ambient pressure Scrubber design is site-specific in regards to vessel size construction specifications and gas and solution flow capacities System pH ranges from 82 to 9 The counter-current scrubber design washes the sour gas or biogas with caustic solution in a packed bed or packed beds containing 2shyinch Pall rings Treated gas (sweet gas) exits the scrubber top enters a knockout drum and is routed for on-site use or to a sales gas stream
The liquid stream is then sent to the bioreactor (ambient pressure) where caustic solution is regenerated through a series of chemical reactions and biological oxidation of dissolved sulfide A blower supplies air to a distribution header in the bottom section of the reactor to enhance mixing Some of the oxygen is consumed in reactions with sulfide to produce sulfur by the actions of the Thiobacillus bacteria The bacteria are maintained using a continuous feed of proprietary nutrients supplied by Paques These nutrients are pumped into the bioreactor with a small metering pump Regenerated solvent from the bioreactor is pumped back to the scrubber for reuse
VERIFICATION DESCRIPTION
The GHG Center tested a THIOPAQ system installed and operating at a 40 million gallons per day (MGD) water pollution control facility (WPCF) designed to process industrial wastewater streams from numerous local companies including grain and food processing plants and a paper mill Approximately three MGD of flow coming from the paper mill is pretreated in three upflow anaerobic sludge blankets (UASBs) Each UASB generates around 100 to 200 cubic feet per minute (cfm) of biogas (generally 60 percent CH4 38 percent CO2 and 1 to 2 percent H2S) The gas generated in each UASB is collected and used to fuel a sludge incinerator within the plant that is capable of consuming all of the biogas generated on-site under normal plant operations The biogas is flared during rare occurrences when the incinerator is not operating or is being fueled with natural gas
S-2
Field tests were performed on June 29 through July 1 2004 on the THIOPAQ system to independently verify the performance of this technology One-month (June 1 through July 1 2004) of process monitoring data was provided by the facility to allow the GHG Center to evaluate system operations over a longer term The verification included evaluation of both environmental and operational performance of the system
Environmental Performance bull Air Emissions bull Liquid Effluent
Operational Performance bull H2S Removal Efficiency bull Gas Composition and Quality bull NaOH Consumption bull Sulfur Product Purity
Nine grab samples were collected during the verification period to directly measure the concentrations of H2S and other sulfur compounds emitted to the atmosphere from the bioreactor vent Vent gas flow rates were not determined due to difficulties with cyclonic and highly variable flow Therefore vent gas emissions are reported as estimates only Seven bioreactor slurry samples were collected to determine the sulfates sulfides and total suspended solids (TSS) content of liquids disposed from the system as wastewater
For verification of operational performance nine corresponding biogas grab samples were collected on both the upstream and downstream sides of the THIOPAQ system and submitted for analysis Results of the analyses were used with biogas flow rates through the system to evaluate system removal efficiency for H2S and other sulfur compounds The results also allowed the center to evaluate the effects of the system on biogas composition and heating value NaOH consumption rates were monitored and reported and composite solid waste samples from the system were collected for determination of elemental sulfur content Plans to measure the amount of solids produced by the system were abandoned during field testing The facility only wastes solids every three weeks or so on an as-needed basis The frequency and amount of solids removed varies widely depending on the amount of solids removed through the liquid effluent Removal of solids cake at this facility was operator specific and infrequent therefore it was deemed too arbitrary for verification here Because of this a sulfur mass balance could not be completed for the system
Quality assurance (QA) oversight of the verification testing was provided following specifications in the ETV Quality Management Plan (QMP) The GHG Centerrsquos quality manager conducted a technical systems audit (TSA) and an audit of data quality (ADQ) on at least 10 percent of the data generated during this verification Two performance evaluation audits (PEAs) were also conducted The GHG Center field team leader and project manager have reviewed the data from the verification testing and have concluded that the data quality objectives specified in the Test and Quality Assurance Plan were attained for the verification parameters that were evaluated (excluding vent gas emission rates and solids production rates)
S-3
VERIFICATION OF PERFORMANCE
Environmental Performance
bull Concentrations of H2S and total sulfur compounds in the air vented from the bioreactor were very low averaging 929 and 1961 ppbv respectively H2S typically comprised about half of the total sulfur compound concentrations and methyl mercaptan dimethyl sulfide and dimethyl disulfide were the other prominent compounds
bull Vent gas flow rates were not determined due to difficulties with cyclonic and highly variable flow Using air flow rates into the reactor logged by the facility the estimated average reactor vent emission rates for H2S and total sulfur compounds were 00012 and 00026 pounds per hour respectively
bull The average sulfate sulfide and TSS concentrations in the bioreactor effluent were 3480 2030 and 20130 milligrams per liter respectively
bull The average bioreactor effluent disposal rate during the 1-month monitoring period was 110 gallons per hour or about 2600 gallons per day Resulting sulfate sulfide and TSS effluent disposal rates are 77 45 and 444 pounds per day respectively
Operational Performance
bull Biogas flow rates through the system during the three-day sampling period ranged from 119 to 504 standard cubic feet per minute (scfm) and averaged 322 scfm [or approximately 464 thousand cubic feet per day (103cfd)]
bull Table S-1 summarizes the sour and processed gas average composition H2S content and heat content for nine samples collected before and after the THIOPAQ system The average H2S removal efficiency on a mass basis was 998 percent Biogas lower heating value (LHV) increased by approximately 86 percent due to changes in gas composition specifically removal of some of the CO2 from the sour biogas
Table S-1 Composition and Properties of Sour and Processed Biogas - Dry Basis
Gas Composition Higher and lower heating values (Btuscf)
Relative Density
Compres-sibility CH4 () CO2 () N2 () H2S (ppm)
Total S (ppm) HHV LHV
Avg Sour Gas 6244 3375 189 19318 19336 6339 5686 08970 09970
Avg Processed Gas 6889 2871 203 275 429 6856 6172 08454 09972
bull During a continuous NaOH tank level monitoring period of 376 hours a total of 947 gallons of 50shypercent NaOH solution was consumed for an average consumption rate of 252 galhr (605 galday) The average sour biogas feed rate during that monitoring period was 355 scfm (or 511 x 103cfd) with an average 193 percent sulfur content The average 50-percent NaOH consumption normalized to biogas feed rate was 012 gallons per thousand cubic foot of biogas processed or 044 lb NaOH per lb sulfur
bull The average elemental sulfur content of the solids cake samples was 436 percent (wet basis) On a dry basis elemental sulfur averaged 592 percent
S-4
Details on the verification test design measurement test procedures and Quality AssuranceQuality Control (QAQC) procedures can be found in the Test Plan titled Test and Quality Assurance Plan ndash Paques THIOPAQ and Shell-Paques Gas Purification Technology (SRI 2004) Detailed results of the verification are presented in the Final Report titled Environmental Technology Verification Report for The Paques THIOPAQ Gas Purification Technology (SRI 2004) Both can be downloaded from the GHG Centerrsquos web-site (wwwsri-rtpcom) or the ETV Program web-site (wwwepagovetv)
Signed by Lawrence W Reiter PhD 92904 Signed by Stephen D Piccot 92004
Lawrence W Reiter PhD Acting Director National Risk Management Research Laboratory Office of Research and Development
Stephen D Piccot Director Greenhouse Gas Technology Center
Southern Research Institute
Notice GHG Center verifications are based on an evaluation of technology performance under specific predetermined criteria and the appropriate quality assurance procedures The EPA and Southern Research Institute make no expressed or implied warranties as to the performance of the technology and do not certify that a technology will always operate at the levels verified The end user is solely responsible for complying with any and all applicable Federal State and Local requirements Mention of commercial product names does not imply endorsement or recommendation
EPA REVIEW NOTICE
This report has been peer and administratively reviewed by the US Environmental Protection Agency and approved for publication Mention of trade names or commercial products does not constitute endorsement or recommendation for use
S-5
SRIUSEPA-GHG-VR-32 September 2004
Greenhouse Gas Technology Center A US EPA Sponsored Environmental Technology Verification ( ) Organization
Environmental Technology Verification Report
NATCO Group Inc ndash Paques THIOPAQ Gas Purification Technology
Prepared By Greenhouse Gas Technology Center
Southern Research Institute PO Box 13825
Research Triangle Park NC 27709 USA Telephone 919806-3456
Under EPA Cooperative Agreement CR 829478
US Environmental Protection Agency Office of Research and Development
National Risk Management Research Laboratory Air Pollution Prevention and Control Division
Research Triangle Park NC 27711 USA
EPA Project Officer David A Kirchgessner
TABLE OF CONTENTS Page
LIST OF FIGURES iii LIST OF TABLES iii ACKNOWLEDGMENTS iv ACRONYMS AND ABBREVIATIONSv
10 INTRODUCTION 1-211 BACKGROUND 1-212 PAQUES THIOPAQ TECHNOLOGY DESCRIPTION 1-3
121 THIOPAQ Process1-3122 Process Chemistry1-4123 Host Facility Description and THIOPAQ Integration 1-5
13 PERFORMANCE VERIFICATION OVERVIEW1-7131 Environmental Performance Parameters1-7132 Operational Performance Parameters1-8133 Modifications to TQAP1-9
Vent Flow Measurement 1-9Collection of Vent Gas1-10Collection of sour and processed biogas samples 1-10Liquid NaOH Solution Flow Measurement 1-10
20 VERIFICATION RESULTS2-121 ENVIRONMENTAL PERFORMANCE2-1
211 Air Emissions2-1212 Liquid Effluent2-3
22 OPERATIONAL PERFORMANCE 2-4221 Gas Composition Gas Quality and H2S Removal Efficiency2-4222 NaOH Consumption2-6223 Sulfur Production and Purity2-7
30 DATA QUALITY ASSESSMENT3-131 DATA QUALITY OBJECTIVES 3-132 ENVIRONMENTAL PERFORMANCE PARAMETERS 3-133 OPERATIONAL PERFORMANCE PARAMETERS3-334 VERIFICATION AUDITS 3-4
40 TECHNICAL AND PERFORMANCE DATA SUPPLIED BY NATCO GROUP 4-1
50 REFERENCES 5-1
LIST OF FIGURES Page
Figure 1-1 Simplified THIOPAQ System Schematic 1-3 Figure 1-2 THIOPAQ System Tested 1-5 Figure 2-1 Biogas and Reactor Air Flow Rates During Testing 2-2 Figure 2-2 Biogas Composition Before and After the THIOPAQ 2-5 Figure 2-3 NaOH Consumption During Verification Period 2-6
LIST OF TABLES Page
Table 1-1 Host Site THIOPAQ Monitoring Instrumentation 1-6 Table 2-1 Sampling Matrix 2-1 Table 2-2 Summary of Sulfur Compounds in Vent Gas Samples 2-2 Table 2-3 Total Sulfate Total Suspended Solids and Total Sulfides in Reactor Slurry 2-3 Table 2-4 Composition and Properties of Sour and Processed Biogas 2-4 Table 2-4 Composition of Solids Removed From the THIOPAQ Process 2-6 Table 3-1 Verification Reference Methods 3-1Table 3-2 Summary of Vent Gas Analytical QAQC Checks 3-2 Table 3-3 Summary of Effluent Sulfate and Sulfide Analytical QAQC Checks 3-3
ACRONYMS AND ABBREVIATIONS
ADQ Audit of Data Quality ASTM American Society for Testing and Materials Btu British thermal units Btuscf British thermal units per standard cubic foot CAR Corrective Action Report cfm cubic feet per minute DQI data quality indicator DQO data quality objective EPA Environmental Protection Agency ETV Environmental Technology Verification gal US gallons galday gallons per day galhr gallons per hour GHG Center Greenhouse Gas Technology Center lb pound lbhr pounds per hour lbday pounds per day LHV lower heating value mgl milligrams per liter MGD million gallons per day NATCO NATCO Group Inc PEA Performance Evaluation Audit ppbv parts per billion volume ppmv parts per million volume QAQC Quality AssuranceQuality Control QMP Quality Management Plan scfm standard cubic feet per minute TQAP Test and Quality Assurance Plan TSA 103cfd
technical systems audit thousand cubic feet per day
UASB upflow anaerobic sludge blanket WPCF Water Pollution Control Facility
10 INTRODUCTION
11 BACKGROUND
The US Environmental Protection Agencyrsquos Office of Research and Development operates the Environmental Technology Verification (ETV) program to facilitate the deployment of innovative technologies through performance verification and information dissemination The goal of ETV is to further environmental protection by accelerating the acceptance and use of improved and innovative environmental technologies Congress funds ETV in response to the belief that there are many viable environmental technologies that are not being used for the lack of credible third-party performance data With performance data developed under this program technology buyers financiers and permitters in the United States and abroad will be better equipped to make informed decisions regarding environmental technology purchase and use
The Greenhouse Gas Technology Center (GHG Center) is one of six verification organizations operating under the ETV program The GHG Center is managed by EPArsquos partner verification organization Southern Research Institute (Southern) which conducts verification testing of promising greenhouse gas mitigation and monitoring technologies The GHG Centerrsquos verification process consists of developing verification protocols conducting field tests collecting and interpreting field and other data obtaining independent peer-reviewed input and reporting findings Performance evaluations are conducted according to externally reviewed verification Test and Quality Assurance Plans (TQAP) and established protocols for quality assurance
The GHG Center is guided by volunteer groups of stakeholders These stakeholders guide the GHG Center in selecting technologies that are most appropriate for testing help to disseminate results and review test plans and technology verification reports A technology area of interest to some GHG Center stakeholders is reliable renewable energy sources The generation of heat and power at industrial petrochemical agricultural and waste-handling facilities with renewable energy sources such as anaerobic digester gas (biogas) or landfill gas is a particular interest These gases when released to the atmosphere contribute millions of tons of methane emissions annually in the US Cost-effective technologies are available that can curb these emissions by processing the gases to remove harmful constituents recovering the methane and using it as an energy source Removal of the harmful components of biogases (primarily hydrogen sulfide and other sulfurous compounds) while minimizing the creation of secondary waste streams and effluents is essential to development of these renewable energy sources
NATCO Group Inc (NATCO) located in Houston Texas requested that the GHG Center perform an independent performance verification of the Paques THIOPAQ technology ndash a gas purification system This technology developed in The Netherlands by Paques BioSystems is designed to safely and efficiently remove hydrogen sulfide (H2S) from biogas and other sour gases while minimizing the generation of harmful emissions or effluents The process is suitable to applications where the processed biogas can be utilized as fuel The system also allows the production of elemental sulfur for subsequent sale or use A variation of this technology is the Shell-Paques system which operates on the same principles as THIOPAQ but includes system components that can process low- medium- and highshypressure natural gas as well as acid gas and Claus tail gas The Shell-Paques version is of particular interest to the natural gas petrochemical and refining industries The two versions of the technology are similar in principle and operation but this verification applies only to the Paques THIOPAQ version A
1-2
THIOPAQ system installed and operating at a midwestern water pollution control facility (WPCF) was selected for this verification
Field tests were performed on the Paques THIOPAQ system to independently verify the performance of this technology The verification included evaluations of both environmental and operational performance of the system Details of the verification test design measurement test procedures and Quality AssuranceQuality Control (QAQC) procedures can be found in the Test and Quality Assurance Plan (TQAP) titled Test and Quality Assurance Plan ndash Paques THIOPAQ and Shell-Paques Gas Purification Technology [1] The TQAP describes the rationale for the experimental design the testing and instrument calibration procedures planned for use and specific QAQC goals and procedures The TQAP was reviewed and revised based on comments received from industry experts and the EPA Quality Assurance Team The TQAP meets the requirements of the GHG Centers Quality Management Plan (QMP) and satisfies the ETV QMP requirements
The remainder of Section 10 describes the THIOPAQ system technology and test facility and outlines the performance verification procedures that were followed Section 20 presents test results and Section 30 assesses the quality of the data obtained Section 40 submitted by NATCO presents additional information regarding the THIOPAQ system Information provided in Section 40 has not been independently verified by the GHG Center
12 PAQUES THIOPAQ TECHNOLOGY DESCRIPTION
Renewable biogas produced from the management of municipal and farm waste is a potentially viable energy source Operational performance data is needed to verify the ability of technologies to remove contaminants in biologically generated gas streams Biogas can be made more usable and environmentally benign if contaminants (primarily H2S) are removed prior to their use as an energy source Conventional H2S removal technologies such as caustic scrubbers are available but these systems may be costly to operate and produce hazardous effluents Redox processes are also available but these require use of chelating agents and generate potentially hazardous effluents
121 THIOPAQ Process
THIOPAQ is a biotechnological process for removing H2S from gaseous streams by absorption into a mild alkaline solution followed by the oxidation of the absorbed sulfide to elemental sulfur by naturally occurring microorganisms THIOPAQ is licensed by Paques for biogas applications The Shell- Paques version of the technology is used for refinery gas and other high pressure applications
The Paques desulfurization technology is a caustic scrubber-based system designed to maintain a high level of H2S removal while addressing several shortcomings of conventional technologies According to NATCO this technology is designed to (1) reduce hazardous effluents from the scrubber by aerobically digesting the waste into a more benign sulfurous product and (2) regenerate and recycle sodium hydroxide (NaOH) needed in the scrubber The THIOPAQ system is specifically designed for lowshypressure biogas streams NATCO states that H2S to sulfur conversion efficiency is expected to be between 95 to 99 percent
The THIOPAQ process begins with the input of biogas or sour gas into an absorber unit (or scrubber) at ambient pressure Scrubber design is site-specific in regards to vessel size construction specifications and gas and solution flow capacities System pH ranges from 82 to 9 The counter-current scrubber design washes the sour gas (or biogas) in a packed bed or packed beds containing 2-inch Pall rings A total draw-off tray combined with a liquid redistribution tray in-between the packed beds ensures proper
1-3
Scrubber
AerobicBioreactor
pH 82 9P 1 bar
SettlingTank
Vacuum FilterVacuum Filter
liquid redistribution Treated gas (sweet gas) exits the scrubber top enters a knockout drum and is routed to the sales gas stream
The liquid stream is then sent to the bioreactor (ambient pressure) A blower supplies air to a distribution header in the bottom section of the reactor enhancing mixing Some of the oxygen is consumed in reactions with sulfide to produce sulfur by the actions of the Thiobacillus bacteria The bacteria are maintained using a continuous feed of proprietary nutrients supplied by Paques These nutrients are pumped into the bioreactor with a small metering pump
Regenerated solvent from the bioreactor is pumped back to the scrubber for reuse A portion of the solvent from the bioreactor is also pumped to a settling tank where solids are separated from the solution and collected gravimetrically NATCO estimates a potential elemental sulfur purity of 95 percent in the sludge cake from the vacuum filter press The solution is then recycled back to the bioreactor for reuse A general process flow diagram of the THIOPAQ process is shown in Figure 1-1
ProcessedProcessedGas Out Air VentGas Out Air Vent
Figure 1-1 Simplified THIOPAQ System Schematic
122 Process Chemistry
The reactions that drive these processes occur primarily in the scrubber and the bioreactor The first main reaction in the scrubber (at feed gas pressure) is H2S absorption The H2S is absorbed by the dilute caustic scrubber solution (NaOH) in the scrubber according to the following chemical reaction
H2S + NaOH rarr NaHS + H2O (a)
Reaction (a) shows that solution alkalinity is consumed during this process The solution leaving the scrubber (NaHS + H2O) is directed to the bioreactor
NaOH
Effluent Bleed Water and
sodium salts
Sulfur Product
Sour Gas In
Circulation Pump
Air Nutrients
= ndash =
Recycled Caustic
NaOH
Effluent BleedWater and
sodium salts
Sulfur Product
SourGas In
Scrubber
CirculationPump
Air
Aerobic Bioreactor
Nutrients
pH = 82 ndash 9 P = 1 bar
Settling Tank
Vacuum Filter
Recycled Caustic
1-4
Hydroxide ions are also consumed in the scrubber during a CO2 absorption step
CO2 + OHndash rarr HCO3ndash (b)
and a carbonate formation step
ndash HCO3 + OHndash rarr CO32ndash + H2O (c)
Note According to NATCO the actual amount of CO2 removed from the sour gas generally is small The carbonate bicarbonate buffer moderates the solution pH to the appropriate range providing hydroxide ions for H2S removal and allowing for the selective removal of H2S and the slip of CO2
The liquid stream loses the OHndash ion in the scrubber and gains the OHndash ion back in the bioreactor The bioreactor operates near atmospheric pressure and is aerated (constant mix) with a controlled inflow of ambient air The bacteria react with the spent scrubber solution and convert the dissolved sulfide to solid elemental sulfur as follows
NaHS + 12O2 rarr So + NaOH (d)
This step relies on the biological oxidation of the dissolved sulfide into elemental sulfur using aerobic bacteria (Thiobacillus) A small portion of the dissolved sulfide (less than 5 percent) is completely oxidized to sulfate as follows
2NaHS +4O2 rarr 2NaHSO4 harr Na2SO4 + H2SO4 (e)
Solution alkalinity is partially regenerated in the bioreactor via the reactions in equation (d) Caustic solution regeneration eliminates the need for a large supply of NaOH to maintain pH above 82 Solution regeneration is not 100 percent as shown in equation (e) so additional make-up NaOH is required A controlled amount of 50-percent NaOH is added to the system continuously using a small metering pump An automated level sensor detects when bioreactor solution level is high and a controlled amount of system effluent is bled to the wastewater treatment plant influent stream restoring proper solution level This bleed stream also prevents the accumulation of sulfate ions Air leaving the bioreactor is vented to atmosphere
According to NATCO the sulfur produced has a hydrophilic nature which significantly reduces the chance of equipment fouling or blocking This characteristic also makes the product suitable for agricultural use as fertilizer Alternatively the sulfur can be melted to yield a high-purity product which meets international Claus sulfur specifications
123 Host Facility Description and THIOPAQ Integration
The WPCF that hosted the THIOPAQ verification is a 40-million gallon per day (MGD) wastewater treatment facility specifically designed to process industrial wastewater streams from numerous local industries including grain and food processing plants and a paper mill Approximately three MGD of flow coming from the paper mill is characterized as low-flow high biological oxygen demand-type waste The facility uses three Biothane upflow anaerobic sludge blankets (UASBs) to pre-treat this wastewater stream The system was designed to handle an average of 818 and a maximum 1184 cubic feet per minute (cfm) and was built in anticipation of future plant expansion Currently the three UASBs generate around 300 to 600 cfm of biogas [or around 432 to 864 thousand cubic feet per day (103cfd)]
1-5
AerobicBioreactor
Scrubber
Biogas composition can vary but is generally 60 percent CH4 38 percent CO2 and 1 to 15 percent H2S The gas generated in each UASB is collected combined compressed and used to fuel a sludge incinerator within the plant The sludge incinerator will consume all of the biogas generated on-site under normal plant operations The biogas is flared during rare occurrences when the incinerator is not operating or is being fueled with natural gas
The facility installed a THIOPAQ system in 2001 to efficiently scrub H2S from the biogas prior to its use as fuel or incineration in the flares (Figure 1-2)
Aerobic Bioreactor
Scrubber
Figure 1-2 THIOPAQ System Tested
The THIOPAQ system tested here has a biogas treatment capacity of 1000 cubic feet per minute is largely automated and PLC-controlled and includes numerous monitoring devices to record the system parameters shown in Figure 1-1 Table 1-1 summarizes some of the monitoring instrumentation used at the plant
The system at this facility decants a liquid effluent batch only about once per week Solids are removed by a vacuum filter press (made by Straight-Line Filter Press) approximately once every three weeks The facility has not yet found a buyer or user of the solid waste containing sulfur so the solids are collected in a large bin and disposed of in a landfill The bioreactor vent is a two-foot diameter rain-capped vent emitting directly to atmosphere
1-6
Table 1-1 Host Site THIOPAQ Monitoring Instrumentation
Parameter Typical Range Instrumentation Location Biogas flow (generation) rate
100 - 200 acfm per each UASB
Fluid Components International Model ST98 thermal mass flow meters (three total)
One on the outlet of each UASB
Scrubber solution flow rate
800 to 1000 gpm Promag 5053W electromagnetic flow monitor
Scrubber pump discharge
NaOH consumption rate
Approximately 1500 lbday
Milltronics level sensor NaOH holding tank
13 PERFORMANCE VERIFICATION OVERVIEW
Field tests were performed on a Paques THIOPAQ system to independently verify the performance of this technology Field testing by the GHG Center was conducted over a three-day period at the facility A one-month period of process monitoring data including biogas flow rate NaOH consumption bioreactor tank level and air flow rates into the bioreactor was provided by the facility These data allowed the GHG Center to evaluate these system operations over a longer term The verification included evaluation of both environmental and operational performance of the system
Environmental Performance bull Air Emissions bull Liquid Effluent
Operational Performance bull H2S Removal Efficiency bull Gas Composition and Quality bull NaOH Consumption bull Sulfur Purity
Sections 131 and 132 briefly describe the sampling and analytical procedures Detailed descriptions of the sample collection handling custody and analytical procedures that were followed during this verification can be found in the TQAP Several modifications to the sampling and analytical procedures specified in the TQAP were implemented during field testing These changes in test procedures are discussed in Section 133
131 Environmental Performance Parameters
Air Emissions The bioreactor vent continuously releases vent gases to the atmosphere The GHG Center conducted measurements on this vent to independently verify concentrations H2S and other sulfur compounds if any that are liberated from the vent GHG Center personnel collected three vent air samples in Tedlar bags on each of three consecutive days for analysis Collected samples were express shipped to Air Toxics Ltd in Folsom California for next day analysis Concentrations of H2S and other sulfur compounds were quantified following ASTM Method D5504 [2] and reported in units of parts per billion by volume (ppbv) Vent gas flow rates were not independently verified (see Section 133) However the plant continuously monitors the amount of air injected into the bioreactor These data were
1-7
provided to the GHG Center for use here as a surrogate for the vent air release rate since the maximum vent volumetric flow rate should be equivalent to or less than the volumetric air input
Liquid Effluent The THIOPAQ system includes only one liquid effluent point ndash the effluent bleed stream used to regulate solution conductivity The THIOPAQ system reduces the volume of hazardous liquid effluent associated with conventional wet scrubbers but small amounts of effluent must be bled from the system intermittently to maintain proper system pH and conductivity This effluent consisting mainly of water and small amounts of sulfate and sulfides is directed back to the wastewater treatment facility Under normal plant operations it is only necessary to remove liquid effluent from the system every week or so Rather than attempt to capture these events and measure the volume of effluent removed the facility provided tank level data for a one-month period These data allowed the GHG Center to calculate the amount of liquid removed from the system and then determine an average weekly effluent rate
A total of seven liquid effluent samples were collected during the verification period and analyzed for total sulfates (EPA Method 3000) total sulfides (EPA Method 3761) and total suspended solids (EPA Method 1602) by CT Laboratories of Baraboo Wisconsin
132 Operational Performance Parameters
H2S Removal Efficiency The Center conducted three tests per day to determine the systems H2S removal efficiency This was done in conjunction with the environmental testing outlined above Timeshyintegrated biogas samples were collected in Tedlar bags simultaneously at the inlet and outlet of the scrubber during each test Collected samples were express-shipped to Empact Analytical in Brighton Colorado for determination of H2S and 17 other sulfur-based compounds by ASTM Method 5504 Results of each species in each sample were standardized and reported in units of parts per million by volume (ppmv) Removal efficiency was calculated based on the measured inlet and outlet concentrations and the biogas throughput values provided by facility instrumentation
Gas Composition and Quality Gas processing by the THIOPAQ system is not expected to significantly impact gas composition or quality other than removal of H2S The center examined gas quality before and after treatment in the THIOPAQ to verify that gas quality was not significantly affected by treatment The same sets of integrated biogas samples used to determine H2S removal were analyzed by Empact to determine gas composition according to ASTM Method D1945 [3] and lower heating value using ASTM D3588 [4] Results of the analysis were examined to determine if the composition and lower heating value (LHV) of the gas are significantly changed by THIOPAQ processing
NaOH Consumption Rate The THIOPAQ system reduces NaOH consumption through NaOH regeneration in the bioreactor The host facility uses a metering pump to add NaOH to the process and a NaOH tank level sensor to continuously monitor consumption The center evaluated the NaOH tank level data for a one-month period to report the NaOH consumption rate at this facility
Sulfur Production and Purity The sulfur containing solids cake generated by the THIOPAQ system represents a potentially salable product The center collected a total of five solids cake samples from the vacuum press for determination of moisture content and to estimate elemental sulfur content Samples were submitted to Core Laboratories of Houston Texas for analysis
Process Operations Several key operational parameters that are logged by the facility were provided to the GHG Center to aid in post-testing data analysis These included biogas flow rate through the system scrubber water flow rate bioreactor level NaOH tank level and air flow rate to the bioreactor These
1-8
data all collected by site metering equipment (Table 1-1) are not used as primary verification parameters but are included in this report to document system operations during testing They also allowed the center to evaluate operational stability or variation during the verification test periods
133 Modifications to TQAP
The procedures and protocols described in the TQAP were selected prior to visiting the WPCF When the testing began at the site several changes were necessary for successful implementation These changes were needed to adapt the procedures to site-specific operating practices and the characteristics of the process streams that were measured The changes to the verification protocol are described in Corrective Action Reports that were submitted to the GHG Center QA Manager and filed at the GHG Center A summary of the changes that were adopted is presented here
Upon arrival at the test site it was noted that the settling tank described in the system design documentation was no longer an active component of the process Consequently suspended solids in the bioreactor were higher than anticipated in the test plan It was also noted that solids removal did not occur daily but rather every three weeks or so after manual measurements of suspended solids passed a threshold value These operations were highly operator dependant and were not conducted on a regular basis Some operators would instead route the solids slurry back to the plant and not to the filter press for recovery Therefore regular meaningful measurements of solids recovery were not possible Liquid bleed for pH and conductivity control was still triggered by the bioreactor tank level and was roughly a fixed volume (approximately 6 inches in tank level or 1590 gallons per event) This revision of the discharge schedule prevented the planned measurement of smaller flows as presented in the TQAP These process modifications and other corrections of the initial information from the plant required changes in verification parameters and test methods In each case the proposed changes were reviewed by the project QA Manager and approved upon his recommendation by GHG Center management
These configuration and operational changes in the THIOPAQ process were addressed by the following changes in experimental design and methods
bull Elimination of direct measurement of solids production rate as non-meaningful
bull Use of plant measurements for bioreactor vent flow rate with spot verification using vane anemometer
bull Change in procedure for effluent disposal rate using non-verified plant data The planned gravimetric measurement was deleted as unworkable and replaced with data from the plant process instruments to detect bleed event record the level change and to quantify the resulting volume that was removed from the reactor (a 6-inch drop equals 1590 gallons)
bull Addition of total suspended solids measurement to liquid sample analysis and change of sample schedule
bull Addition of extended data period (one month of hourly averages) for plant process measurements
Other changes in the sampling and measurements approach were implemented in the field and are described below Documentation and QC checks were followed as outlined in the TQAP for setup and measurement procedures for sample acquisition and sample handling
Vent Flow Measurement The field team leader attempted measurements and found that a standard pitot traverse was impractical due to cyclonic flow duct configuration wind and low flow rate The
1-9
measurement plan was changed to use plant process data with confirmatory check runs using vane anemometer
Collection of Vent Gas Integrated 1-liter bag samples were collected over a 3- to 4- minute period rather than the one-hour sample specified in the TQAP
Collection of sour and processed biogas samples In consultation with the analytical laboratory cylinder samples for gas quality were eliminated and the analyses were performed on bag samples used for sulfur species (ASTM 5504) analysis Use of Tedlar bags minimizes H2S sample deterioration In addition the 24-30 hour hold time limit was exceeded Due to logistical issues such as sample packaging and shipping samples were held for up to 48 hours before analysis This extended holding time may have caused sample degradation or losses of H2S in the bags Although the extent of the degradation if any cannot be quantified it is expected to be minimal This is because results reported here are consistent with sour and processed biogas H2S concentrations measured at the facility which are analyzed within an hour of collection
Liquid NaOH Solution Flow Measurement The QC check was changed to use an onsite volume check device(graduated sight glass)
1-10
20 VERIFICATION RESULTS
The verification period was June 1 through July 1 2004 Field testing was conducted by GHG Center personnel over a 3-day test period from June 29 through July 1 2004 Bioreactor vent gas sour biogas processed biogas liquid effluent and solids samples collected during this 3-day test period are summarized in Table 2-1 Follow-up effluent and solids samples were collected by facility personnel on July 14 Key THIOPAQ operational data including biogas throughput reactor air flow reactor level and NaOH tank level were logged by the facility over the entire one-month verification period and provided to the GHG Center Results of the verification of THIOPAQ environmental and operational performance are presented in Sections 21 and 22 The laboratory reports detailing sample analyses are on file at the GHG Center and available on request but too voluminous for inclusion here A sulfur mass balance for the technology could not be calculated because operational procedures at the facility were not appropriate for measuring the sulfur solids production rate
Table 2-1 Sampling Matrix
Date
Sample Type (Sample ID and time collected) Bioreactor Vent Gas Sour Biogas
Processed Biogas Liquid Effluent Solids Cake
62904 Vent 1 (0920) Sour gas 1 (0945) P gas 1 (0945) Effluent 1 (1000) Vent 2 (1115) Sour gas 2 (1125) P gas 2 (1120) Vent 3 (1315) Sour gas 3 (1325) P gas 3 (1320)
63004 Vent 4 (1030) Sour gas 4 (1055) P gas 4 (1050) Effluent 2 (1030) Vent 5 (1130) Sour gas 5 (1200) P gas 5 (1155) Vent 6 (1320) Sour gas 6 (1330) P gas 6 (1325) Effluent 3 (1315)
7104 Vent 7 (0840) Sour gas 7 (0850) P gas 7 (0845) Solids 1 (0900) Vent 8 (0950) Sour gas 8 (1000) P gas 8 (0955) Effluent 4 (1100) Solids 2 (1000) Vent 9 (1120) Sour gas 9 (1135) P gas 9 (1130) Effluent 5 (1130) Solids 3 (1100)
71404a Effluent 6 Solids 4 Effluent 7 Solids 5
a Samples were collected by facility personnel on 71404 Collection times were not recorded
21 ENVIRONMENTAL PERFORMANCE
211 Air Emissions
Three vent gas samples were collected from the bioreactor on each of the three test days of the technology verification The schedule of vent gas sampling is included in Table 2-1 The results of the analyses of these samples are summarized in Table 2-2 Full documentation of the laboratory analyses are maintained in the GHG Center files As shown in Table 2-2 concentrations of H2S and total sulfur compounds were very low averaging 929 and 1961 ppbv respectively H2S typically comprised about half of the total sulfur compound concentrations Methyl mercaptan dimethyl sulfide and dimethyl disulfide were the other prominent sulfur compounds
2-1
Table 2-2 Summary of Sulfur Compounds in Vent Gas Samples
Date Time H2S ppbv
Total S Compounds ppbv
62904 0920 990 2154 1115 95 1235 1315 72 903
63004 1030 240 1105 1130 200 738 1320 1300 2523
7104 0840 3900 5120 0950 430 1494 1120 1200 2381
Average 929 1961
Difficulties with direct vent gas flow rate measurement forced the Center to use plant process data for the air blower flow rates as a surrogate for the vent gas flow After analyzing these data it is apparent that the air flow through the reactor is highly variable The flow rates logged during the 3-day sampling period are plotted as Figure 2-1 and summarized as follows
Bioreactor Vent Gas Flow Rate Statistics
StatisticAverage
MaximumMinimum
Standard Deviation
Value (scfm) 2463
4320 910 565
This level of variability was evident over the entire 1-month verification period and is reported by the facility to be typical for this gas stream The variable speed air blower is regulated by the THIOPAQ control system to respond to changes in biogas throughput Biogas flow rates through the system also plotted in Figure 2-1 are also highly variable These variabilities complicated evaluation of vent gas flow rates GHG Center personnel also obtained vane anemometer readings in the vent as an independent check on the air blower process data The agreement between the two data sets is poor further complicating this measurement Since the flow rate data is poor only the concentrations of sulfur compounds in the vent gas are summarized in Table 2-2
To provide potential THIOPAQ system users with an estimate of potential bioreactor emissions the average concentrations shown in table 2-2 and the average vent gas flow rate for the 3-day test period were used to calculate estimated average emission rates in units of pounds per hour (lbhr) The average estimated H2S and total sulfur (quantified as H2S) emission rates for the bioreactor vent were 00012 and 00026 lbhr respectively
2-2
THIO
PAQ
Flo
w R
ates
(scf
m)
600
500
400
300
200
100
-
Biogas Air
62904 000 62904 1200 63004 000 63004 1200 7104 000 7104 1200 7204 000
Figure 2-1 Biogas and Reactor Air Flow Rates During Testing
212 Liquid Effluent
A total of seven samples of THIOPAQ effluent (reactor slurry) were collected during the verification for determination of total sulfides total sulfates and total suspended solids Results are summarized in Table 2-3
Results of the sulfide analyses were much higher than expected and after investigation of ion chromatographs run by the laboratory it is evident that thiosulfate was present in the samples Thiosulfate is a potential interference for the analytical method used here so results presented here are possibly biased high by the presence of thiosulfate
One hour average tank levels were provided by the facility over the entire 1-month verification period A total of 81600 gallons of effluent were released during the verification period Based on these data the average effluent rate was approximately 110 gallons per hour (galhr) or about 2600 gallons per day (galday) These values were not independently verified by the GHG Center but are used to estimate mass emissions of sulfate sulfide and solids during the period
2-3
The average sulfate sulfide and TSS concentrations shown in Table 2-3 and the average effluent rate of 2600 galday during the period were then used to estimate discharge rates The estimated liquid disposal rates for sulfate sulfide and solids during the verification period are 77 45 and 444 lbday respectively
Table 2-3 Total Sulfate Total Suspended Solids and Total Sulfide in Reactor Slurry
Date Sample Total Sulfate
mgl
Total Suspended Solids mgl
Total Sulfidea
mgl 62904 Effluent 1 3740 22150 1680 63004 Effluent 2 3710 20940 1770
Effluent 3 3730 21180 2000 7104 Effluent 4 4020 21560 1820
Effluent 5 3610 20730 1880 71404 Effluent 6 2850 16800 2470
Effluent 7 2690 17560 2560 Average 3480 20130 2030
a Potential thiosulfate interference causing high bias in total sulfide test results
22 OPERATIONAL PERFORMANCE
221 Gas Composition Gas Quality and H2S Removal Efficiency
The primary purpose of the THIOPAQ technology is to safely and efficiently remove H2S from sour gas A total of nine sour and processed biogas samples were collected by GHG Center personnel during the 3shyday verification period and analyzed for H2S content Biogas flow rate through the system during the test period ranged from 119 to 504 scfm and averaged 322 scfm (or 464 x 103cfd) The average throughput was approximately 39 percent of design average capacity
Average H2S removal efficiency (mass ) is calculated based on the average measured concentrations of H2S in the sour biogas and the treated biogas as well as the average measured flow rate of biogas into the scrubber and an estimated flow rate out of the scrubber Changes in gas flow rate into and out of the scrubber were expected to be negligible Therefore an equivalent biogas input and output flow rate was assumed in the TQAP for determining the mass flows of H2S in and out of the scrubber and the resulting mass removal efficiency for the system However the biogas flow rate out of the scrubber is slightly less than the input flow rate due to the removal of H2S and a portion of the CO2 in the scrubber The biogas flow rate out of the scrubber was estimated based on a material balance for the components of the biogas (N2 and CH4) that were not impacted by the scrubber Material balance calculations yield a maximum change in biogas flow rate of 97
Although significant changes were observed in biogas flow rate due to the scrubbing of the H2S and CO2 a sensitivity analysis indicates that the maximum impact of the reduced biogas flow rate on the H2S removal efficiency calculation is 001 because of the large change in H2S concentration Therefore the assumption of equivalent flow rates in calculation of the H2S removal efficiency does not significantly
2-4
impact the data quality and is used in this report H2S removal efficiency is then calculated as the change in concentration of H2S across the scrubber
The same samples were analyzed for basic gas composition and heating value to evaluate if gas treatment by THIOPAQ impacted the quality of the gas Results are summarized in Table 2-4 Figure 2-2 illustrates the gas composition before and after the treatment
Table 2-4 Composition and Properties of Sour and Processed Biogas - Dry Basis
Sample ID
Gas Composition Heat Content (Btuscf)
Relative Density
Compres-sibility CH4 () CO2 () N2 () H2S (ppm)
Total S (ppm) HHV LHV
Sour Gas 1 6184 3528 162 12603 12619 6208 5588 09088 09970
Processed Gas 1 6751 3071 142 376 538 6719 6048 08604 09971
Sour Gas 2 6223 346 180 13869 13885 6250 5626 09032 09970
Processed Gas 2 6759 3057 147 361 519 6727 6055 08592 09971
Sour Gas 3 6273 3457 106 16489 16503 6334 5701 09005 09970
Processed Gas 3 7000 2870 108 212 350 6967 6271 08385 09972
Sour Gas 4 618 3466 183 17156 17170 6251 5627 09045 09970
Processed Gas 4 6912 2883 185 260 398 6879 6192 08430 09972
Sour Gas 5 6085 3451 297 16781 16792 6147 5533 09078 09970
Processed Gas 5 6875 2802 294 164 328 6842 6159 08400 09973
Sour Gas 6 6213 3469 127 19180 19199 6292 5664 09033 09970
Processed Gas 6 6676 3171 128 317 474 6645 5981 08690 09971
Sour Gas 7 6357 3142 258 24352 24369 6647 5803 08794 09971
Processed Gas 7 6914 2818 221 282 443 6881 6193 08397 09972
Sour Gas 8 6352 3206 182 25957 25987 6469 5823 08824 09971
Processed Gas 8 7081 2639 236 315 486 7047 6343 08227 09973
Sour Gas 9 6325 3195 207 27472 27497 6450 5805 08827 09971
Processed Gas 9 7032 2527 369 191 325 6997 6298 08188 09974
Avg Sour Gas 6244 3375 189 19318 19336 6339 5686 08970 09970
Avg Processed Gas 6889 2871 203 275 429 6856 6172 08454 09972
H2S concentrations in the sour biogas averaged 193 percent Processed gas contained an average 275 ppm H2S Based on these average concentrations average H2S removal efficiency was 998 percent Analysis of the gas compositional data also indicates that the THIOPAQ system reduces the CO2 concentration of the biogas by an average 15 percent This change in gas composition creates an increase in methane concentration and heating value The average LHV of the processed biogas was approximately 86 percent higher than the sour gas
2-5
Sour Biogas Processed Biogas
338 CO2287 CO2624 CH4 689 CH4
19 N2 19 H2S19 N2 19 H2S 20 N220 N2
Sour Biogas Processed Biogas
338 CO2 624 CH4 287 CO2 689 CH4
Figure 2-2 Biogas Composition Before and After THIOPAQ
222 NaOH Consumption
A primary benefit of THIOPAQ is the potential reduction in NaOH consumption and subsequent operating costs NaOH consumption rates are site specific and will vary depending on the gas processing rate sour gas H2S concentrations and the desired removal efficiency Data presented here are representative of the conditions experienced at this facility during the verification period
Final adjustments to the NaOH feed rate were made by the facility engineer on June 16 2004 One-hour average tank level data collected from that point in time to the end of the verification period are plotted in Figure 2-3 and are used to report NaOH consumption during the verification Unless additional adjustments are made to system operations the NaOH feed rate is constant as illustrated in the figure During the 376-hour period shown a total of 947 gallons of 50-percent NaOH solution were consumed for an average consumption rate of 252 galhr (605 galday) This rate was field verified by GHG Center personnel (see Section 332) The average sour biogas feed rate during the monitoring period was 355 scfm (511 x 103cfd) or about 39 percent of design capacity The sour gas was an average 193 percent sulfur The average 50-percent NaOH consumption normalized to biogas feed rate was 012 gallons per thousand cubic feet of biogas processed or 044 lb NaOH per lb sulfur
2-6
Consumption of 50-percent NaOH solution averaged252 galhr
NaO
H T
ank
Volu
me
(gal
lons
)N
aOH
Tank
Vol
ume
(gal
lons
)24002400
22002200
20002000
18001800
16001600
14001400
12001200
1000100061404 000 61604 000 61804 000 62004 000 62204 000 62404 000 62604 000 62804 000 63004 000 7204 000 7404 00061404 000 61604 000 61804 000 62004 000 62204 000 62404 000 62604 000 62804 000 63004 000 7204 000 7404 000
Consumption of 50-percent NaOH solution averaged 252 galhr
Figure 2-3 NaOH Tank Volume During Verification Period
223 Sulfur Production and Purity
A total of five samples of THIOPAQ solids cake were collected during the verification for estimation of elemental sulfur and moisture content The remaining solids were not identified Results are plusmn 10 percent and are summarized in Table 2-5
Table 2-5 Composition of the Solids Removed From the THIOPAQ Process
Date Time Sulfur
Other Solids
Water
7104 1000 58 22 20 1030 53 19 27 1100 53 18 29
71404 1000 26 48 26 1030 28 44 27
Average 44 30 26
The average elemental sulfur content of the samples as collected was 44 percent On a dry basis elemental sulfur averaged 59 percent of the solids collected
2-7
Plans to measure the amount of solids produced by the system were abandoned during field testing The facility only removes solids every three weeks or so on an as-needed basis The frequency and amount of solids removed varies widely depending on the amount of solids removed through the liquid effluent (the amount of liquids bled and the total suspended solids content of the liquid) Removal of solids cake at this facility was so operator specific and infrequent that it was deemed too arbitrary for verification here Because of this a sulfur mass balance could not be completed for the system
Analysis of the liquid effluent composition and disposal rate indicated that the average total suspended solids disposal rate via the effluent is 444 lbday These solids are the same material that is collected on as solids cake on the vacuum press so it is estimated that 592 percent of the solids disposed of as effluent (or 263 lbs) is recoverable elemental sulfur Since the THIOPAQ system tested here is not configured to maximize solids recovery rate the GHG Center could not determine how much of that sulfur is recoverable for subsequent use
2-8
30 DATA QUALITY ASSESSMENT
31 DATA QUALITY OBJECTIVES
The GHG Center selects methodologies and instruments for all verifications to ensure that the desired level of data quality in the final results is obtained The GHG Center specifies DQOs for each verification parameter before testing starts and uses these goals as a statement of data quality Ideally quantitative DQOs are established based on the level of confidence in results needed by stakeholders or potential users of a technology In some cases such as this verification quantitative DQOs are not well defined and therefore qualitative DQOs are established
During this verification determination of each of the primary verification parameters was conducted based on published reference methods The methods used are summarized in Table 3-1
Table 3-1 Verification Reference Methods
Verification Parameter Required Measurements Applicable Reference
Methods
H2S air emissions (vent) H2S Concentrations Modified ASTM D5504
Sulfate emissions Sulfates in water EPA Method 3000 Sulfide emissions Sulfides in water EPA Methods 3761 Total suspended solids TSS in water EPA Method 1602 H2S removal efficiency Sour gas H2S content
ASTM D5504Processed gas H2S content Gas Quality Gas composition ASTM D1945
Gas heating value ASTM D3588 NaOH consumption rate NaOH consumption rate None see Section 332 Sulfur production Solids moisture content Internal laboratory
proceduresSolids sulfur content
The qualitative DQOs for this verification then are to meet all of the QAQC requirements of each method In some cases the laboratory conducting the analyses has internal QAQC checks that are performed in addition to the method requirements The analytical methods used here were introduced in Section 13 Additional details regarding these methods can be found in the TQAP A summary of the QAQC requirements and results for each method are provided in the following sections
32 ENVIRONMENTAL PERFORMANCE PARAMETERS
The primary verification parameters for environmental performance were concentrations of H2S in the vent gas and sulfate and sulfide concentrations in the effluent QAQC requirements for the methods used to verify these two parameters are discussed below
3-1
321 H2S Concentrations in Vent Gas
Vent gas sample collection date time run number and bag IDs were logged and laboratory chain of custody forms were completed and shipped with the samples Copies of the chain of custody forms and results of the analyses are stored in the GHG Center project files Collected samples were express shipped to Air Toxics Ltd on each of the three days of sampling for next day analysis A coordinated effort minimized sample holding times which ranged from 22 to 33 hours Air Toxics analyzed collected samples in accordance with a modified version of ASTM Method 5504 The QAQC procedures specified in the method were followed and are summarized in Table 3-2
Table 3-2 Summary of Vent Gas Analytical QAQC Checks
QC Check Minimum Frequency
Acceptance Criteria Results Achieved
Five point instrument calibration (ICAL)
Prior to sample analysis
Relative standard deviation lt 30 Results acceptable
Laboratory control sample (LCS)
After each ICAL 90 percent of the compounds quantified must be within 70 ndash 130 of expected values
H2S within the range of 90 to 120 of expected values
Laboratory blank After the ICAL Results lower than reporting limit All compounds below reporting limit
Duplicate analyses 10 of the samples
Relative percent difference of lt 25 for compounds detected 5 times higher than reporting limits
Relative difference lt 25 for compounds detected
As an additional QC check the GHG Center supplied one blindaudit air sample to the laboratory for analysis The audit gas was an independent Reference Standard of H2S in air manufactured by Scott Specialty Gases with a certified analytical accuracy of 25 ppm plusmn 5 percent The audit sample was collected handled and analyzed using the same procedures and equipment as the vent gas samples The laboratory result was 21 ppm or approximately plusmn 16 percent of the certified concentration This QC check served as a performance evaluation audit (PEA) for this verification and was reported to the Southern QA manager for inclusion in the audit report
322 Sulfate and Sulfide Effluent Emissions
Concentrations of sulfates and sulfides in the liquid effluent samples were determined by CT Laboratories using the methods identified in Table 3-1 The QAQC procedures specified in the methods were followed and are summarized in Table 3-3 Documentation from CT Laboratories that each of these QC checks were conducted indicates that the qualitative DQO was met
3-2
Table 3-3 Summary of Effluent Sulfate and Sulfide Analytical QAQC Checks
QC Check Minimum Frequency Acceptance Criteria Results Achieved Three-point instrument calibration
Before analyses Nonendashestablishes instrument calibration curve
Calibration conducted
Daily single-point calibration
Daily prior to sample analyses
Result within 10 of expected values
Result within 10
Duplicate analysis Two samples Not specified Repeatability within 2
Daily single-point calibration reanalysis
Daily after sample analyses
Result within 5 of initial response
Result within 5
33 OPERATIONAL PERFORMANCE PARAMETERS
The primary verification parameters for operational performance were concentrations of H2S in the sour and processed biogas the biogas compositional analyses and the NaOH consumption determination QAQC requirements for the methods used to verify these two parameters are discussed below
331 Biogas H2S Composition and Heating Value
For all biogas samples collected (Table 2-1) sample collection date time run number and canister ID were logged and laboratory chain of custody forms were completed and shipped with the samples Copies of the chain of custody forms and results of the analyses are stored in the GHG Center project files Collected samples were shipped to Empact for compositional analysis and determination of LHV per ASTM Methods D1945 and D3588 as well as H2S analyses according to Method D5504 All samples were analyzed within 48 hours of collection which exceeds the 24 hour method recommendation Empact maintains strict continuous calibration criteria on the instrumentation used for the sulfur and compositional analyses using certified reference standards Copies of these calibration data are stored in the GHG Center project files As independent calibration checks blind audits were submitted to Empact on two similar verifications within the past year to evaluate analytical accuracy on the methane analyses [5 6] These audits qualified as PEAs as required by the ETV QMP Both audits indicated analytical accuracy within 30 Since the same sampling and analytical procedures were used here by the same laboratory analyst the audit was not repeated a third time
In addition to the blind audit samples duplicate analyses were conducted on two of the sour biogas samples and two of the processed biogas samples Duplicate analysis is defined as the analysis performed by the same operating procedure and using the same instrument for a given sample volume Results of the duplicate analyses showed an average analytical repeatability of 003 percent for both methane and LHV Duplicate analyses were also conducted on the sour gas samples to demonstrate H2S repeatability Average repeatability was approximately 4 percent
332 NaOH Consumption
NaOH consumption rates were determined using data provided by the facility GHG Center personnel conducted a field check to verify the accuracy of the tank level sensor used to log NaOH consumption The NaOH tank is equipped with a graduated sight glass Two sets of manual sight glass readings were recorded along with the elapsed time of a given change in level Calculated NaOH consumption rate based on the manual readings averaged 262 galhr The average rate reported by the facility (Section 222) was 252 galhr a difference of approximately 4 percent
3-3
34 VERIFICATION AUDITS
In addition to the QAQC activities discussed here several audit activities were conducted in support of this verification Southernrsquos QA manager conducted an on-site technical systems audit (TSA) of the measurement equipment techniques and methods to ensure compliance with the requirements of the TQAP During the TSA the QA manager and GHG Center field technician noted and documented all of the changes in the TQAP procedures due to site operational differences on corrective action reports These reports are filed at the GHG Center
Southernrsquos QA manager also conducted an audit of data quality (ADQ) for this verification The ADQ is an evaluation of the measurement processing and data evaluation steps to determine if systematic errors have been introduced The QA manager randomly selected approximately 10 percent of the data and followed through the analysis processing and reporting of the data to ensure accuracy The ADQ also included review of any problems changes or corrective actions documented during the test program to verify that their impact on data quality has been assessed and documented
Finally the PEAs described in Sections 321 and 331 satisfied the PEA requirement from the GHG Centerrsquos QMP
3-4
40 TECHNICAL AND PERFORMANCE DATA SUPPLIED BY NATCO GROUP
Note This section provides an opportunity for NATCO and Paques to provide additional comments concerning the THIOPAQ System and its features not addressed elsewhere in the Report The GHG Center has not independently verified the statements made in this section
In anticipation of future plant expansion the THIOPAQ system tested here was designed for higher biogas throughputs than currently available This means that the unit is currently operating at just 30 to 50 percent of capacity (50 to 70 percent turndown) According to NATCO and Paques air blower control is less efficient at these capacities and the technology will likely operate more efficiently at throughputs closer to design capacity It is expected that performance results presented here might further improve at sulfur loads closer to design capacity System turndown can also have a negative impact on NaOH consumption rates The rate verified here (036 lb NaOH per lb sulfur) may also improve at gas throughput rates closer to design capacity
4-1
50 REFERENCES
[1] Southern Research Institute Test and Quality Assurance Plan ndash Paques THIOPAQ and Shell-Paques Gas Purification Technology SRIUSEPA-GHG-QAP-32 wwwsri-rtpcom Greenhouse Gas Technology Center Southern Research Institute Research Triangle Park NC June 2004
[2] American Society for Testing and Materials Standard Practice for Determination of Sulfur Compounds in Natural Gas by Gas Chromatography and Chemiluminescense ASTM D5504-01 West Conshohocken PA 2001
[3] American Society for Testing and Materials Standard Test Method for Analysis of Natural Gas by Gas Chromatography ASTM D1945-98 West Conshohocken PA 2001
[4] American Society for Testing and Materials Standard Practice for Calculating Heat Value Compressibility factor and Relative Density of Gaseous Fuels ASTM D3588-98 West Conshohocken PA 2001
[5] Southern Research Institute Environmental Technology Verification Report Combined Heat and Power at a Commercial Supermarket ndash Capstone 60 kW Microturbine CHP System SRIUSEPA-GHG-QAP-27 wwwsri-rtpcom Greenhouse Gas Technology Center Southern Research Institute Research Triangle Park NC September 2003
[6] Southern Research Institute Environmental Technology Verification Report Residential Electric Power Generation Using the Plug Power SU1 Fuel Cell System SRIUSEPA-GHG-QAP-25 wwwsri-rtpcom Greenhouse Gas Technology Center Southern Research Institute Research Triangle Park NC September 2003
5-1

Scrubber
AerobicBioreactor
pH 82 9P 1 bar
SettlingTank
Vacuum FilterVacuum Filter
liquid redistribution Treated gas (sweet gas) exits the scrubber top enters a knockout drum and is routed to the sales gas stream
The liquid stream is then sent to the bioreactor (ambient pressure) A blower supplies air to a distribution header in the bottom section of the reactor enhancing mixing Some of the oxygen is consumed in reactions with sulfide to produce sulfur by the actions of the Thiobacillus bacteria The bacteria are maintained using a continuous feed of proprietary nutrients supplied by Paques These nutrients are pumped into the bioreactor with a small metering pump
Regenerated solvent from the bioreactor is pumped back to the scrubber for reuse A portion of the solvent from the bioreactor is also pumped to a settling tank where solids are separated from the solution and collected gravimetrically NATCO estimates a potential elemental sulfur purity of 95 percent in the sludge cake from the vacuum filter press The solution is then recycled back to the bioreactor for reuse A general process flow diagram of the THIOPAQ process is shown in Figure 1-1
ProcessedProcessedGas Out Air VentGas Out Air Vent
Figure 1-1 Simplified THIOPAQ System Schematic
122 Process Chemistry
The reactions that drive these processes occur primarily in the scrubber and the bioreactor The first main reaction in the scrubber (at feed gas pressure) is H2S absorption The H2S is absorbed by the dilute caustic scrubber solution (NaOH) in the scrubber according to the following chemical reaction
H2S + NaOH rarr NaHS + H2O (a)
Reaction (a) shows that solution alkalinity is consumed during this process The solution leaving the scrubber (NaHS + H2O) is directed to the bioreactor
NaOH
Effluent Bleed Water and
sodium salts
Sulfur Product
Sour Gas In
Circulation Pump
Air Nutrients
= ndash =
Recycled Caustic
NaOH
Effluent BleedWater and
sodium salts
Sulfur Product
SourGas In
Scrubber
CirculationPump
Air
Aerobic Bioreactor
Nutrients
pH = 82 ndash 9 P = 1 bar
Settling Tank
Vacuum Filter
Recycled Caustic
1-4
Hydroxide ions are also consumed in the scrubber during a CO2 absorption step
CO2 + OHndash rarr HCO3ndash (b)
and a carbonate formation step
ndash HCO3 + OHndash rarr CO32ndash + H2O (c)
Note According to NATCO the actual amount of CO2 removed from the sour gas generally is small The carbonate bicarbonate buffer moderates the solution pH to the appropriate range providing hydroxide ions for H2S removal and allowing for the selective removal of H2S and the slip of CO2
The liquid stream loses the OHndash ion in the scrubber and gains the OHndash ion back in the bioreactor The bioreactor operates near atmospheric pressure and is aerated (constant mix) with a controlled inflow of ambient air The bacteria react with the spent scrubber solution and convert the dissolved sulfide to solid elemental sulfur as follows
NaHS + 12O2 rarr So + NaOH (d)
This step relies on the biological oxidation of the dissolved sulfide into elemental sulfur using aerobic bacteria (Thiobacillus) A small portion of the dissolved sulfide (less than 5 percent) is completely oxidized to sulfate as follows
2NaHS +4O2 rarr 2NaHSO4 harr Na2SO4 + H2SO4 (e)
Solution alkalinity is partially regenerated in the bioreactor via the reactions in equation (d) Caustic solution regeneration eliminates the need for a large supply of NaOH to maintain pH above 82 Solution regeneration is not 100 percent as shown in equation (e) so additional make-up NaOH is required A controlled amount of 50-percent NaOH is added to the system continuously using a small metering pump An automated level sensor detects when bioreactor solution level is high and a controlled amount of system effluent is bled to the wastewater treatment plant influent stream restoring proper solution level This bleed stream also prevents the accumulation of sulfate ions Air leaving the bioreactor is vented to atmosphere
According to NATCO the sulfur produced has a hydrophilic nature which significantly reduces the chance of equipment fouling or blocking This characteristic also makes the product suitable for agricultural use as fertilizer Alternatively the sulfur can be melted to yield a high-purity product which meets international Claus sulfur specifications
123 Host Facility Description and THIOPAQ Integration
The WPCF that hosted the THIOPAQ verification is a 40-million gallon per day (MGD) wastewater treatment facility specifically designed to process industrial wastewater streams from numerous local industries including grain and food processing plants and a paper mill Approximately three MGD of flow coming from the paper mill is characterized as low-flow high biological oxygen demand-type waste The facility uses three Biothane upflow anaerobic sludge blankets (UASBs) to pre-treat this wastewater stream The system was designed to handle an average of 818 and a maximum 1184 cubic feet per minute (cfm) and was built in anticipation of future plant expansion Currently the three UASBs generate around 300 to 600 cfm of biogas [or around 432 to 864 thousand cubic feet per day (103cfd)]
1-5
AerobicBioreactor
Scrubber
Biogas composition can vary but is generally 60 percent CH4 38 percent CO2 and 1 to 15 percent H2S The gas generated in each UASB is collected combined compressed and used to fuel a sludge incinerator within the plant The sludge incinerator will consume all of the biogas generated on-site under normal plant operations The biogas is flared during rare occurrences when the incinerator is not operating or is being fueled with natural gas
The facility installed a THIOPAQ system in 2001 to efficiently scrub H2S from the biogas prior to its use as fuel or incineration in the flares (Figure 1-2)
Aerobic Bioreactor
Scrubber
Figure 1-2 THIOPAQ System Tested
The THIOPAQ system tested here has a biogas treatment capacity of 1000 cubic feet per minute is largely automated and PLC-controlled and includes numerous monitoring devices to record the system parameters shown in Figure 1-1 Table 1-1 summarizes some of the monitoring instrumentation used at the plant
The system at this facility decants a liquid effluent batch only about once per week Solids are removed by a vacuum filter press (made by Straight-Line Filter Press) approximately once every three weeks The facility has not yet found a buyer or user of the solid waste containing sulfur so the solids are collected in a large bin and disposed of in a landfill The bioreactor vent is a two-foot diameter rain-capped vent emitting directly to atmosphere
1-6
Table 1-1 Host Site THIOPAQ Monitoring Instrumentation
Parameter Typical Range Instrumentation Location Biogas flow (generation) rate
100 - 200 acfm per each UASB
Fluid Components International Model ST98 thermal mass flow meters (three total)
One on the outlet of each UASB
Scrubber solution flow rate
800 to 1000 gpm Promag 5053W electromagnetic flow monitor
Scrubber pump discharge
NaOH consumption rate
Approximately 1500 lbday
Milltronics level sensor NaOH holding tank
13 PERFORMANCE VERIFICATION OVERVIEW
Field tests were performed on a Paques THIOPAQ system to independently verify the performance of this technology Field testing by the GHG Center was conducted over a three-day period at the facility A one-month period of process monitoring data including biogas flow rate NaOH consumption bioreactor tank level and air flow rates into the bioreactor was provided by the facility These data allowed the GHG Center to evaluate these system operations over a longer term The verification included evaluation of both environmental and operational performance of the system
Environmental Performance bull Air Emissions bull Liquid Effluent
Operational Performance bull H2S Removal Efficiency bull Gas Composition and Quality bull NaOH Consumption bull Sulfur Purity
Sections 131 and 132 briefly describe the sampling and analytical procedures Detailed descriptions of the sample collection handling custody and analytical procedures that were followed during this verification can be found in the TQAP Several modifications to the sampling and analytical procedures specified in the TQAP were implemented during field testing These changes in test procedures are discussed in Section 133
131 Environmental Performance Parameters
Air Emissions The bioreactor vent continuously releases vent gases to the atmosphere The GHG Center conducted measurements on this vent to independently verify concentrations H2S and other sulfur compounds if any that are liberated from the vent GHG Center personnel collected three vent air samples in Tedlar bags on each of three consecutive days for analysis Collected samples were express shipped to Air Toxics Ltd in Folsom California for next day analysis Concentrations of H2S and other sulfur compounds were quantified following ASTM Method D5504 [2] and reported in units of parts per billion by volume (ppbv) Vent gas flow rates were not independently verified (see Section 133) However the plant continuously monitors the amount of air injected into the bioreactor These data were
1-7
provided to the GHG Center for use here as a surrogate for the vent air release rate since the maximum vent volumetric flow rate should be equivalent to or less than the volumetric air input
Liquid Effluent The THIOPAQ system includes only one liquid effluent point ndash the effluent bleed stream used to regulate solution conductivity The THIOPAQ system reduces the volume of hazardous liquid effluent associated with conventional wet scrubbers but small amounts of effluent must be bled from the system intermittently to maintain proper system pH and conductivity This effluent consisting mainly of water and small amounts of sulfate and sulfides is directed back to the wastewater treatment facility Under normal plant operations it is only necessary to remove liquid effluent from the system every week or so Rather than attempt to capture these events and measure the volume of effluent removed the facility provided tank level data for a one-month period These data allowed the GHG Center to calculate the amount of liquid removed from the system and then determine an average weekly effluent rate
A total of seven liquid effluent samples were collected during the verification period and analyzed for total sulfates (EPA Method 3000) total sulfides (EPA Method 3761) and total suspended solids (EPA Method 1602) by CT Laboratories of Baraboo Wisconsin
132 Operational Performance Parameters
H2S Removal Efficiency The Center conducted three tests per day to determine the systems H2S removal efficiency This was done in conjunction with the environmental testing outlined above Timeshyintegrated biogas samples were collected in Tedlar bags simultaneously at the inlet and outlet of the scrubber during each test Collected samples were express-shipped to Empact Analytical in Brighton Colorado for determination of H2S and 17 other sulfur-based compounds by ASTM Method 5504 Results of each species in each sample were standardized and reported in units of parts per million by volume (ppmv) Removal efficiency was calculated based on the measured inlet and outlet concentrations and the biogas throughput values provided by facility instrumentation
Gas Composition and Quality Gas processing by the THIOPAQ system is not expected to significantly impact gas composition or quality other than removal of H2S The center examined gas quality before and after treatment in the THIOPAQ to verify that gas quality was not significantly affected by treatment The same sets of integrated biogas samples used to determine H2S removal were analyzed by Empact to determine gas composition according to ASTM Method D1945 [3] and lower heating value using ASTM D3588 [4] Results of the analysis were examined to determine if the composition and lower heating value (LHV) of the gas are significantly changed by THIOPAQ processing
NaOH Consumption Rate The THIOPAQ system reduces NaOH consumption through NaOH regeneration in the bioreactor The host facility uses a metering pump to add NaOH to the process and a NaOH tank level sensor to continuously monitor consumption The center evaluated the NaOH tank level data for a one-month period to report the NaOH consumption rate at this facility
Sulfur Production and Purity The sulfur containing solids cake generated by the THIOPAQ system represents a potentially salable product The center collected a total of five solids cake samples from the vacuum press for determination of moisture content and to estimate elemental sulfur content Samples were submitted to Core Laboratories of Houston Texas for analysis
Process Operations Several key operational parameters that are logged by the facility were provided to the GHG Center to aid in post-testing data analysis These included biogas flow rate through the system scrubber water flow rate bioreactor level NaOH tank level and air flow rate to the bioreactor These
1-8
data all collected by site metering equipment (Table 1-1) are not used as primary verification parameters but are included in this report to document system operations during testing They also allowed the center to evaluate operational stability or variation during the verification test periods
133 Modifications to TQAP
The procedures and protocols described in the TQAP were selected prior to visiting the WPCF When the testing began at the site several changes were necessary for successful implementation These changes were needed to adapt the procedures to site-specific operating practices and the characteristics of the process streams that were measured The changes to the verification protocol are described in Corrective Action Reports that were submitted to the GHG Center QA Manager and filed at the GHG Center A summary of the changes that were adopted is presented here
Upon arrival at the test site it was noted that the settling tank described in the system design documentation was no longer an active component of the process Consequently suspended solids in the bioreactor were higher than anticipated in the test plan It was also noted that solids removal did not occur daily but rather every three weeks or so after manual measurements of suspended solids passed a threshold value These operations were highly operator dependant and were not conducted on a regular basis Some operators would instead route the solids slurry back to the plant and not to the filter press for recovery Therefore regular meaningful measurements of solids recovery were not possible Liquid bleed for pH and conductivity control was still triggered by the bioreactor tank level and was roughly a fixed volume (approximately 6 inches in tank level or 1590 gallons per event) This revision of the discharge schedule prevented the planned measurement of smaller flows as presented in the TQAP These process modifications and other corrections of the initial information from the plant required changes in verification parameters and test methods In each case the proposed changes were reviewed by the project QA Manager and approved upon his recommendation by GHG Center management
These configuration and operational changes in the THIOPAQ process were addressed by the following changes in experimental design and methods
bull Elimination of direct measurement of solids production rate as non-meaningful
bull Use of plant measurements for bioreactor vent flow rate with spot verification using vane anemometer
bull Change in procedure for effluent disposal rate using non-verified plant data The planned gravimetric measurement was deleted as unworkable and replaced with data from the plant process instruments to detect bleed event record the level change and to quantify the resulting volume that was removed from the reactor (a 6-inch drop equals 1590 gallons)
bull Addition of total suspended solids measurement to liquid sample analysis and change of sample schedule
bull Addition of extended data period (one month of hourly averages) for plant process measurements
Other changes in the sampling and measurements approach were implemented in the field and are described below Documentation and QC checks were followed as outlined in the TQAP for setup and measurement procedures for sample acquisition and sample handling
Vent Flow Measurement The field team leader attempted measurements and found that a standard pitot traverse was impractical due to cyclonic flow duct configuration wind and low flow rate The
1-9
measurement plan was changed to use plant process data with confirmatory check runs using vane anemometer
Collection of Vent Gas Integrated 1-liter bag samples were collected over a 3- to 4- minute period rather than the one-hour sample specified in the TQAP
Collection of sour and processed biogas samples In consultation with the analytical laboratory cylinder samples for gas quality were eliminated and the analyses were performed on bag samples used for sulfur species (ASTM 5504) analysis Use of Tedlar bags minimizes H2S sample deterioration In addition the 24-30 hour hold time limit was exceeded Due to logistical issues such as sample packaging and shipping samples were held for up to 48 hours before analysis This extended holding time may have caused sample degradation or losses of H2S in the bags Although the extent of the degradation if any cannot be quantified it is expected to be minimal This is because results reported here are consistent with sour and processed biogas H2S concentrations measured at the facility which are analyzed within an hour of collection
Liquid NaOH Solution Flow Measurement The QC check was changed to use an onsite volume check device(graduated sight glass)
1-10
20 VERIFICATION RESULTS
The verification period was June 1 through July 1 2004 Field testing was conducted by GHG Center personnel over a 3-day test period from June 29 through July 1 2004 Bioreactor vent gas sour biogas processed biogas liquid effluent and solids samples collected during this 3-day test period are summarized in Table 2-1 Follow-up effluent and solids samples were collected by facility personnel on July 14 Key THIOPAQ operational data including biogas throughput reactor air flow reactor level and NaOH tank level were logged by the facility over the entire one-month verification period and provided to the GHG Center Results of the verification of THIOPAQ environmental and operational performance are presented in Sections 21 and 22 The laboratory reports detailing sample analyses are on file at the GHG Center and available on request but too voluminous for inclusion here A sulfur mass balance for the technology could not be calculated because operational procedures at the facility were not appropriate for measuring the sulfur solids production rate
Table 2-1 Sampling Matrix
Date
Sample Type (Sample ID and time collected) Bioreactor Vent Gas Sour Biogas
Processed Biogas Liquid Effluent Solids Cake
62904 Vent 1 (0920) Sour gas 1 (0945) P gas 1 (0945) Effluent 1 (1000) Vent 2 (1115) Sour gas 2 (1125) P gas 2 (1120) Vent 3 (1315) Sour gas 3 (1325) P gas 3 (1320)
63004 Vent 4 (1030) Sour gas 4 (1055) P gas 4 (1050) Effluent 2 (1030) Vent 5 (1130) Sour gas 5 (1200) P gas 5 (1155) Vent 6 (1320) Sour gas 6 (1330) P gas 6 (1325) Effluent 3 (1315)
7104 Vent 7 (0840) Sour gas 7 (0850) P gas 7 (0845) Solids 1 (0900) Vent 8 (0950) Sour gas 8 (1000) P gas 8 (0955) Effluent 4 (1100) Solids 2 (1000) Vent 9 (1120) Sour gas 9 (1135) P gas 9 (1130) Effluent 5 (1130) Solids 3 (1100)
71404a Effluent 6 Solids 4 Effluent 7 Solids 5
a Samples were collected by facility personnel on 71404 Collection times were not recorded
21 ENVIRONMENTAL PERFORMANCE
211 Air Emissions
Three vent gas samples were collected from the bioreactor on each of the three test days of the technology verification The schedule of vent gas sampling is included in Table 2-1 The results of the analyses of these samples are summarized in Table 2-2 Full documentation of the laboratory analyses are maintained in the GHG Center files As shown in Table 2-2 concentrations of H2S and total sulfur compounds were very low averaging 929 and 1961 ppbv respectively H2S typically comprised about half of the total sulfur compound concentrations Methyl mercaptan dimethyl sulfide and dimethyl disulfide were the other prominent sulfur compounds
2-1
Table 2-2 Summary of Sulfur Compounds in Vent Gas Samples
Date Time H2S ppbv
Total S Compounds ppbv
62904 0920 990 2154 1115 95 1235 1315 72 903
63004 1030 240 1105 1130 200 738 1320 1300 2523
7104 0840 3900 5120 0950 430 1494 1120 1200 2381
Average 929 1961
Difficulties with direct vent gas flow rate measurement forced the Center to use plant process data for the air blower flow rates as a surrogate for the vent gas flow After analyzing these data it is apparent that the air flow through the reactor is highly variable The flow rates logged during the 3-day sampling period are plotted as Figure 2-1 and summarized as follows
Bioreactor Vent Gas Flow Rate Statistics
StatisticAverage
MaximumMinimum
Standard Deviation
Value (scfm) 2463
4320 910 565
This level of variability was evident over the entire 1-month verification period and is reported by the facility to be typical for this gas stream The variable speed air blower is regulated by the THIOPAQ control system to respond to changes in biogas throughput Biogas flow rates through the system also plotted in Figure 2-1 are also highly variable These variabilities complicated evaluation of vent gas flow rates GHG Center personnel also obtained vane anemometer readings in the vent as an independent check on the air blower process data The agreement between the two data sets is poor further complicating this measurement Since the flow rate data is poor only the concentrations of sulfur compounds in the vent gas are summarized in Table 2-2
To provide potential THIOPAQ system users with an estimate of potential bioreactor emissions the average concentrations shown in table 2-2 and the average vent gas flow rate for the 3-day test period were used to calculate estimated average emission rates in units of pounds per hour (lbhr) The average estimated H2S and total sulfur (quantified as H2S) emission rates for the bioreactor vent were 00012 and 00026 lbhr respectively
2-2
THIO
PAQ
Flo
w R
ates
(scf
m)
600
500
400
300
200
100
-
Biogas Air
62904 000 62904 1200 63004 000 63004 1200 7104 000 7104 1200 7204 000
Figure 2-1 Biogas and Reactor Air Flow Rates During Testing
212 Liquid Effluent
A total of seven samples of THIOPAQ effluent (reactor slurry) were collected during the verification for determination of total sulfides total sulfates and total suspended solids Results are summarized in Table 2-3
Results of the sulfide analyses were much higher than expected and after investigation of ion chromatographs run by the laboratory it is evident that thiosulfate was present in the samples Thiosulfate is a potential interference for the analytical method used here so results presented here are possibly biased high by the presence of thiosulfate
One hour average tank levels were provided by the facility over the entire 1-month verification period A total of 81600 gallons of effluent were released during the verification period Based on these data the average effluent rate was approximately 110 gallons per hour (galhr) or about 2600 gallons per day (galday) These values were not independently verified by the GHG Center but are used to estimate mass emissions of sulfate sulfide and solids during the period
2-3
The average sulfate sulfide and TSS concentrations shown in Table 2-3 and the average effluent rate of 2600 galday during the period were then used to estimate discharge rates The estimated liquid disposal rates for sulfate sulfide and solids during the verification period are 77 45 and 444 lbday respectively
Table 2-3 Total Sulfate Total Suspended Solids and Total Sulfide in Reactor Slurry
Date Sample Total Sulfate
mgl
Total Suspended Solids mgl
Total Sulfidea
mgl 62904 Effluent 1 3740 22150 1680 63004 Effluent 2 3710 20940 1770
Effluent 3 3730 21180 2000 7104 Effluent 4 4020 21560 1820
Effluent 5 3610 20730 1880 71404 Effluent 6 2850 16800 2470
Effluent 7 2690 17560 2560 Average 3480 20130 2030
a Potential thiosulfate interference causing high bias in total sulfide test results
22 OPERATIONAL PERFORMANCE
221 Gas Composition Gas Quality and H2S Removal Efficiency
The primary purpose of the THIOPAQ technology is to safely and efficiently remove H2S from sour gas A total of nine sour and processed biogas samples were collected by GHG Center personnel during the 3shyday verification period and analyzed for H2S content Biogas flow rate through the system during the test period ranged from 119 to 504 scfm and averaged 322 scfm (or 464 x 103cfd) The average throughput was approximately 39 percent of design average capacity
Average H2S removal efficiency (mass ) is calculated based on the average measured concentrations of H2S in the sour biogas and the treated biogas as well as the average measured flow rate of biogas into the scrubber and an estimated flow rate out of the scrubber Changes in gas flow rate into and out of the scrubber were expected to be negligible Therefore an equivalent biogas input and output flow rate was assumed in the TQAP for determining the mass flows of H2S in and out of the scrubber and the resulting mass removal efficiency for the system However the biogas flow rate out of the scrubber is slightly less than the input flow rate due to the removal of H2S and a portion of the CO2 in the scrubber The biogas flow rate out of the scrubber was estimated based on a material balance for the components of the biogas (N2 and CH4) that were not impacted by the scrubber Material balance calculations yield a maximum change in biogas flow rate of 97
Although significant changes were observed in biogas flow rate due to the scrubbing of the H2S and CO2 a sensitivity analysis indicates that the maximum impact of the reduced biogas flow rate on the H2S removal efficiency calculation is 001 because of the large change in H2S concentration Therefore the assumption of equivalent flow rates in calculation of the H2S removal efficiency does not significantly
2-4
impact the data quality and is used in this report H2S removal efficiency is then calculated as the change in concentration of H2S across the scrubber
The same samples were analyzed for basic gas composition and heating value to evaluate if gas treatment by THIOPAQ impacted the quality of the gas Results are summarized in Table 2-4 Figure 2-2 illustrates the gas composition before and after the treatment
Table 2-4 Composition and Properties of Sour and Processed Biogas - Dry Basis
Sample ID
Gas Composition Heat Content (Btuscf)
Relative Density
Compres-sibility CH4 () CO2 () N2 () H2S (ppm)
Total S (ppm) HHV LHV
Sour Gas 1 6184 3528 162 12603 12619 6208 5588 09088 09970
Processed Gas 1 6751 3071 142 376 538 6719 6048 08604 09971
Sour Gas 2 6223 346 180 13869 13885 6250 5626 09032 09970
Processed Gas 2 6759 3057 147 361 519 6727 6055 08592 09971
Sour Gas 3 6273 3457 106 16489 16503 6334 5701 09005 09970
Processed Gas 3 7000 2870 108 212 350 6967 6271 08385 09972
Sour Gas 4 618 3466 183 17156 17170 6251 5627 09045 09970
Processed Gas 4 6912 2883 185 260 398 6879 6192 08430 09972
Sour Gas 5 6085 3451 297 16781 16792 6147 5533 09078 09970
Processed Gas 5 6875 2802 294 164 328 6842 6159 08400 09973
Sour Gas 6 6213 3469 127 19180 19199 6292 5664 09033 09970
Processed Gas 6 6676 3171 128 317 474 6645 5981 08690 09971
Sour Gas 7 6357 3142 258 24352 24369 6647 5803 08794 09971
Processed Gas 7 6914 2818 221 282 443 6881 6193 08397 09972
Sour Gas 8 6352 3206 182 25957 25987 6469 5823 08824 09971
Processed Gas 8 7081 2639 236 315 486 7047 6343 08227 09973
Sour Gas 9 6325 3195 207 27472 27497 6450 5805 08827 09971
Processed Gas 9 7032 2527 369 191 325 6997 6298 08188 09974
Avg Sour Gas 6244 3375 189 19318 19336 6339 5686 08970 09970
Avg Processed Gas 6889 2871 203 275 429 6856 6172 08454 09972
H2S concentrations in the sour biogas averaged 193 percent Processed gas contained an average 275 ppm H2S Based on these average concentrations average H2S removal efficiency was 998 percent Analysis of the gas compositional data also indicates that the THIOPAQ system reduces the CO2 concentration of the biogas by an average 15 percent This change in gas composition creates an increase in methane concentration and heating value The average LHV of the processed biogas was approximately 86 percent higher than the sour gas
2-5
Sour Biogas Processed Biogas
338 CO2287 CO2624 CH4 689 CH4
19 N2 19 H2S19 N2 19 H2S 20 N220 N2
Sour Biogas Processed Biogas
338 CO2 624 CH4 287 CO2 689 CH4
Figure 2-2 Biogas Composition Before and After THIOPAQ
222 NaOH Consumption
A primary benefit of THIOPAQ is the potential reduction in NaOH consumption and subsequent operating costs NaOH consumption rates are site specific and will vary depending on the gas processing rate sour gas H2S concentrations and the desired removal efficiency Data presented here are representative of the conditions experienced at this facility during the verification period
Final adjustments to the NaOH feed rate were made by the facility engineer on June 16 2004 One-hour average tank level data collected from that point in time to the end of the verification period are plotted in Figure 2-3 and are used to report NaOH consumption during the verification Unless additional adjustments are made to system operations the NaOH feed rate is constant as illustrated in the figure During the 376-hour period shown a total of 947 gallons of 50-percent NaOH solution were consumed for an average consumption rate of 252 galhr (605 galday) This rate was field verified by GHG Center personnel (see Section 332) The average sour biogas feed rate during the monitoring period was 355 scfm (511 x 103cfd) or about 39 percent of design capacity The sour gas was an average 193 percent sulfur The average 50-percent NaOH consumption normalized to biogas feed rate was 012 gallons per thousand cubic feet of biogas processed or 044 lb NaOH per lb sulfur
2-6
Consumption of 50-percent NaOH solution averaged252 galhr
NaO
H T
ank
Volu
me
(gal
lons
)N
aOH
Tank
Vol
ume
(gal
lons
)24002400
22002200
20002000
18001800
16001600
14001400
12001200
1000100061404 000 61604 000 61804 000 62004 000 62204 000 62404 000 62604 000 62804 000 63004 000 7204 000 7404 00061404 000 61604 000 61804 000 62004 000 62204 000 62404 000 62604 000 62804 000 63004 000 7204 000 7404 000
Consumption of 50-percent NaOH solution averaged 252 galhr
Figure 2-3 NaOH Tank Volume During Verification Period
223 Sulfur Production and Purity
A total of five samples of THIOPAQ solids cake were collected during the verification for estimation of elemental sulfur and moisture content The remaining solids were not identified Results are plusmn 10 percent and are summarized in Table 2-5
Table 2-5 Composition of the Solids Removed From the THIOPAQ Process
Date Time Sulfur
Other Solids
Water
7104 1000 58 22 20 1030 53 19 27 1100 53 18 29
71404 1000 26 48 26 1030 28 44 27
Average 44 30 26
The average elemental sulfur content of the samples as collected was 44 percent On a dry basis elemental sulfur averaged 59 percent of the solids collected
2-7
Plans to measure the amount of solids produced by the system were abandoned during field testing The facility only removes solids every three weeks or so on an as-needed basis The frequency and amount of solids removed varies widely depending on the amount of solids removed through the liquid effluent (the amount of liquids bled and the total suspended solids content of the liquid) Removal of solids cake at this facility was so operator specific and infrequent that it was deemed too arbitrary for verification here Because of this a sulfur mass balance could not be completed for the system
Analysis of the liquid effluent composition and disposal rate indicated that the average total suspended solids disposal rate via the effluent is 444 lbday These solids are the same material that is collected on as solids cake on the vacuum press so it is estimated that 592 percent of the solids disposed of as effluent (or 263 lbs) is recoverable elemental sulfur Since the THIOPAQ system tested here is not configured to maximize solids recovery rate the GHG Center could not determine how much of that sulfur is recoverable for subsequent use
2-8
30 DATA QUALITY ASSESSMENT
31 DATA QUALITY OBJECTIVES
The GHG Center selects methodologies and instruments for all verifications to ensure that the desired level of data quality in the final results is obtained The GHG Center specifies DQOs for each verification parameter before testing starts and uses these goals as a statement of data quality Ideally quantitative DQOs are established based on the level of confidence in results needed by stakeholders or potential users of a technology In some cases such as this verification quantitative DQOs are not well defined and therefore qualitative DQOs are established
During this verification determination of each of the primary verification parameters was conducted based on published reference methods The methods used are summarized in Table 3-1
Table 3-1 Verification Reference Methods
Verification Parameter Required Measurements Applicable Reference
Methods
H2S air emissions (vent) H2S Concentrations Modified ASTM D5504
Sulfate emissions Sulfates in water EPA Method 3000 Sulfide emissions Sulfides in water EPA Methods 3761 Total suspended solids TSS in water EPA Method 1602 H2S removal efficiency Sour gas H2S content
ASTM D5504Processed gas H2S content Gas Quality Gas composition ASTM D1945
Gas heating value ASTM D3588 NaOH consumption rate NaOH consumption rate None see Section 332 Sulfur production Solids moisture content Internal laboratory
proceduresSolids sulfur content
The qualitative DQOs for this verification then are to meet all of the QAQC requirements of each method In some cases the laboratory conducting the analyses has internal QAQC checks that are performed in addition to the method requirements The analytical methods used here were introduced in Section 13 Additional details regarding these methods can be found in the TQAP A summary of the QAQC requirements and results for each method are provided in the following sections
32 ENVIRONMENTAL PERFORMANCE PARAMETERS
The primary verification parameters for environmental performance were concentrations of H2S in the vent gas and sulfate and sulfide concentrations in the effluent QAQC requirements for the methods used to verify these two parameters are discussed below
3-1
321 H2S Concentrations in Vent Gas
Vent gas sample collection date time run number and bag IDs were logged and laboratory chain of custody forms were completed and shipped with the samples Copies of the chain of custody forms and results of the analyses are stored in the GHG Center project files Collected samples were express shipped to Air Toxics Ltd on each of the three days of sampling for next day analysis A coordinated effort minimized sample holding times which ranged from 22 to 33 hours Air Toxics analyzed collected samples in accordance with a modified version of ASTM Method 5504 The QAQC procedures specified in the method were followed and are summarized in Table 3-2
Table 3-2 Summary of Vent Gas Analytical QAQC Checks
QC Check Minimum Frequency
Acceptance Criteria Results Achieved
Five point instrument calibration (ICAL)
Prior to sample analysis
Relative standard deviation lt 30 Results acceptable
Laboratory control sample (LCS)
After each ICAL 90 percent of the compounds quantified must be within 70 ndash 130 of expected values
H2S within the range of 90 to 120 of expected values
Laboratory blank After the ICAL Results lower than reporting limit All compounds below reporting limit
Duplicate analyses 10 of the samples
Relative percent difference of lt 25 for compounds detected 5 times higher than reporting limits
Relative difference lt 25 for compounds detected
As an additional QC check the GHG Center supplied one blindaudit air sample to the laboratory for analysis The audit gas was an independent Reference Standard of H2S in air manufactured by Scott Specialty Gases with a certified analytical accuracy of 25 ppm plusmn 5 percent The audit sample was collected handled and analyzed using the same procedures and equipment as the vent gas samples The laboratory result was 21 ppm or approximately plusmn 16 percent of the certified concentration This QC check served as a performance evaluation audit (PEA) for this verification and was reported to the Southern QA manager for inclusion in the audit report
322 Sulfate and Sulfide Effluent Emissions
Concentrations of sulfates and sulfides in the liquid effluent samples were determined by CT Laboratories using the methods identified in Table 3-1 The QAQC procedures specified in the methods were followed and are summarized in Table 3-3 Documentation from CT Laboratories that each of these QC checks were conducted indicates that the qualitative DQO was met
3-2
Table 3-3 Summary of Effluent Sulfate and Sulfide Analytical QAQC Checks
QC Check Minimum Frequency Acceptance Criteria Results Achieved Three-point instrument calibration
Before analyses Nonendashestablishes instrument calibration curve
Calibration conducted
Daily single-point calibration
Daily prior to sample analyses
Result within 10 of expected values
Result within 10
Duplicate analysis Two samples Not specified Repeatability within 2
Daily single-point calibration reanalysis
Daily after sample analyses
Result within 5 of initial response
Result within 5
33 OPERATIONAL PERFORMANCE PARAMETERS
The primary verification parameters for operational performance were concentrations of H2S in the sour and processed biogas the biogas compositional analyses and the NaOH consumption determination QAQC requirements for the methods used to verify these two parameters are discussed below
331 Biogas H2S Composition and Heating Value
For all biogas samples collected (Table 2-1) sample collection date time run number and canister ID were logged and laboratory chain of custody forms were completed and shipped with the samples Copies of the chain of custody forms and results of the analyses are stored in the GHG Center project files Collected samples were shipped to Empact for compositional analysis and determination of LHV per ASTM Methods D1945 and D3588 as well as H2S analyses according to Method D5504 All samples were analyzed within 48 hours of collection which exceeds the 24 hour method recommendation Empact maintains strict continuous calibration criteria on the instrumentation used for the sulfur and compositional analyses using certified reference standards Copies of these calibration data are stored in the GHG Center project files As independent calibration checks blind audits were submitted to Empact on two similar verifications within the past year to evaluate analytical accuracy on the methane analyses [5 6] These audits qualified as PEAs as required by the ETV QMP Both audits indicated analytical accuracy within 30 Since the same sampling and analytical procedures were used here by the same laboratory analyst the audit was not repeated a third time
In addition to the blind audit samples duplicate analyses were conducted on two of the sour biogas samples and two of the processed biogas samples Duplicate analysis is defined as the analysis performed by the same operating procedure and using the same instrument for a given sample volume Results of the duplicate analyses showed an average analytical repeatability of 003 percent for both methane and LHV Duplicate analyses were also conducted on the sour gas samples to demonstrate H2S repeatability Average repeatability was approximately 4 percent
332 NaOH Consumption
NaOH consumption rates were determined using data provided by the facility GHG Center personnel conducted a field check to verify the accuracy of the tank level sensor used to log NaOH consumption The NaOH tank is equipped with a graduated sight glass Two sets of manual sight glass readings were recorded along with the elapsed time of a given change in level Calculated NaOH consumption rate based on the manual readings averaged 262 galhr The average rate reported by the facility (Section 222) was 252 galhr a difference of approximately 4 percent
3-3
34 VERIFICATION AUDITS
In addition to the QAQC activities discussed here several audit activities were conducted in support of this verification Southernrsquos QA manager conducted an on-site technical systems audit (TSA) of the measurement equipment techniques and methods to ensure compliance with the requirements of the TQAP During the TSA the QA manager and GHG Center field technician noted and documented all of the changes in the TQAP procedures due to site operational differences on corrective action reports These reports are filed at the GHG Center
Southernrsquos QA manager also conducted an audit of data quality (ADQ) for this verification The ADQ is an evaluation of the measurement processing and data evaluation steps to determine if systematic errors have been introduced The QA manager randomly selected approximately 10 percent of the data and followed through the analysis processing and reporting of the data to ensure accuracy The ADQ also included review of any problems changes or corrective actions documented during the test program to verify that their impact on data quality has been assessed and documented
Finally the PEAs described in Sections 321 and 331 satisfied the PEA requirement from the GHG Centerrsquos QMP
3-4
40 TECHNICAL AND PERFORMANCE DATA SUPPLIED BY NATCO GROUP
Note This section provides an opportunity for NATCO and Paques to provide additional comments concerning the THIOPAQ System and its features not addressed elsewhere in the Report The GHG Center has not independently verified the statements made in this section
In anticipation of future plant expansion the THIOPAQ system tested here was designed for higher biogas throughputs than currently available This means that the unit is currently operating at just 30 to 50 percent of capacity (50 to 70 percent turndown) According to NATCO and Paques air blower control is less efficient at these capacities and the technology will likely operate more efficiently at throughputs closer to design capacity It is expected that performance results presented here might further improve at sulfur loads closer to design capacity System turndown can also have a negative impact on NaOH consumption rates The rate verified here (036 lb NaOH per lb sulfur) may also improve at gas throughput rates closer to design capacity
4-1
50 REFERENCES
[1] Southern Research Institute Test and Quality Assurance Plan ndash Paques THIOPAQ and Shell-Paques Gas Purification Technology SRIUSEPA-GHG-QAP-32 wwwsri-rtpcom Greenhouse Gas Technology Center Southern Research Institute Research Triangle Park NC June 2004
[2] American Society for Testing and Materials Standard Practice for Determination of Sulfur Compounds in Natural Gas by Gas Chromatography and Chemiluminescense ASTM D5504-01 West Conshohocken PA 2001
[3] American Society for Testing and Materials Standard Test Method for Analysis of Natural Gas by Gas Chromatography ASTM D1945-98 West Conshohocken PA 2001
[4] American Society for Testing and Materials Standard Practice for Calculating Heat Value Compressibility factor and Relative Density of Gaseous Fuels ASTM D3588-98 West Conshohocken PA 2001
[5] Southern Research Institute Environmental Technology Verification Report Combined Heat and Power at a Commercial Supermarket ndash Capstone 60 kW Microturbine CHP System SRIUSEPA-GHG-QAP-27 wwwsri-rtpcom Greenhouse Gas Technology Center Southern Research Institute Research Triangle Park NC September 2003
[6] Southern Research Institute Environmental Technology Verification Report Residential Electric Power Generation Using the Plug Power SU1 Fuel Cell System SRIUSEPA-GHG-QAP-25 wwwsri-rtpcom Greenhouse Gas Technology Center Southern Research Institute Research Triangle Park NC September 2003
5-1
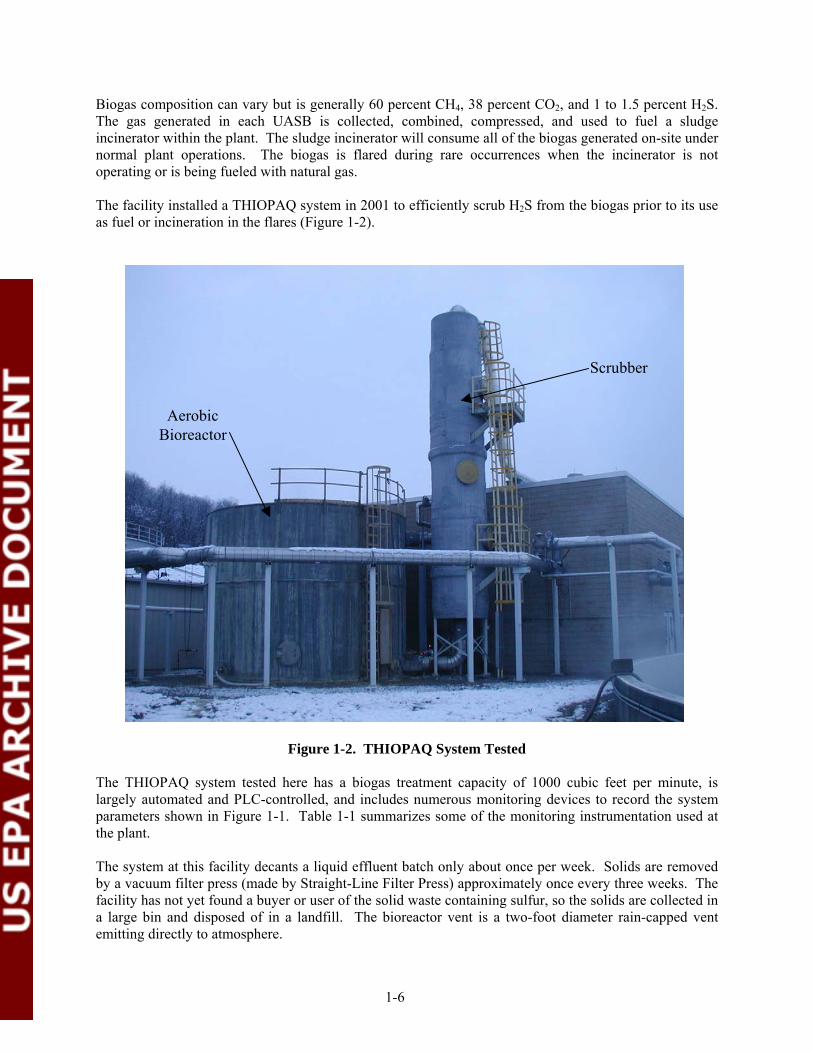

Sour Biogas Processed Biogas
338 CO2287 CO2624 CH4 689 CH4
19 N2 19 H2S19 N2 19 H2S 20 N220 N2
Sour Biogas Processed Biogas
338 CO2 624 CH4 287 CO2 689 CH4
Figure 2-2 Biogas Composition Before and After THIOPAQ
222 NaOH Consumption
A primary benefit of THIOPAQ is the potential reduction in NaOH consumption and subsequent operating costs NaOH consumption rates are site specific and will vary depending on the gas processing rate sour gas H2S concentrations and the desired removal efficiency Data presented here are representative of the conditions experienced at this facility during the verification period
Final adjustments to the NaOH feed rate were made by the facility engineer on June 16 2004 One-hour average tank level data collected from that point in time to the end of the verification period are plotted in Figure 2-3 and are used to report NaOH consumption during the verification Unless additional adjustments are made to system operations the NaOH feed rate is constant as illustrated in the figure During the 376-hour period shown a total of 947 gallons of 50-percent NaOH solution were consumed for an average consumption rate of 252 galhr (605 galday) This rate was field verified by GHG Center personnel (see Section 332) The average sour biogas feed rate during the monitoring period was 355 scfm (511 x 103cfd) or about 39 percent of design capacity The sour gas was an average 193 percent sulfur The average 50-percent NaOH consumption normalized to biogas feed rate was 012 gallons per thousand cubic feet of biogas processed or 044 lb NaOH per lb sulfur
2-6
Consumption of 50-percent NaOH solution averaged252 galhr
NaO
H T
ank
Volu
me
(gal
lons
)N
aOH
Tank
Vol
ume
(gal
lons
)24002400
22002200
20002000
18001800
16001600
14001400
12001200
1000100061404 000 61604 000 61804 000 62004 000 62204 000 62404 000 62604 000 62804 000 63004 000 7204 000 7404 00061404 000 61604 000 61804 000 62004 000 62204 000 62404 000 62604 000 62804 000 63004 000 7204 000 7404 000
Consumption of 50-percent NaOH solution averaged 252 galhr
Figure 2-3 NaOH Tank Volume During Verification Period
223 Sulfur Production and Purity
A total of five samples of THIOPAQ solids cake were collected during the verification for estimation of elemental sulfur and moisture content The remaining solids were not identified Results are plusmn 10 percent and are summarized in Table 2-5
Table 2-5 Composition of the Solids Removed From the THIOPAQ Process
Date Time Sulfur
Other Solids
Water
7104 1000 58 22 20 1030 53 19 27 1100 53 18 29
71404 1000 26 48 26 1030 28 44 27
Average 44 30 26
The average elemental sulfur content of the samples as collected was 44 percent On a dry basis elemental sulfur averaged 59 percent of the solids collected
2-7
Plans to measure the amount of solids produced by the system were abandoned during field testing The facility only removes solids every three weeks or so on an as-needed basis The frequency and amount of solids removed varies widely depending on the amount of solids removed through the liquid effluent (the amount of liquids bled and the total suspended solids content of the liquid) Removal of solids cake at this facility was so operator specific and infrequent that it was deemed too arbitrary for verification here Because of this a sulfur mass balance could not be completed for the system
Analysis of the liquid effluent composition and disposal rate indicated that the average total suspended solids disposal rate via the effluent is 444 lbday These solids are the same material that is collected on as solids cake on the vacuum press so it is estimated that 592 percent of the solids disposed of as effluent (or 263 lbs) is recoverable elemental sulfur Since the THIOPAQ system tested here is not configured to maximize solids recovery rate the GHG Center could not determine how much of that sulfur is recoverable for subsequent use
2-8
30 DATA QUALITY ASSESSMENT
31 DATA QUALITY OBJECTIVES
The GHG Center selects methodologies and instruments for all verifications to ensure that the desired level of data quality in the final results is obtained The GHG Center specifies DQOs for each verification parameter before testing starts and uses these goals as a statement of data quality Ideally quantitative DQOs are established based on the level of confidence in results needed by stakeholders or potential users of a technology In some cases such as this verification quantitative DQOs are not well defined and therefore qualitative DQOs are established
During this verification determination of each of the primary verification parameters was conducted based on published reference methods The methods used are summarized in Table 3-1
Table 3-1 Verification Reference Methods
Verification Parameter Required Measurements Applicable Reference
Methods
H2S air emissions (vent) H2S Concentrations Modified ASTM D5504
Sulfate emissions Sulfates in water EPA Method 3000 Sulfide emissions Sulfides in water EPA Methods 3761 Total suspended solids TSS in water EPA Method 1602 H2S removal efficiency Sour gas H2S content
ASTM D5504Processed gas H2S content Gas Quality Gas composition ASTM D1945
Gas heating value ASTM D3588 NaOH consumption rate NaOH consumption rate None see Section 332 Sulfur production Solids moisture content Internal laboratory
proceduresSolids sulfur content
The qualitative DQOs for this verification then are to meet all of the QAQC requirements of each method In some cases the laboratory conducting the analyses has internal QAQC checks that are performed in addition to the method requirements The analytical methods used here were introduced in Section 13 Additional details regarding these methods can be found in the TQAP A summary of the QAQC requirements and results for each method are provided in the following sections
32 ENVIRONMENTAL PERFORMANCE PARAMETERS
The primary verification parameters for environmental performance were concentrations of H2S in the vent gas and sulfate and sulfide concentrations in the effluent QAQC requirements for the methods used to verify these two parameters are discussed below
3-1
321 H2S Concentrations in Vent Gas
Vent gas sample collection date time run number and bag IDs were logged and laboratory chain of custody forms were completed and shipped with the samples Copies of the chain of custody forms and results of the analyses are stored in the GHG Center project files Collected samples were express shipped to Air Toxics Ltd on each of the three days of sampling for next day analysis A coordinated effort minimized sample holding times which ranged from 22 to 33 hours Air Toxics analyzed collected samples in accordance with a modified version of ASTM Method 5504 The QAQC procedures specified in the method were followed and are summarized in Table 3-2
Table 3-2 Summary of Vent Gas Analytical QAQC Checks
QC Check Minimum Frequency
Acceptance Criteria Results Achieved
Five point instrument calibration (ICAL)
Prior to sample analysis
Relative standard deviation lt 30 Results acceptable
Laboratory control sample (LCS)
After each ICAL 90 percent of the compounds quantified must be within 70 ndash 130 of expected values
H2S within the range of 90 to 120 of expected values
Laboratory blank After the ICAL Results lower than reporting limit All compounds below reporting limit
Duplicate analyses 10 of the samples
Relative percent difference of lt 25 for compounds detected 5 times higher than reporting limits
Relative difference lt 25 for compounds detected
As an additional QC check the GHG Center supplied one blindaudit air sample to the laboratory for analysis The audit gas was an independent Reference Standard of H2S in air manufactured by Scott Specialty Gases with a certified analytical accuracy of 25 ppm plusmn 5 percent The audit sample was collected handled and analyzed using the same procedures and equipment as the vent gas samples The laboratory result was 21 ppm or approximately plusmn 16 percent of the certified concentration This QC check served as a performance evaluation audit (PEA) for this verification and was reported to the Southern QA manager for inclusion in the audit report
322 Sulfate and Sulfide Effluent Emissions
Concentrations of sulfates and sulfides in the liquid effluent samples were determined by CT Laboratories using the methods identified in Table 3-1 The QAQC procedures specified in the methods were followed and are summarized in Table 3-3 Documentation from CT Laboratories that each of these QC checks were conducted indicates that the qualitative DQO was met
3-2
Table 3-3 Summary of Effluent Sulfate and Sulfide Analytical QAQC Checks
QC Check Minimum Frequency Acceptance Criteria Results Achieved Three-point instrument calibration
Before analyses Nonendashestablishes instrument calibration curve
Calibration conducted
Daily single-point calibration
Daily prior to sample analyses
Result within 10 of expected values
Result within 10
Duplicate analysis Two samples Not specified Repeatability within 2
Daily single-point calibration reanalysis
Daily after sample analyses
Result within 5 of initial response
Result within 5
33 OPERATIONAL PERFORMANCE PARAMETERS
The primary verification parameters for operational performance were concentrations of H2S in the sour and processed biogas the biogas compositional analyses and the NaOH consumption determination QAQC requirements for the methods used to verify these two parameters are discussed below
331 Biogas H2S Composition and Heating Value
For all biogas samples collected (Table 2-1) sample collection date time run number and canister ID were logged and laboratory chain of custody forms were completed and shipped with the samples Copies of the chain of custody forms and results of the analyses are stored in the GHG Center project files Collected samples were shipped to Empact for compositional analysis and determination of LHV per ASTM Methods D1945 and D3588 as well as H2S analyses according to Method D5504 All samples were analyzed within 48 hours of collection which exceeds the 24 hour method recommendation Empact maintains strict continuous calibration criteria on the instrumentation used for the sulfur and compositional analyses using certified reference standards Copies of these calibration data are stored in the GHG Center project files As independent calibration checks blind audits were submitted to Empact on two similar verifications within the past year to evaluate analytical accuracy on the methane analyses [5 6] These audits qualified as PEAs as required by the ETV QMP Both audits indicated analytical accuracy within 30 Since the same sampling and analytical procedures were used here by the same laboratory analyst the audit was not repeated a third time
In addition to the blind audit samples duplicate analyses were conducted on two of the sour biogas samples and two of the processed biogas samples Duplicate analysis is defined as the analysis performed by the same operating procedure and using the same instrument for a given sample volume Results of the duplicate analyses showed an average analytical repeatability of 003 percent for both methane and LHV Duplicate analyses were also conducted on the sour gas samples to demonstrate H2S repeatability Average repeatability was approximately 4 percent
332 NaOH Consumption
NaOH consumption rates were determined using data provided by the facility GHG Center personnel conducted a field check to verify the accuracy of the tank level sensor used to log NaOH consumption The NaOH tank is equipped with a graduated sight glass Two sets of manual sight glass readings were recorded along with the elapsed time of a given change in level Calculated NaOH consumption rate based on the manual readings averaged 262 galhr The average rate reported by the facility (Section 222) was 252 galhr a difference of approximately 4 percent
3-3
34 VERIFICATION AUDITS
In addition to the QAQC activities discussed here several audit activities were conducted in support of this verification Southernrsquos QA manager conducted an on-site technical systems audit (TSA) of the measurement equipment techniques and methods to ensure compliance with the requirements of the TQAP During the TSA the QA manager and GHG Center field technician noted and documented all of the changes in the TQAP procedures due to site operational differences on corrective action reports These reports are filed at the GHG Center
Southernrsquos QA manager also conducted an audit of data quality (ADQ) for this verification The ADQ is an evaluation of the measurement processing and data evaluation steps to determine if systematic errors have been introduced The QA manager randomly selected approximately 10 percent of the data and followed through the analysis processing and reporting of the data to ensure accuracy The ADQ also included review of any problems changes or corrective actions documented during the test program to verify that their impact on data quality has been assessed and documented
Finally the PEAs described in Sections 321 and 331 satisfied the PEA requirement from the GHG Centerrsquos QMP
3-4
40 TECHNICAL AND PERFORMANCE DATA SUPPLIED BY NATCO GROUP
Note This section provides an opportunity for NATCO and Paques to provide additional comments concerning the THIOPAQ System and its features not addressed elsewhere in the Report The GHG Center has not independently verified the statements made in this section
In anticipation of future plant expansion the THIOPAQ system tested here was designed for higher biogas throughputs than currently available This means that the unit is currently operating at just 30 to 50 percent of capacity (50 to 70 percent turndown) According to NATCO and Paques air blower control is less efficient at these capacities and the technology will likely operate more efficiently at throughputs closer to design capacity It is expected that performance results presented here might further improve at sulfur loads closer to design capacity System turndown can also have a negative impact on NaOH consumption rates The rate verified here (036 lb NaOH per lb sulfur) may also improve at gas throughput rates closer to design capacity
4-1
50 REFERENCES
[1] Southern Research Institute Test and Quality Assurance Plan ndash Paques THIOPAQ and Shell-Paques Gas Purification Technology SRIUSEPA-GHG-QAP-32 wwwsri-rtpcom Greenhouse Gas Technology Center Southern Research Institute Research Triangle Park NC June 2004
[2] American Society for Testing and Materials Standard Practice for Determination of Sulfur Compounds in Natural Gas by Gas Chromatography and Chemiluminescense ASTM D5504-01 West Conshohocken PA 2001
[3] American Society for Testing and Materials Standard Test Method for Analysis of Natural Gas by Gas Chromatography ASTM D1945-98 West Conshohocken PA 2001
[4] American Society for Testing and Materials Standard Practice for Calculating Heat Value Compressibility factor and Relative Density of Gaseous Fuels ASTM D3588-98 West Conshohocken PA 2001
[5] Southern Research Institute Environmental Technology Verification Report Combined Heat and Power at a Commercial Supermarket ndash Capstone 60 kW Microturbine CHP System SRIUSEPA-GHG-QAP-27 wwwsri-rtpcom Greenhouse Gas Technology Center Southern Research Institute Research Triangle Park NC September 2003
[6] Southern Research Institute Environmental Technology Verification Report Residential Electric Power Generation Using the Plug Power SU1 Fuel Cell System SRIUSEPA-GHG-QAP-25 wwwsri-rtpcom Greenhouse Gas Technology Center Southern Research Institute Research Triangle Park NC September 2003
5-1