think globally, act locally: a client-focused, innovation-driven
TRANSCRIPT
215
an
TAIY
O N
IPP
ON
SA
NS
O C
orp
oratio
n A
nn
ual R
epo
rt 20
10
Think Globally, Act Locally:
A Client-Focused,Innovation-DrivenApproach
Annual Report
Year Ended March 31, 2010
2010
210
ProfileTaiyo Nippon Sanso Corporation is the fruit of the merger of Nippon Sanso Corporation and Taiyo Toyo Sanso
Co., Ltd., on October 1, 2004. The Company is drawing on the capabilities of its two predecessors in its drive
to become a leading player in Asia and around the world.
Management Philosophy“Market-driven collaborative innovation: improving the future through gases”
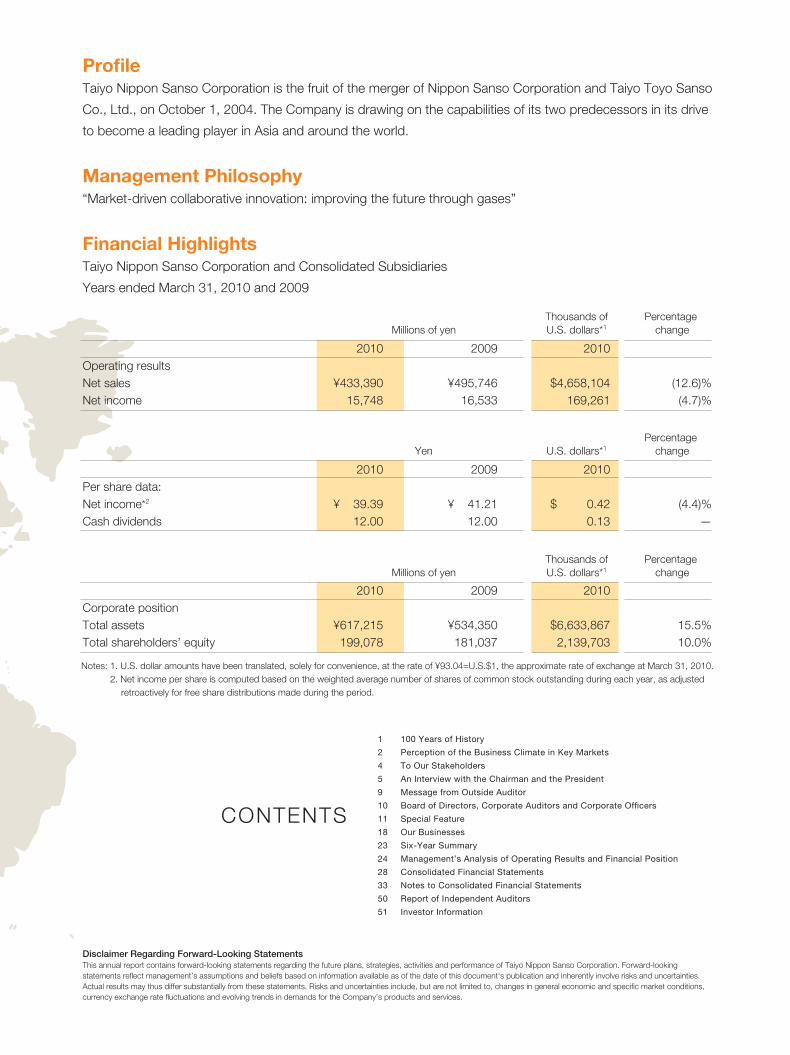
Financial HighlightsTaiyo Nippon Sanso Corporation and Consolidated Subsidiaries
Years ended March 31, 2010 and 2009
Disclaimer Regarding Forward-Looking StatementsThis annual report contains forward-looking statements regarding the future plans, strategies, activities and performance of Taiyo Nippon Sanso Corporation. Forward-looking statements reflect management’s assumptions and beliefs based on information available as of the date of this document‘s publication and inherently involve risks and uncertainties. Actual results may thus differ substantially from these statements. Risks and uncertainties include, but are not limited to, changes in general economic and specific market conditions, currency exchange rate fluctuations and evolving trends in demands for the Company’s products and services.
1 100 Years of History
2 Perception of the Business Climate in Key Markets
4 To Our Stakeholders
5 An Interview with the Chairman and the President
9 Message from Outside Auditor
10 Board of Directors, Corporate Auditors and Corporate Officers
11 Special Feature
18 Our Businesses
23 Six-Year Summary
24 Management’s Analysis of Operating Results and Financial Position
28 Consolidated Financial Statements
33 Notes to Consolidated Financial Statements
50 Report of Independent Auditors
51 Investor Information
2010 2009 2010Operating resultsNet sales ¥433,390 ¥495,746 $4,658,104 (12.6)%Net income 15,748 16,533 169,261 (4.7)%
2010 2009 2010Per share data:Net income*2 ¥ 39.39 ¥ 41.21 $ 0.42 (4.4)%Cash dividends 12.00 12.00 0.13 —
2010 2009 2010Corporate positionTotal assets ¥617,215 ¥534,350 $6,633,867 15.5%Total shareholders’ equity 199,078 181,037 2,139,703 10.0%
Millions of yen Thousands ofU.S. dollars*1
Percentage change
Yen U.S. dollars*1Percentage
change
Millions of yen Thousands ofU.S. dollars*1
Percentage change
Notes: 1. U.S. dollar amounts have been translated, solely for convenience, at the rate of ¥93.04=U.S.$1, the approximate rate of exchange at March 31, 2010. 2. Net income per share is computed based on the weighted average number of shares of common stock outstanding during each year, as adjusted
retroactively for free share distributions made during the period.
CONTENTS
205
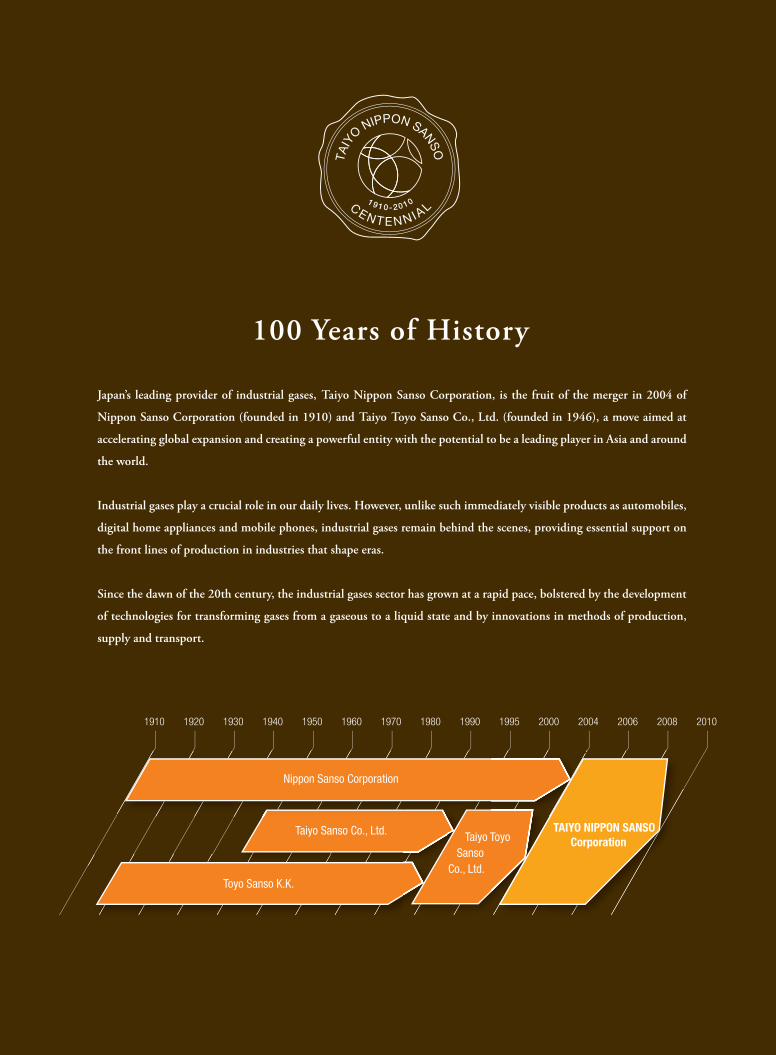
100 Years of History
Japan’s leading provider of industrial gases, Taiyo Nippon Sanso Corporation, is the fruit of the merger in 2004 of
Nippon Sanso Corporation (founded in 1910) and Taiyo Toyo Sanso Co., Ltd. (founded in 1946), a move aimed at
accelerating global expansion and creating a powerful entity with the potential to be a leading player in Asia and around
the world.
Industrial gases play a crucial role in our daily lives. However, unlike such immediately visible products as automobiles,
digital home appliances and mobile phones, industrial gases remain behind the scenes, providing essential support on
the front lines of production in industries that shape eras.
Since the dawn of the 20th century, the industrial gases sector has grown at a rapid pace, bolstered by the development
of technologies for transforming gases from a gaseous to a liquid state and by innovations in methods of production,
supply and transport.
1910 1920 1930 1940 1950 1960 1970 1980 1990 1995 2000 2004 2006 2008 2010
Toyo Sanso K.K.
Taiyo Sanso Co., Ltd. Taiyo Toyo Sanso Co., Ltd.
Nippon Sanso Corporation
ToyoTAIYO NIPPON SANSO
Corporation
210
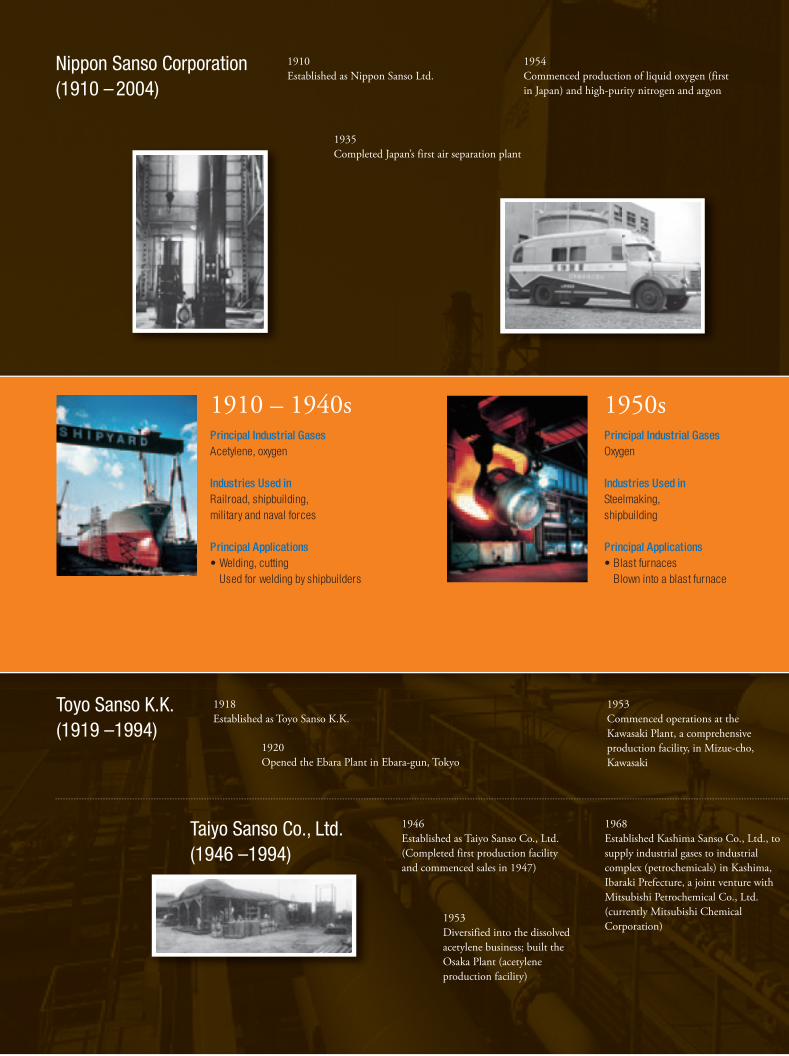
1950sPrincipal Industrial GasesOxygen
Industries Used inSteelmaking, shipbuilding
Principal Applications• Blast furnaces
Blown into a blast furnace
1910 – 1940sPrincipal Industrial GasesAcetylene, oxygen
Industries Used inRailroad, shipbuilding, military and naval forces
Principal Applications• Welding, cutting
Used for welding by shipbuilders
1910Established as Nippon Sanso Ltd.
1935Completed Japan’s first air separation plant
1918Established as Toyo Sanso K.K.
1946Established as Taiyo Sanso Co., Ltd. (Completed first production facility and commenced sales in 1947)
1953Diversified into the dissolved acetylene business; built the Osaka Plant (acetylene production facility)
1968Established Kashima Sanso Co., Ltd., to supply industrial gases to industrial complex (petrochemicals) in Kashima, Ibaraki Prefecture, a joint venture with Mitsubishi Petrochemical Co., Ltd. (currently Mitsubishi Chemical Corporation)
1920Opened the Ebara Plant in Ebara-gun, Tokyo
1953Commenced operations at the Kawasaki Plant, a comprehensive production facility, in Mizue-cho, Kawasaki
19Cofirsfacequ
1954Commenced production of liquid oxygen (first in Japan) and high-purity nitrogen and argon
19Opcur
Lama
Be
Nippon Sanso Corporation(1910 –2004)
Toyo Sanso K.K.(1919 –1994)
Taiyo Sanso Co., Ltd.(1946 –1994)

215
Gases
ns
furnace
1960sPrincipal Industrial GasesOxygen, nitrogen (inert gas)
Industries Used inPetrochemicals industryElectronics
Principal Applications• Refining
Used in the production of a wide range of petrochemicals
• Prevention of oxidation• Prevention of contamination
1970 – 1980sPrincipal Industrial GasesOxygen, nitrogen, argonXenon, krypton, neon, monosilane gas, others
Industries Used inSemiconductorsNonferrous metals, metalsAerospace, aircraft
Principal Applications• Various production processes • Plasma cutting• Smelting • Deoxidation• Emission spectrometry • Rocket fuel
a Sanso Co., Ltd., to ses to industrial
micals) in Kashima, joint venture with
mical Co., Ltd. hi Chemical
1975Began supplying specialty gases to Mitsubishi Electric Corporation’s Kumamoto Plant, diversifying into industrial gases for the electronics industry
1987Designated general supplier of specialty materials gases by Taiwan Semiconductor Manufacturing Company Limited (TSMC), marking the launch of full-scale supply of gases for semiconductor-related applications overseas
Established Kawaguchi Sogo Gas Center in joint venture with Showa Denko K.K., integrating the acetylene production and general-purpose gas filling operations of the two partners and forming Japan’s largest gas filling company
1994Signed merger agreement with Toyo Sanso K.K.
tions at the omprehensive in Mizue-cho,
1955Commenced operations at the Takasaki Plant, the first dedicated liquefied gas storage and filling facility in Japan, which featured state-of-the-art equipment
1971Established Shinyo Sanso Co., Ltd.; commenced operations at the Nitta Plant, a liquefied gas production facility
gen (first d argon
1964Opened first onsite plant (Shunan Plant; currently Shunan Sanso Co., Ltd.)
Launched production of semiconductor materials gases (neon) at Kawasaki Plant
Began full-scale imports and sales of helium gas
1967Completed and delivered Japan’s first food refrigerator “Magic Freeze” employing liquid nitrogen
1980Established Japan Oxygen, Inc., in the United States
1981Commenced full-scale production and sales of stainless steel insulated bottles
Opened Iwate Gas Center, its first onsite total gas center (TGC) supplying gases for use in semiconductor fabrication
1982Established National Oxygen Pte. Ltd. in Singapore in a joint venture with three local companies, notably National Iron and Steel Mills Ltd., Singapore’s only government-owned steelmaker
1Acpseb
Ddte
1971Completed the world’s first air separation plant employing liquefied natural gas (LNG) as refrigerant at Tokyo Liquefied Oxygen Co., Ltd.
T(
210
ttingnl
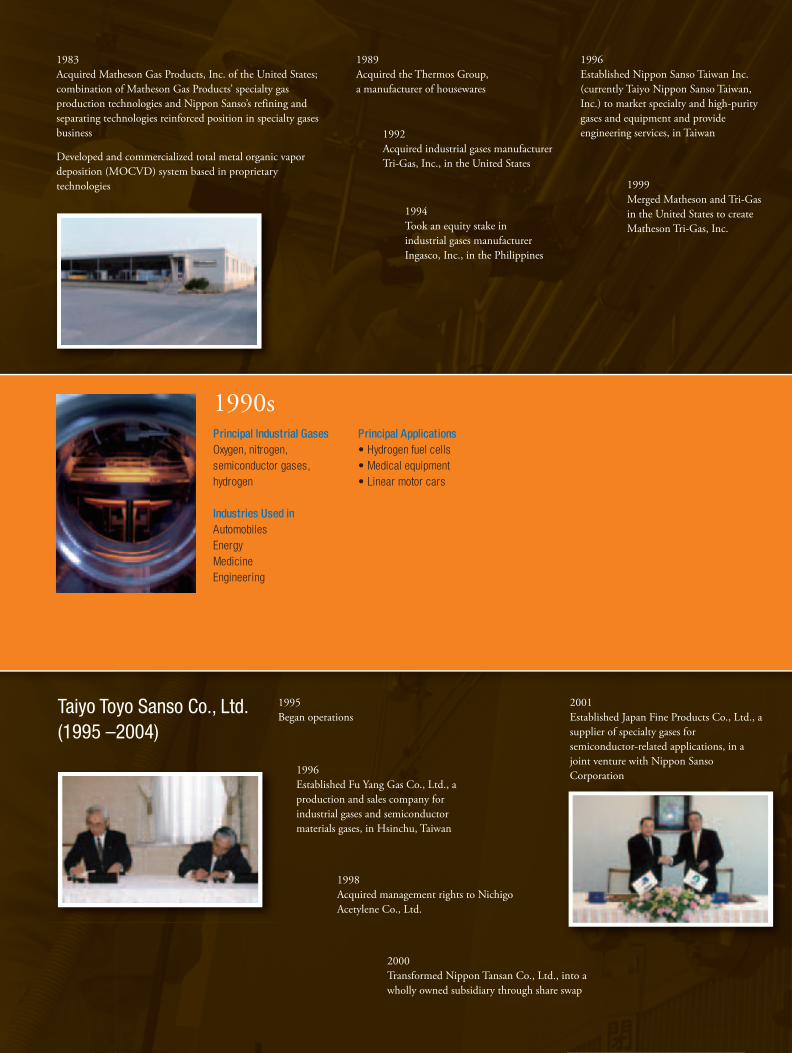
1990sPrincipal Industrial GasesOxygen, nitrogen, semiconductor gases, hydrogen
Industries Used inAutomobilesEnergyMedicineEngineering
Principal Applications• Hydrogen fuel cells• Medical equipment• Linear motor cars
2000 – pPrincipal Industrial Oxygen, nitrogen, se
Industries Used inElectronics, semico
Principal Applicatio• Production of light
1996Established Fu Yang Gas Co., Ltd., a production and sales company for industrial gases and semiconductor materials gases, in Hsinchu, Taiwan
2000Transformed Nippon Tansan Co., Ltd., into a wholly owned subsidiary through share swap
with
n ocal eel owned
1983Acquired Matheson Gas Products, Inc. of the United States; combination of Matheson Gas Products’ specialty gas production technologies and Nippon Sanso’s refining and separating technologies reinforced position in specialty gases business
Developed and commercialized total metal organic vapor deposition (MOCVD) system based in proprietary technologies
1989Acquired the Thermos Group, a manufacturer of housewares
1992Acquired industrial gases manufacturer Tri-Gas, Inc., in the United States
1994Took an equity stake in industrial gases manufacturer Ingasco, Inc., in the Philippines
1996Established Nippon Sanso Taiwan Inc. (currently Taiyo Nippon Sanso Taiwan, Inc.) to market specialty and high-purity gases and equipment and provide engineering services, in Taiwan
1999Merged Matheson and Tri-Gas in the United States to create Matheson Tri-Gas, Inc.
2001Established Japan Fispecialty gases for semjoint venture with Ta
2003Established ShangLtd. (currently ShGas Co., Ltd.) anand marketing co
1995Began operations
Taiyo Toyo Sanso Co., Ltd.(1995 –2004)
1998Acquired management rights to Nichigo Acetylene Co., Ltd.
2001Established Japan Fine Products Co., Ltd., a supplier of specialty gases for semiconductor-related applications, in a joint venture with Nippon Sanso Corporation
2003Established Taiyo ToCo., Ltd., an importfor semiconductor-re
Integrated Mitsubishbusiness (Kurosaki, plants) into TM AirKashima Sanso)

205
2000 – presentPrincipal Industrial GasesOxygen, nitrogen, semiconductor gases, helium
Industries Used inElectronics, semiconductors
Principal Applications• Production of light-emitting diodes (LEDs)
2001Established Japan Fine Products Co., Ltd., a supplier of specialty gases for semiconductor-related applications, in a joint venture with Taiyo Toyo Sanso Corporation
2003Established Shanghai Nippon Sanso Gas Co., Ltd. (currently Shanghai Taiyo Nippon Sanso Gas Co., Ltd.) an industrial gases manufacturing and marketing company, in China
TAIYO NIPPON SANSOCorporation(2004 –)
2003Established Taiyo Toyo Trading (Shanghai) Co., Ltd., an importer of equipment and gases for semiconductor-related applications
Integrated Mitsubishi Chemical’s separator gas business (Kurosaki, Mizushima and Yokkaichi plants) into TM Air Co., Ltd. (formerly Kashima Sanso)
2004Merged to form Taiyo Nippon Sanso Corporation (October 1)
2006Matheson Tri-Gas acquired Linweld Inc., a U.S. industrial gases production and marketing company
2007Launched helium production project at joint venture established with Air Products and Chemicals, Inc., in the U.S. state of Wyoming
2008Established Taiyo Nippon Sanso (China) Investment Co., Ltd., and Dalian Changxing Island Taiyo Nippon Sanso Gas Co., Ltd., in China
2009Matheson Tri-Gas acquired Valley National Gases LLC, the largest independent distributor of industrial gases in the United States
2009Launched joint monosilane production project with Evonik Degussa Japan Co., Ltd.
2010Matheson Tri-Gas acquired Western International Gas and Cylinders, Inc., a leading U.S. wholesale supplier of acetylene
Perception of the BusinessClimate in Key Markets
JapanThe steel, chemicals and electronics industries—the principal customer industries for piped gases continue to recover strongly, bolstered primarily by export demand from other parts of Asia. In the area of piped gases for the steel industry, one of the primary users of piped gases, export demand, partic-ularly from customers in the Republic of Korea and China, remains robust and steel exports at present are outpacing the previous peak (fiscal year 2008, when steel exports from Japan totaled 38.4 million tons), as a consequence of which domestic blast furnaces continue to operate at full capacity. In piped gases for the chemicals industry, there is a likelihood that over the long term the supply–demand bal-ance will weaken, owing to falling prices for the raw material naphtha accompanied by a slump in the markets for ethylene and other petrochemicals products, combined with the start of full-scale production at large-scale facilities in the Middle East and China. However, demand from China and other parts of Asia is recovering strongly, while sales to industrial complexes in Japan remain brisk. Although demand for bulk gases for small and medium-sized customers appears to be recovering, the pace of improvement is moderate, underlined by a lack of drive in domestic consumption, capital investment and construction-related demand. In the area of specialty materials gases for the electronics industry, market conditions are recovering steadily, reflecting improved production levels for semiconductors and liquid crystal displays (LCDs), together with the
commencement of production of large LCDs at the Green Front Sakai in Osaka in October 2009 and the emergence of new demand for use in solar cells. Of particular note, with demand for light-emitting diodes (LEDs) for PCs, televisions, signage and lighting applications and power semiconductors rising rapidly, we are benefiting from firm orders from domestic and overseas cus-tomers as Japan’s top manufacturer of gallium nitride (GaN) metal organic chemical vapor deposition (MOCVD) equipment. To bet-ter respond to customer needs, we are installing a new UR25K, a large-scale mass- production testing facility at our Tsukuba Laboratory, which conducts evaluations for customers, alongside the facility’s existing testing line.
North AmericaAlthough economic conditions in the United States continue to recover at a leisurely pace, we continue to expand the nature of our local operations, having long positioned North America as a stable growth market. In the six years since the merger that created Taiyo Nippon Sanso in 2004, we have invested approximately $1.6 billion, both in M&A deals and in capital expenditures. In fiscal year 2011, the compound annual growth rate (CAGR) for sales is expected to reach 14.9% and we have begun to realize significant synergies. We are also seeing
500,000
400,000
300,000
200,000
100,000
0
35,000
28,000
21,000
14,000
7,000
0
Total sales Operating income
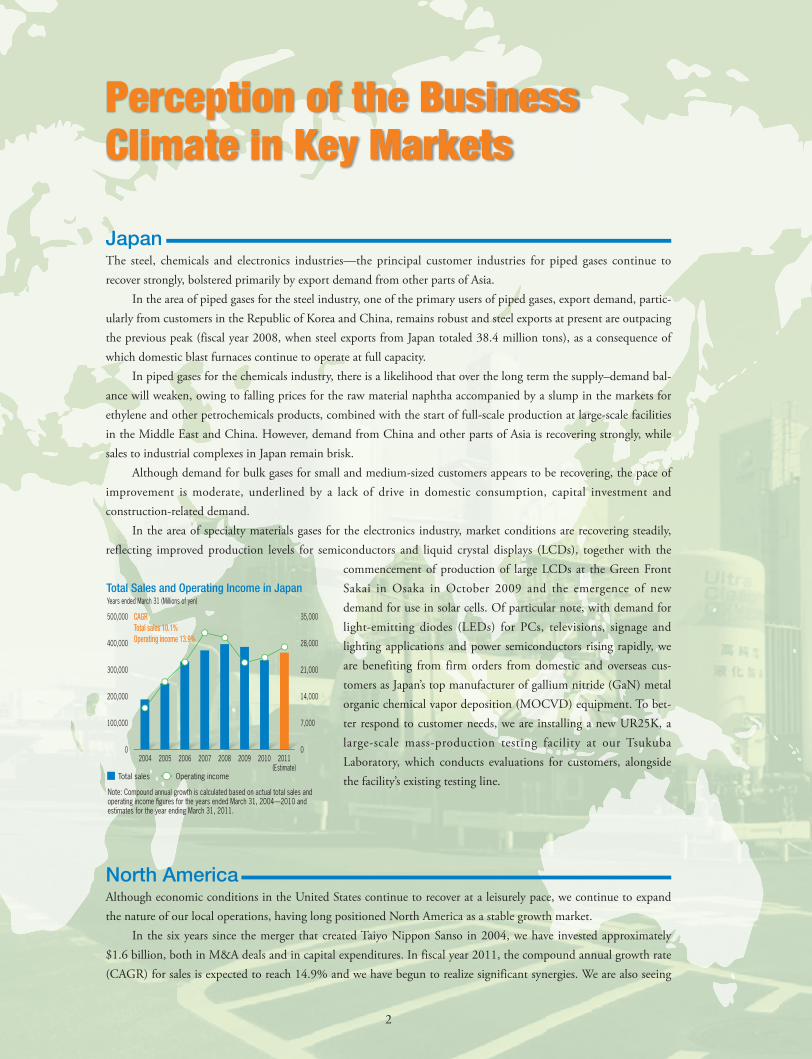
Years ended March 31 (Millions of yen)Total Sales and Operating Income in Japan
Note: Compound annual growth is calculated based on actual total sales and operating income figures for the years ended March 31, 2004—2010 and estimates for the year ending March 31, 2011.
2004 2005 2006 2007 2008 2009 2010 2011(Estimate)
CAGRTotal sales 10.1%Operating income 13.9%
2
大陽日酸_P2_22_0906.indd 2大陽日酸_P2_22_0906.indd 2 10.9.12 7:31:21 PM10.9.12 7:31:21 PM
substantial growth in operating income, in line with initial projec-tions. The sharp deterioration of economic conditions in fiscal year 2010 had a significant negative impact on our performance, but discounting this transitory episode our investments in the United States are yielding steady results. Looking ahead, we will work to enhance the efficiency of our U.S. operations and implement mea-sures, including building a new gas production facility, while also seeking out attractive M&A opportunities, as part of a strategy aimed at ensuring sustainable expansion and growth.
AsiaDespite a temporary interruption due to the collapse of Lehman Brothers, the economy of Asia, including China, and the region’s industrial gases market were quick to bounce back and resume rapid growth. Recognizing the strategic importance of Asia as the driving force behind global economic growth, we continue to place a high prior-ity on our operations in the region. While the market for industrial gases in Asia is still small in comparison with that of Japan or the United States, we have invested strategically in this tremendous growth potential market, approximately ¥25 bil-lion over the past six years, particularly in gas production facilities. To date, our ongoing investments in Asia have focused on capital expenditures designed to capitalize on growth in the market for general industrial gases, as well as other strategic efforts, shown in the list below. In recent years, we have focused on growing mar-kets such as steel, petrochemicals and other heavy industry markets, solar cells, and on electronics markets, including LCDs and LEDs, building on our established base to seek out major investment opportunities in a bid to drive the further expansion and growth of our Asian operations.
Major recent investments in AsiaSingapore: Built third air separation plant
Philippines: Built second air separation plant
China: Built air separation plant for Shanghai Taiyo Nippon Sanso Gas Co., Ltd.
Acquired Yangzhou Taiyo Nippon Sanso Semiconductor Gases Co., Ltd.
Invested in Taiyo Nippon Sanso Shenwei (Shanghai) Medical Gas Co., Ltd.
Took an equity stake in Shanghai Shenwei Gas Filling Co., Ltd.
South Korea: Established SKC Airgas Inc., joint venture with SKC
Projected investments in Asia in the near futureVietnam: Build air separation plant pursuant to agreement to supply industrial gases to a major steel maker (Ba Ria-Vung Tau, in southern
Vietnam)
Build air separation plant for joint venture with local gas company (Hanoi, northern Vietnam)
Philippines: Build air separation plant (Mindanao)
Build facility for specialty gases (Luzon)
China: Complete air separation plant for Dalian Changxing Island Harbor Industrial Zone
100,000
80,000
60,000
40,000
20,000
0
12,000
9,600
7,200
4,800
2,400
0
Total sales Operating income
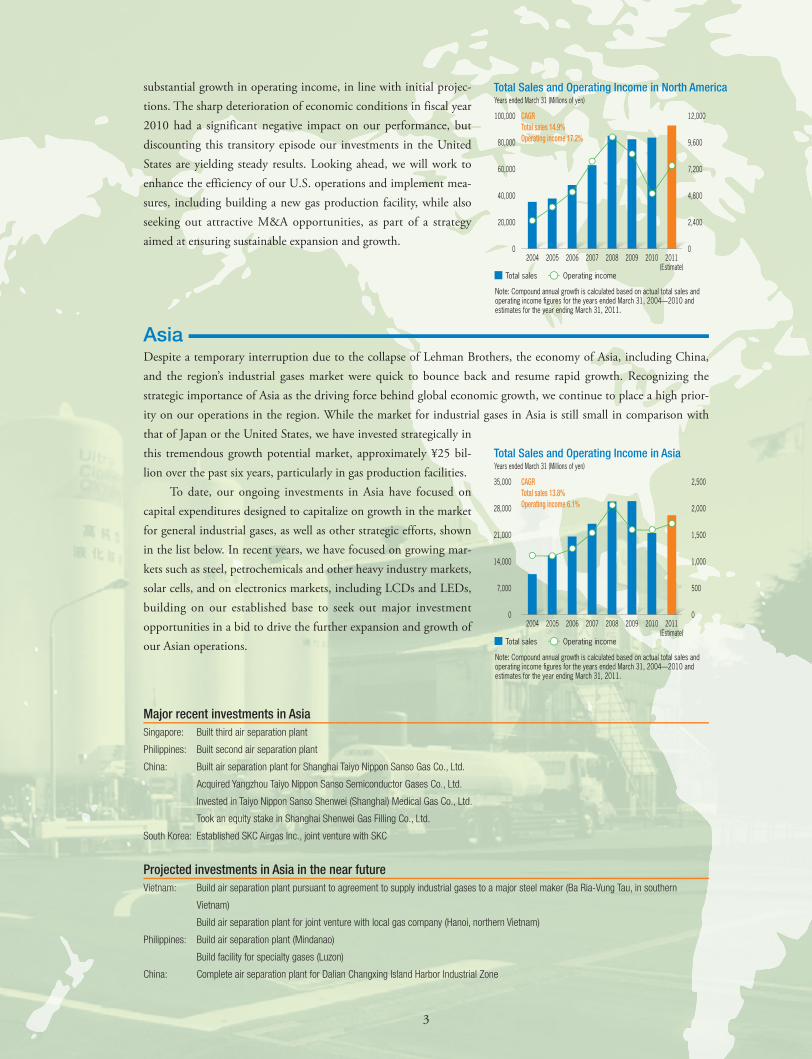
Years ended March 31 (Millions of yen)Total Sales and Operating Income in North America
Note: Compound annual growth is calculated based on actual total sales and operating income figures for the years ended March 31, 2004—2010 and estimates for the year ending March 31, 2011.
2004 2005 2006 2007 2008 2009 2010 2011(Estimate)
CAGRTotal sales 14.9%Operating income 17.2%
35,000
28,000
21,000
14,000
7,000
0
2,500
2,000
1,500
1,000
500
0
Total sales Operating income
Years ended March 31 (Millions of yen)Total Sales and Operating Income in Asia
Note: Compound annual growth is calculated based on actual total sales and operating income figures for the years ended March 31, 2004—2010 and estimates for the year ending March 31, 2011.
2004 2005 2006 2007 2008 2009 2010 2011(Estimate)
CAGRTotal sales 13.8%Operating income 6.1%
3
大陽日酸_P2_22_0906.indd 3大陽日酸_P2_22_0906.indd 3 10.9.12 7:31:25 PM10.9.12 7:31:25 PM
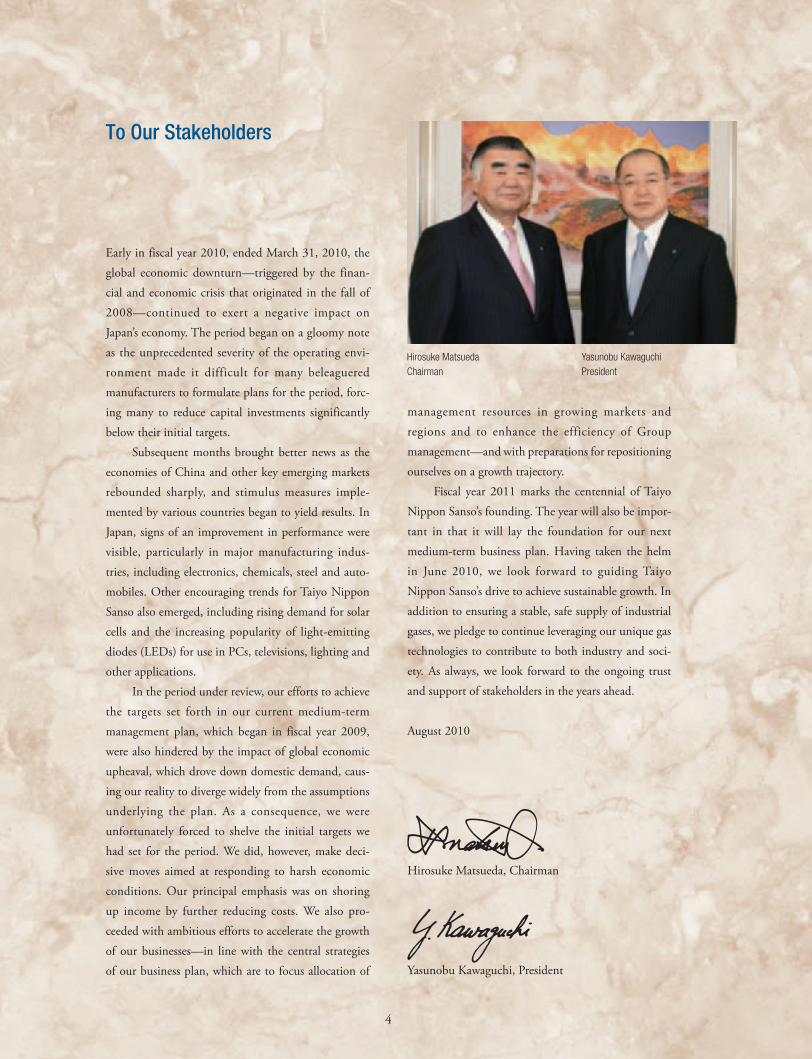
To Our Stakeholders
Hirosuke MatsuedaChairman
Yasunobu KawaguchiPresident
Early in fiscal year 2010, ended March 31, 2010, the global economic downturn—triggered by the finan-cial and economic crisis that originated in the fall of 2008—continued to exert a negative impact on Japan’s economy. The period began on a gloomy note as the unprecedented severity of the operating envi-ronment made it difficult for many beleaguered manufacturers to formulate plans for the period, forc-ing many to reduce capital investments significantly below their initial targets. Subsequent months brought better news as the economies of China and other key emerging markets rebounded sharply, and stimulus measures imple-mented by various countries began to yield results. In Japan, signs of an improvement in performance were visible, particularly in major manufacturing indus-tries, including electronics, chemicals, steel and auto-mobiles. Other encouraging trends for Taiyo Nippon Sanso also emerged, including rising demand for solar cells and the increasing popularity of light-emitting diodes (LEDs) for use in PCs, televisions, lighting and other applications. In the period under review, our efforts to achieve the targets set forth in our current medium-term management plan, which began in fiscal year 2009, were also hindered by the impact of global economic upheaval, which drove down domestic demand, caus-ing our reality to diverge widely from the assumptions underlying the plan. As a consequence, we were unfortunately forced to shelve the initial targets we had set for the period. We did, however, make deci-sive moves aimed at responding to harsh economic conditions. Our principal emphasis was on shoring up income by further reducing costs. We also pro-ceeded with ambitious efforts to accelerate the growth of our businesses—in line with the central strategies of our business plan, which are to focus allocation of
management resources in growing markets and regions and to enhance the efficiency of Group management—and with preparations for repositioning ourselves on a growth trajectory. Fiscal year 2011 marks the centennial of Taiyo Nippon Sanso’s founding. The year will also be impor-tant in that it will lay the foundation for our next medium-term business plan. Having taken the helm in June 2010, we look forward to guiding Taiyo Nippon Sanso’s drive to achieve sustainable growth. In addition to ensuring a stable, safe supply of industrial gases, we pledge to continue leveraging our unique gas technologies to contribute to both industry and soci-ety. As always, we look forward to the ongoing trust and support of stakeholders in the years ahead.
August 2010
Hirosuke Matsueda, Chairman
Yasunobu Kawaguchi, President
4
大陽日酸_P2_22_0906.indd 4大陽日酸_P2_22_0906.indd 4 10.9.12 7:31:26 PM10.9.12 7:31:26 PM
An Interview with the Chairman and the President
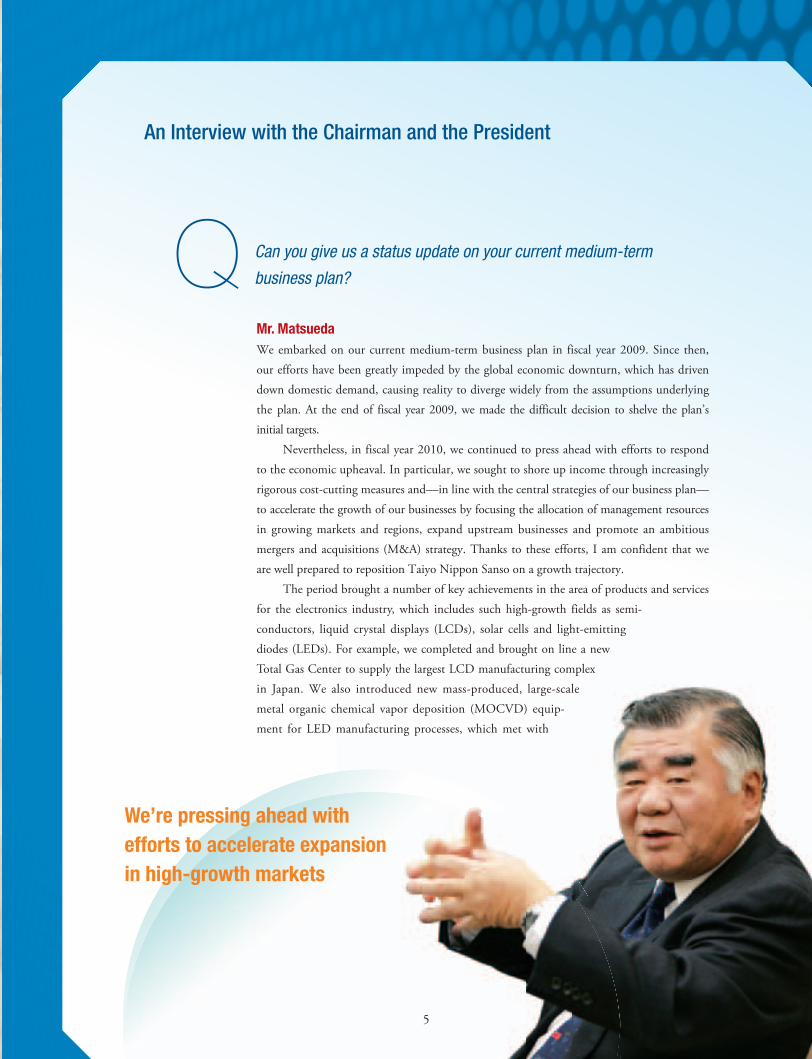
Mr. MatsuedaWe embarked on our current medium-term business plan in fiscal year 2009. Since then, our efforts have been greatly impeded by the global economic downturn, which has driven down domestic demand, causing reality to diverge widely from the assumptions underlying the plan. At the end of fiscal year 2009, we made the difficult decision to shelve the plan’s initial targets. Nevertheless, in fiscal year 2010, we continued to press ahead with efforts to respond to the economic upheaval. In particular, we sought to shore up income through increasingly rigorous cost-cutting measures and—in line with the central strategies of our business plan—to accelerate the growth of our businesses by focusing the allocation of management resources in growing markets and regions, expand upstream businesses and promote an ambitious mergers and acquisitions (M&A) strategy. Thanks to these efforts, I am confident that we are well prepared to reposition Taiyo Nippon Sanso on a growth trajectory. The period brought a number of key achievements in the area of products and services for the electronics industry, which includes such high-growth fields as semi-conductors, liquid crystal displays (LCDs), solar cells and light-emitting diodes (LEDs). For example, we completed and brought on line a new Total Gas Center to supply the largest LCD manufacturing complex in Japan. We also introduced new mass-produced, large-scale metal organic chemical vapor deposition (MOCVD) equip-ment for LED manufacturing processes, which met with
cs industry, which includes such high-growth fields as semi-uid crystal displays (LCDs), solar cells and light-emitting For example, we completed and brought on line a new r to supply the largest LCD manufacturing complex lso introduced new mass-produced, large-scalehemical vapor deposition (MOCVD) equip-manufacturing processes, which met with
Q Can you give us a status update on your current medium-term
business plan?
We’re pressing ahead withefforts to accelerate expansionin high-growth markets
5
大陽日酸_P2_22_0906.indd 5大陽日酸_P2_22_0906.indd 5 10.9.12 7:31:31 PM10.9.12 7:31:31 PM
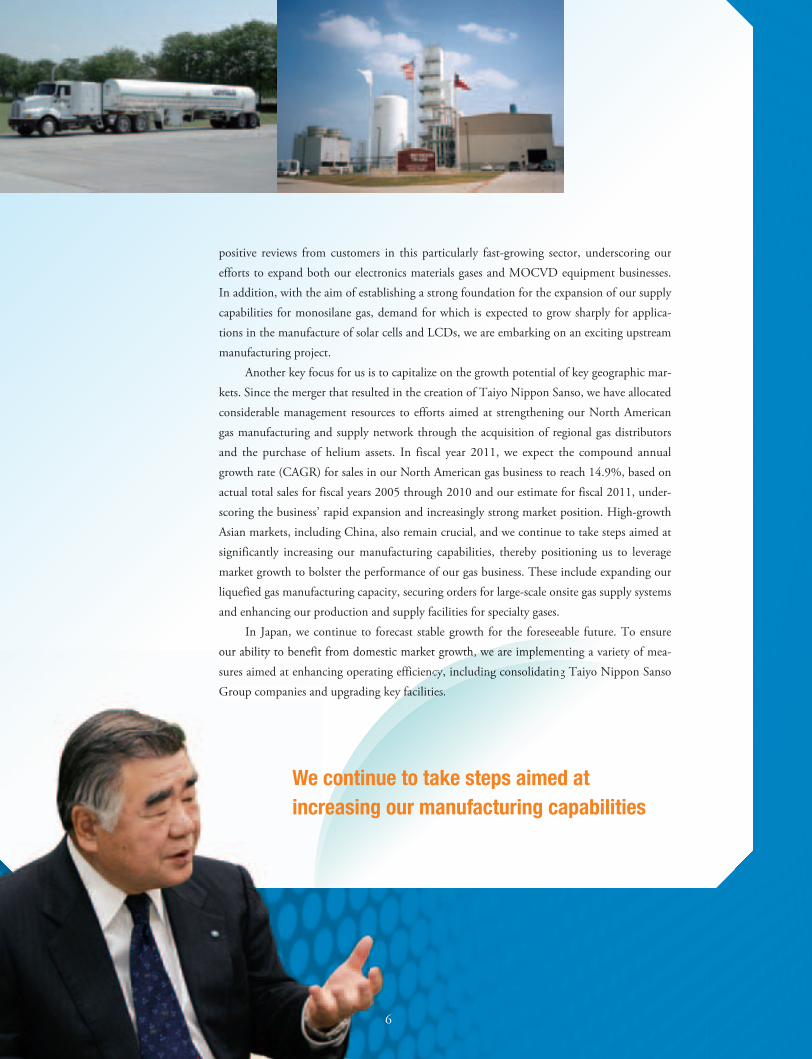
positive reviews from customers in this particularly fast-growing sector, underscoring our efforts to expand both our electronics materials gases and MOCVD equipment businesses. In addition, with the aim of establishing a strong foundation for the expansion of our supply capabilities for monosilane gas, demand for which is expected to grow sharply for applica-tions in the manufacture of solar cells and LCDs, we are embarking on an exciting upstream manufacturing project. Another key focus for us is to capitalize on the growth potential of key geographic mar-kets. Since the merger that resulted in the creation of Taiyo Nippon Sanso, we have allocated considerable management resources to efforts aimed at strengthening our North American gas manufacturing and supply network through the acquisition of regional gas distributors and the purchase of helium assets. In fiscal year 2011, we expect the compound annual growth rate (CAGR) for sales in our North American gas business to reach 14.9%, based on actual total sales for fiscal years 2005 through 2010 and our estimate for fiscal 2011, under-scoring the business’ rapid expansion and increasingly strong market position. High-growth Asian markets, including China, also remain crucial, and we continue to take steps aimed at significantly increasing our manufacturing capabilities, thereby positioning us to leverage market growth to bolster the performance of our gas business. These include expanding our liquefied gas manufacturing capacity, securing orders for large-scale onsite gas supply systems and enhancing our production and supply facilities for specialty gases. In Japan, we continue to forecast stable growth for the foreseeable future. To ensure our ability to benefit from domestic market growth, we are implementing a variety of mea-sures aimed at enhancing operating efficiency, including consolidating Taiyo Nippon Sanso Group companies and upgrading key facilities.
our ability to benefit from domestic market growth, wth, , we aarre iimmplememensures aimed at enhancing operating efficiency, ncy, incnclludidinng ccodingng connsosollidadatitinngGroup companies and upgrading key fay facilitieses.iesss...
We continue to take steps aimed atincreasing our manufacturing capabilities
6
大陽日酸_P2_22_0906.indd 6大陽日酸_P2_22_0906.indd 6 10.9.12 7:31:35 PM10.9.12 7:31:35 PM
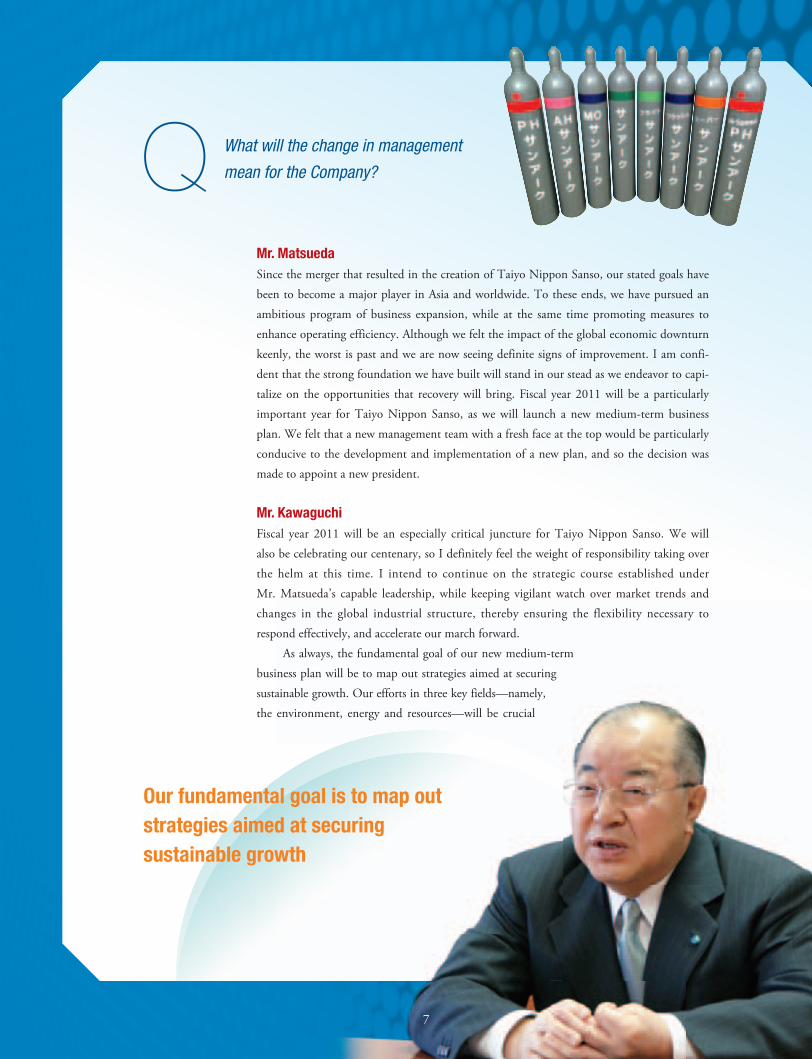
Mr. MatsuedaSince the merger that resulted in the creation of Taiyo Nippon Sanso, our stated goals have been to become a major player in Asia and worldwide. To these ends, we have pursued an ambitious program of business expansion, while at the same time promoting measures to enhance operating efficiency. Although we felt the impact of the global economic downturn keenly, the worst is past and we are now seeing definite signs of improvement. I am confi-dent that the strong foundation we have built will stand in our stead as we endeavor to capi-talize on the opportunities that recovery will bring. Fiscal year 2011 will be a particularly important year for Taiyo Nippon Sanso, as we will launch a new medium-term business plan. We felt that a new management team with a fresh face at the top would be particularly conducive to the development and implementation of a new plan, and so the decision was made to appoint a new president.
Mr. KawaguchiFiscal year 2011 will be an especially critical juncture for Taiyo Nippon Sanso. We will also be celebrating our centenary, so I definitely feel the weight of responsibility taking over the helm at this time. I intend to continue on the strategic course established under Mr. Matsueda’s capable leadership, while keeping vigilant watch over market trends and changes in the global industrial structure, thereby ensuring the flexibility necessary to respond effectively, and accelerate our march forward. As always, the fundamental goal of our new medium-term business plan will be to map out strategies aimed at securing sustainable growth. Our efforts in three key fields—namely, the environment, energy and resources—will be crucial
What will the change in management
mean for the Company?Q
Our fundamental goal is to map outstrategies aimed at securingsustainable growth
7
大陽日酸_P2_22_0906.indd 7大陽日酸_P2_22_0906.indd 7 10.9.12 7:31:38 PM10.9.12 7:31:38 PM
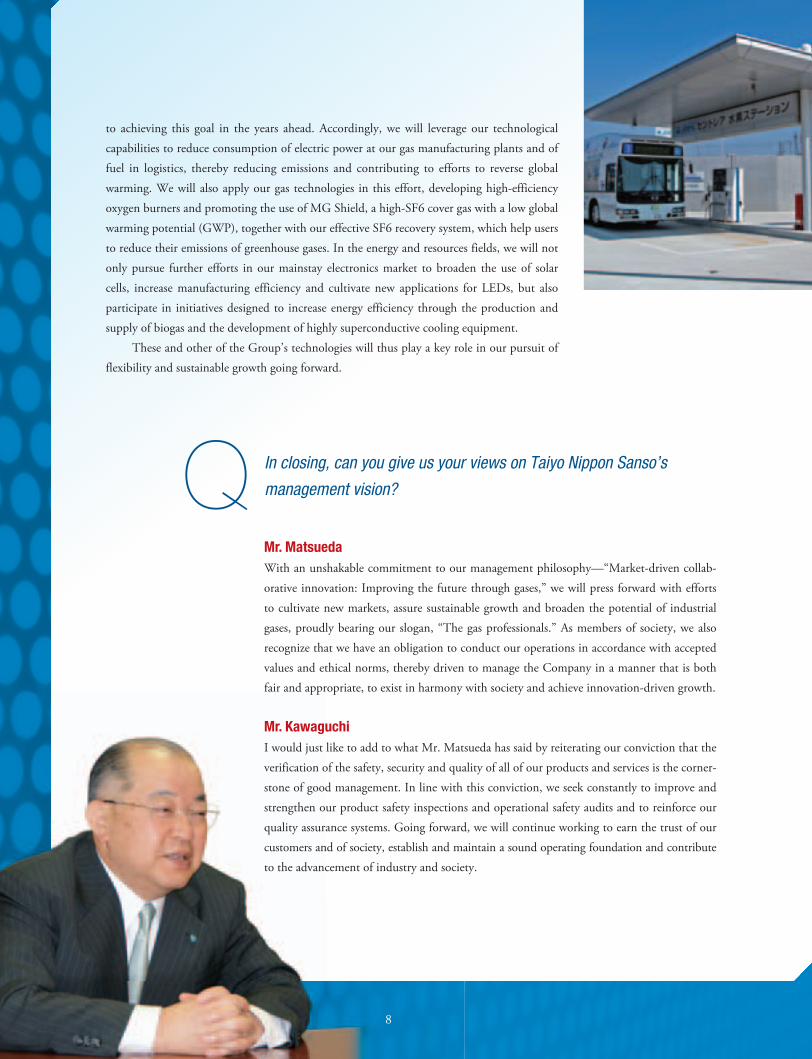
to achieving this goal in the years ahead. Accordingly, we will leverage our technological capabilities to reduce consumption of electric power at our gas manufacturing plants and of fuel in logistics, thereby reducing emissions and contributing to efforts to reverse global warming. We will also apply our gas technologies in this effort, developing high-efficiency oxygen burners and promoting the use of MG Shield, a high-SF6 cover gas with a low global warming potential (GWP), together with our effective SF6 recovery system, which help users to reduce their emissions of greenhouse gases. In the energy and resources fields, we will not only pursue further efforts in our mainstay electronics market to broaden the use of solar cells, increase manufacturing efficiency and cultivate new applications for LEDs, but also participate in initiatives designed to increase energy efficiency through the production and supply of biogas and the development of highly superconductive cooling equipment. These and other of the Group’s technologies will thus play a key role in our pursuit of flexibility and sustainable growth going forward.
Mr. MatsuedaWith an unshakable commitment to our management philosophy—“Market-driven collab-orative innovation: Improving the future through gases,” we will press forward with efforts to cultivate new markets, assure sustainable growth and broaden the potential of industrial gases, proudly bearing our slogan, “The gas professionals.” As members of society, we also recognize that we have an obligation to conduct our operations in accordance with accepted values and ethical norms, thereby driven to manage the Company in a manner that is both fair and appropriate, to exist in harmony with society and achieve innovation-driven growth.
Mr. KawaguchiI would just like to add to what Mr. Matsueda has said by reiterating our conviction that the verification of the safety, security and quality of all of our products and services is the corner-stone of good management. In line with this conviction, we seek constantly to improve and strengthen our product safety inspections and operational safety audits and to reinforce our quality assurance systems. Going forward, we will continue working to earn the trust of our customers and of society, establish and maintain a sound operating foundation and contribute to the advancement of industry and society.
In closing, can you give us your views on Taiyo Nippon Sanso’s
management vision?Q
8
大陽日酸_P2_22_0906.indd 8大陽日酸_P2_22_0906.indd 8 10.9.12 7:31:41 PM10.9.12 7:31:41 PM

Message from Keiichi Kiyota, Independent Outside Corporate Auditor
* Corporate auditors are thus the last bastion of responsibility in ensuring the effective
execution of duties by directors. The Tokyo Stock Exchange’s recently added provision
that listed companies appoint independent outside corporate auditors is a change that
will further strengthen this role.
1. Background to the appointment of independent
outside corporate auditors in Japan
To protect the interests of general (i.e., minority) share-holders, the Tokyo Stock Exchange requires companies listed on the exchange to secure independent directors and/or auditors who have no conflict of interest with general shareholders. I was appointed as an independent outside corporate auditor by Taiyo Nippon Sanso to fulfill this requirement.
2. The role of corporate auditors in Japan
Under Japan’s Companies Act, for companies having adopted the Company with Board of Auditors model, the execution of duties by directors is monitored and supervised by the Board of Directors and simultaneously audited by corporate auditors. While this system is often criticized for limiting the ability of corporate auditors to fulfill their responsibilities because it does not accord them voting rights on the Board of Directors, it is also greatly valued because it facilitates both effective supervi-sion of decision making by directors other than those directly involved in the process, and objective auditing by corporate auditors who are independent and thus have no conflict of interest.
While the term “auditor” is commonly used in English for corporate auditors in Japan, this does not capture the full extent of the auditor’s role. Corporate auditors not only audit the financial statements prepared by the direc-tors, but also monitor the decision-making process—accomplished through resolution of the Board of Directors or the ringi system, a system for proposal rati-fication common in Japan; supervise the discharge of duties by individual directors and inspect documentation pertaining to resolutions and decisions made by direc-tors, thus enabling them to comprehensively oversee the execution of duties by directors.* 3. Taiyo Nippon Sanso’s auditing system
Taiyo Nippon Sanso has four corporate auditors, all of whom are full time, which affords them adequate access
to internal information, the ability to interview/question directors and employees whenever necessary and other-wise aids their ability to fulfill their roles. Taiyo Nippon Sanso’s corporate auditors are also in a position to work closely with the Company’s Technological Affairs Division, which is responsible for managing technology risks; the Corporate Audit office, which is responsible for internal audits and reports directly to the president; and the General Administration Division and Corporate Administration Division, which have established and administer the Company’s system of internal controls.
In addition to safeguarding and further enhancing this open atmosphere, I will continue to value my indepen-dence from the directors and to reinforce my capacity to work with the independent public accountants in audit-ing the Company’s accounts, and to monitor, supervise and express opinions, as necessary, at important meetings, including those of the Board of Directors.
4. Future goals
By capitalizing on the skills, knowledge and experience gained as a corporate auditor over seven years, as a gradu-ate of New York University School of Law and as an officer in American, British and Japanese corporations, I pledge to continue devoting my best efforts to helping Taiyo Nippon Sanso meet the expectations of its general shareholders and other stakeholders. To this end, I will continue to support the Company, a globally active organization, in its endeavors to increase corporate value through appropriate management and sound expansion.
Keiichi KiyotaIndependent Outside Corporate Auditor
9
大陽日酸_P2_22_0906.indd 9大陽日酸_P2_22_0906.indd 9 10.9.12 7:31:43 PM10.9.12 7:31:43 PM
Notes: *1 Outside Director
Notes: *2 Outside Corporate Auditor
Board of Directors, Corporate Auditors and Corporate Officers
Board of Directors
ChairmanHirosuke Matsueda
PresidentYasunobu Kawaguchi
Executive Vice PresidentFumio Hara
Executive Directors/AdvisorsKonosuke OseHiroshi Taguchi
Senior Managing DirectorsMasashi YamashitaKen-ichi KasuyaToshio SatoShinji TanabeKunishi HazamaTadashige Maruyama
Managing DirectorsAkira ItoYoshikazu YamanoMasayuki TaninoYujiro IchiharaShigeru Amada
Executive DirectorsRyuichi Tomizawa *1
William J. Kroll
Corporate Auditors
Shigeto UmataniKiyoshi FujitaKeiichi Kiyota *2
Shigeru Koyama *2
Corporate Officers
Executive Corporate OfficersHiroshi KatsumataKinji MizunoeMasanori ZaimaShin-ichiro HiramineAkihiko UmekawaKeiki Ariga
Corporate OfficersMasakazu NaruoMasahiro ImagawaTetsuya NakayamaMasami SakaguchiSusumu NakaYoshihide KenmochiYuki HajikanoShigenobu SomayaJun IshikawaTakashi TatsumiMasahiro SakamotoTakashi FukanoMasahiko KitabatakeMikio YamaguchiHiroyuki TanizawaTadashi HigashinoAtsuhiro FujitaToshiaki YamazakiHiroshi Nagae
(As of June 29, 2010)
10
大陽日酸_P2_22_0906.indd 10大陽日酸_P2_22_0906.indd 10 10.9.12 7:31:44 PM10.9.12 7:31:44 PM

Putting Strategies into Action: Laying a Foundation forFuture GrowthTaiyo Nippon Sanso continues to promote ambitious strategies in line with four key goals:
• Accelerate profitable growth
• Promote globalization
• Pursue cost reductions
• Strengthen Group management
Taiyo Nippon Sanso has positioned fiscal year 2011 as a year for further reinforcing its operating founda-
tion in preparation for the launch of its next medium-term business plan. In this year’s special feature, we
look at three themes that will guide us as we endeavor to transform Taiyo Nippon Sanso into an entity
capable of sustainable, profitable growth, as well as how these themes fit with our basic business strategies.
Advance our environment, resource and energy businesses• Develop biogas refining units• Perfect new technologies for highly oriented carbon nanotubes• Foster hydroenergy businesses• Develop cryogenic systems for superconductive devices
Theme 3
Concentrate resources in growth markets• Expand sales of MOCVD equipment• Press ahead with monosilane gas production project• Pursue helium gas production projects
Theme 1
Enhance our position in promising geographic markets• Step up expansion of our North American gases business• Decisively build up our operations in Asia
Theme 2
Special Feature
11
大陽日酸_P2_22_0906.indd 11大陽日酸_P2_22_0906.indd 11 10.9.12 7:31:45 PM10.9.12 7:31:45 PM

Expand Sales of Gallium Nitride (GaN) MOCVD EquipmentThe increasing popularity of white LEDs in lighting is spurring demand for LEDs and, in turn, for gases used in LED manufacturing. In response to rising demand from LED manufacturers, who are investing actively to expand production capacity, we are capitalizing on our supply capabilities for these gases and our vertically integrated production system—which encompasses all aspects of production, from refining through to adsorption—and allocating man-agement resources to efforts aimed at reinforcing our electronic materials business, which includes metal organic chemical vapor deposition (MOCVD) equip-ment for use in LED and power semiconductor manufacturing. With the aim of increasing diode brightness without increasing power requirements, LED manu-facturers are working to develop chip technologies that facilitate the efficient conversion of power into light, as well as to keep manufacturing costs down. To manufacture high-brightness chips, we are focusing on controlling the volume and speed of gas injec-tion and use a three- layered gas flow system, minimizing defect rates and making it possible to ensure high qual-ity. We are also responding to the trend toward larger-diameter wafers and high-throuphput manufacturing systems, which increase the number of LEDs per batch and shorten the time required, thereby reducing manufacturing costs.
Concentrate resources in growth marketsTheme 1
Our share of the Japanese market for MOCVD equipment is currently in the area of 80%, and our MOCVD business boasts annual sales of approxi-mately ¥3.3 billion. In addition to sales in Japan, we also accept major orders for MOCVD equipment from the Republic of Korea, Taiwan and other overseas markets. We do not forecast a strong increase in sales overseas in fiscal year 2011, but we do expect overseas sales to increase to 40% of total MOCVD sales by fiscal year 2012 and anticipate annual sales rising to ¥10 billion in the near future. In late 2010, we expect to complete a state-of-the-art, large-scale mass pro-duction system for six- and eight-inch wafers—the first such system in the world.
Joint Monosilane Gas Production ProjectTo reinforce our position as a producer of gases for the electronics industry, we continue to promote an ambitious program of strategic investments both in Japan and overseas. In 2009, we announced the launch of a project with Evonik Degussa Japan Co., Ltd., an affiliate of Evonik Industries AG of
Special Feature
(Figures are for blue and other LED chips)Global Market for LED Chips
Unit prices for LEDlighting rise
Decreasing unit prices
12
大陽日酸_P2_22_0906.indd 12大陽日酸_P2_22_0906.indd 12 10.9.12 7:31:46 PM10.9.12 7:31:46 PM
Germany, to produce monosilane gas, which is used in the manufacture of semiconductor devices, liquid crystals displays (LCDs) and solar cells. Under the terms of the agreement, we will set up a joint venture with Evonik Degussa Japan in 2010 with a view to commencing operations in March 2011. Through this agreement, we aim to respond to growing global demand for monosilane gas. The joint venture will employ an innovative process whereby a thin silicon film is produced on a substrate for a sili-con wafer, LCDs or solar cell from a silicon-based precursor using chemical vapor deposition (CVD). The agreement calls for construction of a plant with an annual production capacity of 1,000 tons in Yokkaichi, Mie Prefecture. Together with silane gas filling subsidiary Yangzhou Taiyo Nippon Sanso Semiconductor Gases Co., Ltd. in China, the new joint venture will play a crucial role in ensuring a stable supply of products in the region.
Expand Helium Gas Sales Through Major ProjectsHelium gas is used in a wide range of applications, including the fabrication of semiconductor devices and LCDs for electronics industries and the manufac-ture of optical fibers, while liquid helium is needed as
a coolant for magnetic resonance imaging (MRI) devices. Despite the importance of helium, however, supplies worldwide are extremely limited. In 2006, we purchased the helium gas business of the former BOC Group plc, as a result of which we gained BOC’s helium source contracts and other related assets in the United States, Russia and Poland. Capitalizing on our newly acquired position as one of only six companies in the world with rights to conduct transactions directly with major helium producers, we designated our helium business as a key growth driver. In 2007, subsidiary Matheson Tri-Gas, Inc., formed a joint venture with Air Products and Chemicals, Inc., of the United States, thereby estab-lishing itself as a helium manufacturer, and resolved to begin production at a new helium plant in the American state of Wyoming in 2012. With the aim of securing new sources of helium in the United States and further strengthening our position as a top supplier in Japan, we recently commenced helium sales in China. Acting through Matheson Tri-Gas, we signed a long-term helium supply agreement with Jiyang Technology & Development Co., Ltd., China’s largest independent helium distributor. We also signed a helium supply agreement with Jinhong Gas Co., Ltd., of Jiangsu Province, which is building a new helium filling base. In spring 2010, we acquired former helium customer K-Air Gases India Private Limited, which was subsequently renamed Matheson K-Air Gases India Private Limited, thereby enabling us to expand helium operations in India.
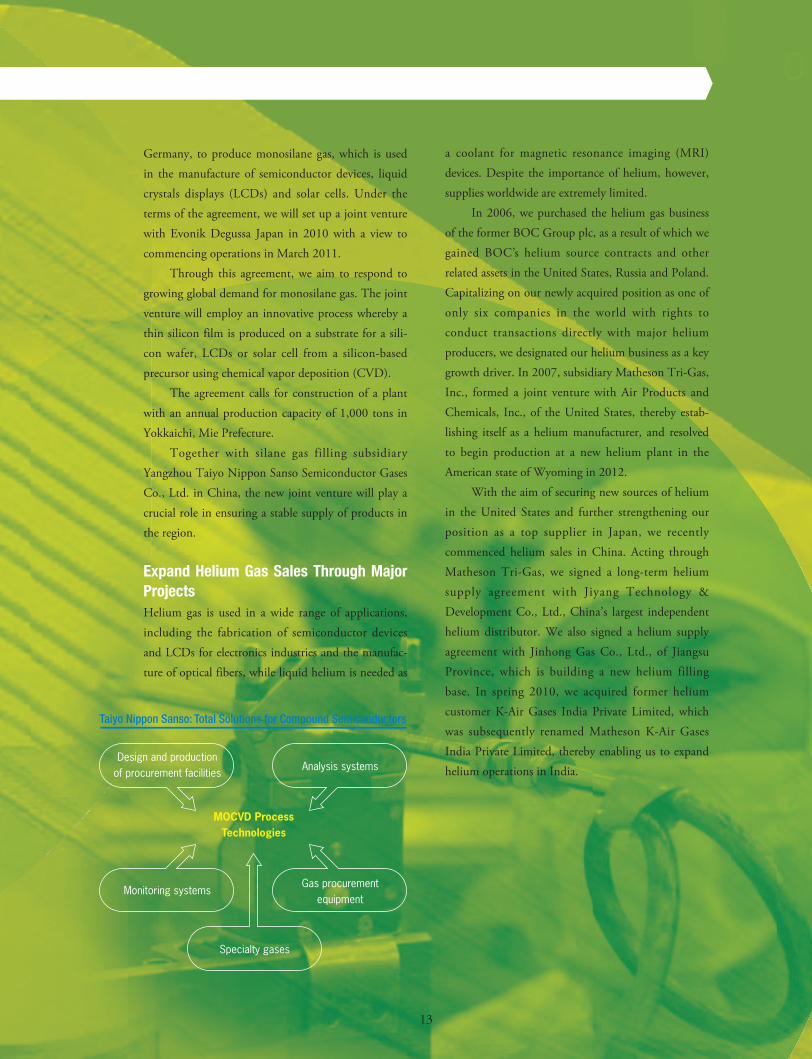
Taiyo Nippon Sanso: Total Solutions for Compound Semiconductors
MOCVD ProcessTechnologies
Analysis systems
Specialty gases
Design and productionof procurement facilities
Gas procurementequipment
Monitoring systems
13
大陽日酸_P2_22_0906.indd 13大陽日酸_P2_22_0906.indd 13 10.9.12 7:31:54 PM10.9.12 7:31:54 PM
Special Feature
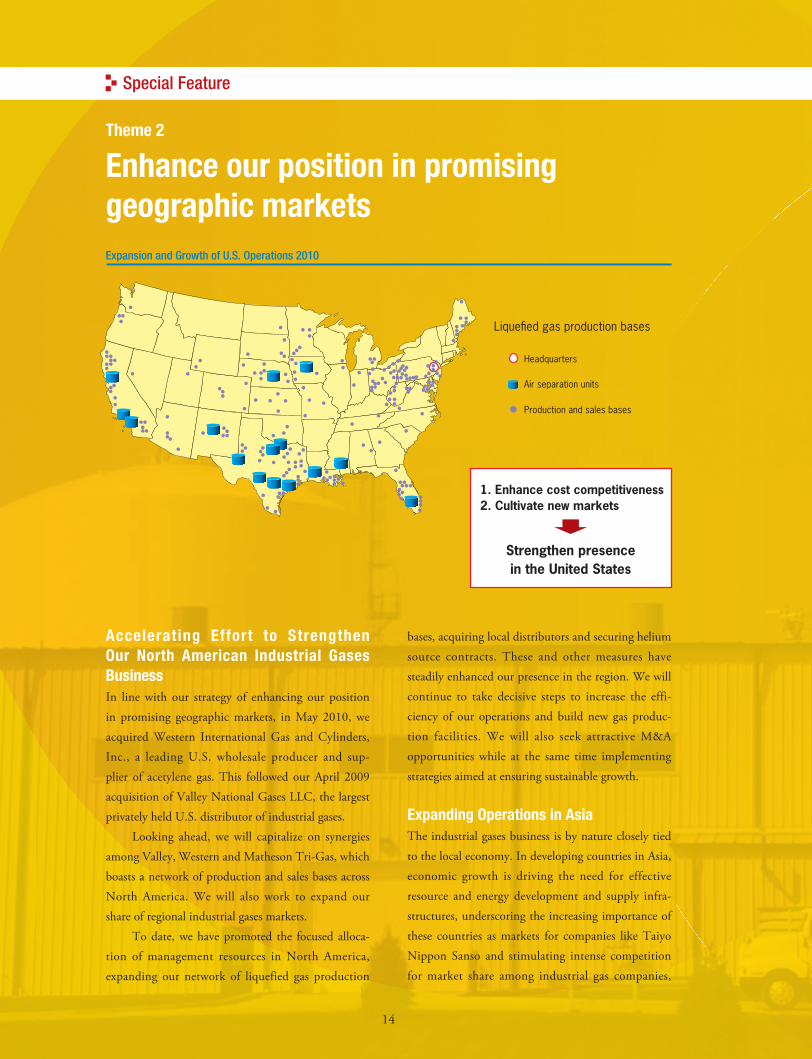
Accelerating Effort to Strengthen Our North American Industrial Gases BusinessIn line with our strategy of enhancing our position in promising geographic markets, in May 2010, we acquired Western International Gas and Cylinders, Inc., a leading U.S. wholesale producer and sup-plier of acetylene gas. This followed our April 2009 acquisition of Valley National Gases LLC, the largest privately held U.S. distributor of industrial gases. Looking ahead, we will capitalize on synergies among Valley, Western and Matheson Tri-Gas, which boasts a network of production and sales bases across North America. We will also work to expand our share of regional industrial gases markets. To date, we have promoted the focused alloca-tion of management resources in North America, expanding our network of liquefied gas production
Enhance our position in promising geographic markets
Theme 2
bases, acquiring local distributors and securing helium source contracts. These and other measures have steadily enhanced our presence in the region. We will continue to take decisive steps to increase the effi-ciency of our operations and build new gas produc-tion facilities. We will also seek attractive M&A opportunities while at the same time implementing strategies aimed at ensuring sustainable growth. Expanding Operations in AsiaThe industrial gases business is by nature closely tied to the local economy. In developing countries in Asia, economic growth is driving the need for effective resource and energy development and supply infra-structures, underscoring the increasing importance of these countries as markets for companies like Taiyo Nippon Sanso and stimulating intense competition for market share among industrial gas companies,
Expansion and Growth of U.S. Operations 2010
Liquefied gas production bases
1. Enhance cost competitiveness2. Cultivate new markets
Strengthen presencein the United States
Air separation units
Headquarters
Production and sales bases
14
大陽日酸_P2_22_0906.indd 14大陽日酸_P2_22_0906.indd 14 10.9.12 7:32:01 PM10.9.12 7:32:01 PM
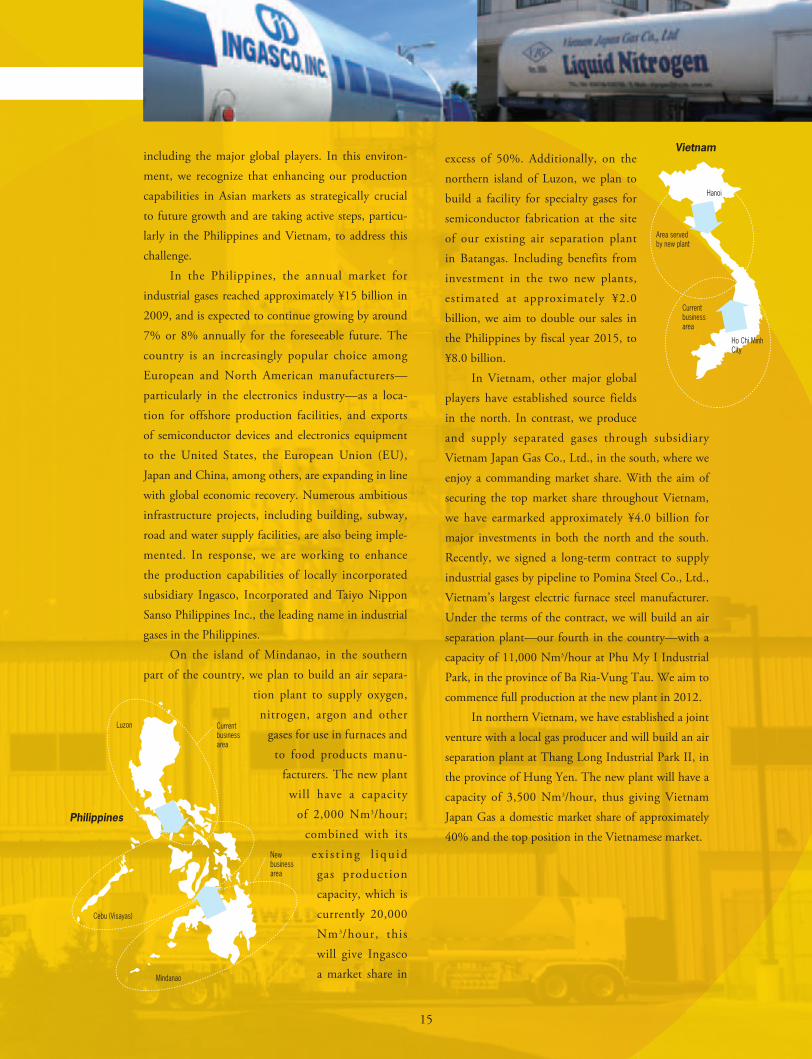
including the major global players. In this environ-ment, we recognize that enhancing our production capabilities in Asian markets as strategically crucial to future growth and are taking active steps, particu-larly in the Philippines and Vietnam, to address this challenge. In the Philippines, the annual market for industrial gases reached approximately ¥15 billion in 2009, and is expected to continue growing by around 7% or 8% annually for the foreseeable future. The country is an increasingly popular choice among European and North American manufacturers— particularly in the electronics industry—as a loca-tion for offshore production facilities, and exports of semiconductor devices and electronics equipment to the United States, the European Union (EU), Japan and China, among others, are expanding in line with global economic recovery. Numerous ambitious infrastructure projects, including building, subway, road and water supply facilities, are also being imple-mented. In response, we are working to enhance the production capabilities of locally incorporated subsidiary Ingasco, Incorporated and Taiyo Nippon Sanso Philippines Inc., the leading name in industrial gases in the Philippines. On the island of Mindanao, in the southern part of the country, we plan to build an air separa-
tion plant to supply oxygen, nitrogen, argon and other
gases for use in furnaces and to food products manu-
facturers. The new plant will have a capacity
of 2,000 Nm3/hour; combined with its
e x i s t i ng l i qu id gas production capacity, which is currently 20,000 Nm3/hour, this will give Ingasco a market share in
excess of 50%. Additionally, on the northern island of Luzon, we plan to build a facility for specialty gases for semiconductor fabrication at the site of our existing air separation plant in Batangas. Including benefits from investment in the two new plants, estimated at approximately ¥2.0 billion, we aim to double our sales in the Philippines by fiscal year 2015, to ¥8.0 billion. In Vietnam, other major global players have established source fields in the north. In contrast, we produce and supply separated gases through subsidiary Vietnam Japan Gas Co., Ltd., in the south, where we enjoy a commanding market share. With the aim of securing the top market share throughout Vietnam, we have earmarked approximately ¥4.0 billion for major investments in both the north and the south. Recently, we signed a long-term contract to supply industrial gases by pipeline to Pomina Steel Co., Ltd., Vietnam’s largest electric furnace steel manufacturer. Under the terms of the contract, we will build an air separation plant—our fourth in the country—with a capacity of 11,000 Nm3/hour at Phu My I Industrial Park, in the province of Ba Ria-Vung Tau. We aim to commence full production at the new plant in 2012. In northern Vietnam, we have established a joint venture with a local gas producer and will build an air separation plant at Thang Long Industrial Park II, in the province of Hung Yen. The new plant will have a capacity of 3,500 Nm3/hour, thus giving Vietnam Japan Gas a domestic market share of approximately 40% and the top position in the Vietnamese market.
Philippines
Luzon
Cebu (Visayas)
Mindanao
Currentbusinessarea
Newbusinessarea
Vietnam
Area servedby new plant
Currentbusinessarea
Hanoi
Ho Chi MinhCity
15
大陽日酸_P2_22_0906.indd 15大陽日酸_P2_22_0906.indd 15 10.9.12 7:32:07 PM10.9.12 7:32:07 PM
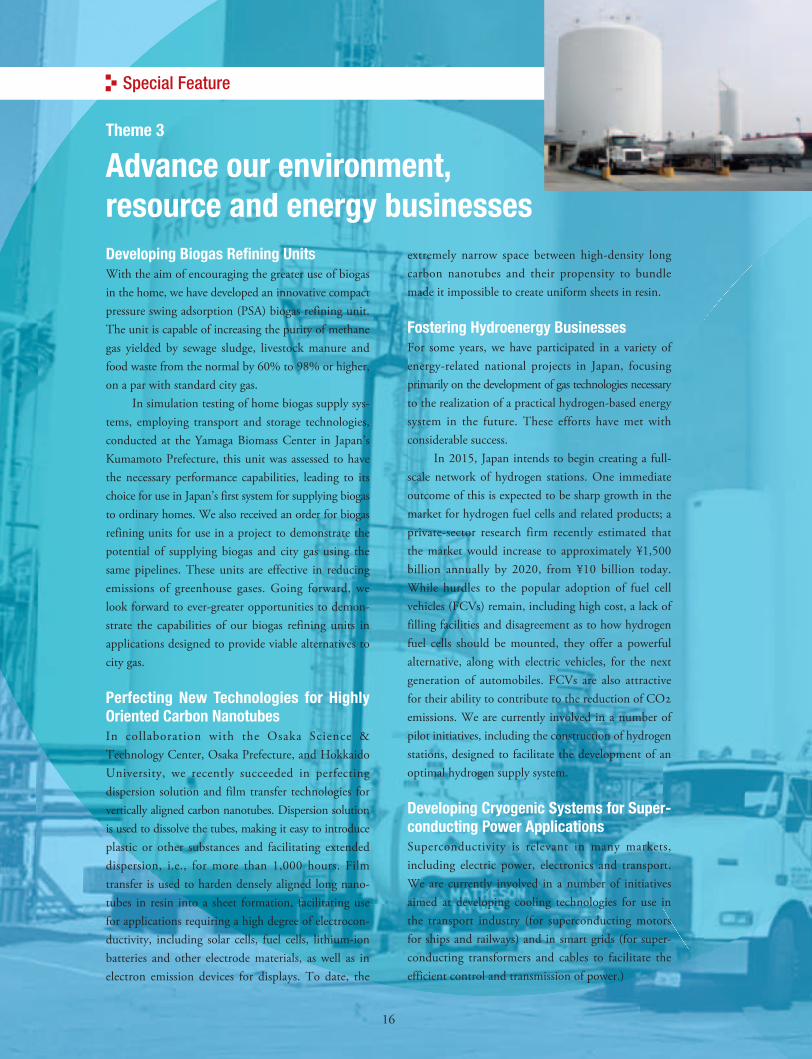
Developing Biogas Refining UnitsWith the aim of encouraging the greater use of biogas in the home, we have developed an innovative compact pressure swing adsorption (PSA) biogas refining unit. The unit is capable of increasing the purity of methane gas yielded by sewage sludge, livestock manure and food waste from the normal by 60% to 98% or higher, on a par with standard city gas. In simulation testing of home biogas supply sys-tems, employing transport and storage technologies, conducted at the Yamaga Biomass Center in Japan’s Kumamoto Prefecture, this unit was assessed to have the necessary performance capabilities, leading to its choice for use in Japan’s first system for supplying biogas to ordinary homes. We also received an order for biogas refining units for use in a project to demonstrate the potential of supplying biogas and city gas using the same pipelines. These units are effective in reducing emissions of greenhouse gases. Going forward, we look forward to ever-greater opportunities to demon-strate the capabilities of our biogas refining units in applications designed to provide viable alternatives to city gas.
Perfecting New Technologies for Highly Oriented Carbon NanotubesIn collaboration with the Osaka Science & Technology Center, Osaka Prefecture, and Hokkaido University, we recently succeeded in perfecting dispersion solution and film transfer technologies for vertically aligned carbon nanotubes. Dispersion solution is used to dissolve the tubes, making it easy to introduce plastic or other substances and facilitating extended dispersion, i.e., for more than 1,000 hours. Film transfer is used to harden densely aligned long nano-tubes in resin into a sheet formation, facilitating use for applications requiring a high degree of electrocon-ductivity, including solar cells, fuel cells, lithium-ion batteries and other electrode materials, as well as in electron emission devices for displays. To date, the
Advance our environment,resource and energy businesses
Theme 3
extremely narrow space between high-density long carbon nanotubes and their propensity to bundle made it impossible to create uniform sheets in resin.
Fostering Hydroenergy BusinessesFor some years, we have participated in a variety of energy-related national projects in Japan, focusing primarily on the development of gas technologies necessary to the realization of a practical hydrogen-based energy system in the future. These efforts have met with considerable success. In 2015, Japan intends to begin creating a full-scale network of hydrogen stations. One immediate outcome of this is expected to be sharp growth in the market for hydrogen fuel cells and related products; a private-sector research firm recently estimated that the market would increase to approximately ¥1,500 billion annually by 2020, from ¥10 billion today. While hurdles to the popular adoption of fuel cell vehicles (FCVs) remain, including high cost, a lack of filling facilities and disagreement as to how hydrogen fuel cells should be mounted, they offer a powerful alternative, along with electric vehicles, for the next generation of automobiles. FCVs are also attractive for their ability to contribute to the reduction of CO emissions. We are currently involved in a number of pilot initiatives, including the construction of hydrogen stations, designed to facilitate the development of an optimal hydrogen supply system.
Developing Cryogenic Systems for Super-conducting Power ApplicationsSuperconductivity is relevant in many markets, including electric power, electronics and transport. We are currently involved in a number of initiatives aimed at developing cooling technologies for use in the transport industry (for superconducting motors for ships and railways) and in smart grids (for super-conducting transformers and cables to facilitate the efficient control and transmission of power.)
Special Feature
16
大陽日酸_P2_22_0906.indd 16大陽日酸_P2_22_0906.indd 16 10.9.12 7:32:12 PM10.9.12 7:32:12 PM
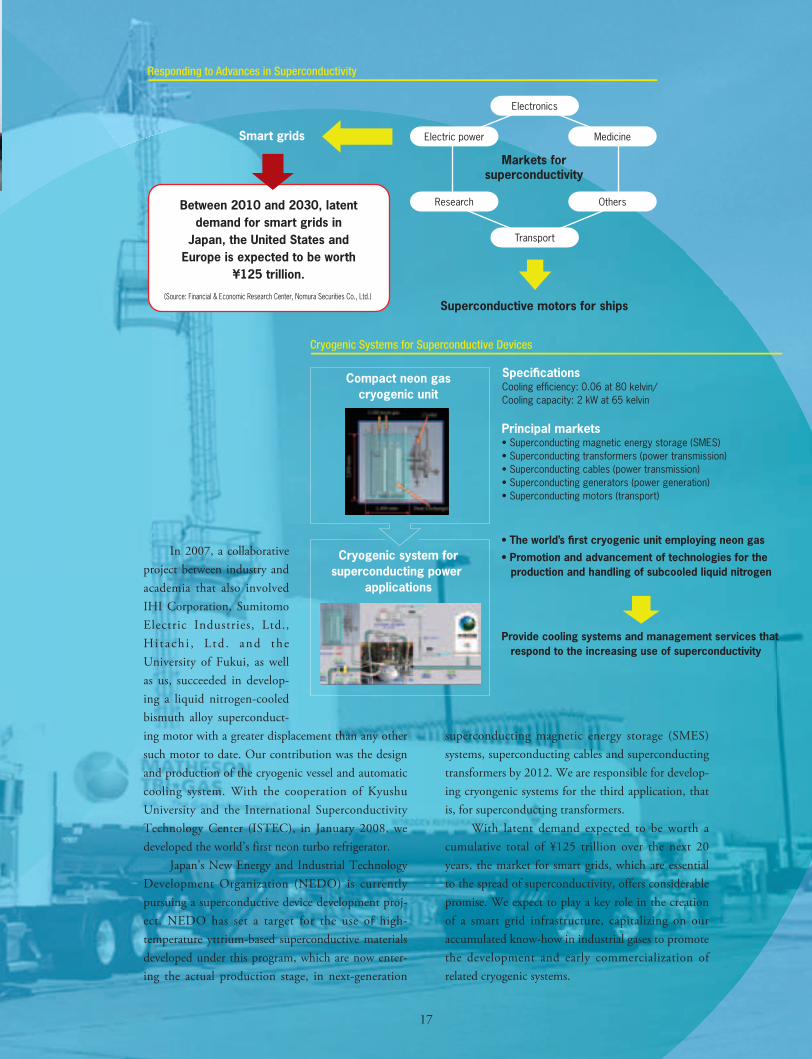
In 2007, a collaborative project between industry and academia that also involved IHI Corporation, Sumitomo Electric Industries, Ltd., Hi tach i , L td . and the University of Fukui, as well as us, succeeded in develop-ing a liquid nitrogen-cooled bismuth alloy superconduct-ing motor with a greater displacement than any other such motor to date. Our contribution was the design and production of the cryogenic vessel and automatic cooling system. With the cooperation of Kyushu University and the International Superconductivity Technology Center (ISTEC), in January 2008, we developed the world’s first neon turbo refrigerator. Japan’s New Energy and Industrial Technology Development Organization (NEDO) is currently pursuing a superconductive device development proj-ect. NEDO has set a target for the use of high- temperature yttrium-based superconductive materials developed under this program, which are now enter-ing the actual production stage, in next-generation
superconducting magnetic energy storage (SMES) systems, superconducting cables and superconducting transformers by 2012. We are responsible for develop-ing cryongenic systems for the third application, that is, for superconducting transformers. With latent demand expected to be worth a cumulative total of ¥125 trillion over the next 20 years, the market for smart grids, which are essential to the spread of superconductivity, offers considerable promise. We expect to play a key role in the creation of a smart grid infrastructure, capitalizing on our accumulated know-how in industrial gases to promote the development and early commercialization of related cryogenic systems.
Responding to Advances in Superconductivity
Smart grids
Superconductive motors for ships
Electronics
Transport
MedicineElectric power
OthersResearch
Markets forsuperconductivity
Between 2010 and 2030, latent demand for smart grids in
Japan, the United States and Europe is expected to be worth
¥125 trillion.
(Source: Financial & Economic Research Center, Nomura Securities Co., Ltd.)
Cryogenic Systems for Superconductive Devices
SpecificationsCooling efficiency: 0.06 at 80 kelvin/Cooling capacity: 2 kW at 65 kelvin
Cryogenic system forsuperconducting power
applications
Compact neon gascryogenic unit
Principal markets
17
大陽日酸_P2_22_0906.indd 17大陽日酸_P2_22_0906.indd 17 10.9.12 7:32:19 PM10.9.12 7:32:19 PM
Electronics-Related Business
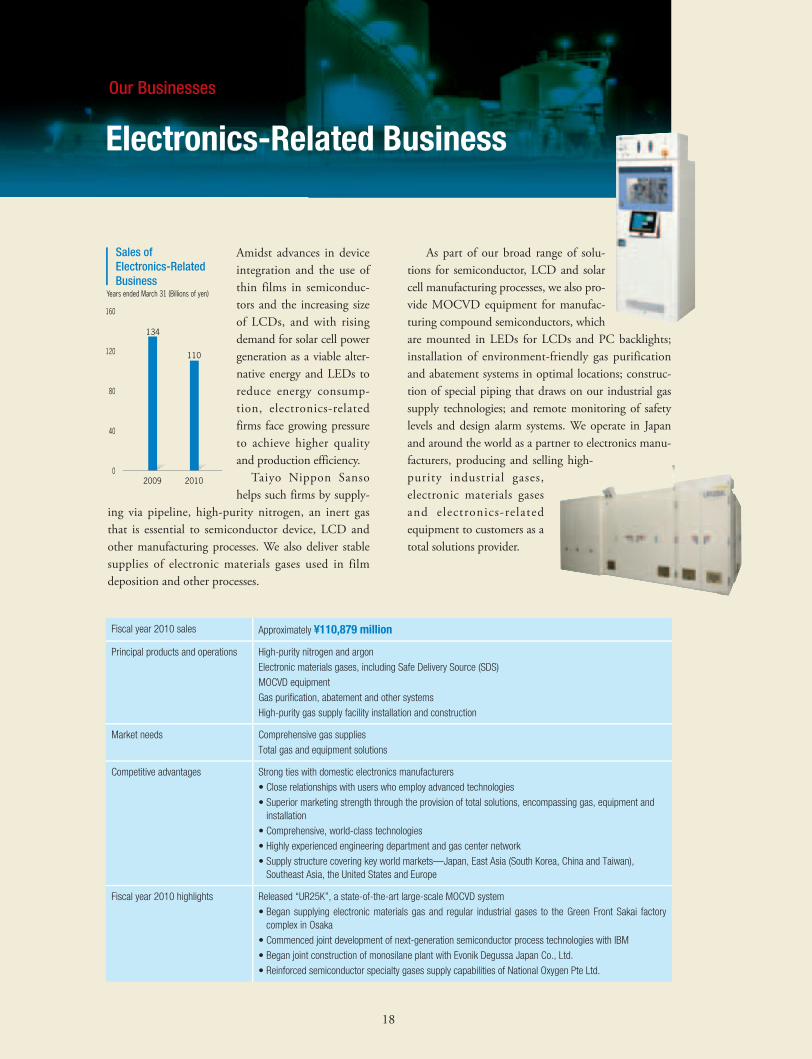
Amidst advances in device integration and the use of thin films in semiconduc-tors and the increasing size of LCDs, and with rising demand for solar cell power generation as a viable alter-native energy and LEDs to reduce energy consump-tion, electronics-related firms face growing pressure to achieve higher quality and production efficiency. Taiyo Nippon Sanso helps such firms by supply-
ing via pipeline, high-purity nitrogen, an inert gas that is essential to semiconductor device, LCD and other manufacturing processes. We also deliver stable supplies of electronic materials gases used in film deposition and other processes.
As part of our broad range of solu-tions for semiconductor, LCD and solar cell manufacturing processes, we also pro-vide MOCVD equipment for manufac-turing compound semiconductors, which are mounted in LEDs for LCDs and PC backlights; installation of environment-friendly gas purification and abatement systems in optimal locations; construc-tion of special piping that draws on our industrial gas supply technologies; and remote monitoring of safety levels and design alarm systems. We operate in Japan and around the world as a partner to electronics manu-facturers, producing and selling high-purity industrial gases, electronic materials gases and electronics-related equipment to customers as a total solutions provider.
Our Businesses
Fiscal year 2010 sales Approximately ¥110,879 million
Principal products and operations High-purity nitrogen and argon
Electronic materials gases, including Safe Delivery Source (SDS)
MOCVD equipment
Gas purification, abatement and other systems
High-purity gas supply facility installation and construction
Market needs Comprehensive gas supplies
Total gas and equipment solutions
Competitive advantages Strong ties with domestic electronics manufacturers
• Close relationships with users who employ advanced technologies
• Superior marketing strength through the provision of total solutions, encompassing gas, equipment and installation
• Comprehensive, world-class technologies
• Highly experienced engineering department and gas center network
• Supply structure covering key world markets—Japan, East Asia (South Korea, China and Taiwan), Southeast Asia, the United States and Europe
Fiscal year 2010 highlights Released “UR25K”, a state-of-the-art large-scale MOCVD system
• Began supplying electronic materials gas and regular industrial gases to the Green Front Sakai factory complex in Osaka
• Commenced joint development of next-generation semiconductor process technologies with IBM
• Began joint construction of monosilane plant with Evonik Degussa Japan Co., Ltd.
• Reinforced semiconductor specialty gases supply capabilities of National Oxygen Pte Ltd.
160
120
80
40
0
Years ended March 31 (Billions of yen)
2009 2010
Sales of Electronics-RelatedBusiness
134
110
18
大陽日酸_P2_22_0906.indd 18大陽日酸_P2_22_0906.indd 18 10.9.12 7:32:25 PM10.9.12 7:32:25 PM
Gas Business
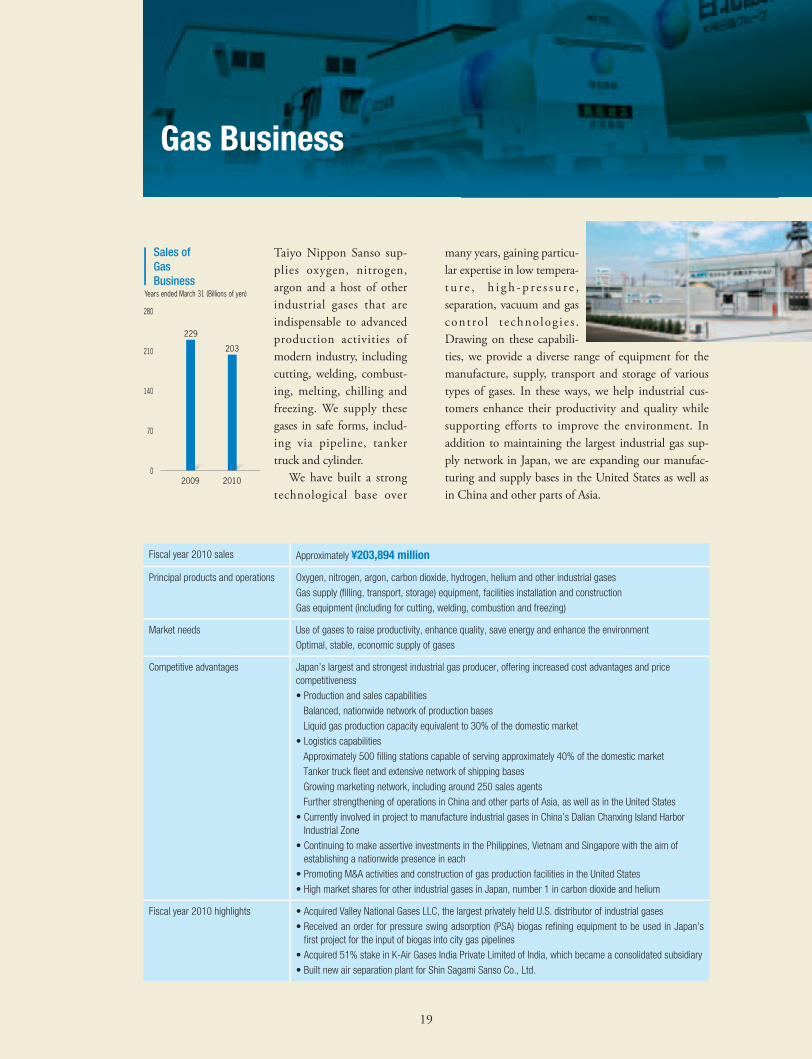
Taiyo Nippon Sanso sup-plies oxygen, nitrogen, argon and a host of other industrial gases that are indispensable to advanced production activities of modern industry, including cutting, welding, combust-ing, melting, chilling and freezing. We supply these gases in safe forms, includ-ing via pipeline, tanker truck and cylinder. We have built a strong technological base over
many years, gaining particu-lar expertise in low tempera-t u r e , h i g h - p r e s s u r e , separation, vacuum and gas contro l t echnolog ie s . Drawing on these capabili-ties, we provide a diverse range of equipment for the manufacture, supply, transport and storage of various types of gases. In these ways, we help industrial cus-tomers enhance their productivity and quality while supporting efforts to improve the environment. In addition to maintaining the largest industrial gas sup-ply network in Japan, we are expanding our manufac-turing and supply bases in the United States as well as in China and other parts of Asia.
Fiscal year 2010 sales Approximately ¥203,894 million
Principal products and operations Oxygen, nitrogen, argon, carbon dioxide, hydrogen, helium and other industrial gases
Gas supply (filling, transport, storage) equipment, facilities installation and construction
Gas equipment (including for cutting, welding, combustion and freezing)
Market needs Use of gases to raise productivity, enhance quality, save energy and enhance the environment
Optimal, stable, economic supply of gases
Competitive advantages Japan’s largest and strongest industrial gas producer, offering increased cost advantages and price competitiveness
• Production and sales capabilities
Balanced, nationwide network of production bases
Liquid gas production capacity equivalent to 30% of the domestic market
• Logistics capabilities
Approximately 500 filling stations capable of serving approximately 40% of the domestic market
Tanker truck fleet and extensive network of shipping bases
Growing marketing network, including around 250 sales agents
Further strengthening of operations in China and other parts of Asia, as well as in the United States
• Currently involved in project to manufacture industrial gases in China’s Dalian Chanxing Island Harbor Industrial Zone
• Continuing to make assertive investments in the Philippines, Vietnam and Singapore with the aim of establishing a nationwide presence in each
• Promoting M&A activities and construction of gas production facilities in the United States
• High market shares for other industrial gases in Japan, number 1 in carbon dioxide and helium
Fiscal year 2010 highlights • Acquired Valley National Gases LLC, the largest privately held U.S. distributor of industrial gases
• Received an order for pressure swing adsorption (PSA) biogas refining equipment to be used in Japan’s first project for the input of biogas into city gas pipelines
• Acquired 51% stake in K-Air Gases India Private Limited of India, which became a consolidated subsidiary
• Built new air separation plant for Shin Sagami Sanso Co., Ltd.
280
210
140
70
0
Years ended March 31 (Billions of yen)
2009 2010
Sales of GasBusiness
229
203
19
大陽日酸_P2_22_0906.indd 19大陽日酸_P2_22_0906.indd 19 10.9.12 7:32:26 PM10.9.12 7:32:26 PM
Onsite and Plant Business
In the onsite business, Taiyo Nippon Sanso constructs large cryogenic air separa-tion plants on the premises of major industrial gas users, notably steel mills and chemical complexes. We also provide stable sup-plies of oxygen and nitro-gen through our pipelines. Our onsite business oper-ates around the clock every day of the year, ensuring consistent supplies of large volumes of industrial gases
and earning us the trust of steelmakers and chemical manufacturers. In our plant business, we build a wide range of air separation plants, which form the founda-tion of the industrial gases business. We draw on our expertise in industrial gas production and supply not only to serve industrial gas producers but also to build a strong track record in manufacturing air separation plants, which we export around the globe. In addition, we supply many different types of experimental equip-ment, including space simulation chambers, which
replicate the conditions of outer space. In addition, we supply equipment for exploring basic physics and dis-covering new functional materials.
Our Businesses
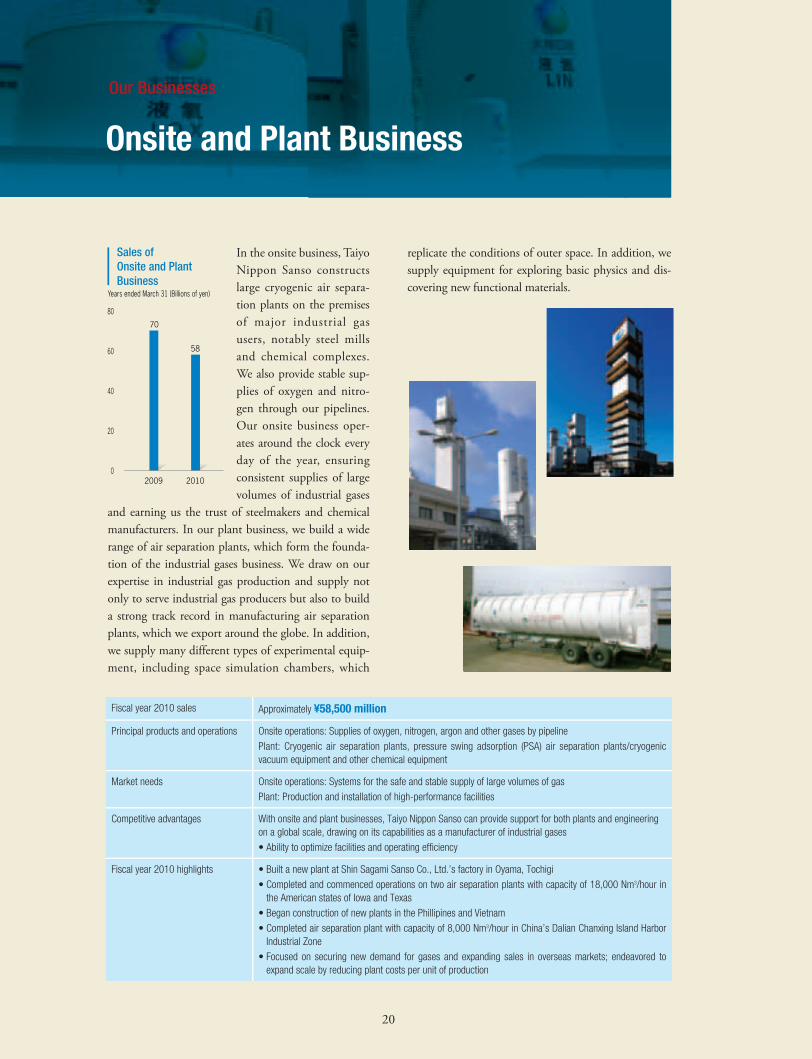
Fiscal year 2010 sales Approximately ¥58,500 million
Principal products and operations Onsite operations: Supplies of oxygen, nitrogen, argon and other gases by pipeline
Plant: Cryogenic air separation plants, pressure swing adsorption (PSA) air separation plants/cryogenic vacuum equipment and other chemical equipment
Market needs Onsite operations: Systems for the safe and stable supply of large volumes of gas
Plant: Production and installation of high-performance facilities
Competitive advantages With onsite and plant businesses, Taiyo Nippon Sanso can provide support for both plants and engineering on a global scale, drawing on its capabilities as a manufacturer of industrial gases
• Ability to optimize facilities and operating efficiency
Fiscal year 2010 highlights • Built a new plant at Shin Sagami Sanso Co., Ltd.’s factory in Oyama, Tochigi
• Completed and commenced operations on two air separation plants with capacity of 18,000 Nm3/hour in the American states of Iowa and Texas
• Began construction of new plants in the Phillipines and Vietnam
• Completed air separation plant with capacity of 8,000 Nm3/hour in China’s Dalian Chanxing Island Harbor Industrial Zone
• Focused on securing new demand for gases and expanding sales in overseas markets; endeavored to expand scale by reducing plant costs per unit of production
80
60
40
20
0
Years ended March 31 (Billions of yen)
2009 2010
Sales of Onsite and PlantBusiness
70
58
20
大陽日酸_P2_22_0906.indd 20大陽日酸_P2_22_0906.indd 20 10.9.12 7:32:27 PM10.9.12 7:32:27 PM

Medical-Related Business
We build special filling facilities for medical gases within our industrial gas production and sales net-works to ensure stable sup-plies of medical oxygen and other high-quality gases used by medical institu-tions. We help improve the safety and reliability of medical treatment by devel-oping pure air supply sys-tems and other medical support equipment, as well as devices for home oxygen
therapy (HOT), and through such services as regular inspection of equipment and operation of remote monitoring systems. Applying our advanced gas-related technologies, we also make and sell stable isotopes for advanced diagnostics and treatment, as well as specialty gases.
Fiscal year 2010 sales Approximately ¥15,005 million
Principal products and operations Medical-related oxygen and other gases
Synthesized (pure) air supply facilities, portable oxygen cylinders and medical-use oxygen compressors
Stable isotopes
Market needs Quality control and assurance for medical-use gases
Mass production and ongoing supply of stable isotopes used in cancer diagnostic agents
Competitive advantages Reliable systems for manufacture and sale of pharmaceutical products
• Continue to gather safety information and data
Production and sale of pharmaceutical ingredients for positron emission tomography (PET) diagnostics
• Strong position as manufacturer of Water–18O, a pharmaceutical ingredient for reagents used in PET diagnostics, with a 70% domestic market share
• Have commenced shipments of world-class pharmaceutical ingredients to leading manufacturers of fluorodeoxyglucose (FDG) PET reagents in Europe and the United States
Fiscal year 2010 highlights • Established Taiyo Nippon Sanso Shenwei (Shanghai) Medical Gas Co., Ltd.
• Expanded sales of stable isotopes and sought out M&A opportunities with the aim of strengthening medical gas and equipment businesses
16
12
8
4
0
Years ended March 31 (Billions of yen)
2009 2010
Sales of Medical-RelatedBusiness
13
15
21
大陽日酸_P2_22_0906.indd 21大陽日酸_P2_22_0906.indd 21 10.9.12 7:32:29 PM10.9.12 7:32:29 PM
LP Gas Business
LP gas is highly valued as a clean energy source, with applications ranging from industrial to household purposes. An environment- friendly alternative to chloro fluoro carbons, LP gas is also used as an aerosol gas and as fuel for taxi fleets. Taiyo Nippon Sanso wholesales LP gas to plants and for other industrial applications, supplies taxi fueling stations and a wide range of customers, from
restaurants and other commercial users to residential users. Our energy business also sells LP gas for house-hold use to 96,000 homes throughout Japan through direct sales outlets. With residential-use fuel cells expected to achieve increased market penetration, LP gas—which is used to fuel cells—is attracting increasing attention as an environment-friendly energy.
Our Businesses
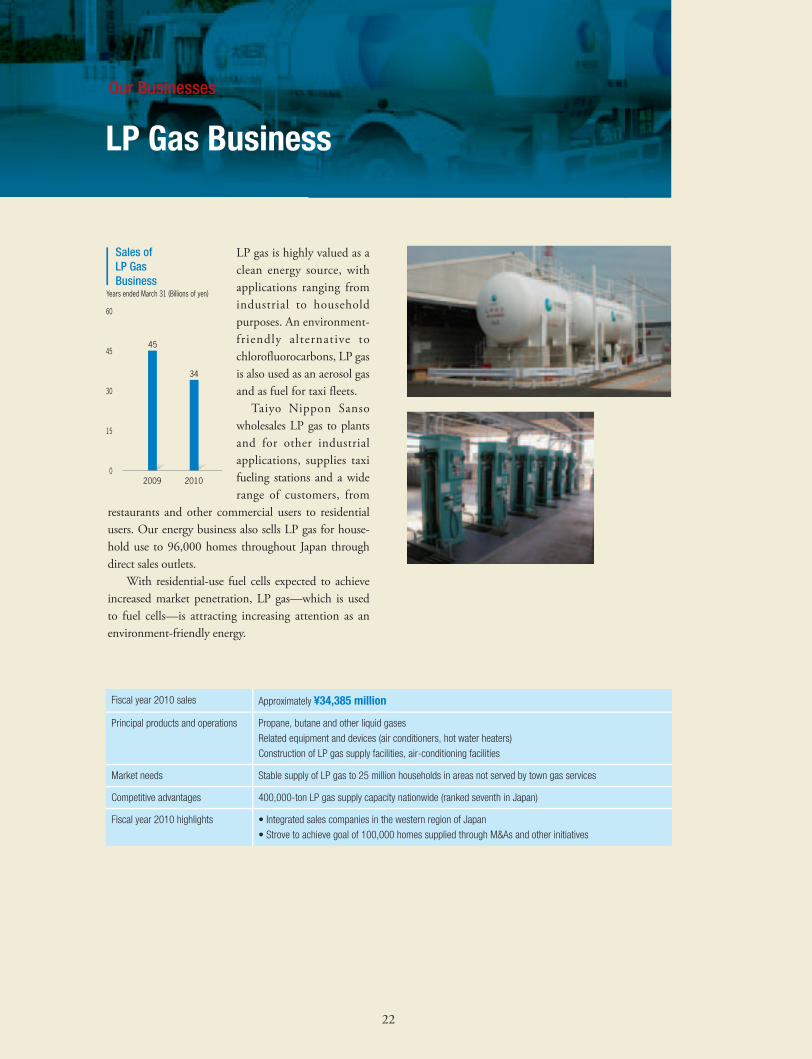
Fiscal year 2010 sales Approximately ¥34,385 million
Principal products and operations Propane, butane and other liquid gases
Related equipment and devices (air conditioners, hot water heaters)
Construction of LP gas supply facilities, air-conditioning facilities
Market needs Stable supply of LP gas to 25 million households in areas not served by town gas services
Competitive advantages 400,000-ton LP gas supply capacity nationwide (ranked seventh in Japan)
Fiscal year 2010 highlights • Integrated sales companies in the western region of Japan
• Strove to achieve goal of 100,000 homes supplied through M&As and other initiatives
60
45
30
15
0
Years ended March 31 (Billions of yen)
2009 2010
Sales of LP GasBusiness
45
34
22
大陽日酸_P2_22_0906.indd 22大陽日酸_P2_22_0906.indd 22 10.9.12 7:32:30 PM10.9.12 7:32:30 PM
23
Millions of yenYears ended March 31 2010 2009 2008 2007 2006 2005
Net sales ¥433,390 ¥495,746 ¥507,718 ¥458,587 ¥397,308 ¥300,055
Operating income 27,556 29,164 38,783 36,488 26,788 20,727
Net income 15,748 16,533 21,930 20,094 14,444 11,568
Selling, general and administrative
expenses/Net sales (%) 27.5% 24.7% 23.1% 23.2% 24.0% 24.5%
Return on equity (%) 8.3% 8.6% 10.8% 10.6% 8.7% 8.7%2
Return on assets (%) 2.4% 3.1% 4.0% 3.6% 3.1% 3.3%2
Capital expenditure 38,366 66,010 36,260 35,891 22,176 38,092
Depreciation and amortization 30,143 28,339 25,506 21,210 18,982 14,592
Research and development
expenses 4,137 3,936 2,903 2,713 2,223 2,056
Interest-bearing debt 259,111 191,074 159,500 152,232 122,196 122,089
Total net assets 212,396 194,250 217,813 216,068 178,055 154,207
Total assets 617,215 534,350 547,237 547,791 471,602 404,668
Yen
Per share data:
Net income1 ¥39.39 ¥41.21 ¥54.48 ¥49.93 ¥35.45 ¥32.76
Cash dividends 12.00 12.00 12.00 12.00 10.00 9.00
Times
Price earnings ratio 23.20 15.55 14.65 21.31 24.54 19.17
Notes: 1. Net income per share is computed based on the weighted average number of shares of common stock outstanding during each year, as adjusted retroactively for free share distributions made during the period.
2. ROE and ROA for fiscal 2005 are computed based on the combined net incomes of Taiyo Nippon Sanso for fiscal 2005 and the former Taiyo Toyo Sanso for the six months ended September 30, 2004.
3. Since the merger of Nippon Sanso and Taiyo Toyo Sanso took place October 1, 2004, consolidated figures for fiscal 2005 exclude the figures for the former Taiyo Toyo Sanso for the six months ended September 30, 2004. Taiyo Nippon Sanso’s results for fiscal 2005 are compared to the fiscal 2003 and 2004 totals of the former Nippon Sanso.
4. Figures given for total net assets prior to fiscal 2007 are for total shareholders’ equity.
Six-Year SummaryTaiyo Nippon Sanso Corporation and Consolidated Subsidiaries
BH0909.indd 23BH0909.indd 23 10.9.12 7:33:11 PM10.9.12 7:33:11 PM
24
20102009200820072006 2010200920082007200620102009200820072006
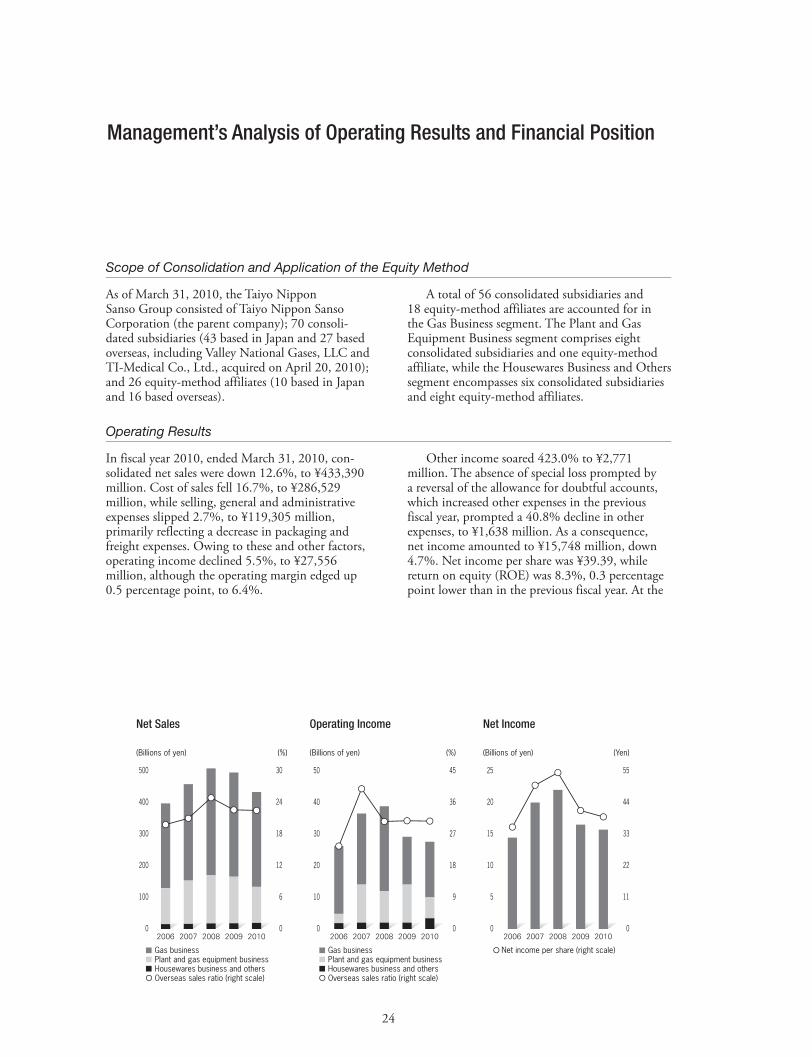
Net Sales
(Billions of yen) (%)
Gas businessPlant and gas equipment businessHousewares business and othersOverseas sales ratio (right scale)
Operating Income
(Billions of yen) (%)
Gas businessPlant and gas equipment businessHousewares business and othersOverseas sales ratio (right scale)
Net Income
(Billions of yen) (Yen)
Net income per share (right scale)
0
10
20
30
40
50
0
9
18
27
36
45
0
5
10
15
20
25
0
11
22
33
44
55
0
100
200
300
400
500
0
6
12
18
24
30
Management’s Analysis of Operating Results and Financial Position
Scope of Consolidation and Application of the Equity Method
Operating Results
As of March 31, 2010, the Taiyo Nippon Sanso Group consisted of Taiyo Nippon Sanso Corporation (the parent company); 70 consoli-dated subsidiaries (43 based in Japan and 27 based overseas, including Valley National Gases, LLC and TI-Medical Co., Ltd., acquired on April 20, 2010); and 26 equity-method affiliates (10 based in Japan and 16 based overseas).
In fiscal year 2010, ended March 31, 2010, con-solidated net sales were down 12.6%, to ¥433,390 million. Cost of sales fell 16.7%, to ¥286,529 million, while selling, general and administrative expenses slipped 2.7%, to ¥119,305 million, primarily reflecting a decrease in packaging and freight expenses. Owing to these and other factors, operating income declined 5.5%, to ¥27,556 million, although the operating margin edged up 0.5 percentage point, to 6.4%.
A total of 56 consolidated subsidiaries and 18 equity-method affiliates are accounted for in the Gas Business segment. The Plant and Gas Equipment Business segment comprises eight consolidated subsidiaries and one equity-method affiliate, while the Housewares Business and Others segment encompasses six consolidated subsidiaries and eight equity-method affiliates.
Other income soared 423.0% to ¥2,771 million. The absence of special loss prompted by a reversal of the allowance for doubtful accounts, which increased other expenses in the previous fiscal year, prompted a 40.8% decline in other expenses, to ¥1,638 million. As a consequence, net income amounted to ¥15,748 million, down 4.7%. Net income per share was ¥39.39, while return on equity (ROE) was 8.3%, 0.3 percentage point lower than in the previous fiscal year. At the
BH0909.indd 24BH0909.indd 24 10.9.12 7:33:11 PM10.9.12 7:33:11 PM

25
Results by Segment
Gas BusinessShipments of the Company’s principle gases—oxygen, nitrogen and argon—showed signs of improving overall, bolstered by increased exports in the electronics, automotive, petrochemicals and other related industries and a recovery in demand, thanks in part to domestic demand stimulus measures, as well as by the positive impact of an M&A deal during the period. Against a backdrop of rising domestic demand in China and elsewhere in Asia for products used in the manufacture of high-end steel plates for automobiles and petrochemicals products, shipments of oxygen for supply through pipelines rallied strongly. Nonetheless, overall sales of oxygen, including liquefied gas, declined from the fiscal 2009 level. Overall shipments and sales of nitrogen, including liquefied gas, also fell short compared with the previous fiscal year, despite firm demand from the steel, chemical and electronics industries for use in ensuring process safety and nitrogen purging, combined with demand for use at a new plant for large LCD panels established by Sharp Corporation. Despite signs of a recovery in demand for use in the production of silicon liquid crystals and in stainless steel smelting, overall shipments and sales of argon also fell, owing to a steep decline in demand for use in welding. As a consequence of these and other factors, sales in the Gas Business segment declined 8.9%, to ¥300,451 million. Operating income amounted to ¥22,443 million, essentially level with fiscal year 2009.
Plant and Gas Equipment BusinessSales and operating income in this segment declined from fiscal 2009, as persistent recessionary
conditions in Japan prompted our electronics materials-related equipment and plant businesses to revise and/or postpone facility replacement plans and new investments. Rising demand for liquid crystal backlights and LEDs for lighting applications combined with higher demand for electronic devices to support a 32% increase in sales in our compound semiconductor manufacturing equipment and MOCVD equipment business. With the release of Mache, a new large-scale model, which stimulated demand in Japan and overseas, bolstering orders, we increased the capacity of the test line at our Tsukuba Laboratory. In the current period, we will install a new, large-scale mass-production testing facility at the Tsukuba Laboratory. Sales of welding equipment and materials fell short of the fiscal year 2009 level. This result was due to a sharp decline in domestic demand, attributable to decreased public-sector investment and to the postponement of capital expenditures in the private sector, which hampered demand for use in the manufacture of transportation and construc-tion equipment. The decline in sales also reflected a slower-than-expected improvement in economic conditions in North America. Owing to the aforementioned business results, among others, sales in the Plant and Gas Equipment Business segment declined 22.7%, to ¥113,997 million. Operating income plummeted 42.6%, to ¥6,646 million.
Housewares Business and OthersSales in this segment were bolstered by robust shipments of sports bottles, Keitai Mug insulated mugs and the Shuttle Chef thermal cooker, all mainstay products of Thermos K.K. Segment sales rose 2.5%, to ¥18,941 million. Operating income climbed 52.9%, to ¥3,412 million.
general meeting of the Company’s shareholders on June 29, 2010, a proposal to pay a full-term dividend of ¥12.00 for the period under review was approved. Capital expenditures, including the cost of construction, totaled ¥38,366 million in the period
under review, approximately ¥27,600 million less than in fiscal 2009. In contrast, depreciation and amortization increased ¥1,804 million, to ¥30,143 million. Investment in R&D rose ¥201 million, to ¥4,137 million, equivalent to approximately 1% of consolidated net sales.
BH0909.indd 25BH0909.indd 25 10.9.12 7:33:11 PM10.9.12 7:33:11 PM
26
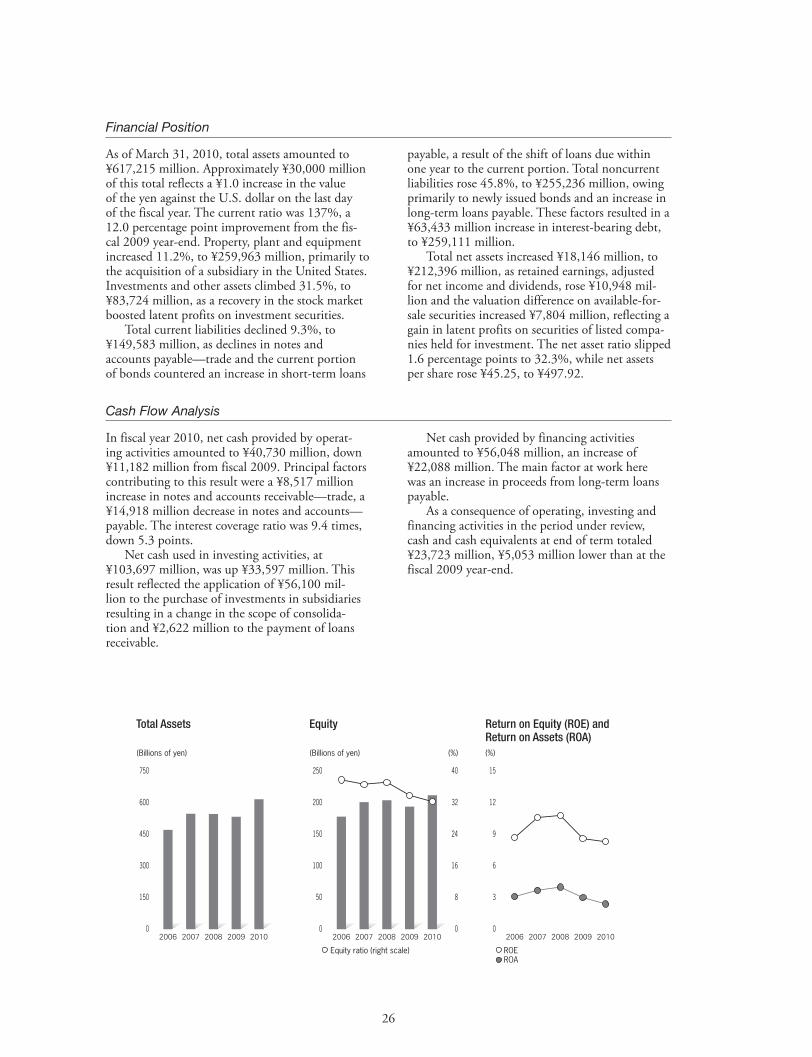
Financial Position
Cash Flow Analysis
As of March 31, 2010, total assets amounted to ¥617,215 million. Approximately ¥30,000 million of this total reflects a ¥1.0 increase in the value of the yen against the U.S. dollar on the last day of the fiscal year. The current ratio was 137%, a 12.0 percentage point improvement from the fis-cal 2009 year-end. Property, plant and equipment increased 11.2%, to ¥259,963 million, primarily to the acquisition of a subsidiary in the United States. Investments and other assets climbed 31.5%, to ¥83,724 million, as a recovery in the stock market boosted latent profits on investment securities. Total current liabilities declined 9.3%, to ¥149,583 million, as declines in notes and accounts payable—trade and the current portion of bonds countered an increase in short-term loans
In fiscal year 2010, net cash provided by operat-ing activities amounted to ¥40,730 million, down ¥11,182 million from fiscal 2009. Principal factors contributing to this result were a ¥8,517 million increase in notes and accounts receivable—trade, a ¥14,918 million decrease in notes and accounts—payable. The interest coverage ratio was 9.4 times, down 5.3 points. Net cash used in investing activities, at ¥103,697 million, was up ¥33,597 million. This result reflected the application of ¥56,100 mil-lion to the purchase of investments in subsidiaries resulting in a change in the scope of consolida-tion and ¥2,622 million to the payment of loans receivable.
payable, a result of the shift of loans due within one year to the current portion. Total noncurrent liabilities rose 45.8%, to ¥255,236 million, owing primarily to newly issued bonds and an increase in long-term loans payable. These factors resulted in a ¥63,433 million increase in interest-bearing debt, to ¥259,111 million. Total net assets increased ¥18,146 million, to ¥212,396 million, as retained earnings, adjusted for net income and dividends, rose ¥10,948 mil-lion and the valuation difference on available-for-sale securities increased ¥7,804 million, reflecting a gain in latent profits on securities of listed compa-nies held for investment. The net asset ratio slipped 1.6 percentage points to 32.3%, while net assets per share rose ¥45.25, to ¥497.92.
Net cash provided by financing activities amounted to ¥56,048 million, an increase of ¥22,088 million. The main factor at work here was an increase in proceeds from long-term loans payable. As a consequence of operating, investing and financing activities in the period under review, cash and cash equivalents at end of term totaled ¥23,723 million, ¥5,053 million lower than at the fiscal 2009 year-end.
20102009200820072006 20102009200820072006 20102009200820072006
Total Assets
(Billions of yen)
Equity
(Billions of yen) (%)
Equity ratio (right scale)
Return on Equity (ROE) and Return on Assets (ROA)(%)
ROEROA
0
150
300
450
600
750
0
3
6
9
12
15
0
50
100
150
200
250
0
8
16
24
32
40
BH0909.indd 26BH0909.indd 26 10.9.12 7:33:11 PM10.9.12 7:33:11 PM
27
Business Risks
Management Policies, Business-Related RisksPurchase of Property, Plant and EquipmentThe Company maintains large-scale gas supply facilities for major customers and needs to spend heavily to maintain and upgrade these facilities. Accordingly, interest rate trends could have a material impact on the Company’s business performance.
Reliance on Specific IndustriesThe Company supplies gases to a wide range of industries and its exposure to risks from reliance on specific industries is thus low. Nevertheless, changes in key electronics markets (semiconduc-tors, liquid crystals, solar cells) could have a significant impact on the Company’s business performance.
Manufacturing CostsElectricity is the major component of the cost of manufacturing such core products as oxygen, nitrogen and argon. Accordingly, a sharp increase in the price of crude oil could result in a substantial increase in electricity charges, which the Company may be unable to reflect in the pricing of its products.
Overseas FactorsThe Company maintains operations overseas, particularly in the United States and in other parts of Asia, including China, where the Company has substantial gas operations. Political and economic changes in countries where the Company has operations may have an adverse impact on its business performance.
Technical and Safety FactorsTechnological DevelopmentThe creation of new products and technologies entails various uncertainties owing to the Company’s reliance on technological development in such areas as compound semiconductors, the environment and energy.
Intellectual PropertyThe Company’s business depends on proprietary technological development. The Company endeavors to obtain intellectual property rights as necessary for its proprietary technological develop-ment activities. However, there are no guarantees that its technologies are completely protected.
Product Defects The Company sells high-pressure gas-related prod-ucts and handles toxic and flammable gases used in
electronics manufacturing (semiconductors, liquid crystals, solar cells). While the Company strives to ensure the effective management of related risks, it cannot guarantee that all of its products are free of defects.
Financial Risks and Other FactorsForeign Exchange RiskThe Company exports products for sale outside of Japan. The Company strives to hedge foreign exchange risks by entering into forward exchange contracts and other derivatives transactions. However, the Company may not be able to respond to sudden fluctuations in currency rates, which therefore may have an adverse impact on its business performance.
Retirement Benefit LiabilitiesA sudden deterioration in retirement plan returns resulting in an increase in retirement benefit costs may have an adverse impact on the Company’s business performance.
Natural DisastersThe occurrence of earthquakes or other natural disasters in areas where the Company has manufacturing facilities may damage facilities. In particular, damage to the Company’s large-scale manufacturing facilities may lead to a significant decline in production capacity and incur major recovery costs. Such factors may adversely affect the Company’s business performance.
Legal IssuesUnanticipated changes to existing laws, the introduction of new laws, particularly in countries overseas where the Company maintains operations, may adversely affect the Company’s business performance. Revisions to environmental laws that result in a tightening of restrictions may result in an increase in costs to ensure compliance, which may also adversely affect the Company’s business performance.
Medium-Term Business PlanIn April 2008, the Company formulated a new medium-term business plan. The Company is currently devoting its best efforts toward achieving the quantitative targets of this plan. Based on the information available to management at the time the plan was formulated, these targets are judged to be appropriate. However, a number of factors—including changes in the operating environment—could render the achievement of these targets impossible.
BH0909.indd 27BH0909.indd 27 10.9.12 7:33:12 PM10.9.12 7:33:12 PM
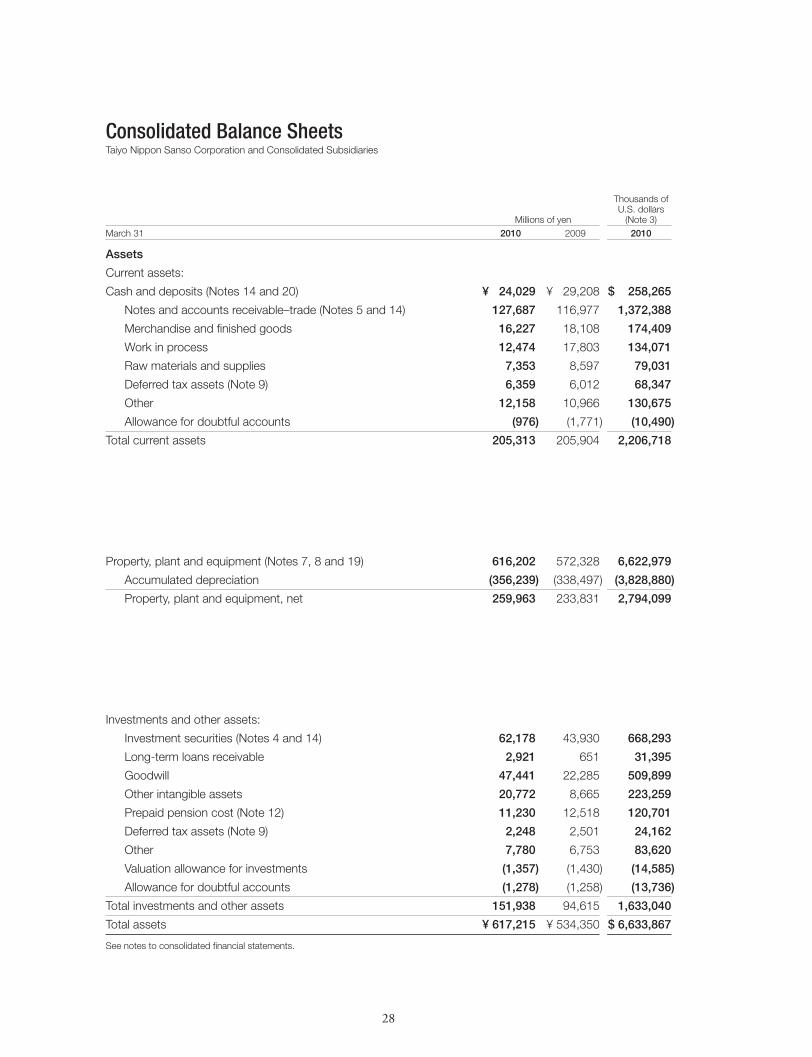
28
Thousands of U.S. dollars Millions of yen (Note 3)March 31 2010 2009 2010
Assets
Current assets:
Cash and deposits (Notes 14 and 20) ¥ 24,029 ¥ 29,208 $ 258,265
Notes and accounts receivable–trade (Notes 5 and 14) 127,687 116,977 1,372,388
Merchandise and finished goods 16,227 18,108 174,409
Work in process 12,474 17,803 134,071
Raw materials and supplies 7,353 8,597 79,031
Deferred tax assets (Note 9) 6,359 6,012 68,347
Other 12,158 10,966 130,675
Allowance for doubtful accounts (976) (1,771) (10,490)
Total current assets 205,313 205,904 2,206,718
Property, plant and equipment (Notes 7, 8 and 19) 616,202 572,328 6,622,979
Accumulated depreciation (356,239) (338,497) (3,828,880)
Property, plant and equipment, net 259,963 233,831 2,794,099
Investments and other assets:
Investment securities (Notes 4 and 14) 62,178 43,930 668,293
Long-term loans receivable 2,921 651 31,395
Goodwill 47,441 22,285 509,899
Other intangible assets 20,772 8,665 223,259
Prepaid pension cost (Note 12) 11,230 12,518 120,701
Deferred tax assets (Note 9) 2,248 2,501 24,162
Other 7,780 6,753 83,620
Valuation allowance for investments (1,357) (1,430) (14,585)
Allowance for doubtful accounts (1,278) (1,258) (13,736)
Total investments and other assets 151,938 94,615 1,633,040
Total assets ¥ 617,215 ¥ 534,350 $ 6,633,867
See notes to consolidated financial statements.
Consolidated Balance SheetsTaiyo Nippon Sanso Corporation and Consolidated Subsidiaries
BH0909.indd 28BH0909.indd 28 10.9.12 7:33:12 PM10.9.12 7:33:12 PM

29
Thousands of U.S. dollars Millions of yen (Note 3)March 31 2010 2009 2010
Liabilities and Net assets
Current liabilities:
Notes and accounts payable–trade (Note 14) ¥ 67,926 ¥ 81,236 $ 730,073
Short-term loans payable (Notes 6 and 14) 47,429 49,495 509,770
Income taxes payable (Note 9) 7,051 6,162 75,785
Other 27,174 28,090 292,068
Total current liabilities 149,583 164,985 1,607,728
Noncurrent liabilities:
Long-term loans payable (Notes 6 and 14) 201,197 135,659 2,162,479
Pension and severance indemnities (Note 12) 5,051 5,306 54,288
Deferred tax liabilities (Note 9) 32,305 18,639 347,216
Negative goodwill 1,181 1,718 12,693
Lease obligations (Note 6) 8,957 8,556 96,270
Other 6,541 5,234 70,303
Total noncurrent liabilities 255,236 175,115 2,743,293
Contingent liabilities (Note 13)
Total liabilities 404,819 340,100 4,351,021
Net assets (Notes 10 and 21):
Shareholders’ equity:
Capital stock:
Authorized—1,600,000,000 shares
Issued—403,092,837 shares 27,039 27,039 290,617
Capital surplus 44,910 44,910 482,696
Retained earnings 142,426 131,478 1,530,804
Treasury stock, at cost—
3,268,919 shares in 2010 and 3,159,559 shares in 2009 (2,307) (2,181) (24,796)
Valuation and translation adjustments and others:
Valuation difference on available-for-sale securities 10,880 3,076 116,939
Deferred gains or losses on hedges 27 (111) 290
Foreign currency translation adjustments (23,773) (23,011) (255,514)
Accumulated other comprehensive loss (124) (163) (1,333)
Minority interests 13,317 13,212 143,132
Total net assets 212,396 194,250 2,282,846
Total liabilities and net assets ¥617,215 ¥534,350 $6,633,867
BH0909.indd 29BH0909.indd 29 10.9.12 7:33:12 PM10.9.12 7:33:12 PM

30
Thousands of U.S. dollars Millions of yen (Note 3)Years ended March 31 2010 2009 2010
Net sales ¥433,390 ¥495,746 $4,658,104Cost of sales (Note 16) 286,529 343,905 3,079,632 Gross profit 146,861 151,841 1,578,472Selling, general and administrative expenses (Note 16) 119,305 122,676 1,282,298 Operating income 27,556 29,164 296,174
Other income (expenses): Interest and dividend income 928 1,313 9,974 Interest expenses (4,352) (3,504) (46,776) Amortization of negative goodwill 750 667 8,061 Gain on sales of noncurrent assets (Note 17) 151 354 1,623 Gain on extinguishment of tie-in shares 332 — 3,568 Compensation income 264 — 2,837 Loss on sales and retirement of noncurrent assets (Note 17) (1,146) (916) (12,317) Foreign exchange losses — (824) — Gain on sales of investment securities — 9 — Loss on valuation of investment securities (1) (209) (11) Loss on valuation of golf club memberships (68) (81) (731) Gain on sales of golf club memberships — 2 — Gain on sales of subsidiaries’ stocks 1,225 — 13,166 Loss on sales of subsidiaries’ stocks (18) — (193) Gain on sales of subsidiaries and affiliates’ stocks 49 9 527 Equity in earnings of affiliates 1,385 1,333 14,886 Impairment loss (Note 18) (570) (141) (6,126) Provision of valuation allowance for investments (240) (450) (2,580) Reversal of valuation allowance for investments 32 — 344 Reversal of allowance for doubtful accounts 716 278 7,696 Provision of allowance for doubtful accounts — (722) — Environmental expenses (108) — (1,161) Loss on revision of retirement benefit plan — (333) — Early extra retirement payments — (311) — Other 1,305 200 14,026 634 (3,325) 6,814Income before income taxes and minority interests 28,191 25,839 302,999
Income taxes (Note 9): Current 11,155 12,332 119,895 Deferred 146 (4,089) 1,569 11,301 8,243 121,464Minority interests in income 1,142 1,062 12,274Net income ¥ 15,748 ¥ 16,533 $ 169,261
U.S. dollars Yen (Note 3)
Amounts per share: Net assets ¥497.92 ¥452.67 $5.35 Net income 39.39 41.21 0.42 Cash dividends 12.00 12.00 0.13
See notes to consolidated financial statements.
Consolidated Statements of IncomeTaiyo Nippon Sanso Corporation and Consolidated Subsidiaries
BH0909.indd 30BH0909.indd 30 10.9.12 7:33:12 PM10.9.12 7:33:12 PM
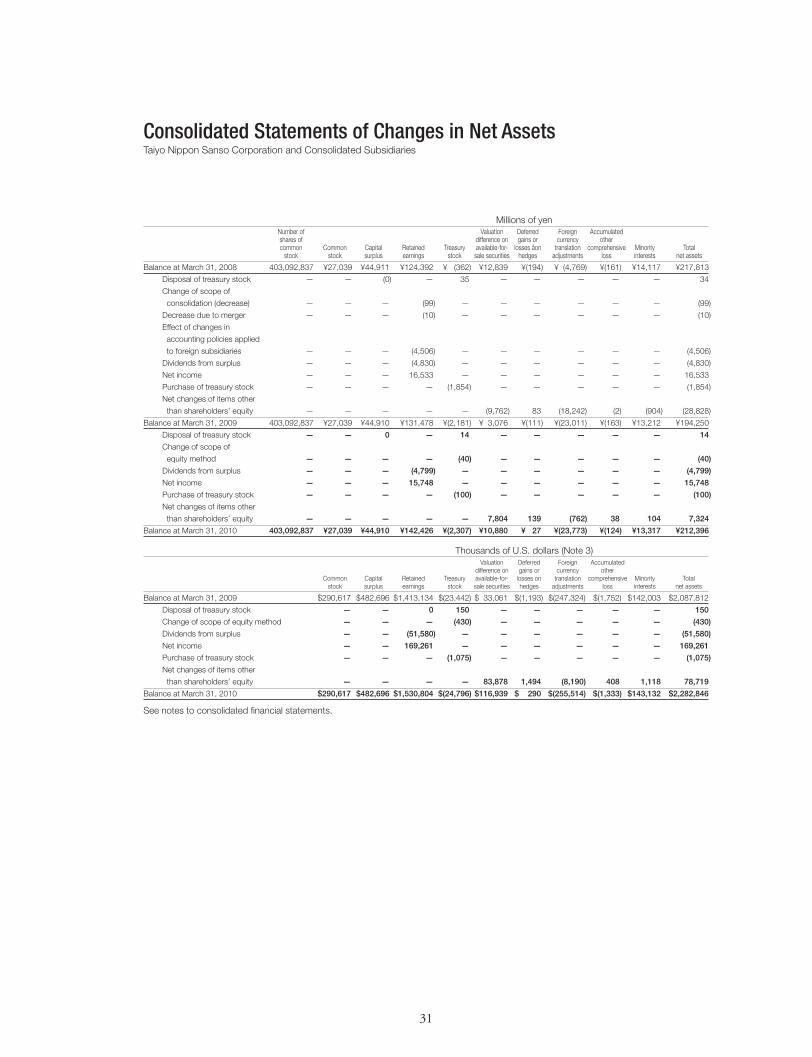
31
Millions of yen Number of Valuation Deferred Foreign Accumulated shares of difference on gains or currency other common Common Capital Retained Treasury available-for- losses åon translation comprehensive Minority Total stock stock surplus earnings stock sale securities hedges adjustments loss interests net assets
Balance at March 31, 2008 403,092,837 ¥27,039 ¥44,911 ¥124,392 ¥ (362) ¥12,839 ¥(194) ¥ (4,769) ¥(161) ¥14,117 ¥217,813
Disposal of treasury stock — — (0) — 35 — — — — — 34
Change of scope of
consolidation (decrease) — — — (99) — — — — — — (99)
Decrease due to merger — — — (10) — — — — — — (10)
Effect of changes in
accounting policies applied
to foreign subsidiaries — — — (4,506) — — — — — — (4,506)
Dividends from surplus — — — (4,830) — — — — — — (4,830)
Net income — — — 16,533 — — — — — — 16,533
Purchase of treasury stock — — — — (1,854) — — — — — (1,854)
Net changes of items other
than shareholders’ equity — — — — — (9,762) 83 (18,242) (2) (904) (28,828)
Balance at March 31, 2009 403,092,837 ¥27,039 ¥44,910 ¥131,478 ¥(2,181) ¥ 3,076 ¥(111) ¥(23,011) ¥(163) ¥13,212 ¥194,250
Disposal of treasury stock — — 0 — 14 — — — — — 14
Change of scope of
equity method — — — — (40) — — — — — (40)
Dividends from surplus — — — (4,799) — — — — — — (4,799)
Net income — — — 15,748 — — — — — — 15,748
Purchase of treasury stock — — — — (100) — — — — — (100)
Net changes of items other
than shareholders’ equity — — — — — 7,804 139 (762) 38 104 7,324
Balance at March 31, 2010 403,092,837 ¥27,039 ¥44,910 ¥142,426 ¥(2,307) ¥10,880 ¥ 27 ¥(23,773) ¥(124) ¥13,317 ¥212,396
Thousands of U.S. dollars (Note 3) Valuation Deferred Foreign Accumulated difference on gains or currency other Common Capital Retained Treasury available-for- losses on translation comprehensive Minority Total stock surplus earnings stock sale securities hedges adjustments loss interests net assets
Balance at March 31, 2009 $290,617 $482,696 $1,413,134 $(23,442) $ 33,061 $(1,193) $(247,324) $(1,752) $142,003 $2,087,812
Disposal of treasury stock — — 0 150 — — — — — 150
Change of scope of equity method — — — (430) — — — — — (430)
Dividends from surplus — — (51,580) — — — — — — (51,580)
Net income — — 169,261 — — — — — — 169,261
Purchase of treasury stock — — — (1,075) — — — — — (1,075)
Net changes of items other
than shareholders’ equity — — — — 83,878 1,494 (8,190) 408 1,118 78,719
Balance at March 31, 2010 $290,617 $482,696 $1,530,804 $(24,796) $116,939 $ 290 $(255,514) $(1,333) $143,132 $2,282,846
See notes to consolidated financial statements.
Consolidated Statements of Changes in Net AssetsTaiyo Nippon Sanso Corporation and Consolidated Subsidiaries
BH0909.indd 31BH0909.indd 31 10.9.12 7:33:12 PM10.9.12 7:33:12 PM

32
Thousands of U.S. dollars Millions of yen (Note 3)Years ended March 31 2010 2009 2010
Operating activitiesIncome before income taxes and minority interests ¥ 28,191 ¥ 25,839 $ 302,999Depreciation and amortization 30,143 28,339 323,979Impairment loss 570 141 6,126Amortization of goodwill 3,153 1,961 33,889Interest and dividends income (929) (1,313) (9,985)Interest expense 4,352 3,504 46,776Equity in earnings of affiliates (1,385) (1,333) (14,886)Loss on sales and retirement of noncurrent assets 941 527 10,114Gain on sales of investment securities (1,275) (19) (13,704)Gain on extinguishment of tie-in shares (332) — (3,568)Loss on sales of subsidiaries’ stocks 18 — 193(Increase) decrease in accounts receivable–other (78) 470 (838)(Increase) decrease in notes and accounts receivable–trade (8,517) 18,962 (91,541)(Increase) decrease in advance payments (337) 1,006 (3,622)Decrease (increase) in inventories 11,420 (4,970) 122,743Decrease in notes and accounts payable–trade (14,918) (6,225) (160,340)Decrease in accrued expenses (1,934) (1,519) (20,787)Increase in advances received 664 503 7,137Decrease in prepaid pension costs 1,287 670 13,833(Decrease) increase in provision for retirement benefits (170) 273 (1,827)Other, net 3,873 2,011 41,627 54,736 68,828 588,306Interest and dividends income received 1,353 1,767 14,542Interest expenses paid (4,315) (3,541) (46,378)Income taxes paid (11,043) (15,141) (118,691)Net cash provided by operating activities 40,730 51,912 437,769
Investing activitiesIncrease in short-term investments 137 168 1,472Purchases of property, plant and equipment (40,830) (58,703) (438,844)Proceeds from sales of property, plant and equipment 576 1,000 6,191Purchases of intangible assets (160) (1,426) (1,720)Purchases of investment securities (4,685) (5,833) (50,355)Proceeds from sales of investment securities 1,229 102 13,209Payments for assets purchase (Note 20) (2,137) (5,425) (22,969)Purchase of investments in subsidiaries resulting in change in scope of consolidation (Note 20) (56,100) — (602,966)Proceeds from sales of investments in subsidiaries resulting in change in scope of consolidation (Note 20) 1,547 — 16,627Payments of loans receivable (2,622) (30) (28,181)Other, net (651) 48 (6,997)Net cash used in investing activities (103,697) (70,100) (1,114,542)
Financing activitiesNet (decrease) increase in short-term loans payable ¥ (6,516) ¥ 10,136 $ (70,034)Net decrease in commercial papers (1,000) (4,000) (10,748)Proceeds from long-term loans payable 81,345 57,875 874,301Repayment of long-term loans payable (10,986) (22,172) (118,078)Proceeds from issuance of bonds 15,000 — 161,221Redemption of bonds (15,000) — (161,221)Repayments of lease obligations (1,444) (990) (15,520)Cash dividends paid (4,800) (4,831) (51,591)Cash dividends paid to minority shareholders (469) (280) (5,041)Purchase of treasury stock (82) (1,852) (881)Proceeds from sales of treasury stock 2 74 21Net cash provided by financing activities 56,048 33,960 602,408Effect of exchange rate change on cash and cash equivalents 1,674 (499) 17,992Net (decrease) increase in cash and cash equivalents (5,243) 15,273 (56,352)Cash and cash equivalents at beginning of period 28,776 12,709 309,286Increase in cash and cash equivalents resulting from change of scope of consolidation 108 777 1,161Increase in cash and cash equivalents resulting from merger with unconsolidated subsidiaries 82 15 881Cash and cash equivalents at end of period (Note 20) ¥ 23,723 ¥ 28,776 $ 254,976
See notes to consolidated financial statements.
Consolidated Statements of Cash FlowsTaiyo Nippon Sanso Corporation and Consolidated Subsidiaries
BH0909.indd 32BH0909.indd 32 10.9.12 7:33:12 PM10.9.12 7:33:12 PM
33
Notes to Consolidated Financial StatementsTaiyo Nippon Sanso Corporation and Consolidated Subsidiaries
1. Basis of Consolidated Financial Statements
Exchange Act of Japan (the “FIEA”). As permitted by the FIEA, amounts of less than one million yen have been omitted. As a result, the totals shown in the accompanying consolidated financial state-ments (both in yen and U.S. dollars) do not necessarily agree with the sums of the individual amounts. Certain amounts previously reported have been reclassified to conform to the current year presentation.
The accompanying consolidated financial statements of TAIYO NIPPON SANSO CORPORATION (the “Company”) and consolidated subsidiaries are prepared on the basis of accounting principles generally accepted in Japan, which are different in certain respects as to application and disclosure requirements of International Financial Reporting Standards, and are compiled from the consolidated financial statements prepared by the Company as required by the Financial Instruments and
(a) ConsolidationThe accompanying consolidated financial statements include the accounts of the Company and its 70 signifi-cant subsidiaries (71 in 2009). All significant intercom-pany accounts and transactions have been eliminated in consolidation. In accordance with the regulations for the prepara-tion of consolidated financial statements under the FIEA, investments in certain unconsolidated subsidiaries and significant affiliates are accounted for by the equity method of accounting. The differences at the dates of acquisition between the cost and the underlying net equity in investments in consolidated subsidiaries and the companies accounted for by the equity method are amortized equally over the years for which their effect are reasonably estimated. Investments in unconsolidated subsidiaries and affili-ates other than those which are accounted for by the equity method are principally stated at cost.
(b) Cash equivalentsFor purposes of the statements of cash flows, the Company considers all highly liquid instruments with maturity of three months or less when purchased to be cash equivalents. (c) Investment securitiesInvestments in securities are classified into three catego-ries: trading securities, held-to-maturity securities and other securities. The Company and certain consolidated subsidiaries have marketable securities classified as other securities, which are carried at fair value with any changes in valuation difference on other securities, net of the applicable income taxes, reported as a separate com-ponent of net assets. Non-marketable securities classified as other securities are carried at cost. Under the Companies Act of Japan (the “Act”), unrealized gain or loss on other securities, net of the applicable income
taxes, is not available for distribution as dividends.
(d) InventoriesInventories of the Company and its consolidated domes-tic subsidiaries are stated at cost, determined by the aver-age method, specific identification method or the moving-average method (lower than book value due to decline in profitability). As for overseas consolidated subsidiaries, inventories are stated at the lower of cost or market, cost being determined by the first-in first-out method.
(e) Property, plant and equipment (except for the leased assets)
Property, plant and equipment is stated at cost, and for the Company and its consolidated domestic subsidiaries, depreciation is computed by the straight-line method for buildings and leased equipment and by the declining balance method for other equipment based on the esti-mated useful lives of the respective assets. As for consoli-dated overseas subsidiaries, depreciation is principally computed by the straight-line method based on the estimated useful lives of the respective assets.
The useful lives are as follows: Buildings 3 to 50 years Machinery 4 to 15 years
(f) Intangible assetsGoodwill and other intangible assets are stated at cost. As for the Company and its consolidated domestic sub-sidiaries, goodwill and other intangible assets are amor-tized by straight-line method based on their estimated useful life. Consolidated overseas subsidiaries record goodwill according to the Financial Accounting Standards Board Statement No. 142 (“Goodwill and Other Intangible Assets,” issued by the Financial Accounting Standards Board of the USA).
2. Summary of Significant Accounting Policies
BH0909.indd 33BH0909.indd 33 10.9.12 7:33:12 PM10.9.12 7:33:12 PM
34
(g) LeasesLeased assets are initially accounted for at their acquisi-tion costs and depreciated over the leased term by the straight-line method with no residual value. Finance leases contracted on or before March 31, 2008 that do not deem to transfer ownership of the leased property to the lessee are accounted for as operating lease transactions. (h) Translation of foreign currency transactionsAll monetary assets and liabilities, regardless of short-term or long-term, denominated in foreign currencies other than receivables and payables hedged by qualified foreign exchange forward contracts, are translated into yen at the exchange rates prevailing as of the fiscal year-end, and resulting gains and losses are included in income. The accounts of the overseas consolidated subsidiaries are translated into yen at the year-end exchange rates, except for net assets, which are translated at historical rates, and income statement items are translated into yen at average exchange rates during the year. Differences arising from the translations are stated under “Foreign currency translation adjustments” and minority interests in consolidated subsidiaries in the accompanying consolidated balance sheets.
(i) Pension and severance indemnitiesAllowance for employees’ retirement benefits is recog-nized at the net total of the present value of the defined benefit obligation at the balance sheet date, plus any actuarial gains (less any actuarial losses) not yet recog-nized, minus the fair value of plan assets (if any) at the balance sheet date out of which the obligations are to be settled directly. If the amount determined above is nega-tive (an asset), such asset should be recorded as prepaid pension expenses. Net retirement benefit expense or income is recog-nized at the net total of current service cost and interest cost, minus the expected return on any plan assets, minus any actuarial gains (less any actuarial losses) and past service cost recognized during the year, plus any retirement benefits paid at a lump sum. To determine the present value of a defined benefit obligation and the related current service cost and, where applicable, the past service cost, the project unit credit method are used. Actuarial gains or losses and past service cost are rec-ognized for each defined benefit plan over a period not exceeding the expected average remaining service years of the employees participating in the plan. The Company and its consolidated domestic subsidiaries recognize actuarial gains or losses evenly over 12 to 16 years fol-lowing the respective fiscal years when such gains or losses are identified. Past service cost is amortized using the straight-line method over 13 to 16 years.
The Company recognized the amount of unrecognized past service cost due to the revision of the retirement rule at April 1, 2003. For transition benefit liability, the Company estab-lished the pension and severance indemnity trust by con-tribution of shares owned by the Company, and the remaining transition benefit liability is being recognized over a period of 15 years.
(Change in accounting policy)Effective from the beginning of the fiscal year, April 1, 2009, the Company has adopted “Partial Amendments to Accounting Standard for Retirement Benefits (Part 3)” (Financial Accounting Standard No. 19, issued by the Accounting Standards Board of Japan on July 31, 2008). There was no effect of this change on operating income and income before income taxes and minority interests for the year ended March 31, 2010.
(j) Allowance for directors’ and corporate auditors’ retirement benefits
The allowance for directors’ and corporate auditors’ retirement benefits of the Company and certain consoli-dated domestic subsidiaries is provided at the amount which would have been required to be paid if all direc-tors and corporate auditors had voluntarily terminated their services as of the balance sheet date. This amount has been determined in accordance with the internal rules of the respective companies. The allowance included ¥436 million ($4,686 thou-sand) and ¥410 million for corporate officers at March 31, 2010 and 2009, respectively.
(k) Research and development expensesResearch and development expenses are charged to operations as incurred.
(l) Income taxesDeferred tax assets and liabilities are determined based on the differences between financial reporting and the tax bases of assets and liabilities and are measured using the enacted tax rates and laws which will be in effect when the differences are expected to reverse.
(m) Amounts per sharePresentation of diluted net income per share is not appli-cable as there were no potentially dilutive securities for the years ended March 31, 2010 and 2009.
(n) Allowance for doubtful accountsTo cover possible losses on collection of receivables, the Company and its consolidated domestic subsidiaries pro-vided for an allowance with respect to specific debts of which recovery is doubtful, based on estimated write-off amounts, after considering the likelihood of recovery on an individual basis.
BH0909.indd 34BH0909.indd 34 10.9.12 7:33:12 PM10.9.12 7:33:12 PM
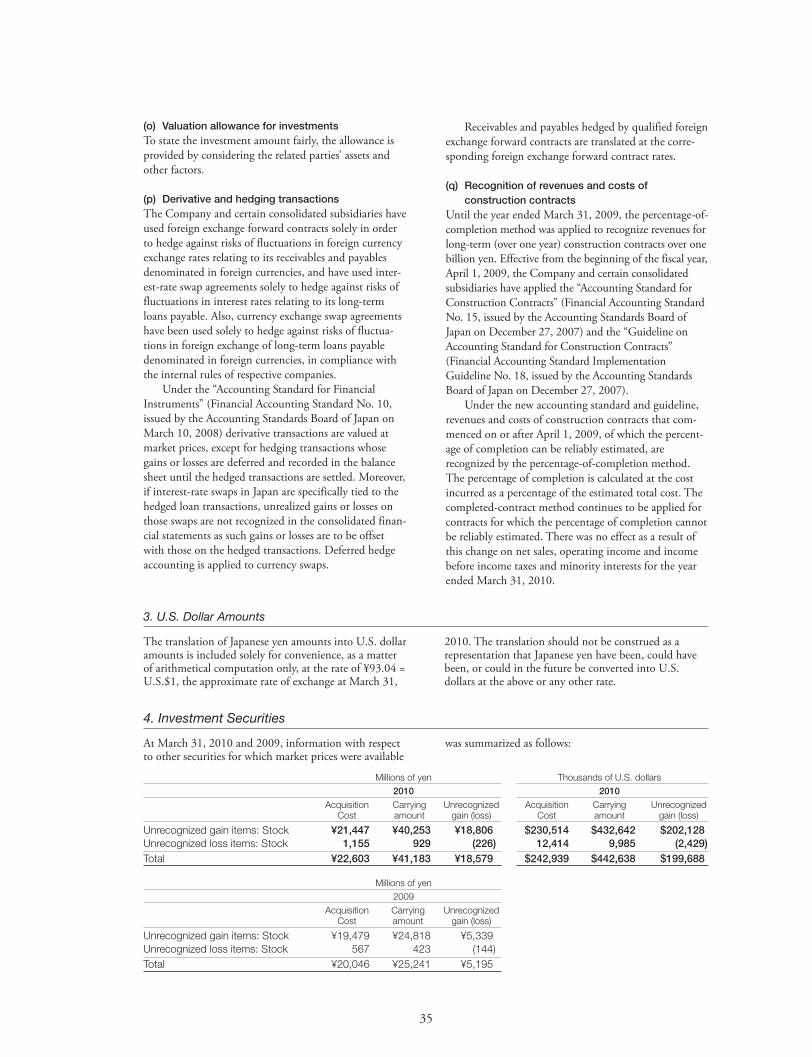
35
(o) Valuation allowance for investmentsTo state the investment amount fairly, the allowance is provided by considering the related parties’ assets and other factors. (p) Derivative and hedging transactionsThe Company and certain consolidated subsidiaries have used foreign exchange forward contracts solely in order to hedge against risks of fluctuations in foreign currency exchange rates relating to its receivables and payables denominated in foreign currencies, and have used inter-est-rate swap agreements solely to hedge against risks of fluctuations in interest rates relating to its long-term loans payable. Also, currency exchange swap agreements have been used solely to hedge against risks of fluctua-tions in foreign exchange of long-term loans payable denominated in foreign currencies, in compliance with the internal rules of respective companies. Under the “Accounting Standard for Financial Instruments” (Financial Accounting Standard No. 10, issued by the Accounting Standards Board of Japan on March 10, 2008) derivative transactions are valued at market prices, except for hedging transactions whose gains or losses are deferred and recorded in the balance sheet until the hedged transactions are settled. Moreover, if interest-rate swaps in Japan are specifically tied to the hedged loan transactions, unrealized gains or losses on those swaps are not recognized in the consolidated finan-cial statements as such gains or losses are to be offset with those on the hedged transactions. Deferred hedge accounting is applied to currency swaps.
Receivables and payables hedged by qualified foreign exchange forward contracts are translated at the corre-sponding foreign exchange forward contract rates.
(q) Recognition of revenues and costs of construction contracts
Until the year ended March 31, 2009, the percentage-of-completion method was applied to recognize revenues for long-term (over one year) construction contracts over one billion yen. Effective from the beginning of the fiscal year, April 1, 2009, the Company and certain consolidated subsidiaries have applied the “Accounting Standard for Construction Contracts” (Financial Accounting Standard No. 15, issued by the Accounting Standards Board of Japan on December 27, 2007) and the “Guideline on Accounting Standard for Construction Contracts” (Financial Accounting Standard Implementation Guideline No. 18, issued by the Accounting Standards Board of Japan on December 27, 2007). Under the new accounting standard and guideline, revenues and costs of construction contracts that com-menced on or after April 1, 2009, of which the percent-age of completion can be reliably estimated, are recognized by the percentage-of-completion method. The percentage of completion is calculated at the cost incurred as a percentage of the estimated total cost. The completed-contract method continues to be applied for contracts for which the percentage of completion cannot be reliably estimated. There was no effect as a result of this change on net sales, operating income and income before income taxes and minority interests for the year ended March 31, 2010.
2010. The translation should not be construed as a representation that Japanese yen have been, could have been, or could in the future be converted into U.S. dollars at the above or any other rate.
3. U.S. Dollar Amounts
The translation of Japanese yen amounts into U.S. dollar amounts is included solely for convenience, as a matter of arithmetical computation only, at the rate of ¥93.04 = U.S.$1, the approximate rate of exchange at March 31,
Millions of yen Thousands of U.S. dollars 2010 2010
Acquisition Carrying Unrecognized Acquisition Carrying Unrecognized Cost amount gain (loss) Cost amount gain (loss)
Unrecognized gain items: Stock ¥21,447 ¥40,253 ¥18,806 $230,514 $432,642 $202,128Unrecognized loss items: Stock 1,155 929 (226) 12,414 9,985 (2,429)Total ¥22,603 ¥41,183 ¥18,579 $242,939 $442,638 $199,688
4. Investment Securities
At March 31, 2010 and 2009, information with respect to other securities for which market prices were available
was summarized as follows:
Millions of yen 2009 Acquisition Carrying Unrecognized Cost amount gain (loss)
Unrecognized gain items: Stock ¥19,479 ¥24,818 ¥5,339Unrecognized loss items: Stock 567 423 (144)Total ¥20,046 ¥25,241 ¥5,195
BH0909.indd 35BH0909.indd 35 10.9.12 7:33:12 PM10.9.12 7:33:12 PM
36
Proceeds from sales of securities classified as other securities amounted to ¥54 million ($580 thousand) and ¥62 million with an aggregate gain on sales of ¥0 million ($0 thousand) and ¥19 million for the years ended March 31, 2010 and 2009, respectively, and an aggregate
loss on sales of ¥0 million ($0 thousand) and nil for the years ended March 31, 2010 and 2009. Carrying amounts of non-marketable securities classified as other securities at March 31 2009 were as follows:
Other securities: Millions of yen 2009
Unlisted securities (except for OTC securities) ¥2,796Preferred stock 1,000
5. Notes and Accounts Receivable
6. Short-Term Loans Payable, Long-Term Loans Payable and Lease Obligations
(a) Notes and accounts receivable liquidated at March 31, 2010 and 2009 were as follows: Thousands of Millions of yen U.S. dollars 2010 2009 2010
Accounts receivable transferred by liquidation ¥2,800 ¥10,280 $30,095Notes receivable transferred by liquidation 2,327 7,726 25,011
(b) Notes receivable discounted at March 31, 2010 and 2009 were as follows: Thousands of Millions of yen U.S. dollars 2010 2009 2010
Notes receivable discounted ¥— ¥20 $—
At March 31, 2010 and 2009, short-term loans payable and the current portion of long-term loans payable
consisted of the following:
Thousands of Millions of yen U.S. dollars 2010 2009 2010
Bank loans ¥17,825 ¥24,581 $191,584Current portion of long-term loans payable 29,604 9,914 318,1860.95% unsecured bonds, payable in yen, due 2009 — 15,000 —Total ¥47,429 ¥49,495 $509,770
Thousands of Millions of yen U.S. dollars 2010 2009 2010
Loans from banks due through 2018 at average interest rate of 1.96% in 2010 and 1.93% in 2009 ¥161,197 ¥110,659 $1,732,5561.81% unsecured bonds, payable in yen, due 2011 15,000 15,000 161,2211.58% unsecured bonds, payable in yen, due 2012 10,000 10,000 107,4811.13% unsecured bonds, payable in yen, due 2014 15,000 — 161,221 ¥201,197 ¥135,659 $2,162,479
The average interest rates applicable to short-term loans payable outstanding at March 31, 2010 and 2009 were 1.51% and 2.93%, respectively.
Long-term loans payable at March 31, 2010 and 2009 consisted of the following:
At March 31, 2009, commercial paper (¥1,000 million) with a borrowing rate of 0.54% was included in other current liabilities. Short-term lease obligations at
March 31, 2010 and 2009 included in other current liabilities were ¥1,525 million ($16,391 thousand) and ¥966 million, respectively.
There are no securities with maturity dates classified as other securities at March 31 2009. As described in Note 14. “Financial Instruments,” the Company and certain consolidated subsidiaries have applied “Accounting Standard for Financial Instruments” and “Guideline on Disclosures about Fair Value of Financial Instruments.” The accounting
standard and the guideline are applicable to financial instruments and related disclosures effective from the beginning of the fiscal year, April 1, 2009; therefore, the information above regarding other securities is not required for the year ended March 31, 2010 and is disclosed only for the year ended March 31, 2009.
BH0909.indd 36BH0909.indd 36 10.9.12 7:33:12 PM10.9.12 7:33:12 PM

37
The annual maturities of long-term loans payable subsequent to March 31, 2010 are s ummarized as follows: Thousands ofYears ending March 31 Millions of yen U.S. dollars
2011 ¥ 29,604 $ 318,1862012 24,565 264,0262013 16,888 181,5132014 40,020 430,1382015 49,961 536,9842016 and thereafter 29,763 319,895 ¥190,801 $2,050,742
The annual maturities of lease obligations subsequent to March 31, 2010 are summarized as follows:
Thousands ofYears ending March 31 Millions of yen U.S. dollars
2011 ¥ 1,525 $ 16,3912012 3,804 40,8862013 1,354 14,5532014 1,417 15,2302015 381 4,0952016 and thereafter 2,000 21,496 ¥10,481 $112,650
7. Pledged Assets
Assets pledged as collateral for short-term loans payable of ¥136 million ($1,462 thousand) and ¥72 million, long-term loans payable of ¥714 million ($7,674
thousand) and ¥697 million, and accounts payable-trade of ¥307 million ($3,300 thousand) and ¥136 million at March 31, 2010 and 2009, respectively, were as follows:
Thousands of Millions of yen U.S. dollars 2010 2009 2010
Property, plant and equipment, at net book value ¥2,110 ¥3,176 $22,678
Assets replaced by national subsidy at March 31, 2010 and 2009 were as follows: Thousands of Millions of yen U.S. dollars 2010 2009 2010
Property, plant and equipment ¥411 ¥411 $4,417
8. Assets Replaced by National Subsidy
Income taxes applicable to the Company comprise cor-poration, enterprise and inhabitants’ taxes, which, in the aggregate, resulted in a statutory tax rate of 40.69% for the year ended March 31, 2009.
Significant components of the Company’s deferred tax assets and liabilities at March 31, 2010 and 2009 were as follows:
9. Income Taxes
Thousands of Millions of yen U.S. dollars 2010 2009 2010
Current deferred tax assets and liabilitiesDeferred tax assets: Accrued bonus ¥2,134 ¥2,000 $22,936 Loss from valuation of inventory 313 310 3,364 Accrued expenses 2,153 1,346 23,141 Other 1,975 2,538 21,227 Deferred tax assets—subtotal 6,577 6,196 70,690 Valuation allowance (171) (184) (1,838) Deferred tax assets—net 6,405 6,012 68,841 Deferred tax liabilities (46) — (494)Net deferred tax assets ¥6,359 ¥6,012 $68,347Deferred tax liabilities: Adjustment of allowance for doubtful accounts ¥ (134) ¥ (24) $ (1,440) Deferred tax liabilities—subtotal (134) (24) (1,440) Offset by deferred tax assets 46 — 494Net deferred tax liabilities ¥ (88) ¥ (24) $ (946)
BH0909.indd 37BH0909.indd 37 10.9.12 7:33:12 PM10.9.12 7:33:12 PM
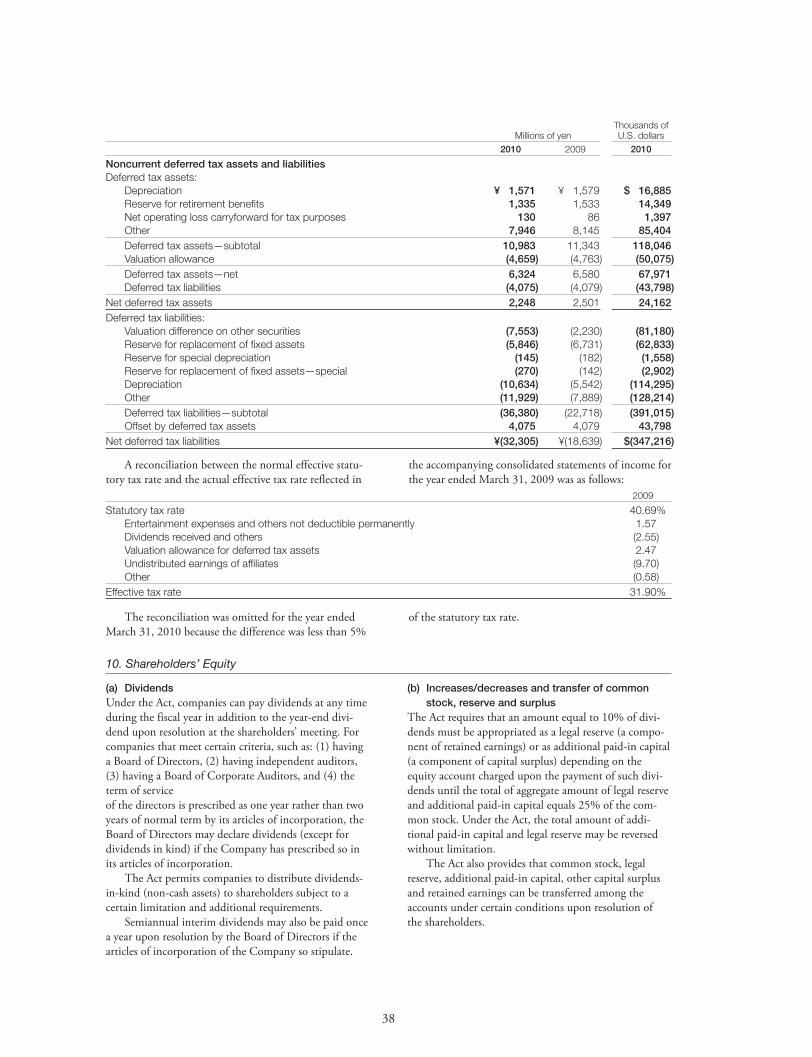
38
2009
Statutory tax rate 40.69% Entertainment expenses and others not deductible permanently 1.57 Dividends received and others (2.55) Valuation allowance for deferred tax assets 2.47 Undistributed earnings of affiliates (9.70) Other (0.58)Effective tax rate 31.90%
10. Shareholders’ Equity
(a) DividendsUnder the Act, companies can pay dividends at any time during the fiscal year in addition to the year-end divi-dend upon resolution at the shareholders’ meeting. For companies that meet certain criteria, such as: (1) having a Board of Directors, (2) having independent auditors, (3) having a Board of Corporate Auditors, and (4) the term of service of the directors is prescribed as one year rather than two years of normal term by its articles of incorporation, the Board of Directors may declare dividends (except for dividends in kind) if the Company has prescribed so in its articles of incorporation. The Act permits companies to distribute dividends-in-kind (non-cash assets) to shareholders subject to a certain limitation and additional requirements. Semiannual interim dividends may also be paid once a year upon resolution by the Board of Directors if the articles of incorporation of the Company so stipulate.
(b) Increases/decreases and transfer of common stock, reserve and surplus
The Act requires that an amount equal to 10% of divi-dends must be appropriated as a legal reserve (a compo-nent of retained earnings) or as additional paid-in capital (a component of capital surplus) depending on the equity account charged upon the payment of such divi-dends until the total of aggregate amount of legal reserve and additional paid-in capital equals 25% of the com-mon stock. Under the Act, the total amount of addi-tional paid-in capital and legal reserve may be reversed without limitation. The Act also provides that common stock, legal reserve, additional paid-in capital, other capital surplus and retained earnings can be transferred among the accounts under certain conditions upon resolution of the shareholders.
Thousands of Millions of yen U.S. dollars 2010 2009 2010
Noncurrent deferred tax assets and liabilities Deferred tax assets: Depreciation ¥ 1,571 ¥ 1,579 $ 16,885 Reserve for retirement benefits 1,335 1,533 14,349 Net operating loss carryforward for tax purposes 130 86 1,397 Other 7,946 8,145 85,404 Deferred tax assets—subtotal 10,983 11,343 118,046 Valuation allowance (4,659) (4,763) (50,075) Deferred tax assets—net 6,324 6,580 67,971 Deferred tax liabilities (4,075) (4,079) (43,798)Net deferred tax assets 2,248 2,501 24,162Deferred tax liabilities: Valuation difference on other securities (7,553) (2,230) (81,180) Reserve for replacement of fixed assets (5,846) (6,731) (62,833) Reserve for special depreciation (145) (182) (1,558) Reserve for replacement of fixed assets—special (270) (142) (2,902) Depreciation (10,634) (5,542) (114,295) Other (11,929) (7,889) (128,214) Deferred tax liabilities—subtotal (36,380) (22,718) (391,015) Offset by deferred tax assets 4,075 4,079 43,798Net deferred tax liabilities ¥(32,305) ¥(18,639) $(347,216)
A reconciliation between the normal effective statu-tory tax rate and the actual effective tax rate reflected in
the accompanying consolidated statements of income for the year ended March 31, 2009 was as follows:
The reconciliation was omitted for the year ended March 31, 2010 because the difference was less than 5%
of the statutory tax rate.
BH0909.indd 38BH0909.indd 38 10.9.12 7:33:13 PM10.9.12 7:33:13 PM
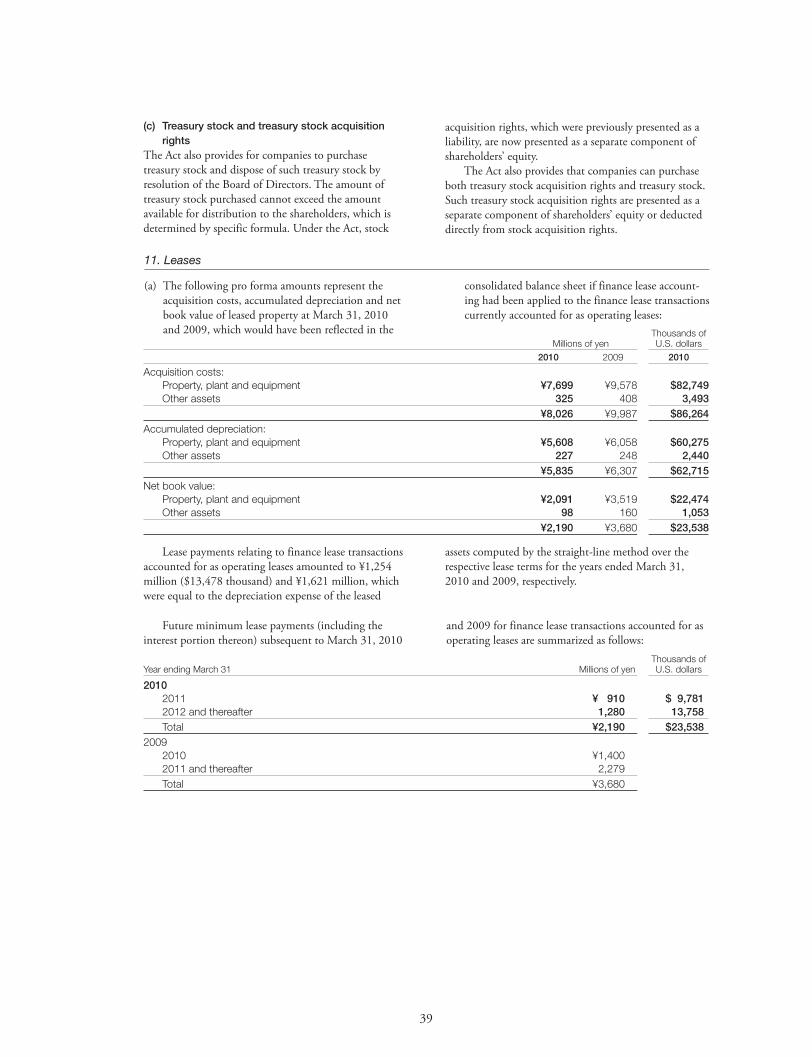
39
11. Leases
(a) The following pro forma amounts represent the acquisition costs, accumulated depreciation and net book value of leased property at March 31, 2010 and 2009, which would have been reflected in the
consolidated balance sheet if finance lease account-ing had been applied to the finance lease transactions currently accounted for as operating leases:
Thousands of Millions of yen U.S. dollars 2010 2009 2010
Acquisition costs: Property, plant and equipment ¥7,699 ¥9,578 $82,749 Other assets 325 408 3,493 ¥8,026 ¥9,987 $86,264Accumulated depreciation: Property, plant and equipment ¥5,608 ¥6,058 $60,275 Other assets 227 248 2,440 ¥5,835 ¥6,307 $62,715Net book value: Property, plant and equipment ¥2,091 ¥3,519 $22,474 Other assets 98 160 1,053 ¥2,190 ¥3,680 $23,538
Lease payments relating to finance lease transactions accounted for as operating leases amounted to ¥1,254 million ($13,478 thousand) and ¥1,621 million, which were equal to the depreciation expense of the leased
assets computed by the straight-line method over the respective lease terms for the years ended March 31, 2010 and 2009, respectively.
(c) Treasury stock and treasury stock acquisition rights
The Act also provides for companies to purchase treasury stock and dispose of such treasury stock by resolution of the Board of Directors. The amount of treasury stock purchased cannot exceed the amount available for distribution to the shareholders, which is determined by specific formula. Under the Act, stock
acquisition rights, which were previously presented as a liability, are now presented as a separate component of shareholders’ equity. The Act also provides that companies can purchase both treasury stock acquisition rights and treasury stock. Such treasury stock acquisition rights are presented as a separate component of shareholders’ equity or deducted directly from stock acquisition rights.
Thousands ofYear ending March 31 Millions of yen U.S. dollars
2010 2011 ¥ 910 $ 9,781 2012 and thereafter 1,280 13,758 Total ¥2,190 $23,5382009 2010 ¥1,400 2011 and thereafter 2,279 Total ¥3,680
Future minimum lease payments (including the interest portion thereon) subsequent to March 31, 2010
and 2009 for finance lease transactions accounted for as operating leases are summarized as follows:
BH0909.indd 39BH0909.indd 39 10.9.12 7:33:13 PM10.9.12 7:33:13 PM
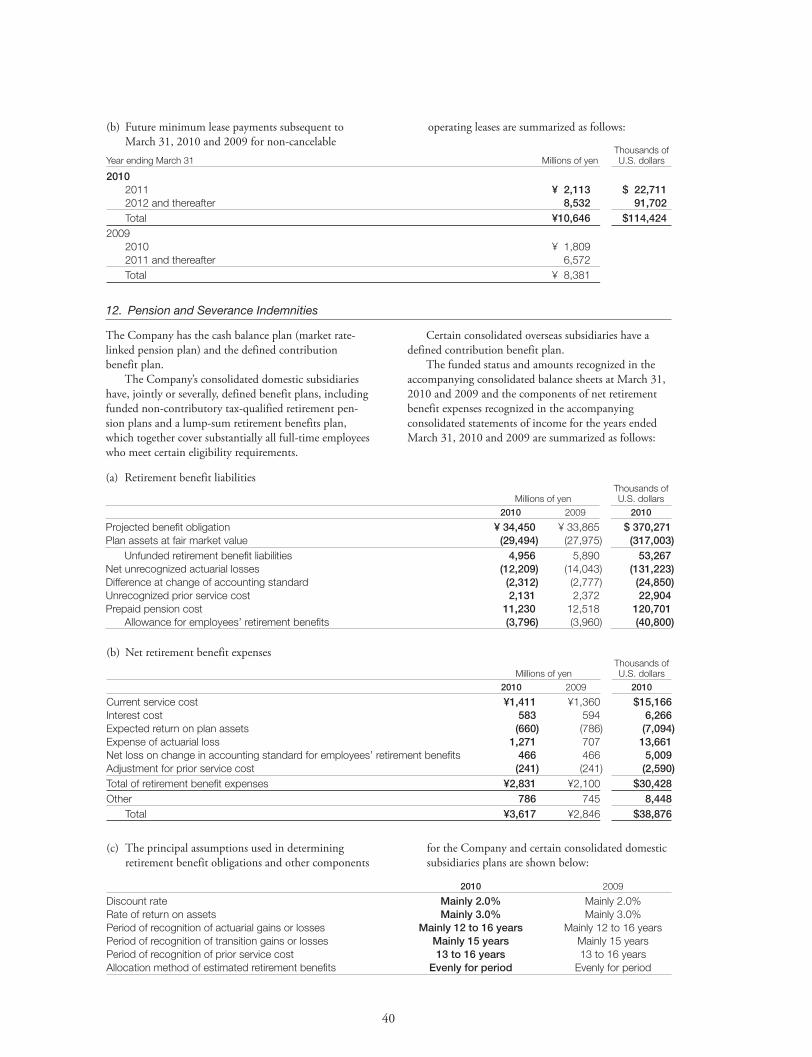
40
(a) Retirement benefit liabilities Thousands of Millions of yen U.S. dollars 2010 2009 2010
Projected benefit obligation ¥ 34,450 ¥ 33,865 $ 370,271Plan assets at fair market value (29,494) (27,975) (317,003) Unfunded retirement benefit liabilities 4,956 5,890 53,267Net unrecognized actuarial losses (12,209) (14,043) (131,223)Difference at change of accounting standard (2,312) (2,777) (24,850)Unrecognized prior service cost 2,131 2,372 22,904Prepaid pension cost 11,230 12,518 120,701 Allowance for employees’ retirement benefits (3,796) (3,960) (40,800)
12. Pension and Severance Indemnities
The Company has the cash balance plan (market rate-linked pension plan) and the defined contribution benefit plan. The Company’s consolidated domestic subsidiaries have, jointly or severally, defined benefit plans, including funded non-contributory tax-qualified retirement pen-sion plans and a lump-sum retirement benefits plan, which together cover substantially all full-time employees who meet certain eligibility requirements.
Certain consolidated overseas subsidiaries have a defined contribution benefit plan. The funded status and amounts recognized in the accompanying consolidated balance sheets at March 31, 2010 and 2009 and the components of net retirement benefit expenses recognized in the accompanying consolidated statements of income for the years ended March 31, 2010 and 2009 are summarized as follows:
(b) Net retirement benefit expenses Thousands of Millions of yen U.S. dollars 2010 2009 2010
Current service cost ¥1,411 ¥1,360 $15,166Interest cost 583 594 6,266Expected return on plan assets (660) (786) (7,094)Expense of actuarial loss 1,271 707 13,661Net loss on change in accounting standard for employees’ retirement benefits 466 466 5,009Adjustment for prior service cost (241) (241) (2,590)Total of retirement benefit expenses ¥2,831 ¥2,100 $30,428Other 786 745 8,448 Total ¥3,617 ¥2,846 $38,876
(c) The principal assumptions used in determining retirement benefit obligations and other components
for the Company and certain consolidated domestic subsidiaries plans are shown below:
2010 2009
Discount rate Mainly 2.0% Mainly 2.0%Rate of return on assets Mainly 3.0% Mainly 3.0%Period of recognition of actuarial gains or losses Mainly 12 to 16 years Mainly 12 to 16 yearsPeriod of recognition of transition gains or losses Mainly 15 years Mainly 15 yearsPeriod of recognition of prior service cost 13 to 16 years 13 to 16 yearsAllocation method of estimated retirement benefits Evenly for period Evenly for period
(b) Future minimum lease payments subsequent to March 31, 2010 and 2009 for non-cancelable
operating leases are summarized as follows:
Thousands ofYear ending March 31 Millions of yen U.S. dollars
2010 2011 ¥ 2,113 $ 22,711 2012 and thereafter 8,532 91,702 Total ¥10,646 $114,4242009 2010 ¥ 1,809 2011 and thereafter 6,572 Total ¥ 8,381
BH0909.indd 40BH0909.indd 40 10.9.12 7:33:13 PM10.9.12 7:33:13 PM
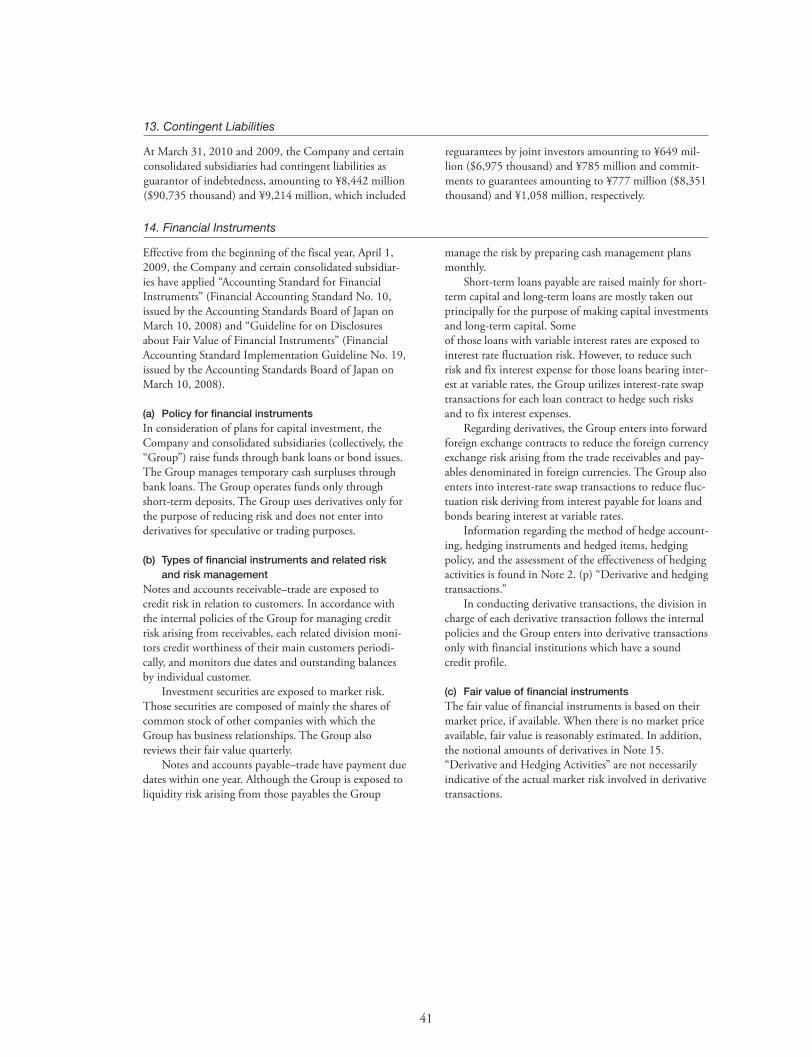
41
13. Contingent Liabilities
At March 31, 2010 and 2009, the Company and certain consolidated subsidiaries had contingent liabilities as guarantor of indebtedness, amounting to ¥8,442 million ($90,735 thousand) and ¥9,214 million, which included
reguarantees by joint investors amounting to ¥649 mil-lion ($6,975 thousand) and ¥785 million and commit-ments to guarantees amounting to ¥777 million ($8,351 thousand) and ¥1,058 million, respectively.
14. Financial Instruments
Effective from the beginning of the fiscal year, April 1, 2009, the Company and certain consolidated subsidiar-ies have applied “Accounting Standard for Financial Instruments” (Financial Accounting Standard No. 10, issued by the Accounting Standards Board of Japan on March 10, 2008) and “Guideline for on Disclosures about Fair Value of Financial Instruments” (Financial Accounting Standard Implementation Guideline No. 19, issued by the Accounting Standards Board of Japan on March 10, 2008).
(a) Policy for financial instrumentsIn consideration of plans for capital investment, the Company and consolidated subsidiaries (collectively, the “Group”) raise funds through bank loans or bond issues. The Group manages temporary cash surpluses through bank loans. The Group operates funds only through short-term deposits. The Group uses derivatives only for the purpose of reducing risk and does not enter into derivatives for speculative or trading purposes.
(b) Types of financial instruments and related risk and risk management
Notes and accounts receivable–trade are exposed to credit risk in relation to customers. In accordance with the internal policies of the Group for managing credit risk arising from receivables, each related division moni-tors credit worthiness of their main customers periodi-cally, and monitors due dates and outstanding balances by individual customer. Investment securities are exposed to market risk. Those securities are composed of mainly the shares of common stock of other companies with which the Group has business relationships. The Group also reviews their fair value quarterly. Notes and accounts payable–trade have payment due dates within one year. Although the Group is exposed to liquidity risk arising from those payables the Group
manage the risk by preparing cash management plans monthly. Short-term loans payable are raised mainly for short-term capital and long-term loans are mostly taken out principally for the purpose of making capital investments and long-term capital. Some of those loans with variable interest rates are exposed to interest rate fluctuation risk. However, to reduce such risk and fix interest expense for those loans bearing inter-est at variable rates, the Group utilizes interest-rate swap transactions for each loan contract to hedge such risks and to fix interest expenses. Regarding derivatives, the Group enters into forward foreign exchange contracts to reduce the foreign currency exchange risk arising from the trade receivables and pay-ables denominated in foreign currencies. The Group also enters into interest-rate swap transactions to reduce fluc-tuation risk deriving from interest payable for loans and bonds bearing interest at variable rates. Information regarding the method of hedge account-ing, hedging instruments and hedged items, hedging policy, and the assessment of the effectiveness of hedging activities is found in Note 2. (p) “Derivative and hedging transactions.” In conducting derivative transactions, the division in charge of each derivative transaction follows the internal policies and the Group enters into derivative transactions only with financial institutions which have a sound credit profile.
(c) Fair value of financial instrumentsThe fair value of financial instruments is based on their market price, if available. When there is no market price available, fair value is reasonably estimated. In addition, the notional amounts of derivatives in Note 15. “Derivative and Hedging Activities” are not necessarily indicative of the actual market risk involved in derivative transactions.
BH0909.indd 41BH0909.indd 41 10.9.12 7:33:13 PM10.9.12 7:33:13 PM

42
The table above does not include financial instru-ments for which it is extremely difficult to determine the fair value. For information on those items, please refer to note (2) below. The current portion of long-term loans
payable shown as “Short-term loans payable” in consoli-dated balance sheet are included in “Long-term loans payable” in the table above.
Valuation method of fair value of financial instruments and information on investment securities and derivative transactions were as follows:
Cash and deposits and notes and accounts receivable–tradeSince these items are settled in a short period of time, their carrying amount approximates fair value.
Investment securitiesThe fair value of stocks is based on quoted market prices of the stock exchange. For information on securities classified by holding purpose, please refer to Note 4. “Investment securities.”
Notes and accounts payable–trade and short-term loans payableSince these items are settled in a short period of time, their carrying amount approximates fair value.
Long-term loans payableThe fair value of bonds is measured at the quoted mar-ket price. The fair value of long-term loans payable other than bonds is based on the present value of the total of principal and interest discounted by the inter-est rate combined of the risk free rate and credit spread. Interest-rate swap transactions are utilized for most variable rate loans to fix interest expense. All interest-rate swap transactions meet the criteria for the short-cut method of interest-rate swap transactions and are integrally processed with those loans. Therefore, the fair value of those loans is based on the present value of the total of principal and interest processed with interest-rate swap discounted by the rate above.
Thousands of U.S. dollars Carrying amount Fair value Difference
Cash and deposits $ 258,265 $ 258,265 $ —Notes and accounts receivable–trade 1,372,388 1,372,388 —Investment securities: Other securities 442,638 442,638 —Total assets $2,073,291 $2,073,291 $ —Notes and accounts payable–trade $ 730,073 $ 730,073 $ —Short-term loans payable 191,584 191,584 —Long-term loans payable 2,480,675 2,515,423 34,748Total liabilities $3,402,343 $3,437,092 $34,748
(2) Financial instruments for which it is extremely difficult to determine the fair value Thousands of Millions of yen U.S. dollars
Unlisted stocks ¥19,995 $214,908Preferred stocks 1,000 10,748
Millions of yen Carrying amount Fair value Difference
Cash and deposits ¥ 24,029 ¥ 24,029 ¥ —Notes and accounts receivable–trade 127,687 127,687 —Investment securities: Other securities 41,183 41,183 —Total assets ¥192,899 ¥192,899 ¥ —Notes and accounts payable–trade ¥ 67,926 ¥ 67,926 ¥ —Short-term loans payable 17,825 17,825 —Long-term loans payable 230,802 234,035 3,233Total liabilities ¥316,554 ¥319,787 ¥3,233
(1) Fair value of financial instrumentsCarrying amount on the consolidated balance sheet as of March 31, 2010 and estimated fair value and differences of financial instruments were as follows:
BH0909.indd 42BH0909.indd 42 10.9.12 7:33:13 PM10.9.12 7:33:13 PM
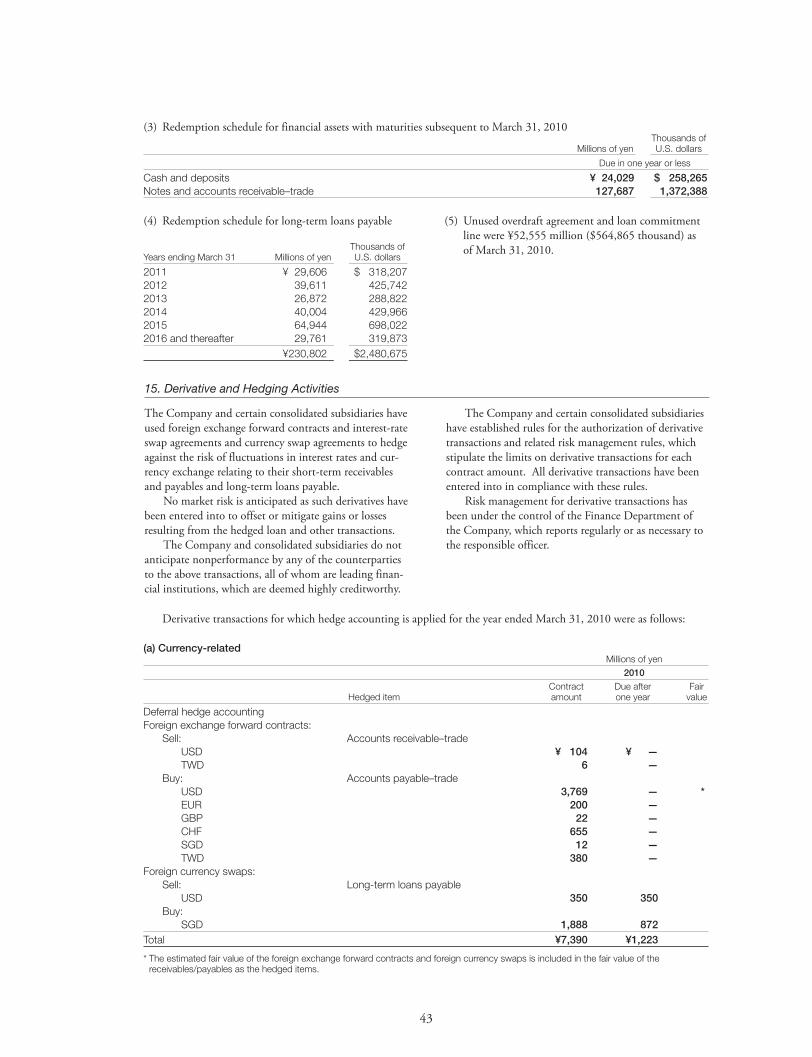
43
(3) Redemption schedule for financial assets with maturities subsequent to March 31, 2010 Thousands of Millions of yen U.S. dollars
Due in one year or less
Cash and deposits ¥ 24,029 $ 258,265Notes and accounts receivable–trade 127,687 1,372,388
(5) Unused overdraft agreement and loan commitment line were ¥52,555 million ($564,865 thousand) as of March 31, 2010.
The Company and certain consolidated subsidiaries have used foreign exchange forward contracts and interest-rate swap agreements and currency swap agreements to hedge against the risk of fluctuations in interest rates and cur-rency exchange relating to their short-term receivables and payables and long-term loans payable. No market risk is anticipated as such derivatives have been entered into to offset or mitigate gains or losses resulting from the hedged loan and other transactions. The Company and consolidated subsidiaries do not anticipate nonperformance by any of the counterparties to the above transactions, all of whom are leading finan-cial institutions, which are deemed highly creditworthy.
The Company and certain consolidated subsidiaries have established rules for the authorization of derivative transactions and related risk management rules, which stipulate the limits on derivative transactions for each contract amount. All derivative transactions have been entered into in compliance with these rules. Risk management for derivative transactions has been under the control of the Finance Department of the Company, which reports regularly or as necessary to the responsible officer.
15. Derivative and Hedging Activities
Derivative transactions for which hedge accounting is applied for the year ended March 31, 2010 were as follows:
(a) Currency-related Millions of yen 2010
Contract Due after Fair Hedged item amount one year value
Deferral hedge accountingForeign exchange forward contracts: Sell: Accounts receivable–trade USD ¥ 104 ¥ — TWD 6 — Buy: Accounts payable–trade USD 3,769 — * EUR 200 — GBP 22 — CHF 655 — SGD 12 — TWD 380 — Foreign currency swaps: Sell: Long-term loans payable USD 350 350 Buy: SGD 1,888 872 Total ¥7,390 ¥1,223
* The estimated fair value of the foreign exchange forward contracts and foreign currency swaps is included in the fair value of the receivables/payables as the hedged items.
(4) Redemption schedule for long-term loans payable
Thousands ofYears ending March 31 Millions of yen U.S. dollars
2011 ¥ 29,606 $ 318,2072012 39,611 425,7422013 26,872 288,8222014 40,004 429,9662015 64,944 698,0222016 and thereafter 29,761 319,873 ¥230,802 $2,480,675
BH0909.indd 43BH0909.indd 43 10.9.12 7:33:13 PM10.9.12 7:33:13 PM
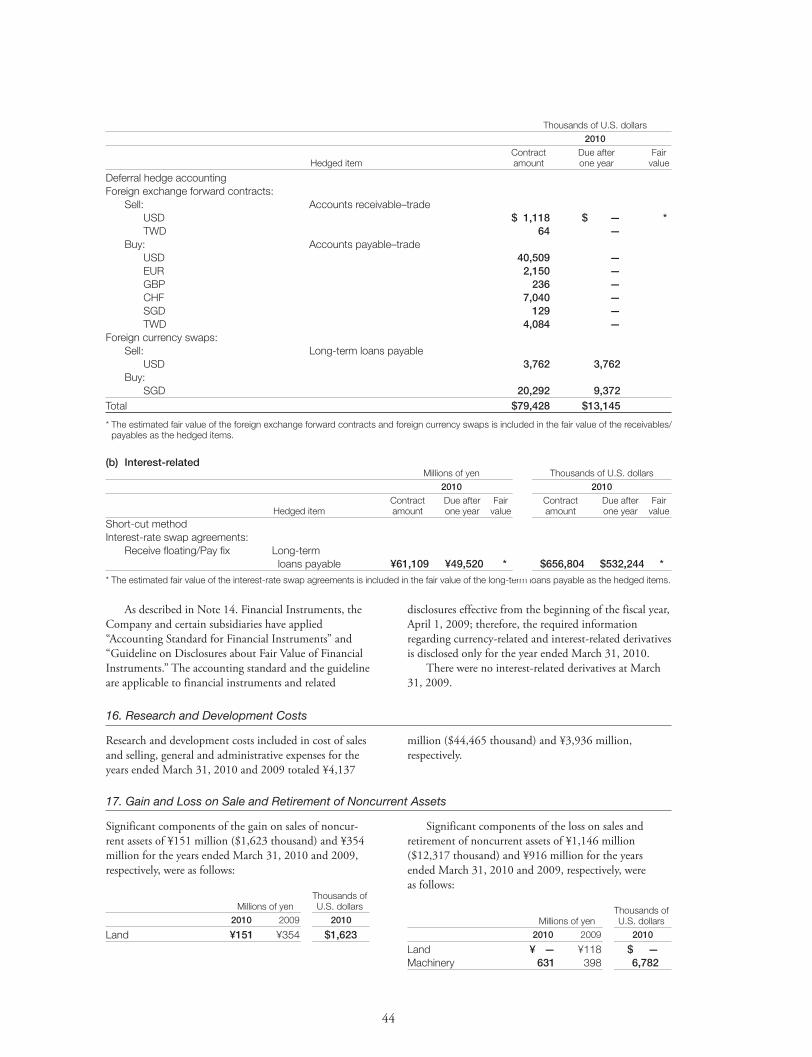
44
Significant components of the gain on sales of noncur-rent assets of ¥151 million ($1,623 thousand) and ¥354 million for the years ended March 31, 2010 and 2009, respectively, were as follows:
Thousands of Millions of yen U.S. dollars 2010 2009 2010
Land ¥151 ¥354 $1,623
Significant components of the loss on sales and retirement of noncurrent assets of ¥1,146 million ($12,317 thousand) and ¥916 million for the years ended March 31, 2010 and 2009, respectively, were as follows:
Thousands of Millions of yen U.S. dollars 2010 2009 2010
Land ¥ — ¥118 $ —Machinery 631 398 6,782
16. Research and Development Costs
Research and development costs included in cost of sales and selling, general and administrative expenses for the years ended March 31, 2010 and 2009 totaled ¥4,137
million ($44,465 thousand) and ¥3,936 million, respectively.
17. Gain and Loss on Sale and Retirement of Noncurrent Assets
(b) Interest-related Millions of yen Thousands of U.S. dollars 2010 2010
Contract Due after Fair Contract Due after Fair Hedged item amount one year value amount one year valueShort-cut methodInterest-rate swap agreements: Receive floating/Pay fix Long-term loans payable ¥61,109 ¥49,520 * $656,804 $532,244 *
* The estimated fair value of the interest-rate swap agreements is included in the fair value of the long-term loans payable as the hedged items.
As described in Note 14. Financial Instruments, the Company and certain subsidiaries have applied “Accounting Standard for Financial Instruments” and “Guideline on Disclosures about Fair Value of Financial Instruments.” The accounting standard and the guideline are applicable to financial instruments and related
disclosures effective from the beginning of the fiscal year, April 1, 2009; therefore, the required information regarding currency-related and interest-related derivatives is disclosed only for the year ended March 31, 2010. There were no interest-related derivatives at March 31, 2009.
Thousands of U.S. dollars 2010
Contract Due after Fair Hedged item amount one year value
Deferral hedge accountingForeign exchange forward contracts: Sell: Accounts receivable–trade USD $ 1,118 $ — * TWD 64 — Buy: Accounts payable–trade USD 40,509 — EUR 2,150 — GBP 236 — CHF 7,040 — SGD 129 — TWD 4,084 — Foreign currency swaps: Sell: Long-term loans payable USD 3,762 3,762 Buy: SGD 20,292 9,372 Total $79,428 $13,145
* The estimated fair value of the foreign exchange forward contracts and foreign currency swaps is included in the fair value of the receivables/payables as the hedged items.
BH0909.indd 44BH0909.indd 44 10.9.12 7:33:13 PM10.9.12 7:33:13 PM
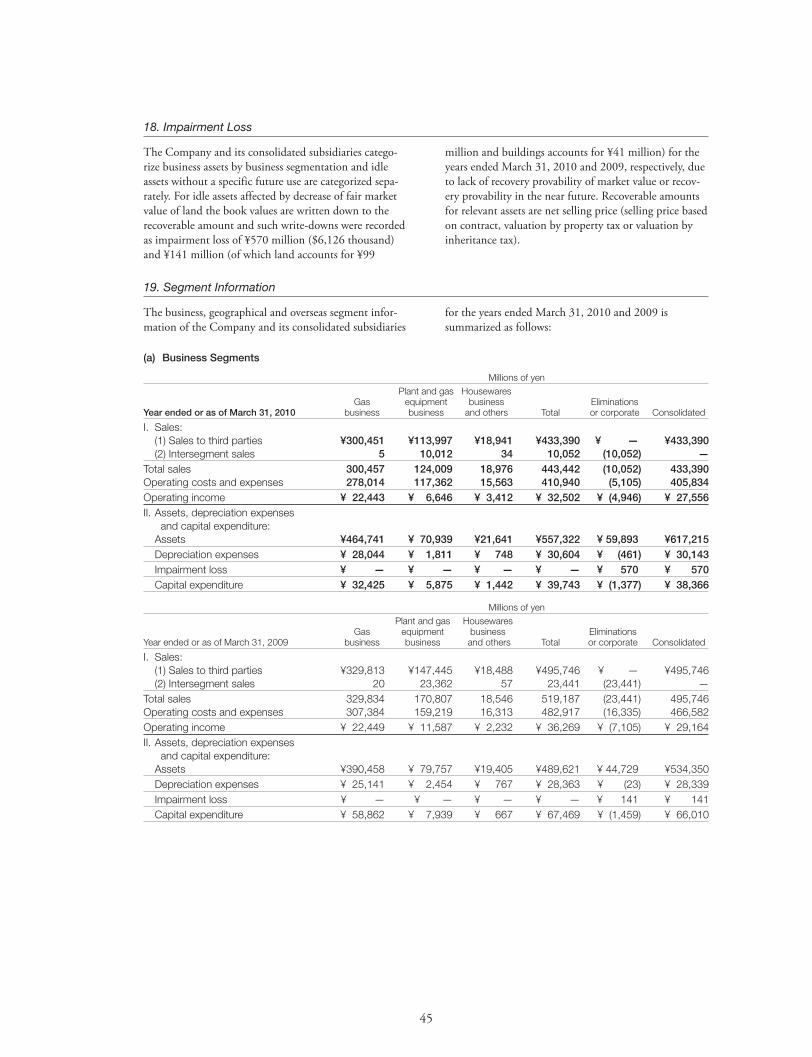
45
18. Impairment Loss
The Company and its consolidated subsidiaries catego-rize business assets by business segmentation and idle assets without a specific future use are categorized sepa-rately. For idle assets affected by decrease of fair market value of land the book values are written down to the recoverable amount and such write-downs were recorded as impairment loss of ¥570 million ($6,126 thousand) and ¥141 million (of which land accounts for ¥99
million and buildings accounts for ¥41 million) for the years ended March 31, 2010 and 2009, respectively, due to lack of recovery provability of market value or recov-ery provability in the near future. Recoverable amounts for relevant assets are net selling price (selling price based on contract, valuation by property tax or valuation by inheritance tax).
19. Segment Information
The business, geographical and overseas segment infor-mation of the Company and its consolidated subsidiaries
for the years ended March 31, 2010 and 2009 is summarized as follows:
(a) Business Segments
Millions of yen Plant and gas Housewares Gas equipment business EliminationsYear ended or as of March 31, 2010 business business and others Total or corporate Consolidated
I. Sales: (1) Sales to third parties ¥300,451 ¥113,997 ¥18,941 ¥433,390 ¥ — ¥433,390 (2) Intersegment sales 5 10,012 34 10,052 (10,052) —Total sales 300,457 124,009 18,976 443,442 (10,052) 433,390Operating costs and expenses 278,014 117,362 15,563 410,940 (5,105) 405,834Operating income ¥ 22,443 ¥ 6,646 ¥ 3,412 ¥ 32,502 ¥ (4,946) ¥ 27,556II. Assets, depreciation expenses and capital expenditure: Assets ¥464,741 ¥ 70,939 ¥21,641 ¥557,322 ¥ 59,893 ¥617,215 Depreciation expenses ¥ 28,044 ¥ 1,811 ¥ 748 ¥ 30,604 ¥ (461) ¥ 30,143 Impairment loss ¥ — ¥ — ¥ — ¥ — ¥ 570 ¥ 570 Capital expenditure ¥ 32,425 ¥ 5,875 ¥ 1,442 ¥ 39,743 ¥ (1,377) ¥ 38,366
Millions of yen Plant and gas Housewares Gas equipment business EliminationsYear ended or as of March 31, 2009 business business and others Total or corporate Consolidated
I. Sales: (1) Sales to third parties ¥329,813 ¥147,445 ¥18,488 ¥495,746 ¥ — ¥495,746 (2) Intersegment sales 20 23,362 57 23,441 (23,441) —Total sales 329,834 170,807 18,546 519,187 (23,441) 495,746Operating costs and expenses 307,384 159,219 16,313 482,917 (16,335) 466,582Operating income ¥ 22,449 ¥ 11,587 ¥ 2,232 ¥ 36,269 ¥ (7,105) ¥ 29,164II. Assets, depreciation expenses and capital expenditure: Assets ¥390,458 ¥ 79,757 ¥19,405 ¥489,621 ¥ 44,729 ¥534,350 Depreciation expenses ¥ 25,141 ¥ 2,454 ¥ 767 ¥ 28,363 ¥ (23) ¥ 28,339 Impairment loss ¥ — ¥ — ¥ — ¥ — ¥ 141 ¥ 141 Capital expenditure ¥ 58,862 ¥ 7,939 ¥ 667 ¥ 67,469 ¥ (1,459) ¥ 66,010
BH0909.indd 45BH0909.indd 45 10.9.12 7:33:13 PM10.9.12 7:33:13 PM
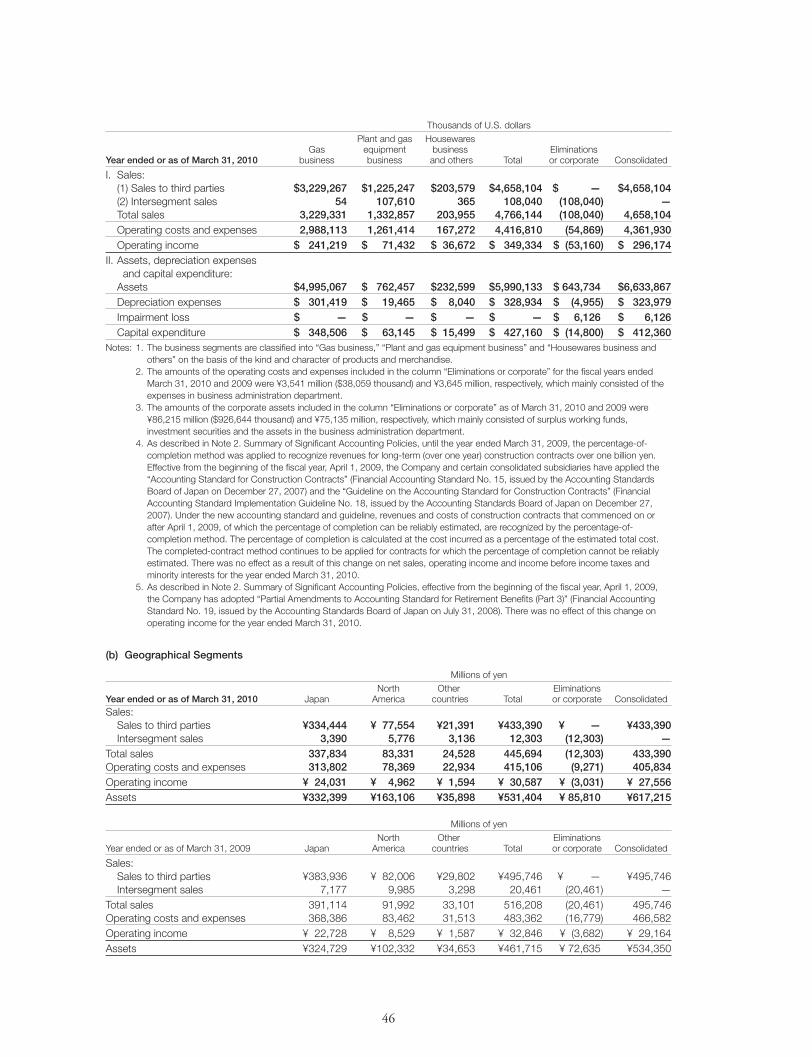
46
Notes: 1. The business segments are classified into “Gas business,” “Plant and gas equipment business” and “Housewares business and others” on the basis of the kind and character of products and merchandise.
2. The amounts of the operating costs and expenses included in the column “Eliminations or corporate” for the fiscal years ended March 31, 2010 and 2009 were ¥3,541 million ($38,059 thousand) and ¥3,645 million, respectively, which mainly consisted of the expenses in business administration department.
3. The amounts of the corporate assets included in the column “Eliminations or corporate” as of March 31, 2010 and 2009 were ¥86,215 million ($926,644 thousand) and ¥75,135 million, respectively, which mainly consisted of surplus working funds, investment securities and the assets in the business administration department.
4. As described in Note 2. Summary of Significant Accounting Policies, until the year ended March 31, 2009, the percentage-of- completion method was applied to recognize revenues for long-term (over one year) construction contracts over one billion yen. Effective from the beginning of the fiscal year, April 1, 2009, the Company and certain consolidated subsidiaries have applied the “Accounting Standard for Construction Contracts” (Financial Accounting Standard No. 15, issued by the Accounting Standards Board of Japan on December 27, 2007) and the “Guideline on the Accounting Standard for Construction Contracts” (Financial Accounting Standard Implementation Guideline No. 18, issued by the Accounting Standards Board of Japan on December 27, 2007). Under the new accounting standard and guideline, revenues and costs of construction contracts that commenced on or after April 1, 2009, of which the percentage of completion can be reliably estimated, are recognized by the percentage-of- completion method. The percentage of completion is calculated at the cost incurred as a percentage of the estimated total cost. The completed-contract method continues to be applied for contracts for which the percentage of completion cannot be reliably estimated. There was no effect as a result of this change on net sales, operating income and income before income taxes and minority interests for the year ended March 31, 2010.
5. As described in Note 2. Summary of Significant Accounting Policies, effective from the beginning of the fiscal year, April 1, 2009, the Company has adopted “Partial Amendments to Accounting Standard for Retirement Benefits (Part 3)” (Financial Accounting Standard No. 19, issued by the Accounting Standards Board of Japan on July 31, 2008). There was no effect of this change on operating income for the year ended March 31, 2010.
Thousands of U.S. dollars Plant and gas Housewares Gas equipment business EliminationsYear ended or as of March 31, 2010 business business and others Total or corporate Consolidated
I. Sales: (1) Sales to third parties $3,229,267 $1,225,247 $203,579 $4,658,104 $ — $4,658,104 (2) Intersegment sales 54 107,610 365 108,040 (108,040) — Total sales 3,229,331 1,332,857 203,955 4,766,144 (108,040) 4,658,104 Operating costs and expenses 2,988,113 1,261,414 167,272 4,416,810 (54,869) 4,361,930 Operating income $ 241,219 $ 71,432 $ 36,672 $ 349,334 $ (53,160) $ 296,174II. Assets, depreciation expenses and capital expenditure: Assets $4,995,067 $ 762,457 $232,599 $5,990,133 $ 643,734 $6,633,867 Depreciation expenses $ 301,419 $ 19,465 $ 8,040 $ 328,934 $ (4,955) $ 323,979 Impairment loss $ — $ — $ — $ — $ 6,126 $ 6,126 Capital expenditure $ 348,506 $ 63,145 $ 15,499 $ 427,160 $ (14,800) $ 412,360
(b) Geographical Segments
Millions of yen North Other EliminationsYear ended or as of March 31, 2010 Japan America countries Total or corporate ConsolidatedSales: Sales to third parties ¥334,444 ¥ 77,554 ¥21,391 ¥433,390 ¥ — ¥433,390 Intersegment sales 3,390 5,776 3,136 12,303 (12,303) —Total sales 337,834 83,331 24,528 445,694 (12,303) 433,390Operating costs and expenses 313,802 78,369 22,934 415,106 (9,271) 405,834Operating income ¥ 24,031 ¥ 4,962 ¥ 1,594 ¥ 30,587 ¥ (3,031) ¥ 27,556Assets ¥332,399 ¥163,106 ¥35,898 ¥531,404 ¥ 85,810 ¥617,215
Millions of yen North Other EliminationsYear ended or as of March 31, 2009 Japan America countries Total or corporate Consolidated
Sales: Sales to third parties ¥383,936 ¥ 82,006 ¥29,802 ¥495,746 ¥ — ¥495,746 Intersegment sales 7,177 9,985 3,298 20,461 (20,461) —Total sales 391,114 91,992 33,101 516,208 (20,461) 495,746Operating costs and expenses 368,386 83,462 31,513 483,362 (16,779) 466,582Operating income ¥ 22,728 ¥ 8,529 ¥ 1,587 ¥ 32,846 ¥ (3,682) ¥ 29,164Assets ¥324,729 ¥102,332 ¥34,653 ¥461,715 ¥ 72,635 ¥534,350
BH0909.indd 46BH0909.indd 46 10.9.12 7:33:13 PM10.9.12 7:33:13 PM
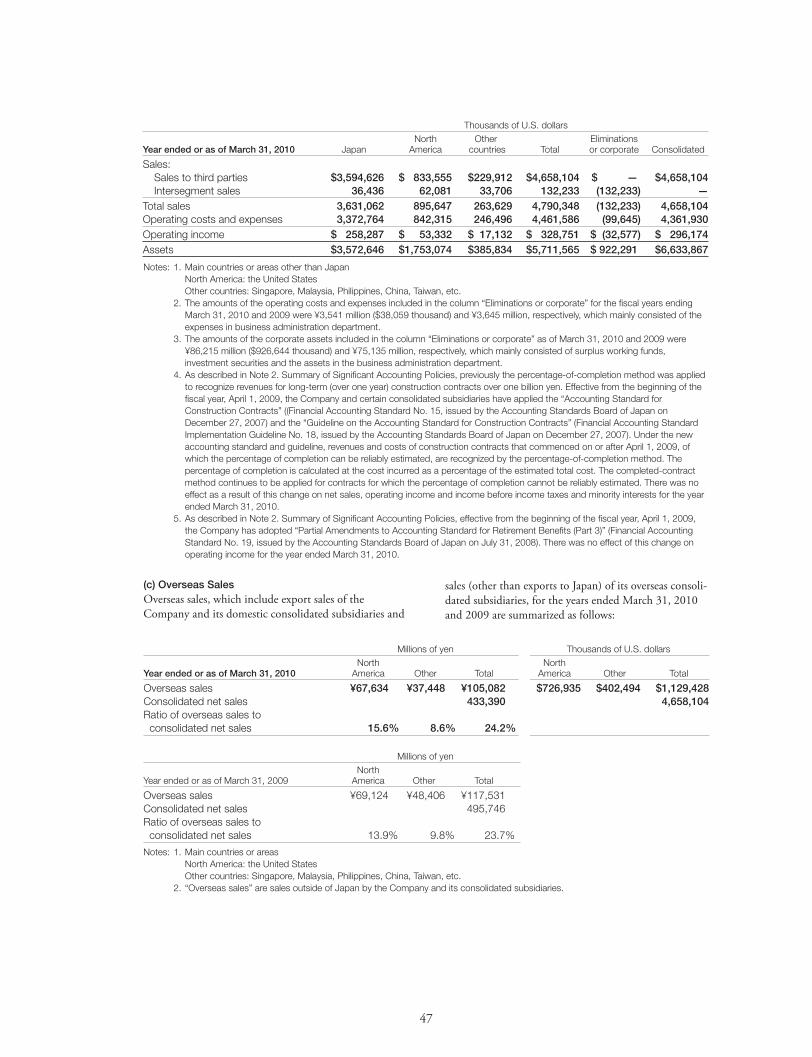
47
Notes: 1. Main countries or areas other than Japan North America: the United States Other countries: Singapore, Malaysia, Philippines, China, Taiwan, etc. 2. The amounts of the operating costs and expenses included in the column “Eliminations or corporate” for the fiscal years ending
March 31, 2010 and 2009 were ¥3,541 million ($38,059 thousand) and ¥3,645 million, respectively, which mainly consisted of the expenses in business administration department.
3. The amounts of the corporate assets included in the column “Eliminations or corporate” as of March 31, 2010 and 2009 were ¥86,215 million ($926,644 thousand) and ¥75,135 million, respectively, which mainly consisted of surplus working funds, investment securities and the assets in the business administration department.
4. As described in Note 2. Summary of Significant Accounting Policies, previously the percentage-of-completion method was applied to recognize revenues for long-term (over one year) construction contracts over one billion yen. Effective from the beginning of the fiscal year, April 1, 2009, the Company and certain consolidated subsidiaries have applied the “Accounting Standard for Construction Contracts” ((Financial Accounting Standard No. 15, issued by the Accounting Standards Board of Japan on December 27, 2007) and the “Guideline on the Accounting Standard for Construction Contracts” (Financial Accounting Standard Implementation Guideline No. 18, issued by the Accounting Standards Board of Japan on December 27, 2007). Under the new accounting standard and guideline, revenues and costs of construction contracts that commenced on or after April 1, 2009, of which the percentage of completion can be reliably estimated, are recognized by the percentage-of-completion method. The percentage of completion is calculated at the cost incurred as a percentage of the estimated total cost. The completed-contract method continues to be applied for contracts for which the percentage of completion cannot be reliably estimated. There was no effect as a result of this change on net sales, operating income and income before income taxes and minority interests for the year ended March 31, 2010.
5. As described in Note 2. Summary of Significant Accounting Policies, effective from the beginning of the fiscal year, April 1, 2009, the Company has adopted “Partial Amendments to Accounting Standard for Retirement Benefits (Part 3)” (Financial Accounting Standard No. 19, issued by the Accounting Standards Board of Japan on July 31, 2008). There was no effect of this change on operating income for the year ended March 31, 2010.
Thousands of U.S. dollars North Other EliminationsYear ended or as of March 31, 2010 Japan America countries Total or corporate Consolidated
Sales: Sales to third parties $3,594,626 $ 833,555 $229,912 $4,658,104 $ — $4,658,104 Intersegment sales 36,436 62,081 33,706 132,233 (132,233) —Total sales 3,631,062 895,647 263,629 4,790,348 (132,233) 4,658,104Operating costs and expenses 3,372,764 842,315 246,496 4,461,586 (99,645) 4,361,930Operating income $ 258,287 $ 53,332 $ 17,132 $ 328,751 $ (32,577) $ 296,174Assets $3,572,646 $1,753,074 $385,834 $5,711,565 $ 922,291 $6,633,867
(c) Overseas SalesOverseas sales, which include export sales of the Company and its domestic consolidated subsidiaries and
sales (other than exports to Japan) of its overseas consoli-dated subsidiaries, for the years ended March 31, 2010 and 2009 are summarized as follows:
Millions of yen Thousands of U.S. dollars North NorthYear ended or as of March 31, 2010 America Other Total America Other Total
Overseas sales ¥67,634 ¥37,448 ¥105,082 $726,935 $402,494 $1,129,428Consolidated net sales 433,390 4,658,104Ratio of overseas sales to consolidated net sales 15.6% 8.6% 24.2%
Notes: 1. Main countries or areas North America: the United States Other countries: Singapore, Malaysia, Philippines, China, Taiwan, etc. 2. “Overseas sales” are sales outside of Japan by the Company and its consolidated subsidiaries.
Millions of yen NorthYear ended or as of March 31, 2009 America Other Total
Overseas sales ¥69,124 ¥48,406 ¥117,531Consolidated net sales 495,746Ratio of overseas sales to consolidated net sales 13.9% 9.8% 23.7%
BH0909.indd 47BH0909.indd 47 10.9.12 7:33:13 PM10.9.12 7:33:13 PM
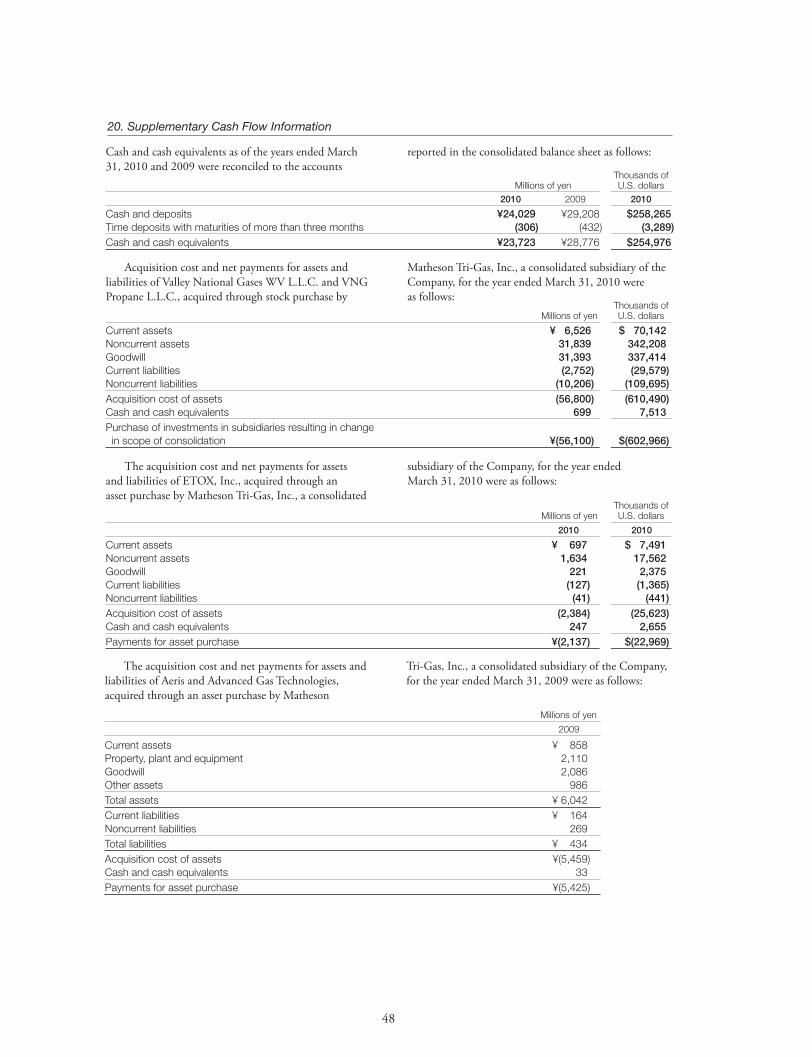
48
20. Supplementary Cash Flow Information
Cash and cash equivalents as of the years ended March 31, 2010 and 2009 were reconciled to the accounts
Acquisition cost and net payments for assets and liabilities of Valley National Gases WV L.L.C. and VNG Propane L.L.C., acquired through stock purchase by
reported in the consolidated balance sheet as follows:
Matheson Tri-Gas, Inc., a consolidated subsidiary of the Company, for the year ended March 31, 2010 were as follows:
Thousands of Millions of yen U.S. dollars 2010 2009 2010
Cash and deposits ¥24,029 ¥29,208 $258,265Time deposits with maturities of more than three months (306) (432) (3,289)Cash and cash equivalents ¥23,723 ¥28,776 $254,976
Thousands of Millions of yen U.S. dollars
Current assets ¥ 6,526 $ 70,142Noncurrent assets 31,839 342,208Goodwill 31,393 337,414Current liabilities (2,752) (29,579)Noncurrent liabilities (10,206) (109,695)Acquisition cost of assets (56,800) (610,490)Cash and cash equivalents 699 7,513Purchase of investments in subsidiaries resulting in change in scope of consolidation ¥(56,100) $(602,966)
The acquisition cost and net payments for assets and liabilities of ETOX, Inc., acquired through an asset purchase by Matheson Tri-Gas, Inc., a consolidated
The acquisition cost and net payments for assets and liabilities of Aeris and Advanced Gas Technologies, acquired through an asset purchase by Matheson
subsidiary of the Company, for the year ended March 31, 2010 were as follows:
Tri-Gas, Inc., a consolidated subsidiary of the Company, for the year ended March 31, 2009 were as follows:
Thousands of Millions of yen U.S. dollars
2010 2010
Current assets ¥ 697 $ 7,491Noncurrent assets 1,634 17,562Goodwill 221 2,375Current liabilities (127) (1,365)Noncurrent liabilities (41) (441)Acquisition cost of assets (2,384) (25,623)Cash and cash equivalents 247 2,655Payments for asset purchase ¥(2,137) $(22,969)
Thousands of Millions of yen U.S. dollars
2009 2010
Current assets ¥ 858Property, plant and equipment 2,110Goodwill 2,086Other assets 986Total assets ¥ 6,042Current liabilities ¥ 164Noncurrent liabilities 269Total liabilities ¥ 434Acquisition cost of assets ¥(5,459)Cash and cash equivalents 33Payments for asset purchase ¥(5,425)
BH0909.indd 48BH0909.indd 48 10.9.12 7:33:13 PM10.9.12 7:33:13 PM
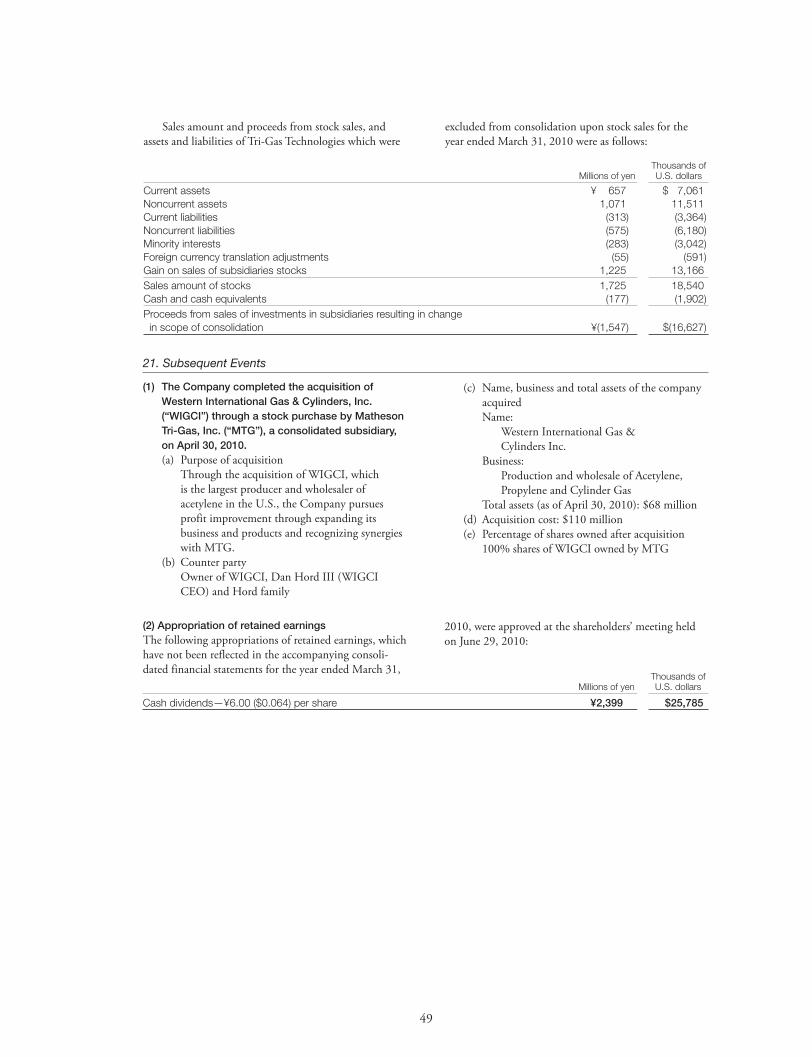
49
Sales amount and proceeds from stock sales, and assets and liabilities of Tri-Gas Technologies which were
excluded from consolidation upon stock sales for the year ended March 31, 2010 were as follows:
Thousands of Millions of yen U.S. dollars
Current assets ¥ 657 $ 7,061Noncurrent assets 1,071 11,511Current liabilities (313) (3,364)Noncurrent liabilities (575) (6,180)Minority interests (283) (3,042)Foreign currency translation adjustments (55) (591)Gain on sales of subsidiaries stocks 1,225 13,166Sales amount of stocks 1,725 18,540Cash and cash equivalents (177) (1,902)Proceeds from sales of investments in subsidiaries resulting in change in scope of consolidation ¥(1,547) $(16,627)
(1) The Company completed the acquisition of Western International Gas & Cylinders, Inc. (“WIGCI”) through a stock purchase by Matheson Tri-Gas, Inc. (“MTG”), a consolidated subsidiary, on April 30, 2010.
(a) Purpose of acquisition Through the acquisition of WIGCI, which
is the largest producer and wholesaler of acetylene in the U.S., the Company pursues profit improvement through expanding its business and products and recognizing synergies with MTG.
(b) Counter party Owner of WIGCI, Dan Hord III (WIGCI
CEO) and Hord family
(c) Name, business and total assets of the company acquired
Name: Western International Gas &
Cylinders Inc. Business: Production and wholesale of Acetylene,
Propylene and Cylinder Gas Total assets (as of April 30, 2010): $68 million (d) Acquisition cost: $110 million (e) Percentage of shares owned after acquisition 100% shares of WIGCI owned by MTG
21. Subsequent Events
Thousands of Millions of yen U.S. dollars
Cash dividends—¥6.00 ($0.064) per share ¥2,399 $25,785
(2) Appropriation of retained earningsThe following appropriations of retained earnings, which have not been reflected in the accompanying consoli-dated financial statements for the year ended March 31,
2010, were approved at the shareholders’ meeting held on June 29, 2010:
BH0909.indd 49BH0909.indd 49 10.9.12 7:33:13 PM10.9.12 7:33:13 PM
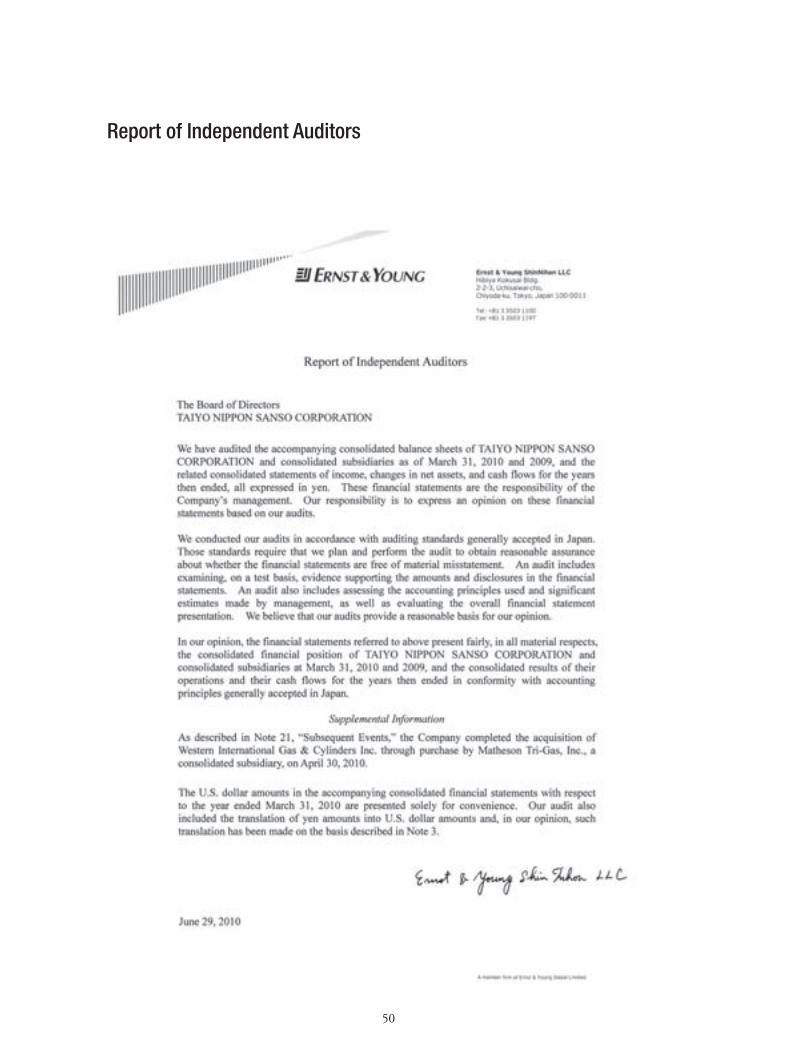
50
Report of Independent Auditors
BH0909.indd 50BH0909.indd 50 10.9.12 7:33:13 PM10.9.12 7:33:13 PM
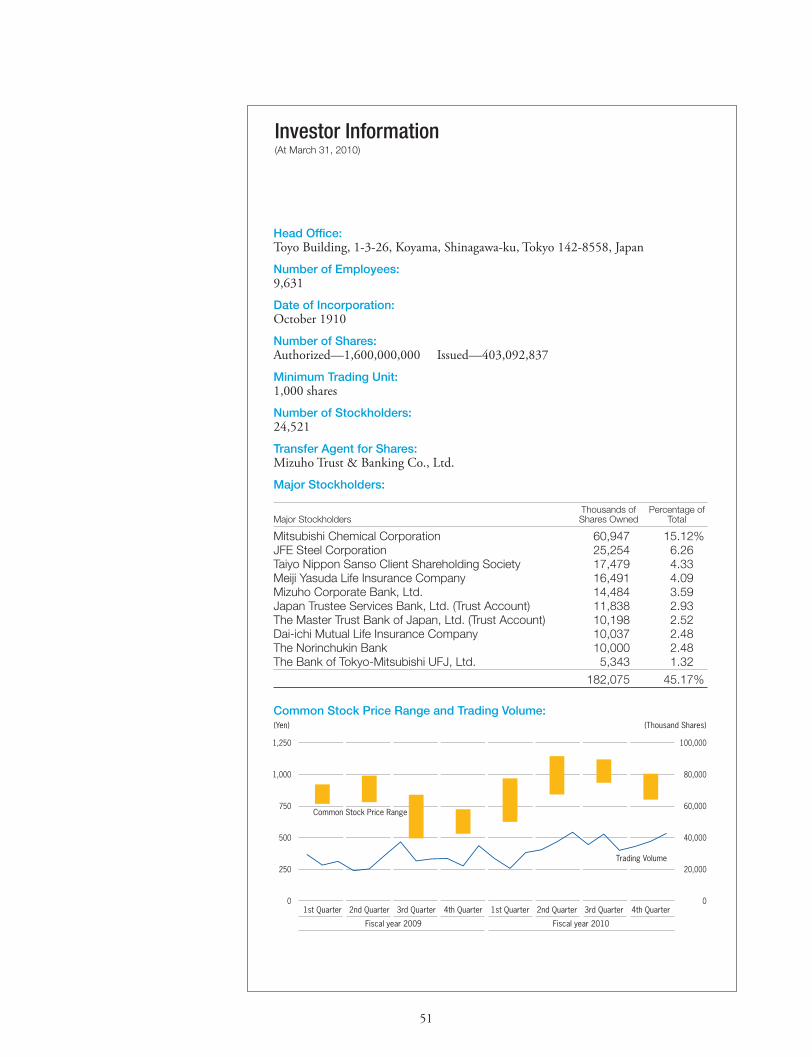
51
Investor Information(At March 31, 2010)
Head Office: Toyo Building, 1-3-26, Koyama, Shinagawa-ku, Tokyo 142-8558, Japan
Number of Employees: 9,631
Date of Incorporation: October 1910
Number of Shares: Authorized—1,600,000,000 Issued—403,092,837
Minimum Trading Unit:1,000 shares
Number of Stockholders: 24,521
Transfer Agent for Shares: Mizuho Trust & Banking Co., Ltd.
Major Stockholders:
Thousands of Percentage ofMajor Stockholders Shares Owned Total
Mitsubishi Chemical Corporation 60,947 15.12%JFE Steel Corporation 25,254 6.26Taiyo Nippon Sanso Client Shareholding Society 17,479 4.33Meiji Yasuda Life Insurance Company 16,491 4.09Mizuho Corporate Bank, Ltd. 14,484 3.59Japan Trustee Services Bank, Ltd. (Trust Account) 11,838 2.93The Master Trust Bank of Japan, Ltd. (Trust Account) 10,198 2.52Dai-ichi Mutual Life Insurance Company 10,037 2.48The Norinchukin Bank 10,000 2.48The Bank of Tokyo-Mitsubishi UFJ, Ltd. 5,343 1.32
182,075 45.17%
Common Stock Price Range and Trading Volume: (Yen) (Thousand Shares)
0
250
500
750
1,000
1,250
0
20,000
40,000
60,000
80,000
100,000
4th Quarter3rd Quarter2nd Quarter1st Quarter4th Quarter3rd Quarter2nd Quarter1st Quarter
Fiscal year 2010Fiscal year 2009
Common Stock Price Range
Trading Volume
BH0909.indd 51BH0909.indd 51 10.9.12 7:33:14 PM10.9.12 7:33:14 PM

215
Toyo Building, 1-3-26, Koyama,
Shinagawa-ku, Tokyo 142-8558, Japan
Tel: 81-3-5788-8000
www.tn-sanso.co.jp
Printed in Japan
TAIY
O N
IPP
ON
SA
NS
O C
orp
oratio
n A
nn
ual R
epo
rt 20
10