thesis submitted to national centre of excellence in...
TRANSCRIPT

HYDRO- CHEMICAL INVESTIGATIONS OF HIGH ALTITUDE
ALPINE LAKES OF GILGIT AND GHIZAR DISTRICTS, NORTHERN
AREAS OF PAKISTAN
BY
ISLAM UD DIN
Thesis Submitted to National Centre of Excellence in Geology
University of Peshawar, in Partial Fulfillment of the requirements
of the Degree of Master of Philosophy in Geology.
National Centre of Excellence in Geology
University of Peshawar
(2010)


CONTENTS
List of Tables I
List of Figures 1
List of abbreviations V
Abstract VII
Acknowledgements X
Chapter 1 page No
1. Introduction 1
1.1. General Statement 1
1.2. . Introduction of Northern Areas 5
1.2.1. Geographical location 5
1.2.2. History of Northern areas 6
1.2.3. Climate 8
1.2.4. Land and Soil Status 9
1.2.5. Topography 9
1.2.6.Lakes 11
1.2.7. Forest 12
1.2.8. Biodiversity 13
1.3. Aims and objectives 13
Chapter 2
2. Study areas discribtion 14
2.1. Naltar wetland complex 15
2.1.1. Hydrology 15
2.1.2. Geology of the area 15
2.2. Uttar lake at Iskoman 18
2.2.1. Geomorphology 18
2.2.2. Hydrology 18
2.2.3. Geology of the area 20
2.3. Hundrap lake at Hundrap 20

2.3.1. Geomorphology 20
2.3.2. Hydrology 21
2.3.3. Geology of the area 21
2.4. Baha lake at Khukosh 23
2.4.1. Hydrology 23
2.4.2. Geology of the area 23
2.5. Ecological and socio-economic values of alpine lakes in the Gilgit region 25
2.5.1. Biological resources 25
2.5.2. Sources of water 25
2.5.3. Pastures 25
2.5.4. Fish production 25
2.5.5. Tourism Resorts 25
2.6. Current potential threats to alpine lakes 26
2.6.1. Overgrazing 26
2.6.2. Illegal hunting 26
2.6.2. Illegal Hunting 26
2.7. Geomorphalogical sitting of the lakes in the study area 26
2.7.1. Karakuram Range (Naltar Wetland Complex) 27
2.7.2. Hindukush Range (Uttar, Hundrap and Baha Lakes) 28
Chapter 3
3. Literature review 30
Chapter 4
4. Methodology 41
4.1. Field work 41
4.1.1. Water sampling 41
4.2. Laboratory Methods 41
4.2.1. Determination of physical parameters 41
4.2.1.1. Determination of Temperature 46
4.2.1.2. Determination of pH 46
4.2.1.3. Determination of electric conductivity (EC) 46
4.2.1.4. total dissolved solids (TDS) 47

4.2.1.5. Determination of turbidity /transparency 47
4.2.1.6. Determination of salinity 47
4.2.1.7. Determination of resistivity 47
4.2.2. Determination of chemical parameters 48
4.2.2.1. Determination of Anions 48
4.2.2.1.1. Chloride (Cl-) 48
4.2.2.1.2. Nitrate (NO3-) 48
4.2.2.1.3. Sulfate (SO4-2
) 49
4.2.2.1.4. Carbonates (CO3-2
) and bicarbonates (HCO3-) 49
4.2.2.2. Determination of light elements 50
4.2.2.2.1. Determination of Na and potassium K 50
4.2.2.2.2. Determination of Ca and Mg 51
4.2.2.3. Determination of trace and heavy metals by using Graphite Furnace 51
4.2.2.3.1. Determination of manganese (Mn) 51
4.2.2.3.2. Determination of iron (Fe) 52
4.2.2.3.3. Determination of copper (Cu) 53
4.2.2.3.4. Determination of lead (Pb) 53
4.2.2.3.5. Determination of zinc (Zn) 54
4.2.2.3.6. Determination of nickel (Ni) 55
4.2.2.3.7. Determination of chromium (Cr) 55
4.2.2.3.8 Determination of cadmium (Cd) 56
4.2.2.4. Determination of toxic elements, arsenic (As) and mercury (Hg) 57
by Mercury Hydride System (MHS)
4.2.2.4.1. Determination of Mercury (Hg) 57
4.2.2.4.2. Determination of Arsenic (As) 58
4.3. Piper diagram scheme 59
4.4. GIS 59
Chapter 5
5. Water chemistry 60
5.1. Introduction 60

5.2. Water pollution 61
5.2.1. Sources of water pollution 62
5.2.2. Types of water pollutants 62
5.3. Water chemistry 63
5.4. Water chemistry of the study areas 64
5.4.1. Physical parameters 65
5.4.2. Anions 74
5.4.3. Light elements 79
5.4.4. Classification of water 83
5.4.5. Heavy metals 84
Chapter 6
6. Discussion 181
6.1. Physical parameters 182
6.2. Anions 183
6.3. Light elements 184
6.4. Heavy metals 185
6.5. Statistical analysis of water quality 188
6.6. Health risk assessment 196
6.6.1. Average daily dose (ADD) 197
6.6.2. Hazard quotient (HQ) 200
6.6.3. Cancer risk (CR) 201
Conclusions 206
Recommendations 208
References 209
Annexure

i
List of the Tables
Table. No. Captions Page. No.
Table.1.1 Important Peaks of the Northern Areas 9
Table.1.2 Important Glaciers of the Northern Areas 10
Table.1.3 Important lakes of the Northern Areas 11
Table.5.1 Physical parameters 105
Table.5.2 Anions 108
Table.5.3 Light elements 111
Table.5.4 Trace metals 114
Table.6.1 Pearson’s correlation Matrix for Naltar wetland complex and
respective stream.
192
Table.6.2 Pearson’s correlation Matrix for Uttar lake and respective stream. 193
Table.6.3 Pearson’s correlation Matrix for Hundrap lake and respective
stream.
194
Table.6.4 Pearson’s correlation Matrix for Baha lake and respective stream. 195
Table.6.5 Health risk assessment (ADD, HQ and CR) for Naltar wetland
complex and respective stream.
202
Table.6.6 Health risk assessment (ADD, HQ and CR) for Uttar lake and
respective stream.
203
Table.6.7 Health risk assessment (ADD, HQ and CR) for Hundrap lake and
respective stream.
204
Table.7.8 Health risk assessment (ADD, HQ and CR) for Baha lake and
respective stream.
205
List of the Figures
Figure No. Captions Page No.
Figure 1.1 Map of the northern areas 7
Figure 1.2 Temperature variation in northern areas of Pakistan 8
Figure 2.1 Generalized map of he study area 14
Fig.2.2 GIS based map showing various lakes of the Naltar wetland complex at
Naltar. 16
Figure 2.3 GIS map showing accessibility to Naltar lakes 17
Figure 2.4 GIS map showing accessibility to Uttar lake 19
Figure 2.5 GIS map showing accessibility to Hundrap lake 21
Figure 2.6 GIS map showing accessibility to Baha lake 24
Figure 2.7 Generalized geological map of study area 29
Figure 4.1 GIS map showing sampling point at Naltar 42
ii
Figure 4.2 GIS map showing sampling point at Iskoman 43
Figure 4.3 GIS map showing sampling point at Hundrap 43
Figure 4.4 GIS map showing sampling point at Khukosh 45
Figure 5.1 Variations of temperature in the water of study areas 117
Figure 5.2 Variations of pH in the water of study areas 118
Figure 5.3 Variations of electric conductivity in the water of study areas 119
Figure 5.4 Variations of total dissolved solid in the water of study 120
Figure 5.5 Variations in turbidity in the water of study areas 121
Figure 5.6 Variations in salinity in the water of study areas 122
Figure 5.7 Variations in resistivity in the water of study areas 123
Figure 5.8 Concentrations of chloride in the water of study areas 124
Figure 5.9 Concentrations of sulfate in the water of study areas 125
Figure 5.10 Concentrations of nitrate in the water of study areas 126
Figure 5.11 Concentrations of bicarbonate in the water of study areas 127
Figure 5.12 Concentrations sodium in the water of study areas 128
Figure 5.13 Concentrations of potassium in the water of study areas 129
Figure 5.14 Concentrations of calcium in the water of study areas 130
Figure 5.15 Concentrations of magnesium in the water of study areas 131
Figure 5.16 Concentrations of manganese in the water of study areas 132
Figure 5.17 Concentrations of iron in the water of study areas 133
Figure 5.18 Concentrations of copper in the water of study areas 134
Figure 5.19 Concentrations of lead in the water of study areas 135
Figure 5.20 Concentrations of zinc in the water of study areas 136
Figure 5.21 Concentrations of nickel in the water of study areas 137
Figure 5.22 Concentrations of chromium in the water of study areas 138
Figure 5.23 Concentrations of cadmium in the water of study areas 139
Figure 5.24 Concentrations of arsenic in the water of study areas 140
Figure 5.25
The composition of water of the Naltar lakes and its stream in the piper
diagram 141
Figure 5.26
The composition of water of the Uttar lake and its stream in the piper
diagram 142
Figure 5.27
The composition of water of the Hundrap lake and its stream in the piper
diagram 143
Figure 5.28
The composition of water of the Baha lake and its stream in the piper
diagram 144
Figure 5.29
GIS based distribution pattern of Mn in the water of Naltar lakes and
their streams at Naltar 145
Figure 5.30
GIS based distribution pattern of Mn in the water of Uttar lake and its
streams at Iskoman 146
Figure 5.31
GIS based distribution pattern of Mn in the water of Hundrap lake and its
streams at Hundrap 147

iii
Figure 5.32
GIS based distribution pattern of Mn in the water of Baha lake and its
streams at Khukosh 148
Figure 5.33 GIS based distribution pattern of Fe in the water of Naltar lakes and
their5streams at Naltar 149
Figure 5.34 GIS 5ased distribution pattern of Fe in the water of Uttar lake and its
strea5s at Iskoman 150
Figure 5.35 GIS based distribution pattern of Fe in the water of Hundrap lake and its
streams at Hundrap 151
Figure 5.36 GIS based distribution pattern of Fe in the water of Baha lake and its
streams at Khukosh 152
Figure 5.37 GIS based distribution pattern of Cu in the water of Naltar lakes and their
streams at Naltar 153
Figure 5.38 GIS based distribution pattern of Cu in the water of Uttar lake and its
streams at Iskoman 154
Figure 5.39 GIS based distribution pattern of Cu in the water of Hundrap lake and its
streams at Hundrap 155
Figure 5.40 GIS based distribution pattern of Cu in the water of Baha lake and its
streams at Khukosh 156
Figure 5.41 GIS based distribution pattern of Pb in the water of Naltar lakes and their
streams at Naltar 157
Figure 5.42 GIS based distribution pattern of Pb in the water of Uttar lake and its
streams at Iskoman 158
Figure 5.43 GIS based distribution pattern of Pb in the water of Hundrap lake and its
streams at Hundrap 159
Figure 5.44 GIS based distribution pattern of Pb in the water of Baha lake and its
streams at Khukosh 160
Figure 5.45 GIS based distribution pattern of Zn in the water of Naltar lakes and their
streams at Naltar 161
Figure 5.46 GIS based distribution pattern of Zn in the water of Uttar lake and its
streams at Iskoman 162
Figure 5.47 GIS based distribution pattern of Zn in the water of Hundrap lake and its
streams at Hundrap 163
Figure 5.48 GIS based distribution pattern of Zn in the water of Baha lake and its
streams at Khukosh 164
Figure 5.49 GIS based distribution pattern of Ni in the water of Naltar lakes and their
streams at Naltar 165
Figure 5.50 GIS based distribution pattern of Ni in the water of Uttar lake and its
streams at Iskoman 166
Figure 5.51 GIS based distribution pattern of Ni in the water of Hundrap lake and its
streams at Hundrap 167
Figure 5.52 GIS based distribution pattern of Ni in the water of Baha lake and its
streams at Khukosh 168
Figure 5.53 GIS based distribution pattern of Cr in the water of Naltar lakes and their
streams at Naltar 169
Figure 5.54 GIS based distribution pattern of Cr in the water of Uttar lake and its
streams at Iskoman 170

iv
Figure 5.55 GIS based distribution pattern of Cr in the water of Hundrap lake and its
streams at Hundrap 171
Figure 5.56 GIS based distribution pattern of Cr in the water of Baha lake and
its5streams at Khukosh 172
Figure 5.57 GI5 based distribution pattern of Cd in the water of Naltar lakes and their
streams at Naltar 173
Figure 5.58 GIS based distribution pattern of Cd in the water of Uttar lake and its
streams at Iskoman 174
Figure 5.59 GIS based distribution pattern of Cd in the water of Hundrap lake and its
streams at Hundrap 175
Figure 5.60 GIS based distribution pattern of Cd in the water of Baha lake and its
streams at Khukosh 176
Figure 5.61 GIS based distribution pattern of As in the water of Naltar lakes and their
streams at Naltar 177
Figure 5.62 GIS based distribution pattern of As in the water of Uttar lake and its
streams at Iskoman 178
Figure 5.63 GIS based distribution pattern of As in the water of Hundrap lake and its
streams at Hundrap 179
Figure 5.64 GIS based distribution pattern of As in the water of Baha lake and its
streams at Khukosh 180

v
List of Abbreviations
Abbreviations Captions
ADD
AKRSP
AT
BDL
BW
CR
DOC
DON
DHQ
DDT
EEA
EC
ED
EF
HQ
FANA
GIS
HCB
Average Daily Dose
Agha Khan Rural Support Programme
Average Time
Below Diction Level
Body Weight
Cancer Risk
Dissolved Organic Carbon
Dioxynivalenol
District Head Quarter
Dichloro Diphenyl Trichloroethane
Extracellular Enzyme Activities
Electric Conductivity
Exposure Duration
Exposure frequency
Hazard Quotient
Federally Administrated Northern Areas
Geographical Information System
Hexachlorobenzene

vi
IR
IUCN
HCH
KKH
L
Mg/L
MSH
NAs
NASED
PCBs
POC
POP
PON
REEs
SKM
Std.dev
TDS
μg/l
USEPA
UNEP
WSHSP
WWF
WHO
Ingestion Rate
International Union for Conservation of Natural Resources
Hexachlorocyclohexane
Karakoram Highway
Liter
Milligram Per Liter
Mercury Hydrated System
Northern Areas
Northern Areas State of Environmental Development
Polychlorinated Biphenyls
Particulate Organic Compound
Persistent Organic Pollutant
Particulate Organic Nitrogen
Rare Earth Elements
Southern Karakoram Metamorphic
Standard Deviation
Total Dissolved Solids
Microgram Per Liter
US, Environmental Protection Agency
United Nation Environmental Programme
Water Sanitation, Hygiene, and Health Studies Project
World Wilde Fun for Nature
World Health Organization

vii
ABSTRACT
Glaciers and their melt fed streams and lakes are most important as their
analysis provides essential information on current continental geochemical processes.
They drain the continental weathered products to downward rivers and oceans and play a
major role in the global sea-water evolution. The present study is to investigate the
physio-chemical parameters in water of nine selected high altitude alpine lakes (i.e.,
Naltar wetland complex, Uttar, Hundrap and Baha lakes), and their respective streams
possessing four sites within the two districts (Gilgit and Ghizar), northern areas of
Pakistan. The northern areas cover an isolated mountainous terrain in the northern
extreme of Pakistan referred to as the roof of the world. The northern areas of Pakistan is
sandwiched between three famous mountain ranges, the Himalayas, Karakuram and the
Hindukush, containing natural landscape, glaciers, tracking paths and beautiful high
altitude alpine lakes. These high altitude alpine lakes are the major water resources that
fulfill the basic life requirements in the region. People use the water from lakes for
drinking and irrigation purposes. Besides fulfilling the basic needs of the inhabitants of
the area, these lakes also have great significance in promotion of tourism in the region.
No detail studies of the high altitude alpine lakes of the northern areas of Pakistan have
ever been conducted in regard to the physico-chemical contamination and consequent
environmental degradation. Therefore, the present study is purposed to investigate the
environmental degradations, if any, related to these lakes in the region.
The present work involves 50 various water samples of lakes and streams which
have been analysed in regard to environmental impact assessment of water of the study
area. The data obtained after the analysis of these water samples were compared with the
international water quality standards set by WHO (2008) and USEPA (2009). Analyses
viii
of these samples were performed by using instruments such as Consort Electrochemical
analyzer, JENWAY 6035, Turbidity meter, DR/2800 Photospectrometer and
Electrothermal Atomic Absorption spectrometer.
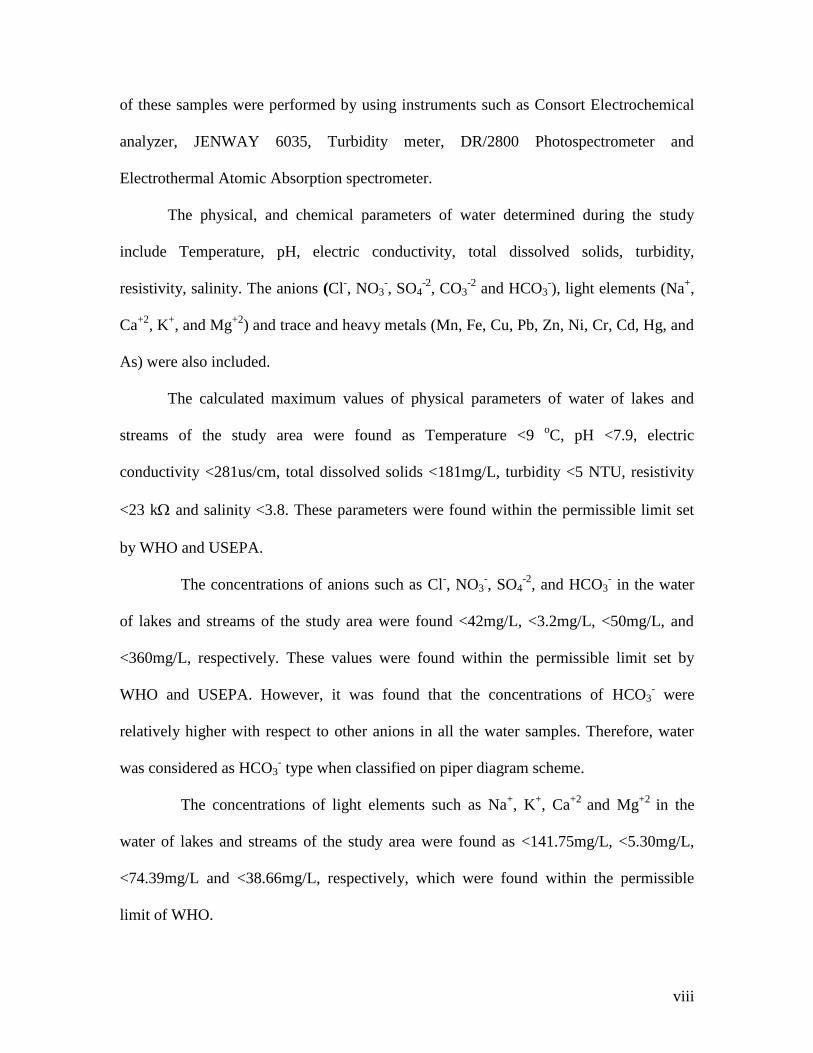
The physical, and chemical parameters of water determined during the study
include Temperature, pH, electric conductivity, total dissolved solids, turbidity,
resistivity, salinity. The anions (Cl-, NO3
-, SO4
-2, CO3
-2 and HCO3
-), light elements (Na
+,
Ca+2
, K+, and Mg
+2) and trace and heavy metals (Mn, Fe, Cu, Pb, Zn, Ni, Cr, Cd, Hg, and
As) were also included.
The calculated maximum values of physical parameters of water of lakes and
streams of the study area were found as Temperature <9 oC, pH <7.9, electric
conductivity <281us/cm, total dissolved solids <181mg/L, turbidity <5 NTU, resistivity
<23 k and salinity <3.8. These parameters were found within the permissible limit set
by WHO and USEPA.
The concentrations of anions such as Cl-, NO3
-, SO4
-2, and HCO3
- in the water
of lakes and streams of the study area were found <42mg/L, <3.2mg/L, <50mg/L, and
<360mg/L, respectively. These values were found within the permissible limit set by
WHO and USEPA. However, it was found that the concentrations of HCO3- were
relatively higher with respect to other anions in all the water samples. Therefore, water
was considered as HCO3- type when classified on piper diagram scheme.
The concentrations of light elements such as Na+, K
+, Ca
+2 and Mg
+2 in the
water of lakes and streams of the study area were found as <141.75mg/L, <5.30mg/L,
<74.39mg/L and <38.66mg/L, respectively, which were found within the permissible
limit of WHO.

ix
Among trace and heavy metals, the concentrations of Hg was found below the
detection level in all the water samples, while the remaining metals such as Mn, Fe, Cu,
Pb, Zn, Ni, Cr, Cd, and As were having concentrations <110μg/L, <868μg/L, <84μg/L,
<10μg/L, <1282μg/L, <29.39μg/L, <8μg/L,<5μg/L and <6μg/l, respectively. It was
noticed that the concentrations of Cu, Zn, Ni, and Cr were within the permissible limits
set by WHO and USEPA, while the concentrations of Fe, Pb, Cd, and As in some of the
samples were found slightly higher than those of USEPA.
Statistically, the quality of water in the study area was analyzed by Pearson’s
correlationship and it was found that some of the physio-chemicals pairs have not any
interrelationships, however, in most of the pairs strong positive (r =>50) and strong
negative (r =->50) interrelationships were found.
Finally, health risk assessments like average daily dose (ADD), hazards
quotient (HQ) and cancer risk (CR) indices for the trace and heavy metals in the water of
lakes and streams of the study area were calculated by using statistical formulas set by
USEPA, and it was found that all trace and heavy metals have an average values of HQ
<1 and CR <1 per 1, 000,000 inhabitants which was vary low when compared with
USEPA. Therefore, neither any chronic risk (HQ), nor carcinogenic risk (CR) was found
in the water of lakes and streams of the study area.
It is concluded on the basis of the hydro-chemical investigations of high altitude
alpine lakes with their respective streams of Gilgit and Ghizar Districts of northern areas
of Pakistan, that the water of lakes and their related streams is suitable for drinking and
irrigation.

x
ACKNOWLEDGMENTS
Prior to all, I am deeply grateful to the real blessor of the Universe, “ALLAH
ALMIGHTY” the most merciful and adored, hearty blessings for the Prophet Muhammad
(PBUH) Who guided the mankind towards Siraat-al- Mustaqeem.
With the completion of this report preferably, I prostrate before Allah for His blessings
upon me to have this opportunity. I take this site to express my warmest gratitude and
indebtedness to my supervisor Dr. Muhammad Tahir Shah, Professor, National Centre of
Excellence in Geology University of Peshawar, who not only provided me fruitful
guidance, but his very sympathetic attitude always encouraged and inspired me to work
hard. He provided me all possible opportunities, and his useful supervision will always
been appreciated.
I extend my most profound thanks to Dr. M. Asif Khan, Professor and Director, NCE in
Geology University of Peshawar who not only provided me invaluable guidance,
continuous support, advice and encouragement but also provided me transport facility
for fulfillment of my thesis field work easily.
I also owe a debt of gratitude to Dr. Sardar Khan, Associate Professor Department of
Environmental Science, University of Peshawar and Babar khan, head WWf-Gilgit
Northern Areas of Pakaistan who not only provided me professional guidance but also
solved my problems that I faced during this research work.
I extend special thanks to my esteemed and credible friends and colleagues specially Ms.
Nida Gul, Ms Shazia Jabeen, Mr. Said Muhammad, Syed Zahid Shah, Iltaf Ahmad, Qazi
yasar Hamid, Syed Ali Turab and Syed Muntazir Abbas for their prudent suggestions and
invaluable help through out the study. I am also thankful to Mr. Tariq and Bilal for their
help in my lab work.
I am hearty obliged to National Centre of Excellence in Geology, University of Peshawar
for facilitating me with all the material support to ensure in-time completion of the task
successfully.
Finally, my family members especially my parents and brother Liaqat Ali deserve
regards and special thanks for their moral and financial support throughout my
education carrier, without whose help I may not been able to achieve my goals. May God
bless them and may God provide me a chance to serve them better (Amin).

1
CHAPTER 1
INTRODUCTION
1.1. General statement
Today our planet is facing a lot of obstacles in which the most significant is the
degradation of environment (Khan, 1996). Environment is the circumstances or
conditions that surrounding an organism, or group of organisms. It includes the physical,
cultural and biological resources. The relationship of an organism to its surrounding is
called its Ecosystem. Degradation of environment destroys the ecosystem and makes the
existence of life difficult (Enger and Smith, 2006).
The word environment has been defined by William et al. (2005) as, the complex
of social or cultural condition that affects an individual or community. Therefore, an
environment is the some or all the features and conditions surrounding an organism that
may influence on that organism. An individual’s physical environment encompasses
rock, soil, air, water, light and temperature, and other organisms, while in case of their
social environment includes a network of family and friends, a particular political system,
and set of social customs that affect one’s behavior (Montgomery, 2006).
The main objective of environmental crises is the release of different types of
pollutants to the environment. A pollutant can be defined as the existence of substances
in greater abundance than that of its natural concentration and is harmful to the
environment (Manahan, 2005). There are two agencies, which are responsible for the
degradation of environment i.e., human impact and natural processes. Human impact on
environment has produced unexpected, unpleasant and even dangerous consequences.
Water logging and overgrazing have converted hundred of thousand of acres of fertile

2
land into barren desert. Improper plugging and tilling techniques cause fertile soil to wash
away in heavy rain. Industrial pollution is another main environmental problem caused
by human. Industrial wastes that drained in to the rivers and lakes cause killing of the fish
and other organisms living in the water. On the other hand natural process include
earthquake, floods, volcanoes, water and soil contamination with heavy metals are the
main cause of degradation (Coleman and Gressey, 1947).
The global degradation of environment is mainly caused by the rapid
development (poorly planed), lack of environmental awareness, and over exploitation of
world renewable and non-renewable resources (Asian Development Bank, 1986).
Among the physical environment water is one of the most important segments of
the ecosystem. It is a basic tool to combat poverty, hunger, diseases and environmental
degradation. Lack of data on water quality hinders attempts to address water related
issues in any region. Water borne diseases are major threats to human health in the
developing world. According to United Nation Environment Programs (UNEP), many of
the populations of the world are lacking access to safe drinking water (UNEP, 2004).
This lack of access to safe drinking water may further aggravate the health related
problems in future. The provision of safe drinking water and hygienic sanitation to
households and communities help in reducing deaths through waterborne diseases, such
as cholera, diarrhea and dysentery (Pertti and Ziglio, 2000). Therefore, it is imperative to
look for sources of water, which are safe and healthy for consumption.
Throughout the history, the quality and quantity of water available to humans
have been vital factors in determining their well-being. Waterborne diseases such as
cholera and typhoid killed millions of people in the past and also in the present

3
(Manahan, 2005). According to the World Health Organization (WHO), 80% diseases
are caused in the world by inadequate sanitation and polluted water (WHO, 1981). All
these problems are due to population growth, improperly discarded hazardous waste, and
lack of awareness and drinking of contaminated (polluted) water.
Water can be polluted by physical, chemical, or biological change in water quality
that adversely affects living organisms or make water unsuitable for desired uses
(Narayan, 2000). As the water pollution is due to addition of any substance from the
external sources, it leads to excess their normal concentration in water and hence
adversely affect the aquatic environment and the normal activities of various living
communities in or near water bodies (Triveddi and Raj, 1992). When we think of water
pollution, we usually visualize sewage or industrial effluents pouring out of a discharge
pipe and some toxic chemicals introduce in to water as a result of human activities, but
there are natural toxicants that threaten us as well. Some toxic inorganic chemicals are
released from rocks by weathering which are carried out by run off into lakes or river, or
percolate into ground aquifers and cause contamination of a water body (William et al.,
2005).
A unique feature that strongly increases the complexity of fresh-water chemistry
is the seasonal variation. These seasonal variations are found across a wide range of
catchments with contrasting climate, geology and type of ecosystem (Ponter et al., 1992).
In the high altitude alpine zone, the major hydrological event in catchments is the melt-
water discharge in spring (April–June depending on the latitude). During melt-water
discharge, the concentrations of dissolved organic carbon (DOC) and several trace
4
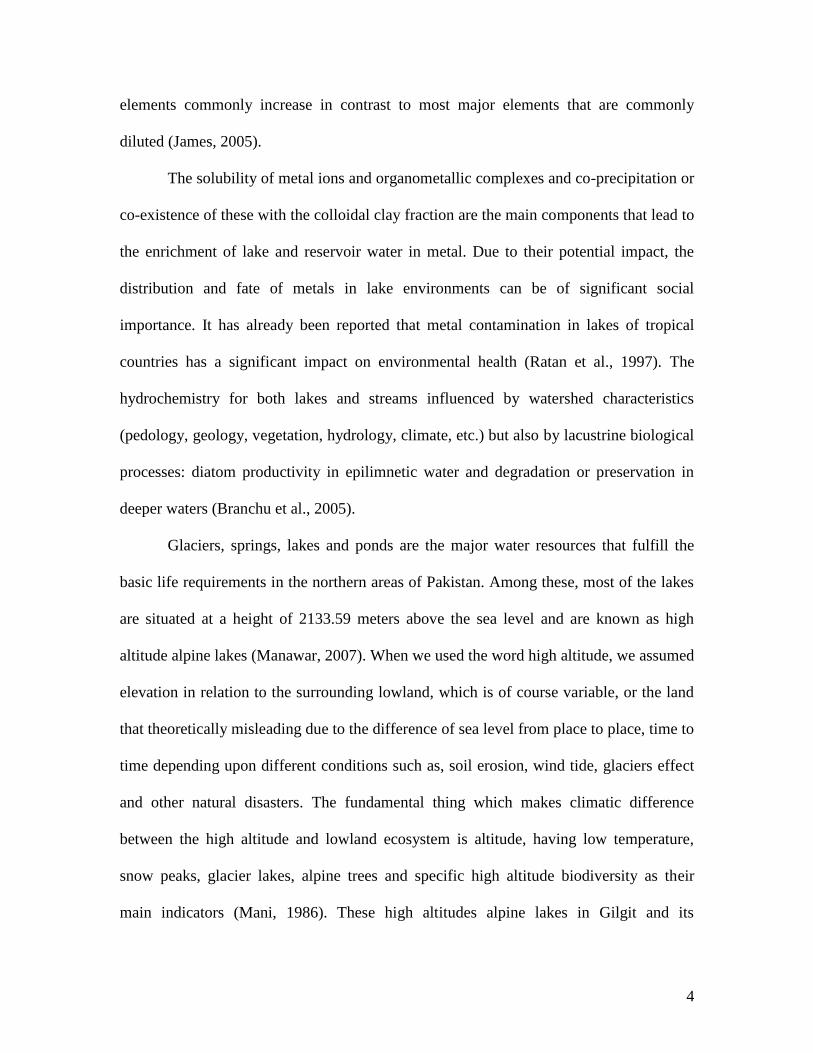
elements commonly increase in contrast to most major elements that are commonly
diluted (James, 2005).
The solubility of metal ions and organometallic complexes and co-precipitation or
co-existence of these with the colloidal clay fraction are the main components that lead to
the enrichment of lake and reservoir water in metal. Due to their potential impact, the
distribution and fate of metals in lake environments can be of significant social
importance. It has already been reported that metal contamination in lakes of tropical
countries has a significant impact on environmental health (Ratan et al., 1997). The
hydrochemistry for both lakes and streams influenced by watershed characteristics
(pedology, geology, vegetation, hydrology, climate, etc.) but also by lacustrine biological
processes: diatom productivity in epilimnetic water and degradation or preservation in
deeper waters (Branchu et al., 2005).
Glaciers, springs, lakes and ponds are the major water resources that fulfill the
basic life requirements in the northern areas of Pakistan. Among these, most of the lakes
are situated at a height of 2133.59 meters above the sea level and are known as high
altitude alpine lakes (Manawar, 2007). When we used the word high altitude, we assumed
elevation in relation to the surrounding lowland, which is of course variable, or the land
that theoretically misleading due to the difference of sea level from place to place, time to
time depending upon different conditions such as, soil erosion, wind tide, glaciers effect
and other natural disasters. The fundamental thing which makes climatic difference
between the high altitude and lowland ecosystem is altitude, having low temperature,
snow peaks, glacier lakes, alpine trees and specific high altitude biodiversity as their
main indicators (Mani, 1986). These high altitudes alpine lakes in Gilgit and its
5
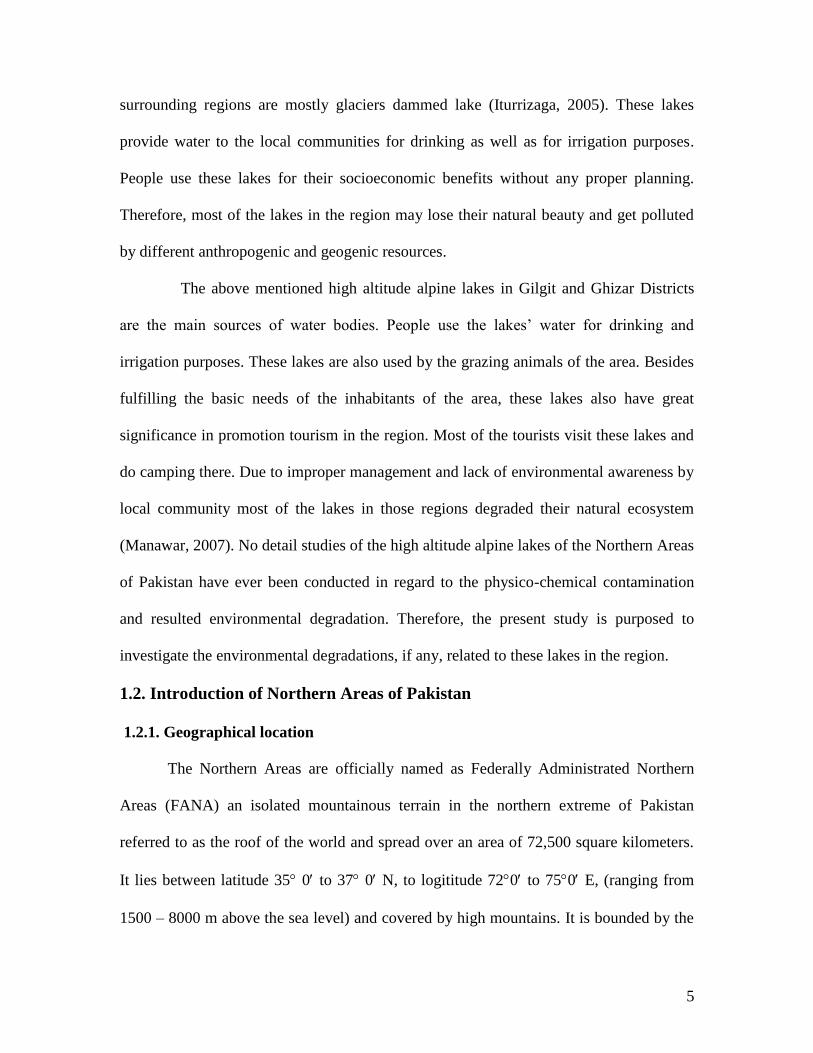
surrounding regions are mostly glaciers dammed lake (Iturrizaga, 2005). These lakes
provide water to the local communities for drinking as well as for irrigation purposes.
People use these lakes for their socioeconomic benefits without any proper planning.
Therefore, most of the lakes in the region may lose their natural beauty and get polluted
by different anthropogenic and geogenic resources.
The above mentioned high altitude alpine lakes in Gilgit and Ghizar Districts
are the main sources of water bodies. People use the lakes’ water for drinking and
irrigation purposes. These lakes are also used by the grazing animals of the area. Besides
fulfilling the basic needs of the inhabitants of the area, these lakes also have great
significance in promotion tourism in the region. Most of the tourists visit these lakes and
do camping there. Due to improper management and lack of environmental awareness by
local community most of the lakes in those regions degraded their natural ecosystem
(Manawar, 2007). No detail studies of the high altitude alpine lakes of the Northern Areas
of Pakistan have ever been conducted in regard to the physico-chemical contamination
and resulted environmental degradation. Therefore, the present study is purposed to
investigate the environmental degradations, if any, related to these lakes in the region.
1.2. Introduction of Northern Areas of Pakistan
1.2.1. Geographical location
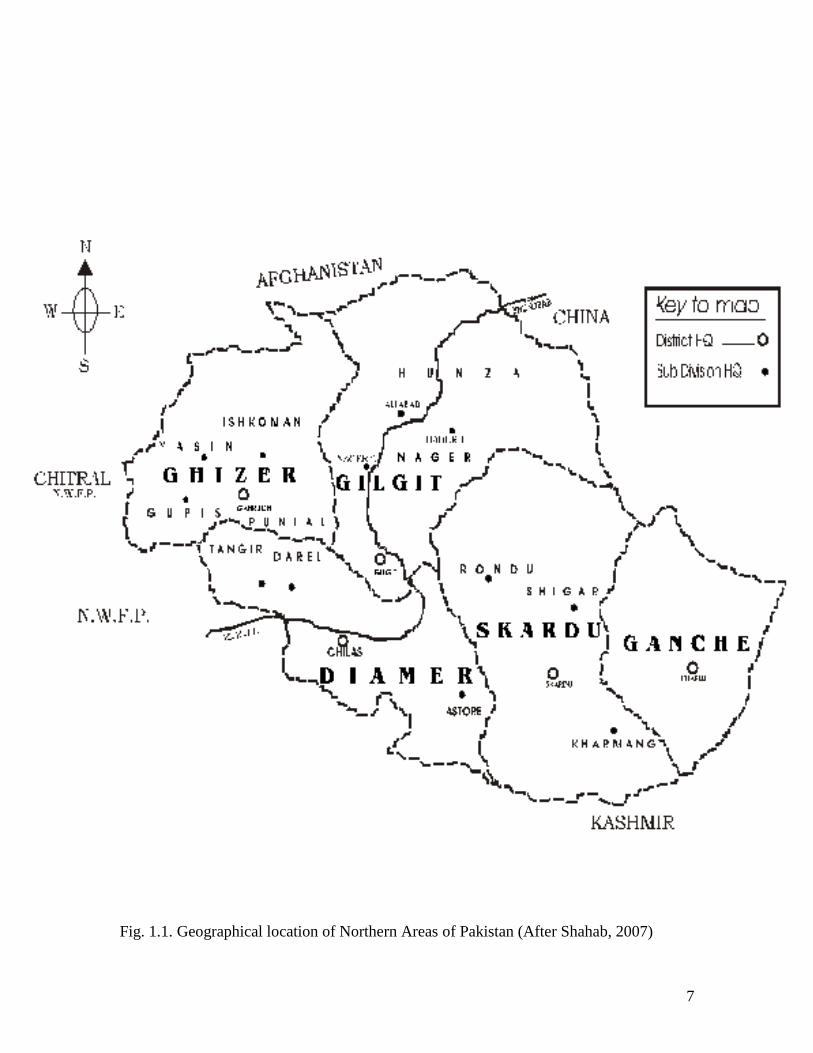
The Northern Areas are officially named as Federally Administrated Northern
Areas (FANA) an isolated mountainous terrain in the northern extreme of Pakistan
referred to as the roof of the world and spread over an area of 72,500 square kilometers.
It lies between latitude 35 0 to 37 0 N, to logititude 720 to 750 E, (ranging from
1500 – 8000 m above the sea level) and covered by high mountains. It is bounded by the

6
Xinjiang province of Republic of China in the north-east, Frontier Province of Pakistan
(Khyber Phuktunkhawa) in the south, Kashmir in the east and Afghanistan in the west
(Fig.1.1). The Northern Areas of Pakistan is sandwiched between three famous mountain
ranges, the Himalayas, Karakuram and the Hindukush. Lofty mountain ranges are
composed of a large number of gigantic and glorious snow capped peaks, K-2 (8613
meters) and Nanga Parbat (8126 meters), lush green valleys, lakes, and some of the
biggest glaciers (Mashabrum, Rakaposhi, Siachen, Passu and Haramoish) in the world
(Winter and Mannheim, 2000).
1.2.2. History of Northern Areas
The ancient history of the Northern Areas (NAs) is lost in antiquity. However the
documentation of history of the Northern Areas shows that the areas have had a long and
turbulent history. Despite the remoteness of the region, the inhabitants of the Northern
Areas have never been completely isolated from the event taking place in Central Asia,
Iran, India, Pakistan or China. Many different peoples and cultures have left their impact
on the region, including ‘Rock Arts People, ‘who can be traced back to the 5th
millennium B.C; the White Huns from Central Asia, the Turks, the Dogra rules of
Kashmir. However the documentation of history and chronology was started when Sikhs
(in 1840), dodgers (in 1846) and British’s (in 1877) penetrated in the region. They have
brought a new management and statecraft and laid infrastructure. People accepted these
changes delightfully, although the areas are freed in November, 1948 and peoples wanted
to live with Pakistan (Dani, 1991).
7
Fig. 1.1. Geographical location of Northern Areas of Pakistan (After Shahab, 2007)
8
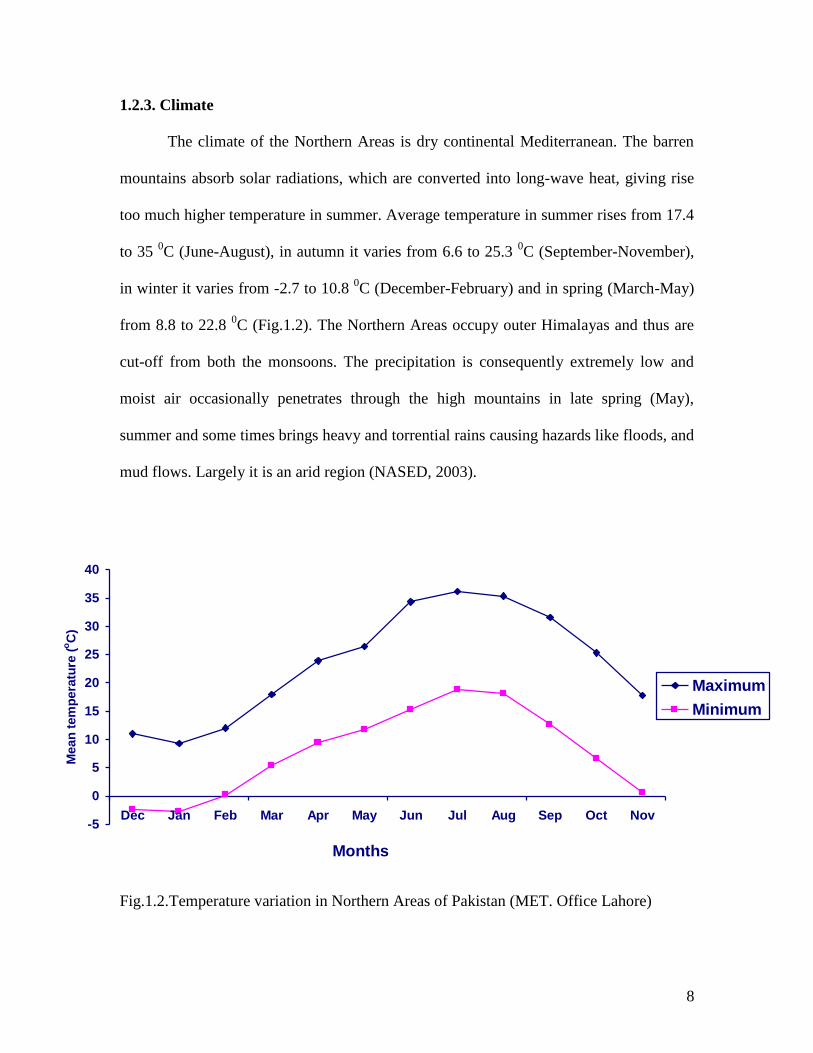
1.2.3. Climate
The climate of the Northern Areas is dry continental Mediterranean. The barren
mountains absorb solar radiations, which are converted into long-wave heat, giving rise
too much higher temperature in summer. Average temperature in summer rises from 17.4
to 35 0C (June-August), in autumn it varies from 6.6 to 25.3
0C (September-November),
in winter it varies from -2.7 to 10.8 0C (December-February) and in spring (March-May)
from 8.8 to 22.8 0C (Fig.1.2). The Northern Areas occupy outer Himalayas and thus are
cut-off from both the monsoons. The precipitation is consequently extremely low and
moist air occasionally penetrates through the high mountains in late spring (May),
summer and some times brings heavy and torrential rains causing hazards like floods, and
mud flows. Largely it is an arid region (NASED, 2003).
Fig.1.2.Temperature variation in Northern Areas of Pakistan (MET. Office Lahore)
-5
0
5
10
15
20
25
30
35
40
Dec Jan Feb Mar Apr May Jun Jul Aug Sep Oct Nov
Months
Mean
tem
pera
ture
(oC
)
Maximum
Minimum

9
1.2.4. Land and Soil Status
Cultivated areas have been developed mainly on alluvial fans and to a lesser
extent from the reclamination of old river terraces. Soils are generally low in clay
content, high in silt and sand fraction, and low in organic matter (usually less than one
per cent). They tend to poor in nitrogen, although major and minor nutrients are reported
to be adequate. However, as soil testing is not carried out systematically, little is really
know about the available nutrient content of the Northern Areas soil (Hashmi and
Shafiullah, 2003).
1.2.5. Topography
The Northern Areas are dominated by one of the most mountainous landscape on
the earth, with an arm of the Hindu Kush to the west, the lesser Himalaya to the south,
the karakuram to the east, and the Pamir to the north. In total, 101 peaks above 7,000
meter (Table 1.1), including Nanga Parbat and K.2 (the world’s second highest
mountain), are found in the Northern areas, and also contain some of the largest glaciers
outside the polar region (Table 1.2). The Baltoro glacier, for example, extends for 62 km
and covers an area of 529 square kilometer. The Northern Areas also form a critical
watershed for the Indus river. The early tributaries of the Indus run through the mountain
in narrow, steep-sided valleys, and play a central role in the ecology and land –use region
(NASED, 2003).
Table.1.1. Important Peaks of Northern Areas
S/No Peaks Altitude (meters) Range World Ranking
1. K-2 (Chogori) 8,611 Karakoram 2

10
2. Nanga Parbat 8,125 Himalaya 9
3. Gasherbrum I 8,068 Karakoram 11
4. Broad Peak 8,047 Karakoram 12
5. Gasherbrum II 8,035 Karakoram 14
6. Gasherbrum III 7,952 Karakoram 15
7. Gasherbrum IV 7,925 Karakoram 17
8. Disteghil Sar 7,885 Karakoram 20
9. Kunyang Chhish 7,852 Karakoram 22
10. Masherbrum NE 7,821 Karakoram 24
11. Rakaposhi 7,788 Karakoram 27
12. Batura 7,785 Karakoram 28
Source, www.tourism gov.pk/ mountaineering.hmtl.
Table.1.2. Important glaciers of Northern Areas
S/No Name of Glaciers Area (sq km
2 )
Length (km)
1. Siachen 685 72
2. Baltoro 529 62
3. Biafo 383 65
4. Hispar 343 49
5. Panmah 254 42
6. Chongo Lungma 238 44
7. Batura 220 56

11
8. Khurdopin & Yukshin Garden 135 37
9. Braldu 123 36
10. Barpu 123 33
11. Yaqghil 114 31
12. Virjerab 112 38
13. Mohmil 68 26
14. Gasherbrum 67 25
15. Malangutti 53 22
Source, Mol, 1991.
1.2.6. Lakes
There are 25 to 33 wetland sides in the Northern Areas of Pakistan. Most of these
are fresh water lakes, which are fed by snowmelt streams, glaciers and springs water.
Among them, most of the wetland (lakes) sites are found at the elevations between 2,800
and 4000 meters (Tabl3 1.3). These wetland provide a wide range of ecological and
socioeconomic benefits. These are the basic sources of water in the region, regulate water
level, best tourism potential sports by recreational activities and provides important fish
and wildlife habitats (WWF-Gilgit, 2006). Some of important identified high altitude
alpine lakes in the northern areas of Pakistan are shown in table 1.3.
Table. 1.3. High altitude alpine lakes in the Northern Areas of Pakistan
S/No Name of Lake Elevation
Location
1. Sheosar lake 4,115 m Doesai plain
2. Satpara lake 2636m Skardu

12
3. Katchura lake 2500m Katchura (Skardu)
4. Borith lake 2600m Upper hunza
5. Rama lake 3,535 m Rama (Astore)
6. Koramber lake 4,304 m Koramber (Ghizar)
7. Uttar lake 3,840 m Iskoman (Ghizar)
8. Hundrap lake 3,291 m Hundrap (Ghizar)
9. Baha lake 1,2400 m Khukosh (Ghizar)
10. Naltar wetland complex 3,364 m Naltar (Gilgit)
11. Gasho lake 2,877 m Sai-bala (Gilgit).
12. Austi lake 3,292 m Bumburat ( Chitral)
13. Shuvorth lakes 4,755 m Shimshal (Hunza)
14. Rush lake 4,206 m Nagar (Gilgit)
15. Lulusar lake 3,613 m Naran valley
16 Dodipat lake 3,779 m Naran valley
17 Saifulmuluk Lake 3,510 m Naran valley
Source, Virk, et al., 2003.
1.2.7. Forest
The natural forests of the Northern Areas are limited to the south-western portion
of the region. They occur primarily in Diamer District, the southern part of the Gilgit
District the Punial area of Ghizar District and few packets of Baltistan District (i.e.,
Basho and Kharmang). Designated forest (both private and protected) covers some
281,600 hectares this is equivalent to nearly four percent of the Northern Areas. In the

13
Northern Areas mostly four types of forest are found which are sub tropical scrub, dry
temperate coniferous, dry temperate Broad-Leaved and Sub alpine forest (Alam, 1976).
1.2.8. Biodiversity
The biodiversity of Northern Areas is believed to include some 230 species of
birds, 54 species of mammals, 20 species of fresh water fish, 23 species of reptiles and 6
species of amphibians. The region’s floral diversity has not yet been assessed, but the
northern Areas are believed to support some of the reaches plants communities in
Pakistan, including many different species of medicinal plants (Khan et al., 2004).
1.3. Aims and objectives
1. Identification and characterization of the lakes’ waters of the Gilgit region
2. Assessment of physico-chemical parameters of the lakes’ waters in regard to their
role in the environmental degradation of the ecosystem of the region
3. Investigation of sources for the environmental degradation, if any, and giving
recommendations for taking possible remedial measures

14
CHAPTER 2
STUDY AREA DESCRIPTION
The study area consists of nine selected high altitude alpine lakes possessing four
sites within the two districts (District Gilgit and District Ghizar), Northern Areas of
Pakistan (Fig. 2.1). Complete descriptions of lakes and their configuration are given
below.
Fig.2.1.Generalized map of the study area.
Source, (http://commons.wikimidia.org/wiki/File:KKH.png)

15
2.1. Naltar Wetland Complex at Naltar
It is a wetland complex situated in the Gilgit District between latitude 36º10 to
36º15Nand longitude 74º05 to 74º10E, with an easy access from Gilgit town. It
comprises of six small-and medium-sized lakes which are generally located within 2 km2
area (Fig.2.2 & 2.3). All these lakes are fed by melting of glaciers in the form of springs
and streams. Lake-1 is called as “Berloki-bari”, which is situated at an elevation of
502.615 meters. Lake-2 is called as, “Singo-bari”, which is basically a peat land, located
at an elevation of 3452.774 meters. Lake-3 is called as, “Chakar-bari” which is basically
twins of two small lakes locating at an elevation of 3254.654 meters. Lake-4 is called as,
“Chomo-bari” and is comparatively a small lake, situated at an elevation of 3202.534
meters. Lake-5 comparatively smallest lake within the wetland complex and is know as,
“small bari” which is situated at an elevation of 3282.391 meters. Lake-6 is called as,
“Koto bari” and is situated at an elevation of 3269.589 meters (WWF-Gilgit, 2006).
2.1.1. Hydrology
The main source of water to Naltar lakes is several small and medium size
perennial streams which are fed by glacial melt water. In summer (Jun-Aug) the lakes
water level increases to its maximum and in winter (Nov-Dec) it reaches to its lowest
level. Occasionally heavy rains cause floods in the area.
2.1.2. Geology of the area
The geology of the area is dominantly characterized by subaerial fore-arc basaltic
andesite, rhyolite, ignimbrite and volcanic clastic sedimentary rocks. There are also Chalt
group (Abtain-blain), rocks and related calac-alkaline andisites, high-Mg tholleiites and

16
boninites. Rakaposhi volcanic Formation and lower part of the Baumaharel Formation are
also exposed (Searle et al., 1996).
Fig.2.2. GIS based map showing various lakes of the Naltar wetland complex at Naltar

17
Fig.2.3 GIS based map showing accessibility to the Naltar wetland complex at Naltar
18
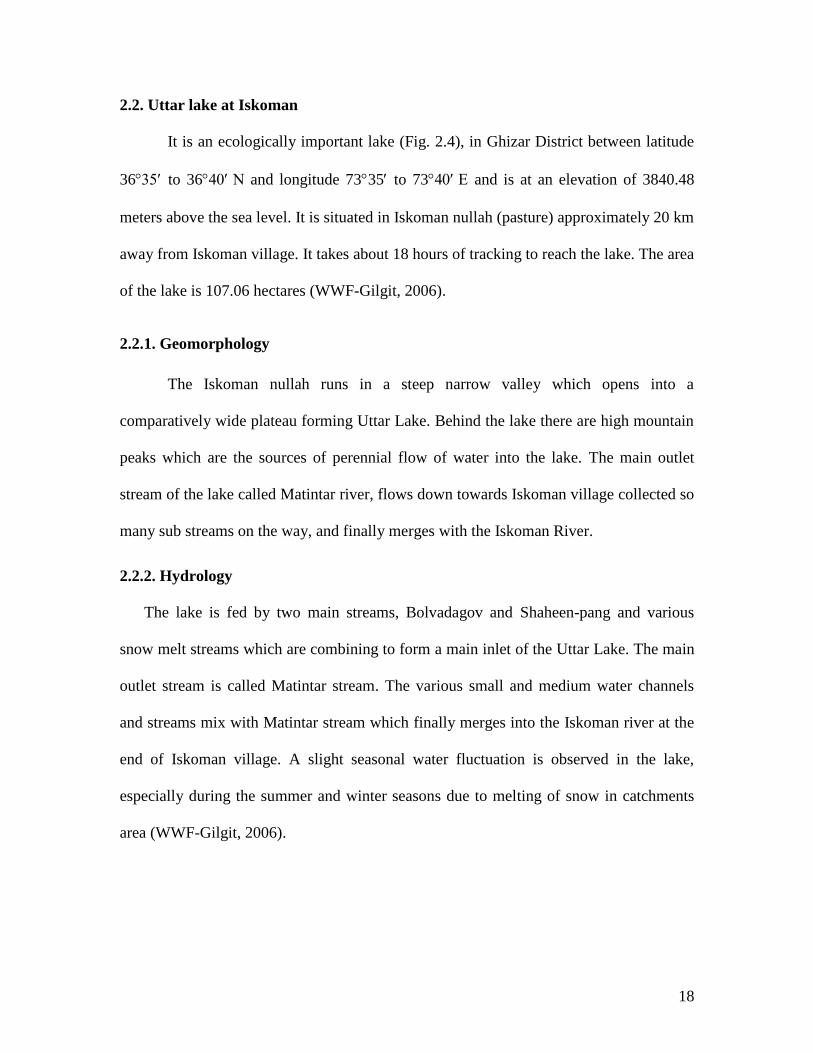
2.2. Uttar lake at Iskoman
It is an ecologically important lake (Fig. 2.4), in Ghizar District between latitude
36 to 36 and longitude 7335 to 73 and is at an elevation of 3840.48
meters above the sea level. It is situated in Iskoman nullah (pasture) approximately 20 km
away from Iskoman village. It takes about 18 hours of tracking to reach the lake. The area
of the lake is 107.06 hectares (WWF-Gilgit, 2006).
2.2.1. Geomorphology
The Iskoman nullah runs in a steep narrow valley which opens into a
comparatively wide plateau forming Uttar Lake. Behind the lake there are high mountain
peaks which are the sources of perennial flow of water into the lake. The main outlet
stream of the lake called Matintar river, flows down towards Iskoman village collected so
many sub streams on the way, and finally merges with the Iskoman River.
2.2.2. Hydrology
The lake is fed by two main streams, Bolvadagov and Shaheen-pang and various
snow melt streams which are combining to form a main inlet of the Uttar Lake. The main
outlet stream is called Matintar stream. The various small and medium water channels
and streams mix with Matintar stream which finally merges into the Iskoman river at the
end of Iskoman village. A slight seasonal water fluctuation is observed in the lake,
especially during the summer and winter seasons due to melting of snow in catchments
area (WWF-Gilgit, 2006).

19
Fig.2.4.GIS based map showing accessibility to the Uttar lake at Iskoman
20
2.2.3. Geology of the area
Uttar Lake is located on the Ghamu Bar Plutonic Unit (GB).The area is also has
the lithology of southern Karakoram metamorphic complex (SKM), toward the lower
parts of Iskoman, in which rocks exposed are mostly parageneisses including interbanded
pelite, marble, amphibolites (Ganschan, Dumordu, Askoli units) with rare ultramafic
lenses (panmuh unit). Here Pelites contain micas, granet, staurolite, kyanite sillimanite +
muscovite and sillimanite + K feldspar assemblages (Searle et al., 1996).
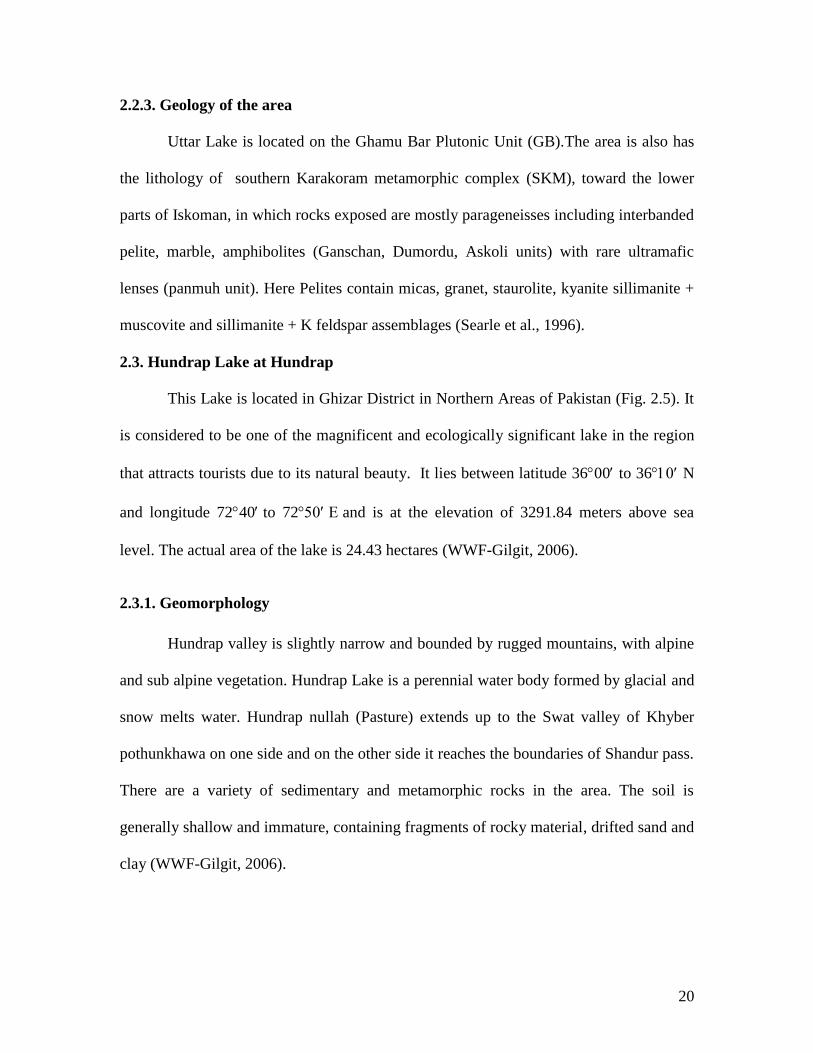
2.3. Hundrap Lake at Hundrap
This Lake is located in Ghizar District in Northern Areas of Pakistan (Fig. 2.5). It
is considered to be one of the magnificent and ecologically significant lake in the region
that attracts tourists due to its natural beauty. It lies between latitude 3600 to 36 N
and longitude 7240to 72and is at the elevation of 3291.84 meters above sea
level. The actual area of the lake is 24.43 hectares (WWF-Gilgit, 2006).
2.3.1. Geomorphology
Hundrap valley is slightly narrow and bounded by rugged mountains, with alpine
and sub alpine vegetation. Hundrap Lake is a perennial water body formed by glacial and
snow melts water. Hundrap nullah (Pasture) extends up to the Swat valley of Khyber
pothunkhawa on one side and on the other side it reaches the boundaries of Shandur pass.
There are a variety of sedimentary and metamorphic rocks in the area. The soil is
generally shallow and immature, containing fragments of rocky material, drifted sand and
clay (WWF-Gilgit, 2006).
21
2.3.2. Hydrology
The lake is fed by numerous snow melting and glaciers melting perennial small
and medium channels produced by the upstream catchments of Hundrap valley. In
summer the lake water level rises to its maximum level due to melting of snow on
glaciers and peaks, while in winter season the water level in the lake is goes to its
minimum. Occasionally heavy rain causes floods in the area. The Hundrap nullah (outlet
stream of the Hundrap lake) passes through the valley and merges with Gupis river at the
end of Hundrap population (WWF-Gilgit, 2006).
2.3.3. Geology of the area
Dominant lithology of this area is characterized by Trondhjemite, calc alkaline
gabbro-diorite, hornblende cumulates e.g. Matum Das pluton (Calc alkaline gabbro-
diorite, granodiorite, granite), Shirot, Gindai, Gilgit plutons (Biotite + Muscovite + granet
leucogranite), Indus confluence dyke swarm (Parri acid sheet).While the lower elevated
parts of the area dominantly characterized by Utror volcanics, Dir group and shamram
volcanic group (Searle et al., 1996).

22
Fig.2.5. GIS based map showing accessibility to the Hundrap lake at Hundrap
23
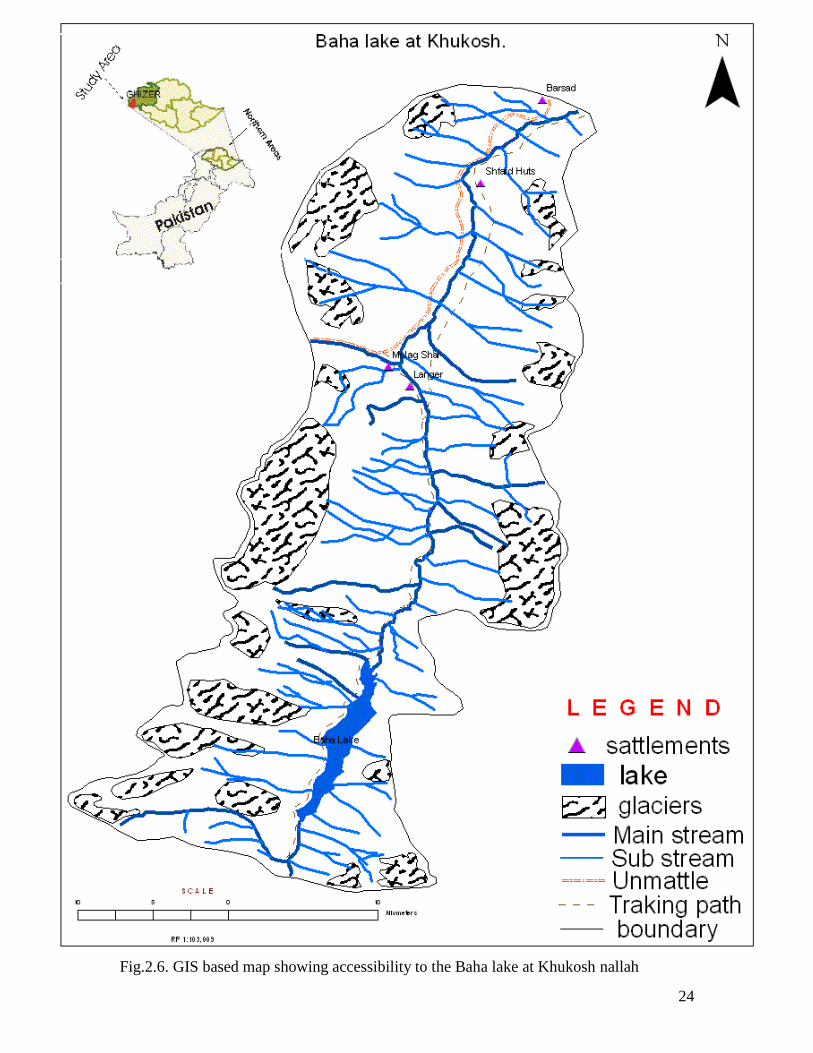
2.4. Baha Lake at Khukosh nallah
This Lake is located in Khukosh nallah (Pasture) in Langer valley, just below
Shandur plateau in Ghizar District Northern Areas of Pakistan. It lies between latitude
3606 to 3640 N and longitude 7237 to 7250 E, and is at elevation of 3640 meters
above sea level. Langer valley has extensive peat bogs and perennial stream which
originate from Baha Lake outlet stream and Shandur pass stream. The actual area of the
Baha Lake is 81 hectares (WWF-Gilgit, 2006). Baha lake and its stream (Khukosh
nallah), are famous for trout fish and considered as the best trout breeding ground in the
Ghizar (Hussain, 2008).
2.4.1. Hydrology
Glaciers and snow melting small and large size different streams from the upper
catchments of the lake are the basic feding source of the Lake. Out let from the Baha lake
formed Khukosh nallah (pasture), which passes through the narrow valley and it joining
with Shandur river at Langer. The Longer valley is basically pastureland for Tero, Barsat,
Gulakhtori and other adjacent valleys of Ghizar district (WWF-Gilgit, 2006).
2.4.2. Geology of the area
The geology of this region is comprised of the rocks of Dir group and shamran
group such as, subaerial for-arc basaltic andesite, rhyolite, ignimbrite and volcanic clastic
sedimentary rocks. The area is also surrounded by trondhjemite, calc alkaline gabbro-
diorite, hornblende cumulates e.g., Matum Das pluton (Calc alkaline gabbro-diorite,
granodiorite, granite), Shirot, Gindai, Gilgit plutons (Biotite + Muscovite + granet
leucogranite), Indus confluence dyke swarm (Parri acid sheet) toward the Gilgit (Searle et
al., 1996).
24
Fig.2.6. GIS based map showing accessibility to the Baha lake at Khukosh nallah

25
2.5. Ecological and socio-economic values of alpine lakes in Gilgit and Ghizar
Districts.
2.5.1. Biological resources
Pastures and upstreams areas surrounding the lakes sustain a variety of wildlife.
Important species such as snow leopard, wolf, Himalayan lynx, Himalayan ibex and
brown bear have been reported in these regions, while in flora the wetlands (alpine lakes)
and its upstream catchments are consisting of sub-alpine and alpine pastures such as,
Willow, Birchand and Juniper. However, at lower altitudes sub tropical dry temperate
species such as, Walnut, Russian olive, Mulberry, are present.
2.5.2. Sources of water
These high altitudes alpine lakes in these regions are considered as main resources
of water, which are providing drinking, irrigation and other uses of water to the
community living down hills these lakes.
2.5.3. Pastures
Scattered trees of Birch, Willow, Patches of coniferous (blue pine, spruce,
juniper), broadleaved trees and scattered pastures exist around these alpines lakes, where
the local communities graze their livestock in the summer.
2.5.4. Fish production
Some of the lakes like Hundrap and Baha lakes are famous for trout fishes and are
considered as the best trout breeding ground in the Ghizar.
2.5.5. Tourism resorts
These high altitudes alpine lakes in the Northern Areas of Pakistan are popular
tourist resorts since all the tourist attractions are available such as lakes, camping sides,

26
beautiful landscape, tracking and wildlife. Therefore, these alpine lakes have excellent
potential as a regional, national and international tourist destination for nature based
recreation focusing on its rich flora and fauna.
2.6. Current potential threats to the alpine lakes
2.6.1. Overgrazing
The pastures surround the lakes are utilized by local communities during the
summer season from April to September under a free grazing system. In winter most of
the high altitude pastures are covered with snow. Due to the short season the right holders
use the pastures intensively for a short amount of time. Their livestock overgraze
palatable species and damage the regeneration of birch, juniper and other valuable flora.
2.6.2. Illegal hunting
Illegal hunting of wild life, fish and migratory birds is commonly practiced by
some local community in these regions. Therefore, most of the endangered species are
extincted from the region.
2.6.3. Ill managed tourism
Due to lack of tourist information centers and facilities in these regions, most of
the tourists and local visitors are responsible for the degradation of natural ecosystem in
these areas.
2.7. Geomorphalogical sitting of the lakes in the study area
Nine high altitude alpine mountain lakes in Karakoram and Hindukush ranges of
North Pakistan are selected for the proposed study. Naltar wetland complex in district
Gilgit is situated in the part of Karakuram Range, while Hundrap, Uttar and Baha lakes of
27
Ghizar district, are situated in Hindukush Range. General morphological sitting of these
lakes are briefly discussed below.
2.7.1. Karakuram Range (Naltar Wetland Complex)
The Karakoram Mountains are situated at the western end of the Trans-Himalayan
Mountains and are the result of the collision of the Asian and Indian continental plates. The
region contains highest snow peaks, glaciers, lakes and some of the largest rivers with the
highest sediment loads in the world, including the Indus, Gilgit and Hunza rivers (Ferguson
et al., 1984). The rocks mostly exposed in the region are igneous and metamorphic. The
region is still rapidly uplifting and being intensely denudated (Burbank et al., 1996).
Denudational processes include frost shattering (Hewitt, 1968c; Goudie et al., 1984),
chemical weathering by salt crystal growth (Goudie, 1984., Walley et al., 1984), glacial
erosion (Goudie et al., 1984., Li Jijun et al., 1984), fluvial incision (Ferguson, 1984.,
Ferguson et al., 1984) and mass movement (Brunsden and Jones, 1984., Hewitt, 1988). All
these processes are responsible to immense quantities of fine sediment, which has the
potential to be deposited within lacustrine environments. The region is climatically
transitional between central Asian and monsoonal south Asian types, varying considerably
with altitude, aspect and local relief. Three extensive glaciations during Pleistocene times
and at least five minor advances during Holocene times have been recognized (Derbyshire
et al., 1984; Shroder et al., 1993). These have resulted in deeply eroded valleys and thick
extensive deposits of till. The high supraglacial sediment loads give rise to large terminal
and lateral moraines rather than subglacial till sheets. Many types of lakes have existed and
still exist in the high mountains of Karakoram. There is no any tectonically formed lakes
(the lake is formed as a result of tectonic process) have recognized in the Karakoram

28
mountains, Although the orientation of the valley system, however, is strongly controlled
by the tectonics and many of the valleys either lie a long fault or are controlled by rapidly
uplifted massifs such as, Nanga Perbat, (Owen, 1989c), therefore most of the lakes situated
in the Karakuran mountains are glacier damed lakes (Burgisser et al., 1982), or lakes
formed from the blockage by debris flows, rock fall and by lansliding. Naltar wetland
complex situated in the Gilgit District between latitude 36º10 to 36º15Nand longitude
74º05 to 74º10E, comprises of six small and medium sized lakes which are located
within 2 km2 area of Karakuram Range are also glaciers dammed lakes in the Naltar region.
2.7.2. Hindukush Range (Uttar, Hundrap and Baha Lakes)
Uttar, Hundrap and Baha Lakes are glacier dammed alpine lakes situated in Ghizar
District, District Ghizar in the Hindukush range is located in the west of Gilgit city,
bordering with Chitral in the west, and Afghanistan to north. Towards south it borders with
district Diamer. The Northern Areas specially Ghizar District has got extensive inland
water resources comprising rivers and glacier lakes with varying potential for the
development of inland fisheries on aquaculture in the region. The above mentioned alpine
lakes (Utter lake, Hundrap lake and Baha lake) are the part of glaciers dammed lakes in the
Hindu Kush range of Ghizar District (WWF-Gilgit, 2006).
The lakes in the Hindukush ranged are mostly glacier lakes mainly formed as a
result of the blockage of the main river by advancing tributary glaciers. The topographic
setting is at the current stage of glaciations in the Hindukush region favorable for the
formation of this dam type. Tributary glaciers with catchments areas of over 7000 m in
height descend down to low altitudes below 3000 m into the glacier-free trunk valleys and
block temporarily the main river. A large number of glaciers terminate at confluence

29
positions. The glacier dams consist of various glacier types, including short avalanche-cone
glaciers as well as firnstream glaciers of up to 60 km in length (Iturrizaga, 2005).
In the Hindukush Mountains, a seasonal pattern dominates in July and August i.e.,
outburst chronologies, during the time of the highest discharge therefore failures of ice-
dammed lakes mostly occurred between these month. But, most of the dams fail
periodically with irregular possible return intervals of about 1-2 years (Iturrizaga, 2005).
Fig.2.7. Generalized geological map of the study area and its surroundings (After Searle et
al., 1996)
30
CHAPTER 3
LITERATURE REVIEW
A brief literature review of the related environmental studies conducted on
similar kind of lakes in Pakistan as well as in other parts of the world has been discussed
here to understand the importance of conducting the present research.
Matthew et al. (2008) conducted a study on local adaptation of microbial
communities to heavy metal stress in polluted sediments of lake Erie in North America.
They investigated the impact of heavy metal contamination on microbial communities.
They performed two experiments; measuring extracellular enzyme activities (EEA) in
polluted and unpolluted sediments of lake Erie. In the first experiment they found that,
inoculations with moderate concentrations of copper and zinc appreciably diminished
EEA from uncontaminated sites, whereas EEA from contaminated sediments increase or
where only negligibly affected. In the second experiment, they compared the effects of
three separate metals (i.e. copper, arsenic, and cadmium) on microbial community
metabolism in polluted and unpolluted locations. When they compared the results, it was
found that copper and arsenic were reacted differentially by inhabited EEA only in
unpolluted while, cadmium inhibited in both polluted and unpolluted sediment.
Multivariate analyses of EEA from polluted sediments revealed direct association among
hydrolytic enzymes and inverse or absent association between hydrolyses and oxidizes;
these associations demonstrated resilience of microbial communities to heavy metal
stress. In contrast, addition of heavy metals to unpolluted sediments appeared to have a
higher impact on the multivariate pattern of EEA associations as revealed by an increase
in the number of associations, more inverse relationships, and potential enzymatic trade-

31
offs. At the last from the results of the study it is suggested that the community-level
adaptations through the development of resistance mechanisms to the types and local
levels of heavy metals in the environment.
Hussain (2008) had done assessment of production and market capacity of trout
fish in fresh water (lakes, streams and rivers) in Ghizar District Northern Areas of
Pakistan, under the supervision of AKRSP (Agakhan Rural Support Program). In their
work they mention that, in Ghizar Districts, Northern Areas of Pakistan, there is no
proper sanitation system, and most of the sewerages are openly entered in to the streams
and rivers, which degradated the water quality and adversely affected the fish in these
regions. They also mentioned that most of the communities in these regions use water
from the nallah (water stream). As the water flows from the mountains to villages, it
dissolves and carries the heavy metals. Therefore, the chances for the presence of heavy
metals are common in water in these regions.
Tiercinlin et al. (2008) conducted a study on high-resolution sedimentary record
of the last deglaciation from a high-altitude lake in Ethiopia, and in this study they linked
sedimentary processes to the progressive retreat of a high-altitude glacier in the Bale
Mountains surrounding the high-altitude lake in Ethiopia since1700 year recorded data.
During the investigation they found that, Lake Sedimentation is interpreted as the result
of discharges of melt water and glaciogenic sediment which progressively filled the
accommodation space generated by glacier retreat within the basin. Monogenic sediment
originated from glacial erosion of the trachytic tuff forming the cirque floor. Such type of
studies will be helpful to illustrate the complex interaction between global (climate) and

32
local (glyacier dynamics vs. local climate) processes and evolution of every sensitive
environment of the Ethiopian highland regions.
Ahmad et al. (2007) did physical and microbiological assessment of drinking
water of Nomal valley District Gilgit, Northern Areas, Pakistan. During the study they
collected the water samples from the inlet and outlet of different water reservoirs and
from other sources which distributing the water to the household in the Nomal valley.
During the investigation of physical parameters it was found that the value of turbidity
varies with the seasonal change and is because of heavy rainfalls, strong winds, and
temperature. The value of temperature varied from 6 to 7.34C˚ during winter and autumn,
7 to 8.68C˚ during spring, while it was 11 to 14.34C˚ in summer. This increase of
temperature enhances solid solubility, and microorganism’s activities inside the water
body. When the microbiological assessments were done, they found that the value of
fecal coliform showed increasing pattern from source to outlet. The value of fecal
coliform during the May and August at the source ranged to 90-280 fecal
coliform/100ml, and was slightly increased toward the inlet water reservoir i.e.,195-434
fecal coliform/100ml. There is no treatment inside the water reservoir, therefore, the
value of fecal coliform continuously increased and the value at the outlet was 202-437
fecal coliform/100ml. At the end they concluded that the microbiological assessment of
water quality of Nomal region showed that the water in the region is highly contaminated
with fecal coliform during summer and it is due to the agriculture activities and
movement of livestock. Therefore, the gastrophil, and other abdomen related diseases are
most common in the area during summer.

33
Ronnback and Strom (2007) conducted a study on hydrochemical pattern of
Small lake and a stream in an area proposed as a Repository site for Spent Nuclear Fuel,
Forsmark, Sweden. The over all aim of their study was to increase understanding of
chemical dynamic of small catchments. In their study, they conducted the hydrochemical
sampling campaign lasted nearly for four years with sample collection from monthly to
semi-monthly and continuously they measured the water flow over the last twenty
months. They concluded from their study that (1) as a result of the calcareous overburden
caused by redistributed Paleozoic deposits in the catchments, pH of Ca+2
and HCO3-
concentrations were relatively high in both the stream and lake throughout the period (2)
limnic primary production resulted in decreased concentrations of Ca+2
, HCO3-, NH4
+,
NO3- and Si, and increased pH and concentrations of chlorophyll a, O2, DON, POC, PON
and POP in the lake in summer, while in other seasons (in winter in particular) when the
production was minimal or non-existent, the concentrations of Ca+2
, HCO3-
in the lake
and the inflow stream were similar (3) high uranium concentrations in both stream and
lake was derived most likely from reduced uranium minerals (i.e. uraninite, lanthinite and
secoepite) in the overburden and was predicted to be carried to >90% in the form of
calcium uranyl carbonate, in a model in which colloidal Fe and Al oxyhydroxides were
not considered (4) the rare earth elements (REEs) had similar concentrations and
fractionation patterns in the stream and lake, unlike those found in the overburden ground
waters, and was predicted to be carried as organic complexes (e.g., dissolved organic
matters, clay and alkali metals organic complexes). (5) the abundance of dissolved humic
acids, predicted to carry the REEs, which consists of analogues for several actinides,

34
deserve special attention in a safety assessment perspective focusing on radionuclide
contamination.
Schenone et al. (2007) studied trace metal contents in water and sediments in
samborombon Bay wetland, Argentina. In this project they investigated the phyio-
chemical parameters of water and sediments in low and high water periods of different
rivers, and channels that flow into the Bay wetland. During the study they found that the
values of pH and temperature are increasing from northern to southern side in both water
periods. In case of heavy metals, (i.e. Al, Mg, Ca, Na, K, As, Ba, Cr, Ni, Pb and Zn,)
their concentrations were detected high in low water period and low in high water period
due to dilution factor. The concentration of trace metals in sediments suggests, as a
whole, that this wetland has been so far exposed to low to moderate levels of
anthropogenic influence. They concluded that, the presence of metals in both water and
sediments of this Bay might have effects on biota and on the regional tropical web chain.
According to them, this study will be helpful to conservation of wetland environment in
right manner for future.
Shah et al. (2007) conducted a study on determination of selected metals in
drinking water of Water Purification Plants in Gilgit city, Northern Areas of Pakistan. To
investigate the heavy metals in water, they collected the water samples from six
representative water purification plants namely, (DHQ hospital, Konodas, Jutial,
U.comps, Kashrote, and Oshkhandas) of Gilgit city. During the water samples analysis
they found that pH and Electric Conductivity values of water samples were ranged from
7.42 to 7.92 and 0.12 to 0.25μs/cm respectively. Trace elements determined in all water
samples where within the range permissible limits of WHO (2004). A concentration

35
range of lead (Pb) determined in all the water samples was higher than the WHO
permitted concentration values. Concentration of heavy metals except Pb falls within the
WHO permissible value.
Yamada et al. (2007) conducted a nation wide acid deposition survey on long
term trends in surface water quality of five lakes in Japan under the project of Ministry of
the Environment in Japan. For this purpose they selected five representative lakes, (Lake
Kuttara: northernmost; Lake Kamakita: near Tokyo; Lake Ijira: central; Lake Banryu:
Westren; and Lake Unagiike: Southernmost), and their inlet streams to investigate the
effects of acid deposition on surface water by using nonparametric Mann-Kendall test to
find temporal trends in pH, Alkalinity, and Electrical conductivity (EC) in more than ten
years recorded data. During the ten years of collected data they found that, there were no
evidence of acidification in all the lakes, except Lake Ijira. The pH, in the water Ijira lake
declined slightly and significant upward trend was noticed in electric conductivity (EC)
since the mid 1990s. It is corresponding with the downward trends in pH and alkalinity
of the river flowing into the lake water. The reason behind the acid deposition in Lake
Ijira is the geology of the catchments, and the rate of acid deposition loading. They
concluded that, because of the high acid-neutralizing capacity of the geology, in Japan
acid depositions has so far had no obvious effect on acidification of surface water except
lake Ijira.
Senpera et al. (2003) worked on persistent organic pollutants (DDT, PCBs and
HCB) in little Egret Eggs from three selected Pakistani wetlands (i.e., Haleji lake in
Sindh, Taunsa Barrege behind the Indus river in Punjab Province and Karachi Harbor,
mangrove swamps in Karachi). During the study they selected Little Egert Eggs (water

36
birds), prey, and sediments as representative samples from these wetlands. Among the
three wetlands, Haleji lake generally considered as pristine lake because of its location in
a rocky desert, while Taunsa Barrege and Karachi Harbor are considered as effected sites
of industrial activities, agriculture runoff and large burden population. When all the
compartments (Eggs, Prey and Sediment) of the samples collected from the selected
wetlands were analyzed they found that, the concentration of organochlorine cyclodienes,
of DDT, and PCBs were significantly lower in Haleji Lake than the other two sides.
Tuansa Barrege show relatively lower concentration while the Karachi Harbor was
characterized with high concentration of DDT and PCBs. They investigated that the
presence of high concentration of organochlorine cyclodienes in all the samples of
Karachi Harbor Swamps are due to the heavy industrial activities and presence
agricultural forms in the surrounding area, while due to the stony or rocky desert and low
burden of industrial activities of Haleji Lake showed low concentration of
organochlorine. They investigated that, hydrocholobenzene (HCB) concentrations were
generally low at all three study areas. However, they got highest concentrations at Haleji
Lake where they were detected in all the compartments (Eggs, Prey and sediments).They
suggested that the presence of HCB is due to the fungicide which were dumped in to the
Lake. They concluded that the persistence of organochlorine in the living organisms
(Bioaccumulations) of the areas is a result of transfer of these pollutants from their
surrounding a biotic ecosystem through their Food web.
Sinyukovich (2003) conducted a study based on water quality and
environmental aspects in lake Baikal which is natural lake in Southern Siberia between
Buryat Republic and Irkutsk Oblast, Russia. He studied relationships between water flow
37
and total dissolved solids (TDS) discharge in the major tributaries of lake Baikal. After
the long term data observation of the relationships between the TDS and water flows of
the three major tributaries of Baikal Lake, they found an inverse relation between the
water flows and TDS of rivers water which is due to the predominance of hardly soluble
gneisses, conglomerates, crystalline schist, and dolomite in the geological structure of
their watersheds. By their ion composition these water belong to the hydrocarbonate class
(Calcium group). They studied that the cause of alimentation are the main factor to
understand the relationships between the water flow and ionic composition of water.
They concluded that the governing role of water abundance in rivers in the dissolved
solids discharged is important and their study will be helpful in improving the knowledge
of the formation of total dissolved solids discharge in to the lake Baikal.
Islam et al. (2000) studied the Lake and reservoir water quality affected by
metals leaching from tropical soil in Bangladesh. They studied the release of metals
during the weathering in order to assess geochemical controls and possible effects on
environmental health in Bangladesh. During comparative study of four sites (i.e.,
Rajarampur, Shamta, Mainamoti and Andulia of Bangladesh) they found that all the
surface water samples were typically were enriched in Al, Mg, Ca, Na, K, As, Ba, Cr, Ni,
Pb and Zn, which they considered are mostly due to weathering effect of strong climatic
conditions. They concluded that the solubility of metal ions organometallic complexes
and coprecipitation with the colloidal fraction are the main processes that lead to metal
enrichment in the lake and reservoirs water.
Dua et al. (1998) conducted a study on organochlorine insecticide residues in
Water from five lakes of Nainital (U.P), India. To investigate the contamination of

38
organochlorine insecticides such as, DDT and HCH they selected five representative
lakes namely Bhimtal, Sattal, Khurpatal, Naukuchiatal and Nainital. These are mostly
situated in the hilly area of Nainital region. After the analyses of water samples collected
from selected lakes, it was found that the concentration of DDT and HCH was maximum
in July and minimum in March. The contamination of HCH in July ranged from 3.121 to
8.656μg/L. This range is higher than the limit established by Council of the European
Communities (1980), for natural water, except in July the samples from the Bhimtal lake,
all sample did not exceed the maximum permissible limit for HCH (4μg/L) reported by
WHO (1984). While the mean contamination of DDT in all the lakes, ranged from 6.054
to 31.336μg/L which showed that all the lakes water exceeded the maximum permissible
limit of DDT (1μg/L) for drinking water (WHO, 1984). They concluded that the higher
concentration of DDT and HCH in lakes of Nainital are due to excessive use of DDT and
HCH in the Terai and Bhabar area for malaria control.
Ogutu-Ohwayo et al. (1997) conducted a study on Human impacts on the
African Great Lakes. During the studied they found that most of the African lakes and
their catchments are under the pressure due to the human population around the lakes.
Excessive use of fish and introducing the exotic species in the lake, native fish stocks will
extinct. There are increased nutrient inputs from agricultural sewage and industrial
discharges and combustion processes which can cause Eutrophication in the lakes.
Overgrazing and deforestation phenomenon caused the loss of suitable habitats and
biodiversity of the regions .They concluded that the thermal stability of lakes had been
changed with the change in climates. According to them there is a human population
increase around the lakes which resulted in the degradations of lakes.

39
Owen (1989) conducted a study on quaternary lacustrine deposits in a high-
energy semi-arid mountain environment, the Karakuram Mountains, Northern Pakistan.
In his study he used a facies model for lacustrine sedimentation in a high- energy semi-
arid high mountain region, presented, using case studies from a glacially dammed
palaeolake (Glacial Lake Gilgit) and a debris-flow dammed palaeolake (Lake Serat).
During his study he found that, impressive quaternary lacustrine deposits terrace are
present through- out the Karakuram Mountains, Northern Pakistan. They are mainly the
result of damming of drainage systems during glacial advances or by catastrophic mass
movement deposits. He found that longevity of most lakes is relatively short, in the order
of years to tens of year, but sedimentation rates are extremely high as a consequence of
the high sediment loads within the rivers. These sediments comprise dominantly planar
bedded, massive and, less commonly, planar laminated, silts, comprising detrital quartz,
feldspar, mica, calcite, chlorite and illite. He found that, as a result of rapid deposition of
sediments and absence of organic materials, restricted the usefulness of these lacustrine
sediments as proxies for palaeo environmental reconstruction, but they are helpful in
reconstructing the former extent of glaciers and illustrating the importance of high-
magnitude-low-frequency events, such as land sliding, as formative processes
contributing to the evolution of the Karakuram land- escape. He concluded that, majority
of Quaternary lacustrine deposits in the Karakuram Mountains are the result of drainage
systems being dammed by glacial advances or catastrophic mass movements, and these
lake deposits are probably important as a temporary storage for silts, which may later be
reworked to contribute to aeolian deposits such as loess.
40
Water Sanitation, Hygiene, and Health Studies Project Northern Areas of Pakistan
(WSHSP), conducted an in-depth weekly water quality surveillance study between 1993-
1994, on micro-bacterial contamination in drinking water of Oshikhandass village where
a piped water delivery system is in place, while in Jalalabad, the traditional open channels
water delivery system is inplaced. Water samples were tested in-situ using the portable
Del-Agued water kit and a standard membrane filtration. The range of contamination of
E. coli in Oshikhandass region within were the piped water supply system was found as
48-372 E. coli /100ml in winter while during the summer it ranged from 191-417
E.coli/100ml. In case of traditional open channels water drinking system, it was
significantly more contaminated with level as higher as 462-3025 E.coli/100ml in
summer. This study concluded that the drinking water of Oshikhandass especially
Jalalabad, Northern Areas of Pakistan are highly contaminated with bacterial
contamination, therefore, gastrointestinal diseases is very common in such regions

41
CHAAPTER 4
METHODOLOGY
4.1. Field work
The following methods were used to collect the water samples from the selected
high altitude Alpine lakes and streams of the study area (Naltar wetland complex, Uttar,
Hundrap and Baha lakes with their related streams).
4.1.1. Water sampling
Representative water samples were collected from the inlet, centre, and outlet of
the lakes (Fig.4.1, 4.2, 4.3 and 4.4). For comparative analysis representative water
samples were also collected from the related downward streams of these lakes. All the
water samples were collected in a cleaned polyethylene bottles. The polyethylene bottles
were washed with double-ionized water before taking the water sample. Two water
samples were collected from each point. One bottle was filled with water having no air
bubble, while the other bottle was added with few drops of nitric acid after it was filled
with the water from the same point. The former was used for the determination of
physical parameters and anions while the later was used for the determination of major,
heavy and trace elements (Mora et al., 2007).
4.2. Laboratory Methods
4.2.1. Determination of physical parameters
Among the physical parameters, the pH, EC, and T were determined on spot in
the field by using various instruments such as pH meter, Consort Electrochemical
analyzer and thermometer. The other parameters such as total dissolved solid (TDS),
turbidity, salinity and resistivity were measured in the Geochemistry laboratory of the

42
Fig.4.1.GIS based map showing sampling points in Naltar wetland complex and stream

43
Fig.4.2.GIS based map showing sampling points in Uttar lake and respective stream
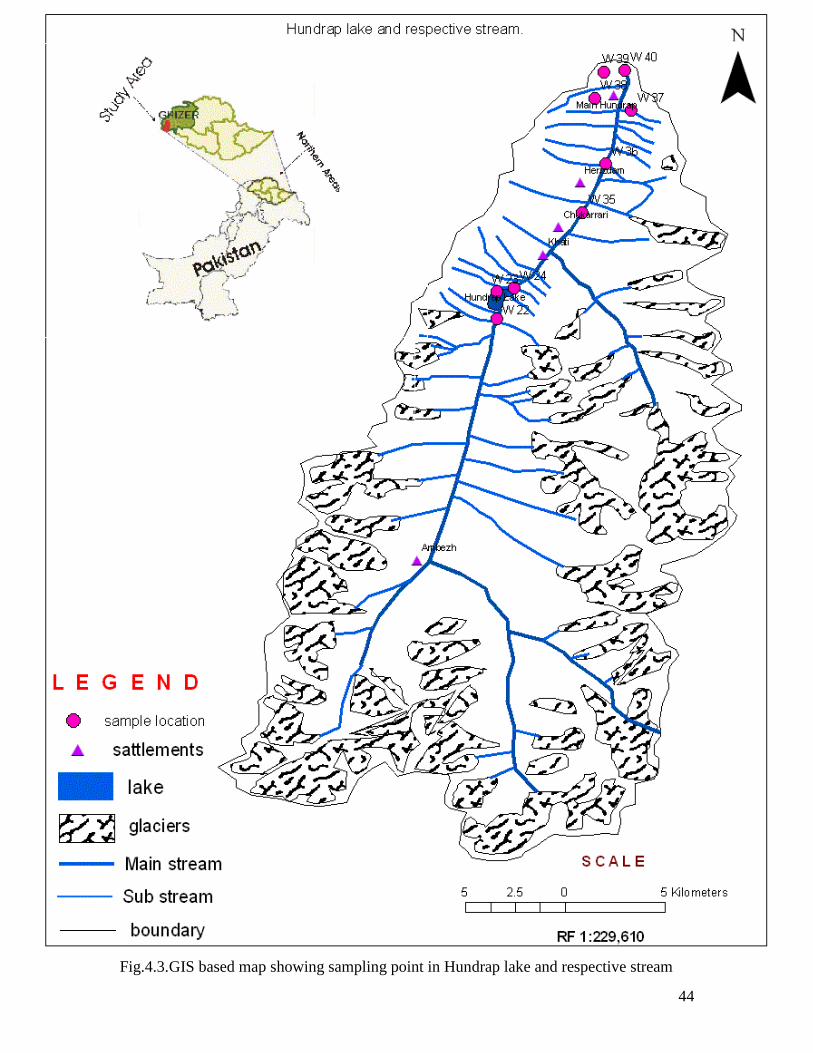
44
Fig.4.3.GIS based map showing sampling point in Hundrap lake and respective stream

45
Fig.4.4.GIS based map showing sampling points in Baha lake and respective stream
46
National Centre of Excellence in Geology (NCEG), University of Peshawar.
4.2.1.1. Determination of Temperature
Temperature is one of the most important parameters for aquatic environment
because almost all the physical, chemical and biochemical properties are governed by it.
It is the temperature which limits the saturation values of solids and gases that are
dissolved in it. Water temperature is a major factor in determining the different species
present in the streams and lakes. Temperature was determined for the water samples in
the field with the help of thermometer.
4.2.1.2. Determination of pH
Measurement of pH is one of most frequently used test in water chemistry.
pH refers to scale of intensity of acidity or alkalinity. For pH measurement of water
samples, the pH meter was used. First the pH meter was standardized with buffer solution
(solution whose pH tends to remain constant). The electrode was subsequently immersed
in these buffer solutions and the instrument was calibrated in this way. Then immersed to
the water sample and reading was directly noted from the pH meter. For accuracy the
standardization of the instrument was checked by the buffer solution after running five
samples.
4.2.1.3. Determination of Electric Conductivity (EC)
Conductivity is the ability of a material to conduct electric current. Since the
charge on ion in solution facilitates the conductance of electric current, therefore
conductivity in a solution is proportional to its ion concentration. In the laboratory
electrical conductivity of water samples were analyzed by using Consort Electrochemical
analyzer in s/cm.

47
4.2.1.4. Total Dissolved Solids (TDS)
TDS contents of water are residue left upon evaporation at 103C˚ to 105C˚. The
total dissolved solids (TDS) mostly comprise inorganic salts and small amounts of
organic matter in a water body. TDS in water is due to its natural contact with the rock
and soil with minor contribution from pollution, (Sinyukovich, 2001). TDS values were
calculated in mg/L for water samples by Consort Electrochemical analyzer.
4.2.1.5. Determination of Turbidity /Transparency
Turbidity of water is responsible for the light to be scattered or absorbed rather
than straight transmission through the sample. It is the size, shape and refractive index of
the suspended particulates rather than the concentration of the latter present in the water
samples that are responsible for turbidity. Turbidity was measured by JENWAY 6035
turbidity meter in NTU.
4.2.1.6. Determination of Salinity
The acid neutralization capacity of water is called Salinity of that water. Salinity
of water is a function of carbonate, bicarbonates and hydroxide contents. In water
samples, salinity was measured through Consort Electrochemical analyzer.
4.2.1.7. Determination of Resistivity
Consort Electrochemical analyzer was used to measure the resistivity in water
samples in k.cm.
48
4.2.2. Determination of Chemical parameters
4.2.2.1. Determination of Anions
4.2.2.1.1. Chloride (Cl-)
Chloride was determined in laboratory by using DR/2800 photospectrometer.
While determining chloride first of all chloride programme was selected in DR/2800.
One cell was filled with 10 ml of water sample and with deionized water in another cell
reserved as blank. Mercuric Thiocynate (0.8ml) of solution was added to each sample
cell. Swirled to mix and then add 0.4 ml of ferric ion solution into each sample and mix
well. Pressed the timer for two minutes for the completion of reaction. After two minutes
put the blank solution in the cell holder and press zero, and then put the water prepared
solution in to the cell holder and the reading was noted on the screen in mg/L.
4.2.2.1.2. Nitrate (NO3-)
Nitrates are normally present in natural drinking and waste waters. Nitrates enter
water supplies from the breakdown of natural vegetation, the use of chemical fertilizers
and from the oxidation of nitrogenous compounds in sewages effluents and industrial
wastes. The DR/2800 photospectrometer was used to determine the nitrate for all the
water samples in the laboratory. The regent used for the nitrate is called Powder Pillow
Test (Nitra Ver 5 Regent Powder Pillow). First of all specific programme (No.358) was
selected. One glass cell was filled with 10 ml of water sample, and then the content of
one Nitra Ver 5 Regent Powder Pillow was added. Cell was shaked for one minute till the
time dissolution was complete. Again sample was left for five minutes. Blank sample was
prepared with 10 ml double deionized water in the cell and cell was inserted the holder.
49
Instrument was calibrated at zero with blank and then nitrate concentration in the water
samples was noted as mg/L.
4.2.2.1.3. Sulfate (SO42-
)
Sulfate was determined by using DR/2800 photospectrometer. The regent used for
sulfate determination is, Sulfa Ver 4 Sulfate Act Vac Ampul. First of all SO42-
program
(No.685) was selected. Water sample was prepared by adding Sulfa Ver 4 Sulfate Act
Vac Amopule in 10 ml of square cell containing water sample. Sample cell was left for
five minutes. Double deionized water was used as blank sample. It was taken to the cell
holder, zero was pressed and then put the water sample cell and press and reading was
noted of Sulfate in mg/L.
4.2.2.1.4. Carbonates (CO3-2
) and Bicarbonates (HCO3-)
Titration method was used to measure carbonates and bicarbonates in all water
samples with 0.1N hdrochloric acid. phenolphthalein and methyl orange were used as
indicators for carbonates and bicarbonates respectively. The method of titration was run
in such way that 25ml of water sample was taken in 250ml flask and added 3 drops of
phenolphthalein, no color changing occurred which clarified the absence of carbonate in
the water samples. In the same volume 2-3 drops of methyl orange were added. Light
orange color developed in samples which were titrated against 0.1N HCl until color
disappeared. The volume of acid used was noted and results were recorded in mg/L in
terms of CaCO3 using following formula (Srivastava, 2004).
mg/L of CaCO3= (Volume x N of acid used) x 50,000
Volume of sample
50
4.2.2.2. Determination of Light Elements
The analyses for the light elements were performed on the Perkin Elmer Analyst
700 atomic absorption by using absorption mode.
4.2.2.2.1. Determination of Sodium (Na) and Potassium (K)
The stock standard solutions (1000mg/L) for Na and K were prepared by
dissolving 2.542g of NaCl and 1.91g KCl in deionized water and the volume was made
up to 1000ml in a volumetric flask. Working standards of 2.5, 5 and 10mg/L were
prepared from this stock solution. After the preliminary standardization of the atomic
absorption by the working standards, the concentration of Na and K were determined in
water samples in mg/L. For conformation of instrument calibration and accuracy of
analyses, blank and working standards were run after every 10 samples. The atomic
absorption spectrometer was calibrated under the following conditions.
Conditions
Element Na K
Mode Absorption Absorption
Wavelength 589nm 766.5nm
Energy 57 89 J
Current 8 12 A
Slit width 0.2nm 0.4nm
Air flow 17 L/mi 17L/min
Fuel flow 2L/min 2L/min

51
4.2.2.2.2. Determination of Ca and Mg
For determination of Ca and Mg, standard solution was prepared by dissolving
2.479gm of CaCO3 and 4.95gm in 50 ml of deionized water, in which 10 ml of conc. HCl
was added and after this the solution was made up to 1000 ml in volumetric flask with
deionized water. From the stock standard solution 2.5, 5 and 10 mg/L working solutions
were prepared. After atomic absorption standardized with these working standards
solutions, the concentration of Ca and Mg were determined in water samples in mg/L.
For confirmation of instrument calibration blank and working standards were run after
every 10 samples. The atomic absorption spectrometer was calibrated with the conditions
as mentioned above for Na and K.
4.2.2.3. Determination of heavy metals by using graphite furnace
The heavy and trace elements concentration were determined by the Perkin Elmer
Analyst 700 atomic absorption fitted, with HGA graphite furnace and autosampler.
4.2.2.3.1. Determination of Manganese (Mn)
For manganese 1000mg/L standard solution was prepared by dissolving 4.418gm
of MnSO4.4H2O in deionized water in volumetric flask and diluted to 1L. Working
standards of 50, 100 and 200 μg/L were prepared from the stock solution. After the
instrument calibrated with above mention prepared standards, the concentration of
manganese was determined in μg/L in all water samples. For instrument calibration
confirmation standards were run after every 10 water samples.

52
Conditions
Mode Absorption
Wavelength 279.5nm
Energy 38J
Current 20A
Slit width 0.2nm
Air flow 17L/min
Fuel flow 2L/min
4.2.2.3.2. Determination of Iron (Fe)
First of all, 1000mg/L stock solution was prepared by dissolving 1.15g of Mohr
salt [Fe (NH4) 2. (SO4) 2 H2O] in deionized water and further diluted in volumetric flask to
1L. From same stock solution, working standards of 50, 100, and 200µg/L were prepared.
The instrument was calibrated by these working standards under the following calibration
conditions.
Conditions
Mode Absorption
Wavelength 248.3nm
Pretreatment temp 1400˚C
Atomization temp 2400˚C
Energy 40J
Current 30mA
Tube/site pyro/platform
Slit width 0.2nm

53
4.2.2.3.3. Determination of Copper (Cu)
Stock solution (1000mg/L) was prepared by dissolving 1gm Cu in (1:1) HNO3 and
diluted to 1L with diionozed water in a volumetric flask. Standards of 50,100 and
200µg/L were prepared from this stock solution. Instrument was calibrated with these
standards and concentration of copper was determined in µg/L. The conditions under
which instrument was calibrated are as following.
Conditions
Mode Absorption
Wavelength 324.8nm
Pretreatment temp 1200˚C
Atomization temp 2300˚C
Energy 23J
Current 15mA
Tube/site pyro/platform
Slit width 0.7nm
4.2.2.3.4. Determination of Lead (Pb)
The stock solution was prepared by dissolving 1.598gm of Pb (NO3) 2 in 1% of
HNO3 and the volume was made to 1L by adding deionized water. After the calibration
of instrument under the given condition, concentration of lead was noted as µg/L. Blank
and working standards were run after 10 water samples for the conformation of
instrument calibration and accuracy.
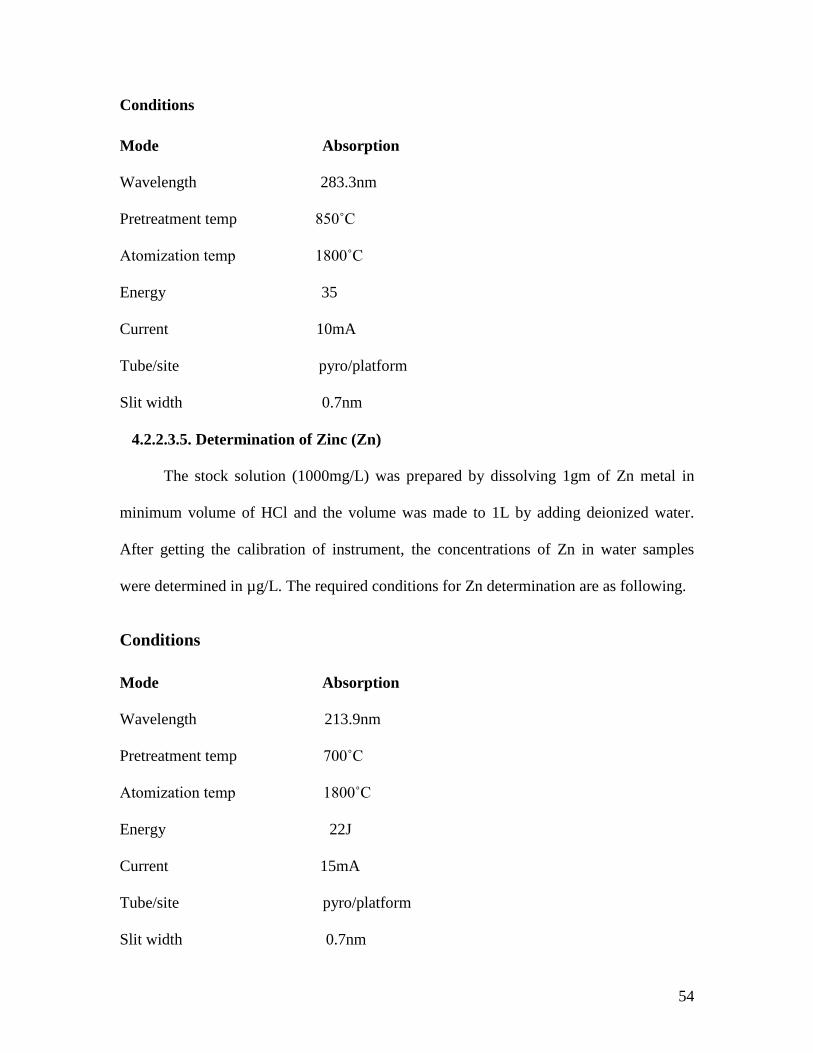
54
Conditions
Mode Absorption
Wavelength 283.3nm
Pretreatment temp 850˚C
Atomization temp 1800˚C
Energy 35
Current 10mA
Tube/site pyro/platform
Slit width 0.7nm
4.2.2.3.5. Determination of Zinc (Zn)
The stock solution (1000mg/L) was prepared by dissolving 1gm of Zn metal in
minimum volume of HCl and the volume was made to 1L by adding deionized water.
After getting the calibration of instrument, the concentrations of Zn in water samples
were determined in µg/L. The required conditions for Zn determination are as following.
Conditions
Mode Absorption
Wavelength 213.9nm
Pretreatment temp 700˚C
Atomization temp 1800˚C
Energy 22J
Current 15mA
Tube/site pyro/platform
Slit width 0.7nm
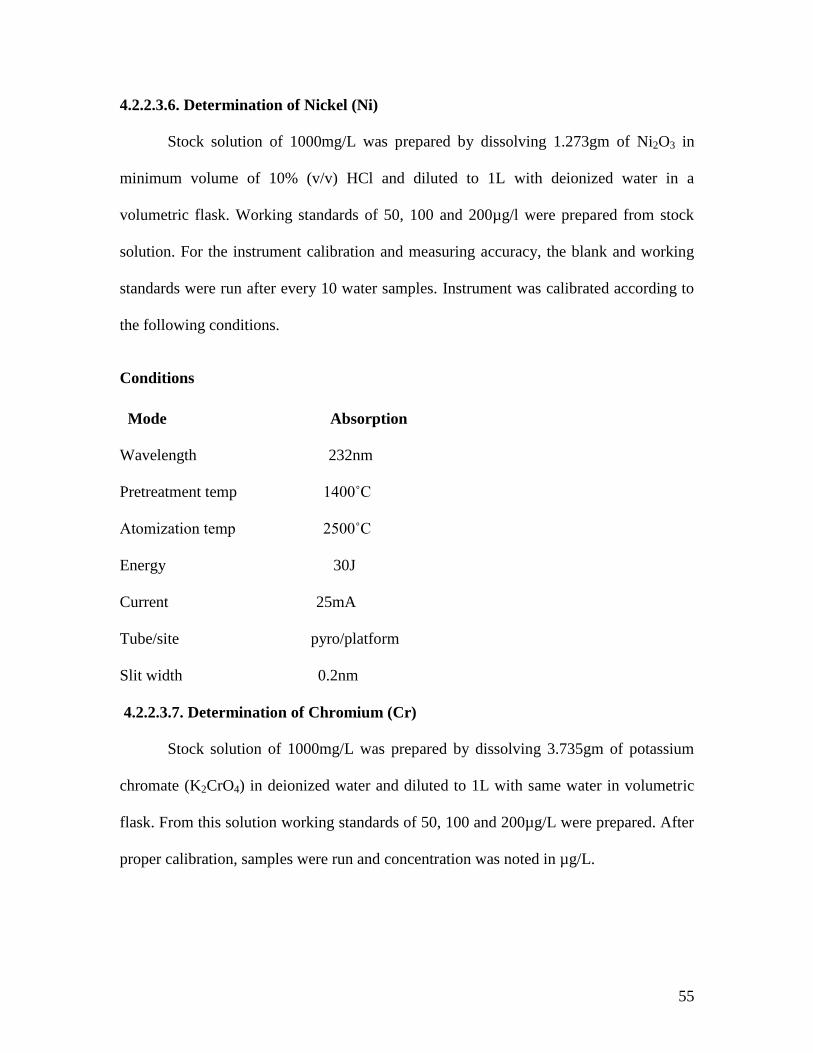
55
4.2.2.3.6. Determination of Nickel (Ni)
Stock solution of 1000mg/L was prepared by dissolving 1.273gm of Ni2O3 in
minimum volume of 10% (v/v) HCl and diluted to 1L with deionized water in a
volumetric flask. Working standards of 50, 100 and 200µg/l were prepared from stock
solution. For the instrument calibration and measuring accuracy, the blank and working
standards were run after every 10 water samples. Instrument was calibrated according to
the following conditions.
Conditions
Mode Absorption
Wavelength 232nm
Pretreatment temp 1400˚C
Atomization temp 2500˚C
Energy 30J
Current 25mA
Tube/site pyro/platform
Slit width 0.2nm
4.2.2.3.7. Determination of Chromium (Cr)
Stock solution of 1000mg/L was prepared by dissolving 3.735gm of potassium
chromate (K2CrO4) in deionized water and diluted to 1L with same water in volumetric
flask. From this solution working standards of 50, 100 and 200µg/L were prepared. After
proper calibration, samples were run and concentration was noted in µg/L.
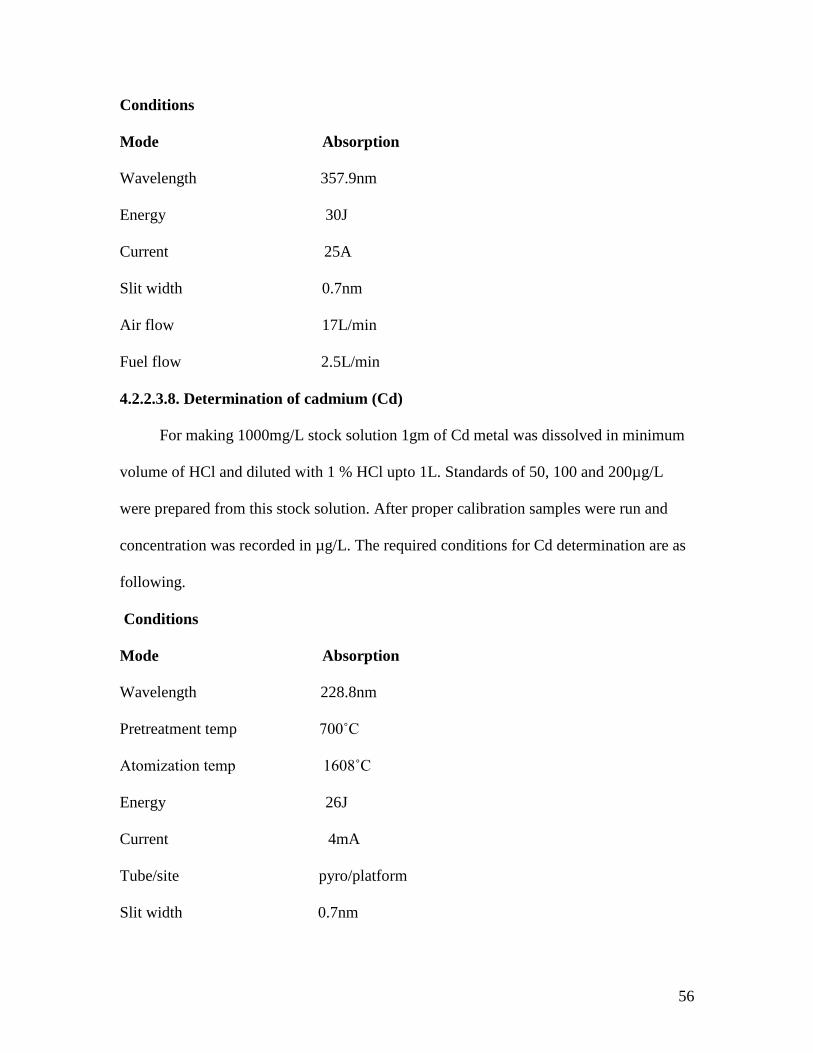
56
Conditions
Mode Absorption
Wavelength 357.9nm
Energy 30J
Current 25A
Slit width 0.7nm
Air flow 17L/min
Fuel flow 2.5L/min
4.2.2.3.8. Determination of cadmium (Cd)
For making 1000mg/L stock solution 1gm of Cd metal was dissolved in minimum
volume of HCl and diluted with 1 % HCl upto 1L. Standards of 50, 100 and 200µg/L
were prepared from this stock solution. After proper calibration samples were run and
concentration was recorded in µg/L. The required conditions for Cd determination are as
following.
Conditions
Mode Absorption
Wavelength 228.8nm
Pretreatment temp 700˚C
Atomization temp 1608˚C
Energy 26J
Current 4mA
Tube/site pyro/platform
Slit width 0.7nm
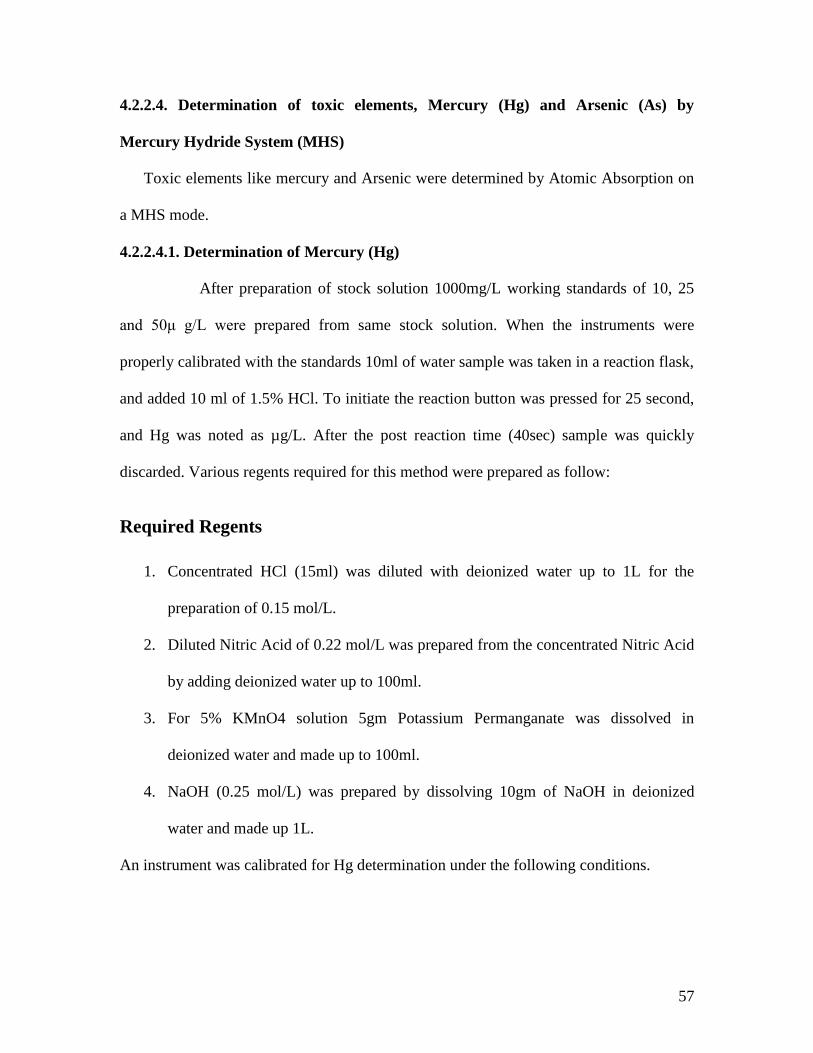
57
4.2.2.4. Determination of toxic elements, Mercury (Hg) and Arsenic (As) by
Mercury Hydride System (MHS)
Toxic elements like mercury and Arsenic were determined by Atomic Absorption on
a MHS mode.
4.2.2.4.1. Determination of Mercury (Hg)
After preparation of stock solution 1000mg/L working standards of 10, 25
and 50μ g/L were prepared from same stock solution. When the instruments were
properly calibrated with the standards 10ml of water sample was taken in a reaction flask,
and added 10 ml of 1.5% HCl. To initiate the reaction button was pressed for 25 second,
and Hg was noted as µg/L. After the post reaction time (40sec) sample was quickly
discarded. Various regents required for this method were prepared as follow:
Required Regents
1. Concentrated HCl (15ml) was diluted with deionized water up to 1L for the
preparation of 0.15 mol/L.
2. Diluted Nitric Acid of 0.22 mol/L was prepared from the concentrated Nitric Acid
by adding deionized water up to 100ml.
3. For 5% KMnO4 solution 5gm Potassium Permanganate was dissolved in
deionized water and made up to 100ml.
4. NaOH (0.25 mol/L) was prepared by dissolving 10gm of NaOH in deionized
water and made up 1L.
An instrument was calibrated for Hg determination under the following conditions.

58
Conditions
Mode Absorption
Wavelength 253.6nm
Slit wide 0.7nm
Pre reactions purge time 5 sec opprox
Post reaction purge time 50 sec
Pre reaction purge time 50 sec
Reaction time 25 sec
Post reaction purge time 40 sec
4.2.2.4.2. Determination of Arsenic (As).
From stock solution of 1000mg/L, working standards of 10, 25 and 50μg/L were
prepared, and instruments was calibrated with these standards solution under the below
mentioned conditions. When the instruments was properly calibrated 10ml of water
sample was taken in a reaction flask,10ml of 1.5% HCl and 1ml of KI were added to each
water sample. Same procedure was followed for the blank and standards. After 30min,
samples were run on MHS and As was noted as µg/L.
Various solutions required for this method were prepared as follow:
1. NaOH solution 0.25mol/L (1% w/v) was prepared by dissolving 10gm NaOH
in double deionized water and diluted to 1L. 0.15M (1.5% v/v) HCl.
2. HCl (5mol/L) was prepared by taking 500ml concentrated HCl and diluting up to
1L with double deionized water.
3. NaBH4 (0.8mol/L) solution was prepared by taking 3gm Sodium borohydride and
dissolving it in 100ml of 10% NaOH.
59
4. Solution of KI was prepared by dissolving 3gm KI and 5gm Ascorbic acid in
100ml of deionized water.
Required conditions for As determination are as following.
Conditions
Mode Absorption
Wavelength 193.7nm
Slit wide 0.7nm
Radiation source Electrodeless discharge lamp for As
Pre reaction Purge time 50 sec
Reaction time 25 sec
Post reaction Purge time 40 sec
4.3. Piper diagram scheme
Piper diagram is a graphical representation of the chemistry of water samples.
Generally it consist of two triangles (one for cations and one for anions), and a central
diamond-shaped figure. Water analysis plotted on piper diagram scheme cation (such as
Ca+2
, Na+, K
+ and Mg
+2) percentages in meqL
-1 plotted on the left triangle, and anions
(such as Cl-, SO4
2-, CO3
2- and HCO3
-) percentages in meqL
-1 plotted on the right triangle.
Points on the cations and anions diagram are projected to upward where they intersect on
the diamond.
4.4. GIS Maps
For the plotting and digitization of all the maps were constructed and digitized for the
study by using the GIS software called as Arc-GIS 9.2.

60
CHAPTER 5
WATER CHEMISTRY
5.1. Introduction
Water is a major constituent for all living organisms. The human body is
containing about 85% of water and vegetative materials are containing about 90% of
water. In all the living systems the basic fundamental processes are dependent on the
distinctive physical and chemical properties of water. It is the only a substance on the
earth that exists in three different states i.e., solid, liquid and gaseous. The vast amounts
of water on the surface of earth act as a giant thermostat to moderate the earth’s
temperature. Due to high specific heat it helps to maintain stable temperatures in living
organisms (Soomro, 2004).
There is a fixed amount of water on the planet, (nearly 1388 million km3)
Which can be neither increased nor decreased but only can be polluted by interaction
with fresh resources without proper planning. About 70% of the earth’s surface is
covered by the ocean, which contain about 97.3%.of total water on the earth. A further
2.09% is ice and the rest is found underground (0.60%), in fresh water lakes (0.007%), in
saline lake (0.0007%), in soil water (0.005%), in atmosphere (0.0009%), in living bio-
mass (0.0002%) and in rivers and streams (0.00007%) (Soomro, 2004).
This small portion of the fresh water on the earth can be used to meet the need
of humanity-to quench its thirst, to wash away its wastes and water to its crops. In many
countries, this limited supply is polluted by industrial and municipal wastes, agricultural
runoff and sediments from eroded land. About 40% of the world’s population is
dependent upon water from neighbouring countries. In such cases, one country polluted

61
water may become problem of neighbor country. Nevertheless, this small portion should
be enough to sustain all forms of life on earth, provided it is more evenly distributed and
kept unpolluted (Narayan, 2000).
5.2. Water pollution
Water pollution is a phenomenon that is characterized by the deterioration of the
quality of land water (river, lakes, marshes and ground water) or seawater as a result of
various geogenic and human activities (Triveddi and Raj, 1992). There are certain
pollutants which by both geogenic and anthropogenic activities that enter the water which
effect the physical and chemical quality of water and cause water pollution. Water
pollution occurs in oceans, rivers, lakes, bays, streams and underground water. It involves
the release of toxic substances, inorganic chemical and pathogenic germs, substances that
require oxygen to decompose, easy soluble substances and radioactivity. The root causing
agents of these pollutants in the water are, synthetic agricultural chemicals, sediments,
petroleum products hazardous wastes and excess of organic matter (Botkin, 1995).
High altitude alpine lakes/wetlands are one of the best water resources and
suitable habitats to the biodiversity (Hecky and Ohwayo, 1990). These high mountain
alpine lakes are good indicators of regional and global pollution, as they are far from
human settlements and the variations they undergo are mainly due to atmospheric
deposition of pollutants and to climatic change. In general, they are sensitive to changes
in atmospheric deposition because of their peculiar characteristics, such as small size,
watershed with steep slopes, little land cover and thin soil, low temperature and low
weathering rates of their bedrock. Palaeolimnological evidence has shown the sensitivity
of alpine lakes to acidification and to temperature change (Marchetto et al., 1995).
62
Gradually when the human population increases, interruption of human to such highly
environmental sensitive areas will be started. Human impacts on lake ecosystem by
overexploitation, which leads to a decline in the fish stocks, industrialization and land
use, can lead eutrophication and rapid contaminations of the aquatic ecosystem (Hecky
and Bugenyi, 1992).
5.2.1. Sources of water pollution
There are two types of sources from which pollutants are usually generated that
lead to water pollution. These are (1) point sources from which the pollutants released at
one readily identifiable spot such as steel mill, sewer outlet, septic tank and (2) non-point
sources from which the pollutants released in diffused form and it is difficult to identify
their sources such as fertilizer run off from farmland, acid drainage from an abandoned
strip mine, runoff of calcium and sodium chloride salt from either directly off roadway or
via storm drains. The point sources of pollution are often easier to identify relative to the
non point sources of pollution (Montgomery , 2006).
5.2.2. Types of water pollutants
Water pollutants are the substances that enter the water body from an external
source and are responsible to degrade the aquatic ecosystem. Geogenic and
anthropogenic activities lead to accelerate the rate of water pollution.
Reven et al. (1993) categorized the pollutants according to their existence which are as
follows:
a. Soil erosion which lead to sediments pollution.
b. Diseases causing germ from the infected organism.

63
c. Mercury compound, salt and acid drainage type of inorganic chemicals from the
mines.
d. Sewerage waste water carried off by drain or sewer from the toilets, shower and
kitchens.
e. Inorganic plant nutrients such as Nitrogen, Phosphorous originating from animal
waste, plant residues and fertilizers.
f. Organic compound in synthetic form that are often toxic to aquatic organisms,
g. Waste from the mining and refinement of radioactive metals, causing radioactive
substances pollution.
h. Thermal pollution i.e., heat entering from the industries which is not
only affecting the liquid organisms but are also toxic for variety of wildlife.
5.3. Water chemistry
Chemically pure water is two molecules of hydrogen and one of oxygen (H2O). Such
a substance is not found in nature, not in wild stream lakes, clouds, rain and not in falling
snow, or nor polar of ice caps. Pure water can be prepared in laboratory but only with
considerable difficulty (Jonathan et al., 1983). Water body has different water chemistry
in its different forms (in air, in snow, in river, in lakes and in oceans). During the
hydrological cycle of water, fresh water in the form of rain and snow fall on the surface
of earth and it started to move downward from the high altitude, it dissolves many
substances from the surrounding catchments and water get contaminated on the way.
Water accepts and holds foreign matter in various ways that are:
64
1. Water is a good solvent in nature, therefore, it dissolved organic compound in the
form of organomettalic complexes and dissolves inorganic substances such as,
minerals and salts which typically consist of negative and positive ions.
2. Insoluble particles, if they are small enough, may settle so slowly that for all
practicle purposes they remain in water indefinitely.
3. Nutrients retained in water body as waste product are the nutrient metabolized by
living organisms in water.
4. Soluble substances that react with the insoluble contaminants and bring these into
solution.
5. Contaminants in the form of floating substances on the surface of water i.e.
petroleum and oil spill.
Water chemistry of alpine lakes is influenced by many factors, such as bedrock
mineralogy soil and vegetation in the catchments. Bedrock mineralogy influence water
chemistry by the dissolution of minerals and solutes by the action of water during
weathering and erosional processes (Psenner and Catalan, 1994). Vegetation effect
precipitation, transport, and deposition of ions and nutrients while the soil can provide
cation exchange complex (Stumm and Margon, 1996). The quantity and quality of water
in any place may be degraded or improved by human intervention. This should be our
duty as human being to look for the ways and mean for the conservation of clean water
for our future generations (Soomro, 2004).
5.4. Water chemistry of the study areas
The quality and property of any water body is depending upon their
physiochemical parameters. On the basis of these parameters water can be classified as

65
healthy and polluted. Various physiochemical parameters in 50 representative water
samples collected from the nine selected high altitude alpine lakes (i.e., Naltar wetland
complex, Uttar lake, Hundrap lake and Baha lake) and their respective streams of the
study area have been evaluated for their possible contamination. Their detailed results
have been given below.
5.4.1. Physical parameters
Color
The appearance color of water body is dependent on the presence of dissolved and
suspended matter, including metallic ions, chemical pollutants, plankton, and plant
pigments (polyphenolic compounds) from humus and peat. In case of lakes, reflections of
the substrate can also impart color. The true color of water is attributed to dissolve
substances only, and can be determined by filtering the water to remove any suspended
matter. Color standards have been developed by which dissolved color can be measured
using a comparative scale. The color of the water in the study area is generally colorless
and odorless.
Temperature
Temperature is one of the most important parameter for aquatic environment
because almost all the physical, chemical and biochemical properties of water are
governed by it therefore, it has direct and indirect effects on aquatic ecosystems.
Variations in water temperature occur both seasonally and daily. In case of daily
variation, maximum temperatures usually occur in the afternoon, minimum temperatures
are recorded in the early morning hours. Short-term variations are greatest in unshaded,
shallow streams and less in deep-water body and near the source of spring-fed streams.
66
Water has a high heat capacity, it is highly resistant to changes in temperature. However,
increases in water temperature may result from the discharge of heated waters, chemical
reaction inside the water body and run-off from heated surfaces (e.g., roads, parking lots),
and decrease in water temperature can result from snowmelt, shade, and underground
springs. As the temperature of water changes chemical and physical properties of the
water also change, therefore, it has significant impacts on biological processes.
The values of temperature in the water of lakes and streams of the areas selected
for studies (Naltar wetland complex, Uttar, Hundrap and Baha lakes and their respective
streams) are given in the Table 5.1 and graphically presented in figures 5.1a, 5.1b, 5.1c,
and 5.1d. The recorded temperature in Naltar (wetland complex and their related stream),
ranged from 6 oC to 9
oC. The maximum temperature of 9
oC was recorded in sample
W29, which was collected from Naltar 4 View Hotel. The average temperature in the
region was 6.92 oC. In Iskoman (Uttar lake and respective stream), the temperature
recorded was 7 oC in all the water samples except in sample W20, collected from the
Uttar lake centre where the temperature was measured 8 oC. The average value of
temperature in Iskoman was found 7.11 oC. Temperature recorded in Hundrap region
(Hundrap lake and respective stream), ranged from 6 oC to 8
oC. The maximum values of
temperature 8 oC were recorded in samples W38, W39, which were collected from the
Hundrap inhabitance. The average temperature in the water of this region was 6.67 oC. In
Khukosh (Baha lake and respective stream), the value of temperature was recorded below
7 oC in all the water samples having an average value of 6.43
oC in the region.
67
pH
Is the –log of hydrogen ion concentration or it is the intensity factor of acidity. pH
values can also be defined as the exponent to the base 10 of hydrogen ion concentration.
For natural water these values range from 4-9 however, higher values represent
bicarbonate and carbonates of alkali and alkaline earth elements (Rajuaidya and
Markandey, 2005).
Water is classify on the basis of their pH are as given below.
Concentration of H+ moles/ Liters Calculation of pH Types of water
1/10-1 log1/10-1= -1pH = 1 More acidic
1/10,000,000 log1/10,000,000, =log 10-7 = 7 Neutral
1/10,000,000,000 Log1/1000,000,000 =10-9 =9 alkaline
Source, Ahmad (2008).
The values of pH in the water of lakes and steams of the areas studied are given in
the Table 5.1 and graphically presented in Figures 5.2a, 5.2b, 5.2c, and 5.2d. The values
of pH in Naltar (wetland complex and their related stream), ranged from 7.4 in sample
W30, collected from the Naltar steam at Bangalah, to 7.9 in samples W6,W7,W32 and
W34, collected from Singo bari outlet, Chakar bari inlet, Naltar home and from the last
of Naltar stream at Nomal respectively. The average value of pH in Naltar region was
found 7.71. In Iskoman (Uttar lake and respective stream), the values of pH ranged from
7.2 in sample W43, collected from Iskoman stream at Gotolti, to 7.9 in sample W46,
collected from the stream at the last of Iskoman population. The average value of pH in
Iskoman was 7.62. The values of pH in Hundrap (Hundrap lake and respective stream),
68
ranged from 7.2 in sample W37 collected from the house in Hundrap, to 7.9 in sample
W38, collected from another house in the Hundrap. The average value of pH in Hundrap
region was found 7.64. In Khukosh (Baha lake and respective stream), the values of pH
ranged from 7.5 in samples W25, W48, collected from the Baha lake inlet and Khukosh
stream at Longer valley respectively, to 7.9 in sample W50, collected from the Khukosh
stream at Barsat. Average value of pH in water of Khukosh region was found 7.69.
Electric Conductivity (EC)
Electric conductivity is the ability of a material to conduct electric current in
water, (Rajuaidya and Markandey, 2005). Electric conductivity is determined by
measuring the concentration of dissolved salts. More salts dissolved in the water, better
will be the conductance electricity. As the temperature of water increases, the velocity of
salt ions increase and, in turn, the conductivity of the water also increases. In unpolluted
waters, conductance increases by 2 to percent. Conductance values can be used to
estimate the total concentration of dissolved and particulate solids (commonly referred to
as total dissolved solids (TDS), in a water body. The value of conductivity in water is
measured as micro-Siemans (μS) (Sinyukovich, 2001).
The values electrical conductivity in water of lakes and streams of the selected
areas are given in Table 5.1 and graphically presented in Figures 5.3a, 5.3b, 5.3c, and
5.3d. The values of EC in Naltar (Naltar wetland complex and their related stream),
varied from a minimum of 106 μs/cm in sample W4, collected from the Singo bari inlet,
to maximum value of 281 μs/cm in sample W30, collected from Naltar stream at
Bangalah. The average value of EC in Naltar region was found 145.76 μs/cm. In Iskoman
69
(Uttar lake and respective stream), the valus of EC ranged from 128 μs/cm in samples
W128, collected from the Uttar stream at Gotolti, to 217 μs/cm in sample W4, collected
from the mosque in Iskoman. The average value of EC in Iskoman was found 163.89
μs/cm. In Hundrap (Hundrap lake and respective stream), the values of EC ranged from
90 μs/cm in sample W23, collected from the Hundrap lake centre, to 181 μs/cm in sample
W39, collected from the house in Hundrap. The average value of EC in Hundrap was
found 123.22 μs/cm. In Khukosh (Baha lake and respective stream) the values of EC
ranged from 103 μs/cm in sample W47, collected from the Khukosh stream, to 241 μs/cm
in sample W27, collected from the Baha lake outlet. The average value of EC in Khukosh
region was found 150.71 μs/cm.
Total Dissolved Solids (TDS)
Total dissolved solids (TDS) comprise inorganic salts and small amounts of
organic matter that are dissolved in water and left in water after water filtration,
(Sinyukovich, 2001). The principal constituents are usually the cations calcium,
magnesium, sodium and potassium and the anions carbonate, bicarbonate, chloride,
sulphates and, particularly in groundwater, nitrate (from agricultural use). A
concentration of TDS in water varies and it depends upon different mineral solubilities in
a different geological regions. The concentration of TDS in water is less than 65 mg/L in
a Precambrian rocks while their level is higher in Palaeozoic and Mesozoic sedimentary
rock (ranging from 195 to 1100 mg/L), because of the presence of carbonates, chlorides,
calcium, magnesium and sulphates, (Singh, et al., 1975). TDS in a water cause hardness,
while in the sense of health effect it will be estimated as the individual component
dissolved in a water rather than whole TDS.
70
The values of TDS in the water of lakes and streams of the areas under
investigation are given in the Table 5.1 and graphically presented in Figures, 5.4a, 5.4b,
and 5.4c 5.4d. The values of TDS in Naltar (Naltar wetland complex and their related
stream), ranged from 57 mg/L in sample W7, collected from Chakar bari inlet, to 181
mg/L in sample W29, collected from the Naltar 4view hotel. The average value of TDS
in Naltar was found 83 mg/L. In Iskoman (Uttar lake and respective stream), the values
of TDS ranged from 65 mg/L in sample W43, collected from the Iskoman stream at
Gotolti, to 122 mg/L in sample W45, collected from the mosque in Iskoman. The average
value of TDS in Iskoman was found 94.2 mg/L. The values of TDS in Hundrap (Hundrap
lake and respective stream), varied from a minimum value of 50 mg/L in sample W23,
collected from the Hundrap lake centre, to a maximum of 125 mg/L in sample W40,
collected from the Hundrap stream at the end of Hundrap population. The average value
of TDS in the Hundrap was found 75 mg/L. In Khukosh (Baha lake and respective
stream), the values of TDS ranged from 51 mg/L in sample W47, collected from
Khukosh stream just below the Baha lake, to 149 mg/L in sample W49, collected from
the Khukosh stream at longer valley. The average value of TDS in Khukosh region was
found 88 mg/L.
Turbidity
Turbidity is a cloudiness or haziness in water (or other liquid) caused by
individual particles that are too small that cannot be seen without magnification, or it can
contain suspended solid matter in large sizes (Schwartz et al., 2000). Therefore, in
drinking water, the turbidity is a measure of the cloudiness of the water, which includes
inorganic, organic and microbial organisms. Increasing turbidity depends on different

71
weathering processes and inevitable consequences of human activities around the water
body. Increasing turbidity in water associated with different problems such as, blocking
of light penetrating to the lower substrata of water body and destroying the life of
photosynthetic plant inside the water body. The siltation that tends to accompany high
turbidity may kill living coral and destroy highly productive grass flats (Cluney, 1975).
As turbidity is one of the most important parameter in water and their values in
the water of lakes and streams in the areas studied are given in Table of 5.1 and
graphically presented in Figures 5.5a, 5.5b, 5.5c, and 5.5d. The values of turbidity in
Naltar (Naltar wetland complex and their related stream), varied from a minimum of 0
NTU, to a maximum of 2.8 NTU with an average value of 0.75 NTU in the region. In
Iskoman (Uttar lake and respective stream), the values of turbidity varied from minimum
of 0.3 NTU to a maximum of 4.9 NTU with an average value of 3.8 NTU in the region.
The values of turbidity in Hundrap (Hundrap lake and respective stream), varied from 0.2
NTU, to 1 NTU with an average value of 0.5 NTU. In Khukosh (Baha lake and
respective stream), the values of turbidity varied from 0.7 NTU, to 3.9 NTU with an
average value of 2.04 NTU in the region.
Salinity
The acid neutralization capacity of water is called salinity of water. The salinity of
water is a function of carbonate, bicarbonates and hydroxide contents dissolved in water
body (Sinyukovich, 2001). Salinity was originally defined by the oceanographer as the
total amount of solid material in grams contained in one kilogram of seawater when all
the carbonate has been converted to oxide, the bromine and iodine replaced by chlorine,
and all organic matter completely oxidized (Willams and Sherwood, 1994). Salinity is

72
most important chemical attribute of athalassic salt lake in most chemical, physical and
biological studies of these water-bodies. Measurements of salinity in water can be
derived directly from full ionic analyses, while indirectly can be derived by
determinations of density, conductivity, freezing point depression and total dissolved
solids or matter.
The values of salinity in water of lakes and streams of the selected areas are given
in Table of 5.1 and graphically presented in figures 5.6a, 5.6b, 5.6c and 5.6d. The values
of salinity in Naltar region (Naltar wetland complex and their related stream), were found
in the range of 0.1 in samples W2, W4, W5, W7, W10, W13, W30, collected from the
centre part of the Bodrok bari, inlet and centre of Singo bari, Chakar bari inlet, Chemo
bari inlet, Small bari inlet and Naltar stream at Bangalah respectively, to 3.8 in sample
W3, collected from the Bodrok bari outlet. The average value of salinity in Naltar was
found 0.51. In Iskoman (Uttar lake and respective stream), the value of salinity was found
0.1 in all the collected water samples with little variation of 0.7 and 0.8 in samples W45
and W42, collected from Iskoman mosque and Iskoman stream at Matintar. The average
value of salinity in Iskoman was found 0.26. The value of salinity in Hundrap (Hundrap
and respective stream), was found to be <0.4 with an average value of 0.17 in the region.
In Khukosh (Baha lake and respective stream) the value of salinity was found to be <0.2
with an average value of 0.16 in the region.
Resistivty
The ability of water to resist the electric current is called resistivity of that water
(Paul, 1988). Mostly the resistivity is used to estimate the subsurface water
contaminations (Urish, 1983). The surface electric resistivity measurement can also be
73
used to estimate the horizontal flow direction and viscosity of ground water in shallow
aquifers as well as the aquifers hydraulic conductivity (Fried, 1975). Any water having
high value of resistivity is having less concentration of salts. In contrast when the water is
concentrated with different salts it enhances the electric current due to impurities of salts
and decrease the value of electric resistivity.
The values of resistivity in the water of lakes and streams of the study areas are
given in Table 5.1 and graphically presented in Figures 5.7a, 5.7b, 5.7c, and 5.7d. The
values of resistivity in Naltar (Naltar wetland complex and their related stream), ranged
from 5 k/Ώ in sample W18, collected from the Koto bari outlet, to 10 k/Ώ in samples W4,
W9, W29, and W34, collected from Singo bari inlet, Chakar bari outlet, Naltar 4view
hotel and at the end of Naltar stream at Nomal respectively. The average value of
resistivity in Naltar was found 7.73 k/Ώ. The calculated values of resistivity in Iskoman
(Uttar lake and respective stream), ranged from 5 k/Ώ in sample W41, collected from
Iskoman stream near the local huts, to 8 k/Ώ in samples W42 and W4, collected from
Iskoman stream at Matintar and at the end of Iskoman population respectively. The
average value of resistivity in Iskoman was found 6.89 k/Ώ. In Hundrap (Hundrap lake
and respective stream), the values of resistivity ranged from 5 k/Ώ in sample W38,
collected from the Hundrap stream at Chakurrari, to10.9 k/Ώ in sample W23, collected
from the central part of Hundrap lake. The average value of resistivity in Hundrap was
found 8.43 k/Ώ. In Khukosh (Baha lake and respective stream), the values of resistivity
ranged from 4 k/Ώ in sample W27, collected from the Baha lake outlet, to 8 k/Ώ in
sample W25, taken from the Baha lake inlet. The average value of resistivity in Khukosh
was found 6.54 k/Ώ.

74
5.4.2. Anions
Chloride (Cl-)
Chloride (Cl-1
) is one of the major anions found in water, and are generally
combined with calcium, magnesium, or sodium in form of soluble salts. Mostly chlorides
entered into the water bodies from several external sources such as rocks, agricultural
runoff, industrial waste water, oil well waste, effluent from wastewater treatment plants
and salting road (Nollet, 2000). In combination form such as sodium chloride, chloride is
essential for life, but in small quantity to a normal cell to perform functions in plant and
animal life. At high concentration chloride can corrode metals and affect the taste of food
products (WHO, 1996).
The values of chloride in the water of lakes and streams of the study areas are
given in the Table 5.2 and graphically presented Figures 5.8a, 5.8b, 5.8c, and 5.8d. The
value of chloride in Naltar (Naltar wetland complex and their related stream), was found
below the detection level (<0.1mg/L) in samples W6, W7, W10 and W13, collected from
Naltar lakes at Singo bari outlet, Chakar bari inlet Chemo bari inlet and Small bar inlet
respectively. The values of chloride in rest of the water samples ranged from 0.1 mg/L, to
42.2 mg/L. The average value of chloride in Naltar was found 5.65 mg/L. In Iskoman
(Uttar lake and respective stream), the values of chloride were found between 0.2 mg/L to
29.2 mg/L in samples W21-W43, collected from Uttar lake outlet and Iskoman stream at
Gotolti respectivelly. The average value of chloride in Iskoman was found 9.2 mg/L. In
Hundrap (Hundrap lake and respective stream), the values of chloride were measured
from 0.5 mg/L to 23.4 mg/L in samples W2-W36, collected from Hundrap lake centre
and Hundrap stream at Hirzdam respectively. The average value of chloride in Hundrap

75
was found 11.87 mg/L. In Khukosh (Baha lake and respective stream), the values of
chloride were in the range of 0.7 mg/L 23.2mg/L in in samples W27-W48, collected from
the Baha lake outlet and Khukosh stream at Longer valley. The average value of chloride
in Khukosh was calculated 9.51 mg/L.
Sulfate (SO4-2
)
Sulfate is a naturally occurring substance formed as a result of combination of
sulpher and oxygen. In soil sulfate formed various minerals of different elemental groups
including, calcium, potassium, sodium etc. Sulfates are found in water as soluble salts of
sodium, magnesium and potassium from the leaching of soil, but some of the sulfate salts
(calcium and barium) not easily be soluble in water. There are several sources other than
soil which bring sulfate in water are, decaying of plant and animal matter, excessive use
of fertilizer having the chemical product of ammonium sulfate. Generally sulfate is
nontoxic and is consider as integral component of protein, sulfates found in all foods
containing protein such as fish, meat or milk products. Sulfates are absorbed by the body
only in very small quantities but at high concentration of magnesium and sodium sulfate
in water may cause intestinal discomfort, diarrhea and consequently dehydration. High
concentration of sulfate in water may interfere the chlorination and some time it increases
the corrosive properties of water (Sulfate fact sheet, 2003).
The concentrations of sulfate in the water of lakes and streams of the areas studied
are given in Table 5.2 and graphically presented in the Figures 5.9a, 5.9b, 5.9c, and 5.9d.
The concentration of sulfate in Naltar (Naltar wetland complex and their related stream),
were found between 6 mg/L to 28 mg/L in samplesW9-W31, collected from Chakar bari
outlet and Naltar house at cote muhallah respectivelly. The average concentration of

76
sulfate in Naltar was found 14.56 mg/L. In Iskoman (Uttar lake and respective stream),
the concentration of sulfate ranged from 15 mg/L to 27 mg/L in samples W20-W43 and
W45, and were collected from Uttar lake centre, Iskoman stream at Gotolti and Iskoman
mosque respectivelly. The average concentration sulfates in Iskoman was found 20.22
mg/L. The concentration of sulfate in Hundrap (Hundrap lake and respective stream),
were in the range of 6 mg/L to 27 mg/L in samples W23-W39, collected from the
Hundrap lake centre and Hundrap house respectively. The average concentration of
sulfate in Hundrap was measured 16.22 mg/L. In Khukosh (Baha lake and respective
stream), the concentration of sulfate ranged from 5 mg/L to 50 mg/L in samples W25-
W27, collected from inlet and outlet of Baha lake respectively. The average concentration
of sulfate in Khukosh was calculated 22mg/L.
Nitrate (NO3-)
Nitrate is a common compound of food, with vegetables usually being the
principle in the daily diet. The entrance of nitrate in human body is directly by the intake
of contaminated groundwater or indirectly by the uses of different vegetables
contaminated with nitrate, Therefore, mostly in vegetarian people high concentration of
nitrate are found as compare to non vegetarian (Gray, 2008). The percentage of amount
of nitrate leaching from the soil is depend upon the different factors such as, soil
structure, plant activities, rain fall and temperature and the rate of fertilizer application. It
is difficult to predict that how much amount of nitrate is released from the farmland, but
it can be concluded that nitrates are mostly coming from the different agricultural
activities because of excessive use of fertilizer in the farmlands. This excessive
concentration of nitrate in water may cause nutrients deposition in lakes and pounds,

77
which are responsible for the deficiency of oxygen in the water body and lead to
eutrophication. In case of dirking water excessive intake of nitrates can have severe
consequences for human health, especially for bottle fed-babies, the high concentration of
nitrate in human body may cause blood poisoning, hypertension, gastric cancer and fetal
malformations (Narayan, 2000).
The concentrations of nitrate in the water of lakes and streams in the areas under
investigation are given in Table 5.2 and graphically presented in the Figures of 5.10a,
5.10b, 5.10c and 5.10d. The concentration of nitrate in Naltar wetland complex and their
related stream were found between 0.4 mg/L to 5 mg/L in samples W7-W34, collected
from Chakar bari inlet and end of Naltar stream at Nomal respectively. The average
concentration of nitrate in Naltar was found 1.61 mg/L. The concentration of nitrate in
Iskoman (Uttar lake and respective stream), was found below the detection level (<0.3) in
sample W20, collected from the Uttar lake centre, while in rest of the water samples the
concentration of nitrate were ranged from 0.4 mg/L to 2.9 mg/L. The average
concentration of nitrate in Iskoman was found 1.49 mg/L. In Hundrap (Hundrap Lake and
respective stream) the concentration of nitrate were found less than 2.1 mg/L in all the
water samples having an average concentration of 0.89 mg/L. In Khukosh (Baha lake and
respective stream), the concentration of nitrate were found less than 3 mg/L in all
collected water samples, with an average concentration of 1.19 mg/L.
Carbonates (CO3-2
) and Bicarbonates (HCO3-)
Carbonates and bicarbonates imparts alkalinity to the water, which is the ability of
water to neutralize acid. The function of alkalinity is due to the carbonate, bicarbonates
and hydroxyl ions. Measuring of these parameters are important in the interpretation and

78
control of the water and wastewater treatment processes. Generally soft waters are prone
to the acid however, the presence of the carbonate and bicarbonate ions help in buffering
the system (Nolett, 2000).
The concentrations of carbonate were found in negligible amount in all the
representative water samples of the study areas and, therefore not presented in the
Table.5.1 however, the concentration bicarbonates in the water of lakes and streams in
the study areas are given in Table 5.2 and graphically presented in the Figures 5.11a,
5.11b, 5.11c, and 5.11d. The concentration of bicarbonates in Naltar (Naltar wetland
complex and their related stream), were found between 60 mg/L to 320 mg/L in samples
W5-W31, collected from the Singo bari centre and Naltar house at cote muhallah
respectively. The average concentration of bicarbonates in Naltar was calculated 163.2
mg/L. The concentration of bicarbonates in Iskoman (Uttar Lake and respective stream),
were in the range of 80 mg/L to 360 mg/L in samples W21-W43, collected from the
Uttar lake outlet and Iskoman stream at Gotolti respectivelly. The average concentration
of bicarbonates in Iskoman was found 170 mg/L. In Hundrap (Hundrap lake and
respective stream), the concentration of bicarbonates ranged from 23 mg/L to 360 mg/L
in samples W37-W39, which were collected from the Hundrap houses at different place.
The average concentration of bicarbonates in Hundrap was found 168.11 mg/L. The
concentration of bicarbonates in Khukosh (Baha lake and respective stream), were ranged
from 140 mg/L to 210 mg/L in samples W47-W49 and W50 and were collected from
Khukosh stream just below the Baha lake, longer valley and Barsad respectivelly to The
average concentration of bicarbonates in Khukosh was calculated 178.57 mg/L.

79
5.4.3. Light elements
Sodium (Na+)
Sodium is silvery-white metallic element with a symbol Na, and is most abundant
element of the earth crust (about 2.6% by weight of the Earth's crust). It is a highly
reactive metal, therefore, it is found in nature only as a compound and never as the free
element. Sodium is found in many different minerals, in which, ordinary salt (sodium
chloride), amphibole, cryolite, soda niter and zeolite. In water sodium ion is soluble in
nearly all of its compounds, therefore, it is present in greater quantities in oceans, lakes
and other stagnant water bodies. Sodium is an essential element for the living of plants
and animals. In animals, sodium ion is used in opposition to potassium ions, to allow the
organism to build up an electrostatic charge on cell membranes, and allow transmission
of nerve impulses. In its metallic form sodium can be used to refine some reactive metals,
such as potassium, and zirconium from their compounds, while as an alkali metal, sodium
ion is vital to animal life. Sodium in water in the form of sodium hypochloride is highly
corrosive to metal and it damages all the living tissues except keratinized epithelia (Roger
and Alex, 1998). In highly sodium concentrated water reservoir there occurs a change in
the fresh water chemistry, and hence resist the survival of fresh living organisms.
Sodium concentrations in the water of lakes and streams in the study areas are
given in Table 5.3 and graphically presented in Figures 5.12a, 5.12b, 5.12c, and 5.12d.
The concentration of sodium in water samples collected from Naltar area (Nalatr wetland
complex and their related stream) ranged from 0.5 mg/L to 35.03 mg/L in samples W11-
W31, with an average concentration of sodium 2.98 mg/L. The concentration of sodium
in Iskoman (Uttar Lake and respective stream), were found between 1.27 mg/L to 123.88

80
mg/L in samples W42-W46, with average concentration of sodium 1.56 mg/L. Water
samples collected from Hundrap area (Hundrap lake and respective stream), the
concentration of sodium ranged from 1.65 mg/L to 33.67 mg/L samples W23-W37, with
an average concentration of sodium 5.52 mg/L in the area. Water samples collected from
Khukosh region (Baha lake and respective stream), the concentration of sodium were in
the range of 1.31mg/L to 140.75mg/L in samples W47-W50, with an average
concentration of sodium of 57.25 mg/L in the region.
Potassium (K+)
Potassium is silver white metal and it exists in water with low concentration,
because of its low solubility in water. Potassium is found in water from the mineral like
feldspar. Potassium in KMnO4 form in water affects the chemical oxygen demand and
affects the fish living pattern. Generally potassium is an essential element for life when
its concentration level is low in body it causes muscle vascular disease (American
Clinical Nutrition, 2000).
The concentrations of potassium in the water of lakes and streams of the areas
under investigation are given in Table 5.3, and graphically presented in the Figures 5.13a,
5.13b, 5.13c, and 5.13d. The concentration of potassium in water samples collected from
Naltar wetland complex and their related stream were in the range of 1.97 mg/L to 5.27
mg/L in samples W14-W30, with an average concentration of potassium 2.78mg/L.
Water samples collected from Iskoman area (Uttar lake and respective stream), the
concentration of potassium were found between 2.41 mg/L to 5.4 mg/L in samples W20-
W45, with an average concentration of potassium 3.39mg/L in the area. Water samples
collected from Hundrap region (Hundrap lake and respective stream), the concentration

81
of potassium were in the range of 0.86 mg/L to 4.3 mg/L in samples W24-W0, with an
average concentration of potassium 2.44 mg/L. The calculated concentration of
potassium in water samples collected from Khukosh region (Baha lake respective
stream), ranged from 0.92 mg/L to 4.72 mg/L in samples W26-W48, with an average
concentration of potassium 2.78 mg/L.
Calcium (Ca+2
)
Calcium is consider as a major component of mineralized tissues and is required
for normal growth and maintenance of bone. Generally it is agreed that an adequate
calcium intake is necessary for the maintenance of life. From most of the epidemiologic
studies, it clarified that most of the population fail to meet the recommended optimal
calcium intake (American Clinical Nutrition, 2000). Calcium is found in water as
carbonate or chloride which are due to limestone, gypsum, and gypsiferous. Calcium is
essential element for life. It helps to cellular permeability and the maintenance of the
intact cellular membranes in a body. When calcium level is low in water, and its use is
for long time, it will lead to cardiovascular disease; chronic renal failure and coronary
artery disease in body (Heaney and Dowell, 1994).
The concentrations calcium in the water of lakes and stream of the study area are
given in Table 5.3 and graphically presented in the Figures 5.14a, 5.14b, 5.14c, and
5.14d. The concentration of calcium in water samples collected from Naltar region
(Naltar wetland complex and their related stream) ranged from 16.36 mg/L to 57.1 mg/L
in samples W7-W31, with an average concentration of calcium 24.36 mg/L in the area.
Water samples collected from Iskoman area (Uttar Lake and respective stream), the
concentration of calcium were found between 19.35 mg/L to 74.29 mg/L in samples

82
W21-W43 with an average concentration of calcium 39.53mg/L. The measured
concentration of Calcium in water samples collected from Hundrap region (Hundrap
Lake and respective stream) were in the range of 11.83 mg/L to 62.9 mg/L in samples
W23-W36, with an average concentration of calcium 40.67 mg/L. The calculated
concentration of calcium in water samples collected from Khukosh area (Baha lake and
respective stream) were ranged from 15.88 mg/L to 50.85 mg/L in samples W49-W26.
The average concentration of calcium in Khukosh region was found 33.34 mg/L.
Magnesium (Mg+2
)
Magnesium is a second most abundant element after sodium found in water. A
large number of minerals contain magnesium, among these most common are dolomite
and magnetite. Magnesium also enters the water bodies in different ways, such as it can
be introduced by the weathering mafic and ultramafic rocks and also from the fertilizer
application and from cattle feed. Industrial sectors which are using the magnesium in
different proposes also act a magnesium sources for pollution. Presence of magnesium in
water is a dietary mineral for living organism such as insects. It is a central atom of the
chlorophyll molecule, and is, therefore, a requirement for plant photosynthesis, but
excessive amount of magnesium in water will lead to hardness to the water (Mordike and
Ebert, 2001).
Concentrations of magnesium in water of lakes and streams of the study area are
given in Table 5.3 and graphically presented in the Figures 5.15a, 5.15b, 5.15c, and
5.15d. The concentration of magnesium in water samples collected from Naltar (Naltar
wetland complex and their related stream) were found between 0.05 mg/L to 38.66 mg/L
in samples W12-W34. The average concentration of magnesium in Naltar was found 5.82
83
mg/L. The concentration of magnesium in water samples collected from Iskoman area
(Uttar lake and respective stream), were in the range of 2.16 mg/L to 29.68 mg/L in
samples W41-W46. The average concentration of magnesium in Iskoman was found 14
mg/L. Water samples collected from the Hundrap region (Hundrap lake and respective
stream), the concentration of magnesium ranged from 0.28 mg/L to 25.51 mg/L in
samples W22-W39 with an average concentration of magnesium 14.82 mg/L in the area.
The concentration of magnesium in water samples collected from the Khukosh area
(Baha lake and respective stream) were found in the range of 1.19 mg/L to 27.69 mg/L in
samples W47-W48, with an average concentration of magnesium 12.43 mg/L in the
region.
5.4.4. Classification of water
For identification and characterization of high altitude alpine lakes and their
respective streams in the study areas (Naltar wetland complex, Uttar, Hundrap and Baha
lakes with their respective streams), a typical method of classification was used on the
basis of anions and light elements data through piper diagrams (Fig Nos. 5.25, 5.26, 5.27
and 5.28). The Piper diagram (Fig.5.25), for Naltar wetland complex and their related
stream showed that, all the lakes and stream water samples fell toward the Ca+ and HCO3
-
, suggested that all the water samples had higher concentration of Ca+ as compare to
Na+, K
+ and Mg
+ and HCO3
- as compare to Cl
- SO4
2- and NO3
-. Therefore, water of the
Naltar wetland complex and their related stream were found as CaHCO3- type (Field.11)
in the piper diagram (Fig.5.25). In Iskoman (Uttar lake and respective stream), all the
lake’s water samples were having higher concentration of Ca+, while stream samples
were having higher concentration of Na+ (Fig.5.26). The concentrations of bicarbonates

84
were also found higher in all the water samples in this region as compared to Cl-, SO4
-
and NO3-. Therefore the water of Uttar lake and respective stream was classified as
bicarbonate type such as CaHCO3 (Field.11) and NaHCO3 (Field.1V) in the piper
diagram (Fig.5.26). In Hundrap (Hundrap lake and respective stream), all the water
samples have higher concentration of Ca+ and HCO3
-, therefore, water of the Hundrap
was found as CaHCO3 type (Field.11) in the piper diagram (Fig.5.27). In Khukosh (Baha
lake and respective stream), all the lake’s water were showing higher concentration of
Ca+ while the stream samples were showing higher concentration of Na
+ in the piper
diagram (Fig.5.28). These water samples also showed higher concentration of HCO3-.
Therefore the water of the Khukosh fell in the (field.11) and (field.111) and was
therefore, classified as CaHCO3 and NaCaHCO3 in the piper diagram scheme (Fig.5.28).
5.4.5. Heavy metals
Heavy metals selected for the present study, includes, manganese (Mn), iron (Fe),
copper (Cu), lead (Pb), zinc (Zn), nickel (Ni), chromium (Cr), cadmium (Cd), mercury
(Hg) and arsenic (As). Brief description, their possible concentrations and GIS based
maps showing the distribution pattern of these elements in the water of lakes and stream
of the study area are as given below.
Manganese (Mn+2
)
Manganese is present in ores and rocks in higher concentration. It is introduced in
the surface and groundwater due to reducing conditions in soil and rocks to bringing it in
soluble forms. In the presence of oxygen, manganese oxidized to form insoluble
component and precipitate in black color at the bottom of water storage tanks, and pipes,
while in the absence of oxygen it turns up to soluble indirect, therefore, most of the lakes

85
and underground water are mainly contaminated by manganese. The major sources which
bring the manganese into the human body are food, intake of water and tea. It is
estimated that on average a cup of tea is containing between 400-1300 μg/L of Mn. With
the toxic point of view manganese is considered as nontoxic within the permissible limit
but it is present in higher amount than the permissible limit, it induces taste problem in
the water and also health related problems such as physiological and particularly
neurological disorder (Criddle, 1992).
The concentrations of manganese in the water of lakes and streams of the study
areas are given in Table 5.4 and graphically presented in Figures, 5.16a, 5.16b, 5.16c and
5.16d. The GIS based maps showing the distribution of Mn in the study areas are shown
in Figures 5.29, 5.30 5.31 and 5.32. The concentration of manganese in Naltar (Nalatr
wetland complex and their related stream), was found below detection level (<0.5 μg/L)
in samples W11, W12, W13, W17, and W28, collected from the centre and outlet of
Chemo bari, Small bari inlet, Koto bari centre and Naltar stream at Bieshgeri
respectively. The calculated concentration of Mn in rest of the water samples in the
region ranged from 10 μg/L in samples W14, W15, W16, W18, W29, and W28, collected
from centre and outlet part of Naltar lake5 (Small bari), inlet and outlet part of Naltar
lake6 (Koto bari), Naltar 4view hotel and Naltar home at Daas mullah respectively to110
μg/L, in samples W9 and W10, taken from the Chakar bari out, and Chemo bari inlet.
The average concentration of Mn in Naltar was found 44 μg/L. In Iskoman (Uttar lake
and respective stream), the concentration of manganese was found below the detection
level (<0.5 μg/L) in three samples W42, W43 and W46, collected from the Iskoman
stream at Matintar, at Gotolti and at the end of Iskoman population respectively. The
86
measured concentration of manganese in rest of the water samples ranged from 10 μg/L
in samples W19, W21 and W44, collected from the inlet and outlet of Uttar lake and
Iskoman Jamatkhanah respectively, to 30 μg/L in sample W41, taken from Iskoman
stream near local huts. The average concentration of Mn in Iskoman was found 12 μg/L.
The concentration of Mn in Hundrap (Hundrap lake and respective stream), was found
below the detection level (<0.5 μg/L) in all lake’s water samples, while in stream
samples the concentration of Mn ranged from 10 μg/L in sample W39, collected from
home in Hundrap, to 40 μg/L in sample W35, taken from the Hundrap stream at
Chukarrari. The average concentration of Mn in Hundrap was found 16 μg/L. The
concentration of manganese in Khukosh (Baha lake and respective stream), was found
below the detection level (<0.5 μg/L) in two lake’s water samples W25 and W27, taken
from the inlet and outlet part of the Baha lake. The concentration of manganese in rest of
all the water samples were found 30 μg/L except sample W48, collected from Khukosh
stream at Longer valley showed the concentration of 10 μg/L. The average concentration
of Mn in Khukosh was found 19 μg/L.
Manganese distribution GIS based maps (Fig.5.29, 5.30, 5.31 and 5.32.) of the
study areas indicated that the Mn concentration was found in relative higher amount in
the upstream of Beishgri in the Naltar wetland complex and its related stream (Fig.5.29).
In the Uttar lake and related stream (Fig.5.30), the Mn concentration at the outlet of the
lake, at shepherd hut and stream at the end of Iskoman had high concentration of Mn.
The distribution of Mn in Hundrap lake and related stream (Fig.5.31) indicated
that Hundrap lake showed minimum concentration of Mn while the downstream the
Hundrap lake showed relatively high concentration. Mn distribution map of the Baha lake

87
and related stream (Fig.5.32) showed that the middle part of Baha lake and most of the
samples downstream were having relatively high concentration of Mn.
Iron (Fe+3
)
Iron an extremely common metal is found in insoluble form in large amount in
soil and rocks but in some cases due to the number of complex reactions it also form
soluble compounds (Gray, 2008). Therefore, excess amount of iron is a common
phenomenon on the ground. Iron generally occurring in ferrous state in soluble form
while it also occurs in ferric state as insoluble form during oxidizing state. During the
hydrological cycle, irons usually enter the water body from surrounding environment.
Iron is an essential element with the recommended minimum daily requirement but
unlikely cause threats to the health when its concentration occasionally found above the
permissible limit in water. Iron cause taste effect and coloration in water and vegetables,
especially tomatoes. In human body when the amount of iron is exceeding it will lead
genetic disorder (WHO, 2006).
The concentrations of iron in the water of lakes and streams of the study areas are
given in the Table 5.4, and graphically presented in Figures, 5.17a, 5.17b, 5.17c and
5.17d. The GIS based maps showing the distribution of iron are presented in
Figures.5.33, 5.34, 5.35 and 5.36. The concentration of iron in Naltar (Naltar wetland
complex and their related stream), was found below the detection level (<0.5μg/L) in
samples W32 and W34, collected from Naltar house at Galieng and Naltar stream at
Nomal respectively. The calculated concentration of iron in rest of the water samples in
the region ranged from 7 μg/L in sample W9, collected from Chakar bari outlet to 877
μg/L in sample W3, taken from the Bodorok bari outlet. The average concentration of

88
iron in Naltar was found 114 μg/L. In Iskoman (Uttar lake and respective stream), the
concentration of iron was found below the detection level (<0.5μg/L) in sample W44,
collected from the mosque in Iskoman, while in rest of the water samples the
concentration of iron were in the range of 5 μg/L in sample W44, collected from
Jamatkhana in Iskoman, to 783 μg/L in sample W21 collected from Uttar lake outlet. The
average concentration of iron in Iskoman was found 259 μg/L. The concentration of iron
in Hundrap (Hundrap lake and respective stream), ranged from 6 μg/L in sample W36,
collected from the Hundrap stream at Hirzdam, to 629 μg/L in sample W40, which was
taken from the Hundrap stream at the end of population. The average concentration of
iron in Hundrap was calculated 165 μg/L. In Khukosh (Baha lake and respective stream),
the concentration of Iron was found below the detection level in samples W49 and W50,
collected from the Khukosh stream just below the longer valley and at Barsat
respectively. While in rest of the water samples, the concentration of iron in the range of
5 μg/L in sample W48, collected from Khukosh stream at longer valley to 333 μg/L in
sample W50, collected from Baha lake inlet. The average concentration of iron in the
Khukosh region was found 84 μg/L.
Iron distribution GIS based maps (Fig.5.33, 5.34, 5.35 and 5.36.) of the study
areas indicated that the Fe concentration was found in higher amount at Naltar lake1
(Bodorok bari), in the upstream of Dalaan, and at Khayout in the Naltar wetland complex
and its related stream (Fig.5.33). In the Uttar lake and respective streams (Fig.5.34), the
distribution of Fe was found in relatively higher amount in the Uttar lake as compared to
downstream of the lake. The distribution of Fe in the Hundrap lake and related stream in
the map (5.35) indicated that the Hundrap lake showed minimum concentration of Fe

89
while the water samples of downstream of the lake at the end Hundrap population
showed relative high. Fe distribution map of Baha lake and respective streams at
Khukosh (Fig.5.36) indicated that Baha lake showed relatively higher amount of Fe while
the water samples of downstream the Baha lake showed relatively low concentration.
Copper (Cu+2
)
Copper is a heavy metal often used as anti-corrosion and decorative coatings on
metal alloys. In drinking water copper is present as, ionizable copper (mostly divalent)
and as copper complexes with organic and inorganic legends, some of these complexes
are insoluble and are, therefore, not likely to show be bioavailability. At high
concentration of copper in water is toxic to a variety of living organisms from humans to
bacteria, especially fish and also even in low exposures can have impact on respiration,
and also affect cell walls of microorganisms. Generally drinking water having high
concentration of copper will show the sign of nausea, vomiting, diarrhea and
gastrointestinal diseases ( Fitzgerald, 1998).
The concentrations of copper in the water of lakes and stream of the study areas
are given in the Table 5.4 and graphically presented in the Figures.5.18a, 5.18b 5.18c and
5.18d. The GIS based maps showing the distribution of copper concentration in the study
areas are given in Figures.5.37, 5.38, 5.39 and 5.40. The concentration of copper in
Naltar (Naltar wetland complex and their related stream), was found below the detection
level (<0.5 μg/L) in samples W15, W17 and W18, collected from the outlet of Naltar
lake5 (Small bari), centre and outlet parts of the Naltar lake6 (Koto bari) respectively. In
rest of the water samples the calculated concentration of copper ranged from 1 μg/L in
samples W10 and W14, collected from the Chemo bari inlet and Small bari centre to 84

90
μg/L in sample W1, collected from Bodorok bari inlet. The average concentration of
copper in Naltar was found 9 μg/L. The concentration of copper in Iskoman (Uttar lake
and respective stream) was found below the detection level (<0.5 μg/L) in samples W20
and W45, collected from the Uttar lake centre and mosque of Iskoman. The concentration
of copper in rest of the water sample ranged from 1 μg/L in sample W19, collected from
the Uttar lake inlet to 31 μg/L in sample W21, collected from Uttar lake outlet. The
average concentration of copper in Iskoman was found 8 μg/L. In Hundrap (Hundrap lake
and respective stream), the concentration of copper ranged from 2 μg/L in sample W38,
collected from the house in Hundrap to 8 μg/L in sample W35, collected from the
Hundrap stream at Chukarrari. The average concentration of copper in Hundrap was
measured 4 μg/L. The concentration of Copper in Khukosh region (Baha lake and
respective stream), was found below the detection level (<0.5 μg/L) in sample W50,
collected from the end of Khukosh stream at Barsad. In rest of the water samples the
concentrations of copper were found in the range of 1 μg/L in samples W25 and W49,
collected from Baha lake inlet and Khukosh stream just below the Longer to 4 μg/L in
samples W26 and W27, taken from the centre and outlet parts of the Baha lake. The
average concentration of copper in Khukosh was found 2 μg/L.
Copper distribution GIS based maps (Fig.5.37, 5.38, 5.39 and 5.40.) of the study
areas indicated that the Cu concentration was found in relative higher amount in Naltar
lakes, downstream the lakes at the Galieng, and at the end of stream at Nomal in the
Naltar wetland complex and it related streams (Fig.5.37). In Uttar lake and its related
streams (Fig.5.38) the Cu contents at the outlet of the lake, downstream the lake at
Shepherd huts, Marig musk and the stream at the end of Iskoman population had high

91
concentration of Cu. The distribution of Cu in the Hundrap lake and its related stream in
the map (5.39) indicated that, the inlet and middle parts of the Hundrap lake and
downstream the lake at Chukarrari showed relatively higher concentration of Cu as
compared to rest of the water samples at Hundrap. Cu distribution map of the Baha lake
and its related stream (Fig.5.40) showed that the middle and outlet parts of the Baha lake,
downstream just below the lake and at the Longer valley were having relatively high
concentration of Cu.
Lead (Pb+2
)
Lead is one of the most toxic elements because of its accumulative effect. Due to
their toxicity it is considering as environmental priority pollutants. In some areas natural
water is contaminated with lead from industrial activities and also from natural influx.
The main sources which are responsible for lead generates in water are, mining, refining
and smelting processes as well as the various lead-treatment industries. Beside these
burning of fossil fuels containing lead additives is another source for lead (Andrzej. et al.,
2004). Lead mostly causing biological effect that are nervous system disorder, kidney and
brain damage. Since lead has accumulative behavior, therefore, lead is accumulated in the
body tissue, especially fetus and growing children (Goyer, 1990).
The concentrations of lead in the water of lakes and stream of the areas selected
for study are given in the Table 5.4 and graphically shown in Figures.5.19a, 5.19b, 5.19c
and 5.19d. The GIS based maps showing the distribution of lead concentrations in the
study areas are presented in Figures.5.41, 5.42, 5.43 and 5.44. The concentration of lead
in Naltar wetland complex and their related stream was found below the detection level
(<0.5 μg/L) in nine water samples W3, W8, W9, W16, W17, W18 W28, W29 and W34,

92
collected from Bodorok bari outlet, centre and outlet parts of Chakar bari (Lake3), inlet,
centre and outlet parts of Koto bari (Lake6), Naltar stream at Beishgiri, Naltar 4view
hotel and at the end Naltar stream at Nomal respectively. In rest of the water samples the
concentration of lead ranged from 1 μg/L in samples W6, W7, W11 and W30, collected
from the Singo bari outlet, Chakar bari inlet, Chemo bari centre and Naltar stream at
Bangalah respectively to 10 μg/L in sample W13, taken from small bari inlet. The
average concentration of lead in Naltar region was found 3 μg/L. The concentration of
lead in Iskoman (Uttar lake and respective stream), was found below the diction level
(<0.5 μg/L) in samples W19, W20, W44 and W45, collected from the inlet, outlet of
Uttar lake, Iskoman mosque, and Iskoman Jamatkhana respectively. The concentration of
lead in rest of the water samples ranged from 1 μg/L in sample W41, collected from
Iskoman stream near local huts to 7 μg/L in sample W43, collected from the Iskoman
stream at Gotolti. The average concentration of lead in Iskoman was measured 2 μg/l. In
Hundrap (Hundrap lake and respective stream), the concentration of lead was found
below the detection level (<0.5 μg/L) in all the lake’s water samples along with sample
W38, collected from home in Hundrap. The concentration of lead in Hundrap stream
water samples ranged from 1 μg/L, in sample W37, collected from a house in Hundrap to
7μg/L in sample W40, taken from stream at the end of Hundrap population. The average
concentration of lead in the Hundrap was calculated 2 μg/L. In Khukosh (Baha lake and
respective stream), the concentration of lead was found below the detection level (<0.5
μg/L) in all the water samples, except samples W26 and W47, having the concentrations
of 7 μg/L and 3 μg/L respectively, collected from Baha lake centre, and Khukosh stream
just below the lake. The average concentration of lead in Khukosh was found 1 μg/L.

93
Lead distribution GIS based maps (Fig.5.41, 5.42, 5.43 and 5.44.) of the study
areas indicated that the Pb concentration was found in relative higher amount in Naltar
lakes, and downstream of the lakes at Galeing in the Naltar wetland complex and their
related streams (Fig.5.41). In Uttar lake and its related streams (Fig.5.42), the Pb contents
at the outlet of the lake, downstream the lake at Matintar, Marig mushk and at the end of
Iskoman stream had relatively higher concentration. The distribution of Pb in the
Hundrap lake and its related stream in the map (5.43) indicated that, Hundrap lake
showed minimum concentration of Pb while the stream water downstream the lake
showed relatively high. Pb distribution map of the Baha lake and related stream
(Fig.5.44) showed that the inlet and middle parts of Baha lake along with water sample
downstream just below the lake were having relatively high concentration of Pb.
Zinc (Zn+2
)
Zinc is a metal that is normally found in small amounts in nature. It is an essential
nutrient needed for body growth, metabolism, bones development, and wound-healing.
Although naturally zinc is occurring every where, in air in soil and in water but their rate
of concentration are enhanced by different human activities. Therefore, mining, smelting
metals (like zinc, lead and cadmium) and steel production, as well as burning coal and
certain wastes from the industries are the main sources of zinc to find it way to the
environment. Soil is contaminated with high level of zinc due to improper disposal of
zinc-containing wastes from metal manufacturing industries and electric utilities. Water
is contaminated with zinc when it flows through such region and water supply pipes
which are coated with zinc metals. Zinc can be entered in to the body through breathing,
food and intake of zinc contaminated water (Gabe et al., 2006). Ingestion of too much

94
zinc in short period of the time will effected the body by stomach cramps, nausea and
vomiting, whiles it long term use will cause, anemia, nervous system disorders, damage
to the pancreas (Elinder, 1986).
The concentrations of Zinc in the water of lakes and streams of the study areas are
given in the Table 5.4 and graphically presented in Figures.5.20a, 5.20b 5.20c and 5.20d.
The GIS based maps showing the distribution of zinc in the study areas are presented in
Figures.5.45, 5.46, 5.47 and 5.48. The concentration of Zinc in Naltar (Naltar wetland
complex and their related stream), was found below the detection level (<0.5 μg/L) in
samples W6, W8, W9 and W10, collected from the Singo bari outlet, centre and outlet of
Chakar bari and Chemo bari inlet respectively. In rest of the water samples in Naltar, the
calculated concentration of zinc ranged from 2 μg/L in samples W7 and W18, collected
from Chakar bari inlet and Koto bari outlet to 602 μg/L, taken from Naltar stream at the
end population at Nomal. The average concentration of Zinc in the Naltar was found 47
μg/L. The concentration of Zinc in Iskoman (Uttar lake and respective stream) are
ranging from 8 μg/L in sample W42, collected from Iskoman stream at Matintar to 1283
μg/L in sample W43, which is collected from the Iskoman stream at Gotolti. The average
concentration of Zinc Iskoman was found 257 μg/L. In Hundrap (Hundrap lake and
respective stream), the concentration of Zinc ranged from 17 μg/L in sample W24,
collected from the Hundrap lake outlet to 929 μg/L in sample W38, collected from the
House in Hundrap. The average concentration of Zinc in Hundrap areas was found 362
μg/L. The concentration of Zinc in Khukosh (Baha lake and respective stream), were in
the range of 20 μg/L, in sample W25, collected from Baha lake inlet to 623 μg/L, in

95
sample W49, taken from the Khukosh stream just below the Longer valley. The average
concentration of Zinc in Khukosh was found 171 μg/L.
Zinc distribution GIS based maps (Fig.5.45, 5.46, 5.47 and 5.48.) of the study
areas indicated that the concentration of Zn was found in relative higher amount in Naltar
lake1 (Bodorok bari), downstream the lakes at Galeing and at the end of stream at Nomal
in the Naltar wetland complex and its related streams (Fig.5.45). In Uttar lake and its
related stream (Fig.5.46), the Zn contents at the inlet and outlet of the lake, downstream
the lake at Marig mushk, main Iskoman population and the stream at the end of
catchments had high concentration of Zn. The distribution of Zn in the Hundrap and its
related streams in the maps (Fig.5.47) indicated that Hundrap lake showed minimum
concentration of Zn while the stream water downstream the Hundrap lake showed
relatively high. Zn distribution map of Baha lake and its related stream (Fig.5.48) showed
that the outlet part of the Baha lake and most of the water samples downstream the lake
were having relatively high concentration of Zn.
Nickel (Ni+2
)
Nickel is a nutritionally essential trace metal for several animal species, micro-
organisms and plants which has widespread distribution in the environment. Nickel is a
naturally occurring element that can exist in various mineral forms. It resists to corrosion
by air, water and alkali because it is a member of the transition metal series, readily
dissolves in dilute oxidizing acids. Although nickel is widely distributed element found in
all segment of environments (air, water and soil) but its concentration is enhance by both
natural (weathering of rock and soil, volcanoes emission wind blown dust and forest fire),
and anthropoginically (industrial sectors, automobiles and mining activities). Nickel is

96
generally considered as nutritionally essential element within the permissible limit but
when the body is exposed to excess of nickel it will cause nasal cavity, larynx and lungs
cancer and some of allergy problems (Cempel and Nikel, 2006).
The concentrations of nickel in the water of lakes and streams of the areas studied
are given in the Table 5.4 and graphically presented in Figures.5.21a, 5.21b 5.21c and
5.21d. The GIS based maps showing the distribution of nickel in the study areas are
presented in Figures.5.49, 5.50, 5.51 and 5.52. The concentration of nickel in Naltar
(Naltar wetland complex and its stream), was found below the detection level (<0.5 μg/L)
in most of the Naltar lakes water samples. In rest of the water samples, the concentration
of nickel ranged from 1 μg/L in samples W5, W7, W16 and W30, collected from Singo
bari centre, Chakar bari inlet, Koto bari inlet and Naltar stream at Bangalah respectively
to 29 μg/L in sample W1, collected from the Bodorok bari inlet. The average
concentration of nickel in Naltar was found 4 μg/L. In Iskoman (Uttar lake and respective
stream), the concentration of nickel was found below the diction level (<0.5 μg/L) in
samples W19, W20, W44 and W45, collected from the inlet and centre of Uttar lake,
Iskoman Jamatkhana and Iskoman mosque. While in rest of the water samples the
concentration of nickel was found within the value of 17 μg/L with an average
concentration of 4 μg/L in the region. In Hundrap (Hundrap lake and respective stream),
the concentration of nickel was found below the detection level (<0.5μg/L) in all the
water samples except W35, W36, W39 and W40, having the concentrations of 4 μg/L, 1
μg/L, 1 μg/L and 3 μg/L respectively, collected from the Hundrap stream at Chukarrari,
Hirzdam, Hundrap home and at the end of Hundrap population respectively. The average
concentration of nickel in Hundrap was found 1 μg/L. The concentration of nickel in

97
Khukosh (Baha lake and respective stream), was found below the detection level (<0.5
μg/L) in all the water samples except samples W27 and W47, collected from the Baha
lake outlet and Khukosh stream just below the lake having the concentration of 5 μg/L
and 2 μg/L respectively. The average concentration of nickel in Khukosh region was
found 1 μg/L.
Nickel distribution GIS based maps (Fig.5.49, 5.50, 5.51 and 5.52.) of the study
areas indicated that the Ni concentration was found in relative higher amount in the
Naltar lakes, downstream the lakes at Beishgiri, at Galeing and at the end of stream at
Nomal in Naltar wetland complex and it related stream (Fig.5.49). In the Uttar lake and
related stream (Fig.5.50), the Ni contents at the outlet of the lake, at local shepherd huts
and at Matintar had high concentration of Ni. The distribution of Ni in Hundrap lake and
related stream (Fig.5.51), indicated that Hundrap lake showed minimum concentration of
Ni while the stream water downstream the Hundrap lake showed relatively high
concentration. Ni distribution map of Baha lake and its related stream (Fig.5.52), showed
that the outlet part of the Baha lake and stream sample just below the lake were having
relatively high concentration of Ni.
Chromium (Cr+3
)
Chromium and its salts are used in the leather tanning industry, the manufacturing
of catalysts, paints, pigments, cosmetics, glass industry and in photography. Chromium
salts are also used in chrome plating and corrosion control (USEPA, 1984). The
distribution compound containing chromium-iii and chromium-vi are dependent upon
redox potential, the pH, the presence of oxidizing or reducing compound the kinetic of
the redox reactions, the formation of chromium (iii) complexes and total concentration of

98
total chromium. Because chromium is widely distributed element, therefore, it is present
in all segment of environment (air, soil, and in water). The concentration of chromium in
surface water is approximately 0.52μg/L (Shiller and Boyle, 1987). Although chromium
is an essential element in limited amount to body for normal glucose metabolism, but
when the concentration of chromium exceeded from the permissible limit it will causes a
nephritis and glycosuria disease. Chromatic dusts produce skin ulcer and nasal mucosum
(Javied et al., 2009)
The concentrations of Chromium in water of lakes and streams of the areas under
investigation are given in the Table 5.4 and graphically presented in Figures.5.22a, 5.22b
5.22c and 5.22d. The GIS based maps showing the distribution of chromium in the study
areas are shown in Figures.5.53, 5.54, 5.55 and 5.56. The concentration of chromium in
Naltar (Naltar wetland complex and their related stream), was found below the detection
level (<0.5 μg/L) in samples W9, W10, W14 and W15, collected the Chakar bari oulet,
Chemo bari inlet, centre and outlet of Small bari respectively. The measured
concentration of chromium in remaining water samples ranged from 0.52 μg/L in sample
W13, collected from the Small bari inlet to 8 μg/L in sample W1, collected from Bodorok
bari inlet (Naltar Lake1). The average concentration of chromium in Naltar was found 2
μg/L. The concentration of chromium in Iskoman (Uttar lake and respective stream), was
found between 0.6 μg/L, in sample W42, collected from Iskoman stream at Matintar to 3
μg/L, in sample W21, taken from Uttar lake outlet. The average concentration of
chromium in Iskoman was found 1 μg/L. In Hundrap (Hundrap lake and respective
stream), the concentration of chromium ranged from 0.6 μg/l, in sample W24, collected
from Hundrap lake outlet to 3 μg/L, in sample W23, which is taken from Hundrap lake

99
centre. The average concentration of chromium in Hundrap was calculated 2 μg/L. In
Khukosh (Baha lake and respective stream), the concentration of chromium was found
below the detection level (<0.5 μg/L) in samples W27 and W48, collected from Baha
lake outlet and Khukosh stream at Longer valley. The concentrations of chromium in rest
of the all water samples collected from Khukosh region were found less than 1.29 μg/L,
with an average value of 0.86μg/l in the area.
Chromium distribution GIS based maps (Fig.5.53, 5.54, 5.55 and 5.56) of the
study areas indicated that the Cr concentration was found in relative higher amount in the
Naltar lake1, downstream the lakes at Khayout, at Galeing and at the end of stream at
Nomal in the Naltar wetland complex and it related stream (Fig.5.53). In the Uttar lake
and related stream (Fig.5.54), the Cr contents at the outlet of the lake, water samples
downstream the lake at Marig musk and upper Iskoman had high concentration of Cr.
The distribution of Cr in Hundrap lake and related stream (Fig.5.55), indicated that the
middle part of the Hundrap lake, downstream the Hundrap lake at Hirzdam, and at the
end of Hundrap population were having relatively high concentration of Cr. The
chromium distribution map of the Baha lake and related stream (Fig.5.56), showed that
the inlet and middle parts of Baha lake and most of the downstream the lake except
Longer valley, were having relatively high chromium concentration.
Cadmium (Cd+2
)
Cadmium is a silver white metal occurring in the earth crust. It is not found as
pure cadmium but in an environment cadmium is always present in oxide, chloride and
sulfur. Cadmium in the form of chloride and sulfate can easily dissolved in water. It may
change forms by dissolution but cadmium metal itself not disappear from the

100
environment. Cadmium contamination may be caused by disposal of waste from
photographic, metal plating or pesticide manufacturing industries (Gunnar and Nordberg,
1974). Food and cigarette smoke are the biggest sources of cadmium exposure for people
in the general population. Besides that, inhalation of air, drinking water from the
contaminated sites are also sources of cadmium exposure. The potential harmful nature of
cadmium depends on the form and amount of cadmium present in body. Since cadmium
tends to accumulate in the body, therefore, long-term effects may occur which include
intestinal, lung and kidney damage (Barrento et al., 2009).
The concentrations of cadmium in the water of lakes and streams of the study
areas are given in the Table 5.4 and graphically presented in Figures.5.23a, 5.23b 5.23c
and 5.23d. The GIS based maps showing the distribution of cadmium in the study areas
are presented in Figures.5.57, 5.58, 5.59 and 5.60. The concentration of cadmium in
Naltar (Naltar wetland complex and their related stream), was found below the detection
level (<0.5 μg/L) in samples W15 and W33, collected from the Small bari outlet and
Naltar house at Daas. In rest of the water samples the concentration of cadmium ranged
from 0.5 μg/L in sample W13 collected from small bari inlet to 5 μg/L in sample W3,
taken from Bodrok bari outlet. The average concentration of cadmium in Naltar was
found 2 μg/L. The concentration of cadmium in Iskoman (Uttar lake and respective
stream), ranged from 0.5 μg/L in sample No.W45, collected from Iskoman mosque to 5
μg/L in sample No.W43, taken from Iskoman stream at Gotolti. The average
concentration of cadmium in Iskoman was found 2 μg/L. In Hundrap (Hundrap lake and
respective stream), the concentration of cadmium ranged from 1 μg/L in sample W35,
collected from Hundrap stream at Chukarrari to 4 μg/L, in sample W37, taken from the

101
house of Hundrap. The average concentration of cadmium in Hundrap was found 3 μg/L.
In Khukosh (Baha lake and respective stream), the concentration of cadmium was found
of below the detection level (<0.5 μg/L), in sample W49, collected from Khukosh stream
just below the Longer valley. The concentration of cadmium in rest of the water samples
ranged from 0.6 μg/L in sample W26 collected from the Baha lake centre to 3 μg/L, in
sample W50, taken from the end of Khukosh stream at Barsat. The average concentration
of cadmium in Khukosh was found 1 μg/L.
Cadmium distribution GIS based maps (Fig.5.57, 5.58, 5.59 and 5.60.) of the
study areas indicated that the Cd concentration was found in relative higher amount in the
Naltar lakes, downstream the lakes at Khayout and at Bangalah in the Naltar wetland
complex and it related stream (Fig.5.57). In the Uttar lake and related stream (Fig.5.58),
the Cd contents at the middle and outlet parts of the lake, water samples downstream the
lake at local huts, and Marig musk had high Cadmium concentration. The Cadmium
distribution in Hundrap lake and related stream (Fig.5.59), indicated that at the inlet of
the Hundrap lake, downstream the lake at main Hundrap population were having
relatively high Cd concentration. The distribution map of Cd of the Baha lake and related
stream (Fig.5.60), showed that the inlet and outlet parts of the Baha lake and most of the
samples downstream the lake were having relatively high Cd concentration.
Mercury (H+2
)
Mercury is a heavy, silvery-white metal found in various forms including
elemental mercury, inorganic mercury compounds, and organic mercury compounds such
as methyl mercury. Although mercury is present everywhere in primary nature minute
amount but their concentration will increase by natural processes including volcanoes,

102
forest fires, cinnabar (ore) and fossil fuels such as coal and petroleum, and
anthropogenically by, mining, pulp, hydroelectric, paper industries, and municipal and
medical wastes. Mercury concentrations in water resources are generally vary low,
between 0.005 and 0.1μg/L with an average concentration in drinking water of
0.025ug/L. Occasionally, concentration >2μg/L are repotted in shallow well (Gray,
2008). Mercury is highly toxic to humans, and exposure to even small amounts of
methylmercury can lead to irreversible neurological damage. Children and the developing
fetus are particularly sensitive to mercury. The Environmental Protection Agency (EPA)
estimates that there are 630,000 children born annually with unsafe blood mercury levels
based on the reference dose set by the agency (Catherine, 2004). In an excessive amount
of mercury in human body will lead to chronic effects to the nervous system, kidney or
intestines.
The concentration of the Mercury in all the representative water samples collected
from the lakes and streams of the study areas was found below the detection level (<0.05
ug/L), therefore not presented in graphs and GIS maps for the study area. (See table. 5.4).
Arsenic (As+2
)
Highly carcinogenic element arsenic is widely distributed and commonly found in
nature as arsenic sulfide and other arsenate metals. The major inorganic forms of arsenic
found in drinking water are trivalent (arsenic III) and pentavelent (arsenic V) compounds
which are most toxic in their nature and caused poisoning in million of people around the
world, while organically arsenic is formed as monomethylarsonic acid (MMA) which is
comparatively less toxic (Gray, 2008). Arsenic commercially has been used as a
rodenticide, insecticide, and weed killer, as well as a way of assassinating enemies.

103
Arsenic concentration in water caused naturally by weathering of rocks and ores and or
by different human activities. As arsenic can not be metabolized or excreted from the
body, therefore, it accumulates in hair and fingernail, where it can be detected long after
death (William, 2005).
The concentrations of arsenic in the water of lakes and stream of the study area
areas are given in the Table 5.4, and graphically presented in Figures.5.24a, 5.24b 5.24c
and 5.24d. The GIS based maps showing the distribution of arsenic in the study areas are
shown in Figures.5.61, 5.62, 5.63 and 5.64. The concentration of arsenic in Naltar (Naltar
wetland complex and their related stream), ranged from 0.76 μg/L, in sample W30,
collected from Nalatr stream at Bangalah to 4.13 μg/L, in sample W33, collected from the
house of Naltar at Daas. The average concentration of arsenic in Naltar was found 2.30
μg/L. In Iskoman (Uttar lake and respective stream), the concentration of arsenic varied
from a minimum of 0.32 μg/L, in sample W43, collected from Iskoman stream at Gotolti
to a maximum of 5.21 μg/L, in sample W21, taken from the Uttar lake outlet. The
average concentration of arsenic in Iskoman was found 1.95 μg/L. In Hundrap (Hundrap
lake and respective stream), the concentration of arsenic ranged from 0.78 μg/L, in
sample W35, collected from Hundrap stream at Chukarrari to 5.52 μg/L in sample W22,
taken from the Hundrap lake Inlet. The average concentration of arsenic in Hundrap
region was found 3.01 μg/L. In Khukosh (Baha lake and respective stream), the
concentration of arsenic ranged from 0.47 μg/L, in sample W27, collected from Baha
lake outlet, to 5.64 μg/L in sample W25, which is also Baha lake water sample taken
from the lake inlet part. The average concentration of arsenic in Khukosh was found 2.28
μg/L.
104
Arsenic distribution GIS based maps (Fig.5.61, 5.62, 5.63 and 5.64) of the study
areas indicated that the As concentration was found in relative higher amount in the
upstream of Beishgri in Naltar lakes and downstream the lakes at Galieng in the Naltar
wetland complex and it related stream (Fig.5.61). In the Uttar lake and respective stream
(Fig.5.62), the As concentration at Uttar lake, downstream the lake at shepherds huts and
at the end of Iskoman stream had high As concentration. The distribution of As in
Hundrap lake and related stream (Fig.5.63) indicated that Hundrap lake and downstream
the lake at main Hundrap population have relatively high As concentration. Arsenic
distribution map of the Baha lake and related stream (Fig.5.64) showed that the inlet and
middle parts of Baha lake, and most of downstream water samples except Longer valley
had relatively higher As concentration.

105
Table.5.1. The physical parameters in the water of study area (Naltar wetland complex, Uttar, Hundrap and Baha lake with
their respective streams)
Samples No. source
Temp- (oC) pH
Electric Conductivity
(μs/cm)
TDS
(mg/L) Turbidity (NTU) Salinity Resestivity (k/Ώ)
Site.1 Naltar (Naltar wetland
complex)
W1 Lake.1 (Bodorok bari) inlet 6 7.73 160 91 0.5 0.5 6
W2 centre 7 7.75 150 76 0.4 0.1 6.8
W3 outlet 7 7.7 152 77 0.6 3.8 6.7
W4 Lake 2 (Singo bari) inlet 6 7.63 106 82 0.1 0.1 10
W5 centre 6 7.8 108 79 0 0.1 8.4
W6 outlet 6 7.9 129 69 0.1 0.2 7.6
W7 Lake 3 (Chakar Bari) inlet 7 7.9 107 57 0.2 0.1 9.4
W8 centre 7 7.8 115 63 0.3 0.3 8.3
W9 outlet 6 7.7 115 60 0.6 1.1 10
W10 Lake 4 (Chemo bari) inlet 6 7.6 132 71 0.1 0.1 6.9
W11 centre 8 7.5 165 80 1.2 0.4 6.5
W12 outlet 7 7.8 130 80 1.5 0.3 7.6
W13 Lake 5 (Small bari) inlet 6 7.7 119 62 0.9 0.1 8.4
W14 centre 6 7.8 110 77 0 0.2 8.6
W15 outlet 6 7.7 110 57 0.3 0.2 9
W16 Lake 6 (Koto Bari) inlet 7 7.5 170 90 0.2 0.4 6
W17 centre 8 7.6 165 87 0.1 0.2 6
W18 outlet 7 7.7 184 99 0 0.2 5
Naltar Streams
W28 Nalatar stream at Beshgiri. 7 7.8 178 89 1.5 0.3 8
W29 Naltar 4 View Hotel 9 7.7 165 181 0.9 0.2 10
W30 Nalatar stream at Beshgiri. 7 7.4 281 92 2.8 0.1 7
W31 Naltar home 1 at Cote muhallah. 8 7.5 170 95 1.7 0.9 6
W32 Naltar home 2 at Galieng. 8 7.9 122 72 0.8 0.8 7
W33 Naltar home 3 at Daas muhallah. 8 7.8 119 95 2.8 1 8
W34 Nomal 7 7.9 182 102 1.1 1.1 10
Minimum 6 7.4 106 57 0 0.1 5
Maximum 8 7.9 281 181 2.8 3.8 10
Average 6.92 7.71 146 83 0.75 0.51 7.73
WHO, permissible values No limit listed 6.5-8.5 1400 1200 5 No limit listed No limit listed
USEPA, permissible values No limit listed 6.5-8.5 No limit listed 500 0.5- 5 No limit listed No limit listed

106
Site.2 Iskoman (Utter lake)
Temp- (oC) pH
Electric Conductivity
(μs/cm)
TDS
(mg/L) Turbidity (NTU) Salinity Resestivity (k/Ώ)
W19 Utter lake inlet 7 7.7 166 87 3.9 0.1 6
W20 centre 8 7.6 153 87 5 0.1 6.5
W21 outlet 7 7.7 156 83 4.9 0.2 6.1
Iskoman Stream
W41 Iskoman stream at local huts. 7 7.8 158 90 4.8 0.1 5
W42 Iskoman stream at Matintar. 7 7.6 142 97 3.2 0.8 9
W43 Iskoman stream at Gotolti. 7 7.2 128 65 1.7 0.1 8
W44 Iskoman Jamatkhana 7 7.5 197 122 0.3 0.1 6
W45 Iskoman Masjid 7 7.6 217 114 1.1 0.7 6.4
W46 At the end of Iskoman stream. 7 7.9 158 103 2.8 0.1 9
Minimum 7 7.2 128 65 0.3 0.1 5
Maximum 8 7.9 217 122 4.9 0.8 8
Average 7.11 7.62 164 94 3.08 0.26 6.89
WHO, permissible values No limit listed 6.5-8.5 1400 1200 5 No limit listed No limit listed
USEPA, permissible values No limit listed 6.5-8.5 No limit listed 500 0.5-5 No limit listed No limit listed
Site.3 Hundrap (Hundrap lake)
Temp- (oC) pH
Electric Conductivity
(μs/cm)
TDS
(mg/L) Turbidity (NTU) Salinity
Resestivity
(k/Ώ)
W22 Hundrap lake inlet 6 7.6 110 54 0.3 0.1 10
W23 centre 6 7.8 90 50 0.2 0.2 10.9
W24 outlet 6 7.5 104 51 0.2 0.2 10
Hundrap Stream
35 Hundrap stream at Chukarrari. 6 7.7 125 61 7 0.1 10
36 Hundrap stream at Hirzdam. 6 7.9 102 98 0.4 0.1 8
37 Hundrap home 1 7 7.2 68 0.6 0.2 6
38 Hundrap home 2 8 7.9 92 79 0.6 0.1 5
39 Hundrap home 3 8 7.8 117 90 0.8 0.1 8
40 At the end of Hundrap stream. 7 7.4 181 125 0.2 0.4 8
Minimum 6 7.2 90 50 1 0.1 5
Maximum 8 7.9 181 125 0.59 0.4 10.9
Average 6.67 7.64 124 75 5 0.17 8.43
WHO, permissible values No limit listed 6.5-8.5 1400 1200 0.5-5 No limit listed No limit listed
USEPA, permissible values No limit listed 6.5-8.5 No limit listed 500 No limit listed No limit listed

107
Site.4 Khokus (Baha lake) Temp- (oC) pH
Electric Conductivity (μs/cm)
TDS (mg/L) Turbidity (NTU) Salinity Resestivity (k/Ώ)
W25 Baha lake inlet 6 7.5 125 69 1.4 0.1 7.8
W26 centre 7 7.7 131 75 1.3 0.1 8
W27 outlet 6 7.8 241 129 2.5 0.2 4
Khukosh Stream
W47 Khokus stream just below the
lake 6 7.7 103 51 0.7 0.2 7
W48 Khokus stream at longer valley. 6 7.5 130 77 1.7 0.2 6
W49 Khokus stream below the longer. 7 7.7 187 149 3.9 0.1 7
W50 Barsad 7 7.9 138 65 2.8 0.2 6
Minimum 6 7.5 103 51 0.7 0.1 4
Maximum 7 7.9 241 149 3.9 0.2 8
Average 6.43 7.69 151 88 2.04 0.16 6.54
WHO, permissible values No limit listed 6.5- 8.5 1400 1200 5 No limit listed No limit listed
USEPA, permissible values No limit listed 6.5- 8.5 No limit listed 500 0.5- 5 No limit listed No limit listed

108
Table.5.2. The concentration of anions in the water of the study area (Naltar wetland complex, Uttar, Hundrap and Baha lakes with
their respective streams)
Samples
No.
source Chloride (Cl) mg/L Sulfate (SO4) mg/L Nitrate (NO3) mg/L Bicarbonate (HCO3) mg/L
Site.1 Naltar (Naltar wetland
complex).
W1 Lake.1 (Bodorok bari) inlet 0.2 18 0.5 130
W2 centre 0.5 12 1.1 100
W3 outlet 6 15 1.2 220
W4 Lake 2 (Singo bari) inlet 0.4 7 1.1 90
W5 centre 0.2 9 0.8 60
W6 outlet <0.1 10 1 160
W7 Lake 3 (Chakar Bari) inlet <0.1 9 0.4 90
W8 centre 0.1 7 2 120
W9 outlet 0.3 6 1.4 70
W10 Lake 4 (Chemo bari) inlet <0.1 12 1 140
W11 centre 0.6 10 0.9 110
W12 outlet 0.8 17 1.5 130
W13 Lake 5 (Small bari) inlet <0.1 10 0.8 140
W14 centre 0.2 11 2 200
W15 outlet 0.5 10 0.9 190
W16 Lake 6 (Koto Bari) inlet 1.3 16 1.2 130
W17 centre 0.8 24 3 110
W18 outlet 1.4 22 0.9 170
Naltar Streams
W28 Nalatar stream at Beshgiri. 3.5 19 2 220
W29 Naltar 4 View Hotel 15.3 22 0.7 240
W30 Nalatar stream at Beshgiri. 10.7 15 3.2 190
W31 Naltar home 1 at Cote muhallah. 42.2 28 2.7 320
W32 Naltar home 2 at Galieng. 16.6 11 1.9 300
W33 Naltar home 3 at Daas muhallah. 24.2 18 3 200
W34 Nomal 15.4 26 5 150
Minimum 0.1 6 0.4 60
Maximum 42.2 28 5 320
Average 6.72 14.56 1.61 163.2

109
WHO, permissible values 250 500 50 250
USEPA, permissible values 250 250 10 250
Below diction level (BDL) <0.1 <2 <0.3 No level listed
Site. 2 Iskoman (Utter lake) Chloride (Cl) mg/L Sulfate (SO4) mg/L Nitrate (NO3) mg/L Bicarbonate (HCO3) mg/L
W19 Utter lake inlet 0.9 17 1 90
W20 centre 0.4 15 <0.3 110
W21 outlet 0.2 19 0.4 80
Iskoman Stream
W41 Iskoman stream at local huts. 0.8 19 1 130
W42 Iskoman stream at Matintar. 17.7 18 2.5 180
W43 Iskoman stream at Gotolti. 29.2 27 0.7 360
W44 Iskoman Jamatkhana 18.3 17 1.9 190
W45 Iskoman Masjid 9.9 27 2.9 140
W46 At the end of Iskoman stream. 5.4 23 1.5 250
Minimum 0.2 15 0.4 80
Maximum 29.2 23 2.9 360
Average 9.2 20.22 1.49 170
WHO, permissible values 250 500 50 250
USEPA, permissible values 250 250 10 250
Below diction level (BDL) <0.1 2 0.3 No level listed
Site.3 Hundrap (Hundrap lake) Chloride (Cl) mg/L Sulfate (SO4) mg/L Nitrate (NO3) mg/L Bicarbonate (HCO3) mg/L
W22 Hundrap lake inlet 0.6 11 0.6 150
W23 centre 0.5 6 0.7 130
W24 outlet 0.9 10 0.1 190
Hundrap Stream
35 Hundrap stream at Chukarrari. 21.8 20 0.5 110
36 Hundrap stream at Hirzdam. 23.4 15 2 150
37 Hundrap home 1 15.4 17 0.9 23
38 Hundrap home 2 13.9 25 0.3 210
39 Hundrap home 3 17.9 27 0.8 360
40 At the end of Hundrap stream. 12.4 15 2.1 190
Minimum 0.5 6 0.1 23
Maximum 23.4 27 2.1 360

110
Average 11.87 16.22 0.89 168.11
WHO, permissible values 250 250 10 250
USEPA, permissible values <0.1 2 <0.3 No level listed
Below diction level (BDL) Chloride (Cl) mg/L Sulfate (SO4) mg/L Nitrate (NO3) mg/L Bicarbonate (HCO3) mg/L
Site.4 Khokus (Baha lake)
W25 Baha lake inlet 1.8 5 <0.3 160
W26 centre 1.4 7 0.9 170
W27 outlet 0.7 50 3 190
Khukosh Stream
W47 Khokus stream just below the lake 2.5 47 2 140
W48 Khokus stream at longer valley. 23.2 13 0.9 170
W49 Khokus stream below the longer. 17.2 16 0.9 210
W50 Barsad 19.8 16 0.5 210
Minimum 0.7 5 0.5 140
Maximum 23.2 50 3 210
Average 9.51 22 1.19 178.57
WHO, permissible values 250 500 50 250
USEPA, permissible values 250 250 10 250
Below diction level (BDL) <0.1 2 <0.3 No level listed
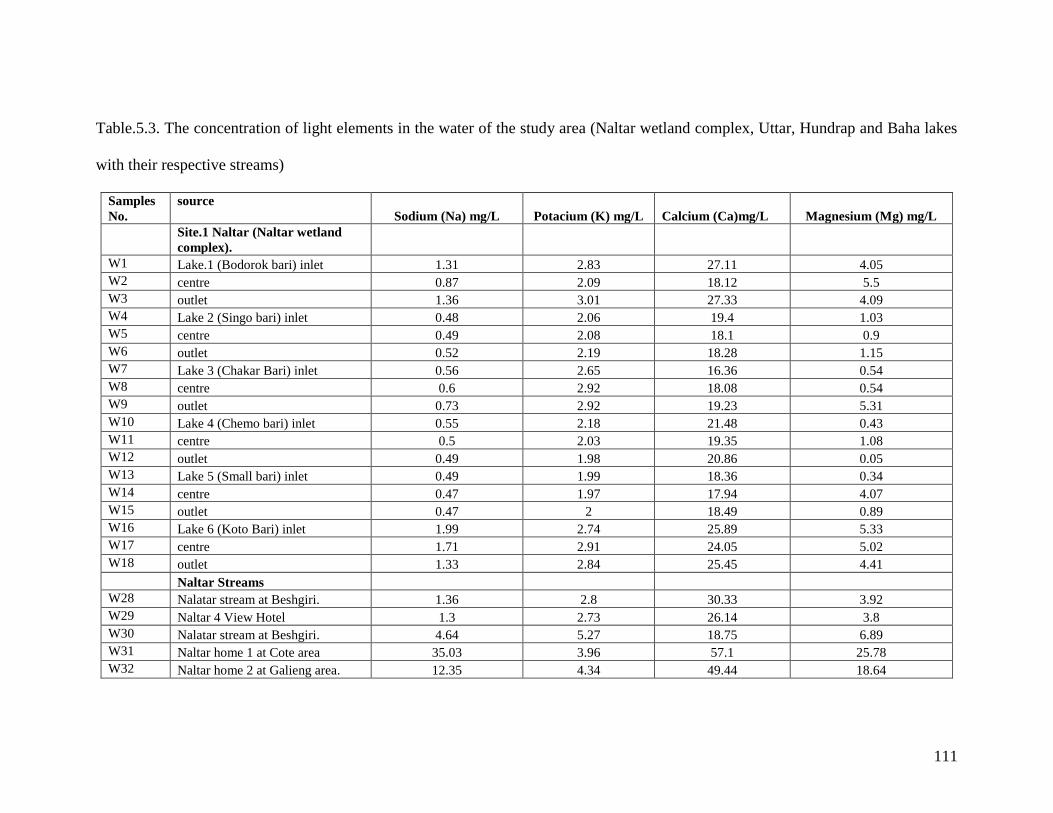
111
Table.5.3. The concentration of light elements in the water of the study area (Naltar wetland complex, Uttar, Hundrap and Baha lakes
with their respective streams)
Samples
No.
source
Sodium (Na) mg/L Potacium (K) mg/L Calcium (Ca)mg/L Magnesium (Mg) mg/L
Site.1 Naltar (Naltar wetland
complex).
W1 Lake.1 (Bodorok bari) inlet 1.31 2.83 27.11 4.05
W2 centre 0.87 2.09 18.12 5.5
W3 outlet 1.36 3.01 27.33 4.09
W4 Lake 2 (Singo bari) inlet 0.48 2.06 19.4 1.03
W5 centre 0.49 2.08 18.1 0.9
W6 outlet 0.52 2.19 18.28 1.15
W7 Lake 3 (Chakar Bari) inlet 0.56 2.65 16.36 0.54
W8 centre 0.6 2.92 18.08 0.54
W9 outlet 0.73 2.92 19.23 5.31
W10 Lake 4 (Chemo bari) inlet 0.55 2.18 21.48 0.43
W11 centre 0.5 2.03 19.35 1.08
W12 outlet 0.49 1.98 20.86 0.05
W13 Lake 5 (Small bari) inlet 0.49 1.99 18.36 0.34
W14 centre 0.47 1.97 17.94 4.07
W15 outlet 0.47 2 18.49 0.89
W16 Lake 6 (Koto Bari) inlet 1.99 2.74 25.89 5.33
W17 centre 1.71 2.91 24.05 5.02
W18 outlet 1.33 2.84 25.45 4.41
Naltar Streams
W28 Nalatar stream at Beshgiri. 1.36 2.8 30.33 3.92
W29 Naltar 4 View Hotel 1.3 2.73 26.14 3.8
W30 Nalatar stream at Beshgiri. 4.64 5.27 18.75 6.89
W31 Naltar home 1 at Cote area 35.03 3.96 57.1 25.78
W32 Naltar home 2 at Galieng area. 12.35 4.34 49.44 18.64

112
W33 Naltar home 3 at Daas area 1.05 2.29 18.77 3.11
W34 Nomal 3.73 4.75 34.66 38.66
Minimum 0.5 1.97 16.36 0.05
Maximum 35.03 5.27 57.1 38.66
Average 2.98 2.78 24.36 5.82
WHO, permissible values 200 15 75 50
USEPA, permissible values No limit listed No limit listed No limit listed No limit listed
Site. 2 Iskoman (Utter lake) Sodium (Na) mg/L Potacium (K) mg/L Calcium (Ca) mg/L Magnesium (Mg) mg/L
W19 Utter lake inlet 1.31 2.44 19.78 7.95
W20 centre 1.29 2.41 21.26 8.04
W21 outlet 1.3 2.54 19.35 8.07
Iskoman Stream
W41 Iskoman stream at local huts. 3.06 3.93 46.93 2.16
W42 Iskoman stream at Matintar. 1.27 2.49 30.42 12.71
W43 Iskoman stream at Gotolti. 11.46 4.56 74.29 25.67
W44 Iskoman Jamatkhana 48.35 2.48 45.26 26.13
W45 Iskoman Masjid 2.14 5.4 42.77 5.62
W46 At the end of Iskoman stream. 123.88 4.23 55.7 29.68
Minimum 1.27 2.41 19.35 2.16
Maximum 123.88 5.4 74.29 29.68
Average 21.56 3.39 39.53 14.00
WHO, permissible values 200 15 75 50
USEPA, permissible values No limit listed No limit listed No limit listed No limit listed
Site.3 Hundrap (Hundrap lake) Sodium (Na) mg/L Potacium (K) mg/L Calcium (Ca) mg/L Magnesium (Mg) mg/L
W22 Hundrap lake inlet 1.76 0.92 12.23 0.28
W23 centre 1.65 0.88 11.83 1.17
W24 outlet 1.78 0.86 12.15 0.31
Hundrap Stream
35 Hundrap stream at Chukarrari. 8.01 2.14 59.9 15.88
36 Hundrap stream at Hirzdam. 10.9 2.88 62.9 24.96
37 Hundrap home 1 33.66 3.08 53.05 22.28
38 Hundrap home 2 26.15 2.95 45.04 21.13

113
39 Hundrap home 3 30.95 3.93 51.35 25.51
40 At the end of Hundrap stream. 24.78 4.3 57.6 21.9
Minimum 1.65 0.86 11.83 0.28
Maximum 33.66 4.3 62.9 25.51
Average 15.52 2.44 40.67 14.82
WHO, permissible values 200 15 75 50
USEPA, permissible values No limit listed No limit listed No limit listed No limit listed
Site.4 Khokus (Baha lake) Sodium (Na) mg/L Potacium (K) mg/L Calcium (Ca) mg/L Magnesium (Mg) mg/L
W25 Baha lake inlet 2.19 1.22 16.48 4.55
W26 centre 2.05 0.92 15.88 4.48
W27 outlet 2.95 3.94 46.63 2.29
Khukosh Stream
W47 Khokus stream just below the lake 1.31 1.68 29.7 1.19
W48 Khokus stream at longer valley. 124.24 4.72 44.9 27.69
W49 Khokus stream below the longer. 127.25 4.6 50.85 24.43
W50 Barsad 140.75 2.4 28.95 22.35
Minimum 1.31 0.92 15.88 1.19
Maximum 140.75 4.72 50.85 27.69
Average 57.25 2.78 33.34 12.43
WHO, permissible values 200 15 75 50
USEPA, permissible values No limit listed No limit listed No limit listed No limit listed

114
Table.5.4. The concentrations heavy metals in the water of the study area (Naltar wetland complex, Uttar, Hundrap and Baha lakes
with their respective streams)
Samples
No.
source Magnese
(Mn)
μg/L
Iron
(Fe)
μg/L
Copper
(Cu)
μg/L
Lead
(Pb)
μg/L
Zinc
(Zn)
μg/L
Nickle
(Ni)
μg/L
Chromium
(Cr) μg/L
Cadmium
(Cd) μg/L
Mercury
(Hg)
μg/L
Arsanic
(As)
μg/L
Site.1 Naltar (Naltar wetland
complex).
W1 Lake.1 (Bodorok bari) inlet 100 105 84 6 22 29 8.4 3.37 <0.05 1.56
W2 centre 80 479 11 2 54 11 5.39 4.2 <0.05 2.27
W3 outlet 100 877 10 <0.5 32 9 6.13 4.78 <0.05 1.93
W4 Lake 2 (Singo bari) inlet 90 14 7 5 11 4 2.25 2.28 <0.05 3.46
W5 centre 100 52 3 4 3 1 1.64 2.89 <0.05 3.61
W6 outlet 80 20 2 1 <0.5 <0.5 1.06 2.31 <0.05 3.55
W7 Lake 3 (Chakar Bari) inlet 90 18 3 1 2 1 0.56 4.07 <0.05 3.83
W8 centre 90 150 2 <0.5 <0.5 <0.5 0.54 2.33 <0.05 1.69
W9 outlet 110 7 2 <0.5 <0.5 <0.5 <0.5 2.59 <0.05 1.66
W10 Lake 4 (Chemo bari) inlet 110 98 1 7 <0.5 <0.5 <0.5 2.24 <0.05 2.53
W11 centre <0.5 54 28 1 16 10 1.17 1.41 <0.05 2.82
W12 outlet <0.5 25 5 6 12 <0.5 0.69 2.45 <0.05 2.46
W13 Lake 5 (Small bari) inlet <0.5 30 3 10 14 <0.5 0.52 0.53 <0.05 2.91
W14 centre 10 27 1 6 16 <0.5 <0.5 0.76 <0.05 2.53
W15 outlet 10 43 <0.5 2 19 <0.5 <0.5 <0.5 <0.05 2.76
W16 Lake 6 (Koto Bari) inlet 10 29 2 <0.5 43 1 1.45 2.57 <0.05 1.34
W17 centre <0.5 16 <0.5 <0.5 12 <0.5 0.91 4.41 <0.05 2.41
W18 outlet 10 33 <0.5 <0.5 2 <0.5 0.72 0.86 <0.05 2.25
Naltar Streams
W28 Nalatar stream at Beshgiri. <0.5 298 5 <0.5 25 5 1.17 1.4 <0.05 1.77
W29 Naltar 4 View Hotel 10 301 3 <0.5 16 2 1.93 3.29 <0.05 1.66
W30 Nalatar stream at Beshgiri. 10 78 2 1 16 1 0.94 2.71 <0.05 0.76
W31 Naltar home 1 at Cote area 30 69 32 5 222 19 2.71 1.3 <0.05 2.12
W32 Naltar home 2 at Galieng area. 20 <0.5 4 3 17 6 1.89 1.62 <0.05 0.77
W33 Naltar home 3 at Daas area 10 24 3 4 20 3 2.57 <0.5 <0.05 4.13

115
W34 Nomal 20 <0.5 8 <0.5 602 3 2.48 1.24 <0.05 0.79
Minimum 10 7 1 1 2 1 0.52 0.53 <0.05 0.76
Maximum 110 877 84 11 602 29 8.4 4.78 <0.05 4.13
Average 44 114 9 3 47 4 2 2.32 <0.05 2.30
WHO, permissible values 500 300 2000 10 3000 20 50 3 1 10
USEPA, permissible values 50 300 1300 5 5000 100 100 5 2 5
Below diction level <0.5 <0.5 <0.5 <0.5 <0.5 <0.5 <0.5 <0.5 <0.05 <0.05
Site. 2 Iskoman (Utter lake) Magnese
(Mn)
μg/L
Iron
(Fe)
μg/L
Copper
(Cu)
μg/L
Lead
(Pb)
μg/L
Zinc
(Zn)
μg/L
Nickle
(Ni)
μg/L
Chromium
(Cr) μg/L
Cadmium
(Cd) μg/L
Mercury
(Hg)μg/L
Arsanic
(As)
μg/L
W19 Utter lake inlet 10 595 1 <0.5 93 <0.5 0.62 0.55 <0.05 2.92
W20 centre 20 753 <0.5 <0.5 25 <0.5 0.94 3.77 <0.05 4
W21 outlet 10 783 31 4 109 13 3.04 2.72 <0.05 5.21
Iskoman Stream
W41 Iskoman stream at local huts. 30 100 28 1 39 17 1.31 2.21 <0.05 0.67
W42 Iskoman stream at Matintar. 0 45 2 5 8 3 0.54 1.63 <0.05 2.39
W43 Iskoman stream at Gotolti. 0 29 3 7 1283 2 2.07 4.96 <0.05 0.32
W44 Iskoman Jamatkhana 10 5 3 <0.5 362 <0.5 1.98 1.14 <0.05 0.53
W45 Iskoman Masjid 20 0 <0.5 <0.5 12 <0.5 0.84 0.48 <0.05 0.43
W46 At the end of Iskoman stream. 0 21 6 3 381 2 1.43 1.72 <0.05 1.04
Minimum 10 5 1 1 8 2 0.54 0.5 <0.05 0.32
Maximum 30 783 31 7 1283 17 3.04 4.96 <0.05 5.21
Average 12 259 8 2 257 4 1.41 2.12 <0.05 1.95
WHO, permissible values 500 300 2000 10 3000 20 50 3 1 10
USEPA, permissible values 50 300 1300 5 5000 100 100 5 2 5
Below diction level <0.5 <0.5 <0.5 <0.5 <0.5 <0.5 <0.5 <0.5 <0.05 <0.05
Site.3 Hundrap (Hundrap lake)
Magnese
(Mn)
μg/L
Iron
(Fe)
μg/L
Copper
(Cu)
μg/L
Lead
(Pb)
μg/L
Zinc
(Zn)
μg/L
Nickle
(Ni)
μg/L
Chromium
(Cr) μg/L
Cadmium
(Cd) μg/L
Mercury
(Hg)μg/L
Arsanic
(As)
μg/L
W22 Hundrap lake inlet <0.5 163 8 <0.5 53 <0.5 0.83 4.06 <0.05 5.52
W23 centre <0.5 156 4 <0.5 31 <0.5 2.55 1.54 <0.05 5.7
W24 outlet <0.5 103 2 <0.5 17 <0.5 0.6 2.73 <0.05 2.95

116
Hundrap Stream
35 Hundrap stream at Chukarrari. 40 82 8 3 401 4 1.79 1.37 <0.05 0.78
36 Hundrap stream at Hirzdam. 20 6 2 3 425 1 2.12 2.19 <0.05 1.88
37 Hundrap home 1 20 24 3 1 859 <0.5 1.73 4.23 <0.05 3.28
38 Hundrap home 2 20 22 2 <0.5 930 <0.5 1.58 3.64 <0.05 2.24
39 Hundrap home 3 10 298 2 5 490 1 2.44 1.67 <0.05 2.22
40 At the end of Hundrap stream. 30 629 3 6 49 3 2.5 3.12 <0.05 2.25
Minimum 10 6 2 1 17 1 0.6 1.37 <0.05 0.78
Maximum 40 629 8 5 929 4 3 4.23 <0.05 5.52
Average 16 165 4 2 362 2 2 2.74 <0.05 3.01
WHO, permissible values 500 300 2000 10 3000 20 50 3 1 10
USEPA, permissible values 50 300 1300 5 5000 100 100 5 2 5
Below detection level <0.5 <0.5 <0.5 <0.5 <0.5 <0.5 <0.5 <0.5 <0.05 <0.05
Site.4 Khokus (Baha lake)
Magnese
(Mn)
μg/L
Iron
(Fe)
μg/L
Copper
(Cu)
μg/L
Lead
(Pb)
μg/L
Zinc
(Zn)
μg/L
Nickle
(Ni)
μg/L
Chromium
(Cr) μg/L
Cadmium
(Cd) μg/L
Mercury
(Hg)μg/L
Arsanic
(As)
μg/L
W25 Baha lake inlet <0.5 333 1 <0.5 20 <0.5 1.01 2.05 <0.05 5.64
W26 centre 30 149 4 7 31 <0.5 0.84 0.63 <0.05 3.13
W27 outlet <0.5 93 4 <0.5 42 5 0 1.31 <0.05 0.47
Khukosh Stream
W47 Khokus stream just below the lake 30 9 3 3 241 2 0.46 1.39 <0.05 4.02
W48 Khokus stream at longer valley. 10 5 3 <0.5 204 <0.5 0.26 1.29 <0.05 0.88
W49 Khokus stream below the longer. 30 0 1 <0.5 623 <0.5 1.3 <0.5 <0.05 0.52
W50 Barsad 30 0 <0.5 <0.5 33 <0.5 1.29 2.73 <0.05 1.31
Minimum 10 5 1 3 20 2 0.26 0.6 <0.05 0.47
Maximum 30 333 4 7 623 5 1.29 2.73 <0.05 5.64
Average 26.00 84 2 3 171 1 0.86 1.16 <0.05 2.28
WHO, permissible values 500 300 2000 10 3000 20 50 3 1 10
USEPA, permissible values 50 300 1300 5 5000 100 100 5 2 5
Below Detection level <0.5 <0.5 <0.5 <0.5 <0.5 <0.5 <0.5 <0.5 <0.05 <0.05

117
Fig.5.1. Variations in temperature in the water of study area. a= Nalatr wetland
complex, b= Iskoman lake, c= Hundrap lake, d= Baha lake.
b
0
2
4
6
8
10
W19
W20
W21
W41
W42
W43
W44
W45
W46
Water samples
Tem
p-
(oC
)
c
0
2
4
6
8
10
W22
W23
W24
W35
W36
W37
W38
W39
W40
Water samples
Tem
p-
(oC
)
a
0
2
4
6
8
10
W1
W2
W3
W4
W5
W6
W7
W8
W9
W10
W11
W12
W13
W14
W15
W16
W17
W18
W28
W29
W30
W31
W32
W33
W34
Water samples
Tem
p-
(oC
)
d
0
2
4
6
8
10
W25
W26
W27
W47
W48
W49
W50
Water samples
Tem
p-
(oC
)
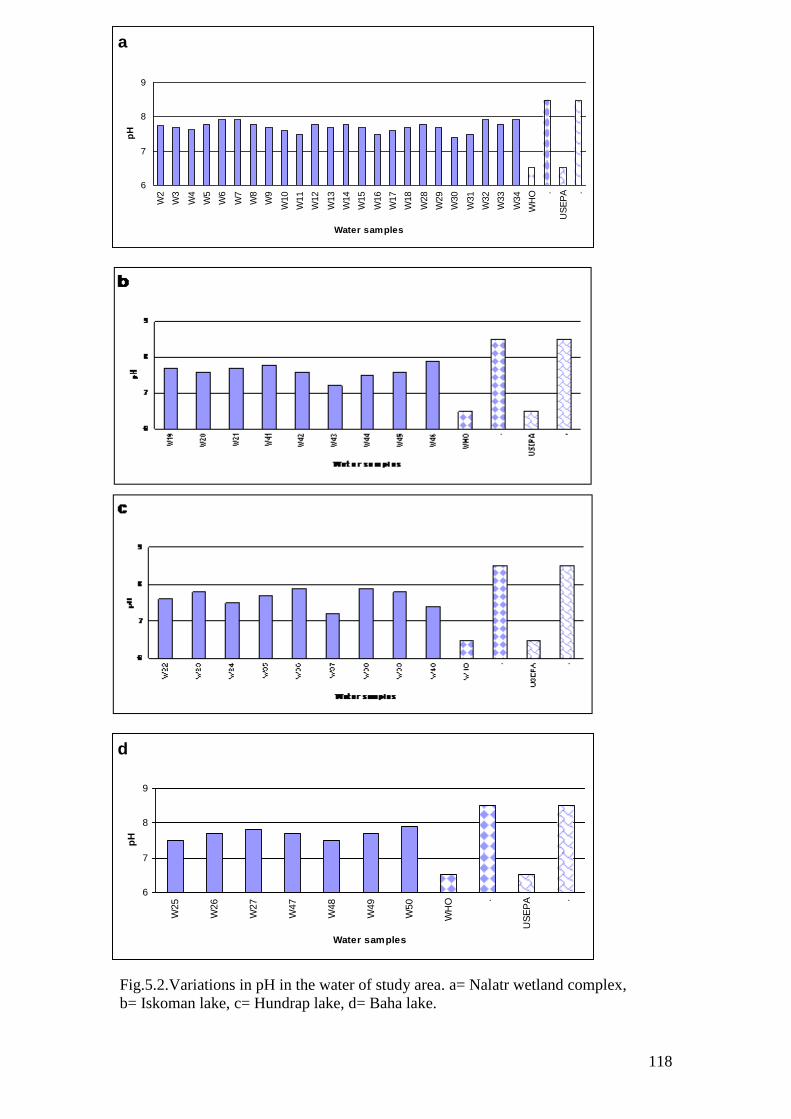
118
Fig.5.2.Variations in pH in the water of study area. a= Nalatr wetland complex,
b= Iskoman lake, c= Hundrap lake, d= Baha lake.
d
6
7
8
9
W25
W26
W27
W47
W48
W49
W50
WH
O .
US
EP
A .
Water samples
pH
a
6
7
8
9
W2
W3
W4
W5
W6
W7
W8
W9
W10
W11
W12
W13
W14
W15
W16
W17
W18
W28
W29
W30
W31
W32
W33
W34
WH
O .
US
EP
A .
Water samples
pH

119
Fig.5.3. Variations in electric conductivity in the water of study area. a= Nalatr
wetland complex, b= Iskoman lake, c= Hundrap lake, d= Baha lake.
c
0
200
400
600
800
1000
1200
1400
W22
W23
W24
W35
W36
W37
W38
W39
W40
WH
O
Water samples
EC
(μ
s/c
m)
a
0
200
400
600
800
1000
1200
1400
W1
W2
W3
W4
W5
W6
W7
W8
W9
W10
W11
W12
W13
W14
W15
W16
W17
W18
W28
W29
W30
W31
W32
W33
W34 WH
Water samples
EC
(μ
s/cm
)

120
Fig.5.4. Variations of the total dissolved solid in the water of study area. a= Nalatr
wetland complex, b= Iskoman lake, c= Hundrap lake, d= Baha lake.
d
0100200300400500600700800900
100011001200
W25
W26
W27
W47
W48
W49
W50
WH
O
US
EP
A
Water samples
TD
S (
mg
/L)
a
0100200300400500600700800900
100011001200
W1
W2
W3
W4
W5
W6
W7
W8
W9
W10
W11
W12
W13
W14
W15
W16
W17
W18
W28
W29
W30
W31
W32
W33
W34
WH
O
US
EP
A
Water samples
TD
S (
mg
/L)

121
Fig.5.5. Variations in turbidity in the water of study area. a= Nalatr wetland complex,
b= Iskoman lake, c= Hundrap lake, d= Baha lake.
b
0
1
2
3
4
5
W19
W20
W21
W41
W42
W43
W44
W45
W46
WH
O
US
EP
A
Water samples
Tu
rbid
ity (
NT
U)
c
0
1
2
3
4
5
W22
W23
W24
W35
W36
W37
W38
W39
W40
WH
O
US
EP
A
Water samples
Tu
rbid
ity (
NT
U)

122
.
Fig.5.6. Variations in salinity in the water of study area. a= Nalatr wetland complex,
b= Iskoman lake, c= Hundrap lake, d= Baha lake.
a
0
1
2
3
4
W1
W3
W5
W7
W9
W11
W13
W15
W17
W28
W30
W32
W34
Water samples
Salin
ity (
SA
L)
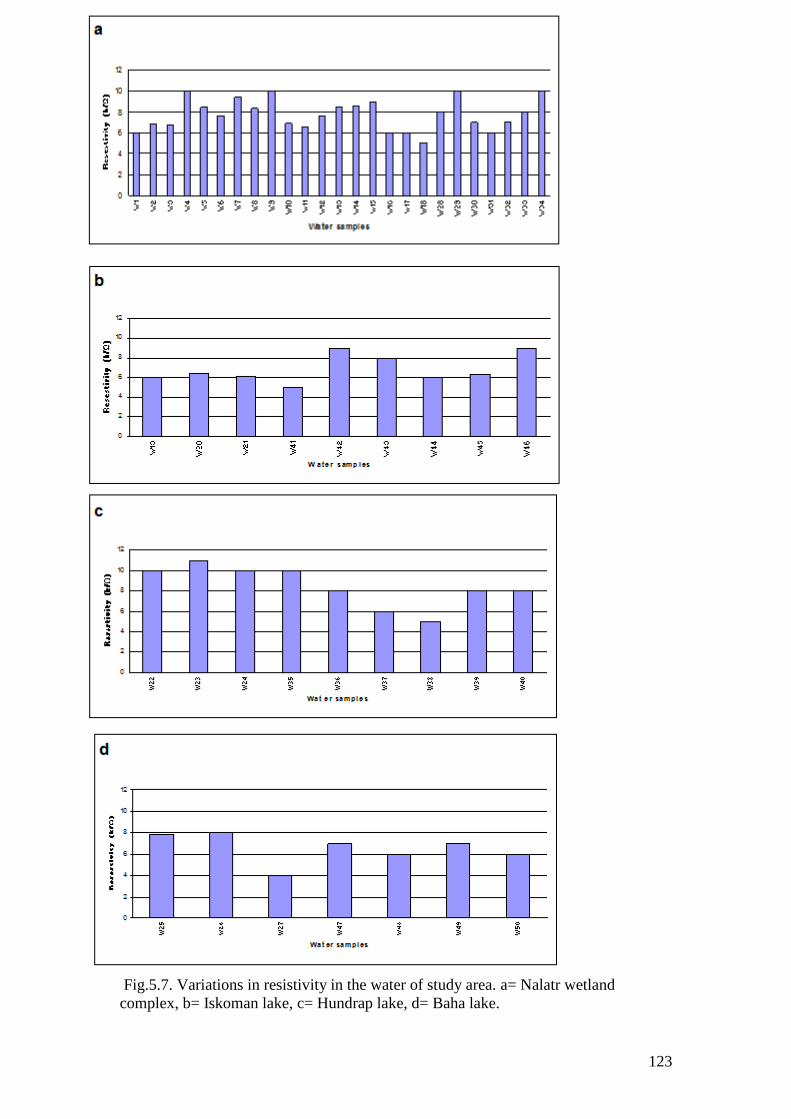
123
Fig.5.7. Variations in resistivity in the water of study area. a= Nalatr wetland
complex, b= Iskoman lake, c= Hundrap lake, d= Baha lake.

124
Fig.5.8. Concentrations of chloride in the water of study area. a= Nalatr wetland
complex, b= Iskoman lake, c= Hundrap lake, d= Baha lake.
b
0
50
100
150
200
250
W19
W20
W21
W41
W42
W43
W44
W45
W46
WH
O
US
EP
A
Water samples
Cl (
mg
/L)
c
0
50
100
150
200
250
W22
W23
W24
W35
W36
W37
W38
W39
W40
WH
O
US
EP
A
Water samples
Cl (m
g/L
)

125
Fig.5.9. Concentration of sulfate in the water of study area. a= Nalatr wetland
complex, b= Iskoman lake, c= Hundrap lake, d= Baha lake.
b
050
100150200250300350400450500
W19
W20
W21
W41
W42
W43
W44
W45
W46
WH
O
US
EP
A
Water samples
SO
4 (
mg
/L)

126
Fig.5.10. Concentrations of nitrate in the water of study area. a= Nalatr wetland
complex, b= Iskoman lake, c= Hundrap lake, d= Baha lake.

127
Fig.5.11. Concentrations of bicarbonate in the water of study area. a= Nalatr wetland
complex, b= Iskoman lake, c= Hundrap lake, d= Baha lake.
b
0
100
200
300
400
W19
W20
W21
W41
W42
W43
W44
W45
W46
WH
O
Water samples
HC
O3 (
mg
/L)
c
0
100
200
300
400
W22
W23
W24
W35
W36
W37
W38
W39
W40
WH
O
Water samples
HC
O3 (
mg
/L)

128
Fig.5.12. Concentrations sodium in the water of study area. a= Nalatr wetland
complex, b= Iskoman lake, c= Hundrap lake, d= Baha lake.
a
0
40
80
120
160
200
W1
W2
W3
W4
W5
W6
W7
W8
W9
W10
W11
W12
W13
W14
W15
W16
W17
W18
W28
W29
W30
W31
W32
W33
W34
WH
Water samples
Na (
mg
/L)
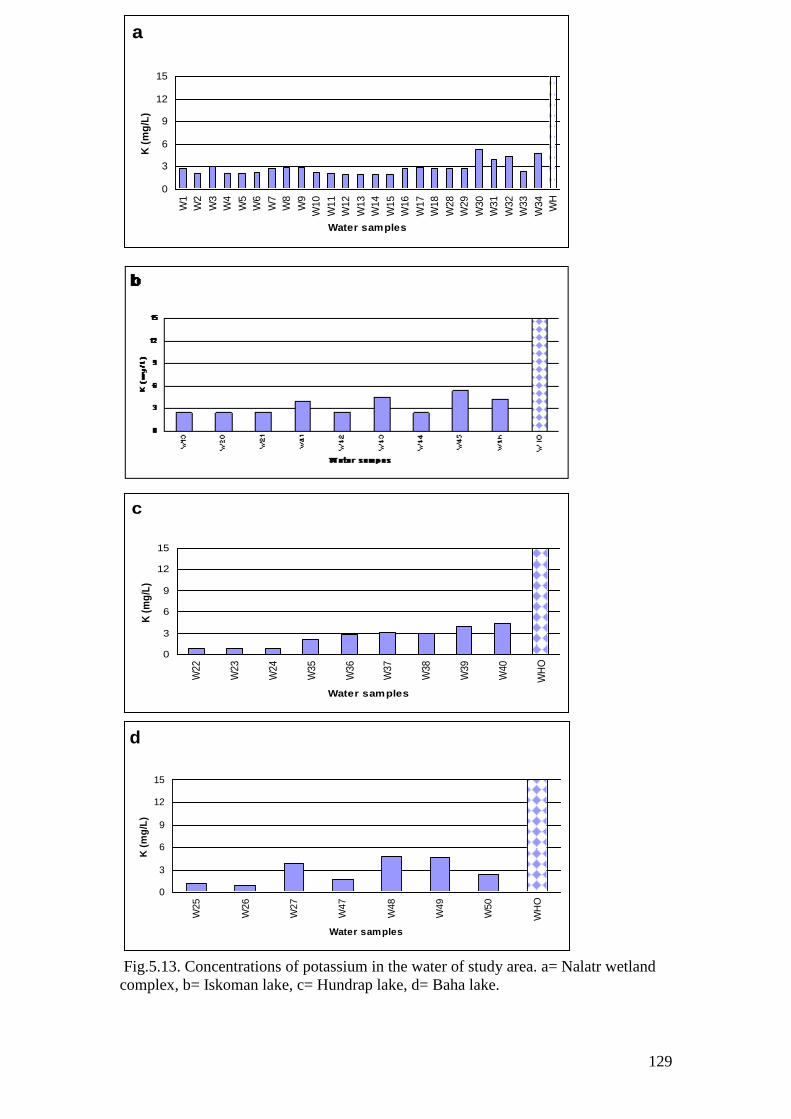
129
Fig.5.13. Concentrations of potassium in the water of study area. a= Nalatr wetland
complex, b= Iskoman lake, c= Hundrap lake, d= Baha lake.
c
0
3
6
9
12
15
W22
W23
W24
W35
W36
W37
W38
W39
W40
WH
O
Water samples
K (
mg
/L)
d
0
3
6
9
12
15
W25
W26
W27
W47
W48
W49
W50
WH
O
Water samples
K (
mg
/L)
a
0
3
6
9
12
15
W1
W2
W3
W4
W5
W6
W7
W8
W9
W10
W11
W12
W13
W14
W15
W16
W17
W18
W28
W29
W30
W31
W32
W33
W34
WH
Water samples
K (
mg
/L)

130
Fig.5.14. Concentrations of calcium in the water of study area. a= Nalatr wetland
complex, b= Iskoman lake, c= Hundrap lake, d= Baha lake.
a
0
10
20
30
40
50
60
70
80
W1
W2
W3
W4
W5
W6
W7
W8
W9
W10
W11
W12
W13
W14
W15
W16
W17
W18
W28
W29
W30
W31
W32
W33
W34
WH
O
Water samples
Ca (
mg
/L)
c
0
10
20
30
40
50
60
70
80
W22
W23
W24
W35
W36
W37
W38
W39
W40
WH
O
Water samples
Ca (
mg
/L)
d
0
10
20
30
40
50
60
70
80
W25
W26
W27
W47
W48
W49
W50
WH
O
Water samples
Ca (
mg
/L)

131
Fig.5.15. Concentrations of magnesium in the water of study area. a= Nalatr wetland
complex, b= Iskoman lake, c= Hundrap lake, d= Baha lake.
b
0
10
20
30
40
50
W19
W20
W21
W41
W42
W43
W44
W45
W46
WH
O
Water samples
Mg
(m
g/L
)
d
0
10
20
30
40
50
W25
W26
W27
W47
W48
W49
W50
WH
O
Water samples
Mg
(m
g/L
)
a
0
10
20
30
40
50
W1
W2
W3
W4
W5
W6
W7
W8
W9
W10
W11
W12
W13
W14
W15
W16
W17
W18
W28
W29
W30
W31
W32
W33
W34
WH
Water samples
Mg
(m
g/L
)

132
Fig.5.16. Concentrations of manganese in the water of study area. a= Nalatr wetland
complex, b= Iskoman lake, c= Hundrap lake, d= Baha lake.
b
050
100150200250300350400450500
W19
W20
W21
W41
W42
W43
W44
W45
W46
WH
O
US
EP
A
Water samples
Mn
(μ
g/L
)
d
050
100150200250300350400450500
W25
W26
W27
W47
W48
W49
W50
WH
O
US
EP
A
Water samples
Mn
(μ
g/L
)
a
050
100150200250300350400450500
W1
W2
W3
W4
W5
W6
W7
W8
W9
W10
W11
W12
W13
W14
W15
W16
W17
W18
W28
W29
W30
W31
W32
W33
W34
WH
O
US
EP
A
Water samples
Mn
(μ
g/L
)

133
Fig.5.17. Concentrations of iron in the water of study area. a= Nalatr wetland
complex, b= Iskoman lake, c= Hundrap lake, d= Baha lake.
a
0
100
200
300
400
500
600
700
800
900
W1
W2
W3
W4
W5
W6
W7
W8
W9
W10
W11
W12
W13
W14
W15
W16
W17
W18
W28
W29
W30
W31
W32
W33
W34
WH
O
US
EP
A
Water samples
Fe (
μg
/L)
b
0100200300400500600700800900
W19
W20
W21
W41
W42
W43
W44
W45
W46
WH
O
US
EP
A
Water samples
Fe (
μg
/L)
d
0100200300400500600700800900
W25
W26
W27
W47
W48
W49
W50
WH
O
US
EP
A
Water samples
Fe (
μg
/L)
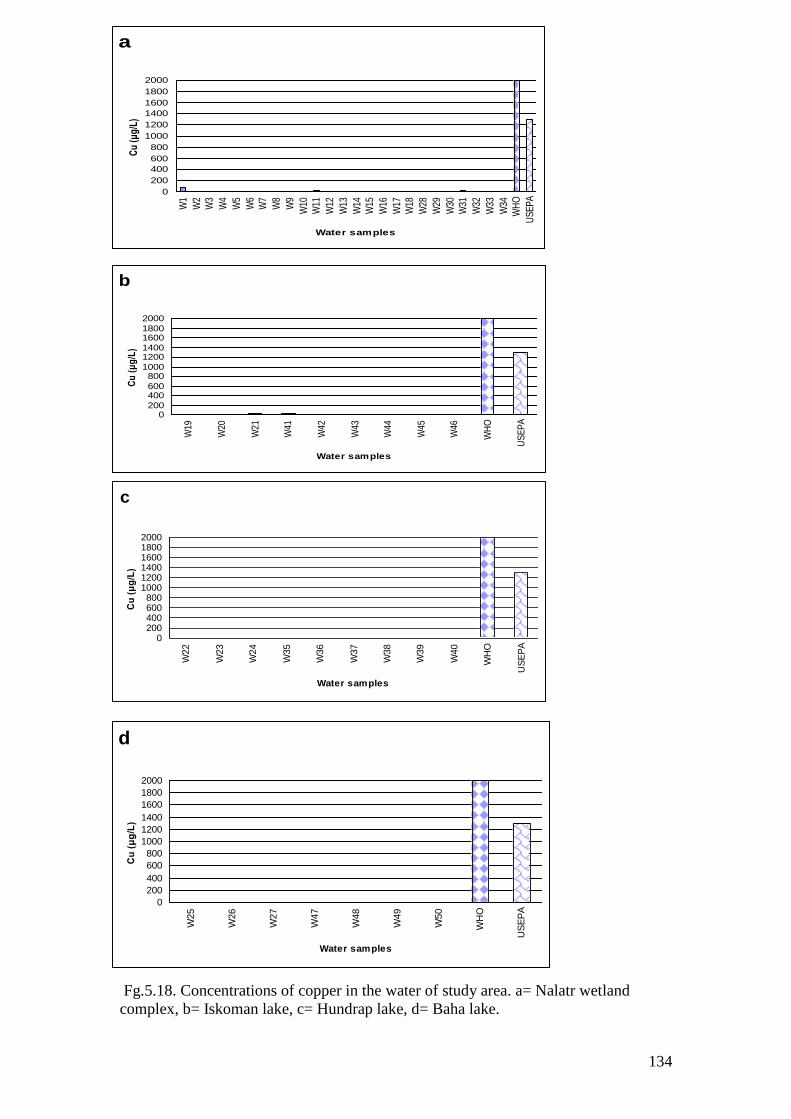
134
Fg.5.18. Concentrations of copper in the water of study area. a= Nalatr wetland
complex, b= Iskoman lake, c= Hundrap lake, d= Baha lake.
a
0
200
400
600
800
1000
1200
1400
1600
1800
2000
W1
W2
W3
W4
W5
W6
W7
W8
W9
W10
W11
W12
W13
W14
W15
W16
W17
W18
W28
W29
W30
W31
W32
W33
W34
WH
O
US
EP
A
Water samples
Cu
(μ
g/L
)
b
0200
400600
8001000
12001400
16001800
2000
W19
W20
W21
W41
W42
W43
W44
W45
W46
WH
O
US
EP
A
Water samples
Cu
(μ
g/L
)
c
0200400600800
100012001400160018002000
W22
W23
W24
W35
W36
W37
W38
W39
W40
WH
O
US
EP
A
Water samples
Cu
(μ
g/L
)
d
0
200
400
600
800
1000
1200
1400
1600
1800
2000
W25
W26
W27
W47
W48
W49
W50
WH
O
US
EP
A
Water samples
Cu
(μ
g/L
)

135
Fig.5.19. Concentrations of lead in the water of study area. a= Nalatr wetland
complex, b= Iskoman lake, c= Hundrap lake, d= Baha lake.
a
0
2
4
6
8
10
W1
W2
W3
W4
W5
W6
W7
W8
W9
W10
W11
W12
W13
W14
W15
W16
W17
W18
W28
W29
W30
W31
W32
W33
W34
WH
O
US
EP
A
Water samples
Pb
(μ
g/L
)
b
0
2
4
6
8
10
W19
W20
W21
W41
W42
W43
W44
W45
W46
WH
O
US
EP
A
Water sample
Pb
(μ
g/L
)
c
0
2
4
6
8
10
W22
W23
W24
W35
W36
W37
W38
W39
W40
WH
O
US
EP
A
Water samples
Pb
(μ
g/L
)
d
0
2
4
6
8
10
W25
W26
W27
W47
W48
W49
W50
WH
O
US
EP
A
Water samples
Pb
(μ
g/L
)

136
.
Fig.5.20. Concentrations of zinc in the water of study area. a= Nalatr wetland
complex, b= Iskoman lake, c= Hundrap lake, d= Baha lake.
a
0
1000
2000
3000
4000
5000
W1
W2
W3
W4
W5
W6
W7
W8
W9
W10
W11
W12
W13
W14
W15
W16
W17
W18
W28
W29
W30
W31
W32
W33
W34
WH
O
US
EP
A
Water samples
Zn
(μ
g/L
)
b
0
1000
2000
3000
4000
5000
W19
W20
W21
W41
W42
W43
W44
W45
W46
WH
O
US
EP
A
Water samples
Zn
(μ
g/L
)
d
0
1000
2000
3000
4000
5000
W25
W26
W27
W47
W48
W49
W50
WH
O
US
EP
A
Water samples
Z
n (
μg
/L)

137
Fig.5.21. Concentrations of nickel in the water of study area. a= Nalatr wetland
complex, b= Iskoman lake, c= Hundrap lake, d= Baha lake.
a
0
20
40
60
80
100
W1
W2
W3
W4
W5
W6
W7
W8
W9
W10
W11
W12
W13
W14
W15
W16
W17
W18
W28
W29
W30
W31
W32
W33
W34
WH
O
US
EP
A
Water samples
Ni (μ
g/L
)
b
0
20
40
60
80
100
W19
W20
W21
W41
W42
W43
W44
W45
W46
WH
O
US
EP
A
Water samples
Ni (μ
g/L
)

138
Fig.5.22. Concentrations of chromium in the water of study area. a= Nalatr wetland
complex, b= Iskoman lake, c= Hundrap lake, d= Baha lake.
a
0102030405060708090
100
W1
W2
W3
W4
W5
W6
W7
W8
W9
W10
W11
W12
W13
W14
W15
W16
W17
W18
W28
W29
W30
W31
W32
W33
W34
WH
OU
SE
PA
Water samples
Cr
(μg
/L)
b
0102030405060708090
100
W19
W20
W21
W41
W42
W43
W44
W45
W46
WH
O
US
EP
A
Water samples
Cr
(μg
/L)
c
0102030405060708090
100
W22
W23
W24
W35
W36
W37
W38
W39
W40
WH
O
US
EP
A
Water samples
Cr
(μg
/L)
d
0102030405060708090
100
W25
W26
W27
W47
W48
W49
W50
WH
O
US
EP
A
Water samples
Cr
(μg
/L)

139
Fig.5.23. Concentrations of cadmium in the water of study area. a= Nalatr wetland
complex, b= Iskoman lake, c= Hundrap lake, d= Baha lake.
b
0
1
2
3
4
5
6
W19
W20
W21
W41
W42
W43
W44
W45
W46
WH
O
US
EP
A
Water samples
Cd
(μ
g/L
)
c
0
1
2
3
4
5
6
W22
W23
W24
W35
W36
W37
W38
W39
W40
WH
O
US
EP
A
Water samples
Cd
(μ
g/L
)
a
0
1
2
3
4
5
6
W1
W2
W3
W4
W5
W6
W7
W8
W9
W10
W11
W12
W13
W14
W15
W16
W17
W18
W28
W29
W30
W31
W32
W33
W34
WH
O
US
EP
A
Water samples
Cd
(μ
g/L
)
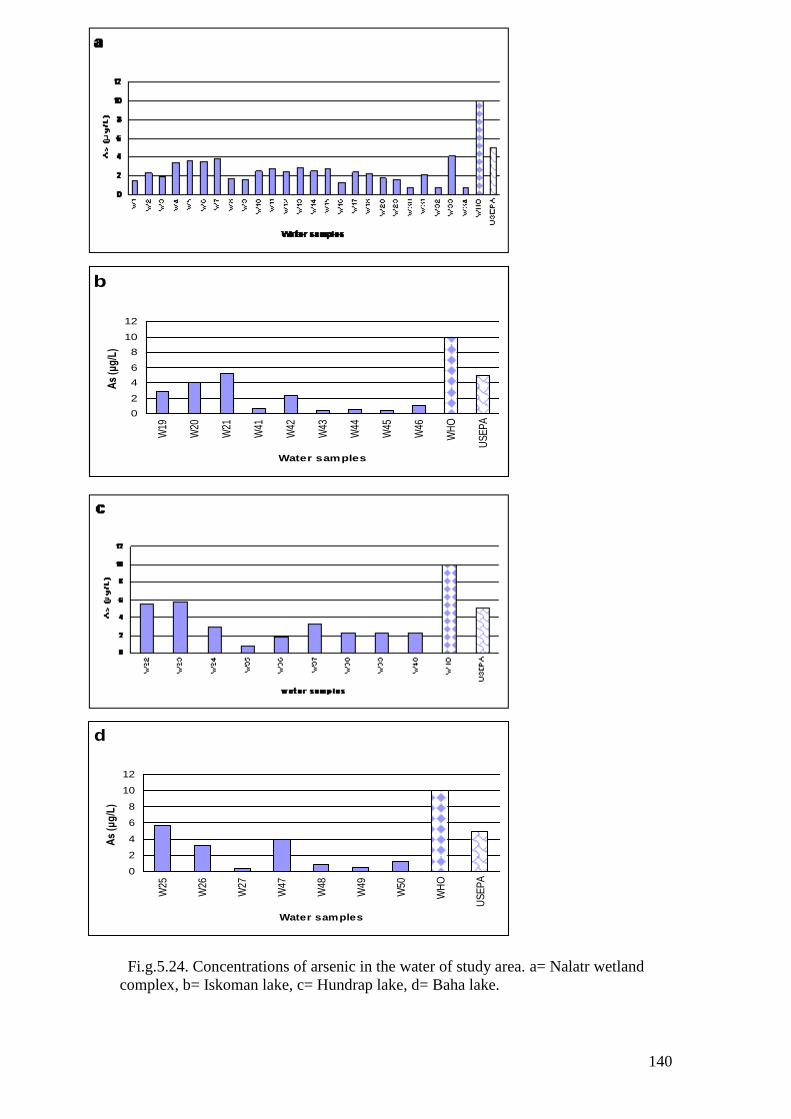
140
Fi.g.5.24. Concentrations of arsenic in the water of study area. a= Nalatr wetland
complex, b= Iskoman lake, c= Hundrap lake, d= Baha lake.
b
0
2
4
6
8
10
12
W19
W20
W21
W41
W42
W43
W44
W45
W46
WH
O
US
EP
A
Water samples
As
(μg
/L)
d
0
2
4
6
8
10
12
W25
W26
W27
W47
W48
W49
W50
WH
O
US
EP
A
Water samples
As
(μg
/L)

141
Fig.5.25. The composition of water of the Naltar lakes and its stream in the Piper
diagram.
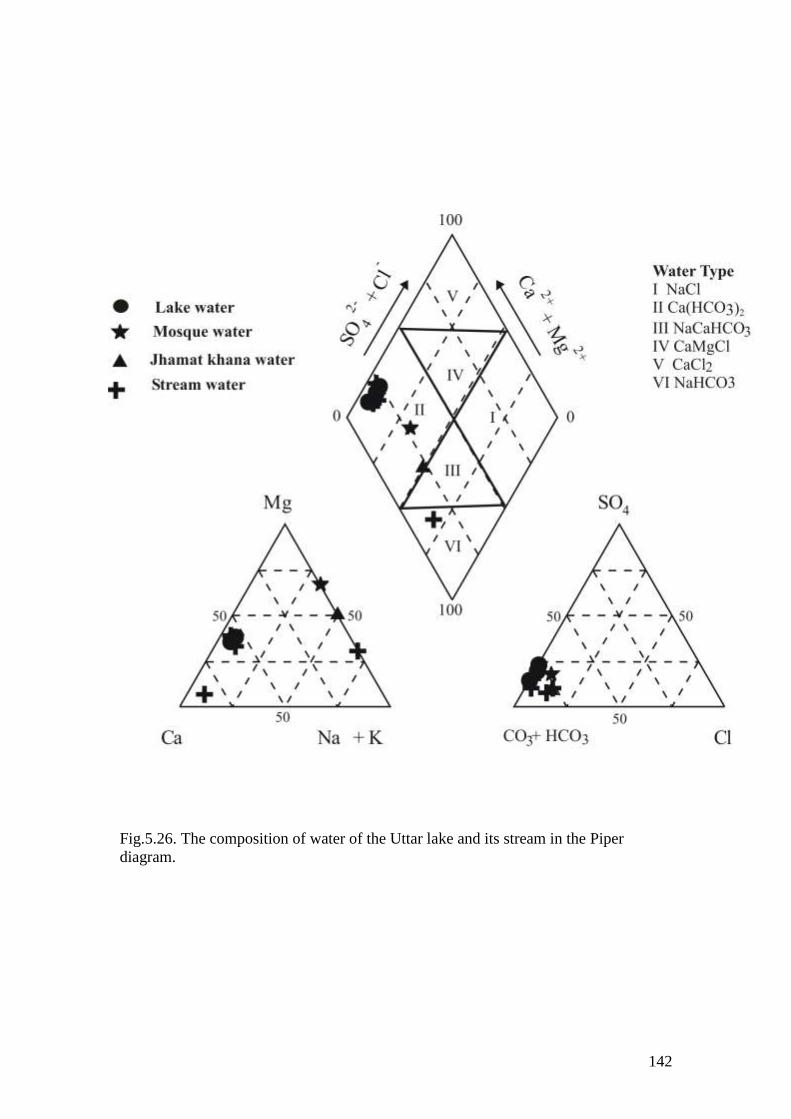
142
Fig.5.26. The composition of water of the Uttar lake and its stream in the Piper
diagram.
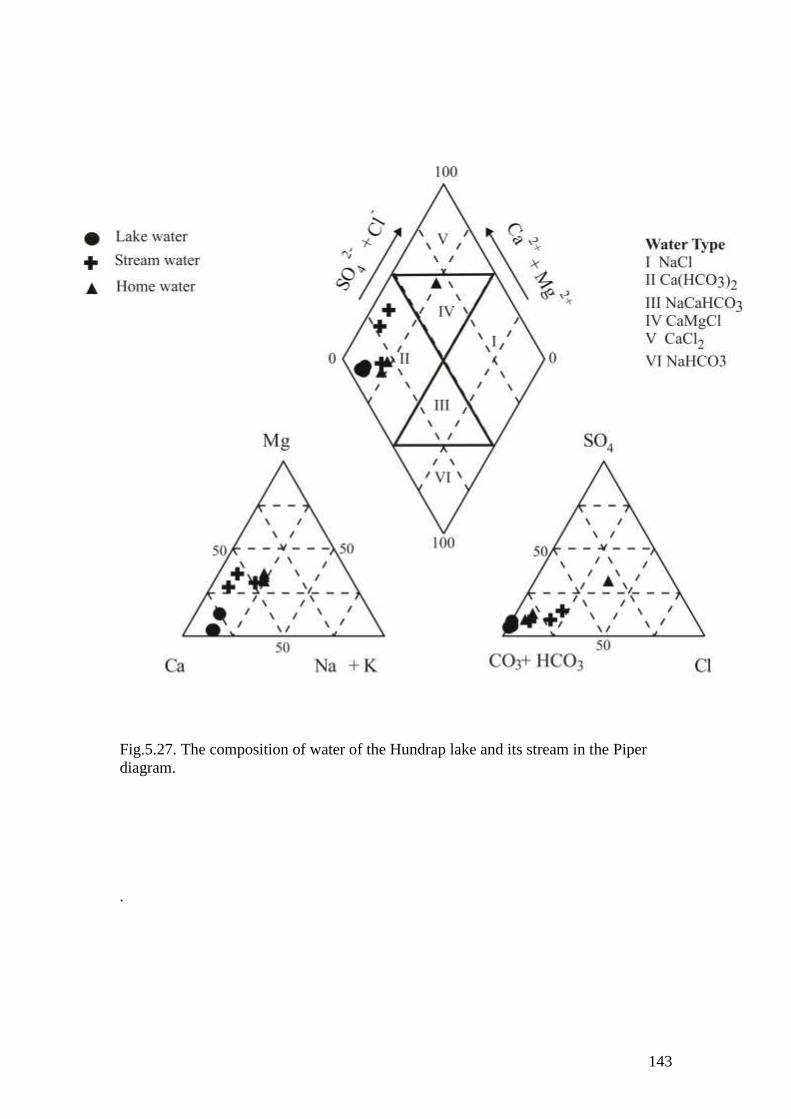
143
Fig.5.27. The composition of water of the Hundrap lake and its stream in the Piper
diagram.
.

144
Fig.5.28. The composition of water of the Baha lake and its stream in the Piper
diagram

145
Fig.5.29. GIS based distribution pattern of Mn in the water of Naltar lakes and their
streams at Naltar.

146
Fig.5.30. GIS based distribution pattern of Mn in the water of Uttar lake and its
streams at Iskoman.

147
Fig.6.31. GIS based distribution pattern of Mn in the water of Hundrap lake and its
streams at Hundrap.

148
Fig.5.32. GIS based distribution pattern of Mn in the water of Baha lake and its
streams at Khukosh.

149
Fig.5.33. GIS based distribution pattern of Fe in the water of Naltar lakes and their
streams at Naltar.
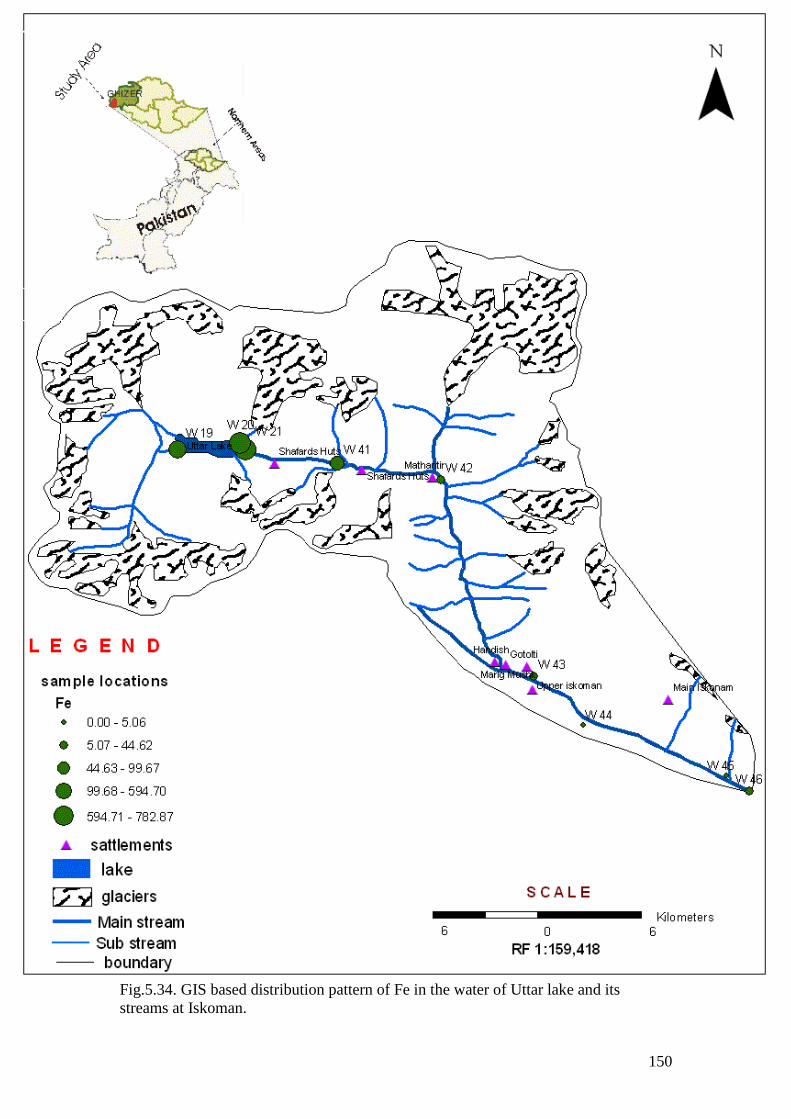
150
Fig.5.34. GIS based distribution pattern of Fe in the water of Uttar lake and its
streams at Iskoman.

151
Fig.5.35. GIS distribution pattern of Fe in the water of Hundrap lake and its streams at
Hundrap.

152
Fig.5.36. GIS based distribution pattern of Fe in the water of Baha lake and its
streams at Khukosh.
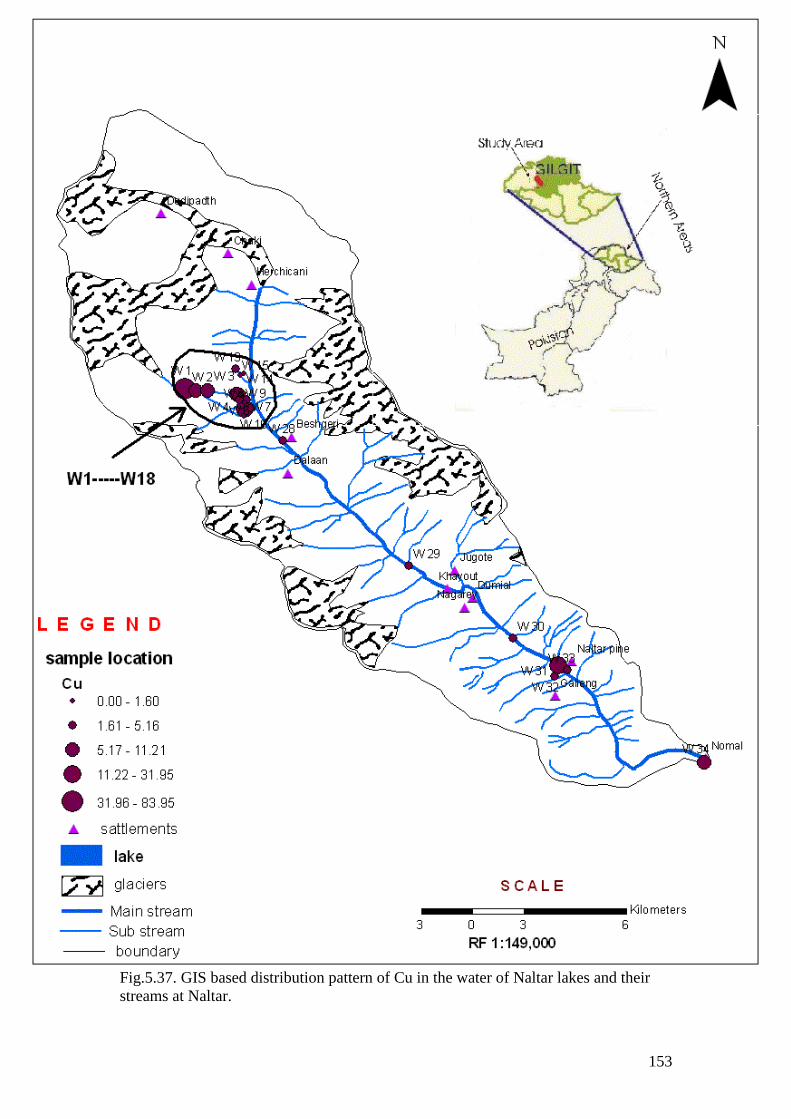
153
Fig.5.37. GIS based distribution pattern of Cu in the water of Naltar lakes and their
streams at Naltar.
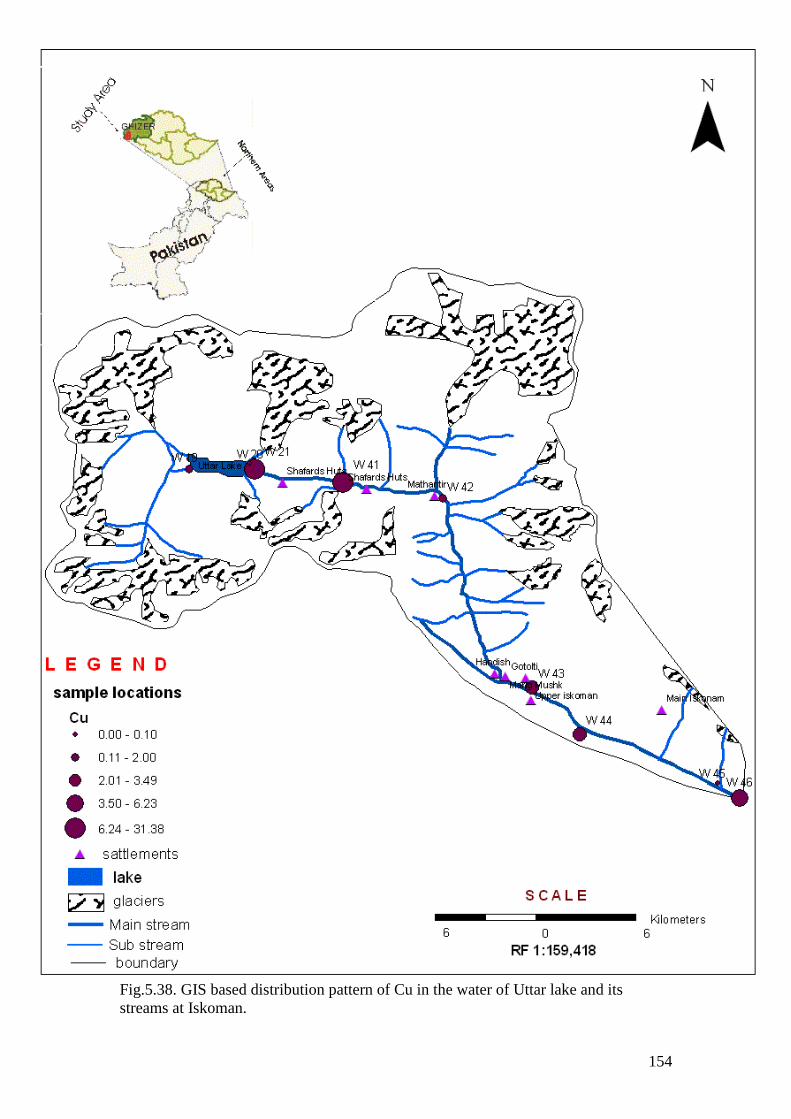
154
Fig.5.38. GIS based distribution pattern of Cu in the water of Uttar lake and its
streams at Iskoman.

155
Fig.5.39. GIS based distribution pattern of Cu in the water of Hundrap lake and its
streams at Hundrap.

156
Fig.5.40. GIS based distribution pattern of Cu in the water of Baha lake and its
streams at Khukosh.
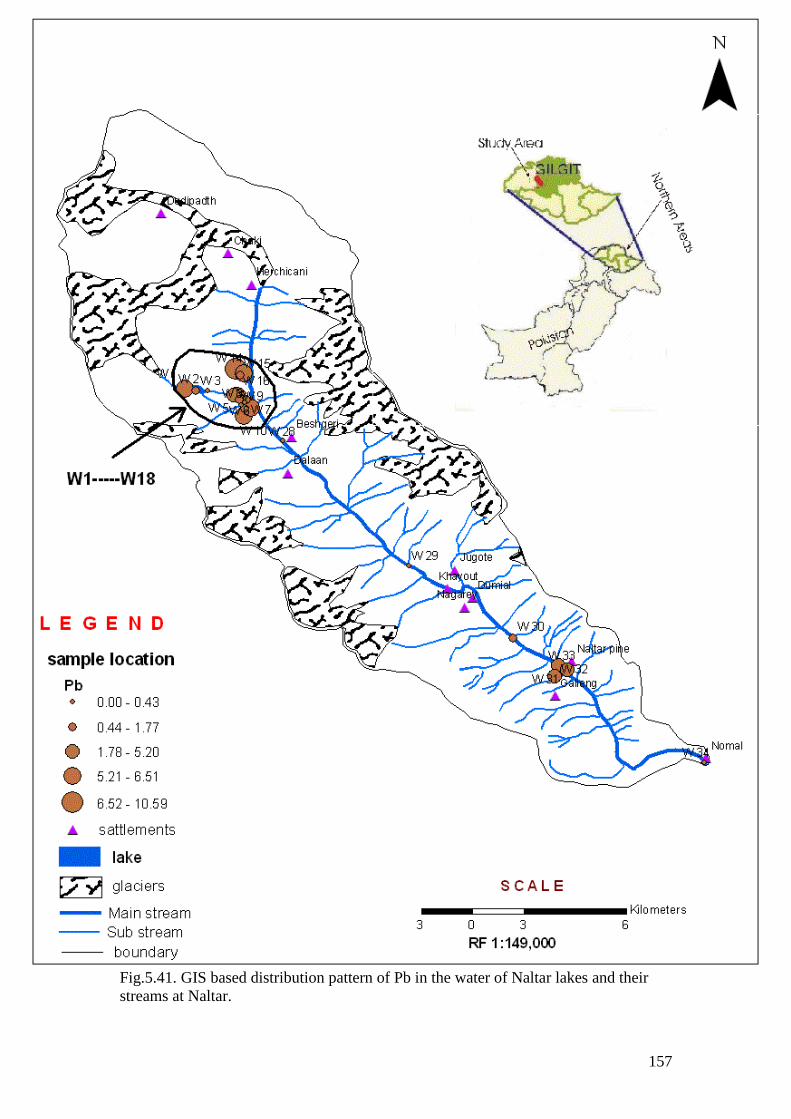
157
Fig.5.41. GIS based distribution pattern of Pb in the water of Naltar lakes and their
streams at Naltar.

158
Fig.5.42. GIS based distribution pattern of Pb in the water of Uttar lake and its
streams at Iskoman.
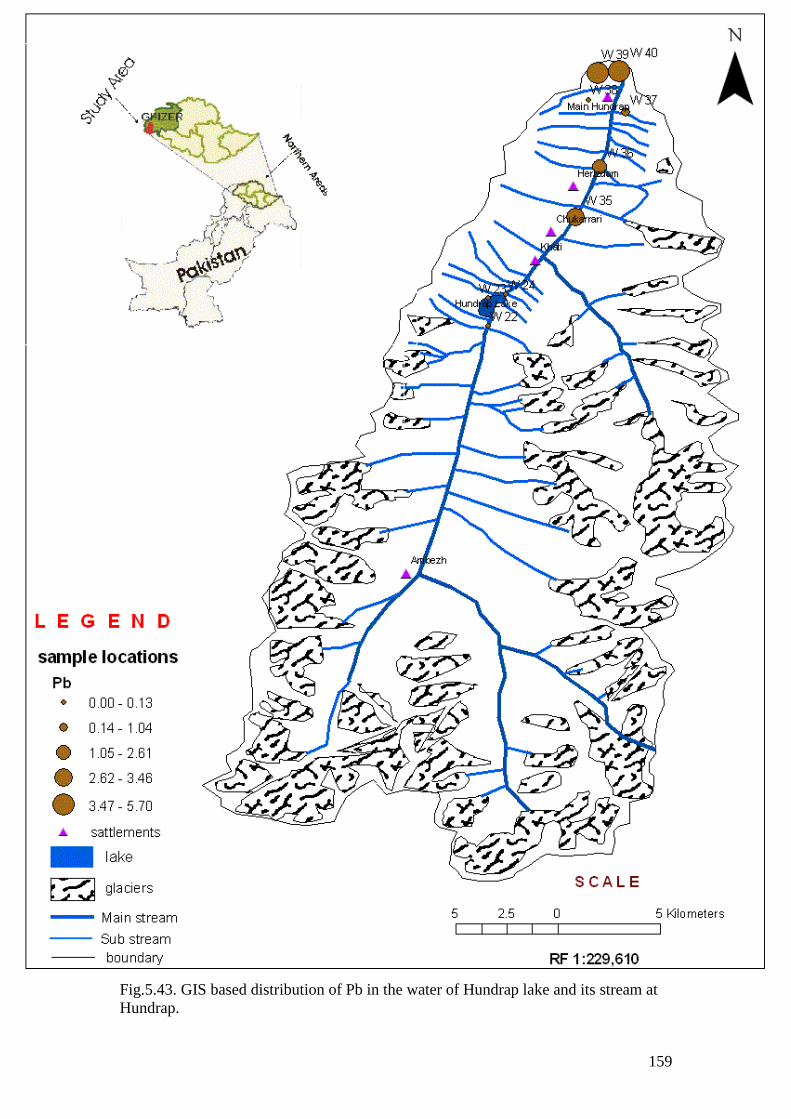
159
Fig.5.43. GIS based distribution of Pb in the water of Hundrap lake and its stream at
Hundrap.

160
Fig.5.44. GIS based distribution pattern Pb in the water of Baha lake and its streams at
Khukosh.
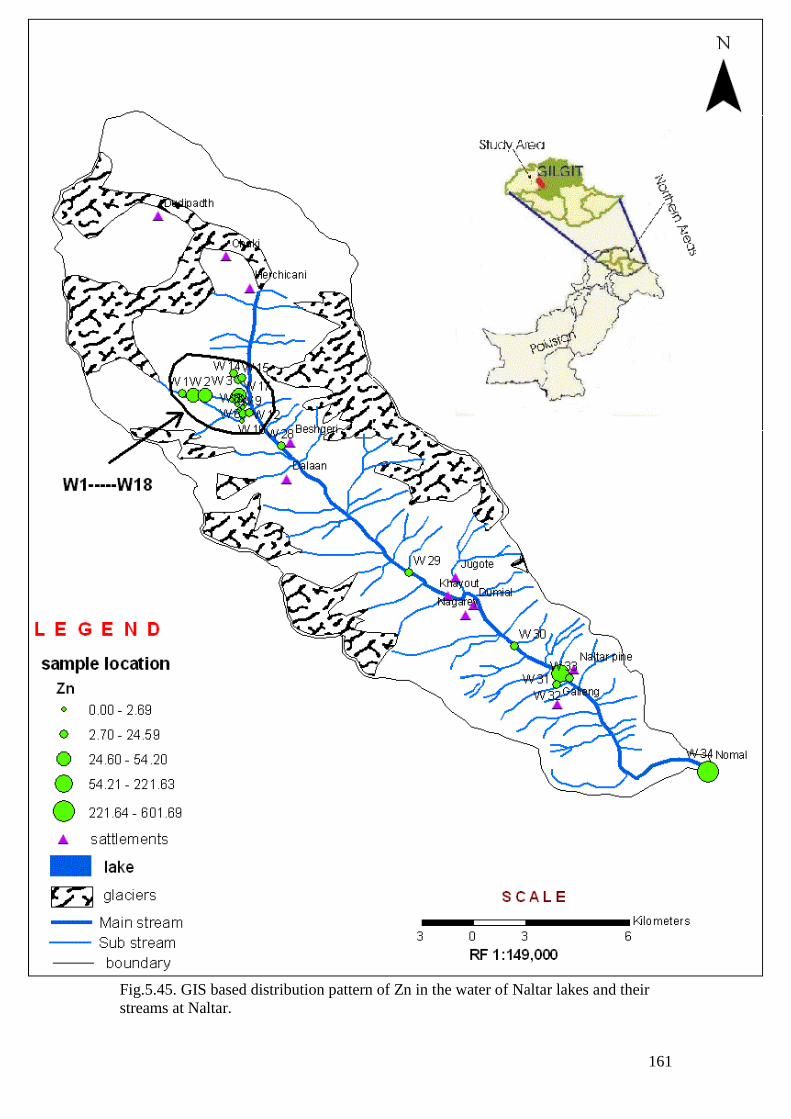
161
Fig.5.45. GIS based distribution pattern of Zn in the water of Naltar lakes and their
streams at Naltar.

162
Fig.5.46. GIS based distribution pattern of Zn in the water of Uttar lake and its
streams at Iskoman.

163
Fig.5.47. GIS based distribution pattern of Zn in the water of Hundrap lake and its
streams at Hundrap.
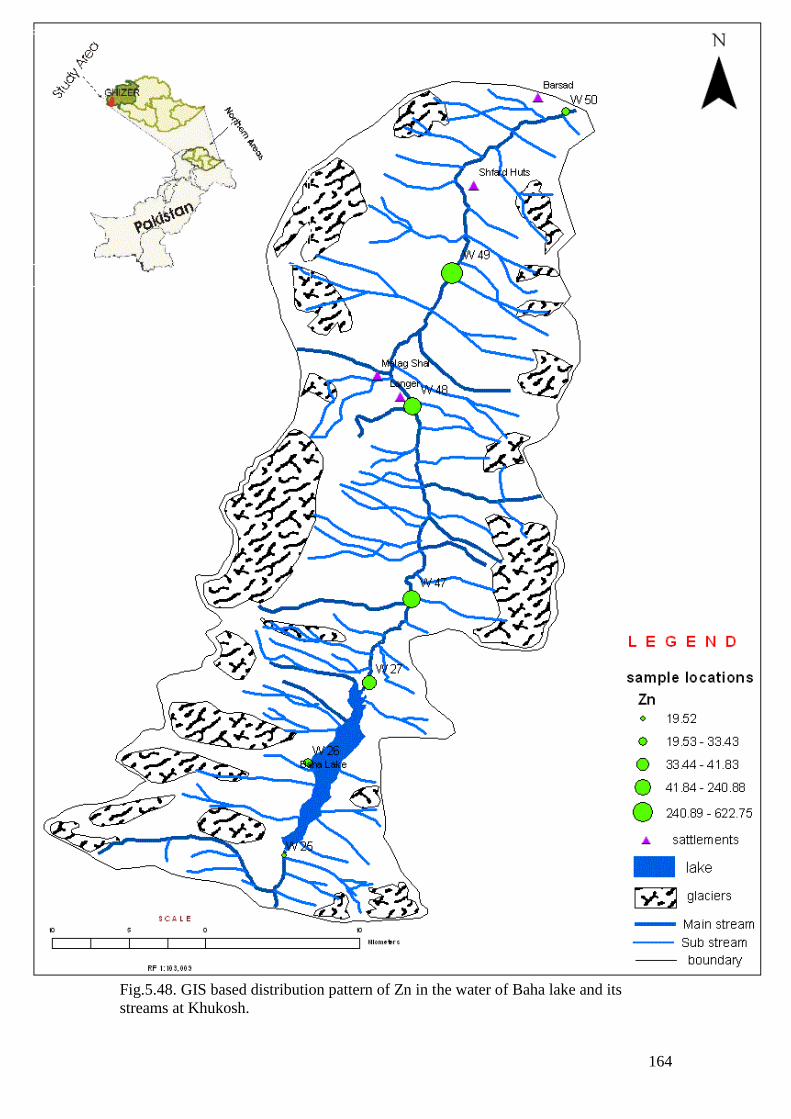
164
Fig.5.48. GIS based distribution pattern of Zn in the water of Baha lake and its
streams at Khukosh.

165
Fig.5.49. GIS based distribution pattern of Ni in the water of Naltar lakes and their
streams at Naltar.
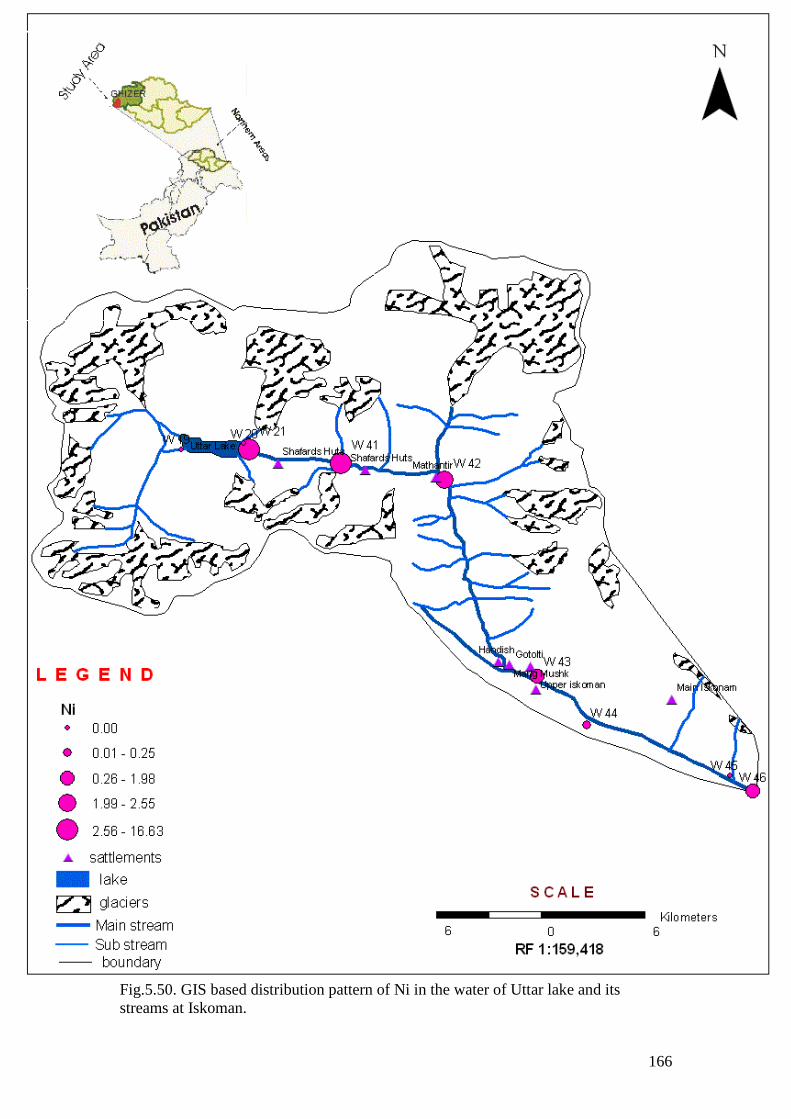
166
Fig.5.50. GIS based distribution pattern of Ni in the water of Uttar lake and its
streams at Iskoman.
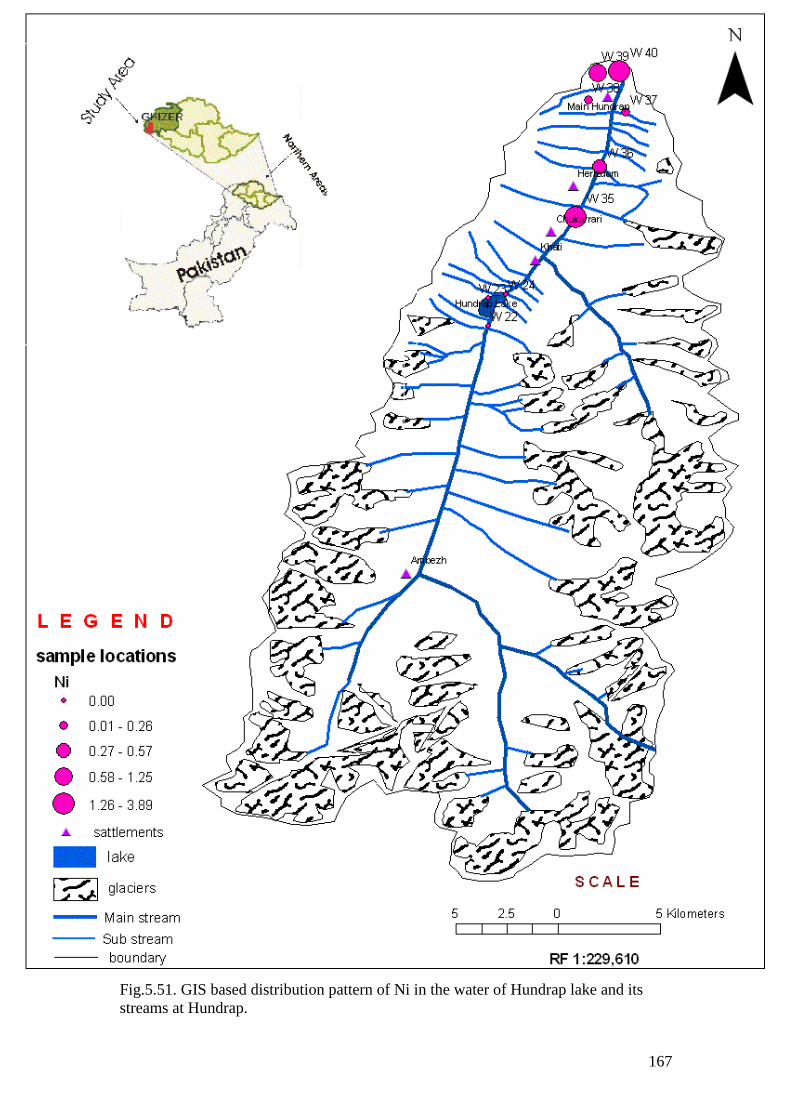
167
Fig.5.51. GIS based distribution pattern of Ni in the water of Hundrap lake and its
streams at Hundrap.

168
Fig.5.52. GIS based distribution pattern of Ni in the water of Baha lake and its
streams at Khukosh.

169
Fig.5.53. GIS based distribution pattern of Cr in the water of Naltar lakes and their
streams at Naltar.

170
Fig.5.54. GIS based distribution pattern of Cr in the water of Uttar lake and its
streams at Iskoman.

171
Fig.5.55. GIS based distribution pattern of Cr in the water of Hundrap lake and its
streams at Hundrap.
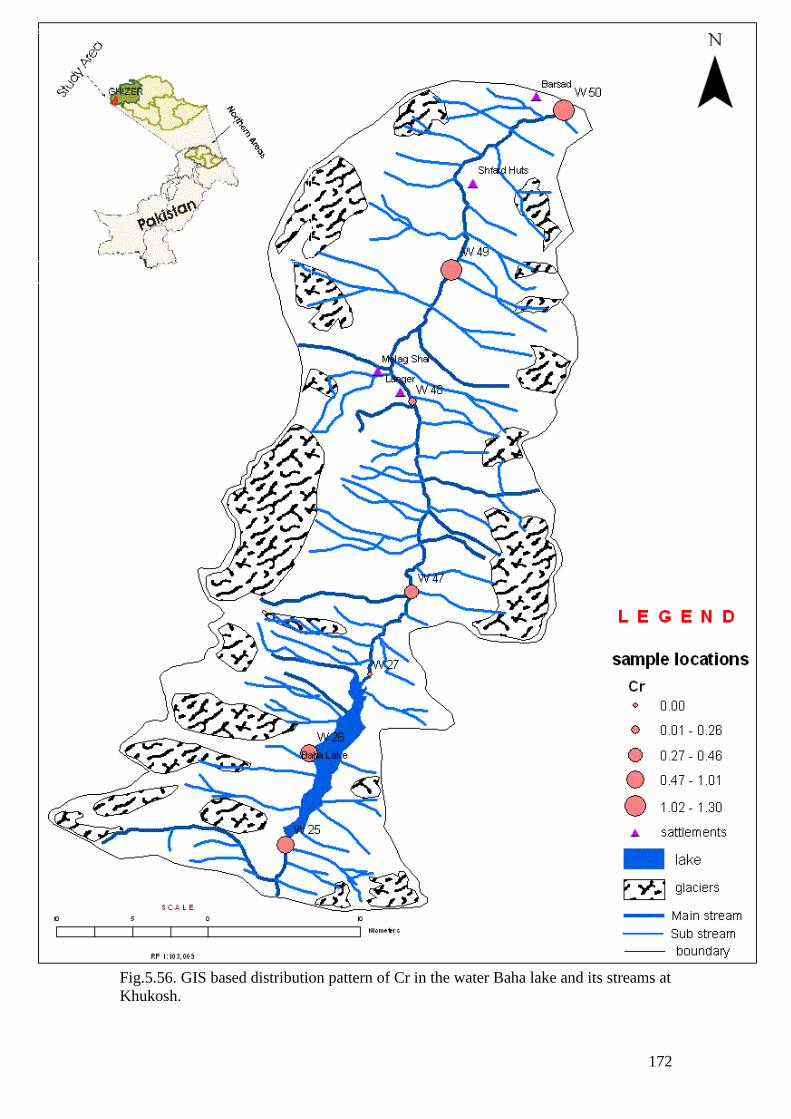
172
Fig.5.56. GIS based distribution pattern of Cr in the water Baha lake and its streams at
Khukosh.
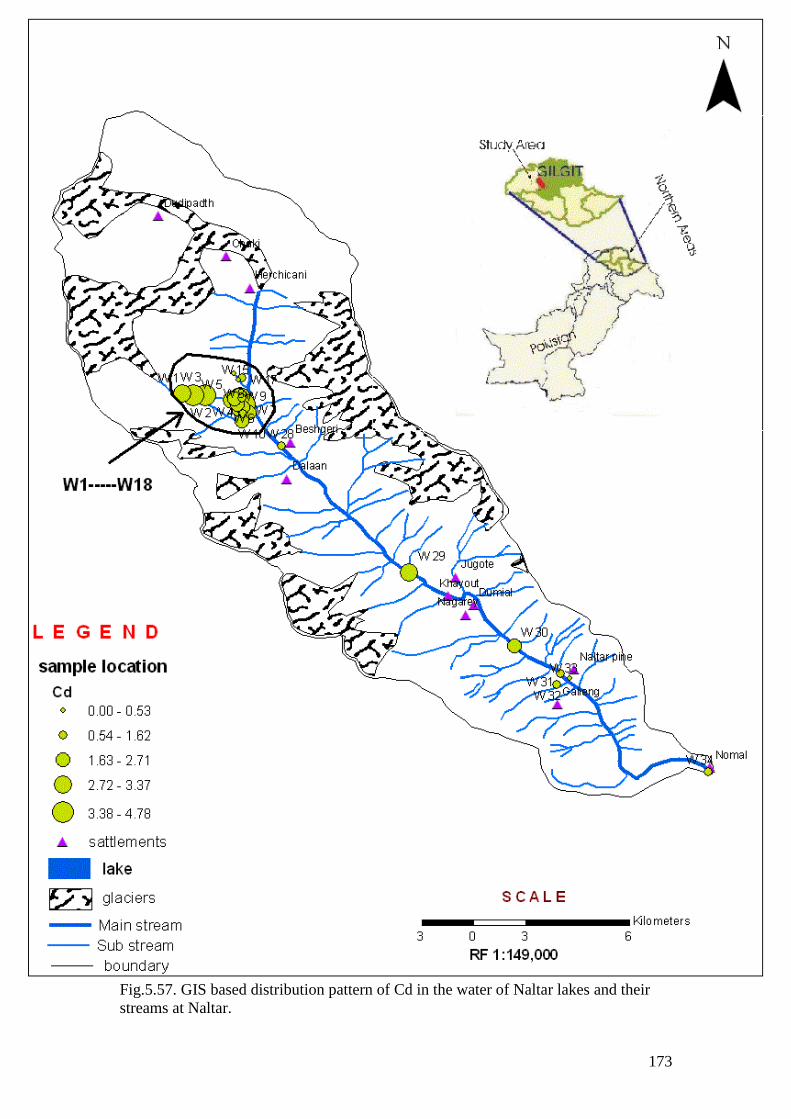
173
Fig.5.57. GIS based distribution pattern of Cd in the water of Naltar lakes and their
streams at Naltar.
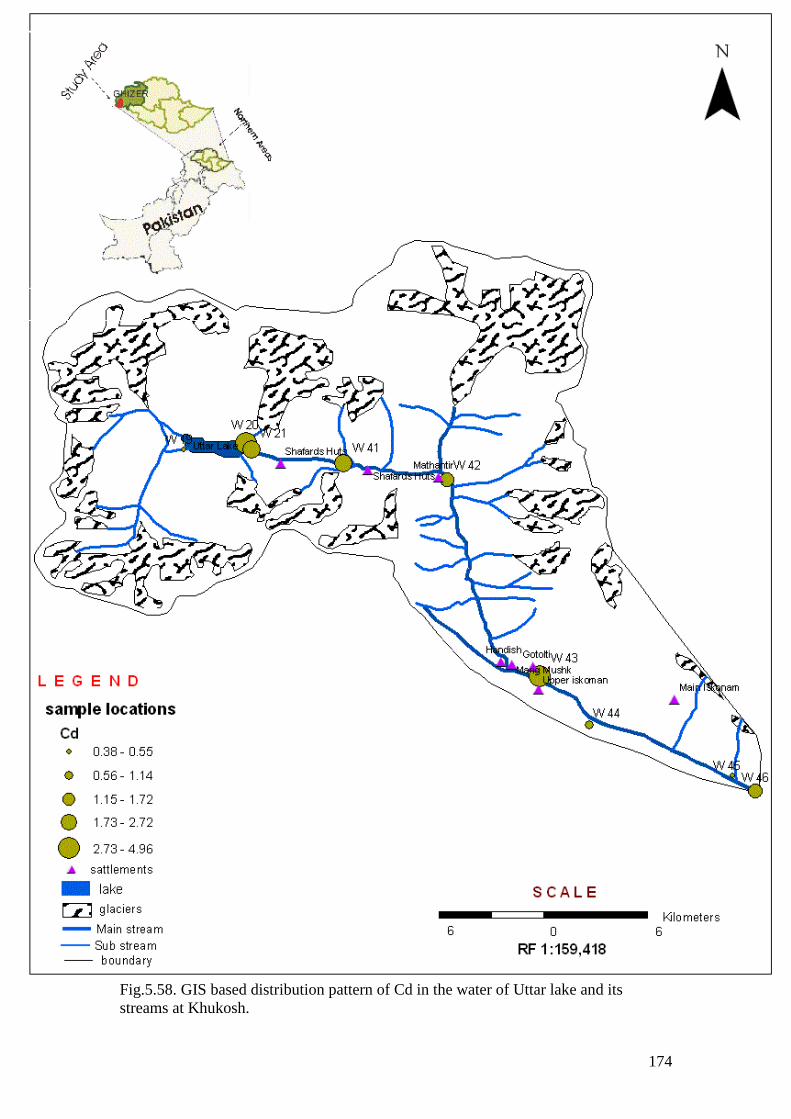
174
Fig.5.58. GIS based distribution pattern of Cd in the water of Uttar lake and its
streams at Khukosh.

175
Fig.5.59. GIS based distribution pattern of Cd in the water of Hundrap lake and its
streams at Hundrap.

176
Fig.5.60. GIS based distribution pattern of Cd in the water of Baha lake and its
streams at Khukosh.

177
Fig.5.61. GIS based Distribution pattern of As in the water of Naltar lakes and their
streams at Naltar.

178
Fig.5.62. GIS based distribution pattern of As in the water of Uttar lake and its
streams at Iskoman.

179
Fig.5.63. GIS based distribution pattern of As in the water of Hundrap lake and its
streams at Hundrap.

180
Fig.5.64. GIS based distribution pattern of As in the water of Baha lake and its
streams at Khukosh.
181
CHAPTER 6
DISCUSSION
Water is a key to combat poverty, hunger, diseases and environmental
degradation. Lack of data on water quality is hindering attempt to address water
related issues in the region. Therefore, emerging issues to human health in the
developing world due to access to unsafe drinking water and inappropriate sanitation
facility. The provision of safe drinking water and hygienic sanitation to households
and communities enhances health by reducing death and diseases through waterborne
diseases such as, cholera, diarrhea and dysentery. Glaciers, springs ponds, and alpine
lakes are the major water resources that fulfill the basic life requirements in the Gilgit,
northern areas of Pakistan. People use the lakes’ water for drinking and irrigation
purposes. These lakes are also used by the grazing animals of the area. Besides
fulfilling the basic needs of the inhabitants of the area, these lakes also have great
significance in promotion of tourism in the region. The sustainable development
especially in regard to the high altitude alpine lakes with their environmental
conservation has always remained controversial due to remoteness. Therefore, the
present study has been conducted in regard to the physico-chemical contamination in
the high altitude alpine lakes and resulted environmental degradation in the Gilgit
region. The geochemical data, obtained during this study for the water of high altitude
alpine lakes and related streams were compared with the international water quality
standards of WHO (2008) and USEPA (2009) and the quality of water was evaluated
for domestic and irrigation purposes.

182
6.1. Physical parameters
The temperature in the water of the study area (i.e., Naltar wetland complex,
Uttar, Hundrap and Baha lakes with their respective streams) was found lower than
8oC. The low temperature can be attributed to the high altitude alpine zones and
glaciers water.
The values of pH in all the representative water samples of lakes and streams,
(Naltar wetland complex, Uttar, Hundrap and Baha lakes with their respective
streams) varied from a minimum of 7.2 to maximum of 7.9 and was found within the
permissible limit (6.5-8.5) set by WHO (2008) and USEPA (2009), therefore, the
water is suitable for domestic as well as irrigation purposes.
The values of EC in all the representative water samples of high altitude alpine
lakes and streams in the Naltar wetland complex, Uttar, Hundrap and Baha lakes and
their respective streams varied from 106-281μs/cm, 128-217μs/cm, 90-181μs/cm and
103-241μs/cm respectively. These results show that the values of EC in all the water
samples of lakes and streams were found within the permissible limit (1400) set by
WHO (2008). Due to the low value of EC in the water the values of resistivity were
found very high (i.e., >5 KΩ).
The values of TDS in all the water samples of lakes and streams in the study
areas were found to be <181mg/L which were within the permissible limit of
1000mg/L of WHO and 500mg/L of USEPA.
The values of turbidity and salinity in all the water samples of lakes and
streams in the study area were found to be <5 NTU and <3.8, respectively and was
found within the permissible limit of WHO (2008) and USEPA (2009). However, it
was noted that the turbidity was zero at lakes, while it slightly increased in down
streams the lakes.

183
6.2. Anions
The concentrations of anions such as Cl-, SO4
-2 and NO3
- in Naltar (Naltar
wetland complex and its stream) were found to be <42mg/L, <28mg/L and <5mg/L
respectively, which were found within the permissible limit set by WHO (2008) and
USEPA (2009). However, HCO3- was found higher (up to 320mg/L) than the limit of
250mg/L set by WHO (2008). Therefore, the concentrations of anions in Naltar were
found in the order of HCO3- > SO4
-2 > Cl
- > NO3
- and water is considered as HCO3
-
type. In Iskoman (Uttar lake and its stream), the concentrations of Cl,- SO4
-2 and NO3
-
were found to be <29mg/L, <27mg/L and <3mg/L respectively, and were within the
permissible limits set by WHO (2008) and USEPA (2009). HCO3- was found higher
(up to 360mg/L) than the limits of 250mg/L set by WHO (2008). Therefore, the
concentrations of anions in Iskoman were found in the order of HCO3- > SO4
-2 > Cl
- >
NO3- and water is considered as HCO3 type. In Hundrap (Hundrap lake and its
stream), the concentrations of Cl-, SO4
-2 and NO3
- were found to be <23mg/L, 27mg/L
and <2mg/L respectively, which were within the permissible limits set by WHO
(2008) and USEPA (2009). However, HCO3- was found higher (up to 360mg/L) than
the permissible limit of 250mg/L set by WHO (2008). The concentrations of anions in
Hundrap were found in the order of HCO3- > SO4
-2 > Cl
- > NO3
-, therefore, water is
considered as HCO3- type. In Khukosh (Baha lake and its stream), the concentration
of anions such as Cl-, SO4
-2 and NO3
- and HCO3
- were found to be <23mg/L,
<50mg/L, <3mg/L and <210mg/L, respectively, and were within the permissible
limits set by WHO (2008) and USEPA (2009). The concentrations of anions in
Khukosh were found in the order of HCO3- > SO4
-2 > Cl
- > NO3
-, therefore water is
considered as HCO3- type.
184
On the basis of these results, it was concluded that the water of high altitude
alpine lakes with their relevant streams of the Gilgit and Ghizar Districts Northern
Areas of Pakistan have the concentration of anions below the permissible limit except
HCO3- which was found relatively higher than the permissible limit set by WHO
(2008) and USEPA (2009). This high concentration of HCO3- in the water can be
attributed to the peculation of water through the HCO3- rocks i.e. limestone, dolomite,
as the solubility of Na2CO3 and CaCO3 in water is also one of the main reasons to
influence the HCO3- concentration in water bodies.
6.3. Light elements
The concentrations of light elements such as Na, K, Ca, and Mg in Naltar
wetland complex and its related streams were found to be <35mg/L, <5mg/L,
<57mg/L and <39mg/L, respectively, which were found within the permissible limit
set by WHO (2008). The concentrations of light elements in Naltar were found in the
order of Ca>Mg> Na > K. The high concentration of Ca relative to other light
elements could be due to the weathering and decomposition of calastic sedimentary
rocks, which are dominantly present in Naltar. The concentrations of Na, K, Ca, and
Mg in Iskoman (Uttar lake and its stream) were found to be <124mg/L, <5mg/L,
<74mg/L and <30mg/L respectively and were found within the permissible limits set
by WHO (2008). The concentrations of light element in Iskoman were found in the
order of Ca>Mg> Na > K. This high concentration of Ca could be due to the joining
of sub streams to main stream having exposure of marble in the catchments areas.
Calcium leached from these marble during weathering and dissolved therefore,
increases Ca concentration in lake water. In Hundrap (Hundrap lake and its stream)
the concentrations of Na, K, Ca, and Mg were found to be <34mg/L, <4mg/L,
<59mg/L and <26mg/L respectively, which were found within the permissible limits

185
set by WHO (2009). The concentration of light elements in Hundrap found in the
order of Ca> Mg > Na >K. This high concentration of Ca in the water samples with
respect to other light elements in the region was purely due to the wreathing of calc
alkaline gabbroic rocks and hornblende cumulates that contains Ca as a major
constituent, which probably leached into the sub streams and then into main stream.
In Khukosh (Baha lake and its stream) the concentrations of Na, K, Ca, and Mg were
found to be <141mg/L, <5mg/L, 51mg/L and <28mg/l respectively and is within the
permissible limit set by WHO (2008). The concentration of anions in Khukosh region
were found in the order of Na > Ca > Mg > K.
It is concluded that, the lakes and streams water in the Gilgit and Ghizar
Districts Northern Areas of Pakistan are having the concentration of light elements
below the permissible limit set by WHO (2009), and water is suitable for domestic
purposes.
6.4. Heavy metals
The concentrations of trace and heavy metals in water of high altitude alpine
lakes with their related streams (i.e., Naltar wetland complex, Uttar, Hundrap and
Baha lakes with their respective streams) are compared with the international water
quality standards i.e., WHO-2008 and USEPA- 2009, to evaluate the quality of water
in these regions.
The concentrations of Mn in the water of lakes and streams found below the
detection level (<0.5μg/L) in most of the water samples. The observed concentrations
of Mn in rest of the water samples in the Naltar wetland complex, Uttar, Hundrap, and
Baha lakes with their respective streams were found to be <110μg/L, <30μg/L,
<40μg/L, and <30μg/L respectively, which were found within the permissible limits
set by WHO-500μg/L. However, in some of the Naltar lakes water samples, the

186
concentration of Mn was found slightly higher than the USEPA (2009). This higher
concentration of Mn in Naltar lakes will lead to taste problem in the water and also
health related problems such as physiological and particularly neurological disorder
(Criddle, 1992).
The concentrations of Fe in the water of Naltar wetland complex, Uttar, Hundrap, and
Baha lakes with their respective streams were found to be <876μg/l, <782μg/L,
<629μg/L, and <332μg/L respectively. These results showed that the concentrations
of Fe in Naltar wetland complex and its related streams were found within the
permissible limit set by WHO (2008). The samples W2 and W3, collected from the
centre and outlet parts of Naltar lake1 (Bodorok bari), having concentration of
479μg/L and 877μg/L respectively showed slightly higher than the permissible limit
(300μg/L) of WHO (2008). In Iskoman (Uttar lake and its stream), the concentrations
of Fe were found within the permissible limit set by WHO (2008) and USEPA (2009)
in all the stream water samples while in lake’s water samples the concentration of Fe
was found slightly higher than the permissible limit of (300μg/L) of WHO (2008). In
Hundrap (Hundrap lake and its stream), the concentrations of Fe were found within
the permissible in all the water samples except sample W40, collected from the end of
the Hundrap population has the concentration of 628μg/L which was found higher
than the permissible limit of (300μg/L) set by WHO (2008) and USEPA (2009). In
Khukosh (Baha lake and its stream), all the water samples showed the concentration
of Fe within the permissible limit set by WHO (2008) and USEPA (2009). The
concentrations of Fe were found slightly increases from the permissible limit set by
WHO (2008), in Naltar lake1 (Bodorok bari) and Uttar lake, therefore, it can cause
the small intestine infection (Bhattacharjee, 2001), and secondary hemochromtosis in

187
which iron gets accumulated in liver and heart, even death in young children
(Bothwell et al,.1979).
The measured concentrations of Cu in Naltar wetland complex, Uttar,
Hundrap, and Baha lakes and their related streams were found to be <84μg/L,
<31.38μg/L, <8.25μg/L and <4μg/L, respectively, which are within the permissible
limits set by WHO (2008) and USEPA (2009).
The concentrations of Pb in the water of lakes and streams were found below
the detection level (<0.5μg/L) in most of the water samples. However, the obtained
values of Pb in the Naltar wetland complex, Uttar, Hundrap, and Baha lakes and their
related streams were found to be <10μg/L, <7μg/L, <2μg/L and <7μg/L, respectively.
These results showed that, in all the lakes and associated streams the Pb concentration
was found within the permissible limit of WHO (2008).
The calculated concentrations of Zn in Naltar wetland complex, Uttar,
Hundrap, and Baha lakes with their respective streams were found to be <601μg/L,
<1283μg/L, <929μg/L and <623μg/L respectively, which were found within the
permissible limit of WHO (2008).
The concentrations of Ni in most of the water samples of areas under
investigation were found below the detection level (<0.5μg/L). The measured
concentrations of Ni in water of Naltar wetland complex, Uttar, Hundrap, and Baha
lakes with their respective streams were found to be <29μg/L, <17μg/L, <4μg/L and
<5μg/L respectively, and are within the permissible limit. The sample W1, collected
from Naltar region has higher Ni concentration of 29μg/L as compared to the
permissible limit set by WHO (2008). This increase of Ni concentration can be
attributed to the volcanic rocks present at the region.

188
The concentration of Cr in all the representative water samples of lakes and
streams of Naltar wetland complex, Uttar, Hundrap, and Baha lakes with their
respective streams were found <8μg/L, which were found within the permissible limit
set by WHO (2008).
The concentration of Cd in the water of lakes and streams of the areas
studied (i.e., Naltar wetland complex, Uttar, Hundrap, and Baha lakes with their
respective streams), were found to be <5μg/L, <4μg/L, 4μg/L and <3μg/L
respectively. These results showed that the concentrations of Cd in most of the
representative water samples were found within the permissible limits set by WHO
(2008). However, some of the water samples collected from Naltar, Iskoman and at
Hundrap regions have slightly increase of Cd concentration from the permissible
limit of 3μg/L set by WHO (2008). This increase of Cd concentrations in such areas
can causes intestinal, lung and kidney damage problems (Barrento et al., 2009).
Mercury has been found below the detection level (0.05μg/L) in all the
representative water samples of lakes and related streams of areas under investigation.
While the concentrations of As in the water of Naltar wetland complex, Uttar,
Hundrap, and Baha lakes with their respective streams were found to be <4μg/L,
<5μg/L, <6μg/L and <6μg/L, respectively and are within the permissible limit of
10μg/L set by WHO (2008).
6.5. Statistical analysis of water quality.
In order to identify the interaction between physio-chemical parameters in the
water of Naltar wetland complex, Uttar, Hundrap, and Baha lakes with their
respective streams (Tables 7.1, 7.2, 7.3 and 7.4), a statistical method of SPSS like
Pearson’s correlation was applied on representative water samples of these areas
(Muhammad et al., 2010). The correlation was done for the selected physio-chemical

189
parameters such as, pH, EC, TDS, Cl, SO4, NO3, HCO3, Na, K, Ca, Mg, Mn, Fe, Cu,
Pb, Zn, Ni, Cr, Cd and As.
Table.7.1 showed the interrelationship of selected physio-chemical parameters
in Naltar (Naltar wetland complex and its stream). The correlation matrix showed that
some of the parameter pairs had no any interrelationship, however, strong positive
correlation was found between pairs such as EC-TDS (r =.587), EC-K (r =.580), Cl-
HCO3 (r =. 585), Cl-Ca (r =.712), Cl-Mg (r =.747), Cl-Zn (r =.544), Na-Mg (r =.630),
K-Ca (r =.652), K-Mg (r =.583), Ca-Mg (r =.762), Ca-Zn (r =.688), Mg-Zn (r =.695),
Cu-Ni (r =.930), Cu-Cr (r =.682), and Ni-Cr (r =.711), and strong negative
correlation between pairs such as EC-As (r=-.525), K-As (r=-.723) and Ca-As (r=-
.605) were found between most of the parameters pairs in Naltar.
The correlation matrix (Table.7.2) for Iskoman (Uttar lake and respective
stream) indicated that the physio-chemical parameter pairs which have strong
positive correlations were found as EC-TDS (r =.825), EC-NO3 (r =.577), TDS-NO3 (r
=.711), Cl-HCO3 (r =.818), Cl-Ca (r =.679), Cl-Mg (r =.609), Cl-Pb (r =.571), Cl-Zn
(r =.739), SO4-HCO3 (r =.620), SO4-K (r =.919), SO4-Ca (r =.728), SO4-Zn (r =.555),
HCO3-Ca (r =.904), HCO3-Mg (r =.790), HCO3-Pb (r =.657), HCO3-Zn (r =.890),
Na-Mg (r =.759), K-Ca (r =.707), Ca-Mg (r =.634), Ca-Zn (r =.793), Mg-Zn (r =.691),
Fe-As (r =.919), Cu-Ni (r= 973), Pb-Zn (r =.625), Pb-Cd (r =.573) and Zn-Cd (r
=.623) and strong negative correlations as, pH-Cl (r =-.813), pH- HCO3 (r =-.558),
pH-Zn (r =-.702), pH-Cd (r =-.519), EC-Pb (r =-.741), EC-Cd (r =-.735), TDS-Pb (r
=-.589), TDS-Cd (r =-.764), Cl-Mn (r =-.565), Cl-Fe (r =-.647), Cl-As (r =-.566),
SO4-Fe (r =-.560), SO4-As (r =-.581), NO3-Fe ( r =-.717), NO3-Cd ( r =-.690), NO3-As
( r =-.543), HCO3-Mn (r =-.598), HCO3-Fe (r =-.651), HCO3-As (r =-.632), K-Fe (r =-

190
.600) K-As (r =-.683), Ca-Fe (r = 773), Ca-As (r = 829), Mg-Mn (r =-.738) and Mn-
Zn (r =-.523).
The correlation matrix (Table.7.3) for Hundrap (Hundrap lake and respective
stream) indicated that, the physio-chemical parameter pairs which have strong
positive correlations were found as EC-SO4 (r =.862), EC-HCO3 (r =.779), EC-Na (r
=.532), EC-K (r =.542), TDS-Cl (r =.549), TDS-NO3 (r =.823), TDS-Na (r =.584),
TDS-K (r =.884), TDS-Ca (r =.712), TDS-Mg (r =.761), TDS-Mn (r =.511), TDS-Fe
(r =.621), TDS-Pb (r =.777), TDS-Cr (r =.574), Cl-SO4 (r =.700), Cl-Na (r =.537), Cl-
K (r =.705), Cl- Ca (r =.957), Cl-Mg (r =.889), Cl-Mn (r =.787), Cl-Pb (r =.610), Cl-Zn
(r =.605), Cl- Ni (r =.543), SO4-Na (r =.734), SO4-K (r =.698), SO4-Ca (r =.664),
SO4-Mg (r =.764), SO4-Zn (r =.730), NO3-K (r =.594), NO3-Ca (r =.569), NO3-Mg
(r =.534), NO3-Pb (r =.607), NO3-Cr (r =.595), Na-K (r =.869), Na-Ca (r =.652), Na-
Mg (r =.825), Na-Zn (r =.717), K-Ca (r =.839), K-Mg (r =.926), K-Mn (r =.605), K-
Pb (r =.789), K-Cr (r =.596), Ca-Mg (r =.936), Ca-Mn (r =.861), Ca-Pb (r =.709), Ca-
Zn (r =.558), Ca-Ni (r =.608), Ca-Cr (r =.513), Mg-Mn (r =.668), Mg-Pb (r =.660),
Mg-Zn (r =.674), Mg-Cr (r =.552), Fe-Pb (r =.679), Pb-Ni (r =.742), and Pb-Cr (r
=.622) and the parameter pairs which have strong negative correlations were found as
pH-Cd (r =-.545), TDS-As (r =-.506), Cl-As (r =-.829), SO4-As (r =-.676), Na-Cu (r
=-.536), K-As (r =-.609), Ca-As (r =-.815), Mg-As (r =-.709), Pb-As (r =-.602) and
Ni-As (r =-.658)
The correlation matrix (Table.7.4) for Khukosh (Baha lake and respective
stream) indicated that, the physio-chemical parameter pairs which have strong
positive correlations were found as, pH-HCO3 (r =.561), EC-TDS (r =.867), EC-NO3
(r =.582) , EC-HCO3 (r =.600), EC-K (r =.578), EC-Ca (r =.639), EC-NI (r =.669),
TDS-HCO3 (r =.641), TDS-K (r =.684), TDS-Ca (r =.725), TDS-Zn (r =.569), Cl-

191
HCO3 (r =.528), Cl-Na (r =.977), Cl-K (r =.629), Cl-Mg (r =.984), SO4-NO3 (r =.928),
SO4-Ni (r =.952), NO3-Cu (r =604), NO3-Ni (r =952), HCO3-Na (r =675), HCO3-K (r
=.511), HCO3-Mg (r =.592), Na-K (r =.617), Na-Ca (r =.506), Na-Mg (r =.975), K-Ca
(r =.963), K-Mg (r =.661), K-Zn (r =.569), Ca-Mg (r =.514), Ca-Zn (r =.631), Mn-Cr
(r =.525), Fe-As (r =.724) and Cu-Pb (r =.657) and the parameter pairs which have
strong negative correlations were found as EC-As (r =-.652), TDS-Cd (r =-.570),
TDS-As (r =-.646), Cl-Fe (r =-.615), Cl-Cu (r =-.599), Cl-As (r =-.592), SO4-Cr (r =-
.636), NO3-Cr (r =-.760), HCO3-Cu (r =-.526), HCO3-As (r =-.734), Na-Fe (r =-.619),
Na-Cu (r =-.683), Na-As (r =-.635), K-Fe (r =-.574), K-Pb (r =-.624), K-As (r =-
.840), Ca-Fe (r =-.650) Ca-Pb (r =-.576), Ca-As (r =-.833), Mg-Fe (r =-.545), Mg-Cu
(r =-.600), Mg-Ni (r =-.527), Mg-As (r =-.609), Mn-Fe (r =-.565), Fe-Zn (r =-.504),
Cu-Cr (r =-.730), Zn-Cd (r =-.617) and Ni-Cr (r =-.703).
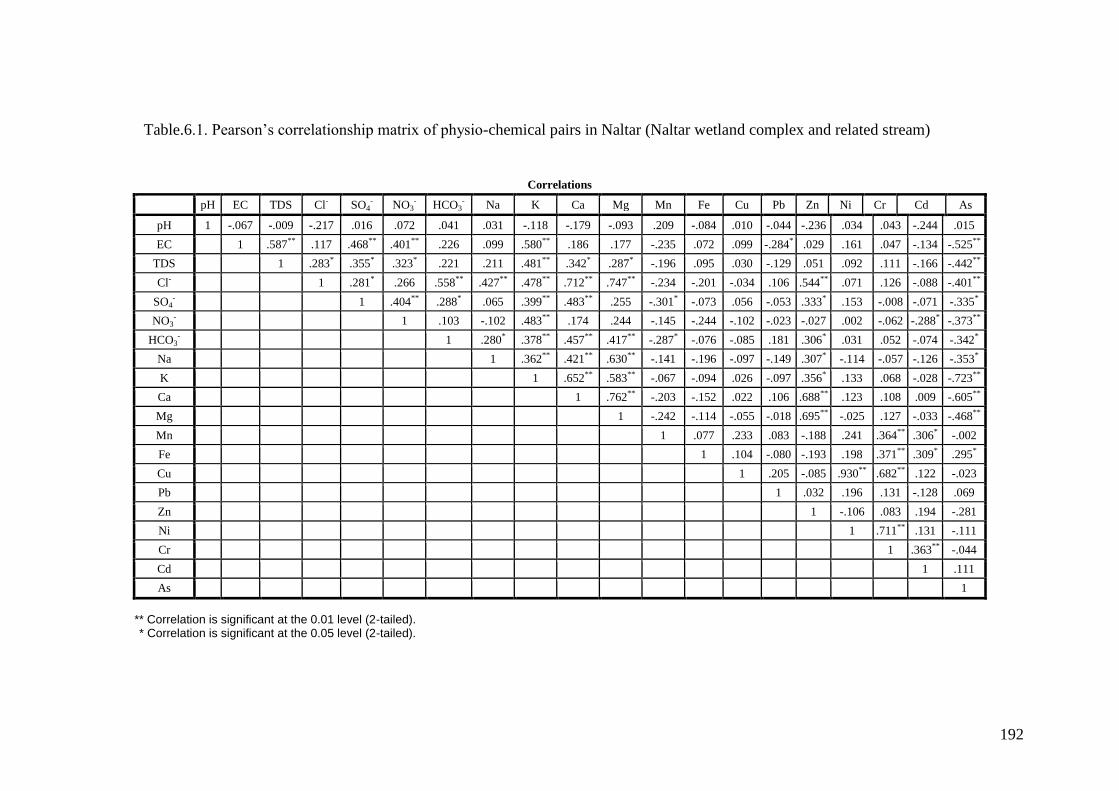
192
Table.6.1. Pearson’s correlationship matrix of physio-chemical pairs in Naltar (Naltar wetland complex and related stream)
Correlations
pH EC TDS Cl- SO4- NO3
- HCO3- Na K Ca Mg Mn Fe Cu Pb Zn Ni Cr Cd As
pH 1 -.067 -.009 -.217 .016 .072 .041 .031 -.118 -.179 -.093 .209 -.084 .010 -.044 -.236 .034 .043 -.244 .015
EC 1 .587** .117 .468** .401** .226 .099 .580** .186 .177 -.235 .072 .099 -.284* .029 .161 .047 -.134 -.525**
TDS 1 .283* .355* .323* .221 .211 .481** .342* .287* -.196 .095 .030 -.129 .051 .092 .111 -.166 -.442**
Cl- 1 .281* .266 .558** .427** .478** .712** .747** -.234 -.201 -.034 .106 .544** .071 .126 -.088 -.401**
SO4- 1 .404** .288* .065 .399** .483** .255 -.301* -.073 .056 -.053 .333* .153 -.008 -.071 -.335*
NO3- 1 .103 -.102 .483** .174 .244 -.145 -.244 -.102 -.023 -.027 .002 -.062 -.288* -.373**
HCO3- 1 .280* .378** .457** .417** -.287* -.076 -.085 .181 .306* .031 .052 -.074 -.342*
Na 1 .362** .421** .630** -.141 -.196 -.097 -.149 .307* -.114 -.057 -.126 -.353*
K 1 .652** .583** -.067 -.094 .026 -.097 .356* .133 .068 -.028 -.723**
Ca 1 .762** -.203 -.152 .022 .106 .688** .123 .108 .009 -.605**
Mg 1 -.242 -.114 -.055 -.018 .695** -.025 .127 -.033 -.468**
Mn 1 .077 .233 .083 -.188 .241 .364** .306* -.002
Fe 1 .104 -.080 -.193 .198 .371** .309* .295*
Cu 1 .205 -.085 .930** .682** .122 -.023
Pb 1 .032 .196 .131 -.128 .069
Zn 1 -.106 .083 .194 -.281
Ni 1 .711** .131 -.111
Cr 1 .363** -.044
Cd 1 .111
As 1
** Correlation is significant at the 0.01 level (2-tailed). * Correlation is significant at the 0.05 level (2-tailed).

193
Table.6.2. Pearson’s correlationship matrix of physio-chemical pairs in Iskoman (Uttar lake and respective stream)
pH EC TDS Cl- SO4- NO3
- HCO3- Na K Ca Mg Mn Fe Cu Pb Zn Ni Cr Cd As
pH 1 .174 .324 -.813** -.320 .036 -.558 .370 -.107 -.410 -.290 .285 .184 .388 -.387 -.702* .366 -.190 -.519 .243
EC 1 .825** -.152 .114 .577 -.361 .056 .245 -.125 -.159 .410 -.209 -.181 -.741* -.413 -.238 -.126 -.735* -.288
TDS 1 -.046 -.091 .711* -.217 .370 .041 -.079 .119 .151 -.412 -.247 -.589 -.462 -.282 -.231 -.764* -.336
Cl- 1 .478 .356 .818** .044 .263 .679* .609 -.565 -.647 -.437 .571 .739* -.393 .094 .291 -.566
SO4- 1 .352 .620 .179 .919** .728* .281 -.221 -.560 -.130 .408 .555 -.113 .140 .117 -.581
NO3- 1 .106 .136 .362 .179 .087 -.138 -.717* -.369 -.080 -.211 -.315 -.423 -.690* -.543
HCO3- 1 .427 .476 .904** .790* -.598 -.651 -.333 .657 .890** -.296 .159 .471 -.632
Na 1 .198 .425 .759* -.427 -.387 -.131 .056 .221 -.210 .130 -.136 -.336
K 1 .707* .109 .103 -.600 -.078 .147 .352 -.018 -.030 .017 -.683*
Ca 1 .634 -.267 -.773* -.134 .453 .793* -.079 .194 .335 -.829**
Mg 1 -.738* -.468 -.354 .397 .691* -.430 .293 .204 -.413
Mn 1 .207 .358 -.682* -.523 .427 -.135 -.147 .005
Fe 1 .265 -.231 -.344 .166 .187 .202 .919**
Cu 1 .129 -.182 .973** .603 .141 .303
Pb 1 .625 .160 .315 .573 -.031
Zn 1 -.197 .416 .623 -.429
Ni 1 .456 .164 .207
Cr 1 .421 .189
Cd 1 .152
As 1
** Correlation is significant at the 0.01 level (2-tailed). * Correlation is significant at the 0.05 level (2-tailed).

194
Table.6.3. Pearson’s correlationship matrix of physio-chemical pairs in Hundrap (Hundrap lake and respective stream).
Correlations
pH EC TDS Cl- SO4- NO3
- HCO3- Na K Ca Mg Mn Fe Cu Pb Zn Ni Cr Cd As
pH 1 .431 -.002 .204 .249 -.078 .478 -.249 -.090 .018 .071 -.081 -.276 -.024 -.032 .074 -.066 .234 -.545 -.111
EC 1 .374 .346 .862** -.158 .779* .532 .542 .330 .488 .210 .211 -.286 .404 .425 .210 .180 -.087 -.446
TDS 1 .549 .403 .823** .344 .584 .884** .712* .761* .511 .621 -.443 .777* .127 .388 .574 .020 -.506
Cl- 1 .700* .430 .053 .537 .705* .957** .889** .787* -.111 -.131 .610 .605 .543 .441 -.253 -.829**
SO4- 1 -.054 .487 .734* .698* .664 .764* .494 -.012 -.261 .479 .730* .333 .217 -.033 -.676*
NO3- 1 -.038 .254 .596 .569 .534 .382 .488 -.204 .607 -.120 .278 .595 -.030 -.213
HCO3- 1 .204 .331 .017 .201 -.210 .397 -.384 .438 -.091 .031 .188 -.331 -.200
Na 1 .869** .652 .825** .406 .221 -.536 .470 .717* .127 .409 .300 -.409
K 1 .839** .926** .605 .467 -.463 .789* .470 .422 .596 .050 -.609
Ca 1 .936** .861** .111 -.183 .709* .558 .608 .513 -.123 -.815**
Mg 1 .668* .121 -.438 .660 .674* .366 .552 -.017 -.709*
Mn 1 .139 .161 .583 .396 .823** .354 -.124 -.791*
Fe 1 -.060 .679* -.479 .430 .423 -.055 -.018
Cu 1 -.093 -.335 .410 -.200 -.128 .202
Pb 1 -.032 .742* .622 -.379 -.602
Zn 1 -.069 .093 .288 -.421
Ni 1 .358 -.431 -.658
Cr 1 -.491 -.169
Cd 1 .278
As 1
** Correlation is significant at the 0.01 level (2-tailed). * Correlation is significant at the 0.05 level (2-tailed).

195
Table.6.4. Pearson’s correlationship matrix of physio-chemical pairs in Khukosh (Baha lake and respective stream).
Correlations
pH EC TDS Cl- SO4- NO3
- HCO3- Na K Ca Mg Mn Fe Cu Pb Zn Ni Cr Cd As
pH 1 .380 .172 -.002 .416 .367 .561 .147 -.025 .120 -.049 .456 -.457 -.104 .057 -.087 .363 .174 .205 -.434
EC 1 .867* -.084 .401 .582 .600 .018 .578 .639 -.008 -.367 -.102 .106 -.361 .147 .669 -.271 -.275 -.652
TDS 1 .108 .153 .326 .641 .216 .684 .725 .231 -.141 -.177 -.057 -.336 .569 .356 .003 -.570 -.646
Cl- 1 -.357 -.407 .528 .977** .629 .494 .984** .252 -.615 -.599 -.476 .414 -.493 .293 .118 -.592
SO4- 1 .928** -.172 -.348 .185 .403 -.442 -.092 -.369 .379 -.116 .025 .904** -.636 -.029 -.214
NO3- 1 -.104 -.404 .274 .460 -.450 -.186 -.312 .604 .017 -.013 .952** -.760* -.253 -.351
HCO3- 1 .675 .511 .475 .592 .168 -.348 -.526 -.405 .275 -.051 .445 .016 -.734
Na 1 .617 .506 .975** .321 -.619 -.683 -.493 .458 -.467 .420 .115 -.635
K 1 .963** .661 -.187 -.574 -.176 -.624 .569 .219 -.259 -.302 -.840*
Ca 1 .514 -.098 -.650 -.108 -.576 .631 .394 -.302 -.355 -.833*
Mg 1 .228 -.545 -.600 -.464 .478 -.527 .350 .006 -.609
Mn 1 -.565 -.139 .475 .401 -.384 .525 -.219 -.104
Fe 1 .096 .124 -.504 -.104 .087 .167 .724
Cu 1 .657 -.293 .476 -.730 -.480 .072
Pb 1 -.221 -.146 -.007 -.400 .339
Zn 1 -.133 .273 -.617 -.370
Ni 1 -.703 -.080 -.257
Cr 1 .134 .162
Cd 1 .251
As 1
** Correlation is significant at the 0.01 level (2-tailed). * Correlation is significant at the 0.05 level (2-tailed).

196
6.6. Health risk assessment
The local people were interviewed in the selected areas for the information
such as living standard, health, economic conditions, dietary habit, and drinking water
resources. It was generally noted that local people were directly using lakes, streams
and springs water for their drinking and domestic purposes without any proper
sanitations system. The main reasons for using such water resources for drinking and
domestic purpose was remoteness, poverty and lack of awareness of local community
in these regions.
Trace and heavy metals like Cr, Cd, Pb, Hg and As have a relatively high
density and are toxic even at low concentrations. These trace and heavy metals are
natural components of the earth crust but to a small extent they entered our bodies
through food, air and drinking water. The trace and heavy metals are considered as
toxic for human health, because in the body they bioaccumulate over the long period
of time and effect body haematopoiesis and can lead to blood disorders. The human
organs such as liver, kidney, circulatory and nervous systems may also be affected
(Marques et al., 2001). For health risk assessment the average daily dose (ADD),
hazard quotient (HQ) and cancer risk (CR) related to the trace and heavy metals (i.e.,
Mn, Fe, Cu, Pb, Zn, Ni, Cr, Cd and As) in the water of lakes and streams of the study
areas (Naltar wetland complex, Uttar, Hundrap and Baha lakes with their respective
streams) were calculated by using an approach set by USEPA (1999). Health risk
assessment is generally based on a quantification of health risk level in relation to two
types of adverse effects such as chronic (noncarcinogenic) and carcinogenic.
Chronically health risk (i.e., ADD and HQ) in water was calculated by using the
approach of USEPA (1999), as follow:

197
HQ = ADD/ RfD
Where HQ mean hazard quotient, ADD, is average daily dose and RfD is
reference dose (mg/kg-day), which differs for different elements.
ADD = C x IR x ED x EF
BW x AT (ED x EF)
Where,
C = Concentration of metal.
IR = Ingestion rate unit /time = 2L
ED = Exposure duration = 67 (Year)
EF = Exposure frequency = 365 (Days)
BW = Body weight = 72 (Average)
AT = Average time (AT= ED x EF)
After the calculation
ADD = C x 0.027
After calculation of ADD, the hazard quotient (HQ) was calculated as:
HQ = ADD/RfD
Carcinogenically health risk will be calculated as:
CR = ADD x Slope Factor
For arsenic (As) Slope Factor was considered as 1.5
The calculated values of ADD, HQ and CR in the water of lakes and streams
of the study area were given in Tables.6.5, 6.6, 6.7 and 6.8.
6.6.1. Average daily dose (ADD)
The calculated values of ADD in the water of Naltar (Naltar wetland complex
and its related streams) (Table.7.5) suggested that, people who have consumed water
contaminated with trace and heavy metals have ADD values for Mn ranged from 0-

198
2.97E-03 mg/kg-day, with an average value of 1.17E-03 mg/kg- day, Fe contaminated
ranged from 0-2.36E-02 mg/kg-day with an average value of 3.07E-03 mg/kg-day, Cu
contaminated ranged from 0-2.26E-03mg/kg-day with an average value of 2.37E-04
mg/kg-day, Pb contaminated ranged from 0-2.85E-04 mg/kg-day with an average
value of 7.17E-05 mg/kg-day, Zn contaminated ranged from 0-1.62E-02 mg/kg-day
with an average value of 1.26E-03 mg/kg-day, Ni contaminated ranged from 0-7.93E-
04 mg/kg-day with an average value of 1.13E-04 mg/kg-day, Cr contaminated ranged
from 1.08E-06-2.26E-04 mg/kg-day with an average value of 4.99E-05 mg/kg-day,
Cd contaminated ranged from 0-1.29E-04 mg/kg-day with an average value of 6.01E-
05 mg/kg-day and As contaminated ranged from 2.05E-05-1.11E-04 mg/kg-day with
an average value of 6.21E-05 mg/kg-day.
The calculated values of ADD in Iskoman (Uttar lake and respective stream)
(Table.7.6) suggested that, people who have consumed water contaminated with trace
metals have ADD values for Mn ranged from 0-8.10E-04 mg/kg-day with an average
value of 3.37E-04 mg/kg-day, Fe contaminated ranged from 0-2.11E-02 mg/kg-day
with an average value of 6.99E-03 mg/kg-day, Cu contaminated ranged from 0-8.47E-
04 mg/kg-day with an average value of 2.28E-04 mg/kg-day, Pb contaminated ranged
from 0-1.79E-04 mg/kg-day with an average value of 5.96E-05 mg/kg-day, Zn
contaminated ranged from 2.21E-04-3.46E-02 mg/kg-day with an average value of
6.93E-03 mg/kg-day, Ni contaminated ranged from 0-4.49E-04 mg/kg-day with an
average value of 1.10E-04 mg/kg-day, Cr contaminated ranged from 1.18E-05-8.20E-
05 mg/kg-day with an average value of 3.80E-05 mg/kg-day. Cd contaminated ranged
from 1.02E-05-1.33E-04 mg/kg-day with an average value of 5.72E-05 mg/kg-day
and As contaminated ranged from 8.64E-06-1.40E-04 mg/kg-day with an average
value of 5.25E-05mg/kg-day.
199
The calculated values of ADD in Hundrap (Hundrap lake and respective
stream) (Table.7.7) indicated that, people who have consumed water contaminated
with Mn the value of ADD ranged from 0-1.08E-03 mg/kg-day with an average value
of 4.20E-04 mg/kg-day, Fe contaminated with ranged from 1.62E-04-1.69E-02
mg/kg-day with an average value of 4.44E-03 mg/kg-day, Cu contaminated ranged
from 4.64E-05-2.22E-04 mg/kg-day with an average value of 1.01E-04 mg/kg-day,
Pb contaminated ranged from 0-1.53E-04 mg/kg-day with an average value of 5.46E-
05 mg/kg-day, Zn contaminated ranged from 4.70E-04-2.50E-02 mg/kg-day with an
average value of 9.76E-03 mg/kg-day, Water consumed Ni contaminated ranged from
0-1.05E-04 mg/kg-day with an average value of 2.64E-05 mg/kg-day, Cr
contaminated ranged from 1.62E-05-6.88E-05 mg/kg-day with an average value of
4.84E-05 mg/kg-day, Cd contaminated ranged from 3.69E-05-1.14E-04 mg/kg-day
with an average value of 7.36E-05 mg/kg-day and As contaminated ranged from
2.10E-05-1.53E-04 mg/kg-day with an average value of 8.04E-05mg/kg-day.
The calculated values of ADD in Khukosh (Baha lake and respective stream)
(Table.7.8) showed that, people who have consumed water contaminated with Mn the
value of ADD ranged from 0-8.10E-04 mg/kg-day with an average value of 5.01E-04
mg/kg-day, Fe contaminated ranged from 0-8.98E-03 mg/kg-day with an average
value of 2.26E-03 mg/kg-day, Cu contaminated ranged from 0-1.19E-04 mg/kg-day
with an average value of 6.11E-05 mg/kg-day, Pb contaminated ranged from 0-1.86E-
04 mg/kg-day with an average value of 3.74E-05 mg/kg-day, Zn contaminated ranged
from 5.27E-04-1.68E-02 mg/kg-day with an average value of 4.60E-03 mg/kg-day, Ni
contaminated ranged from 0-1.27E-04 mg/kg-day with an average value of 2.73E-05
g/kg-day, Cr contaminated ranged from 0-3.51E-05 mg/kg-day with an average value
of 1.99E-05 mg/kg-day, Cd contaminated ranged from 8.10E-06-7.37E-05 mg/kg-day
200
with an average value of 3.74E-05 mg/kg-day and As contaminated ranged from
1.26E-05-1.52E-04 mg/kg-day with an average value of 6.15E-06mg/kg-day.
6.6.2. Hazard quotient (HQ)
The calculated values of HQ in the water of lakes and streams of the study
area (Naltar wetland complex, Uttar, Hundrap and Baha lakes with their respective
streams) were given in the Table.7.5, 7.6, 7.7 and 7.8. The calculated values of HQ in
Naltar wetland complex and their related stream (Table.7.5) indicated that people who
have consumed drinking contaminated with trace and heavy metals had the HQ values
ranged from 0.00-0.02, 0.00-0.03, 0.00-0.06, 0.00-0.07, 0.00-0.05, 0.00-0.03, 0.00-
0.00, 0.00-0.25 and 0.06-0.37 with an average values of 0.00, 0.00, 0.00, 0.01, 0.00,
0.00, 0.00, 0.12 and 0.20 for Mn, Fe, Cu, Pb, Zn, Ni, Cr, Cd and As respectively.
The HQ values in Iskoman (Uttar lake and related streams) (Table.7.6)
indicated that people who have consumed drinking water contaminated with trace and
heavy metals had the HQ values ranged from 0.00-0.00, 0.00-0.03, 0.00-0.02, 0.00-
0.04, 0.00-0.11, 0.00-0.02, 0.00-0.00, 0.02-0.26 and 0.02-0.46 with an average values
of 0.00, 0.00, 0.00, 0.01, 0.02, 0.00, 0.00, 0.11 and 0.17 for Mn, Fe, Cu, Pb, Zn, Ni,
Cr, Cd and As respectively.
The HQ values in Hundrap (Hundrap lake and related streams) (Table.7.7),
indicated that the people who have consumed drinking water contaminated with trace
and heavy metals had the HQ values ranged from 0.00-0.00, 0.00-0.02, 0.00-0.00,
0.00-0.04, 0.00-0.08, 0.00-0.00, 0.00-0.00, 0.07-0.22 and 0.07-0.51 with an average
values of 0.00, 0.00, 0.00, 0.01, 0.03, 0.00, 0.00, 0.14 and 0.26 for Mn, Fe, Cu, Pb,
Zn, Ni, Cr, Cd and As respectively. The HQ values in Khukosh (Baha lake and related
streams), the calculated values of HQ (Table.7.8), indicated that people who have
consumed drinking water contaminated with trace and heavy metals had the HQ
201
values ranged from 0.00-0.00, 0.00-0.01, 0.00-0.00, 0.00-0.05, 0.00-0.05, 0.00-0.00,
0.00-0.00, 0.01-0.14 and 0.04-0.50 with an average values of 0.00, 0.00, 0.00, 0.01,
0.01, 0.00, 0.00, 0.06 and 0.20 for Mn, Fe, Cu, Pb, Zn, Ni, Cr, Cd and As
respectively.
The above calculated values of HQ in the water of lakes and streams of the
study area were compared with the USEPA, 1999 approach in order to assesst the
chronic risk of trace and heavy metals (i.e., Mn, Fe, Cu, Pb, Zn, Ni, Cr, Cd and As),
and it was found that all the trace and heavy metals had the average value HQ <1
except Fe, therefore, these metals have no any chronic health risk in the water of areas
studied.
6.6.3. Cancer risk (CR)
Carsinogenically health risk assessment like cancer risk (CR) for As were
calculated in the water of lakes and stream of the study area (Naltar wetland complex,
Uttar, Hundrap and Baha lakes with their respective streams) which are given in the
Table.7.5, 7.6, 7.7 and 7.8. The values of CR in the study area ranged from 3.07E-05-
1.67E-04, 1.29E-05-2.11E-04, 15E-05-2.30E-04 and 1.90E-05-2.28E-04 with average
values of 9.32E-05, 7.87E-05, 1.20E-04 and 9.23E-05 for Naltar wetland complex
Uttar, Hardpan and Baha lakes with their related streams respectively, which were
vary low (<1per 1,000,000 inhabitants) set by USEPA (1999), therefore As has no
any carcinogenic risk in the water of study area.

202
Table.6.5. Health risk assessment (ADD, HQ and CR) of trace and heavy metals in Naltar (Naltar wetland complex, and their related stream)
*ADD (Average daily dose)
*HQ (Hazard quotient)
* CR (Cancer risk)
*Std dev (Standard deviation)
* ND (Not determined)
Site 1 Naltar (Naltar
wetland complex and its
stream) Mn Fe Cu Pb Zn Ni Cr Cd As
ADD (mg/kg-day)
Range 0-2.97E-03 0-2.36E-02 0-2.26E-03 0-2.85E-04 0-1.62E-02 0-7.93E-04
1.08E-06-
2.26E-04 0-1.29E-04
2.05E-05-
1.11E-04
Average 1.17E-03 3.07E-03 2.37E-04 7.17E-05 1.26E-03 1.13E-04 4.99E-05 6.01E-05 6.21E-05
Std dev 2.84E-04 9.27E-03 3.32E-04 6.71E-05 1.10E-02 1.71E+04 2.25E-05 4.05E-05 4.81E-05
HQ
Range 0.00-0.02 0.00-0.03 0.00-0.06 0.00-0.07 0.00-0.05 0.00-0.03 0.00-0.00 0.00-0.25 0.06-0.37
Average 0.00 0.00 0.00 0.01 0.00 0.00 0.00 0.12 0.20
Std dev 0.00 0.00 0.01 0.02 0.01 0.00 0.00 0.07 0.08
CR
Range ND ND ND ND ND ND ND ND
3.07E-05-
1.67E-04
Average ND ND ND ND ND ND ND ND 9.32E-05
Std dev ND ND ND ND ND ND ND ND 3.82E-05

203
Table.6.6. Health risk assessment (ADD, HQ and CR) of trace and heavy metals in Iskoman (Uttar lake and respective stream)
Site 2 Iskoman (Uttar
lake and its streams) Mn Fe Cu Pb Zn Ni Cr Cd As
ADD (mg/kg-day)
Range 0-8.10E-04 0-2.11E-02 0-8.47E-04 0-1.79E-04
2.21E-04-
3.46E-02 0-4.49E-04
1.18E-05-
8.20E-05
1.02E-05-
1.33E-04
8.64E-06-
1.40E-04
Average 3.37E-04 6.99E-03 2.28E-04 5.96E-05 6.93E-03 1.10E-04 3.80E-05 5.72E-05 5.25E-05
Std dev 2.84E-04 9.27E-03 3.32E-04 6.71E-05 1.10E-02 1.71E-04 2.24E-05 4.05E-05 4.81E-05
HQ
Range 0.00-0.00 0.00-0.03 0.00-0.02 0.00-0.04 0.00-0.11 0.00-0.02 0.00-0.00 0.02-0.26 0.02-0.46
Average 0.00 0.00 0.00 0.01 0.02 0.00 0.00 0.11 0.17
Std dev 0.00 0.00 0.00 0.01 0.03 0.00 0.00 0.08 0.16
CR
Range ND ND ND ND ND ND ND ND
1.29E-05-
2.11E-04
Average ND ND ND ND ND ND ND ND 7.87E-05
Std dev ND ND ND ND ND ND ND ND 7.21E-05
*ADD (Average daily dose)
*HQ (Hazard quotient)
* CR (Cancer risk)
*Std dev (Standard deviation)
* ND (Not determined)
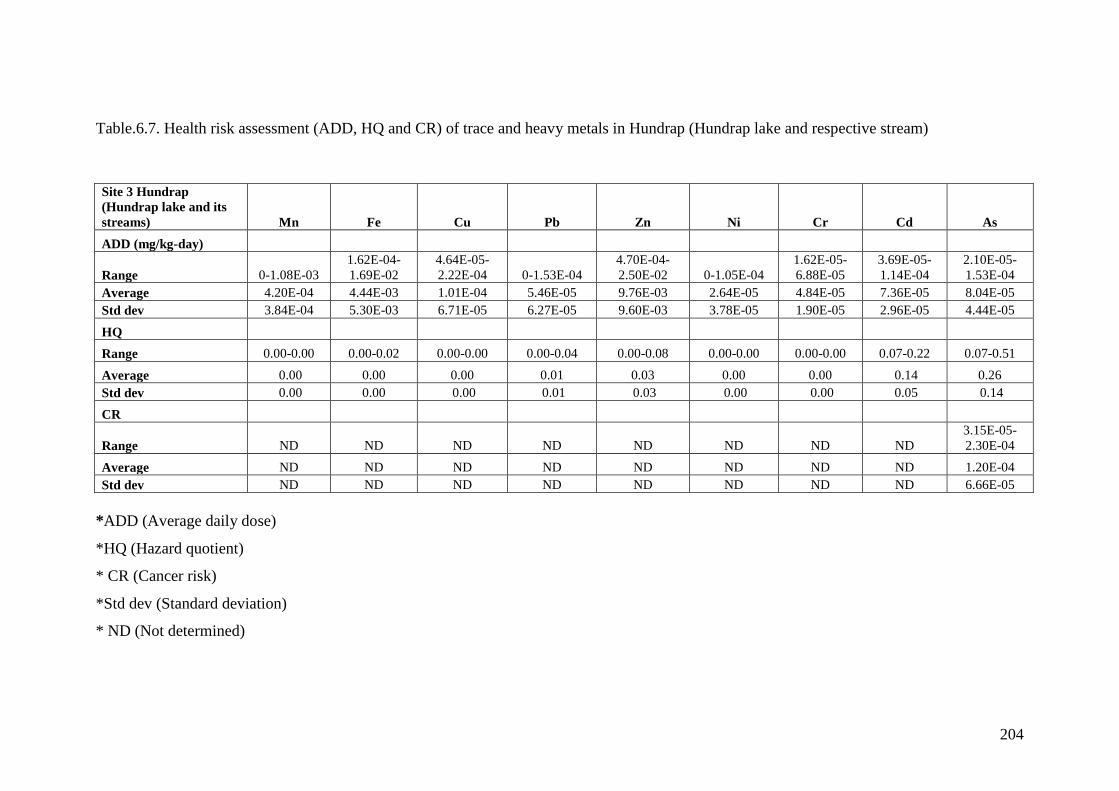
204
Table.6.7. Health risk assessment (ADD, HQ and CR) of trace and heavy metals in Hundrap (Hundrap lake and respective stream)
Site 3 Hundrap
(Hundrap lake and its
streams) Mn Fe Cu Pb Zn Ni Cr Cd As
ADD (mg/kg-day)
Range 0-1.08E-03
1.62E-04-
1.69E-02
4.64E-05-
2.22E-04 0-1.53E-04
4.70E-04-
2.50E-02 0-1.05E-04
1.62E-05-
6.88E-05
3.69E-05-
1.14E-04
2.10E-05-
1.53E-04
Average 4.20E-04 4.44E-03 1.01E-04 5.46E-05 9.76E-03 2.64E-05 4.84E-05 7.36E-05 8.04E-05
Std dev 3.84E-04 5.30E-03 6.71E-05 6.27E-05 9.60E-03 3.78E-05 1.90E-05 2.96E-05 4.44E-05
HQ
Range 0.00-0.00 0.00-0.02 0.00-0.00 0.00-0.04 0.00-0.08 0.00-0.00 0.00-0.00 0.07-0.22 0.07-0.51
Average 0.00 0.00 0.00 0.01 0.03 0.00 0.00 0.14 0.26
Std dev 0.00 0.00 0.00 0.01 0.03 0.00 0.00 0.05 0.14
CR
Range ND ND ND ND ND ND ND ND
3.15E-05-
2.30E-04
Average ND ND ND ND ND ND ND ND 1.20E-04
Std dev ND ND ND ND ND ND ND ND 6.66E-05
*ADD (Average daily dose)
*HQ (Hazard quotient)
* CR (Cancer risk)
*Std dev (Standard deviation)
* ND (Not determined)
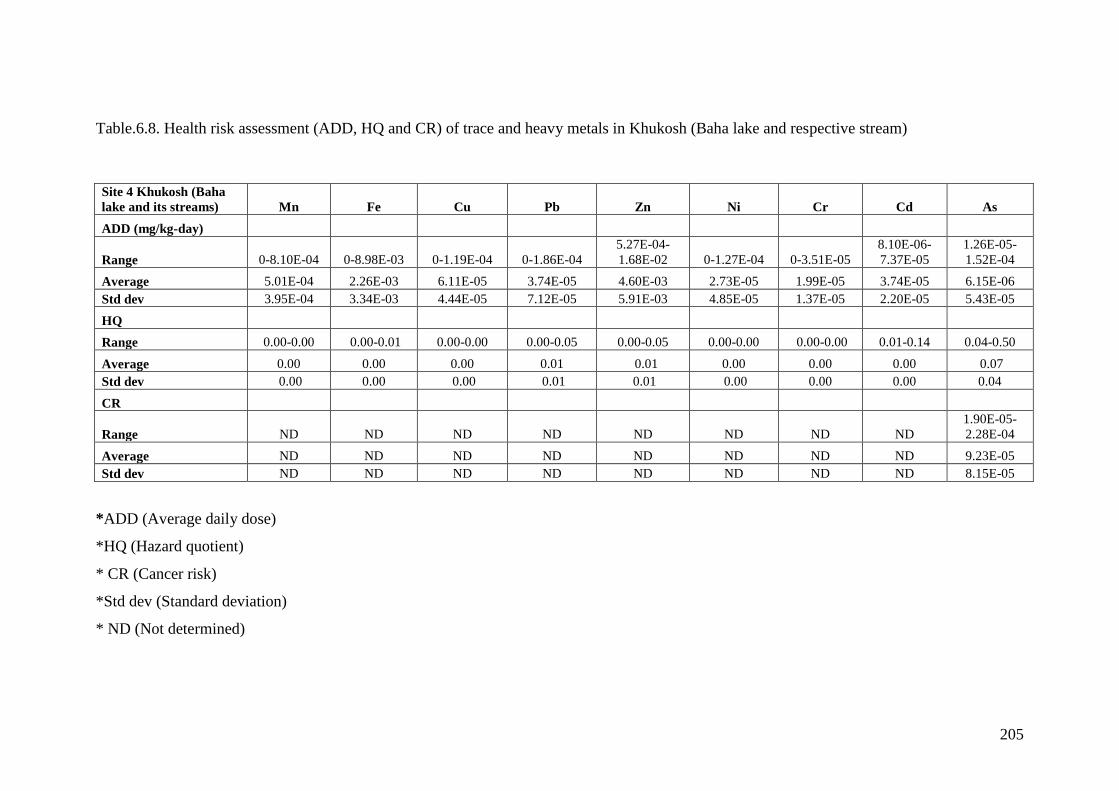
205
Table.6.8. Health risk assessment (ADD, HQ and CR) of trace and heavy metals in Khukosh (Baha lake and respective stream)
Site 4 Khukosh (Baha
lake and its streams) Mn Fe Cu Pb Zn Ni Cr Cd As
ADD (mg/kg-day)
Range 0-8.10E-04 0-8.98E-03 0-1.19E-04 0-1.86E-04
5.27E-04-
1.68E-02 0-1.27E-04 0-3.51E-05
8.10E-06-
7.37E-05
1.26E-05-
1.52E-04
Average 5.01E-04 2.26E-03 6.11E-05 3.74E-05 4.60E-03 2.73E-05 1.99E-05 3.74E-05 6.15E-06
Std dev 3.95E-04 3.34E-03 4.44E-05 7.12E-05 5.91E-03 4.85E-05 1.37E-05 2.20E-05 5.43E-05
HQ
Range 0.00-0.00 0.00-0.01 0.00-0.00 0.00-0.05 0.00-0.05 0.00-0.00 0.00-0.00 0.01-0.14 0.04-0.50
Average 0.00 0.00 0.00 0.01 0.01 0.00 0.00 0.00 0.07
Std dev 0.00 0.00 0.00 0.01 0.01 0.00 0.00 0.00 0.04
CR
Range ND ND ND ND ND ND ND ND
1.90E-05-
2.28E-04
Average ND ND ND ND ND ND ND ND 9.23E-05
Std dev ND ND ND ND ND ND ND ND 8.15E-05
*ADD (Average daily dose)
*HQ (Hazard quotient)
* CR (Cancer risk)
*Std dev (Standard deviation)
* ND (Not determined)

206
CONCULSIONS
The conclusions of the study area are as follows:
The physical parameters such as T, pH, EC, resistivity, TDS, turbidity, and
salinity in the water of the studied lakes and streams (Naltar wetland complex,
Uttar, Hundrap, and Baha lakes with their respective streams), were found
within the permissible limit set by WHO (2008) and USEPA (2009).
The concentrations of anions (Cl-, SO4
-2, NO3
- and HCO3
- ) in all the water
samples of the studied lakes with their relevant streams of the study area were
found within the permissible limit set by WHO (2008) and USEPA (2009),
however, HCO-3 concentration was found above their permissible limit in 5%
of water samples. On the basis of Piper classification scheme the water of the
areas was classified as HCO3 type (i.e., CaHCO3 and NaCaHCO3).
The concentrations of light elements ( Na, K, Ca+2
, Mg+2
) in all the water
samples of studied lakes and streams in the study area were found within the
permissible limit set by WHO (2008).
The concentrations of heavy metals (i.e., Mn, Fe, Cu, Pb, Zn, Ni, Cr, Cd and
As) in all the representative water samples of the studied lakes and their
respective streams of the Gilgit and Ghizar Districts Northern Areas of
Pakistan were found within the permissible limits however, in 5% of the water
samples, the concentration of Mn, Fe and Cd were found slightly higher than
the permissible limits set by WHO (2008).
207
Pearson’s correlation matrixes (Table.6.1, 6.2, 6.3 and 6.4) for Naltar wetland
complex, Uttar, Hundrap and Baha lakes with their respective streams
indicated that most of the physio-chemical parameter pairs have strong
positive (r = > .50) and strong negative(r = > -.50) interrelationships.
Health risk assessments chronical (i.e., ADD and HQ) indices for trace and
heavy metal in the water of lakes and streams of areas studied were calculated
and it was found that the average values of HQ were below 1 which suggested
that no any chronic risk related trace and heavy metals exist in the studied
water. The values of carcinogenic risk (CR) for As in the water showed very
low (<1per 1,000,000 inhabitants) risk. Therefore no any cancer risk in the
water of study area is noted.
The negligible or no contamination from the rocks in the water of the study
area can be attributed to the less contact time for excavenging of toxic metals
in the glacial melting water percolating through the rocks of the area and also
due to the very low temperature which render the dissolution of toxic metals in
the water
As there is no extensive tourism involved in the area, therefore, no
contamination from anthropogenic sources is notice.
This study revealed that the water of high altitude Alpine lakes and related
streams have no any health related risks as for as the physio-chemicals
parameters are concerned.
208
RECOMMENDATIONS
Following recommendations are made to design the framework for water quality
assessment of high altitude alpine lakes in the Northern Areas of Pakistan.
The present study showed no health risk involved with the waters of the
studied lakes and their streams but in future, if these lakes attracted tourists in
the area then the contamination from the anthropogenic source may cause
health related problem in the area. Therefore proper monitoring of the quality
of water from the alpine lakes on regular basis should be carried out
seasonally (i.e., autumn, winter, spring and summer) to assess the
contamination from the anthropogenic and geogenci sources.
A detailed geological study is required to understand the geology of the
surrounding areas and its role in contaminating the water of these lakes.
The community should be encouraged carry out forestation along the feeder
streams to minimize the siltation in these lakes.
A light boat is required for future water quality monitoring programme for
sampling from inside the lakes from a desirable depth to collect representative
samples for analysis.
The present study was concerned with investigation of the phyio-chemical
parameters of lake’s water. However, it is suggested that the biological
parameters should also be determined to get information about
microorganisms in the high altitude lakes.

209
REFRENCES
Ahmad, K. & Shah, S., 2007. Physical and Microbiological Assessment of Drinking
Water of Nomal Valley, Northern Areas, Pakistan. Pak.J. Zool., 39, 367-373.
Alam., 1976. Forest in the Northern Areas, Gilgit Forest Department Northern Areras of
Pakistan.
American Society for Clinical Nutrition, 2000. American Journal of Clinical Nutrition.,
71, 999-1002.
Andrzej, S., Pakula, M., Biniak S. & Walczyk, M., 2004. Influence of the Surface
Chemistry of Modified Activated Carbon on its Electrochemical Behavior in the
presence of Lead (II) ions, Carbon, 42, 3057–3069.
Asian Development Bank.,1986. Economic analysis of the Environmental impact on
Development Projects, the Asian Development Bank, Manila.
Barrento, S., Marques, A., Teixeira, B., Carvalho, M.L.,Vaz-Pires, P., Nunes, M.L, 2009.
Accumulation of elements (S, As, Br, Sr, Cd, Hg, Pb) in two populations of
Cancer pagurus, ecological implications to human consumption, Food and Chem.
Toxic., 47, 150–156.
Bhattacharjee, Y., 2001. Excess iron intake increases risk of intestinal infections. 614,
292-8456; retrieved from http://www.scienceblog.com/community.
Bothwell, T.H., Charlton, R.W., Cook, J.D. & Finch, C.A., 1979. Iron Metabolism in
Man. Blackwell Scientific, Oxford, U.K.

210
Botkin, B.D. & Edward, K.A., 1995. Environmental Earth Science John Wiley and Sons
inc. New York.
Branchu, P., Bergonzini, B.L., Delvaux, D., Batist, D.M., Benedetti, M.G.V. & Klerkx, J.,
2005. Tectonic, climatic and hydrothermal control on sedimentation and water
chemistry of Northern Lake Malawi (Nyasa), Tanzania J. African Earth Sci., 40.
433-446.
Brunsden, D. & Jones, D.K.C., 1984. The Geomorphology of High Magnitude-low
Frequency Events in the Karakuram Mountains. In: Miller, K. (Ed), International
Karakoram Project, 343- 388. Cambridge University Press, Cambridge.
Burbank, D.W., Leland, J., Fielding, E., Anderson, R.S., Brozovoic, N., Reid, M.R. &
Duncan, C., 1996. Bedrock Incision, Rock Uplift and Threshold Hillslopes in the
Northwestern Himalayas. Nature, 53, 218–223.
Burgisser, H.M., Gansser, A. & Pinka, J., 1982. Late glacial lake sediments of the lndus
Valley area, Northwestern Himalayas, Fclogae Geologische Helvetica, 75, 51-63.
Catherine, A. & Neill, O., 2004. Mercury, Risk and Justice. A Center for Progressive,
Regulation White Paper, 405.
Cempel, M. & Nikel, G., 2006. Nickel a Review of Its Sources and Environmental
Toxicology, Polish J. Environ. Stud., 15, 375-382.
Cluney, M.W.R., 1975. Radiometry of Water Turbidity Measurement. Water. Poll. Cont.
Federat., 47. 252-266.
Coleman, J.W. & Gressey, D.R., 1947. Social Problems, Harper and Row. 3rd
Ed,
Unpublished New York.

211
Criddle. J., 1992. The toxicity of Manganese in drinking water. Report FR0313, Marlow,
Foundation for Water Research.
Dani, A.H., 1991. History of Northern Areas of Pakistan, National Institute of Historical
and Cultural Research Islamabad.
Derbyshire, E., Lijijun, Perrott, F. A., XU-Shuying. & Waters, R.S., 1984. Quaternary
Glacial History of the Hunza valley Karakoram Mountains, Pakistan, in: Miller,
K. (Ed). International Karakuram Project, 456-495. Cambridge University Press,
Cambridge,
Dua, V. K., Kumari, R., Johri, K., Ojha, V. P., Shukla, V. P. & Sharma, 1998.
Organochlorine Insecticide Residues in Water from Five Lakes of Nainital (U.P.),
India. Bull. Environ. Contam. Toxicol., 60, 209-215.
Elinder, C.G., 1986. Zinc. In: Friberg, L., Nordberg, G.F. & Vouk, V.B. (Eds). Handbook
on the toxicology of metals, 2nd Ed. Elsevier Science Publishers, Amsterdam,
664-679.
Enger, E.D. & Smith, B.F., 2006. Environmental Science. A study of interrelationships.
10th
Ed, Mc Graw Hill.
Ferguson, R.I., 1984. Sediment Load of the Hunza River, in: Miller, K. (Ed),
International Karakoram Project, 374-382. Cam-bridge University Press,
Cambridge.
Fitzgerald, D.J., 2009. Safety guidelines for copper in water, American Journal of
Clinical Nutrition., 67,1098–1102.

212
Fried, J.J., 1975. Groundwater pollution, Development in Water Science, 4. Elsevier,
330-337.
Gabe, A.A.M., Rahman, A.H.H., Ahmed, A.M. & Fathalla, M.H., 2006. Corrosion
Behavior of Zinc in alcohol-water solvents. Anti-Corrosion Methods and Materi.,
53. 218–223.
Generalized map of the study area retrieved from www.http//commons
Wikimidia.org/wiki/File:KKH.png dated, 23/5/2008.
Goudie, A.S., 1984. Salt Efflorescence and Salt Weathering in the Hunza valley,
Karakoram Mountains, Pakistan. in: Miller, K. (Ed), International Karakoram
Project, 607-615, Cambridge University Press, Cambridg.
Goudie, A.S., Brunsden, D., Collins, D.N., Debyshire, E., Frerguson, R.I., Hashnet, Z.,
Jones, D.K.C., Perrott, F.A., Said, M., Waters, R.S. & Whalley, W.B., 1984. The
Geomorphology of the Hunza valley, Karakoram Mountains, Pakistan. in: Miller,
K. (Ed), International Karakoram Project, 359411. Cambridge University Press,
Cambridg.
Goyer, R.A., 1990. Research Article on Lead toxicity from overt to sub clinical to subtle
health effects, Environ health Perspect. 86, 123-127.
Gray, N., 2008. Drinking water Quality problems and solutions, 2nd
Ed, Cambridge
University New York.
Gunnar, F. & Nordberg. 1974. Health Hazardous Environmental Cadmium Pollution.
Ambio., 3, 55-66.
213
Hashmi, A.A., Shafiuallah. 2003. Agricultural and Food security in Gilgit. Background
Paper, NASED, IUCN Pakistan.
Heaney, R.P & Dowell, M.S., 1994. Absorbability of the calcium in a High-Calcium
mineral water. Oseteoporosis international Euro. Found. Osteo. 4. 323-324.
Hechy, R.E. & Bugenyi, F.W.B., 1992. Hydrology and Chemistry of the Great Lakes and
the Water Quality Issues, Problems and Solutions. Mitt, Inter. Verein. Limnol.,
23. 45-54.
Hechy, R.E. & Ohwayo, O., 1990. Lake Victoria and the Nile perch, A Canadian
Connection. Branta, News letter of fort Whyte Centre, Winnipeg, 8, 1-3.
Hewitt, K., 1968c. The Freeze-thaw Environment of the Karakoram Himalaya, Canadian
Geographer, 85-98.
Hewitt, K., 1988. Catastrophic landslide deposits in the Karakoram Himalaya. Science,
(242), 64-76.
Hussain, Q., 2008. Technical study of Assessment of Production and Market Capacity of
Trout fish in fresh water of District Ghizar, Market Development Section AKRSP
Gilgit.
Impotent Peaks of the Northern Areas, retrieved from the web www.tourism gov.pk/
mountaineering.hmtl. Dated 10/01/2009 at 5:30pm.
Islam, R. Md. P., Lahermo, P., Salminen, R., Rojstaczer, S. & Peuraniemi, V., 2000.
Lake and reservoir water quality affected by metals leaching from Tropical soil,
Bangaladesh, Environ. Geol., 39, 1083-1089.

214
Iturrizaga, L., 2005. Historical Glacier-dammed lakes and outburst floods in the
Karambar valley (Hindukush-Karakuram). Geol. J., 63, 1-47.
James, E. G., 2005. Environmental Chemistry, Jones and Barlett publisher, Inc.
Javied, S., Mehmood, T., Chaudhry, M.M., Tufail M., Irfan N., 2009. Heavy metal
pollution from phosphate rock used for the production of fertilizer in Pakistan,
Miro.Chem. Jourl. 91, 94-99.
Jonathan T., Amos, T. & Karen, A., 1983. Environmental Science. 3rd
Ed, Saunders
College Publishing Philadelphia. New York Chicago.
Khan, A.M., 1996. MS.c Thesis on Environmental Assessment in Uchhali Wetland
Complex, Dist Kushab Province Panjab Pkakistan, Department of Geology
University of Peshawar.
Khan, A.S., Ali, A. & Faizi, M., 2004. Ethnobotanical study of some herbs of Naltar
Valley. Department of chemistry, Karakuram International University Gilgit.
Lijijun, D, E. & Shuying XU., 1984. Glacial and Para glacial Ssediments of the Hunza
valley north-west Karakoram, Pakistan, A preliminary Analysis, in: Miller, K.
(Ed), International Karakoram Project, 496-535. Cambridge University Press,
Cam- bridge.
Manahan, S.E., 2005. Environmental Chemistry. 8th
Ed, CRC Press New youk America.
Manawar, A., 2007. Water Quality Assessment of High Altitude Lakes in Northern Area
Pakistan, WWF-Gilgit Pakistan Unpubl. Report.
Mani, M.S., 1986. Ecology and Biography of high altitude Insects. 1st Ed, Junk N.V.
Publisher Inc.
215
Marchetto, A., Mosello, R., Psenner, R., Bendetta, G., Boggero, A., Tait, D. & Tartari,
G.A., 1995. Factosr Affecting Water Chemistry of Alpine lake. Aquatic Sciences,
57, 1015-1621.
Marques, M.J., Martinez-Coned, E., Rovira, J.V. & Ordonez, S., 2001. Heavy metal
pollution of aquatic ecosystem in the vicinity of a recently closed underground
Lead-Zinc Mine. Environ. Geol, 40, 1125-1137.
Matthew, J., Hoostal, M., Gabriela Bidart-Bouzat, B.G., Juan, L. & Bouzat. 2008. Local
Adaptation of Microbial Communities to Heavy Metal Stress in Polluted
Sediments of Lake Erie. Department of Biological Sciences, Bowling Green State
University, bowling green, online published, NO, DOI:10.1111/j.1574-
6941.2008.00522.x.
Mol., 1991. Pakistan, an official hand book, Islamabad, Ministry of Information, Govt of
Pakistan.
Montgomery, C.W., 2006. Environmental geology 7th
Ed, Mc-Graw Hill, Inc. New York.
Mora, A., Quhae, C.M., Calzadilla, M & nchez, L.S., 2007. Survey of trace metals in
drinking water supplied to rural populations in the eastern Llanos of Venezuela.
Jourl., Enviro., Managt., 90, 752-759.
Mordike, B.L & Ebert, T., 2001. Magnesium Properties, applications and potential.
Matri. Sci.and Engr., 302, 37-45.
Muhammad, S., Shah, M.T. & Khan, S., 2010. Arsenic health risk assessment in drinking
water and source apportionment using multivariate statistical techniques in
Kohistan region, northern Pakistan. Food Chem. Toxicol. 48, 2855-64.
216
Munwar, A., 2007. Water quality Assessment of High Altitude Lakes in Northern Area
Pakistan, WWF-Gilgit Pakistan Unpubl. Report.
Nareyan, B., 2000. Environmental Management. A.P.H. Publishing Corporation, New
Hehli.
Nolett, L.M.L., 2000. Hand book of water analysis. Marcel Dakker Inc.
Northern Areas State of Environmental & Development (NASED), 2003. Govt of
Pakistan and IUCN Pakistan.
Ogutu-ohwayo, O.R., Hocky, E.R., Cohen, S.A. & Kaufman. 1997. Human Impacts on
the African Great Lakes. Environ. Biol. Fishes. Les., 50, 117-131.
Olivares, M., Fernando, P., Hernan, S., Bo, L. & Ricardo, U., 1998. Copper in Infant
Nutrition Safety of World Health Organization, Provisional Guideline Value for
Copper Content of Drinking Water. Pediat. Gastroent. Nutrit., 26, 251-257.
Owen, L. A., 1989c. Neotectonics and Glacial Deformation in the Karakuram Mountains,
Northern Pakistan. Tectonophysics, 163, 227-265.
Pertti, H. & Ziglio, G., 2000. Hydrological and Limnological Aspect. John Wiley and son
LTD Chichester England.
Ponter, C., Ingri, J. & Bostrom, K., 1992. Geochemistry of manganese in the Kalix River.
Northern Sweden. Geochi, Cos. Ac., 65, 1485–1494.
Psenner, R. & Catalan, J., 1994. Chemical composition of lakes in crystalline basins, a
combination of atmospheric deposition, geologic background, biological activity
and human action. In: Margalef, R. (Ed), Limnology Now, a paradigm of
planetary problems. Amsterdam: Elsevier, 255-314.
217
Pual, A., 1988. White, Measurement of Ground-Water Pollution Parameters Using Salt-
Water Injection and Surface Resistivity. Ground Water, 26, 210-214.
Rajvaid, N. & Markanday, D.K., 2005. Environmental analysis and instrumentation.
Publ. A.P.H.Corp. New Delhi.
Ratan, D.K., Bhajan, K.B., Gautam, S., Mandal, K.B., Chakaraborti, D., Roy, S., Jafar,
A., Islam A., Ara, G., Kabir, S., Khan, W., Ahamad, S.A. & Hadi, S.A., 1997.
Groundwater Calamity in Bangladesh Curr. Sci., 73, 48-59.
Reven, P.H., Berg, L.R. & Johnson, G.B., 1993. Environmental Saunders College
Publishing.
Roger, C.M., Alex J. & Moule., 1998. Sodium Hypochlorite and its use as Endodontic
Irrigant. Australian Dental J., 43.
Ronnback, P. & Strom, M., 2007. Hydrochemical pattern of Small Lake and a Stream an
in Uplifting Area Proposed as a Repository Site for Spent Nuclear Fuel,
Forsmark, Sweden. J. Hydro., 344, 223– 235.
Sanpera, C., Ruiz, X., Llorente, G., Jabeen, R., Muhammad, A., Bocnompagni, E. &
Fasola, M., 2003. Persistent Organic Pollutions in little Egret Eggs from Selected
Wetlands in Pakistan. Environ.Contam. Toxicol., 40, 360- 377.
Schenone, N., Volpedo, V.A., Alicia, F. & Cirelli., 2007. Trace metal contents in water
and sediments in Samborombon Bay Wetland, Argentina. Wetland Ecol.
Manage., 15, 303-310.

218
Schwartz, J., Levin R. & Goldstein R., 2000. Drinking water turbidity and
gastrointestinal illness in the Elderly of Philadelphia. Epidem. Comm. Health, 54,
45–51.
Searle, M.P., Khan, M.A., Jan, M.Q., Dipietro, J.A., Pogue, K.R., Pivnik, D.A.,
Sercombe, W.J., Izatt, C.N., Blisniuk, P.M., Treloar, P.J., Gaetani, M. & Zanchi,
A., 1996. Geological Map of the Northern Areas of Pakistan.
Shah, S., Hussain, A., Ahmad, K. & Asar ul Haq., 2007. Determination of selected metals
in drinking water of water purification plants in Gilgit city. Department of Food
Agriculture and Chemical Technology, Karakuram International University
Gilgit. Unpubl.Rport.
Shiller, A.M. & Boyle, E.A., 1987. Variability of dissolved trace metals in the
Mississippi River. Geoch. et Cosmochim. ACTA, 12, 3273-3277.
Shroder, J. F., Owen, L. A. & Derbyshire, E., 1993. Quaternary glaciations of the
Karakuram and Nanga Parbat Himalaya, in: K. (Ed), Himalaya to the Sea,
Geology, Geomorphology and the Quaternary, Routledge, London, 132-1 58.
Singh, T. & Kalra, Y.P., 1975. Specific Conductance Method for in Situ Estimation of
Total Dissolved Solids. Water Works Assoc., 2, 67-99.
Sinyukovich, V.N., 2001. Relationships between Water flow and dissolved solids
discharge in the major Tributaries of Lake Baikal. Water resour., 30, 186-190.
Sinyukovich, V.N., 2003. Relationships between water flow and dissolved solids
discharge in the major Tributaries of Lake Baikal. Water resour., 30, 186-190.

219
Soomro, B., 4004. Paddy and Environmental related Issues, Problem and prospect in
Pakistan. Paddy water Environ., 2, 41-44.
Stumm, W. & Margon, J.J., 1996. Aquatic chemistry. Chemical Eequilibria and Rates in
Natural water. New York Willey.
Sulfate Fact Sheet, 2007. For private water and health regulated public water supplies,
Agri-Food, Govt., Saskatchewan, Canada.
Tartari, G.A., 1995. Factosr affecting water chemistry of alpine lake, Aquatic Sciences,
(57), 1015-1621.
Tiercinlin, J.J., Gibert, E., Umer, M., Bonnefille, R., Disnar, R.J., Lezine, M.A.,
Mazaudier, H.D., Travi, Y., Keravis, D. & Lamb, H.F., 2008. High-Resolution
Sedimentary Record of the last Deglaciation from a high-altitude lake in Ethiopia.
Quarter. Sci. Revi., 27, 449–467.
Trivedi, P.R. & Raj, G, 1992. Water Pollution, Akashdeep Publishing house New Delhi.
UNEP, report. 2004. Health, Dignity and Development, Retrieved on 15th
August 2008,
from htt:\\www.gpa.unep.org\ document.html.
Urish, W.D., 1983.The Practical Application of Surface Electric Resistivity Detection of
Ground Water. Ground Water, 21 463-469.
US. Environmental Protection Agency, 1984. Manual Treatment Techniques from
meeting the interim Primary Drinking Water Regulation. Office of Research
Laboratory. Water Supply Research Division. EPA, 600/8-77-005, Cincinnati,
OH:73.

220
US. Environmental Protection Agency, 2009. Drinking Water Contaminants.
Washington, D.C.
US.EPA, 1999. A Risk Assessment-Multiway exposure spreadsheet calculation tool.
United State Environmental Protection Agency, Washington, D.C.
Virk, A .T., Sheikh, K. & Marwat, A.H., 2003. NASSD Background paper, Biodiversity
Gilgit. NACS Support Project, IUCN Pakistan.
Water Sanitation, Hygiene, and Health Studies Project, 1994. Water Sanitation, Hygiene,
and Health Studies Gilgit, Northern Areas of Pakistan.
Whalley, W. B., Greevy, Mc. 1. P. & Ferguson, R. J., 1984. Rock Temperature
Observation and Chemical Weathering in the Hunza region, Karakoram,
Preliminary data, in: Miller, K. (Ed), International Karakoram Project, 61 6-633.
Cambridge bnivenity Press, Cambridge.
William, P.C., Cunningham, A.M. & Saigo, B., 2005. Environmental Science a Global
Concern. 8th
Ed, McGraw-Hill.
Williams, W.D. & Sherwood, J.E., 1994. Definition and Measurement of Salinity in Salt
Lakes. Inter. J. Salt Lake Res., 3, 53-63.
Winter, D. & Mannheim, I., 2000. Foot Print Pakistan handbook. 2nd
Ed, Foot Print LTD.
World Health Organization (WHO), 1996. Chloride in drinking water: World Health
Organization, Geneva.
World Health Organization, 1981. Drinking water and sanitation, 1989-1990. Away to
health, 1211 Geneva. 27, Switzerland.
221
World Health Organization, 2006. Guideline for drinking water quality. 2rd
Ed, vol.1,
Geneva.
World Health Organization, 2008. Guideline for drinking water quality. 3rd
Ed,vol.1,
Geneva.
WWF-Gilgit Northern Area of Pakistan, 2006. High Altitude Wetland Project, Unpubl
Report.
Yamada, T., Inoue, T., Fukura, H., Nakahara, O., Izuta, T., Suda, R., Takahasi, M., Sase,
H., Takahasi, A., Kobayashi, H., Ohizumi, T. & Hakamata, T., 2007. Long-term
Trends in surface water quality of five lakes in Japan. Water Air Soil Pollut:
Focus, 7, 259-266.

ANNEXURE
Map Gilgit Baltistan (After NASED, 2003).
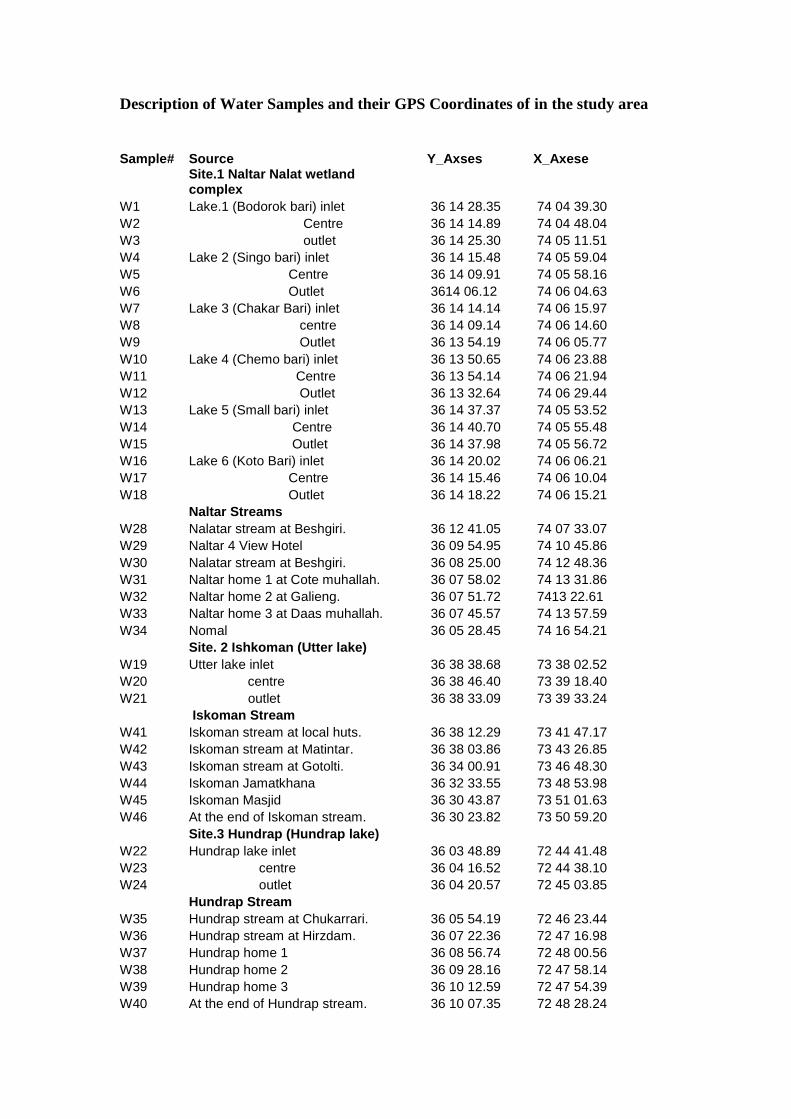
Description of Water Samples and their GPS Coordinates of in the study area
Sample# Source Y_Axses X_Axese
Site.1 Naltar Nalat wetland complex
W1 Lake.1 (Bodorok bari) inlet 36 14 28.35 74 04 39.30
W2 Centre 36 14 14.89 74 04 48.04
W3 outlet 36 14 25.30 74 05 11.51
W4 Lake 2 (Singo bari) inlet 36 14 15.48 74 05 59.04
W5 Centre 36 14 09.91 74 05 58.16
W6 Outlet 3614 06.12 74 06 04.63
W7 Lake 3 (Chakar Bari) inlet 36 14 14.14 74 06 15.97
W8 centre 36 14 09.14 74 06 14.60
W9 Outlet 36 13 54.19 74 06 05.77
W10 Lake 4 (Chemo bari) inlet 36 13 50.65 74 06 23.88
W11 Centre 36 13 54.14 74 06 21.94
W12 Outlet 36 13 32.64 74 06 29.44
W13 Lake 5 (Small bari) inlet 36 14 37.37 74 05 53.52
W14 Centre 36 14 40.70 74 05 55.48
W15 Outlet 36 14 37.98 74 05 56.72
W16 Lake 6 (Koto Bari) inlet 36 14 20.02 74 06 06.21
W17 Centre 36 14 15.46 74 06 10.04
W18 Outlet 36 14 18.22 74 06 15.21
Naltar Streams
W28 Nalatar stream at Beshgiri. 36 12 41.05 74 07 33.07
W29 Naltar 4 View Hotel 36 09 54.95 74 10 45.86
W30 Nalatar stream at Beshgiri. 36 08 25.00 74 12 48.36
W31 Naltar home 1 at Cote muhallah. 36 07 58.02 74 13 31.86
W32 Naltar home 2 at Galieng. 36 07 51.72 7413 22.61
W33 Naltar home 3 at Daas muhallah. 36 07 45.57 74 13 57.59
W34 Nomal 36 05 28.45 74 16 54.21
Site. 2 Ishkoman (Utter lake)
W19 Utter lake inlet 36 38 38.68 73 38 02.52
W20 centre 36 38 46.40 73 39 18.40
W21 outlet 36 38 33.09 73 39 33.24
Iskoman Stream
W41 Iskoman stream at local huts. 36 38 12.29 73 41 47.17
W42 Iskoman stream at Matintar. 36 38 03.86 73 43 26.85
W43 Iskoman stream at Gotolti. 36 34 00.91 73 46 48.30
W44 Iskoman Jamatkhana 36 32 33.55 73 48 53.98
W45 Iskoman Masjid 36 30 43.87 73 51 01.63
W46 At the end of Iskoman stream. 36 30 23.82 73 50 59.20
Site.3 Hundrap (Hundrap lake)
W22 Hundrap lake inlet 36 03 48.89 72 44 41.48
W23 centre 36 04 16.52 72 44 38.10
W24 outlet 36 04 20.57 72 45 03.85
Hundrap Stream
W35 Hundrap stream at Chukarrari. 36 05 54.19 72 46 23.44
W36 Hundrap stream at Hirzdam. 36 07 22.36 72 47 16.98
W37 Hundrap home 1 36 08 56.74 72 48 00.56
W38 Hundrap home 2 36 09 28.16 72 47 58.14
W39 Hundrap home 3 36 10 12.59 72 47 54.39
W40 At the end of Hundrap stream. 36 10 07.35 72 48 28.24

Site.4 Khokus (Baha lake)
W25 Baha lake inlet 35 58 22.63 72 36 02.5
W26 centre 35 59 22.84 72 36 33.00
W27 outlet 36 01 02.71 72 37 23.46
Khukosh Stream
W47 Khokus stream just below the lake 36 0330.64 72 38 18.67
W48 Khokus stream at longe valley. 36 09 37.81 72 41 57.55
W49 Khokus stream below the loner. 36 10 18.07 72 44 39.05
W50 Khukosh stream at Barsad 36 10 32.17 72 47 57.03
Trace elements with their RfD and Slope Factor
Element RfD (mg/kg/day) Slope Factor (Risk/mgkg/day)
Mn .14 Not listed.
Fe 0.07 Not listed.
Cu 0.037 Not listed.
Pb 0.0036 Not listed.
Zn 0.3 Not listed.
Ni .020 Not listed.
Cr 1.5 Not listed.
Cd 0.0005 Not listed.
Hg 0.0003 Not listed.
As 0.0003 1.5

PICTURES
Pic.1. Naltar Valley
Pic.2. Bodorok bari at Naltar.
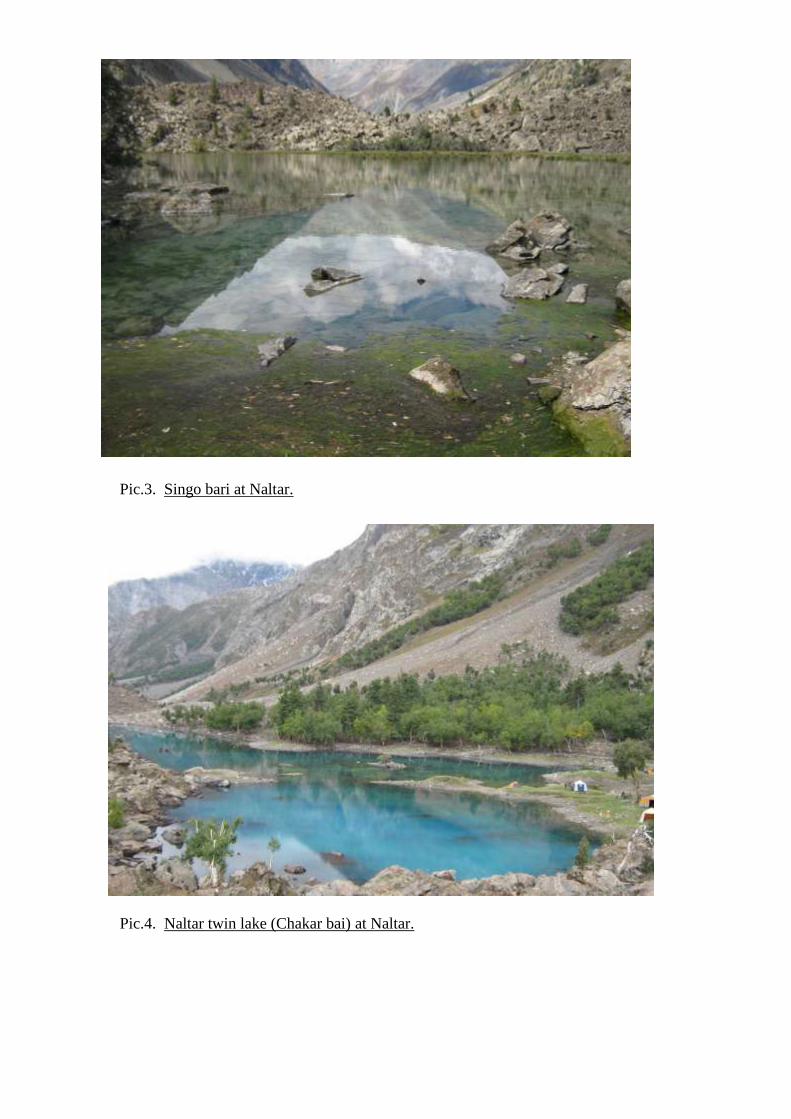
Pic.3. Singo bari at Naltar.
Pic.4. Naltar twin lake (Chakar bai) at Naltar.

Pic.5. Chemo bari at Naltar.
Pic.6. Kotou bari at Naltar .
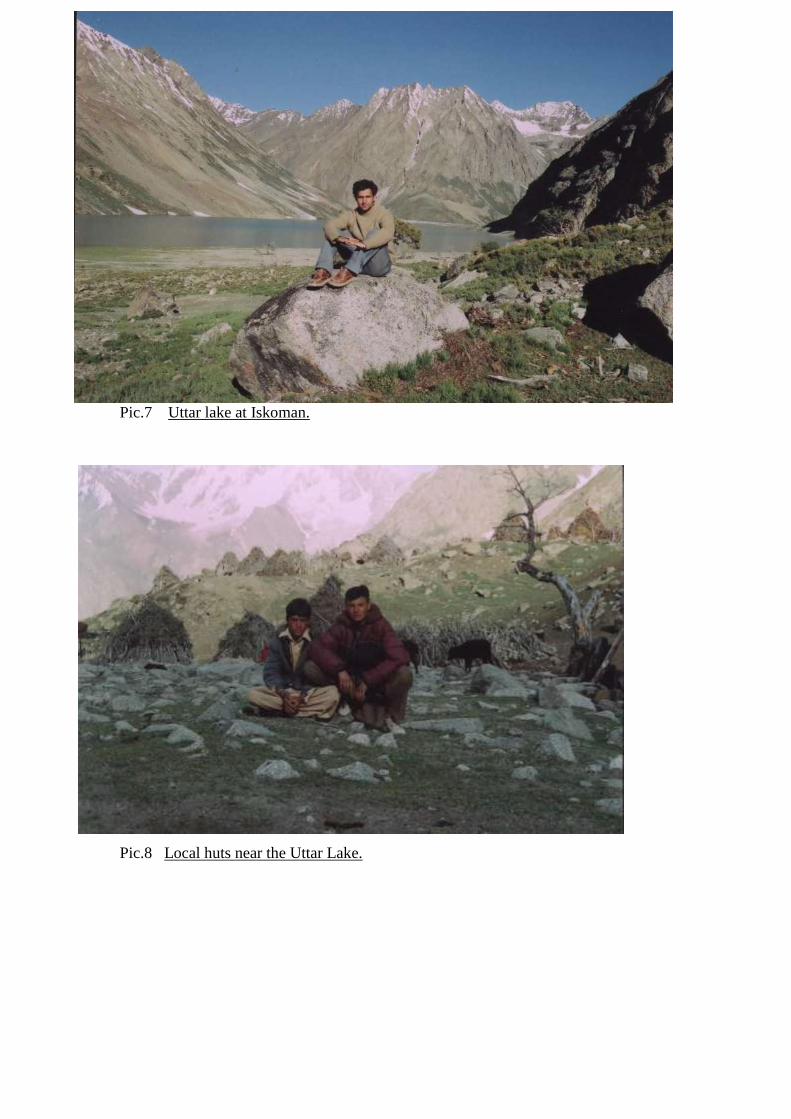
Pic.7 Uttar lake at Iskoman.
Pic.8 Local huts near the Uttar Lake.

Pic.9 Hundrap lake at Hundrap.
Pic.10 Water sampling at Hundrap.

Pic.11 Khukosh nallah.
Pic.12 Baha lake at Khukosh.