thesis performance evaluation of multiple oxidation
TRANSCRIPT

THESIS
PERFORMANCE EVALUATION OF MULTIPLE OXIDATION CATALYSTS ON A
LEAN BURN NATURAL GAS ENGINE
Submitted by
Koushik Badrinarayanan
Department of Mechanical Engineering
In partial fulfillment of the requirements
For the Degree of Master of Science
Colorado State University
Fort Collins, Colorado
Spring 2012
Master’s Committee:
Advisor: Daniel B. Olsen
Anthony Marchese
Michael A. De Miranda

Copyright by Koushik Badrinarayanan 2012
All Rights Reserved

ii
ABSTRACT
PERFORMANCE EVALUATION OF MULTIPLE OXIDATION CATALYSTS ON A
LEAN BURN NATURAL GAS ENGINE
Emission from lean burn natural gas engines used for power generation and gas
compression are major contributors to air pollution. Two-way catalysts or oxidation
catalysts are the common after-treatment systems used on lean burn natural gas engines
to reduce CO, VOCs and formaldehyde emissions. The performance of the oxidation
catalysts is dependent on operating parameters like catalyst temperature and space
velocity. For this study, a part of the exhaust from a Waukesha VGF-18 GL lean burn
natural gas engine was flowed through a catalyst slipstream system to access the
performance of the oxidation catalysts. The slipstream is used to reduce the size of the
catalysts and to allow precise control of temperature and space velocity. Analyzers used
include Rosemount 5-gas emissions bench, Nicolet Fourier Transform Infra-Red
spectrometer and HP 5890 Series II Gas Chromatograph. The oxidation catalysts were
degreened at 1200oF (650
oC) for 24 hours prior to performance testing.
The conversion efficencies for the emission species varied among the oxidation catalysts
tested from different vendors. Therefore, the performance of all the oxidation catalysts is
not the same for this application. Most oxidation catalysts showed over 90% maximum
conversion efficiencies on CO, VOCs and formaldehyde. Saturated hydrocarbons such as
propane were difficult to oxidize in a oxidation catalyst due to high activation energy.
High VOC oxidation was noticed on all catalysts, with maximum conversion efficiency

iii
at 80%. VOC reduction efficiency was limited by propane emission in the exhaust for the
catalyst temperatures tested. Additional formulations need to be developed for oxidation
catalysts to increase VOC reduction efficiency. Oxidation of NO to NO2 was observed
on most oxidation catalysts; this reaction is favored based on chemical equlibrium.
Variation in space velocity showed very little effect on the conversion efficiencies. Most
species showed over 90% conversion efficiency during the space velocity sweep. The
oxidation catalysts showed increasing CH2O conversion efficiency with decreasing space
velocity. No change on performance of the oxidation catalysts on conversion of emission
species was noticed for varying space velocities after conversion efficiencies reached
90%. Thus, adding more catalyst volume may not increase the reduction efficiency of
emission species. Varying cell density showed very little effect on performance of the
oxidation catalysts. The friction factor correlation showed the friction factor is inversely
proportional to cell density.

iv
ACKNOWLEGEMENTS
First and foremost, I would like to thank my academic advisor, Daniel Olsen for his
guidance and support throughout the project. His approach to problems and the ideas he
comes up, proved to be of great help in the study. I also thank my committee members,
Anthony Marchese and Michael A. De Miranda for their support and guidance
throughout the study.
I am thankful to the entire team at the EECL, for their efforts and guidance. I thank my
research engineers, Kirk Evans and Cory Kreutzer for their guidance and help throughout
the project. Their knowledge on the facility at the EECL was instrumental in the study. I
would also like to thank Darryl Beemer, Jason Golly, Adam Friss, Cory DeGroot and
Benjamin Neuner for their help in the study. They were always willing to lend their hands
when needed.
I thank the department head and staff for their support. I thank Karen Mueller, for her
help and support during my time at Colorado State University.
I also would like to acknowledge the sponsors, Pipeline Research Council International
(PRCI) for their support. I thank them for giving me an opportunity to work on this
project. I also would like to thank the catalyst vendors for providing oxidation catalysts
for the study.
Finally, I thank my family and friends for their morale support during the research.
Special thanks to my parents K.S. Badrinarayanan and Uma Badrinarayanan for

v
supporting me throughout my life, providing courage and encouragement. I thank all
those, who supported me.

vi
TABLE OF CONTENTS
1. Introduction ..................................................................................................................... 1
1.1 Emissions .................................................................................................................. 1
1.1.1 CO Emission ....................................................................................................... 1
1.1.2 NOx Emissions .................................................................................................... 3
1.1.3 Hydrocarbon Emissions ...................................................................................... 4
1.2 Emission Standards ................................................................................................... 4
1.3 After-Treatment Systems .......................................................................................... 6
1.3.2 Exhaust Gas Recirculation.................................................................................. 6
1.3.3 Particulate Filters ................................................................................................ 7
1.3.4 Selective Catalytic Reducers .............................................................................. 8
1.3.4 Three - Way Catalytic Converter ........................................................................ 9
1.3.5 Two - Way Catalytic Converters or Oxidation Catalysts ................................... 9
1.4 Oxidation Catalyst Construction ............................................................................. 10
1.5 Catalyst Aging and Degreening .............................................................................. 14
2. Experimentation ............................................................................................................ 17
2.1 Engine Description .................................................................................................. 17
2.2 Catalyst Slipstream .................................................................................................. 19
2.3 Emission Analyzers ................................................................................................. 21
2.3.1 5-Gas Analyzer ................................................................................................. 22

vii
2.3.2 Fourier Transform Infra-Red Spectroscopy (FTIR) ......................................... 24
2.3.3 HP 5890 Series II Gas Chromatograph ............................................................ 25
2.3.4 Varian Gas Chromatograph .............................................................................. 32
2.4 Test Procedure ......................................................................................................... 32
2.4.1 Oxidation Catalyst Preparetion ......................................................................... 32
2.4.2 Test Plan ........................................................................................................... 34
3. Catalyst Temperature Variation .................................................................................... 37
3.1 CO Emission ........................................................................................................... 38
3.2 Formaldehyde Emission .......................................................................................... 41
3.3 Ethylene Emission ................................................................................................... 43
3.4 Propylene Emission ................................................................................................. 44
3.5 Propane Emission .................................................................................................... 46
3.6 VOC Emission......................................................................................................... 48
3.6 NOx Emission .......................................................................................................... 51
4. Space Velocity Variation .............................................................................................. 54
4.1 CO Emission ........................................................................................................... 54
4.2 Formaldehyde Emission .......................................................................................... 56
4.3 Ethylene Emission ................................................................................................... 57
4.4 Propylene Emission ................................................................................................. 58
4.5 Propane Emission .................................................................................................... 60
viii
4.6 VOC Emission......................................................................................................... 61
4.7 NOx Emission .......................................................................................................... 63
4.8 Friction Factor Correlation ...................................................................................... 65
5. Conclusion .................................................................................................................... 69
References ......................................................................................................................... 72

ix
LIST OF FIGURES
FIGURE 1: VARIATION OF EMISSION CONCENTRATION WITH AIR-FUEL RATIO AND
EQUIVALENCE RATIO IN A SPARK IGNITED ENGINE [1]
........................................................... 2
FIGURE 2: STRUCTURE OF CATALYTIC CONVERTER [9]
........................................................ 10
FIGURE 3: EFFECT OF SULPHATING CARRIERS ON METHANE CONVERSION [4]
..................... 14
FIGURE 4: EFFECT OF CATALYST AGING ON CONVERSION EFFICIENCIES ON A PD – BASED
CATALYST [5]
...................................................................................................................... 15
FIGURE 5: EFFECT OF THERMAL AND CHEMICAL AGING ON PT – BASED CATALYST
PERFORMANCE [6]
............................................................................................................... 16
FIGURE 6: WAUKESHA VGF-18 GL WITH DYNAMOMETER ................................................ 17
FIGURE 7: CATALYST SLIPSTREAM SYSTEM ....................................................................... 20
FIGURE 8: SCHEMATIC DIAGRAM OF CATALYST SLIPSTREAM ............................................. 20
FIGURE 9: ROSEMOUNT 5-GAS ANALYZER ......................................................................... 22
FIGURE 10: NICOLET FOURIER TRANSFORM INFRA-RED SPECTROMETER .......................... 24
FIGURE 11: HP 5890 SERIES II GAS CHROMATOGRAPH ..................................................... 25
FIGURE 12: SCHEMATIC DIAGRAM OF HP 5890 SERIES II GC ............................................ 26
FIGURE 13: ACTUATION MECHANISM OF 6-PORT VALVE [21]
............................................... 27
FIGURE 14: GC OVEN TEMPERATURE PROFILE ................................................................... 28
FIGURE 15: GC METHOD TIMETABLE ................................................................................. 28
FIGURE 16: CHROMATOGRAM FOR WET EXHAUST SAMPLE FROM VOC GC ....................... 30
FIGURE 17: CHROMATOGRAM FOR DRY EXHAUST SAMPLE FROM VOC GC ....................... 31
FIGURE 18: PICTURES OF OXIDATION CATALYSTS USED FOR THE STUDY ............................ 33
FIGURE 19: MEASUREMENT OF LIGHT-OFF TEMPERATURE FOR EMISSION SPECIES ............. 37

x
FIGURE 20: VARIATION OF CO CONVERSION EFFICIENCY WITH CATALYST TEMPERATURE 38
FIGURE 21: BRAKE SPECIFIC CO EMISSION VARIATION WITH CATALYST TEMPERATURE .... 40
FIGURE 22: VARIATION OF FORMALDEHYDE CONVERSION EFFICIENCY WITH CATALYST
TEMPERATURE ................................................................................................................... 42
FIGURE 23: VARIATION OF ETHYLENE CONVERSION EFFICIENCY WITH CATALYST
TEMPERATURE ................................................................................................................... 43
FIGURE 24: VARIATION OF PROPYLENE CONVERSION EFFICIENCY WITH CATALYST
TEMPERATURE ................................................................................................................... 45
FIGURE 25: VARIATION OF PROPANE CONVERSION EFFICIENCY WITH CATALYST
TEMPERATURE ................................................................................................................... 47
FIGURE 26: VARIATION OF VOC CONVERSION EFFICIENCY WITH CATALYST TEMPERATURE
........................................................................................................................................... 48
FIGURE 27: BRAKE SPECIFIC VOC EMISSION VARIATION WITH CATALYST TEMPERATURE 50
FIGURE 28: NO2/NOX VARIATION WITH CATALYST TEMPERATURE .................................... 51
FIGURE 29: EQUILIBRIUM CALCULATIONS FOR NO2/NOX RATIO AT VARIOUS
TEMPERATURES [15]
............................................................................................................ 52
FIGURE 30: VARIATION OF CO CONVERSION EFFICIENCY WITH SPACE VELOCITY .............. 55
FIGURE 31: VARIATION OF FORMALDEHYDE CONVERSION EFFICIENCY WITH SPACE
VELOCITY ........................................................................................................................... 56
FIGURE 32: VARIATION OF ETHYLENE CONVERSION EFFICIENCY WITH SPACE VELOCITY ... 58
FIGURE 33: VARIATION OF PROPYLENE CONVERSION EFFICIENCY WITH SPACE VELOCITY . 59
FIGURE 34: VARIATION OF PROPANE CONVERSION EFFICIENCY WITH SPACE VELOCITY ..... 61
FIGURE 35: VARIATION OF VOC CONVERSION EFFICIENCY WITH SPACE VELOCITY ........... 62

xi
FIGURE 36: VARIATION OF NO2/NOX RATIO WITH SPACE VELOCITY .................................. 64
FIGURE 37: VARIATION OF DIFFERENTIAL PRESSURE WITH SPACE VELOCITY ..................... 66
FIGURE 38: VARIATION OF FRICTION FACTOR WITH REYNOLDS NUMBER ........................... 67

xii
LIST OF TABLES
TABLE 1: EMISSION STANDARDS FOR STATIONARY NON-EMERGENCY ENGINES [2] ............. 5
TABLE 2: COMPARISON OF ACTIVE CATALYST MATERIALS ................................................ 13
TABLE 3: ENGINE SPECIFICATIONS OF WAUKESHA VGF-18 GL ........................................ 18
TABLE 4: RESULTS TABLE FOR WET EXHAUST SAMPLE FROM VOC GC ............................. 30
TABLE 5: RESULTS TABLE FOR DRY EXHAUST SAMPLE FROM VOC GC ............................. 31
TABLE 6: CATALYST SPECIFICATIONS ................................................................................ 33
TABLE 7: OXIDATION CATALYST TEST PLAN ...................................................................... 35
TABLE 8: ACTIVATION ENERGY FOR OXIDATION OF HYDROCARBONS [10]
........................... 47
TABLE 9: SUMMARY OF RESULTS FROM THE STUDY ........................................................... 71

1
1. Introduction
1.1 Emissions
Emissions from IC engines are a major source of air pollution. The exhaust of an engine
consists of pollutant emission species like oxides of nitrogen (Nitric oxide (NO) and
small amount of nitrogen dioxide (NO2), collectively known as NOx), carbon monoxide
(CO), carbon dioxide (CO2) and unburnt (or) partially oxidized hydrocarbons. Diesel
engines emit particulate emissions in addition to the above mentioned emission species.
In this study, the focus is on emissions from stationary natural gas engines used for power
generation, compression and other applications.
Air-fuel ratio, also expressed as equivalence ratio (ϕ) is an important factor in
determining the emissions of a SI engine. Aside from racing applications, SI engines
operate at stoichiometric or lean air-fuel ratios. The emissions are significantly lower for
leaner air-fuel ratios. But at very low air-fuel ratios, the combustion quality reduces due
to misfire, increasing CO and hydrocarbon emissions. This creates a need for emission
abatement through after-treatment systems. Oxidation catalysts are an important after-
treatment system, oxidizing hydrocarbons and CO, reducing the harmful emissions in the
engine exhaust. This study was conducted to understand the performance of the oxidation
catalysts under different operating parameters, analyzing their effect on performance.
1.1.1 CO Emission
CO emission from an IC engine is controlled by the air-fuel ratio [1]
. Figure 1 shows, for
rich air-fuel mixtures, CO emission in the exhaust increase rapidly with equivalence ratio,
due to the presence of excess fuel. For lean mixtures, the CO emissions are low and

2
equivalence ratio has very little effect on CO emissions. A SI engine with a three-way
catalyst operates close to stoichiometric conditions, requiring high control over the air-
fuel ratio to control the emissions.
Figure 1: Variation of emission concentration with air-fuel ratio and equivalence ratio in
a spark ignited engine [1]
Equation 1.1 shows the principle reaction steps involved in the formation of CO inside an
engine cylinder. R, in the equation refers to a hydrocarbon radical.
RH→R→RO2→RCHO→RCO→CO (1.1)

3
1.1.2 NOx Emissions
Nitric oxide (NO) and nitrogen dioxide (NO2) are grouped as Nitrogen oxides (NOx).
Nitric oxide is the main constituent of NOx emitted from most IC engines, produced
through the oxidation of nitrogen from the atmospheric air inside the engine cylinder. NO
formations have been studied extensively and the mechanism for oxidation of nitrogen at
near stoichiometric conditions in a spark ignited engine is widely accepted. Figure 1,
presented earlier, shows the trend of NO formation with varying equivalence ratio.
N2 + O → NO + N (1.2)
N + O2 → NO + O (1.3)
N + OH → NO + H (1.4)
Equations 1.2 – 1.4 together are commonly known as the Zeldovich Mechanism and are
the principle reactions in the formation of NO. The NO formation, according to the
mechanism, occurs by the oxidation diatomic nitrogen found in the air inside the
combustion chamber at high temperatures. Rate of formation of NO is a function of
temperature and residence time inside the engine. The reaction requires high engine
temperatures and availability of excess oxygen.
Emitted NO reacts with ammonia and moisture in atmosphere to form nitric acid vapor,
which causes acid rain. NO reacts with Volatile Organic Compounds (VOCs) to form
ground level ozone, causing lung and respiratory issues.

4
1.1.3 Hydrocarbon Emissions
Hydrocarbon emissions from an IC engine are a consequence of partial or incomplete
combustion of the fuel. Hydrocarbon emissions are collectively known as Total
Hydrocarbon (THC) emissions. THC emissions are useful in measuring the inefficiency
of combustion inside the engine cylinder. Engine exhaust consists of various hydrocarbon
compounds, both inert and highly reactive compounds. Non-methane, non-ethane
hydrocarbons are commonly known as Volatile Organic Compounds (VOCs) like
propane. The THC emissions group includes VOC emissions. Fuel composition has a
significant influence in the composition and quantity of THC and VOC emissions.
Flame quenching close to the engine cylinder wall causes a layer of unburned fuel
leading to THC and VOC emission. Fuel trapped in the crevices inside the combustion
chamber is also a source of THC emissions. Incomplete combustion inside a cylinder is a
common source of THC emissions.
THC emission contributes to smog, a major cause for respiratory diseases. Methane
emission, a big contributor to greenhouse effect is difficult to oxidize in the after-
treatment systems. VOC emissions cause harmful long term health defects and are
dangerous to the environment.
1.2 Emission Standards
Emissions from IC engines are a major cause of environmental and human health issues.
Government agencies have developed regulations to control the pollutant emissions from
engine exhaust. Emission performance standards provide threshold limits for emission

5
species. After-treatment systems can be used to reduce pollutant emissions, if they are
above the threshold limit.
Table 1 shows the emission standards for natural gas engines based on the manufacture
date and rated power. For non-emergency SI natural gas engine, the emission standards
are 1 g/hp-hr of NOx, 2 g/hp-hr of CO and 0.7 g/hp-hr of VOC.
Table 1: Emission Standards for stationary non-emergency engines [2]
Environmental Protection Agency (EPA), manages emission standards across North
America. European Union manages the emission standards across Europe. European
emission standards are much more stringent and harder to achieve. Current emission
standard in Europe is Euro 5, effective since 2010.

6
1.3 After-Treatment Systems
Engine design, fuel injection and spark timing have improved the engine performance by
improving efficiency and reducing emissions. These improvements proved insufficient in
meeting many recent emission standards and provide a need for emission after-treatment
systems to reduce pollutant emissions. Various after treatment systems have been
developed to control the emissions and meet the emission standards.
1.3.1 Secondary Air-Injection System
The primitive and simple after-treatment system developed was a secondary injection of
air in to the exhaust stream. The system involved injecting air into the exhaust stream to
oxidize the unburned hydrocarbons and CO. The initial methods injected air at the
exhaust manifold. The re-combustion of exhaust gases caused damage to exhaust
manifold and valves. Another method was to inject downstream of the manifold due to
lower exhaust pressure. The exhaust and air mixture flowed through an oxidation catalyst
to oxidize CO and hydrocarbons. The inefficiency of these systems led to the
development of other exhaust after-treatment systems.
1.3.2 Exhaust Gas Recirculation
Exhaust Gas Recirculation (EGR), is a method of re-injecting exhaust gases into the
engine intake for a complete combustion. Injection of exhaust gases into the engine
cylinders increases the specific heat of the mixture inside the cylinder, reducing the
adiabatic flame temperature. Amount of EGR is dependent on the engine conditions as
higher EGR causes misfiring and partial combustion. In a spark ignited engine, generally
a maximum of 10 to 15% of exhaust is recirculated into the engine [1]
. Typically EGR
7
reduces NOx emissions due to reduced combustion temperatures and reduced throttling
losses. This causes a compromise on engine performance due to higher charge density
inside the cylinder. The recirculation of exhaust can cause clogging at the EGR valves
due to the accumulation of particulate matter, requiring more frequent valve maintenance.
1.3.3 Particulate Filters
Particulate filters are trap oxidizers, which effectively reduces particulate emissions.
Diesel engines are the major application of particulate filters due to high particulate
emissions in the exhaust. The particulate matter is trapped and oxidized on the surface of
the temperature tolerant filter. The flow obstruction caused by these trap oxidizers
increases pressure in the exhaust. The rise in pressure increases steadily as the particulate
matter is accumulated on the trap.
Ignition temperature of the particulate matter is higher than exhaust temperature,
requiring controlled combustion to avoid damage or destruction of the trap. The common
approach on modern diesel engines is the use of regeneration cycle, operating the engine
at rich air-fuel ratio to increase the temperature of the filter to promote oxidation of
particulate matter. This operation occurs when the differential pressure across the filter
reaches a certain threshold limit. An inlet oxidation catalyst is normally employed to
increase NO2 concentration, which oxidizes PM at a lower temperature.
Ceramic monoliths, alumina coated wire mesh, ceramic fiber mat and silica fiber ropes
are the commonly used filters. The application of these filters is depended on the
temperature, efficiency and pressure drop. Regeneration of the trap is also important in
the selection of the filter for the application.
8
1.3.4 Selective Catalytic Reducers
Selective catalytic reducers are used to convert NOx into N2 and water. A reductant is
added to the exhaust stream is absorbed by the catalysts and reduces the NOx to N2 and
water. Anhydrous or aqueous ammonia and urea are some of the reductants used. Urea is
the commonly used reductant due to the toxicity and storage issues of ammonia. The
absorbed ammonia reduces NOx through equations 1.5 to 1.7.
4NO + 4NH3 + O2 → 4N2 + 6H2O (1.5)
2NO2 + 4NH3 + O2 → 3N2 + 6H2O (1.6)
NO + NO2 + 2NH3 → 2N2 + 3H2O (1.7)
When urea is used, it first undergoes thermal decomposition to form ammonia and CO2
as a byproduct, followed by reactions in Equations 1.5 to 1.7. The overall reaction of
urea with NO is shown in Equation 1.8,
4NO + 2(NH2)2CO + O2 → 4N2 + 4H2O + 2CO2 (1.8)
Ceramic substrates like titanium oxide are commonly used as the substrate for these
catalysts in order to tolerate the exhaust temperature and inertness to these reduction
reactions. Vanadium oxides, molybdenum oxides, tungsten oxides, zeolites and oxides of
precious elements are the common active catalyst materials used in the catalyst. Similar
to other after treatment systems, the selection of catalyst material is depended on the
exhaust temperature, inertness and thermal degradation of the catalyst. Contamination of
the active catalyst materials result in reduced life.

9
1.3.4 Three - Way Catalytic Converter
A 3-way catalytic converter converts three major emissions of the engine, oxidizing
reactions of CO and hydrocarbons and reducing reactions of NOx. At an air-fuel ratio
close to stoichiometric, both CO and hydrocarbon oxidation and NO reduction can be
achieved [1]
. The air-fuel ratio range is narrow for high conversion efficiencies of all
compounds in the three way catalysts. The narrow region of operation is beyond the
capabilities of a carburetor. Feedback loops are commonly used in 3-way catalyst
systems to overcome the issue of narrow operation range.
The efficiency of the converter is depended on the exhaust temperature, air-fuel ratio and
volume and type of catalyst material. An oxygen sensor in the exhaust provides signal to
an electronically operated carburetor to control the air-fuel ratio. The ability to oxidize
CO and hydrocarbons and reduce NOx, three way catalytic converters have replaced the
conventional oxidation catalysts, which are still effective on lean burn engines.
1.3.5 Two - Way Catalytic Converters or Oxidation Catalysts
Two way catalytic converters or oxidation catalysts oxidize CO and HCs into CO2 and
water simultaneously. The oxidation catalyst is a common after treatment approach in
most lean burn natural gas engines due to high carbon based emissions. Diesel engines
are also common application for oxidation catalysts for oxidation of CO and
hydrocarbons due to excess oxygen in exhaust. About half the emissions in a natural gas
engine exhaust are unburned hydrocarbons including methane, ethane and partially
oxidized hydrocarbons. About 25% of the exhaust is saturated hydrocarbons, which are
difficult to oxidize. Lean burn engines contain excess oxygen in the exhaust, enabling
easier oxidation of CO and THCs [1]
. The oxidation catalyst enables the reactions in the

10
Equations 1.9 and 1.10 for the oxidation of CO and THC. The rates of these reactions
follow Arrhenius form. Therefore, the reactions are exponentially dependent on catalyst
temperatures. NOx emissions can also have an effect on oxidation of THCs.
2CO + O2 → 2CO2 (1.9)
CxH2x+2 + [(3x+1)/2] O2 → xCO2 + (x+1) H2O (1.10)
1.4 Oxidation Catalyst Construction
The two – way catalytic converter consists of three components, a substrate, wash coat
and active catalyst material. A microscopic view of the structure of catalytic converter is
shown on Figure 2. The figure shows the structure of catalyst substrate and wash coat in
an oxidation catalyst.
Figure 2: Structure of catalytic converter [9]
Catalyst Substrate: A ceramic monolith with a honeycomb structure is a common
substrate used in oxidation catalysts. Metallic substrates are also used in some
applications. Ceramic cores are inexpensive and tolerant to high temperatures. Catalyst

11
substrates are designed to provide a high surface area to support the catalyst wash coat.
The substrate is also designed to avoid excessive pressure drop across the converter.
Wash Coat: A wash coat is a carrier for the active catalyst materials and is used to
disperse the materials over a high surface area. Aluminum oxide, Titanium
dioxide, Silicon dioxide, or a mixture of silica and alumina are common carrier materials
used in oxidation catalyst. The active catalyst materials are suspended in the wash coat
before deposition on the core. Wash coat materials form a rough, irregular surface, which
increases the surface area compared to the smooth surface of the bare substrate. This
maximizes the active surface available for oxidation of CO and THC in the engine
exhaust.
Active Catalyst Material: The catalyst material is most often a precious
metal. Platinum, palladium, rhodium and other precious metals are commonly used active
catalyst material. Cerium, iron, manganese and nickel are also used, although each has its
own limitations.
The catalyst materials are selected based on the abilty to store oxygen. The active catalyst
material oxidizes and stores excess oxygen. It releases the stored oxygen for the oxidation
of CO and THC. The wash coat, consisting of oxides, can also store and release oxygen,
similar to active catalyst material.
Pt – based and Pd – based catalysts have been researched extensively to understand their
performance. Pd – based catalyst show better oxidation activity compared to other active
catalyst metals [4]
. Pt-Pd bimetallic catalysts show excellent activity of THC oxidation [3]
.

12
No (or) very little activity can be seen on NOx emissions on all catalyst materials.
Performance of oxidation catalysts are depended on catalyst temperatures.
The Pt/Pd –based catalyst perform similar to the Pd – based catalyst with good THC
conversion efficiencies. Pt – based catalysts show inefficiency in THC oxidation. THC
conversion efficiencies on Pt/Pd and Pd – based catalyst is near 100% at temperature
range of 350 to 600oC, providing a wider range of operation. Pt – based catalyst material
has maximum conversion efficiency of 80% at 600oC.
Pd - based catalysts are prone to sulpahte posioning. The PdO would form inactive
PdSO4, in the presence of SO2 [3]
, causing deactivation of active catalyst material. Pt –
based catalysts are not sensitive to sulphur poisoning, but are not as active as Pd – based
catalysts in THC oxidation. Figure 4 also shows the effect of poisoning on the
performance oxidation catalysts. Sulphur poisoned and aged catalysts (described later in
the chapter) cause drop in efficiency due to loss of active catalyst material.
The comparison of commonly used active catalyst material is shown in Table 2. Pt –
based catalysts deactivate at a slower rate, but less active on oxidation of CO and
hydrocarbons.

13
Table 2: Comparison of active catalyst materials
Pd – based and Pt/Pd – based catalyst show good conversion efficiencies of CO and
hydrocarbons, but deactivates faster. Pt/Pd – based catalysts are newly developed
compared to other active catalyst material. Extensive research are done to understand the
effect of concentrations of Pt and Pd on performance of these catalysts.
Carrier (or) wash coat also affects the poisoning of active catalyst materials. Sulphating
carriers allow slower deactivation of the catalyst due to sulphur poisoning. Figure 3
shows the effect of sulphating support on the oxidation of methane. Supports like alumina
react with SO2 in the exhaust forming aluminum sulphate.

14
Figure 3: Effect of sulphating carriers on methane conversion [4]
The posisonig of carrier allows slower deactivation of the catalyst. Higher carrier
concentration can also aid in slower deactivation of oxidation catalysts. Carriers like
silicon dioxide and zirconium dioxide are not sensitive to sulphate poisoning, deactivting
the catalyst at a faster rate [3]
.
1.5 Catalyst Aging and Degreening
Long term durability of catalysts is affected by thermal and chemical aging processes.
Thermal aging can cause sintering, decreasing the catalytic activity of the precious metal.
Sintering can also cause destructuring of wash coat, encapsulating active catalyst
material[5]
. Chemical aging process causes blockage of channels, covering active catalyst
materials.
Degreening is the intial drop in efficiency, when a new catalyst is place in the engine
exhaust. Degreening is caused by various parameters, commonly initial sintering and

15
chemical binding. The mechanism is not considered as a aging process and studies are
done to understand the process and developing methods to reduce the drop in efficiency.
Thermal and chemical aging are the major cause for drop in efficiency. Figure 4 and 5
show the effect of aging process on catalyst performance. The rate of drop in efficiency is
affected by the thermal aging temperature as shown in Figure 4. Conversion efficiency of
oxidation catalysts aged at a higher temperature decreases at a faster rate.
Figure 4: Effect of catalyst aging on conversion efficiencies on a Pd – based catalyst [5]
Aging causes efficiency drop at a higher temperature compared to a fresh catalyst as seen
on Figure 4. Thermal aging can also have effects on NOx emissions as seen on Figure 5.

16
Figure 5: Effect of thermal and chemical aging on Pt – based catalyst performance [6]
Chemical aging can be caused by sulphur poisoning and studies are performend to abate
the mechanism. Phosphate posioning and structural changes are also the effects of aging
processes.

17
2. Experimentation
The components for the experimental testing of oxidation catalysts are installed at the
Engines and Energy Conversion Lab (EECL) of Colorado State University. A portion of
the exhaust from the Waukesha VGF-18 GL was used to supply the catalyst slipstream.
Exhaust slipstream system was originally designed and fabricated by Enviro Kinetics, Inc
with some modifications which were done at the EECL. The functiom of the slipstream is
to control the operational parameters of the oxidation catalyst. Emission analyzers were
used to measure the concentrations of emission species.
2.1 Engine Description
Waukesha VGF-18 GL is a 4-stroke stationary lean burn natural gas engine. The engine
has 6 in-line cylinders with a total displacement of 18 litres. Figure 6 shows the
Waukesha VGF-18 GL engine on a test rig at the EECL.
Figure 6: Waukesha VGF-18 GL with dynamometer

18
The bore of the cylinder and the stroke of the piston is 9.35 and 8.5 inches respectively.
The engine operates at the rated load of 300 kW and at a rated speed of 1800 rpm. The
engine specifications are shown in Table 3.
Table 3: Engine Specifications of Waukesha VGF-18 GL
A Garner-Denver screw compressor supplies air to the engine at the desired pressure. In
this study, sea level pressure of 101.3 kPa was supplied, boosted from approximately 84
kPa at the site altitude of 1525 m. A exhaust back pressure valive controls the engine
back pressure to the aire supply. The engine operates on natural gas supplied to the
building. The natural gas supply line includes a propane injection system, allowing
propane concentration in the fuel to be increased. The propane injection was controlled to
maintain 5 to 10 ppm propane concentration in the exhaust. For further details on the
engine specification please review Masters thesis of Kristopher Quillen [12]
.

19
2.2 Catalyst Slipstream
The slipstream system allows engine exhaust to flow through it, enabling control over
catalyst operating parameters for research purposes. The slipstream system consists of a
liquid-gas heat exchanger and flow control valve, enabling control of temperature and
space velocity. Original design by Enviro Kinetics consisted of a gas-gas heat exchanger.
Residence time is an important operational parameter for catalysts. The time spent by the
exhaust inside a catalysts is known as residence time. Residence time is often referred in
the form of space velocity, which is inverse of residence time in units of hr-1
. Slipstream
enables the catalyst operating parameters to be independent of engine parameters.
Figure 7 shows the catalyst slipstream, which was connected to the engine exhaust stream
through stainless steel flexible tubes which were thermally insulated. Figure 8 shows the
schematic diagram of catalyst slipstream system. The engine exhaust is diverted to the
bottom half of the slipstream as shown in Figure 8. The bypass control valve controls the
flow rate through the heat exchanger, allowing control over catalyst temperature. Engine
coolant was pumped into the heat exchanger to control the temperature of the exhaust. A
labview program was developed to control the bypass valve position for a desired catalyst
temperature setpoint.

20
Figure 7: Catalyst slipstream system
The other flow control valve downstream of the heat exchanger was used to control the
entire flow through the system, controlling the space velocity. A secondary control loop
on the labview program controlled the position of the space velocity control valve.
Figure 8: Schematic diagram of catalyst slipstream

21
The flow rate through the system is measured by a orifice flow measurement at the end of
the slipstream. The space velocity was computed using the overall flowrate through the
system and the catalyst envelope volume. The catalyst slipstream consists of two
different catalyst housings, a small (0.152 m x 0.165 m x 0.482 m) housing and a large
(0.152 m x 0.165 m x 1.473 m) housing. The cross section of the housing is slightly
larger than that of the oxidation catalyst. The small catalyst housing was used for the
study, due to the small sized oxidation catalysts. For the measurement of catalyst
temperatures, Omega K-type grounded thermocouples were placed across the catalyst
housing as shown in Figure 9. The thermocouples were grounded for accurate
temperature measurements and toleranance to high exhaust temperatures upto a
maximum of 1650oF (900
oC). The thermocouples were placed within 1 inch of the
catalyst surface for accurate catalyst temperature measurements. A Rosemount
differential pressure transducer with a 0 to 55 inches of water (0 to 0.136 bar) range was
used to measure the pressure drop across the catalyst. The entire system, until the end of
catalyst housing was thermally insulated using fiberglass insulation. Insulation allowed
better control over exhaust temperature and increased maximum catalyst temperature.
For more details on the construction of catalyst slipstream system, review the Masters
thesis of Joshua C. Schmitt [11]
.
2.3 Emission Analyzers
Emission measurement is an important part of the project and three different emission
analyzers were used, specializing in specific emission species.

22
2.3.1 5-Gas Analyzer
The Rosemount 5-gas emission measurement bench has the capability of measuring 5
different emission species. The analyzer measures concentrations of CO, CO2, NOx, THC
and O2. The analyzer uses dry sample to measure these emission species. The exhaust
sample flows through a peltier type condenser which removes water from the exhaust.
Figure 9 shows the Rosemount 5-gas analyzer in the control room at EECL.
Figure 9: Rosemount 5-Gas analyzer
Emission species like CO and CO2 are sensitive to infra-red radiation. These emission
species are excited at certain wavelengths of infra-red radiation. The radiation absorption
profile is used to quantify concentrations of CO and CO2.

23
THC emissions are measured by a Flame Ionization Detector (FID). The detector uses
ions to calculate the THC concentrations. The source of these ions is a small hydrogen-air
flame that pyrolyzes the hydrocarbons in the sample producing positvely charged ions
and electrons. Electrodes with a potential difference are used to detect the ions. The ions
are attracted towards the electrode surface causing flow of current. The measured current
is used to quantify the emission concentration.
The 5-gas analyzer uses chemiluminecense for measurement of NOx in the exhaust
sample. The chemiluminecense method measures the NOx concentration via equations
2.1 to 2.3.
NO2 → NO + 1/2O2 (2.1)
NO + O3 → NO2* + O2 (2.2)
NO2* → NO2 + Photon (2.3)
All NOx species are reduced to NO across the catalysts. The reduced NO passes through a
chamber containing ozone, forming NO2 in an excited state. The NO2 molecules return to
ground NO2 by releasing a photon. The emitted light is measured using a photo diode and
the amount of photons released.
Oxygen concentration in the exhaust is measured based on the magnetic susceptability of
the gas sample. Diatomic oxygen molecules have much higher magnetic susceptability
than other gases in the exhaust. The 5-gas analyzer was connected to a LabView®
program which recorded the data. The analyzer contains a built-in display that shows
measurements real time.

24
2.3.2 Fourier Transform Infra-Red Spectroscopy (FTIR)
Government agencies have described some hydrocarbons as highly toxic. These
hyrocarbons are referred to as Hazardous Air Pollutants (HAPs). Formaldehyde,
acetaldehyde and acrolein are some of the HAPs, requiring accurate measurements due to
their low emission concentrations. Figure 10 shows the FTIR in the control room at the
EECL.
A Nicolet Fourier Transform Infra-Red (FTIR) spectrometer is used for the measurement
of HAPs in the engine exhaust. Similar to CO and CO2 emission measurement in the 5-
gas analyzer, FTIR uses infra-red radiation absorption mechanism to measure HAPs
concentration. FTIR scans the exhaust sample with infra-red radiation at various
wavelengths. It measures the absorption at various wavelengths to determine the
concentrations of various emission species. All polar molecules absorb infra-red radiation
at one (or) more wavelengths.
Figure 10: Nicolet Fourier Transform Infra-Red Spectrometer

25
As shown in Figure10, FTIR uses a heated sample line. Heated sample lines allow wet
measurement of species, preventing water condensation in the line that can absorb
emission species soluble in water.
2.3.3 HP 5890 Series II Gas Chromatograph
Measurement of individual VOCs is important to understand the performance of the
oxidation catalysts. HP 5890 series II GC was used to measure VOCs with low detection
limits, down upto 10 ppb. Figure 11 shows the HP 5890 series II GC in the control room
at the EECL.
Figure 11: HP 5890 Series II Gas Chromatograph
Flame Ionization Detector (FID) was used by the GC to measure VOCs. The working
principle of the detector was explained in previous section 2.3.1. Figure 12 shows the
schematic diagram of GC operation. The flow between calibration gas and exhaust
sample was controlled by a manually actuated 3-way valve. A heated sample line was
used for the sample gas to avoid miscibility of emission species in water. The pressure of

26
the sample inlet was monitered using a pressure gauge. The sample inlet pressure was
regulated by a relief valve at the downstream of the pressure gauge. The flow through the
capillary column is controlled by a 6-port valve. The valve is a 4-way valve as shown in
Figure 14.
Figure 12: Schematic diagram of HP 5890 Series II GC
The 6-port valve controls the flow through the capillary column, which leads to the FID.
The hydrogen and air flow needed to sustain the FID flame are regulated individually. It
is important to regulate them individually to avoid uncontrolled combustion of the fuel.
Figure 13 shows the actuation mechanism of the 6-port valve. The valve is actuated at the
start of the run. At ON position, the valve allows sample gas to flow through the pre-
column into the vent. At OFF position, the valve allows flow of carrier gas to the detector

27
through the pre-column. The valve was actuated from ON to OFF position at the start of
the run. The exhaust sample trapped inside the pre-column is pushed to the detector by
the carrier gas.
Figure 13: Actuation mechanism of 6-port valve [21]
The GC uses a Agilent Plot Q capillary column which was 30 m long and 0.5 mm
diameter. The part number for the column is 19091P-QO4 available at www.agilent.com.
The main function of the capillary column is to separate the emission species
individually. The seperation of emission species is achieved by the oven temperature
profile, based on their molecular weight. The plot Q column was capable of seperating
apolar and polar molecules.

28
Figure 14: GC oven temperature profile
Figure 14 shows the temperature profile of the GC oven. At the start of the run, the
temperature of the oven is maintained at 140oF (60
oC) for 1 minute. The temperature is
then ramped upto 390oF (200
oC) at the rate of 70
oF/min (20
oC/min). The temperature is
maintained at 200oC till the end of the run. Maintaining high oven temperature at the end
burns off any residue in the column and allows fresh sample to enter at the start of next
run.
The GC was controlled and operated on a computer using Clarity software. Figure 15
shows the timetable for GC operation method that was developed on the Clarity software.
The GC operation method was developed on the clarity software based on the
temperature profile.
Figure 15: GC method timetable

29
The exhaust sample injection occurs at the start of the run. Ignition of FID flame and start
of integration are achieved within 30 seconds from start of run. During the run, the clarity
software record the data in the form of chromatograms, which are integrated into
emission concentration.
The GC was operated with wet exhaust samples. Tests conducted on dry samples showed
loss of emission species due to their missibilty in water. Figures 16 and 17 show the wet
and dry sample chromatograms from the GC. Tables 4 and 5 show the results table for
wet sample from the GC. Emission species like ethylene and ethane have low exhaust
concentrations on dry samples, due to their missibility in water.

30
Figure 16: Chromatogram for wet exhaust sample from VOC GC
Table 4: Results table for wet exhaust sample from VOC GC

31
Figure 17: Chromatogram for dry exhaust sample from VOC GC
Table 5: Results table for dry exhaust sample from VOC GC
An Air Dimensions micro sized heated head pump was used to pump the wet exhaust
sample to the GC to maintain the sample flow rate into the GC. The sample inlet pressure
was maintained at 15 psi using the pressure relief valve.

32
2.3.4 Varian Gas Chromatograph
It is necessary to know the fuel composition to calculate the Brake Specific Emissions
(BSE). The Varian micro gas chromatograph was used to measure fuel composition. The
GC uses a thermal conductivity detector for the measurements of hydrocarbons in the
fuel.
The GC consists of a two channel micro sized valve, column and detector, allowing
measurements on small sample quantities in short analysis times (less than 2 minutes).
GC control and species quantification were carried out using Galaxie software.
2.4 Test Procedure
The testing was conducted at the EECL. The slipstream system was connected to the
engine exhaust. A heated sample line was used to flow exhaust to the emissions
analyzers. A manually actuated valve was used to switch between pre-catalyst sample
and post-catalyst sample.
Five different oxidation catalysts were evaluated in the study. Performance of oxidation
catalysts for varying catalyst temperature and space velocity was measured.
2.4.1 Oxidation Catalyst Preparetion
Five commercial catalyst vendors provided oxidation catalysts for performance analysis.
The oxidation catalysts were subject to preparetion processes, enabling comparison
between the catalysts. Degreening of oxidation catalysts is a concept that is not well
understood. Different oxidation catalysts have different degreening rates and
temperatures. It is necessary to degreen the catalysts before analyzing their performance,
ensuring emission destruction efficiencies are stable.

33
Figure 18 shows the images of the oxidation catalysts that were used for the study. All
the oxidation catalysts were degreened at a temperature of 1200oF (650
oC) for 24 hours.
The catalysts were degreened in a kiln at the EECL. Table 6 shows the specifications for
oxidation catalysts tested. The envelope volume or the flow volume varied significantly
among the oxidation catalysts. Significant variations in cell density of the oxidation
catalysts was observed. The catalyst dimensions and specifications were measured for
calculation and analysis purposes.
Figure 18: Pictures of oxidation catalysts used for the study
Table 6: Catalyst specifications

34
Table 7: Catalyst specifications
2.4.2 Test Plan
The oxidation catalysts received from the vendors were tested for the performance under
different operating conditions. The catalysts were degreened and their conversion
efficiencies was measured using the slipstream system. The performance of the oxidation
catalysts were tested for varying exhaust temperature and space velocity.
The activation energy required for oxidation of hydrocarbons in the exhaust is provided
by the heat. Therefore, catalyst temperature is critical in understanding the performance
of the oxidation catalyst. Table 7 shows the test plan for the study used to performe
temperature and space velocity sweep.

35
Table 8: Oxidation catalyst test plan
Pre-catalyst data were recorded before performing the temperature sweep on the
oxidation catalysts. The catalyst temperature was maximized by by-passing the heat
exchanger in the catalyst slipstream system. The exhaust temperature was reduced at a
rate of about 2oF/min. The emissions were continually measured using the analyzers until
minimum exhaust temperature was achieved by the heat exhanger. During the run, the
space velocity was maintained at 150,000 hr-1
. At the end of the temperature sweep, the
pre-catalyst emissions were recorded to confirm stable exhaust conditions.
The other important parameter used for catalyst specification is residence time of the
exhaust. The time spent by the exhaust inside the catalyst module is known as residence
time. Residence time is often shown in the form of space velocity, which is the inverse of
residence time in units of hr-1
. Similar to temperature sweep, the space velocity of the
catalyst was varied from maximum to minimum by the flow control valve in the
slipstream system. The emission analyzers were operated continuously during the sweep.
The exhaust temperature during the run was maintained at 550oF. The performance of the

36
oxidation catalysts during temperature and space velocity sweep is are discussed in the
following chapters.

37
3. Catalyst Temperature Variation
The catalyst performance is significantly affected by catalyst temperature. Generally, the
reaction rate across the catalyst follows Arrhenius form, exponentially increasing with
temperature. The activation energy required for oxidation of CO and hydrocarbons is
reduced by activation sites in the catalyst. Figure 19 shows the variation in concentration
and conversion efficiency of CO for catalyst A.
Figure 19: Measurement of light-off temperature for emission species
The conversion efficiency of emission species were measured using the formula shown in
Equation 3.1.
- -
- (3.1)

38
The performance of the oxidation is often referred in terms of light-off temperature.
Light-off temperature is defined as the temperature at which the conversion efficiency of
an emission species decreases to 50% [14]
. As shown in Figure 19, 50% of maximum
conversion efficiency for CO in catalyst A was 46%. The light off temperature for
oxidation of CO on catalyst A was 410oF (770
oC).
3.1 CO Emission
As discussed earlier, CO emission is the major component in lean burn natural gas engine
exhaust. The CO emission abatement is critical to meet the emission standards. Figure 20
shows the performance of the oxidation catalysts on CO conversion.
Figure 20: Variation of CO conversion efficiency with catalyst temperature
39
Pre-catalyst CO emission was measured at 333 ppm by the 5-gas analyzer. Most catalysts
showed CO conversion efficiencies sbove 90% at temperatures greater than 500oF
(260oC). Catalyst A showed a maximum conversion efficiency of 94%. The conversion
efficiency of catalyst A began to decrease rapidly below a catalyst temperature of 500oF
(260oC). Light-off temperature for CO conversion on catalyst A was 417
oF (214
oC).
Similar performance was noticed on catalyst B, with a maximum conversion efficiency of
95%. The light-off temperature for CO conversion on catalyst B was 410oF (210
oC).
Catalyst C showed low CO conversion efficiencies. Catalyst C achieved a maximum CO
conversion efficiency of 30%. At low catalyst temperatures, catalyst C showed no
oxidation of CO. Both catalysts D and E achieved over 95% maximum conversion
efficiency. The efficiencies began to decrease at 420oF (215.5
oC) for catalyst D and at
400oF (204.5
oC) for catalyst E. The conversion efficiency of both the catalysts did not
decrease below 50% conversion efficiency at the lowest catalyst temperature achieved.
Therefore, the light-off temperatures for catalysts D and E are 370oF (182
oC) and below
360oF (182
oC) respectively. The light-off temperature indicates the range of
temperatures, at which the catalyst can be operated. For a catalyst with lower light-off
temperature, it can be operated at a wider temperature range with maximum conversion
efficiency.
Environmental Protection Agency have released National Emission Standards for HAPs
emission (NESHAP)[13]
. According to the standard, the post-catalyst emission of CO has
to be equal to (or) less than 7% of pre-catalyst emission. Therefore, it is important to
know the catalyst temperature at which the conversion efficiency drops to 93%.
40
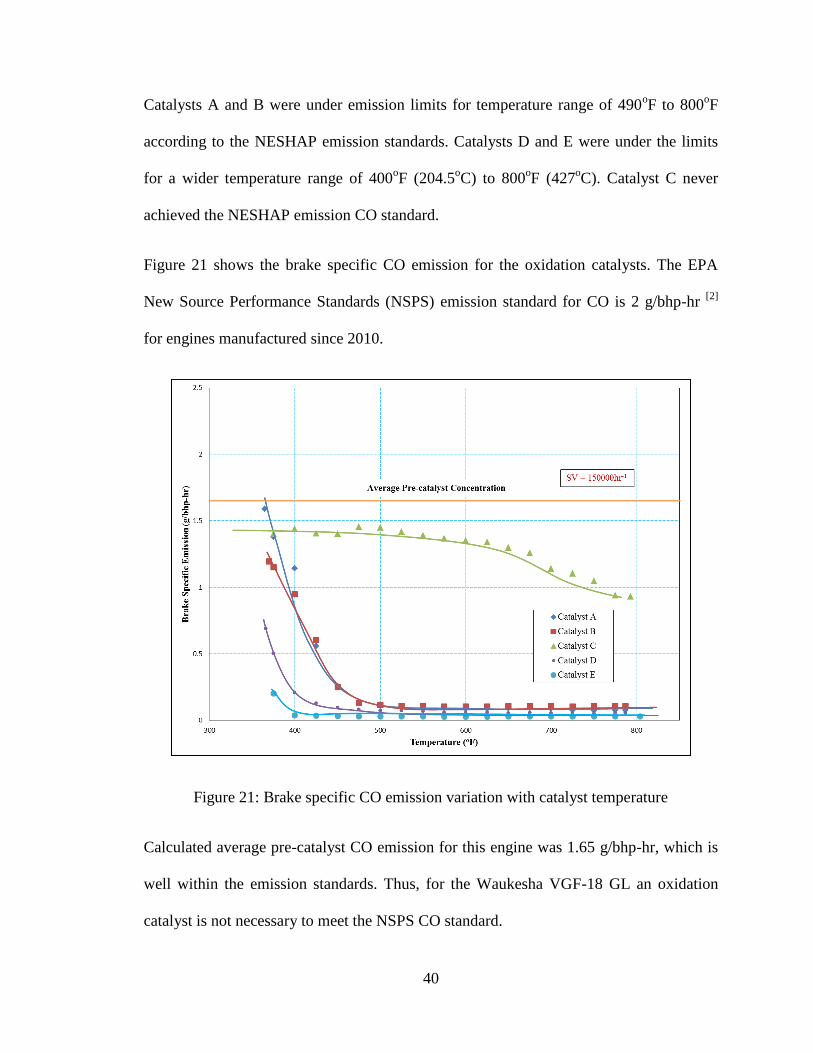
Catalysts A and B were under emission limits for temperature range of 490oF to 800
oF
according to the NESHAP emission standards. Catalysts D and E were under the limits
for a wider temperature range of 400oF (204.5
oC) to 800
oF (427
oC). Catalyst C never
achieved the NESHAP emission CO standard.
Figure 21 shows the brake specific CO emission for the oxidation catalysts. The EPA
New Source Performance Standards (NSPS) emission standard for CO is 2 g/bhp-hr [2]
for engines manufactured since 2010.
Figure 21: Brake specific CO emission variation with catalyst temperature
Calculated average pre-catalyst CO emission for this engine was 1.65 g/bhp-hr, which is
well within the emission standards. Thus, for the Waukesha VGF-18 GL an oxidation
catalyst is not necessary to meet the NSPS CO standard.

41
At low catalyst temperatures, the brake specific CO emission increased rapidly for most
oxidation catalysts, but was well within emission limits. Catalyst C had higher brake
specific emissions compared to the other oxidation catalysts throughout the tempreature
sweep. Catalyst E had very low brake specific CO emission with a maximum brake
specific emission of 0.25 g/bhp-hr.
California Code of Regulations released CARB 2006 emission standard for the state of
California. The limit for CO emission is 0.034 g/bhp-hr for the state of California[19]
.
Catalyst A and B were slightly above the CARB 2006 emission standard. Catalyst D met
the CARB 2006 emission standard for a catalyst temperature range of 800oF (427
oC). to
500oF (260
oC). Catalyst E was within the emission limit for catalyst temperatures above
400oF (204.5
oC).
3.2 Formaldehyde Emission
Formaldehyde (CH2O) is a component of HAPs emitted by the engine exhaust. CH2O
emission constitute to over 50% of the total HAPs emission. Figure 22 illustrates the
performance of the oxidation catalysts on CH2O abatement. Average pre-catalyst CH2O
emission was measured at 34 ppm by the FTIR.
Four of the five oxidation catalysts showed over 90% maximum CH2O conversion
efficiency. Catalyst A had a maximum conversion efficiency of 96%. The conversion
efficiency of catalyst A decreased rapidly from the maximum catalyst temperature. Light-
off temperature for CH2O conversion on catalyst A was 565oF (296
oC). Comparitively,
better performance was noticed on catalyst B, with a maximum conversion efficiency of
93%. The light-off temperature for CH2O conversion on catalyst B was 490oF (254.5
oC).

42
On catalyst B, the CH2O conversion efficiency began to decrease rapidly at 600oF
(315.5oC). Catalyst C showed no CH2O conversion. Catalyst D and catalyst E showed
good activity in CH2O oxidation, oxidizing over 90% of CH2O emission. Catalyst E
achieved over 95% maximum CH2O conversion efficiency. Catalyst D had a maximum
conversion efficiency of 93%. The light-off tempreature for catalyst E was 490oF
(254oC). Catalyst E had a light-off temperature which was below 360
oF (182
oC).
Figure 22: Variation of formaldehyde conversion efficiency with catalyst temperature
The conversion efficiencies decreased at 500oF (260
oC) for catalyst D and at 400
oF
(204.5oC) for catalyst E. The conversion efficiency of catalyst E did not decrease below
50% at the lowest catalyst temperature achieved. Catalyst E achieved a minimum CH2O

43
conversion efficiency of 65%. Catalyst E converted over 90% of CH2O at a catalyst
temperature of 400oF (204.5
oC).
3.3 Ethylene Emission
Ethylene (C2H4) emission is part of the VOC emission from the engine exhaust. VOCs
are non-methane, non-ethane, non-formaldehyde hydrocarbons. Figure 23 shows the
performance of the oxidation catalysts on C2H4 conversion. The average pre-catalyst
C2H4 emission was measured to be 23 ppm by the FTIR.
Figure 23: Variation of ethylene conversion efficiency with catalyst temperature
Three oxidation catalysts showed good C2H4 conversion efficiencies. Catalyst A had a
maximum conversion efficiency of 93%. Light-off temperature for C2H4 conversion on

44
catalyst A was 550oF (288
oC). The conversion efficiency of catalyst A began to decrease
rapidly with decrease in catalyst temperature. Catalyst B had a maximum conversion
efficiency of 92%. The light-off temperature for C2H4 conversion on catalyst B was
480oF (249
oC). On catalyst B, the C2H4 conversion efficiency began to decrease at 550
oF
(288oC). Catalyst C showed linear trend in C2H4 conversion. Catalyst C showed a
maximum C2H4 conversion efficiency of 40% and decreased to 10% during the
temperature sweep. Catalyst D showed over 90% C2H4 conversion efficiency for
temperatures greater than 500oF (260
oC). Light-off temperature for catalyst D was 390
oF
(199oC), with a maximum conversion efficiency of 95%. The efficiency of catalyst D
decreased rapidly at 450oF (232.2
oC) catalyst temperature. Catalyst E achieved 98%
maximum C2H4 conversion efficiency. The light-off tempreature for catalyst E was below
360oF (182.2
oC), since it achieved a minimum conversion efficiency of 67%. The
efficiency curve shows catalyst E had over 90% conversion efficiency until the catalyst
temperature reached 400oF (204.5
oC).
Catalyst C data showed scatter of data points due to ethane fluctuations in the fuel. Fuel
ethane concentrations affected ethylene concentrations in the exhaust only on catalyst C.
This phenomenon was not experienced in the tests on other oxidation catalysts.
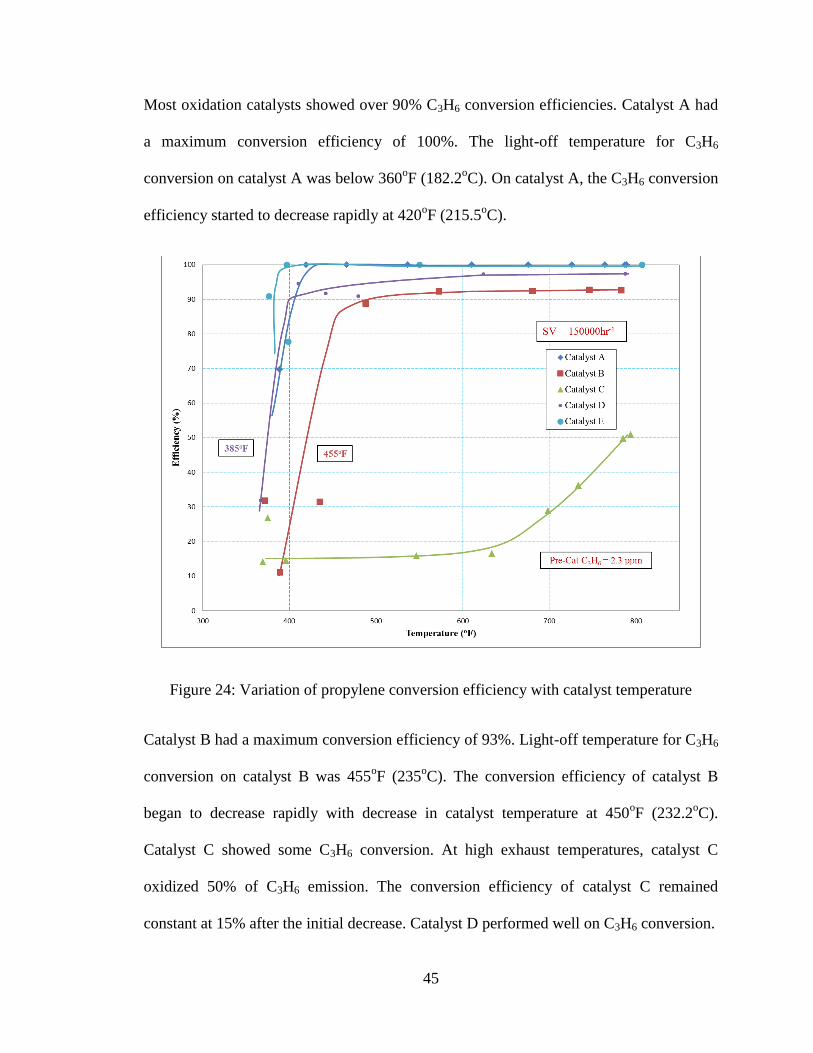
3.4 Propylene Emission
Propylene (C3H6) emission is also a component of the VOC emission. Figure 24 shows
the performance of the oxidation catalysts on C3H6 conversion. Pre-catalyst C3H6
emission was measured to be 2.3 ppm by the HP 5890 Series II GC.
45
Most oxidation catalysts showed over 90% C3H6 conversion efficiencies. Catalyst A had
a maximum conversion efficiency of 100%. The light-off temperature for C3H6
conversion on catalyst A was below 360oF (182.2
oC). On catalyst A, the C3H6 conversion
efficiency started to decrease rapidly at 420oF (215.5
oC).
Figure 24: Variation of propylene conversion efficiency with catalyst temperature
Catalyst B had a maximum conversion efficiency of 93%. Light-off temperature for C3H6
conversion on catalyst B was 455oF (235
oC). The conversion efficiency of catalyst B
began to decrease rapidly with decrease in catalyst temperature at 450oF (232.2
oC).
Catalyst C showed some C3H6 conversion. At high exhaust temperatures, catalyst C
oxidized 50% of C3H6 emission. The conversion efficiency of catalyst C remained
constant at 15% after the initial decrease. Catalyst D performed well on C3H6 conversion.

46
Catalyst D had a light-off temperature of 385oF (196
oC), with a maximum conversion
efficiency of 97%. The efficiency of catalyst D decreased rapidly at 400oF (204.5
oC)
exhaust temperature. Catalyst E achieved 100% C3H6 conversion efficiency almost the
entire temperature sweep. The efficiency decreased at temperatures below 400oF
(204.5oC). The light-off tempreature for catalyst E was below 360
oF (182.2
oC), since it
achieved a minimum conversion efficiency of 78%.
3.5 Propane Emission
Propane (C3H8) emission is the main component of VOC emission from the engine
exhaust. VOC emissions are normally characterized by the propane concentrations in the
exhaust. Figure 25 show the performance of the oxidation catalysts on C3H8 conversion.
Pre-catalyst C3H8 emission was measured to be 8.0 ppm by the HP 5890 Series II GC.
Low C3H8 conversion was noticed on all catalysts. Catalysts A and B showed some
amount of C3H8 oxidation at high catalyst temperatures. At low catalyst temperatures,
scatter of data points were noticed due to the fluctuation in propane concentration in the
fuel. Catalysts D and E showed conversion efficiency decrease linearly with catalyst
temperature. Catalyst A had a maximum conversion efficiency of 46%, while catalyt B
showed a maximum of 63% C3H8 conversion. Table 8 shows the activation of
hydrocarbons.

47
Figure 25: Variation of propane conversion efficiency with catalyst temperature
Table 9: Activation energy for oxidation of hydrocarbons [10]
Hydrocarbon Pre-exponential
term
(cm sec-1
)
Activation energy
(kcal mole-1
)
C2H6 2.8*1010
27.3
C3H8 1.1*1010
17.0
C4H10 3.3*1010
17.0
iso-C4H10 4.6*1010
10.2
Catalyst C showed no activity on C3H8 conversion. As mentioned earlier, saturated
hydrocarbons are difficult to oxidize due to high activation energy. The table also shows

48
the activation energy decreases with increase in molecular weight. Due to the high
activation energy for oxidation of C3H8, it is difficult to oxidize.
3.6 VOC Emission
The total VOC emissions was measured by the HP 5890 series II GC. VOCs for the study
included species like ethylene, propylene, propane, 1-butene, n-butane, n-pentane and n-
hexane. Figure 26 shows the performance of the oxidation catalysts in the conversion of
the VOCs. The pre-catalyst concentration of VOCs was measured to be 33 ppm.
Figure 26: Variation of VOC conversion efficiency with catalyst temperature
Most oxidation catalysts showed good performance on VOC conversion. All the
oxidation catalysts showed lower maximum conversion efficiency. This is due to low

49
conversion efficiencies in C3H8 oxidation. Maximum VOC comversion efficiency
achieved by most oxidattion catalysts was around 80%. Catalyst A had maximum VOC
conversion efficiency of 88%. The efficiency decreased at linearly until the catalyst
temperature reached 450oF (232.2
oC). Below 450
oF (232.2
oC), the efficiency decreased at
a rapid rate. Catalyst B showed similar trend in VOC conversion with a mazimum
conversion efficiency of 86%. Catalyst C showed very little activity on VOC conversion
with a maximum conversion efficiency of 22%. The conversion efficiency was steady at
around 15% for catalyst C throughout the temperature sweep after the initial decrease in
efficiency. Catalysts D and E showed similar trend to catalyst A and B with linear
decrease in efficiency. The conversion efficiency decreased linearly with catalyst
temperature till 420oF (215.5
oC), when the efficiency decreased at a rapid rate.
The heavier hydrocarbons such as butane and higher hydrocarbons were completely
oxidized by all the oxidation catalysts. As mentioned in the previous section, the
activation energy and autoignition temperature for oxidation decreases with increase in
molecular weight. Therefore, all higher hydrocarbons were completely oxidized.
Figure 27 shows the brake specific VOC emission variation with catalyst temperature.
Average pre-catalyst brake specific VOC emission was measured to be 0.13 g/bhp-hr.
EPA NSPS emission standard states the emission limit for VOCs is 1.0 g/bhp-hr [2]
. The
pre-catalyst VOC emission was well below the emission limit. The VOC emissions on
most oxidation catalysts were well lower than the pre-catalyst emissions. Emission on
most catalysts was less than 4% of emission limit at high catalyst temperatures. At 400oF
(204.5oC), the VOC emissions began to increase to 10% of the limit at a rapid rate. VOC

50
emissions from catalyst C was around 0.12 g/bhp-hr during the temperature sweep. No
significant conversion of VOCs was noticed on catalyst C.
Figure 27: Brake Specific VOC emission variation with catalyst temperature
CARB 2006 emission limit for VOC emission is 0.007 g/bhp-hr [19]
. The VOC emission
from the oxidation catalysts was more than the CARB 2006 emission standard. The low
conversion efficiency of C3H8 on all the oxidation catalysts increasing the brake specific
VOC emission. Therfore, all the oxidation catalysts did not achieve the CARB 2006
VOC emission standard.

51
3.6 NOx Emission
Previous research on oxidation catalysts have shown no or very little activity on NOx
abatement. But, it is important to understand the activity of NOx in a oxidation catalysts.
Figure 28 shows the NO2/NOx variation with catalyst temperature. Pre-catalyst NO2/NOx
was 0.16. Catalyst A, B and D showed similar trends in NO2/NOx variation during the
temperature sweep. The NO2/NOx ratio increased with increase in catalyst temperature.
Catalyst D showed increase in NO2 concentration in NOx till the catalyst temperature
reached 600oF (315.5
oC).
Figure 28: NO2/NOx variation with catalyst temperature
52
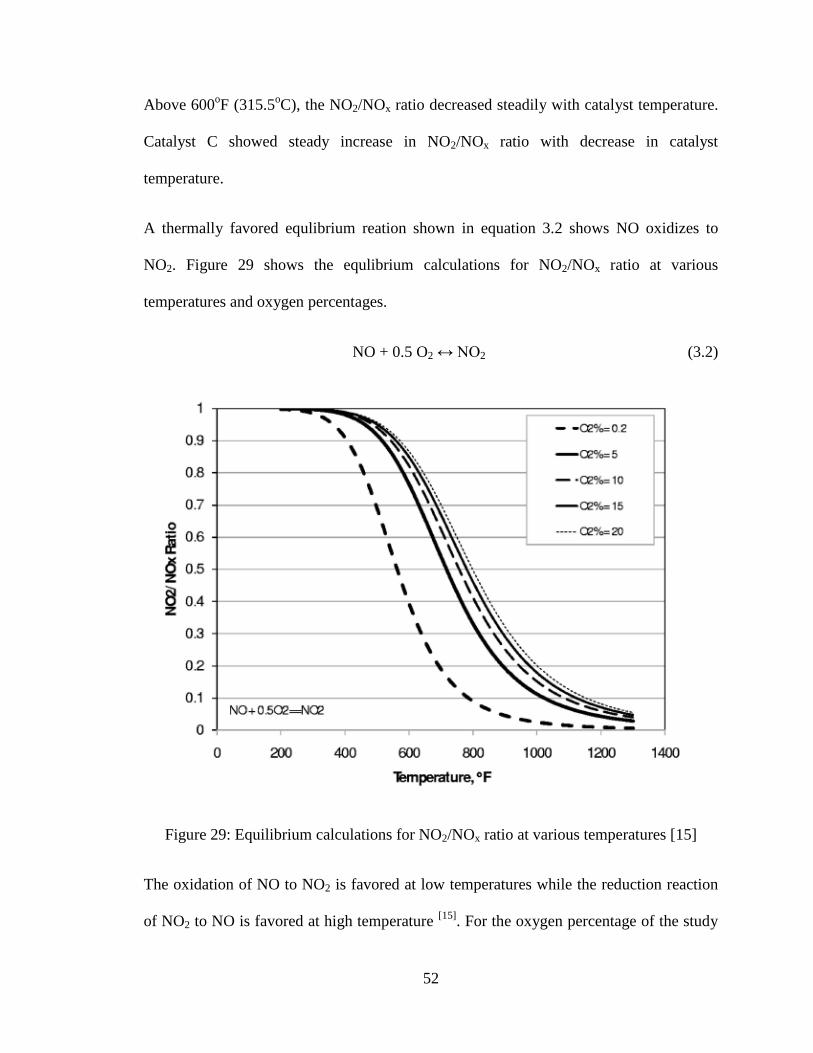
Above 600oF (315.5
oC), the NO2/NOx ratio decreased steadily with catalyst temperature.
Catalyst C showed steady increase in NO2/NOx ratio with decrease in catalyst
temperature.
A thermally favored equlibrium reation shown in equation 3.2 shows NO oxidizes to
NO2. Figure 29 shows the equlibrium calculations for NO2/NOx ratio at various
temperatures and oxygen percentages.
NO + 0.5 O2 ↔ NO2 (3.2)
Figure 29: Equilibrium calculations for NO2/NOx ratio at various temperatures [15]
The oxidation of NO to NO2 is favored at low temperatures while the reduction reaction
of NO2 to NO is favored at high temperature [15]
. For the oxygen percentage of the study

53
at 10%, the oxidation of NO to NO2 is the favored reaction for the temperature range of
the study. Thus NO2 concentration increases with temperature, which was noticed on
most catalysts.
Similar trend to catalyst E on NOx reactions was noticed on the work by Alexander
Winkler et. al,[6]
. In the work, surface characterization of oxidation catalysts showed
change in surface morphology as a possible reason for decrease in NO2/NOx ratio.
Therefore, apart from chemical equlibrium, surface reactions on an oxidation catalyst
surface also affect the NOx reactions inside the catalysts. No conclusions were reached on
the decrease in NO2 concentration on catalysts C and E due to insufficient data.

54
4. Space Velocity Variation
Space velocity is the inverse of the residence time of the exhaust gas in the oxidation
catalyst in units of hr-1
. Reduction in space velocity effectively varies the residence time
in the oxidation catalyst. Space velocity can also be correlated to the amount of catalyst
material in the oxidation catalyst. Increase in amount of catalyst material increases
residence time and reduces space velocity. The focus here is on space velocity, since it is
used by catalyst manufacturers and by industry for sizing catalysts for different
appliucations. It is necessary to understand the effect of space velocity on the
performance of the oxidation catalysts. The catalyst temperature during the variation of
space velocity was maintained at a set point of 550oF (288
oC). The space velocity was
varied from maximum to minimum value achievable by the catalyst slipstream with a
catalyst envelope volume of approximately 220 in3.
4.1 CO Emission
Figure 30 shows the performance of oxidation catalysts on CO conversion with varying
space velocity. Most catalysts showed over 90% CO conversion efficiency during the
space velocity sweep. Increase in CO conversion efficency was noticed on all the
oxidation catalysts, with decrease in space velocity. Decrease in space velocity increases
the residence time of the exhaust, increasing the probability of emission species oxidizing

55
inside the catalyst. Catalyst A showed increase in CO conversion efficiency at the initial
decrease in space velocity. After the initial increase, the conversion efficiency remained
constant during the whole space velocity sweep for catalyst A. Catalyst B showed a
similar trend on CO oxidation, relatively lower conversion efficieny than catalyst A.
Catalyst C showed no or very little activity on CO oxidation at higher space velocities.
The CO conversion efficiency on catalyst C increased at lower space velocities. Catalysts
D and E showed over 95% CO conversion efficiency. The conversion efficiencies varied
very little for catalyst D and E during the space velocity sweep.
Figure 30: Variation of CO conversion efficiency with space velocity
The maximum value on space velocity achieved on each oxidation catalyst was different.
Space velocity is calculated using the formula shown in Equation 4.1.

56
Space Velocity =
(4.1)
The usable envelope volume of each catalyst module was different due to differences in
frame design. Therefore, the maximum space velocity achieved by each catalyst module
was different.
4.2 Formaldehyde Emission
Figure 31 shows the variation of CH2O conversion efficiency with space velocity.
Significant variation in the performance of oxidation catalysts on CH2O conversion was
observed in the space velocity sweep.
Figure 31: Variation of formaldehyde conversion efficiency with space velocity

57
Catalyst A showed a linear increase in CH2O conversion efficiency with decrease in
space velocity. The conversion efficiency increased from 33% to 80% during the space
velocity sweep for catalyst A. CH2O conversion efficiency for catalyst B showed a
similar trend to catalyst A, increasing linearly with decrease in space velocity. CH2O
conversion efficiency on catalyst B increased by 30% during the space velocity sweep.
Catalyst C showed increase in oxidation of CH2O at lower space velocities. Catalyst D
showed over 90% conversion of CH2O during the space velocity sweep. The conversion
efficiency increased during the space velocity sweep, until it reached a maximum of 98%
at the lowest catalyst space velocity. Catalyst E showed near 100% CH2O conversion at
low space velocities. The CH2O conversion efficiency on catalyst E showed increase at
higher space velocities, but remained constant at lower space velocities.
4.3 Ethylene Emission
For this engine class, ethylene (C2H4) emission typically makes up the largest percentage
(68%) of VOC emission. Figure 32 shows the variation of C2H4 conversion efficiency
with space velocity.
Most oxidation catalysts showed near 100% C2H4 conversion efficiency during the space
velocity sweep. Catalyst A oxidized all the C2H4 during the space velocity sweep.
Catalyst B showed 98% C2H4 conversion efficiency throughout the space velocity sweep.
Some oxidation of C2H4 was measured on catalyst C. At higher space velocities, catalyst
C oxidized around 25% of C2H4 in the exhaust. Catalyst C showed a increase in
conversion efficiency at the initial decrease in space velocity and remained constant for
the remaining space velocity sweep.

58
Figure 32: Variation of ethylene conversion efficiency with space velocity
Catalyst D and E showed over 90% C2H4 conversion efficiency during the space velocity
sweep. Catalyst D showed increase in C2H4 conversion efficiency with decrease in space
velocity. C2H4 conversion efficiency on catalyst E remained constant at 97% during the
space velocity sweep.
4.4 Propylene Emission
Propylene (C3H6) emission is also a component of VOC emission. C3H6 emission
constitutes about 7% of VOC emission. Figure 33 shows the variation of C3H6 conversion
efficiency with space velocity.

59
Most oxidation catalysts showed near 100% C3H6 conversion efficiency during the space
velocity sweep. The C3H6 conversion efficiency on catalyst A increased with decrease in
space velocity until the conversion efficiency reached 100%. At lower space velocities
Catalyst A oxidized all the C3H6 emission. Catalyst B showed over 98% C3H6 conversion
efficiency throughout the space velocity sweep. Intial decrease in space velocity showed
a increase in conversion efficiency for catalyst B. After the initial increase, no increase of
conversion efficiency was noticed on catalyst B. Some oxidation of C3H6 was noticed on
catalyst C at lower space velocities. No C3H6 conversion was noticed on catalyst C at
higher space velocities.
Figure 33: Variation of propylene conversion efficiency with space velocity

60
Catalyst D showed over 90% C3H6 conversion efficiency. Catalyst D showed increase in
C3H6 conversion efficiency with decrease in space velocity. At 50000 hr-1
space velocity,
catalyst D showed low C3H6 conversion efficiency of 67% with a emission concentration
of 0.6 ppm. The fluctuations in propane concentration caused the variation in C3H6
emission. Catalyst E showed 100% C3H6 conversion efficiency during the space velocity
sweep.
4.5 Propane Emission
Propane (C3H8) emission is an important constituent of VOC emissions because it is
usually present in significant quantities and is difficult to oxidize. Average pre-catalyst
C3H8 concentration was measured to be 8 ppm and constituted 24% of VOC emission. In
the previous chapter, it was shown that the oxidation catalysts showed very little or no
activity on C3H8 conversion. Figure 34 shows the variation of C3H8 conversion efficiency
with space velocity.
A linear trend in C3H8 conversion efficiency was noticed on most oxidation catalysts with
decrease in space velocity. Catalyst A showed no change in C3H8 conversion efficiency
with change in space velocity. Catalyst B showed increase in C3H8 conversion efficiency
with decrease in space velocity. Catalyst C showed decrease in C3H8 conversion with
decrease in space velocity.

61
Figure 34: Variation of propane conversion efficiency with space velocity
This trend was due to the fluctuations in pre-catalyst C3H8 concentrations. Catalysts D
and E followed the trend of increasing conversion efficiency with decreasing space
velocity.
4.6 VOC Emission
VOC emission included all non-methane and non-ethane hydrocarbons. As discussed in
the previous section, very little conversion of C3H8 was seen on all catalysts. C3H8
constitutes about 20% of VOC emission from the exhaust. C3H8 reduction efficiency is
relatively low, therefore the maximum conversion efficiency of VOCs. Figure 35 shows
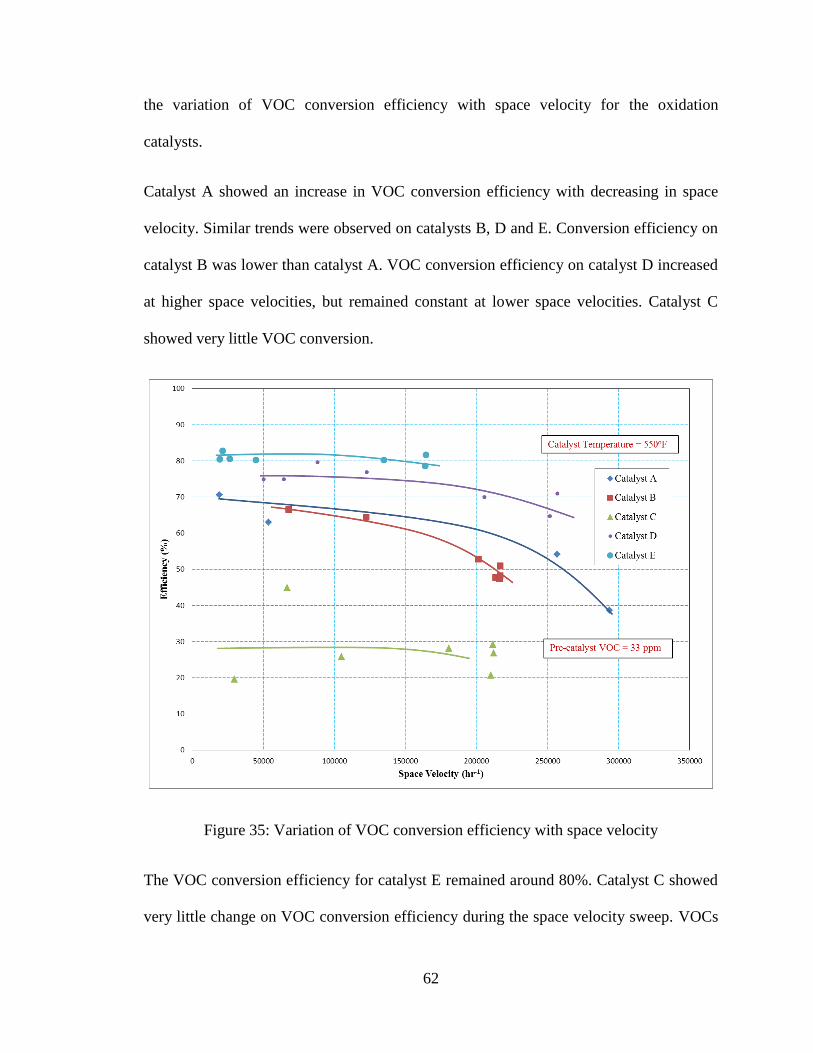
62
the variation of VOC conversion efficiency with space velocity for the oxidation
catalysts.
Catalyst A showed an increase in VOC conversion efficiency with decreasing in space
velocity. Similar trends were observed on catalysts B, D and E. Conversion efficiency on
catalyst B was lower than catalyst A. VOC conversion efficiency on catalyst D increased
at higher space velocities, but remained constant at lower space velocities. Catalyst C
showed very little VOC conversion.
Figure 35: Variation of VOC conversion efficiency with space velocity
The VOC conversion efficiency for catalyst E remained around 80%. Catalyst C showed
very little change on VOC conversion efficiency during the space velocity sweep. VOCs

63
can react with NO2 to form CO2, NO and water. VOCs also react with O2 to form CO2
and water.The global reaction for ethylene with NO2 is shown in Equation 4.2.
C2H4 + 6NO2 → 2CO2 + 2H2O + 6NO (4.2)
Similar to Equation 4.2, all other VOC species react with NO2 to form CO2, NO and
water. Ethylene has a VOC reactive index of 2.21, while the reactive index for propane is
0.25 [17]
. Compounds with higher reactivity index readily react with NO2 and/or O2.
4.7 NOx Emission
Variation of NOx composition across the oxidation catalyst is important to understand.
NO2 is approximately 5 times toxic as NO and it impacts visibility since it is a colored
gas [20]
. Figure 36 shows the variation of NO2/NOx ratio with space velocity.
The equilibrium reaction between oxidation of NO and reduction of NO2 is temperature
dependant. The catalyst temperature for the space velocity sweep was maintained at
550oF (288
oC). At this catalyst temperature, the equilibrium reaction favors oxidation of
NO to NO2. Based on the mechanism, NO2/NOx ratio increases with decreasing space
velocity. Decrease in space velocity increases the residence time inside a catalyst,
providing more time for oxidation of NO to NO2. This trend of increasing NO2
concentration was measured on most oxidation catalysts. Catalyst A showed a increase in
NO2 concentration at lower space velocity, remaining constant at higher space velocities.
Very little variation of NO2 concentration was noticed on catalyst B.

64
Figure 36: Variation of NO2/NOx ratio with space velocity
Catalyst C and D showed similar trends in NO2 concentration, increasing with decrease in
space velocity. Catalyst E showed decrease in NO2 concentration at lower space velocity.
As mentioned in the previous section, NOx reaction mechanisms are dependant on
surface reactions. The catalyst temperature was maintained at a setpoint value of 550oF,
the rate of increase of NO2/NOx ratio is different on most oxidation catalysts. Therfore,
NOx reaction mechanism inside an oxidation catalyst is dependant on both thermally
favored chemical equilibrium reactions and kinetically dependant surface reaction
mechanisms. The trend of decrease in NO2 concentration with decreasing space velocity
on catalyst C is inconclusive due to insuffient data for analysis.

65
4.8 Friction Factor Correlation
The oxidation catalysts used in the study varied in cell density from 200 cells/in2 (31
cells/cm2) to 600 cells/in
2 (93 cells/cm
2). The test results showed no or very little effect of
cell density on the performance of the oxidation catalysts. The cell density of the
oxidation catalysts affected the pressure drop across the catalysts. The pressure drop
across the catalyst was directly proportional to cell density. Oxidation catalysts with
higher cell density caused higher pressure drop across the catalyst due to increased
obstruction to the flow.
Figure 37 shows the variation in differential pressure across the catalyst with space
velocity for the oxidation catalysts. The differential pressure for catalyst A varied from
1.2 to 5.1 inches of water (0.002 to 0.12 bar) with a cell density of 600 cells/in2 (93
cells/cm2). Catalyst B had a differential pressure ranged from 0.95 to 2.5 inches of water
(0.0023 to 0.0062 bar). Catalyst B had a cell density of 300 cells/in2 (46 cells/cm
2).
Catalyst C had a cell density of 300 cells/in2 (46 cells/cm
2) and showed the differential
pressure range from 0.8 to 3.2 inches of water (0.0019 to 0.0079 bar). Catalyst D had the
lowest cell density of 200 cells/in2 (31 cells/cm
2). The differential pressure for catalyst D
ranged from 0.5 to 2.4 inches of water (0.0012 to 0.0059 bar). The differntial pressure for
catalyst E ranged from 0.5 to 2.5 inches of water (0.0012 to 0.0062 bar) with a cell
density of 300 cells/in2 (46 cells/cm
2). The differential pressure for most catalysts varied
linearly with space velocity.

66
Figure 37: Variation of differential pressure with space velocity
The differential pressure for catalyst B was much lower than other catalysts with same
cell density. The catalyst substrate for catalyst B is designed to reduce pressure drop and
increase turbulance to the flow inside the catalyst module.
The pressure drop across the catalyst was used to calculate friction factor for the flow
through the catalyst. Figure 38 shows the variation of friction factor with Reynolds
number.

67
Figure 38: Variation of friction factor with Reynolds number
Equation 4.3 was used to calculate the friction factor for each oxidation catalyst.
Friction factor, f =
(
) (
)
(4.3)
In the equation 4.3, h is the pressure head or pressure drop across the catalyst, l is the
length of the catalyst module, d is the diameter of each cell, ν is the velocity of the flow
through the catalyst and g is the acceleration due to gravity. The velocity, ν is calculated
from the space velocity and catalyst volume.
Equation 4.4 shows the formula used for the calculation of Reynolds number.

68
Reynolds Number, Re =
(4.4)
V in the equation 4.4 denotes the actual volume flowrate through the catalyst module.
This analysis was developed to understand the effect of cell density on the performance
of the oxidation catalyst. Oxidation catalysts with lower cell density showed higer range
of friction factor. The range of friction factor decreased with cell density.
Results in the current chapter showed, cell density had no or very little effect on
reduction of oxidation catalysts. Catalyst A had the highest cell density of 600 cells/in2,
performed similar to other oxidation catalysts with lower cell densities during the space
velocity sweep.

69
5. Conclusion
Emission from lean burn natural gas engines used for power generation and gas
compression are major contributors to air pollution. Two-way catalysts or oxidation
catalysts are the common after-treatment system used on lean burn natural gas engines to
reduce emissions of products of partial combustion (CO, CH2O and VOCs). The
performance of the oxidation catalysts is dependent on operating parameters like catalyst
temperature and space velocity. The study was done to understand the effect of these
operating parameters on the performance of oxidation catalysts and to evaluate how
significant differences are between catalyst vendors.
For the study, a part of exhaust from a Waukesha VGF-18 GL lean burn natural gas
engine was used. The catalyst slipstream used in the study allowed control over the
catalyst operating parameters without affecting engine operating parameters. Emission
analyzers, 5-gas, FTIR and HP 5890 Series II GC, were used for the measurement of
emission species. The oxidation catalysts were degreened at 1200oF (650
oC) for 24 hours.
The performance of oxidation catalysts was analyzed for varying catalyst temperature
and space velocity.
Catalyst Temperature
Most oxidation catalysts showed over 90% CO conversion efficiencies with light-off
temperatures ranging from 417oF (214
oC) to less than 360
oF (182
oC). Most oxidation
catalysts showed over 90% maximum CO conversion. CO conversion efficiencies on
catalyst D and E did not decrease below 50%. Good CH2O conversion efficiencies were
noticed on most of the oxidation catalysts. The light-off temperature for CH2O ranged

70
from 565oF (296
oC) to below 360
oF (182
oC). Over 90% maximum C2H4 conversion
efficiencies were noticed with light-off temperature ranging from 550oF (288
oC) to below
360oF (182
oC). High conversion efficiencies were noticed on C3H6 with some oxidation
catalysts showing 100% conversion efficiency at high catalyst temperatures. No or very
little C3H8 conversion was noticed on the oxidation catalysts. At high catalyst
temperatures, the oxidation catalysts showed an increase in C3H8 conversion efficiency.
Saturated hydrocarbons such as propane are difficult to oxidize in a oxidation catalyst
due to high activation energy and autoignition temperature. All oxidation catalysts
oxidized VOCs, with maximum conversion efficiency at 80%. VOC reduction was
limited by propane emission. Therefore, development of new catalyst formulation is
needed to improve conversion efficiency of VOCs. Oxidation of NO to NO2 was noticed
on most oxidation catalysts, which is favored based on chemical equlibrium. Table 5
shows the summary of results from the study.
Space Velocity
Variation in space velocity showed very little effect on the conversion efficiencies. Most
species showed over 90% conversion efficiency on emission species. The conversion
efficiency of the species varied very little with change in space velocity for most
emission species. Over 90% CO conversion efficiency was observed on most most
oxidation catalysts. Less than 3% change in CO conversion efficiency was observed
during space velocity sweep. CH2O reduction efficiency was constant for most oxidation
catalysts. Some oxidation catalysts showed increase in CH2O conversion efficiency with
decrease in space velocity. 100% C2H4 conversion was noticed on most catalysts during
the space velocity sweep. All the oxidation catalysts showed increase in C3H6 conversion

71
efficiency with decrease in space velocity, until the conversion efficiency reached 100%.
Very little oxidation of C3H8 was observed on any of the oxidation catalysts with
decreasing space velocity. 80% VOC reduction efficiency was observed on most catalysts
during the space velocity sweep. No change on performance of the oxidation catalysts
was noticed for varying space velocities after conversion efficiencies reached 90%.
Therefore, adding more catalyst volume may not increase reduction efficiency of
emission species. The varying cell density showed very little effect on performance of the
oxidation catalysts. The friction factor correlation showed the friction factor is inversely
proportional to cell density.
The reduction efficiencies for emission species tested, varied substantially among the
oxidation catalysts provided by different vendors.
Table 10: Summary of results from the study
72
References
[1] John B. Heywood, “Internal Combustion Engines Fundamentals”, Textbook, 1988
[2] Environmental Protection Agency, “Standards of performance for stationary spark
ignition internal combustion engines and national emission standards for hazardous
air pollutants for reciprocating internal combustion engines; Final Rule”, Federal
Register, Vol. 73, No. 13, 2008
[3] Shazam Williams et. al., “Oxidation Catalysts for Natural Gas Engine operating
under HCCI or SI conditions”, SAE International Journal of Fuels Lubrication,
2008-01-0807
[4] Jordan K. Lampert et. al., “Palladium catalyst performance for methane emissions
abatement from lean burn natural gas vehicles”, Applied Catalysis B:
Environmental 14 (1997) 211-223
[5] Robert L. McCormick et. al., “Rapid Deactivation of Lean burn Natural Gas Engine
Exhaust Oxidation Catalyst”, Sensors And Actuators, 1996, Vol. 1206, 63-77
[6] Alexander Winkler et. al., “The influence of chemical and thermal aging on the
catalytic activity of a monolithic diesel oxidation catalyst”, Applied Catalysis B:
Environmental 93 (2009) 177–184
[7] Hiromichi Yamamoto and Hiroshi Uchida, “Oxidation of methane over Pt and Pd
supported on alumina in lean-burn natural-gas engine exhaust”, Catalysis Today, 45
(1998) 147-151

73
[8] Deborah L. Mowery et. al., “Deactivation of PdO–Al2O3 oxidation catalyst in lean-
burn natural gas engine exhaust: aged catalyst characterization and studies of
poisoning by H2O and SO2”, Applied Catalysis B: Environmental 21 (1999) 157–
169
[9] Shin'ichi Matsumoto, “Catalytic Reduction of Nitrogen Oxides in Automotive
Exhaust Containing Excess Oxygen by NOx Storage-Reduction Catalyst”,
CATTECH, Volume 4, Number 2, 102-109
[10] Leon Hiam et. al., “Catalytic oxidation of hydrocarbons on platinum”, Journal of
Catalysis, Volume 10, Issue 3, 1968, 272-276
[11] Joshua C. Schmitt, “Selective catalytic reduction: testing, numeric modeling and
control strategies”, Master’s Thesis, Colorado State University, Spring 2010
[12] Kristopher Quillen, “Engine fiction reduction measurements and particulate
measurements of a lean burn 4-stroke natural gas internal combustion engine”,
Master’s Thesis, Colorado State University, Spring 2007
[13] Environmental Protection Agency, “National emission standards for hazardous air
pollutants for reciprocating internal combustion engines”, Federal Register, Vol. 76,
No. 46, 2011
[14] Thormählen, et. al., “Low-Temperature CO Oxidation over Platinum and Cobalt
Oxide Catalysts”, Journal of Catalysis, Volume 188, Issue 2, 1999, 300-310
[15] Daniel Olsen et. al., “Impact of oxidation catalysts on exhaust NO2/NOx ratio from
lean burn natural gas engine”, Journal of Air and Waste Management Association,
60 (2010) 867-874

74
[16] Coward H.F. and Jones G.W., “Limits of Flammability of Gases and Vapors”,
Bulletin 503, U.S. Department of the Interior, Bureau of Mines, 1952
[17] Carter W. P. L, “SAPRC Atmospheric chemical mechanisms and VOC reactivity
scales”, Air pollution research center and college of engineering center for
environmental research and technology, University of California, Riverside,
www.cert.ucr.edu/~cater/SAPRC
[18] Frank White, “Fluid mechanics”, Textbook, Seventh edition, 2009
[19] California Code of Regulations, “Amendments to the distributed generation
certification regulation”, Article 3, Division 3 of title 17, 2003
[20] J. A. Last et. al., “Ozone, NO and NO2: oxidant air pollutants and more”,
Environmental Health Perspectives, 102 (Suppl 10), 1994, 179-184
[21] HP 5890 Series II and HP 5890 Series II Plus operating manual