thesis-org complete (1)
TRANSCRIPT
8/14/2019 Thesis-Org Complete (1)
http://slidepdf.com/reader/full/thesis-org-complete-1 1/194
HURDLE TECHNOLOGIES: MICROBIAL INACTIVATION BY PULSED ELECTRIC
FIELDS DURING MILK PROCESSING
A Thesis
Presented to
The Faculty of Graduate Studies
of
The University of Guelph

8/14/2019 Thesis-Org Complete (1)
http://slidepdf.com/reader/full/thesis-org-complete-1 2/194
ABSTRACT
HURDLE TECHNOLOGIES: MICROBIAL INACTIVATION BY PULSED ELECTRIC
FIELDS DURING MILK PROCESSING
Oscar Rodriguez Gonzalez Advisor:
University of Guelph, 2010 Dr. Mansel W. Griffiths
The application of non-thermal processes pulsed electric fields (PEF) and cross-flow
micro-filtration (CFMF) continuous to be studied with the purpose of controlling
microorganisms in milk. Trends suggesting increased adoption include the study of
F d S f t Obj ti f t it i th ti f t i bl i
8/14/2019 Thesis-Org Complete (1)
http://slidepdf.com/reader/full/thesis-org-complete-1 3/194
in homogenized cream (12% fat) compared to non-homogenized. The linear relation
between electrical conductivity and nutrient content (fat and solids content) was
established. In a parallel study the PEF/CFMF sequence resulted in higher inactivation
of mesophilics compared to CFMF/PEF and HTST. The shelf life was acceptable for
CFMF/PEF and HTST after 7 days, while enterics and psychrotrophs grew more after
PEF/CFMF, thermodurics did after HTST.
The growth and stress of Escherichia coli O157:H7 in lactose containing broths was
monitored by absorbance and fluorescence expression of stress reporters. Growth was
explained using a secondary model, and stress response using mechanistic and
probabilistic models. PEF inactivation was evaluated following the Weibull distribution
after the cells reached stationary phase or maximum fluorescence expression. Similar
resistances were observed within the cells grown in lactose broth at 10 25 or 40°C as

8/14/2019 Thesis-Org Complete (1)
http://slidepdf.com/reader/full/thesis-org-complete-1 4/194
ACKNOWLEDGMENTS
To all my colleagues, advisors, family, and friends for their support.
To the Dairy Farmers of Ontario and the Natural Sciences and Engineering Research
Council for their financial assistance.

8/14/2019 Thesis-Org Complete (1)
http://slidepdf.com/reader/full/thesis-org-complete-1 5/194
ABBREVIATIONS
Abbreviation Significance
AA Acetic acid
ABS Absorbance
AIC Akaike information criterion
ANOVA Analysis of variance
ATCC American Type Culture Collection
ATP Adenosine triphosphate
BIC Bayesian information criterion
CFMF Cross-flow microfiltration
CFU Colony forming units

8/14/2019 Thesis-Org Complete (1)
http://slidepdf.com/reader/full/thesis-org-complete-1 6/194
HSP Heat shock proteins
HTST High temperature short time
LA Lactic acid
LACB Lactose broth
LB Luria Berthani Broth, Miller
MF Microfiltration
MPN Most probable number
MSE Mean square errors
MTS Manothermosonication
NACMCF National Advisory Committee on Microbiological Criteria for Foods
NF Nanofiltration
OD Optical density
8/14/2019 Thesis-Org Complete (1)
http://slidepdf.com/reader/full/thesis-org-complete-1 7/194
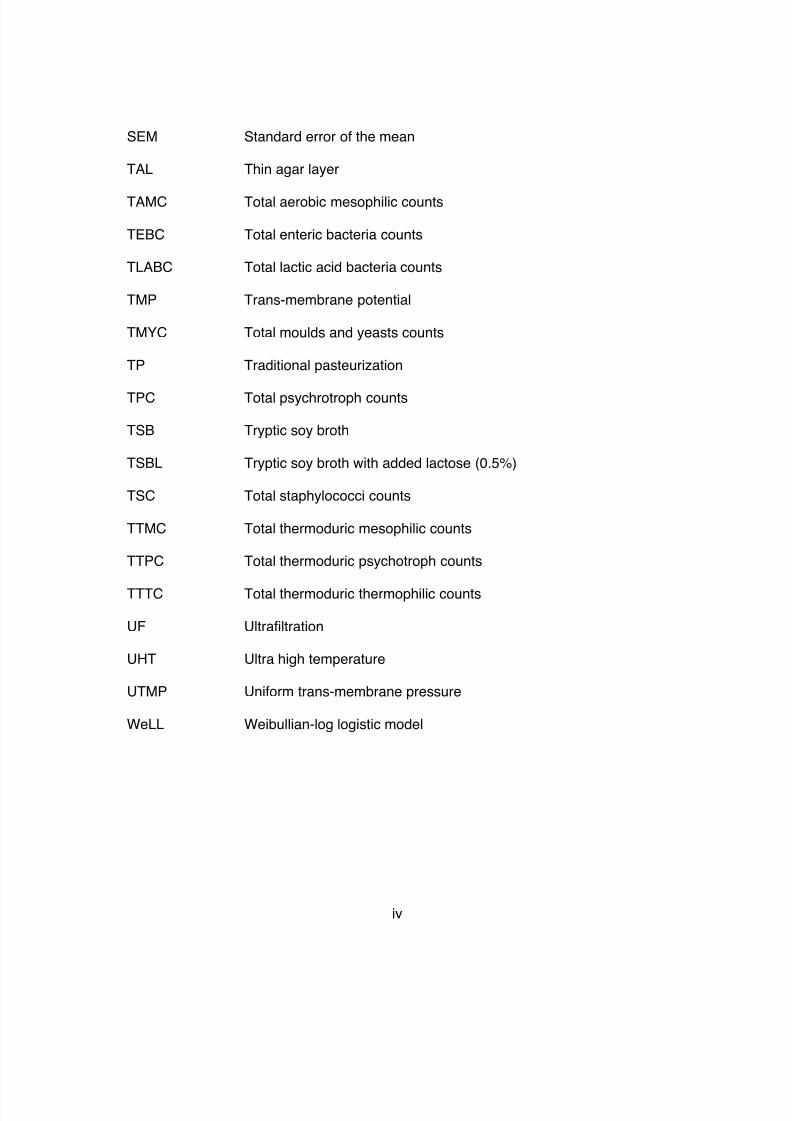
SEM Standard error of the mean
TAL Thin agar layer
TAMC Total aerobic mesophilic counts
TEBC Total enteric bacteria counts
TLABC Total lactic acid bacteria counts
TMP Trans-membrane potential
TMYC Total moulds and yeasts counts
TP Traditional pasteurization
TPC Total psychrotroph counts
TSB Tryptic soy broth
TSBL Tryptic soy broth with added lactose (0.5%)
TSC Total staphylococci counts
8/14/2019 Thesis-Org Complete (1)
http://slidepdf.com/reader/full/thesis-org-complete-1 8/194
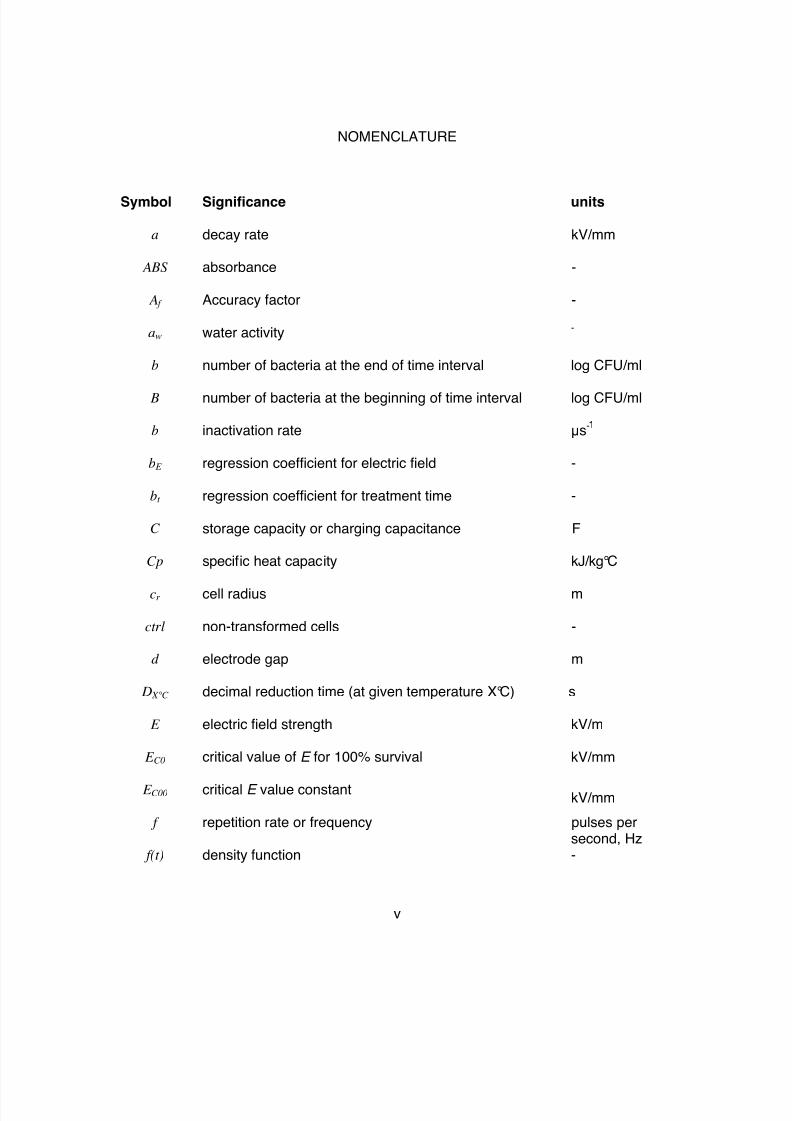
NOMENCLATURE
Symbol Significance units
a decay rate kV/mm
ABS absorbance -
A f Accuracy factor -
aw water activity -
b number of bacteria at the end of time interval log CFU/ml
B number of bacteria at the beginning of time interval log CFU/ml
b inactivation rate !s-
b E regression coefficient for electric field -
bt regression coefficient for treatment time -

8/14/2019 Thesis-Org Complete (1)
http://slidepdf.com/reader/full/thesis-org-complete-1 9/194
Fat fat fraction %
FSO food safety objective CFU/l
G generation time min, h
g rate constant -
gfpUV plasmid containing cells -
H 0 the initial level of the hazard CFU/l
I current signals A
iFat intercept of relation between % fat and electrical
conductivity %fat
iSol intercept of relation between % solids and electricalconductivity
%sol
k constant factor -
k (E,T in) inactivation constant, -

8/14/2019 Thesis-Org Complete (1)
http://slidepdf.com/reader/full/thesis-org-complete-1 10/194
Pre predicted -
q concentration of limiting substrate -
R response ratio -
r rate of response -
RC PEF chamber resistance !
RFI relative fluorescence intensity -
S surviving fraction -
sFat slope of relation between % fat and electrical
conductivityS / m %fat
SFI specific fluorescence intensity -
Sol solids fraction %
sSol slope of relation between % solids and electricalconductivity
S / m %sol
8/14/2019 Thesis-Org Complete (1)
http://slidepdf.com/reader/full/thesis-org-complete-1 11/194
v rate of increase of the limiting substrate -
V C volume of PEF treatment chamber m
w total applied energy kJ
w pl specific energy per pulse kJ/pulse
wsp specific energy input kJ/kg, kJ/l
x microbial population log CFU/ml
! scale parameter -
" shape parameter -
! gamma function -
# pH parameter -
$P pressure rise Pa
$T temperature rise °C
8/14/2019 Thesis-Org Complete (1)
http://slidepdf.com/reader/full/thesis-org-complete-1 12/194
!w pulse width s
! Ratkowsky parameter °C - h-
! angle between the electric field and the point of interestin the membrane (cos ! = 1 at the poles)
-
"
a form factor (3/2) for spherical cells -
# lower asymptote log CFU/ml
" lower asymptote log CFU/ml
$ temperature parameter -
" water activity parameter -

8/14/2019 Thesis-Org Complete (1)
http://slidepdf.com/reader/full/thesis-org-complete-1 13/194
TABLE OF CONTENTS
ACKNOWLEDGMENTS………………………………………………………………………...i
ABBREVIATIONS…………………………………………………………………………....….ii
NOMENCLATURE………………………………………………………………………….......v
1. Introduction ............................................................................................................... 1
1.1. Non-thermal dairy processing ............................................................................... 1
1.1.1. Advances in critical milk processes ................................................................ 2
1.1.2. Microfiltration .................................................................................................. 5
1.1.3. Emerging technologies ................................................................................... 7
1.1.4. Regulatory status of pasteurization technologies .......................................... 11
1 1 5 S t i bl d i i 14
8/14/2019 Thesis-Org Complete (1)
http://slidepdf.com/reader/full/thesis-org-complete-1 14/194
1.7. Research needs .................................................................................................. 48
2. Factors affecting the inactivation of native bacteria in milk processed by pulsed
electric fields and cross-flow microfiltration ................................................................... 49
2.1. Introduction ......................................................................................................... 49
2.2. Materials and Methods ........................................................................................ 51
2.2.1. Conventional and alternative milk processing ............................................... 51
2.2.2. PEF treatment ............................................................................................... 52
2.2.3. Conventional heat treatment of milk ............................................................. 56
2.2.4. Microbiological Analysis ................................................................................ 56
2.2.5. Physico-chemical properties ......................................................................... 57
2.2.6. Statistical analysis ........................................................................................ 58
2.3. Results and Discussion ....................................................................................... 58
2.3.1. Bacteria reduction in PEF-treated milk of different fat contents .................... 58

8/14/2019 Thesis-Org Complete (1)
http://slidepdf.com/reader/full/thesis-org-complete-1 15/194
3.2.4. Nonthermal hurdle processing ...................................................................... 87
3.2.5. Conventional heat pasteurisation .................................................................. 88
3.2.6. Microbiological shelf life ................................................................................ 88
3.2.7. Electrical conductivity and pH ....................................................................... 90
3.2.8. Statistical analysis ........................................................................................ 90
3.3. Results ................................................................................................................ 91
3.3.1. Microbial inactivation with PEF, CFMF, CFMF/PEF, PEF/CFMF, and TP .... 91
3.3.2. Microbial shelf stability of milk processed with PEF/CFMF and TP .............. 92
3.4. Discussion ........................................................................................................... 98
4. Resistance of temperature, pH, osmotic and starvation stress induced Escherichia
coli O157:H7 to pulsed electric fields in milk ............................................................... 104
4.1. Introduction ....................................................................................................... 104
4.2. Materials and Methods ...................................................................................... 106

8/14/2019 Thesis-Org Complete (1)
http://slidepdf.com/reader/full/thesis-org-complete-1 16/194
5. General conclusion .................................................................................................. 131
5.1. Applications and future research ....................................................................... 135
6. References .............................................................................................................. 137
7. Annex ...................................................................................................................... 176
8/14/2019 Thesis-Org Complete (1)
http://slidepdf.com/reader/full/thesis-org-complete-1 17/194
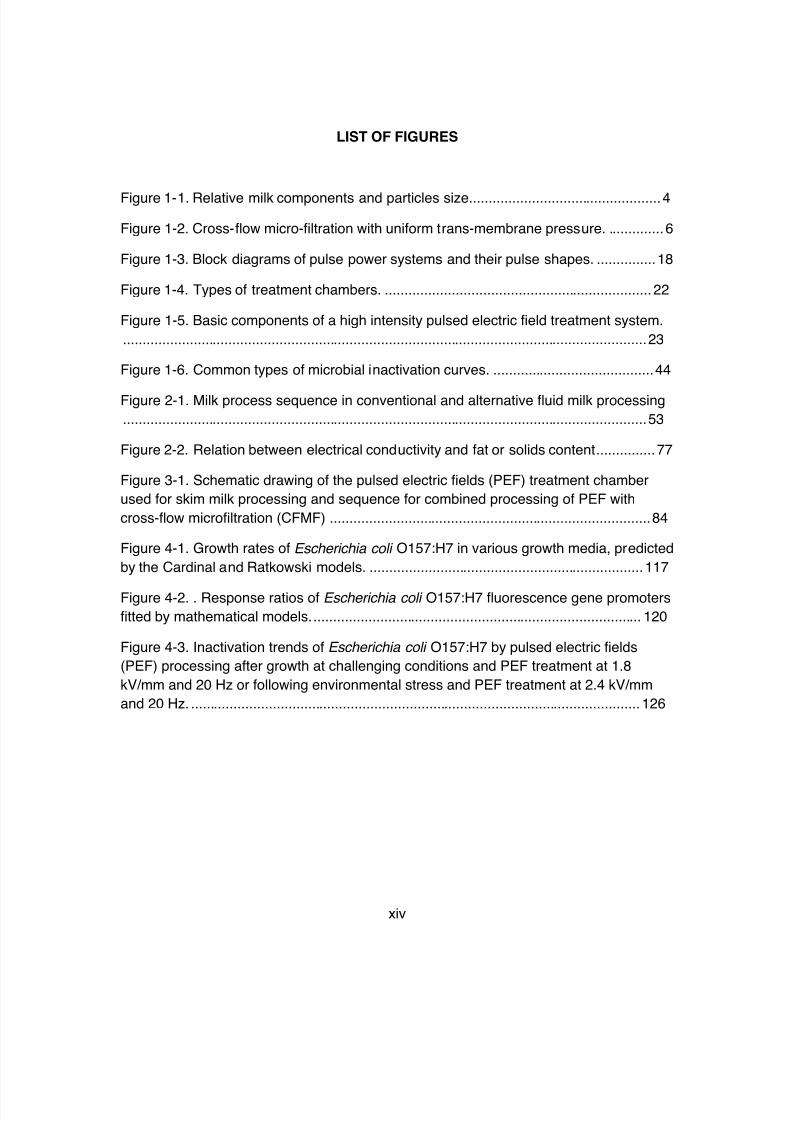
LIST OF FIGURES
Figure 1-1. Relative milk components and particles size. ................................................ 4
Figure 1-2. Cross-flow micro-filtration with uniform trans-membrane pressure. .............. 6
Figure 1-3. Block diagrams of pulse power systems and their pulse shapes. ............... 18
Figure 1-4. Types of treatment chambers. .................................................................... 22
Figure 1-5. Basic components of a high intensity pulsed electric field treatment system.
...................................................................................................................................... 23
Figure 1-6. Common types of microbial inactivation curves. ......................................... 44
Figure 2-1. Milk process sequence in conventional and alternative fluid milk processing
...................................................................................................................................... 53
Figure 2-2. Relation between electrical conductivity and fat or solids content ............... 77
Figure 3-1. Schematic drawing of the pulsed electric fields (PEF) treatment chamber
used for skim milk processing and sequence for combined processing of PEF with

8/14/2019 Thesis-Org Complete (1)
http://slidepdf.com/reader/full/thesis-org-complete-1 18/194
LIST OF TABLES
Table 2-1. Applied intensitites of high intensity pulsed electric fields and resulting
temperature profiles ...................................................................................................... 54
Table 2-2. Variation in microbial populations after pulsed electric fields (PEF) and high
temperature short time (HTST) processing of fluid milks ............................................... 60
Table 2-3. Effect of the pulsed electric fields inlet processing temperature on the
reduction of different bacteria groups in skim milk ........................................................ 65
Table 2-4. Reduction of microbial populations after processing of skim milk with cross-
flow microfiltration (CFMF) and pulsed electric fields (PEF) or high temperature short
time (HTST) pasteurization in a combined approach (CFMF/PEF; CFMF/HTST) ........ 69
Table 2-5. Effect of pulsed electric fields processing on different groups of native
bacteria in cream ........................................................................................................... 72
Table 2-6. Linear regression coefficients of the relation between fat or solids and
conductivity of milk fractions .......................................................................................... 76
T bl 3 1 C i f d ti i t t l hili bi t i ki ilk

8/14/2019 Thesis-Org Complete (1)
http://slidepdf.com/reader/full/thesis-org-complete-1 19/194
1. Introduction
1.1. Non-thermal dairy processing
Because it has been generally recognized that heat pasteurization does not
necessarily achieve commercial sterility (NACMCF 2006), and that excessive heat
treatment can be associated to other health risks resulting from the formation of toxic
substances, a group of technologies labeled non-thermal makes continuous advances
(Knorr and others 2007). In that regard, minimal processing of liquid foods creates
products with improved sensory and nutritional attributes due to the reduced thermal
impact (Walkling-Ribeiro and others 2010a). Parallel to the increase in milk production,
new pasteurization processes are being implemented in emerging markets. While the

8/14/2019 Thesis-Org Complete (1)
http://slidepdf.com/reader/full/thesis-org-complete-1 20/194
mechanisms (FDA 2000). As quoted by McBee (1996), understanding the fundamental
physics of a process allows a better perspective of the operations, and probably reveals
unutilized forms of energy (See Annex 1 for an illustration of the processes related to
the electromagnetic spectrum).
1.1.1. Advances in critical milk processes
Milk is generally subjected to cream separation because of the tendency of the
fat globules to rise to the top of their container. Based on the principle of fat separation
by sedimentation forces, centrifugal separators are continuously being developed to
achieve separations 4500 times faster than gravity (Nielsen 2000). This technique has
been further developed to remove microorganisms in a process called bactofugation,
which consists of a centrifuge bowl with continuous discharge where milk flows through
8/14/2019 Thesis-Org Complete (1)
http://slidepdf.com/reader/full/thesis-org-complete-1 21/194
A basic HPH unit consists of a positive displacement pump that forces the
suspension through the center of a valve seat and across the seat face. As the fluid
flows radially across the valve and strikes an impact ring, disruption results from tearing
apart the cell wall. Based on a similar principle a microfluidizer causes impaction of two
streams of suspension at high velocity against a stationary surface with the energy input
dissipated almost instantaneously at the point of impact. The operation is a function of
flow rate, disruption unit, and the backpressure. While researchers like Hayes and
others (2005) suggest that a significant microbial reduction can be achieved by HPH
(250 MPa and 45°C), other investigators like Smiddy and others (2007) state that HPH
does not extend the shelf-life of milk, even when combined with relatively high
temperatures (250 MPa at 70°C).
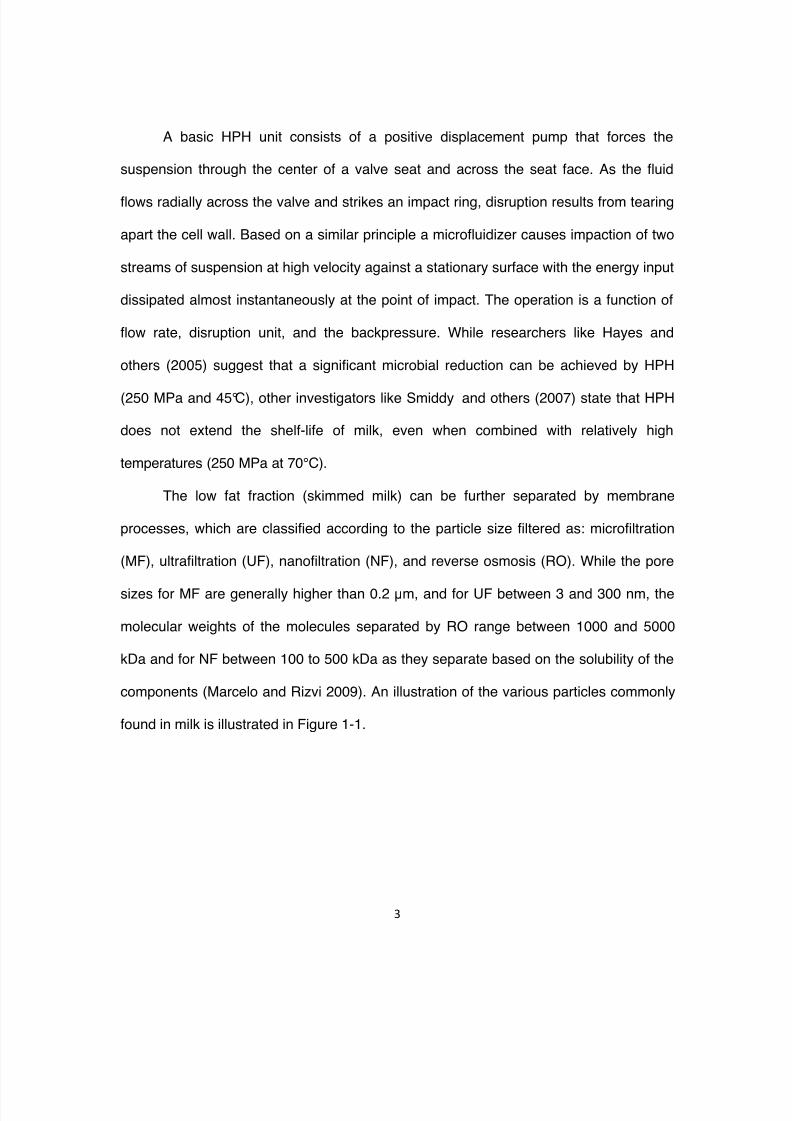
The low fat fraction (skimmed milk) can be further separated by membrane

8/14/2019 Thesis-Org Complete (1)
http://slidepdf.com/reader/full/thesis-org-complete-1 22/194
"
Figure 1-1. Relative milk components and particles size.
Adapted from Walstra and others (2006), CDR (2004), Kessler (2002), Nielsen (2000), and Jelen (1992).
#$%#$&#$#'$$'##$(&#$(%#$("#$()
#$*
#$+
#$)
#$"
#$%
#$&
#$#
#$#'$
,-./0123 4053 6789
,-./0123 4053
6:.84/.;<=49
>?8-< @-0.
A3-4/ 13224
B-1/3.0-
C-/ =2;D?234
E2;/@ F G3H/@ I 02/3.4
J01.;(
I02/.-/0;<
K2/.-(I02/.-/0;<
L-<;(
I02/.-/0;<
E-430<
80132234
J;?2G4
M0.?434
N' 13224
O-1/;43
N-2/4
P3Q3.43
R48;404
S-/3. S@3T
,.;/30<4
:HH.;U08-/3
V30=@/ 6W-2/;<49
M040D23 /; /@3 <-X3G 3T3RH/01-2 801.;41;HTY231/.;< 801.;41;HT
#$"
#$Z
M04?-205-/0;<
#$& #$% #$)
J02X
1;8H;<3</4
J38D.-<3
H.;134434
J01.;;.=-<0484
N1.33<4 F 4/.-0<3.4
M0/-80<4 S@3T H.;/30< -==.3=-/34[ 1@3343 I0<34
#$" ) U #$)
,-./0123 [email protected]/3.04/01 \;<01 J;231?2-. J-1.;8;231?2-. E32 2?2-. ] 801.;H-./01?2-/3

8/14/2019 Thesis-Org Complete (1)
http://slidepdf.com/reader/full/thesis-org-complete-1 23/194
1.1.2. Microfiltration
As the design of membrane equipment advances, different approaches are being
taken to satisfy the processing needs. Membrane systems can be batch or continuous.
Continuous systems can be single-pass, plug-flow or multi-stage with recycling (Nielsen
2000). A further development to achieve higher permeation rates and minimum fouling
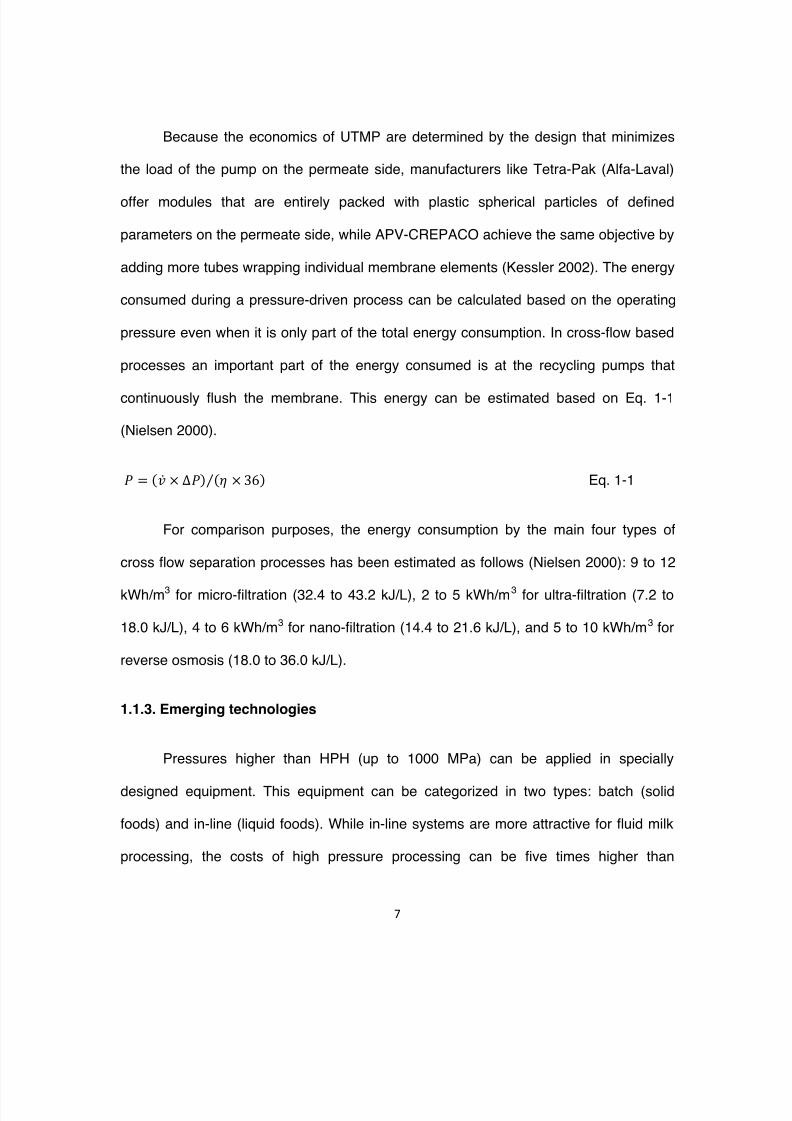
in a continuous system was the concept of cross flow microfiltration (CFMF). As
explained by Kessler (2002), it consists of applying a high tangential velocity in the
filtration module (high wall shear stress), a low trans-membrane pressure drop, and the
highest appropriate temperature (50-55°C). By allow ing a low and uniform trans-
membrane pressure (UTMP) of 30 to 40 kPa, rapid clogging and fouling could be
prevented and a 1 to 10 ratio between the retentate and permeate could be obtained

8/14/2019 Thesis-Org Complete (1)
http://slidepdf.com/reader/full/thesis-org-complete-1 24/194
' '
''
Retentatecirculationpump
Permeatecirculationpump
3.6 Bar 4.0 Bar
1.8 Bar 2.2 Bar
RetentatePermeate
8/14/2019 Thesis-Org Complete (1)
http://slidepdf.com/reader/full/thesis-org-complete-1 25/194
Because the economics of UTMP are determined by the design that minimizes
the load of the pump on the permeate side, manufacturers like Tetra-Pak (Alfa-Laval)
offer modules that are entirely packed with plastic spherical particles of defined
parameters on the permeate side, while APV-CREPACO achieve the same objective by
adding more tubes wrapping individual membrane elements (Kessler 2002). The energy
consumed during a pressure-driven process can be calculated based on the operating
pressure even when it is only part of the total energy consumption. In cross-flow based
processes an important part of the energy consumed is at the recycling pumps that
continuously flush the membrane. This energy can be estimated based on Eq. 1-1
(Nielsen 2000).
! " #$% & '!( #) & *+(, Eq. 1-1

8/14/2019 Thesis-Org Complete (1)
http://slidepdf.com/reader/full/thesis-org-complete-1 26/194
conventional heat treatment, with the initial investment being 75-80% of the cost.
Another problem to solve is the cycle time, some semi-continuous systems save energy
and time by coupling vessels using the energy stored in a pressured one to pressurize a
second one (Van den Berg and others 2001b). As the research on high pressures,
especially the application of hydrostatic high pressure (HHP), advances beyond the
antimicrobial effects, attributes such as the preservation of the level of free fatty acids
related to decreased rancidity, the fat globule cold agglutination, and differences in
rennet coagulation after HHP represent exciting opportunities for the dairy industry
(Norton and Sun 2008). Also, since the structure of milk proteins can be modified by
HHP, research has been focused on the modification of the properties of foams,
emulsions and gels and the application in cheese production both prior to cheese
making and during ripening (Needs 2001).

8/14/2019 Thesis-Org Complete (1)
http://slidepdf.com/reader/full/thesis-org-complete-1 27/194
ionizing radiation a few applications have been developed specifically for dairy products.
UV light is a well-established technique applied for sterilizing packaging films; therefore,
its future is promising (Palmieri and Cacae 2005), and there is a project team
developing a prototype to assess the commercial viability of non-thermal UV processing
(Barnes 2009).
Radio-frequency is being explored for its beneficial non-thermal effects when
applied in the form of radio-frequency electric fields (RFEF) at higher voltages (%5
kV/cm) and lower frequencies (<18 MHz), for that purpose a process applying 3.0
kV/mm between 20 and 100 kHz has been developed to inactivate microorganisms. The
setup of RF is similar to pulsed electric fields (PEF) as they consist in moving a fluid
through two electrodes charged with an electric field, the difference is that the PEF
power supply is in the forms of pulses formed in a pulse-forming network (PFN), while in

8/14/2019 Thesis-Org Complete (1)
http://slidepdf.com/reader/full/thesis-org-complete-1 28/194
Electro-thermal processes are continuously being developed to optimize the
application of thermal treatments. This group of processes includes: infrared radiation,
hertzian waves (microwaves and radiofrequency), and ohmic heating. Infrared radiation
consists of transferring thermal energy in the form of electromagnetic waves as short
waves (0.7 to 2.0 !m), medium waves (2.0 to 4.0 !m), and long waves (0.004 to 1.0
mm), generated by a hot source like a quartz lamp, quartz tube or metal rod (Vicente
and Castro 2007). Hertzian waves include electromagnetic waves in the range between
150 kHz and 30 GHz and include microwaves applied at 915 or 2450 MHz, and RF at
13.56, 27.12, or 40.68 MHz (Tewari 2007, Orsat and Raghavan 2005). Ohmic heating is
generated by using an unrestricted frequency and waveform to generate heat due to the
electrical resistance of the foods (Vicente and Castro 2007). As these technologies are
improved, their advantage compared to traditional heating is that the heat is generated

8/14/2019 Thesis-Org Complete (1)
http://slidepdf.com/reader/full/thesis-org-complete-1 29/194
1.1.4. Regulatory status of pasteurization technologies
According to the Canada National Dairy Code (CFIS 2005) pasteurization is the
process of heating every particle of a dairy product in equipment that is designed and
operated to meet or exceed the required time and temperature relationships specified.The minimum pasteurization requirements for milk based products (<10% fat) are 63 °C
x 30 min (batch/vat) or 72 °C x 15 s (HTST), for pr oducts with higher fat content or
sugar (>10%), the temperature requirements are higher (66 °C x 30 min or 75 °C x 15
s), as for frozen dairy product mixes time-temperature combinations of 69 °C x 30 min,
83 °C x 15 s or 80 °C x 25 s are required. The Onta rio Milk Act Regulation 761 R.R.O.
1990 (OMAFRA 1990) states that skim milk and whey should be pasteurized at least at
69 °C x 30 min, milk for the purpose of cheese maki ng at 62 °C x 30 min, or 72 °C x 16

8/14/2019 Thesis-Org Complete (1)
http://slidepdf.com/reader/full/thesis-org-complete-1 30/194
°C x 0.05 s and 100 °C x 0.001 s), with a requireme nt to increase the temperature by 3
°C for milks with fat content higher than 10%. The International Dairy Federation (FIL-
IDF) defines pasteurization as a process applied to a product with the object of
minimizing possible health hazards arising from pathogenic microorganisms associated
with milk. This is generally achieved by applying a heat treatment, which results in
minimal chemical, physical and organoleptic changes to the product. Various
temperature and time combinations are used by the dairy industry including:
thermization, which requires heating at 63 to 65°C for 15 to 20 seconds to maintain milk
quality at the plant pending final use; pasteurization to destroy pathogenic
microorganisms conducted at 63°C x 30 minutes or 72 °C x 15 s, and commercial
sterilization, which is achieved by heating to about 115°C x 10-20 min, or %135°C for a
few seconds (Cerf 1986).

8/14/2019 Thesis-Org Complete (1)
http://slidepdf.com/reader/full/thesis-org-complete-1 31/194
pasteurized foods must be frozen or refrigerated to preserve product quality, NACMCF
agreed to define pasteurization as follows: Any process, treatment, or combination
thereof that is applied to food to reduce the most resistant microorganism(s) of public
health significance to a level that is not likely to present a public health risk under
normal conditions of distribution and storage (NACMCF 2006). NACMCF also
recommend that regulatory agencies establish a Food Safety Objective (FSO) and/or a
performance standard for food pathogen combinations that can be used as the basis for
judging equivalency when a process is evaluated as an alternative to traditional
pasteurization. The FSO concept has been previously proposed by the International
Commission on Microbiological Specifications for Foods (ICMSF 2002), and its
application is currently being reviewed by a collaborative group facilitated by the
International Life Sciences Institute (Bourdichon and others 2009, Membré and others
8/14/2019 Thesis-Org Complete (1)
http://slidepdf.com/reader/full/thesis-org-complete-1 32/194
-. / 0 1 2 0 3 4 567 Eq. 1-2
The future for regulatory acceptance of non-thermal technologies is promising.
Two of the leading authorities assessing the risk that novel technologies, such as PEF,
may present to public health are the European Food Safety Authority and the U.S. Foodand Drug Administration. Therefore, there is hope in the industrial sector that this
regulatory scrutiny will accelerate the commercialization of emerging technologies and
its products (Smith 2007).
1.1.5. Sustainable dairy processing
Because of the increasing public awareness of the environmental impact caused
by human activities, the dairy industry has taken the lead in analyzing the different
8/14/2019 Thesis-Org Complete (1)
http://slidepdf.com/reader/full/thesis-org-complete-1 33/194
electricity and 34.4% of the fuel were consumed at the pasteurization operation in the
manufacture of bottled milk. Pasteurization was the second highest operation in
electricity consumption after cold storage (40.9%), and also second in fuel consumption
after bottle washing (58%). It was estimated that, in total, 88 kJ/kg of fuel and 20 kJ/kg
of electrical energy were consumed in the manufacture of pasteurized bottled milk.
A more recent review of the pasteurized milk production process was conducted
by Nicol and others (2005), who observed that the energy consumption for pasteurized
milk production in a line that uses 13 MPa for homogenization and 90% regeneration at
the heat exchanger consumed a total of 133.6 kJ/L of thermal energy and 11.5 kJ/L of
electrical energy per hour in a 24,000 L/h processing plant. The energy consumption
can be decreased with higher heat exchanger regeneration efficiency or partial
homogenization.
8/14/2019 Thesis-Org Complete (1)
http://slidepdf.com/reader/full/thesis-org-complete-1 34/194
PEF treatment can be applied as: 5-35-50-5 °C; cons equently, it needs a pre-heating of
30°C and post-cooling of 45°C making regeneration n ot feasible (Hoogland and de
Haan 2007).
As reviewed by Toepfl and others (2006) there is a potential to apply PEF for
environmentally friendly and energy efficient processing, the strategies analyzed can be
related to dairy processing in the sense that the pasteurization of liquid food can be
improved by achieving a sufficient reduction of microbes with low energy consumption
by combining PEF with mild heat, and the waste water treatment can be improved by
disintegrating excess sludge and destroying cells to release intracellular material to be
utilized to initiate biodegradation and autolysis of cells. Therefore, new technologies
have a niche in sustainable food processing, as individual techniques like RFEF and
PEF are compared by their energy usage (Geveke 2005).

8/14/2019 Thesis-Org Complete (1)
http://slidepdf.com/reader/full/thesis-org-complete-1 35/194
1.2. Pulsed electric fields
Fundamentally pulsed electric field technology consists of delivering an electric
field in pulses to a food medium. To generate a high voltage of pulsed electrical field of
several kV/cm within food, a large flux of electrical current must flow through a piece offood in a treatment chamber for a very short period of time (Zhang and others 1995).
The high voltage power supply for the system can be either an ordinary source of direct
current or a capacitor charging power supply with inputs of high frequency alternating
current (AC).Pulses are formed by the pulse-forming network (PFN), which consists of one or
more power supplies with the ability to charge voltages (up to 60 kV), switches (ignitron,
thyratron, tetrode, spark gap, semiconductors), capacitors (0.1-10 !F), inductors (30

8/14/2019 Thesis-Org Complete (1)
http://slidepdf.com/reader/full/thesis-org-complete-1 36/194
" #
Figure 1-3. Block diagrams of pulse power systems and their pulse shapes.
Adapted from: DeHaan (2007), Barbosa-Cánovas and Altunakar (2006), Toepfl (2006), Heinz and others (2002), Zhang and others (1995).
Treatment
ChamberPowerSupply
EnergyStorage
Capacitor(C O)
ChargingResistor
( Rs)
DischargeSwitch
V o l t a g e ( k V )
time (!s)
V o l t a g e ( k V )
time (!s)
TreatmentChamber
Bipolar
Bipolar
Exponentialdecay
Squarewave
A
B
C O C O C O
RO L L
Inductor( L)

8/14/2019 Thesis-Org Complete (1)
http://slidepdf.com/reader/full/thesis-org-complete-1 37/194
The most important parameter influencing microbial inactivation is electric field
strength (E ), as pore formation occurs when the threshold value of the membrane
potential is surpassed (Toepfl 2006). E can be calculated based on Eq. 1-3 (Ho and
Mittal 2000). The minimum E is influenced by cell size and orientation and limited by the
dielectric strength of the material (Heinz and others 2002, Ho and Mittal 2000).
Treatment intensity is influenced by the number of pulses and treatment time, which can
be calculated using Eq. 1-4 as in Ho and Mittal (2000) and Walkling-Ribeiro (2008).
8 " 9 :, Eq. 1-3
;< " = & >? Eq. 1-4
Of the two types of pulse waveforms (exponential decay and square wave)

8/14/2019 Thesis-Org Complete (1)
http://slidepdf.com/reader/full/thesis-org-complete-1 38/194
close to the electrodes, assuming an adiabatic system for all the waveforms as in Eq. 1-
5 (Jaeger and others 2009, Aronsson and others 2005, Picart and others 2002).
@ " 9 & 3 & ;< Eq. 1-5
For exponential decay pulses, specific energy input can be estimated based on
the energy stored at the capacitor (Eq. 1-6), taking into consideration that there are
electricity losses in the PFN and cables that need to be taken into account (Toepfl 2006,
Ho and Mittal 2000, Zhang and others 1995).
@AB " ##9C & D( E, ( & F & G% Eq. 1-6
For exponential decay and square wave pulses specific energy (wsp) can be
calculated based on measured media conductivity and electric field strength (Eq. 1-7).
8/14/2019 Thesis-Org Complete (1)
http://slidepdf.com/reader/full/thesis-org-complete-1 39/194
of the chamber (W) and length (L) of the electrodes. This design is applied to
electroporate cells in the laboratory in batches. In continuous systems liquid food can be
treated as they flow through electrodes in a co-axial or co-field design (Van den Bosch
2007). While cross-field chambers provide the most uniform electric field, treatment is
reduced in boundary regions, especially in batches without mixing, and affects the
microbial inactivation kinetics. In continuous chambers this non-uniformity can be
prevented by adding multiple treatment zones (Toepfl 2006).
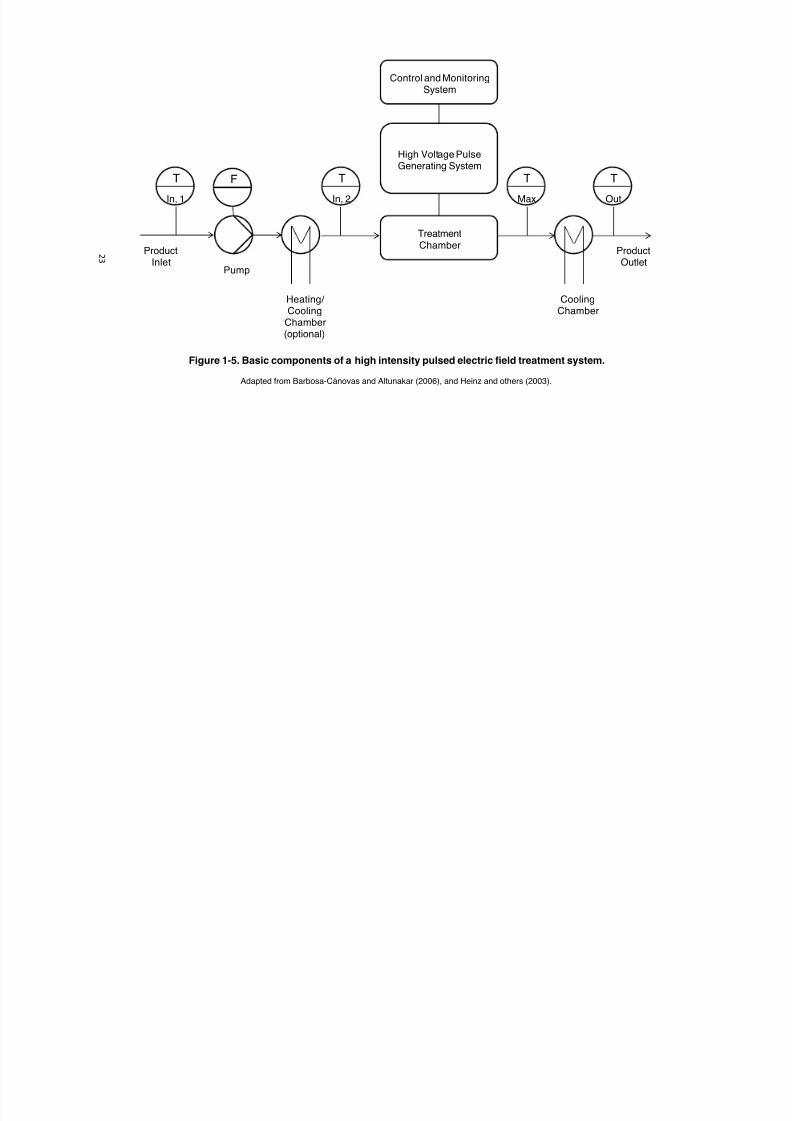
Based on the principles reviewed above, a PEF processing system can be built
by adding other components including a pump, a control and monitoring system (an
oscilloscope), a pre-treatment heating/cooling chamber, a post-treatment cooling
chamber and a temperature monitoring system (Barbosa-Cánovas and Altunakar 2006,
Heinz and others 2003) as in Figure 1-5.

8/14/2019 Thesis-Org Complete (1)
http://slidepdf.com/reader/full/thesis-org-complete-1 40/194
"
"
Figure 1-4. Types of treatment chambers.
Adapted from Mastwiijk and others (2007), van den Bosh (2007), Barbosa-Canovas and Altunakar (2006), and Zhang and others (1995).
Anode
Cathode
H
L
W
Cross-field
Parallel Plate
Food Electrode
Co-Axial
Batch
Insulator
L
R
L
R
Co-linear
(Co-Field)
Continuous
+
+
+
8/14/2019 Thesis-Org Complete (1)
http://slidepdf.com/reader/full/thesis-org-complete-1 41/194
"
#
Figure 1-5. Basic components of a high intensity pulsed electric field treatment system.
Adapted from Barbosa-Cánovas and Altunakar (2006), and Heinz and others (2003).
Product
Inlet
T
In, 1
F T
In, 2
TreatmentChamber
High Voltage PulseGenerating System
T
Max
T
Out
Control and MonitoringSystem
Product
OutletPump
Heating/Cooling
Chamber(optional)
CoolingChamber
8/14/2019 Thesis-Org Complete (1)
http://slidepdf.com/reader/full/thesis-org-complete-1 42/194
Enzymes are used to monitor milk pasteurization as their sensitivity to heat
varies and can be predicted (Griffiths 1986). The efficacy of HTST pasteurization can be
checked by the inactivation of alkaline phosphatase and pasteurization at higher
temperatures (> 80 °C) by lactoperoxidase (Walstra and others 2006). Because of this,
studies have been conducted on alkaline phosphatase with inactivation up to 59% in
raw milk at an electric field of 2.2 kV/mm (Castro and others 2001). Other enzymes, for
example, plasmin, peroxidase, microbial proteases and lipases, have also been studied
(Elez-Martínez and others 2007, Sampedro and others 2005).
Studies in products prepared with PEF-treated milk like cheese and yogurt have
concluded that they were similar to those that had been heat-treated and had a good
acceptability (Sobrino-L'pez and Martín-Belloso 2009, Sampedro and others 2005).
The application of PEF in cheese production has been studied by Sepúlveda-Ahumada

8/14/2019 Thesis-Org Complete (1)
http://slidepdf.com/reader/full/thesis-org-complete-1 43/194
1.3. Combined processes
As encompassed by the hurdle technology concept, the use of an intelligent mix
of hurdles can improve the microbial stability, safety, sensory, nutritional quality and
economic aspects of foods (Leistner and Gould 2002). While initially hurdle technology
was aimed to improve microbial quality and safety of foods, the next step included
sensory and nutritional quality in the optimization of processing. As reviewed by Leistner
and Gould (2002), new approaches include: sustainable processing, predictive
modeling, barriers to food (i.e. packaging), and medical approaches (human naturalbarriers, and defense mechanisms) to hurdle technology. In developed countries the
objective is to minimally process foods, while in developing ones the aim is to keep
products stable and tasty without refrigeration (Leistner 2000).

8/14/2019 Thesis-Org Complete (1)
http://slidepdf.com/reader/full/thesis-org-complete-1 44/194
MTS was patented by the University of Zaragoza as a procedure for the
destruction of microorganisms and enzymes under controlled conditions of pressure,
heat and ultrasound. The process is continuous and the temperature can be increased
to nearly 105°C to inactivate the most resistant mi croorganisms (Ordoñez Pereda and
others 1994).
The TetraPak patented Bactocatch process, consists of removing the cream from
the milk by centrifugation to then be passed through a 1.4 !m pore size membrane
where 99.99% bacterial reduction can be achieved at 50°C with UTMP of 50 kPa and a
cross flow velocity of 7.2 m/s, while the retentate and cream go to a UHT treatment
(115°C to 130°C for 4 to 6 seconds) and then are co mbined with the nearly bacteria-free
skim milk (Marcelo and Rizvi 2009). Also, the CFMF process has advanced in parallel
with the progress in membrane science. In addition to cross-flow microfiltration, dynamic
8/14/2019 Thesis-Org Complete (1)
http://slidepdf.com/reader/full/thesis-org-complete-1 45/194
pump maintains the pressure difference at 100 MPa or more, have also been combined
with PEF (Van den Berg and others 2001b).
Similar to HHP several studies have demonstrated that the lethality of PEF can
be enhanced with increases in temperature (Jaeger and others 2009, Amiali and others
2007, Alvarez and Heinz 2007, Bazhal and others 2006, Heinz and others 2003, Smith
and others 2002, Reina and others 1998, Jayaram and others 1991). Therefore, a
treatment called high electric field short time (HEST) has been proposed by Sampedro
and others (2007) that incorporates PEF in the lines of HTST treatment. The idea is to
reduce the consumption of PEF energy to warm up the product initially. Advanced
systems that are based on this approach include that used by Sepúlveda and others
(2005) that recovers the heat produced in the treatment chamber from the outgoing milk
stream, and incorporate it into the incoming milk stream by using a tube-in-tube heat

8/14/2019 Thesis-Org Complete (1)
http://slidepdf.com/reader/full/thesis-org-complete-1 46/194
consists of applying an electric field to the membrane with the purpose of preventing
fouling. The process has been called cross-flow electro-filtration (Wakeman 1998,
Visvanathan and Ben Aim 1989).
1.4. Microbial stress
As hurdle technology seeks to achieve microbial inactivation based on the
concepts of metabolic exhaustion (as microorganisms use their repair mechanisms to
overcome their hostile environment they spend energy and die), and multi-target
preservation (the perturbation of different targets within the microbial cells in one hit),
the risk of increased microbial resistance while applying minimal processing exists
(Leistner 2000).

8/14/2019 Thesis-Org Complete (1)
http://slidepdf.com/reader/full/thesis-org-complete-1 47/194
resistance include freezing, dehydration, HHP, PEF, and irradiation (Juneja and Novak
2003).
1.4.1. Microbial stress responses
Because of the potential risk of unfavorable microbial stress response, studies
have focused on how microorganisms sense and respond to mild stresses, especially
pathogenic microbes like E. coli and L. monocytogenes , which may respond with
increased virulence (Hill and others 2002).
At the molecular level, microorganisms like E. coli have developed transduction
systems to sense environmental stresses and to control the expression of genes
involved in defense mechanisms. By using these adaptive networks microorganisms
modify their environments and/or survive the stress condition (Chung and others 2006).
8/14/2019 Thesis-Org Complete (1)
http://slidepdf.com/reader/full/thesis-org-complete-1 48/194
level including the detection of stress response genes (using molecular probes), mRNA
analysis (Northern analysis, microarray-genome-wide expression or reverse
transcription polymerase chain reaction), the detection of stress proteins (using gel
electrophoresis or antibodies), or biosensors (Yousef and Courtney 2003). Quantitative
methods to monitor changes in relative stress resistance will be discussed below.
Heat shock proteins (HSP) can be monitored in real time by constructing
biosensors that report the induction of genes related to their synthesis (Zhang and
Griffiths 2003). Microbial biosensors are basically analytical devices that combine a
biological sensing element with a transducer (energy converter) to produce a signal
proportional to the concentration of the chemical of interest. For that purpose
microorganisms have been integrated with a variety of transducers like: amperometric,
potentiometric, calorimetric, conductimetric, colorimetric, luminescence and

8/14/2019 Thesis-Org Complete (1)
http://slidepdf.com/reader/full/thesis-org-complete-1 49/194
48 °C was needed to double or triple the D 64°C values. Murano and Pierson (1992) heat-
shocked E. coli O157:H7 (32 °C to 45 °C for up to 15 minutes) caus ing resistance to a
higher temperature treatment (55 °C). Juneja and ot hers (1998) observed a lag period
(increase of 4 to 6 min) in the inactivation of E. coli O157:H7 at 60 °C when it was
previously exposed to heat shock (46 °C) in a beef gravy system.
1.4.2. Cross protection
The concept of stress adaptation resulting from increased resistance due to non-
related stresses (heterologous) is called cross-protection (Ravishankar and Juneja
2003). The term was initially proposed by Lou and Yousef (1996), who observed an
increase in heat resistance (D 56°C ) in L. monocytogenes at several growth phases,
following exposure to starvation, acid treatment, hydrogen peroxide (H2O2), and ethanol.

8/14/2019 Thesis-Org Complete (1)
http://slidepdf.com/reader/full/thesis-org-complete-1 50/194
1.4.3. Risks associated to PEF
Little research has analyzed the risks of adaptation responses due to PEF. An
unusual risk related to the application of PEF is the possibility of transferring
extracellular DNA material that, once incorporated in more resistant microorganisms,
may confer pathogenic traits. In an assessment of pulsing non-electrocompetent and
electrocompetent Lactobacillus casei in buffer containing the plasmid pIA)8 that carries
chloramphenicol resistance, it was found that there was no transfer between cells that
were not pre-conditioned for electroporation, therefore the risk of cross-transformationmay be low (Rodrigo and others 2007).
1.5. Microbial physiology and inactivation

8/14/2019 Thesis-Org Complete (1)
http://slidepdf.com/reader/full/thesis-org-complete-1 51/194
Liquid media continue to be developed as part of injury recovery protocols, and
highly selective enrichment methods continue to advance. For example, in the case of
L. monocytogenes a broth named Pennsylvania State University broth has been
optimized, and applied successfully in the recovery of HHP injured L. monocytogenes
(Bull and others 2005). The most probable number technique (MPN), based on the
statistical analysis of the probabilities of microbial growth in liquid media placed in
multiple tubes, increases the sensitivity of the estimations to around < 5CFU/g
(Davidson and others 2004), and has been applied to increase the spread plate
detection below 25 CFU/ml when enumerating E. coli O157:H7 after pulsing apple juice
and apple cider with light (PL) (Sauer and Moraru 2009). MPN has been applied in
combination with the pour plate technique by Elwell and Barbano (2006) to analyze the
low total counts in CFMF processed milk. One weakness of this method is that it

8/14/2019 Thesis-Org Complete (1)
http://slidepdf.com/reader/full/thesis-org-complete-1 52/194
fluorescent signal proportional to the number of cells present is automatically read
(Fung 2009).
Modifications to solid media techniques include the thin agar layer method (TAL)
evaluated by Kang and Fung (1999) in L. monocytogenes and by Wu and Fung (2001)
in E. coli O157:H7, L. monocytogenes , S. Typhimurium, and S. aureus , to recover heat
injured cells, consists of recovering the injured microbial population in non-selective
media temporarily and adding selective media to recover the target population.
García and others (2006) monitored injury in E. coli after applying PEF by adding
sodium chloride (4%) to Nutrient Agar, or incubating in peptone water containing sodium
azide (500 !g/ml) chloramphenicol (100 !g/ml), rifampicin (10 !g/ml), cerulenin (70
!g/ml) or penicillin G (100 !g/ml) for 2 hours prior to plating on Nutrient Agar.
Cytometry is a process for measuring the physical and chemical characteristics

8/14/2019 Thesis-Org Complete (1)
http://slidepdf.com/reader/full/thesis-org-complete-1 53/194
culturable E. coli and Pseudomonas putida after pasteurization (Gunasekera and others
2002), the application of fluorescence-in-situ-hybridization to detect E. coli (Gunasekera
2003), detection of respiring E. coli O157:H7 (Yamaguchi and others 2003), gram
differentiation of a mixture of microorganisms (Holm and Jespersen 2003), and to
characterize the microflora of milk (Holm and others 2004ab).
Milk is difficult to study because of its high content of macromolecules (especially
fat and proteins) that make it opaque. For that reason, clarification protocols, including
savinase (EC 3.4.21.52), and Triton X-100 to remove the fat, and the enzymes
proteinase K (EC 3.4.21.52), and subtilisin (EC 232-752-2) to digest the protein
(Gunasekera 2000, Yamaguchi and others 2003) have been employed.
An advantage of flow cytometry over related methods is the ability to sort target
populations for further analysis, the physiological states of these clusters can be

8/14/2019 Thesis-Org Complete (1)
http://slidepdf.com/reader/full/thesis-org-complete-1 54/194
plantarum in model beer. In a subsequent study, the permeability of L. plantarum in
model beer after PEF was determined (Ulmer and others 2002). This application has
been extended to the measurement of membrane damage and viability with the
nucleotide-binding dyes PI and SYTO 9 by PEF in Lactobacillus leichmannii , L.
monocytogenes , and E. coli O157:H7 using a spectrofluorimeter combined with
fluorescence microscopy (Unal and others 2002). Flow cytometry and PI permeability
has been applied by Wouters and others (2001b) to study membrane damage of
exponential and stationary phase cells of L. plantarum . Recently Aronsson and others
(2005), studied membrane permeability by PI, and cell content leakage (ATP) by means
of luminescence. García and others (2007) utilized a spectrofluorophotometer to
monitor PI intake by two gram negative (E. coli and Salmonella Senftenberg) and two
gram positive (L. plantarum and L. monocytogenes ) bacteria and related it to the
8/14/2019 Thesis-Org Complete (1)
http://slidepdf.com/reader/full/thesis-org-complete-1 55/194
There are two schools of thought regarding the electrical membrane breakdown
phenomenon. In the classical electromechanical models the membrane is considered
as a homogeneous bulk elastic layer, which under an external electrical field is stressed
by a compressive force that creates a restoring electric strain. When a critical trans-
membrane voltage at which electric compression exceeds the electric strain is reached
rupture occurs. These models do not consider the proteins between the lipid bilayer or
ionic channels that cross the membrane. From a chemical perspective membrane
rupture is due to an imbalance in molecular/ionic concentration resulting from charge
transport across the membrane where the membrane rupture occurs as a secondary
process. With the increase of trans-membrane voltage, temporary aqueous pathways
across the membrane are believed to appear (Jayaram 2000).
Electroporation can be divided into three main stages: 1) initial stage (within ns to

8/14/2019 Thesis-Org Complete (1)
http://slidepdf.com/reader/full/thesis-org-complete-1 56/194
special challenges. It is important to emphasize that the ultimate purpose of processing
models is to optimize system performance; microbial models are developed to ensure
that a microbial pathogen population does not exceed a certain level (Marks 2008).
Microbial physiology, functional genomics, molecular biology and mathematical
modeling can also help to identify molecule types of living systems in terms of their
individual properties, while the emerging field of systems biology can help us to
understand the functional properties of the system as a whole. Although advances in
some areas, like comparative genomics, can help to define the genes and molecules
that help microorganisms to survive environmental stresses, the progress in single-cell
analysis techniques (i.e. flow cytometry) help to correctly analyze genetic and
physiological characteristics that can be related to the whole population (Brul and
Westerhoff 2007).

8/14/2019 Thesis-Org Complete (1)
http://slidepdf.com/reader/full/thesis-org-complete-1 57/194
mechanistic approach is that the destruction “is an orderly time process presenting a
close analogy to a chemical reaction” (Mathys 2008, Baranyi and Pin 2004).
Researchers are constantly trying to unify models to better describe microbial events
with smooth transitions between growth and inactivation. Therefore advanced models
based on population dynamics considering events at the cellular level continuos to be
studied and developed (Peleg 2006, Corradini and others 2010).
Traditionally investigators working on mechanistic models rely on the fact that
these models are capable of accurately predicting the microbial inactivation response to
thermal treatment conditions outside the range in which experimental data is obtained.
Process engineers have designed ultra-high temperature (UHT) or high temperature
short-time (HTST) and pasteurization processes that operate at higher temperatures
based on this extrapolation capability (Teixeira 2007).
8/14/2019 Thesis-Org Complete (1)
http://slidepdf.com/reader/full/thesis-org-complete-1 58/194
1.6.1. Modeling growth
Microorganisms multiply when exposed to favorable environments. Vegetative
bacterial cells, yeasts and molds reproduce in a process called transverse binary
fission, or simply binary fission. In this process a cell divides asexually into two cells
with each cell becoming a replica of the original cell (Ray 2004).
After inoculation in fresh medium a population remains temporarily with no
division, but may be growing in volume or mass, synthesizing enzymes, proteins and
increasing metabolic activity in what is called the lag phase. In the laboratory a growingbacterial population doubles at regular intervals by geometric progression: 20, 21, 22,
23… 2n, where n = the number of generations in what is called exponential growth. The
generation time is the time interval required for the cells to divide, and can be expressed

8/14/2019 Thesis-Org Complete (1)
http://slidepdf.com/reader/full/thesis-org-complete-1 59/194
and others 2000) with the goal to determine the borderline conditions that prevent
growth of a given microorganism without inactivation intervention. Automated equipment
that detects growth allows quantification once a threshold value of the measured
response is clearly greater than the noise seen over time at no growth conditions
(Legan and others 2002).
As mentioned above (section 1.5), media for assessing microbial recovery can
be both liquid and solid, with solid media preferred to enumerate individual cells based
on the formation of colonies (FIL-IDF 1990). Because the construction of models using
viable count data is time consuming and expensive, researchers are constantly
exploring rapid methods to accumulate sufficient data for modeling. One of the simplest
methods to monitor growth is optical density with instruments like the Bioscreen
(McKellar and Knight 2000). Turbidimetric data can also be collected using microplates,
8/14/2019 Thesis-Org Complete (1)
http://slidepdf.com/reader/full/thesis-org-complete-1 60/194
comparing with other models (Baranyi and others 1999) based on their bias and
accuracy. The model in its simplest form can be expressed by Eq. 1-11.
V#;( " V. & W#XYZ[&<( Eq. 1-11
Other primary models that have been used to describe microbial growth in time
include the Logistic, Gompertz, Weibull, Hills and McKellar models (López and others
2004, McKellar and Lu 2004b), and are reviewed in Chapter 4.
Growth curve parameters like lag phase or time to detection (t d ), and maximum
growth rate ( ! max ) considering pH, and water activity (a w ), have been determined for E.
coli after PEF treatment by Aronsson and others (2004). The secondary models applied
to describe the variation of these parameters with respect to environmental conditions
(i.e. temperature, pH, water activity, and other factors like % CO2) include the following

8/14/2019 Thesis-Org Complete (1)
http://slidepdf.com/reader/full/thesis-org-complete-1 61/194
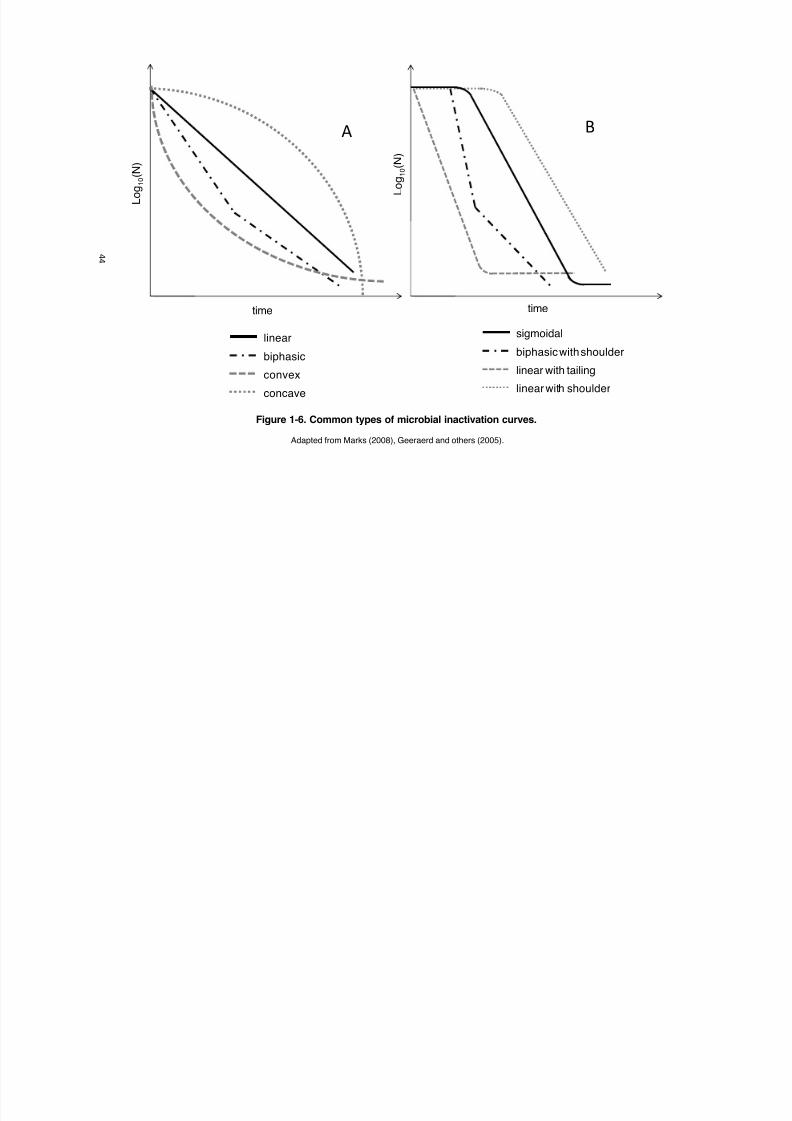
and others (2005) categorized the inactivation curves as log-linear, log-linear with
shoulder and/or tailing, Weibull type, and biphasic models to present the Microsoft®
Excel add-in GInaFit (Bioprocess Technology and Control, Leuven Katholieke
Universiteit. Leuven, Belgium) to predict inactivation curves. An illustration of the
common types is depicted in Fig. 6.
In order to explain the kinetics of microbial inactivation by PEF it is important to
consider the factors affecting the mechanism of action. As reviewed before, it is
generally known that microbial membranes that electrically insulate an electrical field
produce an accumulation of charges with opposite polarity on either side of the
structure, and pore formation occurs when a certain threshold value of electric field (E )
is exceeded (Heinz and others 2002). A trans-membrane potential (TMP) of at least 1 V
(E = 2.5 kV/mm) is needed to achieve irreversible pore formation (Ho and Mittal 2000),
8/14/2019 Thesis-Org Complete (1)
http://slidepdf.com/reader/full/thesis-org-complete-1 62/194
" "
Figure 1-6. Common types of microbial inactivation curves.
Adapted from Marks (2008), Geeraerd and others (2005).
#
$
L o g 1 0
( N )
L o g 1 0
( N )
linear
time time
biphasic
linear with shoulderconcave
sigmoidal
linear with tailingconvex
biphasic with shoulder
8/14/2019 Thesis-Org Complete (1)
http://slidepdf.com/reader/full/thesis-org-complete-1 63/194
The first attempts to describe the kinetics of inactivation by PEF were made by
H*lsheger and others (1981). They described PEF inactivation separately based on
electric field value (Eq. 1-14), and treatment time (Eq. 1-15), and combined both
parameters in a simplified model (Eq. 1-16).
kl m " /no & kl#` / `p.( Eq. 1-14
kl m " /nq & kl#r rp., ( Eq. 1-15
m " #rsrp.(t#oto
uv( w,
Eq. 1-16
Peleg (1995) described the inactivation based on Fermi’s equation as described
in Eqs. 1-17 and 1-18.
8/14/2019 Thesis-Org Complete (1)
http://slidepdf.com/reader/full/thesis-org-complete-1 64/194
value is an indicator of microbial resistance and can be used to compare
microorganisms or processing conditions.
F#;( " •t€ & & #;‚tƒ( & „WLt#<…(†N‡ Eq. 1-20
rˆ " } & ‰#Š 2 ‹tƒ( Eq. 1-21
The variations in the scale (b ) and shape parameters (n ) of the Weibull model
have been further developed to include food composition. For example, Rodrigo and
others (2003) developed a model to quantify the effect of carrot juice addition to orange
juice on the inactivation of E. coli . In a later study by García and others (2005a) the n
values were related to E and pH, and the variation was explained by a fitting of the
Gompertz equation.
8/14/2019 Thesis-Org Complete (1)
http://slidepdf.com/reader/full/thesis-org-complete-1 65/194
These models (Bigelow, H*lsheger, Gompertz, Peleg and Weibull), have been
compared by various authors (Rodrigo and others 2001, Sampedro and others 2006)
with the Weibull having a better accuracy factor in the first study, and the H*lsheger,
and Weibull having lower Mean Square Errors (MSE) than the Bigelow in the second
one.
Because of the integrative characteristic of the PEF energy parameter, a trend to
relate microbial inactivation to the PEF energy applied was initiated by Heinz and others
1999, who related field strength settings and pulsing time based on energy levels and
concluded that a minimum of 0.4 kJ/kg per pulse were needed to inactivate Bacillus
subtilis . Subsequent studies like that of Alvarez and others (2003) with L.
monocytogenes , substitute treatment time by specific energy, which was then included
in the Weibull distribution model. In a related study, the energy efficiency of apple juice
8/14/2019 Thesis-Org Complete (1)
http://slidepdf.com/reader/full/thesis-org-complete-1 66/194
8/14/2019 Thesis-Org Complete (1)
http://slidepdf.com/reader/full/thesis-org-complete-1 67/194
2. Factors affecting the inactivation of native bacteria in milk processed by pulsed
electric fields and cross-flow microfiltration
2.1. Introduction
To control of microorganisms naturally present in milk the dairy industry depends
on heat treatment and cold preservation. Standards like the Pasteurized Milk Ordinance
serve as the reference in which time-temperature combinations for pasteurization of
products with different composition is described together with other guidelines (FDA
2009). It is generally recognized that heat pasteurization does not ensure commercial
sterility (NACMCF 2006) and an excessive heat treatment can be associated with other
health risks (e.g. formation of acrylamide, heterocyclic aromatic amines, or furans)
resulting from the formation of toxic substances (DFG 2007). Ross and others (2003)

8/14/2019 Thesis-Org Complete (1)
http://slidepdf.com/reader/full/thesis-org-complete-1 68/194
the application of PEF in conjunction with high temperature short time (HTST) treatment
as a pre-heating step. Recent studies have explored hurdle processing of milk with PEF
and other processing technologies, for example, Walkling-Ribeiro and others (2009)
combined PEF with heat as a subsequent process, Noci and others (2009) combined
PEF with thermosonication, and Smith and others (2002) combined PEF with moderate
heat and antimicrobial agents, such as nisin and lysozyme.
Due to the variety of processing and product parameters which affect the
application of PEF, reviews by Sampedro and others (2005), and Sobrino-López and
Martín-Belloso (2009) suggested that different approaches are necessary to analyze the
effect of milk nutrients on the effectiveness of pulsed electric fields for milk processing
and preservation. Processing conditions (i.e. electric field strength, pulse number, pulse
width, treatment time and processing temperatures), microbial analysis (i.e.

8/14/2019 Thesis-Org Complete (1)
http://slidepdf.com/reader/full/thesis-org-complete-1 69/194
The objective of this study was the evaluation of the impact of a PEF system at
different steps of milk processing for the reduction of the microbial load in milk with
different fat levels. Moreover, the impact of CFMF applied prior to PEF treatment, and
the effects of cream homogenization were investigated as well as the correlation
between the fat and solids content and electrical conductivity at the different stages of
milk processing.
2.2. Materials and Methods
2.2.1. Conventional and alternative milk processing
The sequences of conventional and alternative processing of milk used are
shown in Figure 2-1. Conventional processing of milk was carried out with raw milk
8/14/2019 Thesis-Org Complete (1)
http://slidepdf.com/reader/full/thesis-org-complete-1 70/194
pre-heat milk, which exited the homogenizer at 12°C , to 50°C. By contrast, in an
alternative processing sequence separated skim milk was passed through a CFMF pilot
plant system (MFS-1, TetraPak, Aarhus, Denmark) with a membrane pore size of 1.4
!m at temperatures of 35°C with respective inlet and outlet pressures of 90 (at 120 L/h),
and 20 kPa (at 12 L/h). The skim milk CFMF retentate was transferred in aseptic
containers for PEF processing. In the other stream, standardized cream (12%) was
exposed to a pasteurization treatment with PEF after homogenization under the same
conditions described above. Both processing approaches were concluded with PEF or
HTST milk pasteurization under the processing conditions described below.
2.2.2. PEF treatment
For non-thermal processing of standardized milk and cream a PEF system was used.

8/14/2019 Thesis-Org Complete (1)
http://slidepdf.com/reader/full/thesis-org-complete-1 71/194
" #
Figure 2-1. Milk process sequence in conventional and alternative fluid milk processing
Products (ovals) and processes (rectangles) compared in this study are highlighted in gray. SEPT = Separation, STND = Standardization, HOMO:
Homogenization, PAST = Pasteurization, CFMF = Micro-filtration. Adapted from Pedersen 1992, and Walstra and others 2006.
Raw
Skim Cream
Milk
Raw
Skim
Upstream
Downstream
C o n v e t i o n a l M i l k P r o c e s s i n g
A l t e r n a t i v e M i l k P r o c e s s i n g
Cream
Cream
Skim
Milk
Skim
CreamMilk
SEPT
STND
HOMO
PAST PAST
PAST
HOMO
CFMF
STND
STND
SEPT

8/14/2019 Thesis-Org Complete (1)
http://slidepdf.com/reader/full/thesis-org-complete-1 72/194
8/14/2019 Thesis-Org Complete (1)
http://slidepdf.com/reader/full/thesis-org-complete-1 73/194
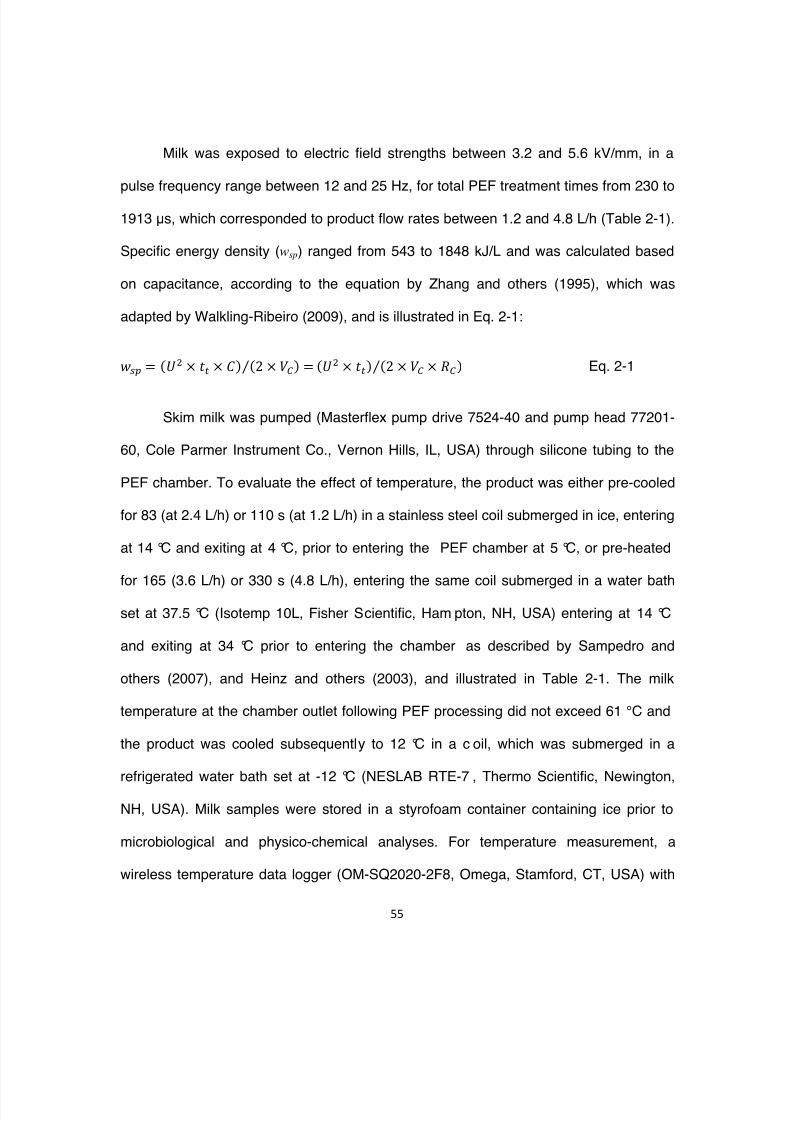
Milk was exposed to electric field strengths between 3.2 and 5.6 kV/mm, in a
pulse frequency range between 12 and 25 Hz, for total PEF treatment times from 230 to
1913 !s, which corresponded to product flow rates between 1.2 and 4.8 L/h (Table 2-1).
Specific energy density (wsp) ranged from 543 to 1848 kJ/L and was calculated based
on capacitance, according to the equation by Zhang and others (1995), which was
adapted by Walkling-Ribeiro (2009), and is illustrated in Eq. 2-1:
@AB " #9C & ;< & D( #E & Oº( ", #9C & ;<( #E & Oº & 1º(, Eq. 2-1
Skim milk was pumped (Masterflex pump drive 7524-40 and pump head 77201-
60, Cole Parmer Instrument Co., Vernon Hills, IL, USA) through silicone tubing to the
PEF chamber. To evaluate the effect of temperature, the product was either pre-cooled

8/14/2019 Thesis-Org Complete (1)
http://slidepdf.com/reader/full/thesis-org-complete-1 74/194
thermocouples was connected to stainless steel flow-through chambers, which, in turn,
were connected to the tubing were used. Pulses were monitored with a two-channel
digital storage oscilloscope using a bandwidth of 100 MHz and a sample rate of 1 GS/s
(TDS1012B, Tektronix Inc., Beaverton, OR, USA).
2.2.3. Conventional heat treatment of milk
High-temperature short-time (HTST) pasteurization of milk was conducted in the
aforementioned pilot scale dual stage heat exchanger using a pre-heating temperature
of 50 °C in the first stage of the unit prior to re aching final temperatures of 72, 85, or 95
°C for holding times of 15, 20 or 15 s respectively .
2.2.4. Microbiological Analysis

8/14/2019 Thesis-Org Complete (1)
http://slidepdf.com/reader/full/thesis-org-complete-1 75/194
Oxoid, Thermo Fisher Scientific, Basingstoke, UK) before spread-plating on the relevant
media. Mesophilic micororganisms were recovered on plate count agar (247940, BD
Difco, Sparks MD, USA) after incubation for 48 h at 32 °C as recommended by Laird
and others (2004), enteric microorganisms were enumerated by plating on MacConkey
agar (R453802 Remel, Thermo Fisher Scientific, Lenexa, KS, USA) before incubation
for 24 h at 35 °C as described by Henning and other s (2004), and psychrotrophs were
also recovered on plate count agar (247940, BD Difco, Sparks, MD, USA) after
incubation for 10 d at 7 °C as suggested by Frank a nd Yousef (2004). Recovered
microorganisms were counted and log reductions were evaluated subsequently.
2.2.5. Physico-chemical properties
Electrical conductivity and pH were measured after processing at room

8/14/2019 Thesis-Org Complete (1)
http://slidepdf.com/reader/full/thesis-org-complete-1 76/194
2.2.6. Statistical analysis
Statistical analyses were conducted using R version 2.10.1 (R Foundation for
Statistical Computing, Vienna, Austria) in conjunction with the Agricolae (Mendiburu
2009) and Rcommander (Fox 2009) packages for each set of data with a minimum of
two batches (n=2) applied with two repetitions per treatment. The effect of the PEF
processing conditions on milk was compared for each of the three microbial populations
(mesophiles, coliforms and psychrotrophs) separately using a multi-way analysis of
variance and multiple comparisons of treatments by means of Tukey (HSD) with an
alpha value of 0.05. Differences between the upstream and downstream products with
regard to the relationship between electrical conductivity and composition (percentage
of fat or solids) of milk were evaluated following an analysis of covariance. Means of pH

8/14/2019 Thesis-Org Complete (1)
http://slidepdf.com/reader/full/thesis-org-complete-1 77/194
8/14/2019 Thesis-Org Complete (1)
http://slidepdf.com/reader/full/thesis-org-complete-1 78/194
" #
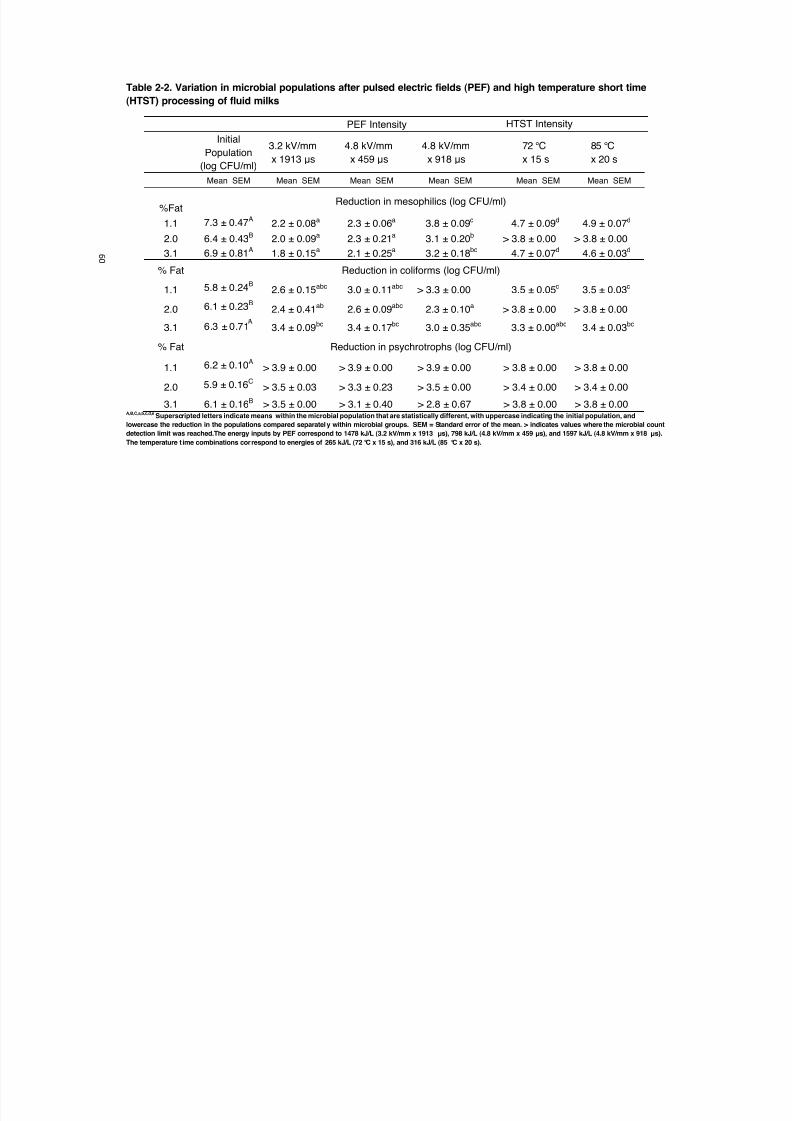
Table 2-2. Variation in microbial populations after pulsed electric fields (PEF) and high temperature short time
(HTST) processing of fluid milks
PEF Intensity HTST Intensity
InitialPopulation
(log CFU/ml)
3.2 kV/mm
x 1913 !s
4.8 kV/mm
x 459 !s
4.8 kV/mm
x 918 !s
72 °C
x 15 s
85 °C
x 20 s
Mean SEM Mean SEM Mean SEM Mean SEM Mean SEM Mean SEM
%FatReduction in mesophilics (log CFU/ml)
1.1 7.3 ± 0.47A 2.2 ± 0.08a 2.3 ± 0.06a 3.8 ± 0.09c 4.7 ± 0.09d 4.9 ± 0.07d
2.0 6.4 ± 0.43B 2.0 ± 0.09a 2.3 ± 0.21a 3.1 ± 0.20b > 3.8 ± 0.00 > 3.8 ± 0.00
3.1 6.9 ± 0.81A 1.8 ± 0.15a 2.1 ± 0.25a 3.2 ± 0.18bc 4.7 ± 0.07d 4.6 ± 0.03d
% Fat Reduction in coliforms (log CFU/ml)
1.1 5.8 ± 0.24B 2.6 ± 0.15abc 3.0 ± 0.11abc > 3.3 ± 0.00 3.5 ± 0.05c 3.5 ± 0.03c
2.0 6.1 ± 0.23B 2.4 ± 0.41ab 2.6 ± 0.09abc 2.3 ± 0.10a > 3.8 ± 0.00 > 3.8 ± 0.00
3.1 6.3 ± 0.71 3.4 ± 0.09bc 3.4 ± 0.17bc 3.0 ± 0.35abc 3.3 ± 0.00abc 3.4 ± 0.03bc
% Fat Reduction in psychrotrophs (log CFU/ml)
1.1 6.2 ± 0.10A > 3.9 ± 0.00 > 3.9 ± 0.00 > 3.9 ± 0.00 > 3.8 ± 0.00 > 3.8 ± 0.00
2.0 5.9 ± 0.16C > 3.5 ± 0.03 > 3.3 ± 0.23 > 3.5 ± 0.00 > 3.4 ± 0.00 > 3.4 ± 0.00
3.1 6.1 ± 0.16B > 3.5 ± 0.00 > 3.1 ± 0.40 > 2.8 ± 0.67 > 3.8 ± 0.00 > 3.8 ± 0.00A,B,C,a,b,c,d,e
Superscripted letters indicate means within the microbial population that are statistically different, with uppercase indicating the initial population, and
lowercase the reduction in the populations compared separatel y within microbial groups. SEM = Standard error of the mean. > indicates values where the microbial count
detection limit was reached.The energy inputs by PEF correspond to 1478 kJ/L (3.2 kV/mm x 1913 !s), 798 kJ/L (4.8 kV/mm x 459 !s), and 1597 kJ/L (4.8 kV/mm x 918 !s).
The temperature t ime combinations correspond to energies of 265 kJ/L (72 °C x 15 s), and 316 kJ/L (85 °C x 20 s).
8/14/2019 Thesis-Org Complete (1)
http://slidepdf.com/reader/full/thesis-org-complete-1 79/194
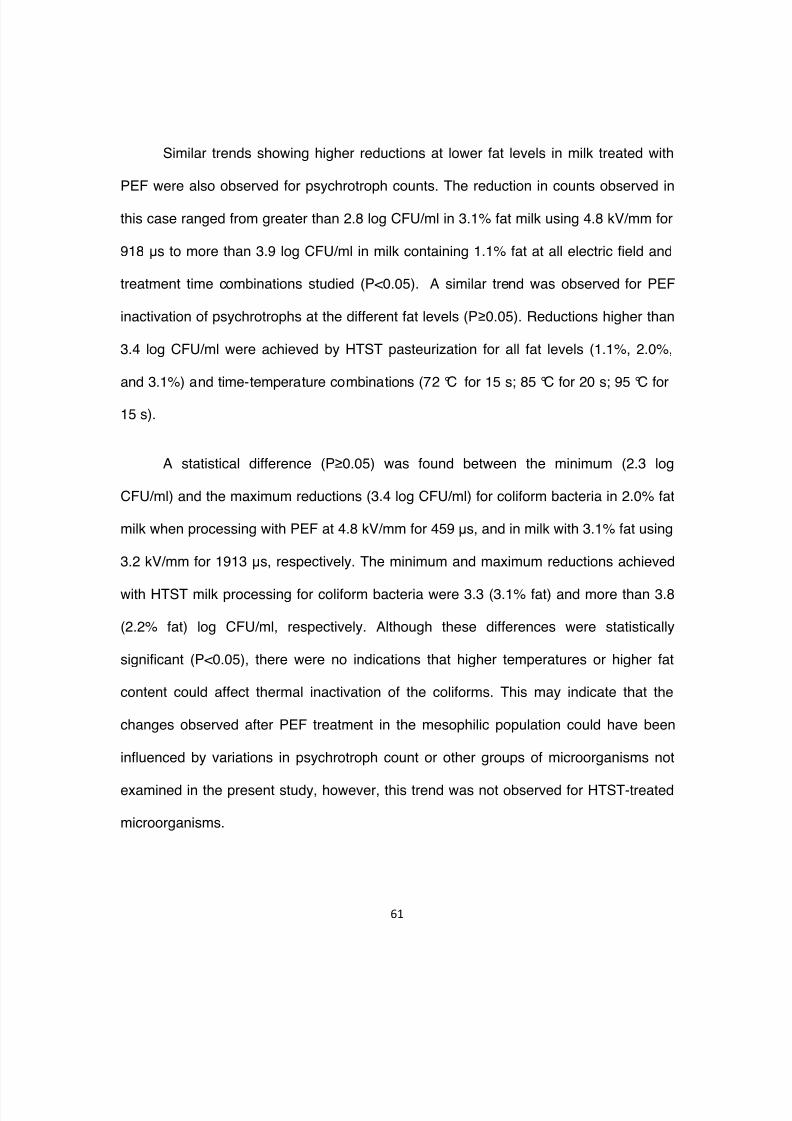
Similar trends showing higher reductions at lower fat levels in milk treated with
PEF were also observed for psychrotroph counts. The reduction in counts observed in
this case ranged from greater than 2.8 log CFU/ml in 3.1% fat milk using 4.8 kV/mm for
918 !s to more than 3.9 log CFU/ml in milk containing 1.1% fat at all electric field and
treatment time combinations studied (P<0.05). A similar trend was observed for PEF
inactivation of psychrotrophs at the different fat levels (P%0.05). Reductions higher than
3.4 log CFU/ml were achieved by HTST pasteurization for all fat levels (1.1%, 2.0%,
and 3.1%) and time-temperature combinations (72 °C for 15 s; 85 °C for 20 s; 95 °C for
15 s).
A statistical difference (P%0.05) was found between the minimum (2.3 log
CFU/ml) and the maximum reductions (3.4 log CFU/ml) for coliform bacteria in 2.0% fat
8/14/2019 Thesis-Org Complete (1)
http://slidepdf.com/reader/full/thesis-org-complete-1 80/194
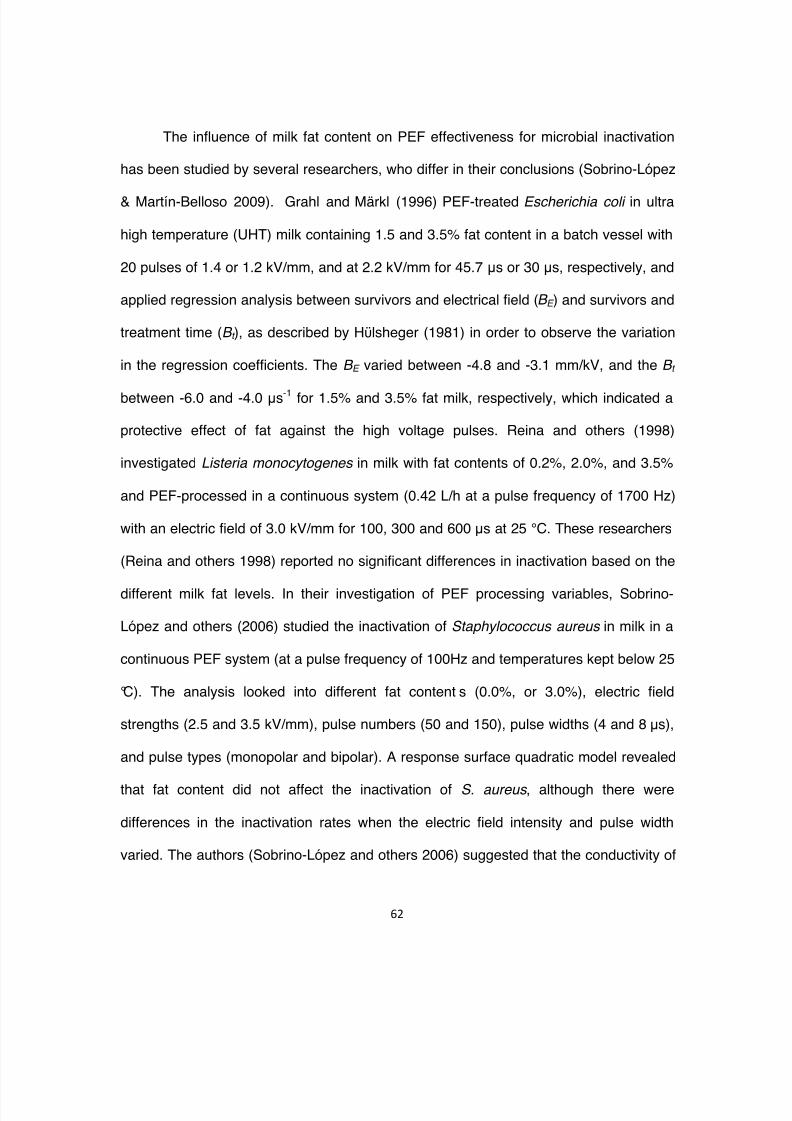
The influence of milk fat content on PEF effectiveness for microbial inactivation
has been studied by several researchers, who differ in their conclusions (Sobrino-López
& Martín-Belloso 2009). Grahl and Märkl (1996) PEF-treated Escherichia coli in ultra
high temperature (UHT) milk containing 1.5 and 3.5% fat content in a batch vessel with
20 pulses of 1.4 or 1.2 kV/mm, and at 2.2 kV/mm for 45.7 !s or 30 !s, respectively, and
applied regression analysis between survivors and electrical field (B E ) and survivors and
treatment time (B t ), as described by H*lsheger (1981) in order to observe the variation
in the regression coefficients. The B E varied between -4.8 and -3.1 mm/kV, and the B t
between -6.0 and -4.0 !s-1 for 1.5% and 3.5% fat milk, respectively, which indicated a
protective effect of fat against the high voltage pulses. Reina and others (1998)
investigated Listeria monocytogenes in milk with fat contents of 0.2%, 2.0%, and 3.5%
and PEF-processed in a continuous system (0.42 L/h at a pulse frequency of 1700 Hz)

8/14/2019 Thesis-Org Complete (1)
http://slidepdf.com/reader/full/thesis-org-complete-1 81/194

8/14/2019 Thesis-Org Complete (1)
http://slidepdf.com/reader/full/thesis-org-complete-1 82/194
2.3.2. Effect of the PEF inlet temperature on the reduction of microorganisms
The milk temperature prior to PEF processing as well as the overall exposure
time of milk to the pulse treatment affected the survival of mesophiles, coliforms and
psychrotrophs (Table 2-3). An increase of the PEF processing inlet temperature (from
5.0-6.3 °C to 34.0-34.3 °C), and doubling the milk flow rate (1.2-2.4 L/h to 3.6-4.8 L/h),
while maintaining the maximum outlet temperature at 56°C, caused a 3.3 log CFU/ml
reduction of total mesophilic bacteria when an electric field strength of 5.6 kV/mm, for
230 !s was applied. Application of a lower electric field strength of 4.0 kV/mm led to an
increase in bacterial inactivation from 1.5 to 2.8 log CFU/ml in half the time (765 !s to
383 !s), suggesting an additive treatment effect. These results confirm that the
microbial inactivation by PEF is effective at mild temperatures (between 34.3 and 50.3
°C) and that the PEF treatment of a colder product (5 0 to 5 9 °C) requires additional

8/14/2019 Thesis-Org Complete (1)
http://slidepdf.com/reader/full/thesis-org-complete-1 83/194
Table 2-3. Effect of the pulsed electric fields inlet processing temperature on the
reduction of different bacteria groups in skim milk
Inlet
Temperature
(°C) "
Intensity
Mesophilics Coliforms Psychrotrophs
Mean SEM Mean SEM Mean SEM
Microbial population
(Log CFU/ml)
Initial population 6.2 ± 0.13A 6.3 ± 0.18A 6.2 ± 0.08A
Reduction in microbial population
(Log CFU/ml)
Low(5.0-6.3 °C)
4.0 kV/mm x 765 !s 1.5 ± 0.09a 2.0 ± 0.41a 3.1 ± 0.18a
4.0 kV/mm x 1530 !s 3.7 ± 0.10c > 3.9 ± 0.00 > 3.8 ± 0.00
5.6 kV/mm x 459 !s 3.4 ± 0.05bc > 3.9 ± 0.00 > 3.8 ± 0.00
b a a
8/14/2019 Thesis-Org Complete (1)
http://slidepdf.com/reader/full/thesis-org-complete-1 84/194
Psychrotrophic bacteria in milk were reduced by the applied PEF conditions in a similar
manner as the coliform bacteria but a higher reduction in count of 3.1 log CFU/ml was
achieved at milder PEF treatment conditions (using 4.0 kV/mm for 765 !s at kJ/L).
Reina and others (1998) also observed that while applying 30 kV/mm at 1,700
Hz, an increase in temperature to 50°C was needed t o achieve a 3 to 4 log CFU/ml (at
300 and 600 !s respectively) reduction in count compared to less than 2 and 3 log
CFU/ml in a temperature range between 25 and 43 °C for 600 !s at the same treatment
times. Recent studies (Sepúlveda and others 2005, Sampedro and others 2007, and
Jaeger and others 2009) have taken a similar approach of decreasing the PEF energy
input by increasing the product inlet temperature. Sampedro and others (2007) reduced
the energy to inactivate 1.8 log CFU/ml of Lactobacillus plantarum in an orange juice

8/14/2019 Thesis-Org Complete (1)
http://slidepdf.com/reader/full/thesis-org-complete-1 85/194
exchanger to increase the temperature to around 50 °C (for a maximum temperature of
65 °C for 15 seconds). Hoogland and de Haan (2007) estimated that large-scale PEF
treatments could be applied using a heating/cooling cycle of 5-35-50-5 °C with
regeneration most likely becoming not economically feasible.
From a microbiological perspective a possible synergistic effect of temperature
and PEF treatment could be attributed to an increase in microbial membrane fluidity at
higher temperatures caused by phase transition of the phospholipids from gel to liquid-
crystalline structure, leading to more pronounced electroporation effects (Heinz and
others 2003, and Jaeger and others 2009). In complex food systems like milk the
liquefaction of colloidal particles (e.g. fat globules) that affect resistivity could also add to
potential treatment synergism. Therefore, a decrease in sample viscosity (and increase
in conductivity) is a factor that may increase milk PEF treatment efficiency as it

8/14/2019 Thesis-Org Complete (1)
http://slidepdf.com/reader/full/thesis-org-complete-1 86/194
2.3.3. Milk processing with a combination of CFMF and PEF
In order to enhance the processing efficacy, CFMF and PEF were used in a
hurdle approach (CFMF/PEF), resulting in overall higher reductions of the bacterial load
in milk (Table 2-4).
Milk processing with CFMF/PEF achieved >4.7, >4.7, and >3.7 log CFU/ml
reductions for counts of total mesophilic, coliform and psychrotroph bacteria,
respectively, using the most severe PEF conditions (at 4.8 kV/mm for 918 !s with an
energy density of 798 kJ/L), which resulted in the highest milk temperature at the PEF
chamber outlet (61 °C). A reduction to half of the energy density led to the same results
at a lower outlet temperature of the product (56 °C ). Equivalent results were obtained
for a combination of CFMF and HTST (CFMF/HTST), with the latter used at 72 °C for 15

8/14/2019 Thesis-Org Complete (1)
http://slidepdf.com/reader/full/thesis-org-complete-1 87/194
Table 2-4. Reduction of microbial populations after processing of skim milk with
cross-flow microfiltration (CFMF) and pulsed electric fields (PEF) or high
temperature short time (HTST) pasteurization in a combined approach
(CFMF/PEF; CFMF/HTST)
Treatment Intensity
Mesophilics Coliforms Psychrotrophs
Mean SEM Mean SEM Mean SEM
Microbial Population
(Log CFU/ml) Initial population 6.9 ± 0.47A 7.0 ± 0.36A 6.3 ± 0.39B
Reduction in microbial population
(Log CFU/ml)
CFMF Standard† 2.1 ± 0.11a 2.9 ± 0.07b 3.2 ± 0.09b
CFMF/PEF 3.2 kV/mm x 1913 !s 4.2 ± 0.10b > 4.7 ± 0.00 > 3.7 ± 0.00

8/14/2019 Thesis-Org Complete (1)
http://slidepdf.com/reader/full/thesis-org-complete-1 88/194
Madec and others (1992) observed that the microbial reduction in skim milk can
be constant and independent from the level of contamination, for example, the reduction
in log CFU/ml obtained for Listeria innocua ranged between 1.8 and 1.9 at
contamination levels between 102 and 106 CFU/ml and that of Salmonella abortus ovis
between 2.4 and 2.5. In their study raising the CFMF processing temperature from 35 to
50 °C increased the decimal reduction of Salmonella , from 2.5 to 3.3, but not that of
Listeria . Elwell and Barbano (2006) reported a reduction in the total counts of milk of 3.8
log CFU/ml using CFMF, and a higher microbial load reduction of 5.6 log CFU/ml was
caused by HTST when applied at 72 °C for 15 s. In t his study, because of the low initial
population the quantifiable coliform reduction was %1.2 log CFU/ml with CFMF as well
as with added heat pasteurization.
8/14/2019 Thesis-Org Complete (1)
http://slidepdf.com/reader/full/thesis-org-complete-1 89/194

8/14/2019 Thesis-Org Complete (1)
http://slidepdf.com/reader/full/thesis-org-complete-1 90/194
Table 2-5. Effect of pulsed electric fields processing on different groups of native
bacteria in cream
Pre-
treatment Intensity
Mesophilics Coliforms Psychrotrophs
Mean SEM Mean SEM Mean SEM
Microbial Population
(Log CFU/ml)
STND
Initial population
6.5 ± 0.10A 6.3 ± 0.05A 6.2 ± 0.13A
HOMO 5.6 ± 0.10B 5.5 ± 0.05B 5.5 ± 0.05B
Reduction in microbial population
(Log CFU/ml)
STND4.0 kV/mm x 765 !s 0.7 ± 0.00ab 0.4 ± 0.05a 0.5 ± 0.06a
4.0 kV/mm x 1530 !s 1.7 ± 0.05b 1.6 ± 0.07b 0.5 ± 0.00a
8/14/2019 Thesis-Org Complete (1)
http://slidepdf.com/reader/full/thesis-org-complete-1 91/194
The microbial reductions achieved in this study were higher than those obtained
by Mañas and others (2001), and Picart and others (2002) who achieved not more than
2.0 log CFU/ml reduction in E. coli counts by treating cream of higher fat content in
batch PEF systems. Mañas and others (2001) conducted their study with full-fat (33%)
cream using PEF at 3.34 kV/mm for 28 to 98 !s and suggested that a fat content above
whole milk did not enhance the protection of microorganisms against inactivation by
PEF. Similarly, Picart and others (2002) obtained a maximum reduction of 2.0 log
CFU/ml using PEF at 3.7 kV/mm for 250 !s for processing of 20% fat cream inoculated
with a cocktail of three Listeria innocua strains of different heat resistances. Toepfl and
others (2007) suggested that, theoretically, the lethal effect of PEF might be impaired by
agglomeration of microbial cells or between cells and insulating particles present in the
food The latter authors estimated that the variations within these factors may occur in
8/14/2019 Thesis-Org Complete (1)
http://slidepdf.com/reader/full/thesis-org-complete-1 92/194
Otunola and others (2008) compared the inactivation of E. coli in the presence ofindigenous microorganisms following PEF treatment at 4.0 kV/mm for 120 !s of milk
with 2% fat and cream with 18% fat. They observed reductions in the bacterial counts of
1.5 and 1.1 log CFU/ml, respectively, which was not significant. The difference was
more noticeable at a shorter treatment time (30 !s) where a 0.9 log CFU/ml reduction in
count was achieved in 2% milk compared to 0.2 log CFU/ml in the 18% cream. These
results suggest a tendency towards a faster initial decrease in bacterial numbers in the
2% milk with a remaining resistant population in both products that caused a tailing in
the inactivation graph at a treatment time of 120 !s (4.0 kV/mm). Therefore, at a specific
electric field, high fat dairy products may require longer treatment times for microbial
inactivation to occur.
While it is possible to achieve a relatively high microbial reduction in cream at a
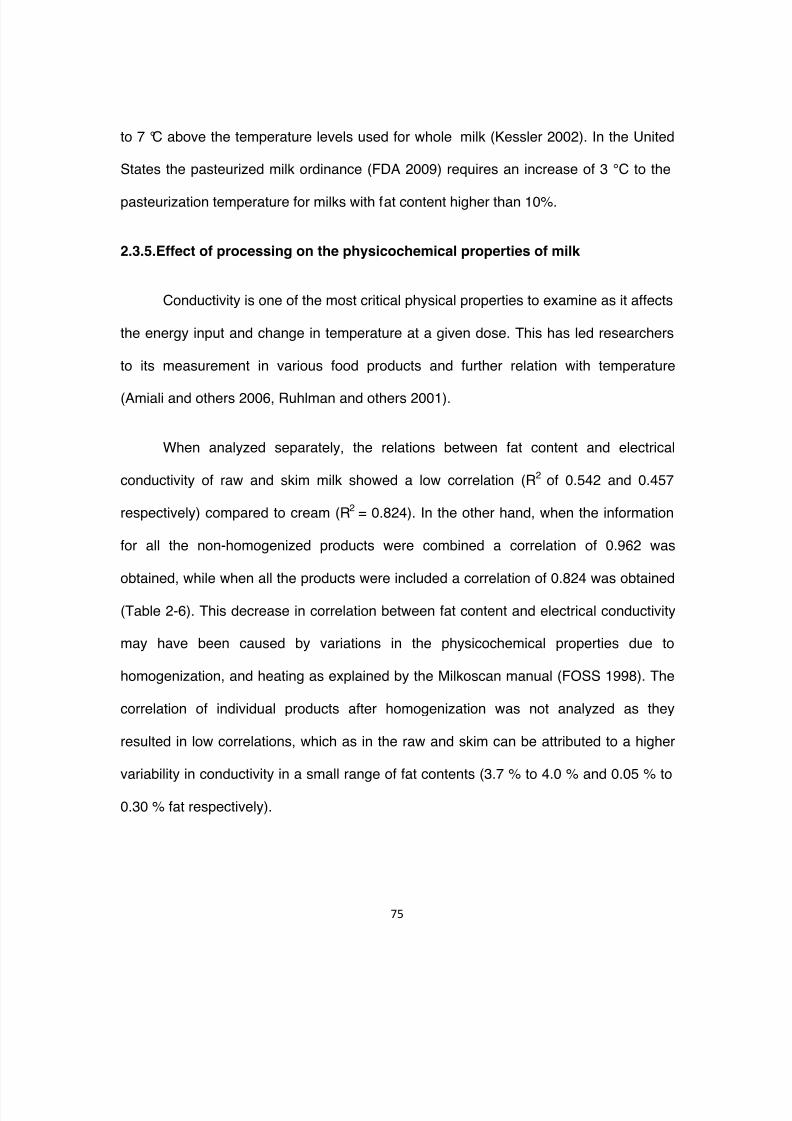
8/14/2019 Thesis-Org Complete (1)
http://slidepdf.com/reader/full/thesis-org-complete-1 93/194
to 7 °C above the temperature levels used for whole milk (Kessler 2002). In the UnitedStates the pasteurized milk ordinance (FDA 2009) requires an increase of 3 °C to the
pasteurization temperature for milks with fat content higher than 10%.
2.3.5.Effect of processing on the physicochemical properties of milk
Conductivity is one of the most critical physical properties to examine as it affects
the energy input and change in temperature at a given dose. This has led researchers
to its measurement in various food products and further relation with temperature
(Amiali and others 2006, Ruhlman and others 2001).
When analyzed separately, the relations between fat content and electrical
conductivity of raw and skim milk showed a low correlation (R2 of 0.542 and 0.457
respectively) compared to cream (R2 0 824) In the other hand when the information
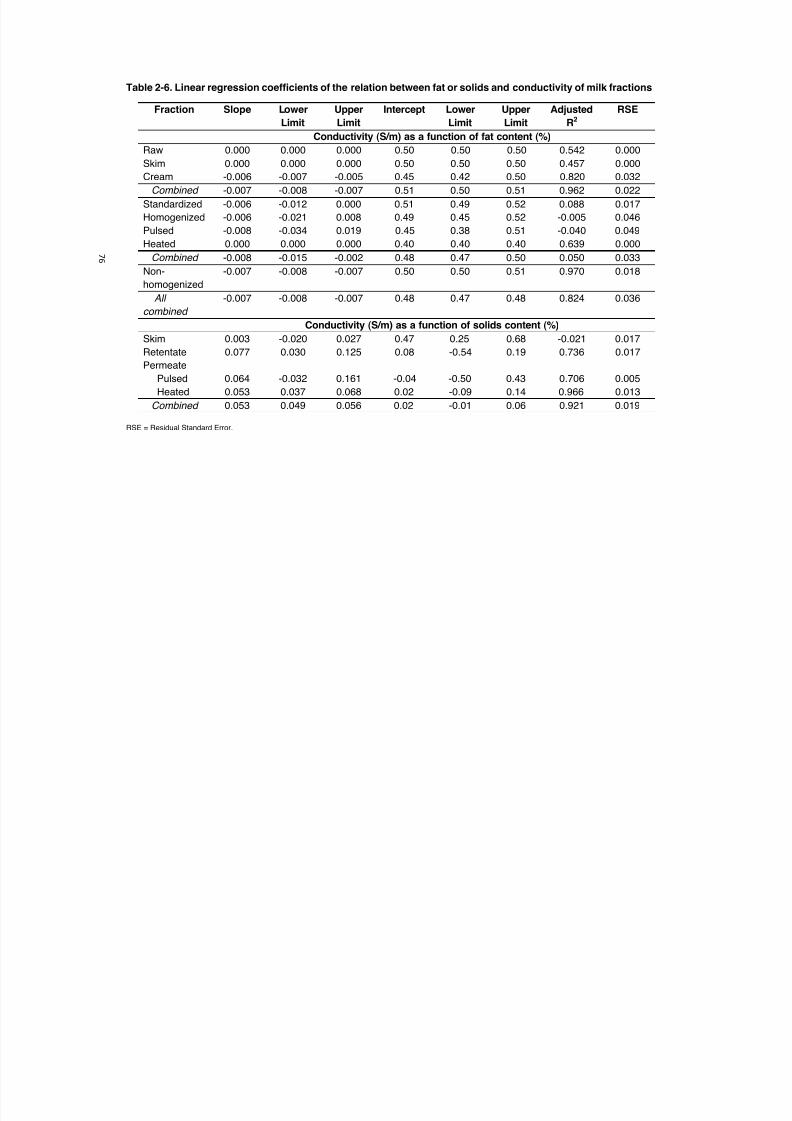
8/14/2019 Thesis-Org Complete (1)
http://slidepdf.com/reader/full/thesis-org-complete-1 94/194
" #
Table 2-6. Linear regression coefficients of the relation between fat or solids and conductivity of milk fractions
Fraction Slope Lower
Limit
Upper
Limit
Intercept Lower
Limit
Upper
Limit
Adjusted
R2
RSE
Conductivity (S/m) as a function of fat content (%)Raw 0.000 0.000 0.000 0.50 0.50 0.50 0.542 0.000
Skim 0.000 0.000 0.000 0.50 0.50 0.50 0.457 0.000
Cream -0.006 -0.007 -0.005 0.45 0.42 0.50 0.820 0.032
Combined -0.007 -0.008 -0.007 0.51 0.50 0.51 0.962 0.022
Standardized -0.006 -0.012 0.000 0.51 0.49 0.52 0.088 0.017
Homogenized -0.006 -0.021 0.008 0.49 0.45 0.52 -0.005 0.046
Pulsed -0.008 -0.034 0.019 0.45 0.38 0.51 -0.040 0.049
Heated 0.000 0.000 0.000 0.40 0.40 0.40 0.639 0.000
Combined -0.008 -0.015 -0.002 0.48 0.47 0.50 0.050 0.033
Non-
homogenized
-0.007 -0.008 -0.007 0.50 0.50 0.51 0.970 0.018
All
combined
-0.007 -0.008 -0.007 0.48 0.47 0.48 0.824 0.036
Conductivity (S/m) as a function of solids content (%)
Skim 0.003 -0.020 0.027 0.47 0.25 0.68 -0.021 0.017
Retentate 0.077 0.030 0.125 0.08 -0.54 0.19 0.736 0.017
Permeate
Pulsed 0.064 -0.032 0.161 -0.04 -0.50 0.43 0.706 0.005
Heated 0.053 0.037 0.068 0.02 -0.09 0.14 0.966 0.013Combined 0.053 0.049 0.056 0.02 -0.01 0.06 0.921 0.019
RSE = Residual Standard Error.
8/14/2019 Thesis-Org Complete (1)
http://slidepdf.com/reader/full/thesis-org-complete-1 95/194
" "
Figure 2-2. Relation between electrical conductivity and fat or solids content (A = non-homogenized products; B
= non-fat milk products)
Lines represent the range where a linear regression was established. Homogenization was conducted at two pressure stages of 20 MPa and 5 MPa respectively.
0.1
0.2
0.3
0.4
0.5
0.6
0.7
0.0 10.0 20.0 30.0 40.0 50.0 60.0
C o n d u c t i v i t y ( S / m )
% Fat
Ay = -0.007x + 0.50
Adjusted R! = 0.970
0.1
0.2
0.3
0.4
0.5
0.6
0.7
2.0 4.0 6.0 8.0 10.0 12.0
C o n d u c t i v i t y ( S / m )
% Solids
By = 0.05x + 0.02
Adjusted R! = 0.921

8/14/2019 Thesis-Org Complete (1)
http://slidepdf.com/reader/full/thesis-org-complete-1 96/194
A similar trend was observed for the solids content, which resulted in R2 ranging
from 0.706 to 0.966 in the CFMF products, and combined, gave a correlation of 0.921,
the range of solids analyzed was 4.1 % to 9.0 %. As mentioned above, the analysis of
the relation between conductivity and solids content did not result in a correlation either.
From the slopes it can be estimated that for each 10% increase in the fat level
the conductivity of the non-homogenized products decreased by 0.07 S/m in the range
of 0.05 and 50.60 % fat and conductivities between 0.54 and 0.17 S/m (Figure 2-2 A),
while the conductivity increased by 0.05 S/m for each 1% of increase in solids content in
the range of 4.1 % and 9.0 % solids and 0.21 and 0.51 S/m for conductivity.
Mabrook and Petty (2003) reported milk conductivities of 0.54 S/m for 0.1% fat,
0 52 S/m for 1 6% fat and 0 51 S/m for 3 6 % fat which represented a slope of 0 010

8/14/2019 Thesis-Org Complete (1)
http://slidepdf.com/reader/full/thesis-org-complete-1 97/194
of cream was between 6.84 and 6.92, and for non-fat milk products a pH from 6.82 to6.98 was obtained. There were no differences (P%0.05) in pH between separation
products (raw, cream and skim milk), nor within the different milk, cream, and non-fat
milk products. In a comparable study, Michalac and others (2003) found no differences
in electrical conductivity or pH of raw or UHT skim milk after PEF treatment (at 3.5
kV/mm for 47.4 !s using a flow rate of 3.6 L/h), or heat pasteurization (73 °C for 30 s),
with pH values between 6.68 and 6.76. Saboya and Maubois (2000) obtained, after
CFMF treatment of debacterized skim milk with a pH 6.72, milk retentate and permeate
with a pH of 6.73 and 6.69, respectively. Among the few studies on PEF treatment of
cream no variation in pH was reported following exposure to PEF, which is in line with
the findings of this study.

8/14/2019 Thesis-Org Complete (1)
http://slidepdf.com/reader/full/thesis-org-complete-1 98/194
8/14/2019 Thesis-Org Complete (1)
http://slidepdf.com/reader/full/thesis-org-complete-1 99/194
3. Microbial inactivation and shelf life comparison of ‘cold’ hurdle processing
with pulsed electric fields and cross-flow microfiltration, and conventional
thermal pasteurisation in milk
3.1. Introduction
Conventional heat pasteurisation has been applied and acknowledged as the
most effective processing method for the commercial production of microbiologically
safe milk for nearly a century. With the emergence of novel technologies for milk
processing such as microfiltration (Hoffmann and others 2006; Makardij and others
1999), pulsed electric fields (Smith and others 2002; Walkling-Ribeiro and others 2009),
ultrasound (Noci and others 2009; Zenker and others 2003), bactofugation (De Noni
and others 2007; Te Giffel and Van Der Horst 2004), and high hydrostatic pressure
(Datta and Deeth 1999; Guan and others 2005) the cornerstone has been laid to meet

8/14/2019 Thesis-Org Complete (1)
http://slidepdf.com/reader/full/thesis-org-complete-1 100/194
!m (Brans and others 2004, Daufin and others 2001, Kaufmann and Kulozik 2006),which generally enable high flow rates, improved yield, reduced processing costs and
higher quality compared to conventional heat treatments. Nonetheless, CFMF is
combined with thermal pasteurisation (TP) for commercial scale production of milk due
to current regulatory food safety requirements (Eberhard and Gallmann 2009, Lewis
2010).
Milk processing with PEF is based on a different mode of action known as
electro-permeabilisation of microbial membranes (Wouters and others 2001a), bringing
about loss of cell viability. Similar to CFMF, commercial milk processing with PEF is
subject to legal restraints and therefore, additional TP treatment of milk is required
(European Union 1997; FDA 2009). Combining CFMF with PEF in a hurdle technology
(Leistner 2000) for ‘cold’ pasteurisation of milk has not been studied to date and may

8/14/2019 Thesis-Org Complete (1)
http://slidepdf.com/reader/full/thesis-org-complete-1 101/194
3.2. Materials and methods
3.2.1. Milk preparation and analysis of microbial inactivation
Separated raw bovine skim milk (0.08 % fat content, 50 °C) was obtained from a
dairy processing plant (Gay Lea Foods, Guelph, ON, Canada) and subsequently 90% of
the product was refrigerated while 10% of the raw milk was used for inocula. Raw milk
provided for inocula was spiked with an additional portion (10% of the inoculum volume)
of refrigerated whole bovine raw milk from another dairy (University of Guelph Dairy
Research Station, Elora, ON, Canada) in order to diversify the microbial population
further and then incubated for 24 h at 25 °C to pro duce final inocula containing 1010
CFU of native biota per ml. Prior to processing, these inocula were added to the
refrigerated raw skim milk for a 1:10 (v/v) dilution ratio, thereby, providing high initial
counts that ensured accurate analysis of the inactivation of native microorganisms

8/14/2019 Thesis-Org Complete (1)
http://slidepdf.com/reader/full/thesis-org-complete-1 102/194
Electrode
TopView
Lateral
View
PEF CoolingCFMF
+
Charge
connectors
Product
outlet
Insulating
spacers
A B
C
8/14/2019 Thesis-Org Complete (1)
http://slidepdf.com/reader/full/thesis-org-complete-1 103/194
Aliquots of 100 !l from treated milk samples, or their ten-fold dilutions prepared
with Ringers solution (BR0052G, Oxoid Ltd., Basingstoke, Hampshire, UK), were
spread on plate count agar (PCA; 247940, BD Difco, Sparks, MD, USA) under aseptic
conditions in a class 2 biosafety cabinet (Forma 4071-1200, Thermo Fisher Scientific
Inc., Newlington, NH, USA) for the analysis of total aerobic mesophilic counts (TAMC).
Agar plates were incubated at 30 °C for 72 h as des cribed in a study by Zárate and
others (1997) before counting.
3.2.2.Nonthermal processing with PEF
For nonthermal processing of inoculated raw skim milk, a treatment chamber
designed at the University of Guelph and the University of Waterloo was used with a
custom built pulsed electric fields (PEF) generating system (PPS 30 University of

8/14/2019 Thesis-Org Complete (1)
http://slidepdf.com/reader/full/thesis-org-complete-1 104/194

8/14/2019 Thesis-Org Complete (1)
http://slidepdf.com/reader/full/thesis-org-complete-1 105/194

8/14/2019 Thesis-Org Complete (1)
http://slidepdf.com/reader/full/thesis-org-complete-1 106/194
which configuration of the nonthermal technologies allowed the most effective ‘cold’pasteurisation of milk.
3.2.5. Conventional heat pasteurisation
Milk was thermally pasteurised in a dual stage heat exchanger unit (UHT/HTST
Lab-25 EDH, Microthermics Inc., Raleigh, NC, USA). Inoculated milk entered the TP
unit at 16 °C with a flow rate of 1.0 L/min and was heated to 75 °C, passing through a
holding tube for 24 s, prior to cooling of the pasteurised product to 10 °C and
subsequent sampling and analysis.
3.2.6. Microbiological shelf life
In order to provide optimum conditions for high shelf stability, separated skim

8/14/2019 Thesis-Org Complete (1)
http://slidepdf.com/reader/full/thesis-org-complete-1 107/194
milk was considered to be expired after exceeding a limit of 5.0 log10 CFU/ml. This is inline with reference microbial values for raw milk (Villar and others 1996). Milk samples
were taken in duplicate under sterile conditions before and after homogenization as well
as following the preservation treatments, and after refrigerated storage at 4±0.1°C for 0,
1, 7, 14, 21, 28, and 35 days. Extensive microbiological analyses were carried out
based on the spread-plating method for the determination of:
a) TAMC on PCA as previously described in subsection 3.2.1;
b) Total enteric bacteria counts (TEBC) on MacConkey agar (MCA; 211387, BD Difco,
Sparks, MD, USA), incubated at 35 °C for 24 h as de scribed in a study by Jocson and
others (1997);
c) Total moulds and yeasts counts (TMYC) on potato dextrose agar (PDA; 254920, BD
Difco Sparks MD USA) incubated at 35 °C for 48 h as described by the American
8/14/2019 Thesis-Org Complete (1)
http://slidepdf.com/reader/full/thesis-org-complete-1 108/194
g) Total thermoduric psychrotroph counts (TTPC), incubated at 7 °C for 240 h based onthe procedural descriptions of FIL-IDF (1991) and Edgell and others (1950);
h) Total thermoduric mesophilic counts (TTMC), incubated at 30 °C for 72 h as described
by Frank and others (1985);
i) Total thermoduric thermophilic counts (TTTC), incubated at 55 °C for 24 h according to
the descriptions of the FIL-IDF (1991) and Murphy and others (1999).
Pour-plating was accomplished with liquid tempered PCA (18 ml portions, 45 °C),
which was poured on 1 ml of the neat or diluted milk sample, previously pipetted in a
sterile petri dish, and distributed by steady rotating and crosswise movements prior to
agar solidification. For thermoduric counts heat exposure of the neat and serial-diluted
milk samples placed in sterile test tubes in a water bath at 63 °C for 35 min preceded
the pour plating

8/14/2019 Thesis-Org Complete (1)
http://slidepdf.com/reader/full/thesis-org-complete-1 109/194

8/14/2019 Thesis-Org Complete (1)
http://slidepdf.com/reader/full/thesis-org-complete-1 110/194
8/14/2019 Thesis-Org Complete (1)
http://slidepdf.com/reader/full/thesis-org-complete-1 111/194
log10 CFU/ml after TP, respectively. Inactivation below the microbiological detection limit(1.5 log10 CFU/ml) was obtained for milk containing initial counts for TSC of 2.0 log 10
CFU/ml, TPC of 1.7 log10 CFU/ml, and TTTP of 5.6 log10 CFU/ml, with both processing
technologies. Raw milk TEBC of 3.8 log10 CFU/ml were reduced by TP below the
detection limit while PEF/CFMF treatment led to a reduction in TEBC to 1.6 log10
CFU/ml. By contrast, an initial TTMC of 5.6 log10 CFU/ml was decreased below the
detection limit after PEF/CFMF, whereas a reduction to 1.5 log10 CFU/ml was attained
with TP. TTPC of untreated milk were originally found to be below the limit of detection.
In spite of slightly higher microbial reductions obtained directly after milk preservation
with PEF/CFMF compared to TP, the microbiological shelf life of skim milk processed
with either method was limited to 7 days of refrigerated storage.

8/14/2019 Thesis-Org Complete (1)
http://slidepdf.com/reader/full/thesis-org-complete-1 112/194
Table 3-1. Comparison of reductions in total mesophilic aerobic counts in skim
milk obtained following pulsed electric fields (PEF), cross-flow microfiltration(CFMF), thermal pasteurisation (TP); combined CFMF/PEF, and PEF/CFMF
treatment
Treatment Maximum Processing
Temperature
(°C)
Microbial Reduction
(Log10 CFU/ml)
PEF1.6//2105/407
1
40 2.0
a
PEF2.0/1454/6321 45 2.1a
PEF3.0/983/6681 47 2.3a
PEF4.2/612/8151 49 2.5a
CFMF 35 3.7 c TP 75 4.6c CFMF/ PEF1.6//2105/407
1 40 4.1c
8/14/2019 Thesis-Org Complete (1)
http://slidepdf.com/reader/full/thesis-org-complete-1 113/194
For PEF/CFMF-treated milk, TAMC, TEBC, TMYC, and TPC exceeded the shelf
life limit of 5.0 log10 CFU/ml after 7 storage days accounting for respectively 8.6, 7.6,
5.1, and 7.5 log10 CFU/ml on day 14 of the shelf life analysis. It was noticeable that the
TAMC, TEBC and TPC followed the same microbial growth pattern over the duration of
the analysis (P%0.05) thus, suggesting that one dominant microorganism, which based
on the observations of the TEBC was non-lactose fermenting and seemed to be able to
grow rapidly under psychrotrophic conditions, accounted for the highest resistivity and
could have been the overall limiting factor for the PEF/CFMF shelf stability. By
comparison, shelf life of milk processed with TP expired when the TAMC passed over
the limit after 7 days of storage and rose slightly to 5.2 log10 CFU/ml on day 14. Over
the duration of the shelf life analysis TLABC, TSC, TTPC, TTMC and TTTC in
PEF/CFMF processed milk did not go beyond the limit of microbial stability and safety

8/14/2019 Thesis-Org Complete (1)
http://slidepdf.com/reader/full/thesis-org-complete-1 114/194
Table 3-2. Microbial counts in skim milk before and after pulsed electric fields
(PEF) and cross-flow microfiltration (CFMF) hurdle treatment (PEF/CFMF) or
thermal pasteurisation (TP) during storage
#$%&'( )&*+
)&,-./&.%$
0%.-$1( 2&)(
345
67&%&$* 8.97%:
3*.1;< 8=>?)*5
@A=?B=:
3*.1;< 8=>?)*5
2@:
3*.1;< 8=>?)*5
/0123 2450678 + &9,:;+9(< $9":;+9#< ,9$:;+9"<
=4>0?@734> " $9":;+9#< $9*:;+9#<
( ,9%:;+9"< ,9#:;+9#<", )9&:;+9#< %9#:;+9#<
#" ""9):;+9"< %9(:;#9#<
#) "#9&:;+9"< (9":;+9+<
$% "$9,:;+9$< )9(:;+9,<
/0123 4A14578 + $9):;+9#< "9&:;+9,< B"9%
C2814572 " "9):;+9"< B"9%
( ,9&:;+9,< B"9%
", (9&:;+9#< #9,:;"9"<
#" ""9(:;+9"< B"9%#) "#9$:;+9+< "9(:;+9$<
$% "$9$:;+9"< B"9%
/0123 =0D3E> + %9&:;+9#< #9):;+9#< "9):;+9&<
2AE F42>1> " #9%:;+9,< #9#:;+9"<
( #9%:;+9$< #9":;+9#<
", %9":;+9,< #9&:;+9"<
#" (9":;"9#< #9,:;+9#<
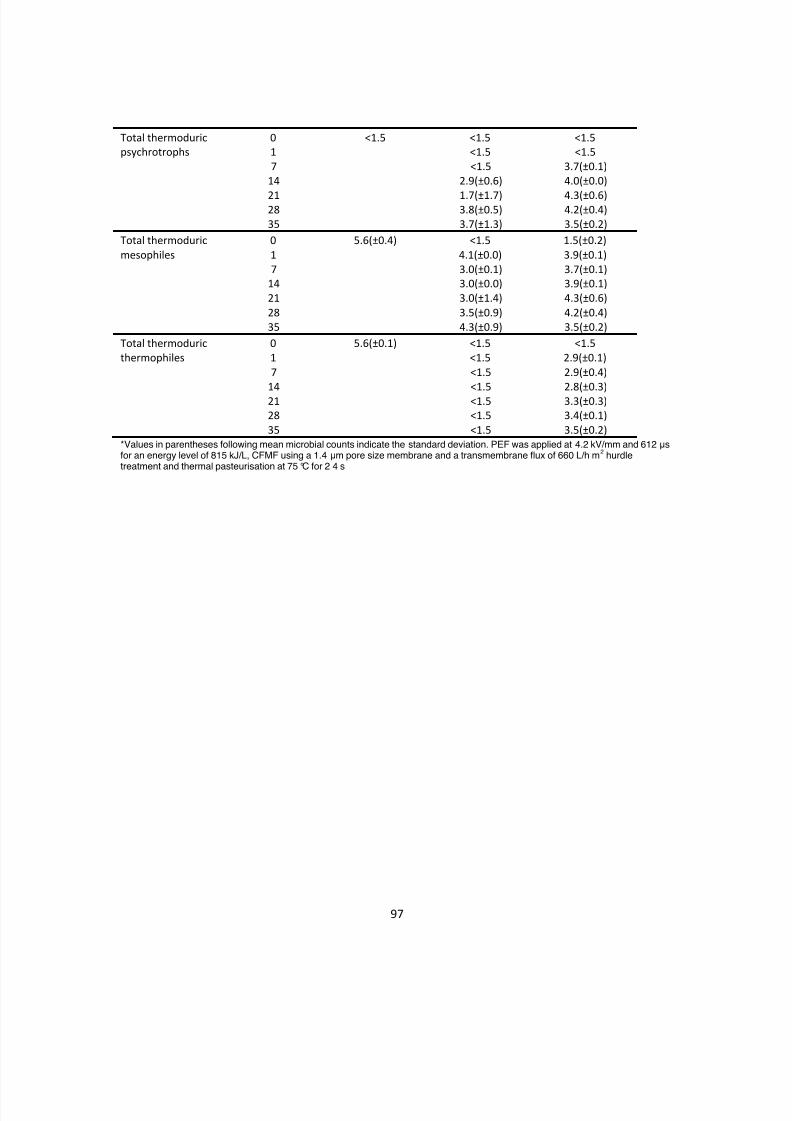
8/14/2019 Thesis-Org Complete (1)
http://slidepdf.com/reader/full/thesis-org-complete-1 115/194
/0123 1@45=0ED578 + B"9% B"9% B"9%
?>F8@50150?@> " B"9% B"9%
( B"9% $9(:;+9"<
", #9*:;+9&< ,9+:;+9+<
#" "9(:;"9(< ,9$:;+9&<
#) $9):;+9%< ,9#:;+9,<
$% $9(:;"9$< $9%:;+9#<
/0123 1@45=0ED578 + %9&:;+9,< B"9% "9%:;+9#<
=4>0?@734> " ,9":;+9+< $9*:;+9"<
( $9+:;+9"< $9(:;+9"<", $9+:;+9+< $9*:;+9"<
#" $9+:;"9,< ,9$:;+9&<
#) $9%:;+9*< ,9#:;+9,<
$% ,9$:;+9*< $9%:;+9#<
/0123 1@45=0ED578 + %9&:;+9"< B"9% B"9%
1@45=0?@734> " B"9% #9*:;+9"<
( B"9% #9*:;+9,<
", B"9% #9):;+9$<
#" B"9% $9$:;+9$<#) B"9% $9,:;+9"<
$% B"9% $9%:;+9#<
*Values in parentheses following mean microbial counts indicate the standard deviation. PEF was applied at 4.2 kV/mm and 612 !sfor an energy level of 815 kJ/L, CFMF using a 1.4 !m pore size membrane and a transmembrane flux of 660 L/h m2 hurdletreatment and thermal pasteurisation at 75 °C for 2 4 s

8/14/2019 Thesis-Org Complete (1)
http://slidepdf.com/reader/full/thesis-org-complete-1 116/194
3.4. Discussion
In the present study similar inactivation of native milk biota in bovine skim milk to
that observed for TP was achieved when CFMF was applied individually or followed by
PEF. Research conducted on pre-filtered ovine (Beolchini and others 2004) and bovinemilk (Beolchini and others 2005) microfiltered with 1.4 !m pore diameter CFMF system
using an average permeate flux of approximately 240 L/h m2 suggested respective
microbial reductions of more than 3.0 (at 40 °C) an d 2.0 (at 40 °C) to 3.0 (30 °C) log 10
CFU/ml, respectively, which is slightly lower than the findings of this study. A possible
reason for the lower antimicrobial impact may have been the use of less sophisticated
CFMF equipment than the Tetra Pak unit used in our study. The latter features uniform
transmembrane pressure (Bird 1996), which can be of considerable impact during

8/14/2019 Thesis-Org Complete (1)
http://slidepdf.com/reader/full/thesis-org-complete-1 117/194
of electroporated microorganisms (García and others 2007, Wang and others 2008) or
an increased agglomeration between microorganisms or between microorganisms and
milk components (Hodgson and others 1993, Jimenez-Lopez and others 2008, Zhao
and others 2009) due to electrical charge polarisation after PEF and prior to CFMF. This
may improve the filtration effect and, thus, enhance the overall process efficacy andmicrobial reduction in the treated product. Similar inactivation of native microbiota in
skim milk by CFMF of 4.0 log10 CFU/ml and more was also reported in other studies
(Payfylias and others 1996, Guerra and others 1997, Fritsch and Moraru 2008). The
majority of the findings on conventional heat pasteurisation of milk reported in the
literature (Sepúlveda-Ahumada and others 2000, El-Hadi Sulieman 2007, and
Odriozola-Serrano and others 2006) were achieved at considerably lower initial TAMC
(4.4, 4.7, and 3.2 log10 CFU/ml, respectively) than those of the present study, therefore,

8/14/2019 Thesis-Org Complete (1)
http://slidepdf.com/reader/full/thesis-org-complete-1 118/194
and lower microbial inactivation of 5.4 and 1.2 log10
CFU/ml of native flora in milk PEF-
treated under ‘cold’ processing conditions have also been reported by Li and others
(2003) (<50 °C, 4.1 kV/mm, 54 !s) and Sepúlveda-Ahumada and others (2000) (<30
°C, 3.5 kV/mm, 30 pulses), respectively. These diff erences are possibly the result of
more or less effective PEF treatment conditions and PEF equipment, and variations inthe microbial composition of the milk. Likewise, substantial volatility in the reduction of
total aerobic counts in PEF-processed milk of 1.3, 2.4, 2.7, 3.0, and 6.0 log10 CFU/ml
was obtained when PEF was applied alone, or in combination with a heat treatment, at
moderate processing temperatures of 50 °C or above as indicated by results of different
research groups, including Smith and others (2002), using 52 °C, 8.0 kV/mm, 100 !s;
Shamsi and others (2008), using 60 °C, 3.5 kV/mm, 1 9.6 !s; Michalac and others
(2003), using 52 °C, 3.5 kV/mm, 188 !s; Fernández-Molina and others (2005), using

8/14/2019 Thesis-Org Complete (1)
http://slidepdf.com/reader/full/thesis-org-complete-1 119/194
temperature levels and much shorter treatment times in the !s range by comparison to
those minimally required by law for TP (72 °C, 15 s ).
The effect of single TP (72 °C, 15 s) and in combin ation with CFMF (1.4 !m, 200
L/h m2) on the microbiological shelf stability of milk stored at 4 °C with a bacterial limit of
4.3 log10 CFU/ml was investigated by Elwell and Barbano (2006), who observed longershelf life of 29 d for CFMF/TP than for TP-treated milk (15 d). Malmberg and Holm
(1998) also stated that addition of CFMF after conventional pasteurisation can
potentially increase overall shelf life of milk by 2 to 3 times, from 6 to 8 days up to 16 to
21 days before expiry. The former shelf life range of conventionally pasteurised milk
coincided with the shelf life of 7 days found for both TP and PEF/CFMF-treated milk in
the present study, which, in turn, is broadly in line with the findings of Odriozola-Serrano
and others (2006). The latter study described milk that was microbiologically stable for 5

8/14/2019 Thesis-Org Complete (1)
http://slidepdf.com/reader/full/thesis-org-complete-1 120/194
found that heat- and PEF-treated milk was stable for the entire 21-day period of the
microbial shelf life analysis in contrast to TP-treated milk, which expired after 14 days of
storage. As the investigated microbial groups of lactobacilli, pseudomonads, coliforms
and non-lactose fermenters, and staphylococci showed generally no significant or
detectable growth after either preservation treatment, psychrotrophs other thanpseudomonads and endo-sporeforming bacteria were suggested as comprising the milk
shelf life limiting microbiota (e.g. Streptococcus , Arthrobacter , Corynebacterium ,
Microbacterium , and Bacillus subspecies). The results for PEF preservation obtained by
the other research group (Sepulveda and others, 2009) were different suggesting that
the microbial shelf life limit of milk treated with heat-generating PEF was exceeded after
22 days while TP-treated milk was shelf stable for 44 days. The growth of mesophiles
exceeding the limit after 44 days was identified as a shelf life limiting factor and not
8/14/2019 Thesis-Org Complete (1)
http://slidepdf.com/reader/full/thesis-org-complete-1 121/194

8/14/2019 Thesis-Org Complete (1)
http://slidepdf.com/reader/full/thesis-org-complete-1 122/194
4. Resistance of temperature, pH, osmotic and starvation stress induced
Escherichia coli O157:H7 to pulsed electric fields in milk
4.1. Introduction
The injury and the repair of microorganisms after inactivation with PEF has been
studied to gain an insight into the shelf-life of products treated with this using technology
(Aronsson and others 2004, García and others 2006). Although similar studies have
been carried out on other processing technologies (Hayman and others 2007, Teo and
others 2001), few studies have examined the exposure of microorganisms to sub-
optimal growth conditions and their subsequent resistance to PEF inactivation.
Exposure of microorganisms to challenging environmental conditions can trigger
stress response mechanisms, including the expression of genes related to the

8/14/2019 Thesis-Org Complete (1)
http://slidepdf.com/reader/full/thesis-org-complete-1 123/194
mechanistic approach to monitor sub-lethal injury Gawande and Griffiths (2005a) used
constructs of Escherichia coli O157:H7 in which the promoters for genes encoding
major stress response proteins were fused to a green fluorescent protein (GFP) gene.
They were then able to identify conditions that led to the expression of these stress
response proteins and relate them to the ability of the organism to survive subsequentstresses (Gawande and Griffiths 2005b).
The dairy industry has incorporated several predictive models to describe
microbial growth and inactivation (Griffiths 1994). In general, growth models have been
evaluated for their ability to predict lag phase and growth rates based on viable counts
and turbidimetric data (Dalgaard and others 1994; Dalgaard and Koutsoumanis 2001,
McKellar and Lu 2004b). The Baranyi model (Baranyi and others 1993; Baranyi and
Roberts 1994; Baranyi and others 1995) has been widely used because of the

8/14/2019 Thesis-Org Complete (1)
http://slidepdf.com/reader/full/thesis-org-complete-1 124/194
and others 2003, García and others 2005), and further modifications of this model were
implemented to enable a comparison of microbial resistance using a z PEF value (Álvarez
and others 2003a, Álvarez and others 2003b, Rodríguez-Calleja and others 2006). With
the development of the WeLL (Weibullian-log logistic) model microbial inactivation that
allows the variation of the inactivation rate due to temperature and other lethal agents tobe determined, the effect of dynamic conditions during microbial inactivation can now be
predicted (Peleg and Cole 2000, Fernández and others 1999, Campanella and Peleg
2001, Peleg and Normand 2004).
The objective of this research was the mathematical analysis of the growth,
stress response and inactivation of a biological indicator (E. coli O157:H7) by using
predictive models. Escherichia coli O157:H7 was subjected to different stress factors,
simulating characteristic dairy processing conditions and subsequently exposed to

8/14/2019 Thesis-Org Complete (1)
http://slidepdf.com/reader/full/thesis-org-complete-1 125/194
4.2.2. Growth medium preparation
Bacterial growth limits were evaluated in two broths: lactose broth (LACB;
DIFCOTM Lactose Broth, 211835, Becton Dickinson and Company, Sparks, MD, USA),
and tryptic soy broth (TSB; BACTOTM Tryptic Soy Broth without dextrose, 286220)
supplemented with 0.5% lactose (102137, D-(+)-lactose monohydrate, MP Biomedicals,
Solon, OH, USA) to make up TSBL.
The growth of the bacterium was also analyzed in modified TSBL. The medium
pH of 7.0 was adjusted by using lactic acid (LA; A162, Fisher Scientific, Fairlawn, NJ,
USA) or acetic acid (AA; A35, Fisher Scientific, Fairlawn, NJ, USA) to final pH values of
6.0, 5.0, and 4.0, which was monitored with a pH meter (AB 15 Accumet Basic, Fisher
Scientific, Hampton, NH, USA). To determine the effect of water activity, sodium

8/14/2019 Thesis-Org Complete (1)
http://slidepdf.com/reader/full/thesis-org-complete-1 126/194
8/14/2019 Thesis-Org Complete (1)
http://slidepdf.com/reader/full/thesis-org-complete-1 127/194
XPI centrifuge, Beckman Coulter, Brea, CA, USA) the cell suspension at 5000 ! g-1 for
5 min at 4 °C, re-suspending it to 1:10 of its orig inal volume with filtered (0.22 !m pore
size) distilled water, and incubating the bacteria at 25 °C for 100 hours. Subsequently,
the samples were transferred to microplates and examined as detailed in Section 4.2.4.
To induce cold shock the cell suspension was cooled to 5 °C and 1.5 ml of thesuspensions were transferred into micro-centrifuge tubes (05-408-129, Fisher Scientific
Company, Hampton, NH, USA) every 24 h, pelleted using a microcentrifuge
(Spectrafuge 16M, Labnet International, Woodbridge, NJ, USA) and re-suspended to
1:10 of its original volume with Ringers solution (BR0052, Oxoid Ltd. Basingstoke,
Hampshire, England) for a final volume of 150 !L per sample.
4.2.4. Monitoring of the physiological state

8/14/2019 Thesis-Org Complete (1)
http://slidepdf.com/reader/full/thesis-org-complete-1 128/194
153ÂBÃÄ " 653<ÂBÃÄ / 653<Å<ÆM Eq. 4-1
1”Ç«ÈÉ " 153q”Ç«ÈÉ 153.”Ç«ÈÉQ Eq. 4-2
4.2.5. PEF treatment
For PEF treatment 104 to 107 CFU/ml of microbial cells grown as described in
Section 4.2.2, and presented in Table 4-2, were used for inoculation (5 % of the total
volume) of 2% micro-filtered milk (Lactantia P,r Filtre, Parmalat SpA, Montreal, QC,
Canada) and pumped (Masterflex pump drive 7524-40 and pump head 77201-60, Cole
Parmer Instrument Co., Vernon Hills, IL, USA) continuously through silicone tubing to a
PEF chamber. Before entering the chamber the inoculated milk passed through a
stainless steel coil submerged in a water bath (Isotemp 10L, Fisher Scientific, Hampton,

8/14/2019 Thesis-Org Complete (1)
http://slidepdf.com/reader/full/thesis-org-complete-1 129/194

8/14/2019 Thesis-Org Complete (1)
http://slidepdf.com/reader/full/thesis-org-complete-1 130/194
Foundation for Statistical Computing, Vienna, Austria) in conjunction with R
Commander 1.6-1 (McMaster University, Burlington, ON, Canada).
Growth rates and lag phases were calculated using the Baranyi model (Baranyi
and Roberts 1994) as explained by Eqs. 4-3 and 4-4, and correlated to pH and water
activity (aw) with the Ratkowsky model (Eq. 4-5) and to temperature using the Cardinal
model (Eqs. 4-6 to 4-8) because its goodness-of-fit and capabilities to estimate optimum
growth conditions. Stress response was modeled using the Logistic (Eq. 4-9), Gompertz
(Eq. 4-10), and Weibull growth (Eq. 4-11) models.
The Weibull model was fitted using the natural logarithm of the surviving
population (Couvert and others 2005; Eq. 4-12), and the mean treatment time was
calculated (Eq. 4-13; Fernández and others 1999) as an indicator of microbial sensitivity
Table 4-1. Mathematical models used to analyze Escherichia coli O157:H7 during stress induced growth and its
resistance to subsequent pulsed electric field processing in milk.
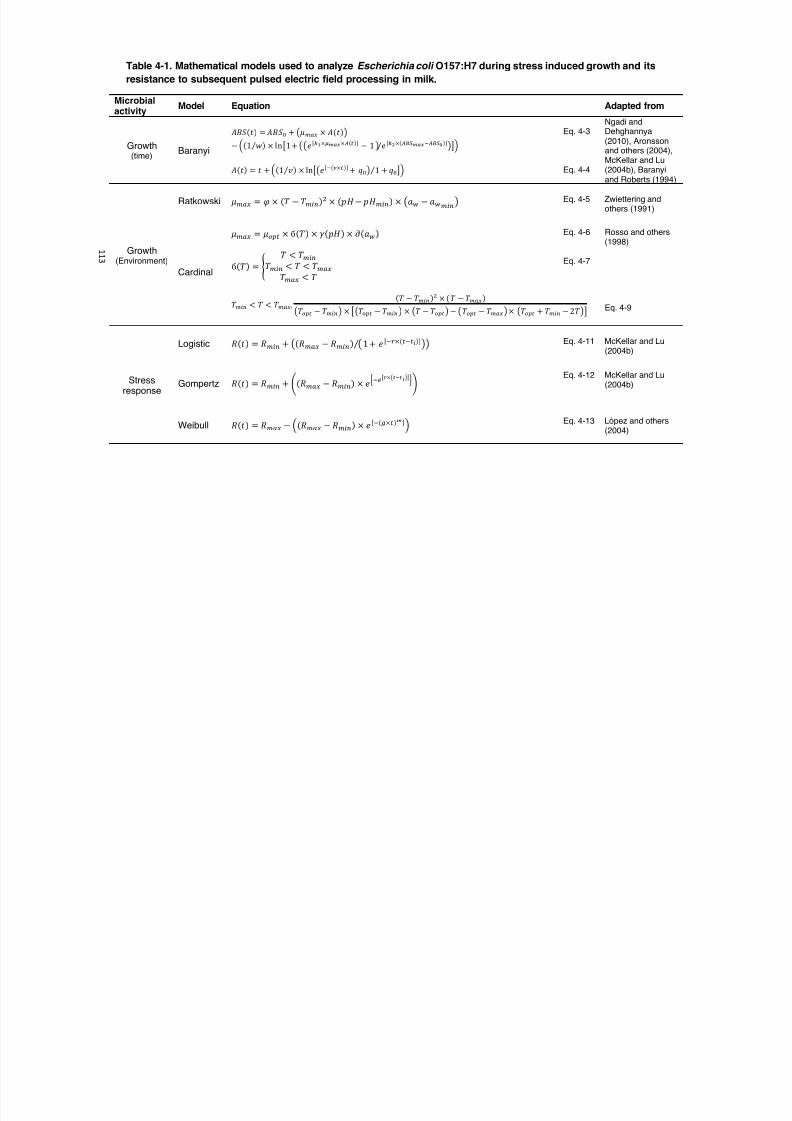
8/14/2019 Thesis-Org Complete (1)
http://slidepdf.com/reader/full/thesis-org-complete-1 131/194
" " #
es sta ce to subseque t pu sed e ect c e d p ocess g
Microbialactivity
Model Equation Adapted from
Growth(time)
Baranyi
!"# $ % & ' ! " #( ) *+ ,- . / ! $ % & 0
1 2 $ 3 45 & / 6 7 8 3 ) * * 9 : ;< /=> ?@ /A $B &C 1 3 0 9 : ;D /$AE F> ?@ GAE FH &C5 0IJ
! $ % & ' % ) 2$ 3 K5 & / 6 7 8 * 9 : G $L /B & C ) M( 0 3 )5 M( IJ
Eq. 4-3
Eq. 4-4
Ngadi andDehghannya(2010), Aronssonand others (2004),McKellar and Lu(2004b), Baranyiand Roberts (1994)
Growth(Environment)
Ratkowski +,-. ' N / $O 1 O,P Q &R / $S T 1 S T,P Q & / *UV 1 UV ,P Q 0 Eq. 4-5 Zwiettering andothers (1991)
Cardinal
+,-. ' +WXB / Y $O & / Z $ST & / [ $UV &
Y$O & ' \ O ] O,P Q
O,P Q ] O ] O,-.O,-. ] O
Eq. 4-6
Eq. 4-7
Rosso and others(1998)
O,P Q ] O ] O,- . _ $O 1 O,P Q & R / $ O 1 O,- . &*OWXB 1 O,P Q 0 / 8 *OWXB 1 O,P Q 0 / *O 1 OWXB 0 1 * OWXB 1 O,- . 0 / *OWXB ) O,P Q 1 ` O 0 I Eq. 4-9
Stressresponse
Logistic a $% & ' a,P Q ) *$a,-. 1 a,P Q & * 3 ) 9 :G b/$ BG B c &C 05 0 Eq. 4-11 McKellar and Lu(2004b)
Gompertz a $% & ' a,P Q ) d$a,-. 1 a,P Q & / 9 eG f 8g/*hih c 0I j k Eq. 4-12 McKellar and Lu
(2004b)
Weibull a $% & ' a,-. 1 2 $a,-. 1 a,P Q & / 9 : G$l /B &> C J Eq. 4-13 López and others
(2004)
!"#$%&'( ) *%& +, '- Eq. 4-14 Peleg and Penchina(2000) Mafart and

8/14/2019 Thesis-Org Complete (1)
http://slidepdf.com/reader/full/thesis-org-complete-1 132/194
" " #
Inactivation
Weibull&. ) + /0%1 2 345'
Eq. 4-15(2000), Mafart andothers (2002),Fernández andothers (1999)
WeLL(Weibullian
Log-logistic)
!67#$%&'( ) *8%9' / : ;
8%9' ) !"<1 2 =#>/%?4?@'(A
Eq. 4-16
Eq. 4-17
Corradini and Peleg(2009),Peleg andNormand (2004)
† a can be denoted as the time for the first decimal reduction if n = 1.
‡ Curves can be described as convex with n >1 or concave with n <1.
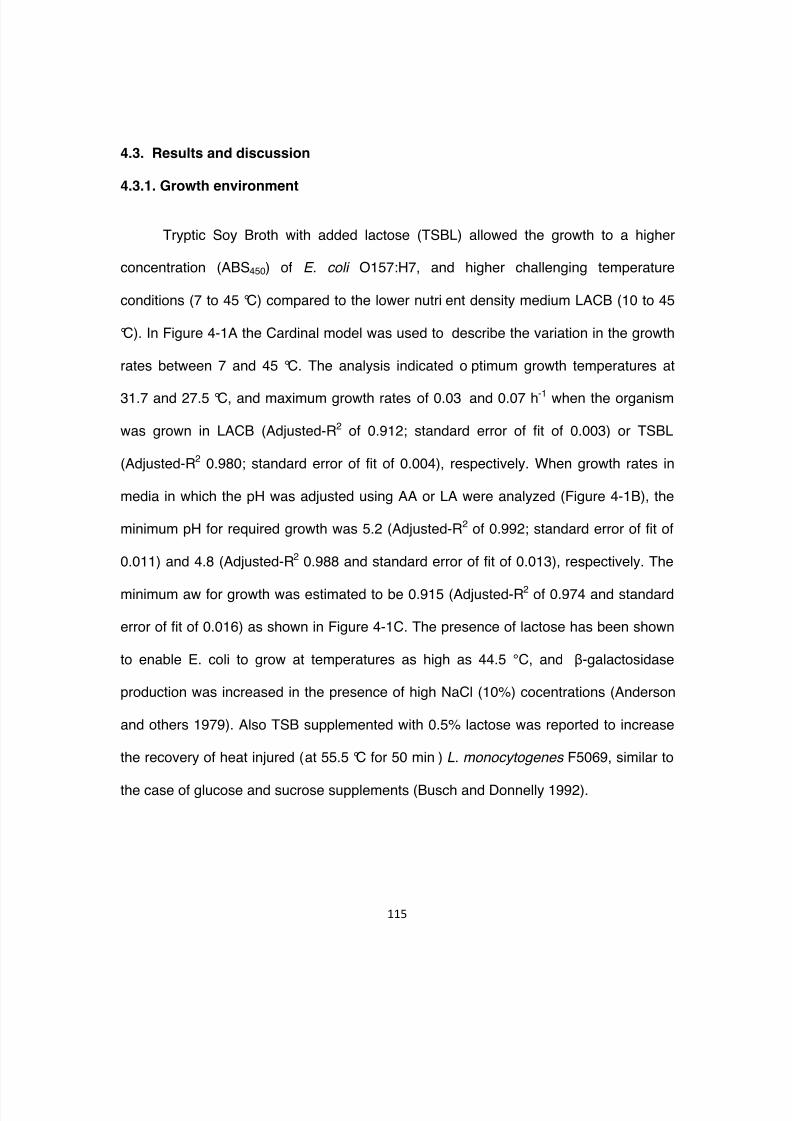
8/14/2019 Thesis-Org Complete (1)
http://slidepdf.com/reader/full/thesis-org-complete-1 133/194
4.3. Results and discussion
4.3.1. Growth environment
Tryptic Soy Broth with added lactose (TSBL) allowed the growth to a higher
concentration (ABS450) of E. coli O157:H7, and higher challenging temperatureconditions (7 to 45 °C) compared to the lower nutri ent density medium LACB (10 to 45
°C). In Figure 4-1A the Cardinal model was used to describe the variation in the growth
rates between 7 and 45 °C. The analysis indicated o ptimum growth temperatures at
31.7 and 27.5 °C, and maximum growth rates of 0.03 and 0.07 h-1
when the organism
was grown in LACB (Adjusted-R2 of 0.912; standard error of fit of 0.003) or TSBL
(Adjusted-R2 0.980; standard error of fit of 0.004), respectively. When growth rates in
media in which the pH was adjusted using AA or LA were analyzed (Figure 4-1B), the
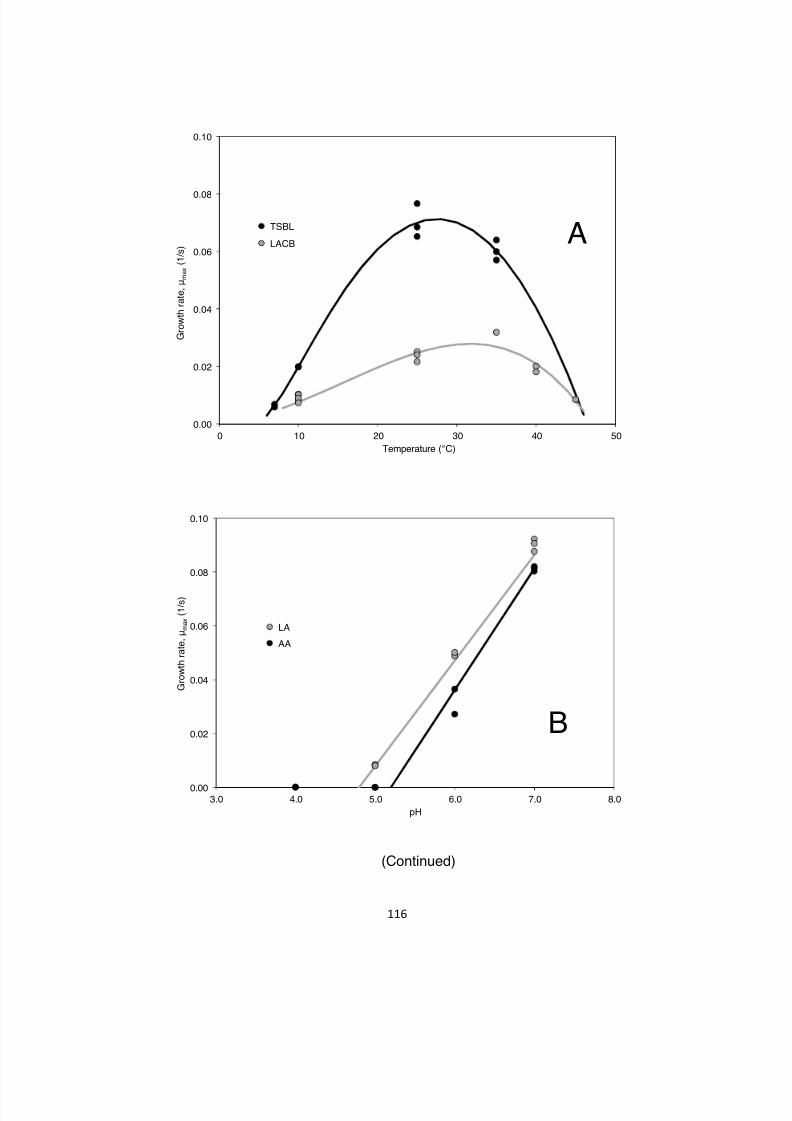
8/14/2019 Thesis-Org Complete (1)
http://slidepdf.com/reader/full/thesis-org-complete-1 134/194
0.00
0.02
0.04
0.06
0.08
0.10
0 10 20 30 40 50
G r o w t h r a t e , ! m a x ( 1 / s )
Temperature ("C)
TSBL
LACB
Series3
Series4
A
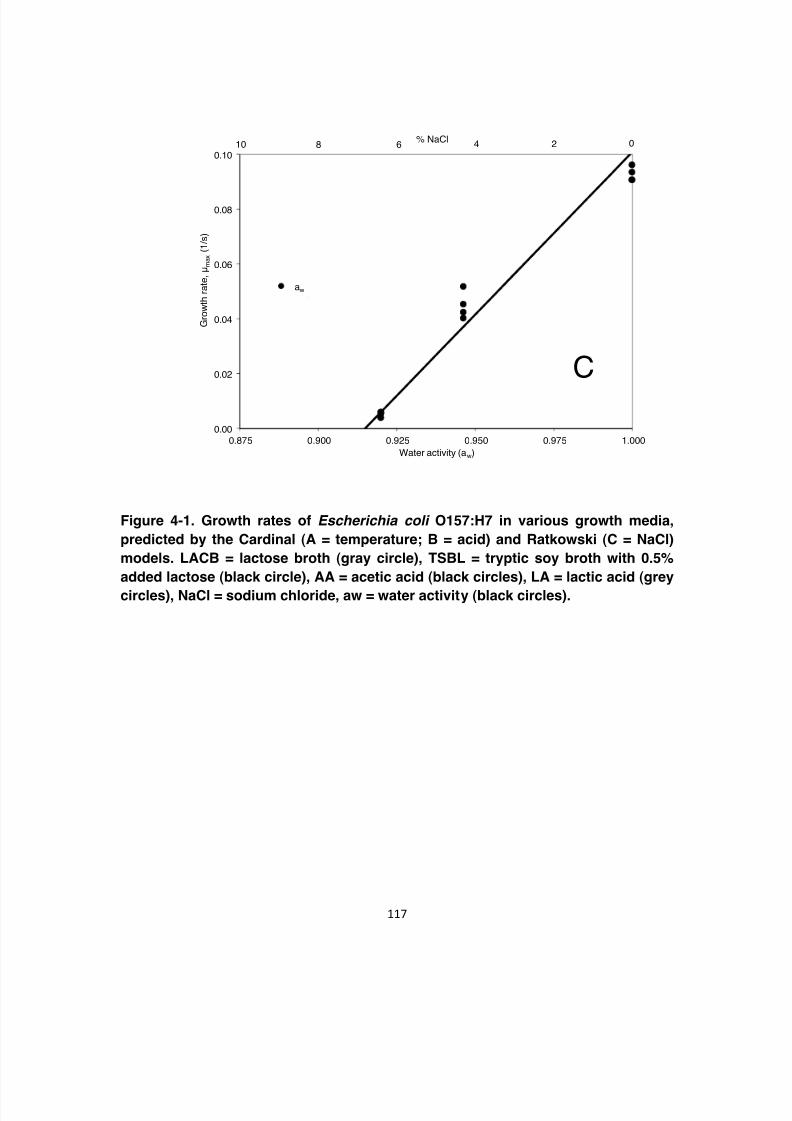
8/14/2019 Thesis-Org Complete (1)
http://slidepdf.com/reader/full/thesis-org-complete-1 135/194

8/14/2019 Thesis-Org Complete (1)
http://slidepdf.com/reader/full/thesis-org-complete-1 136/194
4.3.2. Stress response
The analysis of the trends pertaining to the response ratios (R ) of the stress
reporters construct’s showed similar goodness-of-fit for the three models and the three
promoters, with the exception of a significantly higher AIC (P < 0.05) observed in thelogistic model of the rpoS gene response (Table 4-2). Because AIC and BIC values
close to zero indicate a good fit, the Weibull growth model may represent the best
choice for future studies. Overall, high correlation coefficients (adjusted R2) were
observed for all of the investigated models and treatments. In starved cells the predicted
R max for grpE had the lowest stress RR (P < 0.05), in contrast to cold shocked cells in
which the lowest stress RR (P < 0.05) was observed for rpoS indicating that because its
higher RR ’s uspA may be the best promoter to monitor microbial stress (Table 4-2). The
Table 4-2. Models goodness-of-fit (AIC, BIC and adjusted R2), and coefficients ( Rmax, r , t i , g, m), resulting from
analysis of fluorescence response of Escherichia coli O157:H7 stress gene promoters after induced stress

8/14/2019 Thesis-Org Complete (1)
http://slidepdf.com/reader/full/thesis-org-complete-1 137/194
" " #
(starvation or cold-shock).
Biosensor (stress gene
reporterplasmid)
Estimates Starvation Cold Shocked
Gompertz Logistic Weibull Gompertz Logistic Weibull
puspA::gfp UV AIC
9.9!" 18.3 !" -2.8! -2.7# 2.3# -6.0# prpoS::gfp UV 19.1!" 25.6" 4.2!" 4.3# 4.9# 1.8# pgrpE::gfp UV 3.3!" 3.4!" 2.1!" 7.4# 7.4# 6.5# puspA::gfp UV
BIC
12.4$ 20.9$ -0.3$ -2.6% 2.4% -5.8% prpoS::gfp UV 18.4$ 28.1$ 6.8$ 4.6% 5.2% 2.2% pgrpE::gfp UV 4.6$ 4.7$ 3.5$ 7.4% 7.4% 6.6% puspA::gfp UV
Adjusted R2
0.974& 0.974& 0.998& 0.994' 0.993' 0.992' prpoS::gfp UV 0.995& 0.991& 0.998& 0.993' 0.994' 0.977' pgrpE::gfp UV 0.993
&
0.986&
0.994&
0.989'
0.989'
0.993'
puspA::gfp UV R max
5.8( 5.7( 6.1( 5.9) 5.4) 7.7)
prpoS::gfp UV 6.6( 6.5( 7.4( 3.5* 3.4* 3.2*
pgrpE::gfp UV 2.2+ 2.1+ 2.2+ 5.2) 4.9) 6.6)
puspA::gfp UV r (g ‡ )
0.123, 0.193, 17.1- 0.017. 0.027. 206.1/
prpoS::gfp UV 0.100, 0.147, 22.4- 0.013. 0.023. 123.5/
pgrpE::gfp UV 0.603, 0.580, 5.3- 0.015. 0.025. 225.9/
puspA::gfp UV t i (p ‡ )
8.40 11. 50 1.11 11.72 12.52 0.13
prpoS::gfp UV 8.90 12.80 0.91 1.52 6.32 0.63
pgrpE::gfp UV 3.60 4.60 2.01 2.82 1.22 1.03 ‡Weibull model coeffients.
!,",#,$,%,&,',(,+,),*,,, -,., /, 0, 1,2,3 Greek letters indicate that means within inactivation parameters were statistically different within their group at P < 0.05 using the
Tukey procedure. R max = maximum response ratio, r = response rate, t i = time to response (equivalent to lag phase), AIC = Akaike Information Coefficient, BIC = Bayesian Information
Coefficient.

8/14/2019 Thesis-Org Complete (1)
http://slidepdf.com/reader/full/thesis-org-complete-1 138/194
0
1
2
3
4
5
6
7
8
0 10 20 30 40 50 60 70 80 90
R e s p o n s e r a t i o ( R )
time (h)
uspA
rpoS
Logistic: uspA
Logistic: rpoS
Weibull: uspA
Weibull: rpoS
Logistic
Weibull A
uspA::gfp UV
rpoS::gfp UV
7
8
AA f
8/14/2019 Thesis-Org Complete (1)
http://slidepdf.com/reader/full/thesis-org-complete-1 139/194
As previously observed by Zhang and Griffiths (2003), higher fluorescence units
were obtained from the puspA::gfp uv reporter plasmid, with variations depending on the
method applied to analyze fluorescence. While puspA::gfp uv may give higher response
ratios, a conservative approach may be to analyze all the three gene reporters when
studying new stresses. As observed by Gawande and others (2005ab) there is a
variation in responses within the gene reporters with stresses, and also with time.
Hence, trends analysis may contribute to better understanding on simultaneous
responses.
4.3.3.Cross-protection to physical hurdles
Bacterial cells were harvested after exposure to different environmental stress
conditions (Table 4 3) E coli cells grown in LACB resulted in similar mean times (t ) as
Table 4-3. Growth and stress conditions of Escherichia coli O157:H7 and its relative resistance to pulsed electricfields (PEF).

8/14/2019 Thesis-Org Complete (1)
http://slidepdf.com/reader/full/thesis-org-complete-1 140/194
" # #
Pre-processing conditions Physiological status PEF Processing Resistance
MediumTempe-rature
time Status at
inactivation
Method of
monitoring
ElectricField
frequency tc
(°C) (h) (kV/mm) (Hz) (!s)
10 100
Stationaryphase
Photometry 1.8 20
99.5"
LACB 25 25 70.3"
40 25 87.3"
TSBL 7 150
Stationary
phase
Photometry 1.8 20
97.4#
TSBL pH 5.0 (LA) 35 150 168.4$
TSBL 7.5% NaCl 35 150 153.0$
TSBL 45 25 240.9%
LB† 35 20 Non-stressed
Fluorometry 2.4 20
24.3&
LB5 50
Cold stressed40.3&
5 250 54.6&
Water 25 100Starvation
stress 46.2&
",#,$,%,&Greek letters indicate means within inactivation parameters that are statistically different at P < 0.05 using the Tukey pairwise comparison test.
†Non-shocked control. LACB =
lactose broth, TSBL = tryptic soy broth supplemented with 0.5 % lactose, LA = lactic acid, LB = Luria-Bertani broth, Miller, tc = mean time calculated according to the model.†Absorbance values determined at 450 nm, fluorescence values determined using 485 nm 535 nm filters for excitation and emission respectively from the rpoS promoter gene reporter.

8/14/2019 Thesis-Org Complete (1)
http://slidepdf.com/reader/full/thesis-org-complete-1 141/194
A detailed analysis of the inactivation trends resulted in downwards concavity forall the treatments; with similar magnitude in the scale and shape parameters of the
LACB treatments as for the cell exposed to stress (Table 4-4). In the TSBL grown cells
the scale parameter (a ) showed similar variation as the tc with a significantly lower
value (P < 0.05) for E. coli cells grown at 7 °C and higher (P < 0.05) for thos e grown at
45 °C. By contrast, the shape parameter ( n ) was found to be different in bacteria grown
in acid environments compared to those grown at 45 °C (P < 0.05). Physiologically t c
can be used as a global indicator of microbial health as it reflects the mean of the
distribution of resistances in the population, in the other hand, the shape parameter
indicates potential “shouldering” or “tailing”, which result from a genetically protected or
mutant population to low or high intensity treatments, respectively (Juneja and others
1998, Hayman 2007). At a constant shape factor, the scale parameter (calculated using
Table 4-4. Weibull and Weibullian-log logistic (WeLL) inactivation parameters (n = scale parameter, a = shape
parameter, k = rate, T c = onset temperature level of inactivation) describing Escherichia coli O157:H7 inactivation
i ilk b l d l t i fi ld (PEF) i

8/14/2019 Thesis-Org Complete (1)
http://slidepdf.com/reader/full/thesis-org-complete-1 142/194
" # $
in milk by pulsed electric fields (PEF) processing.
Medium Temperature TimePEF
IntensityWeibull
parametersWeLL
Parameters
(°C) (h) (kV/mm, Hz) !#
(!s
-1
)
$%&
(°C)
LACB 10 100
1.8, 20
7.4" 106.4# 3.6$ 47.1%
LACB 25 25 3.9" 77.4# 7.4$ 40.1%
LACB 40 25 5.5" 94.6 # 8.3$ 39.8%
TSBL 7 150
1.8, 20
2.4&' 109.2( 9.3) 47.3*
TSBL pH 5.0 (LA) 35 150 3.0& 188.5+ 6.3) 57.1*
TSBL 7.5% NaCl 35 150 2.4&' 172.1(+ 8.1) 54.6*
TSBL 45 25 1.2' 257.0, 10.2) 59.2*
LB†† 35 20
2.4, 20
1.4! 26.0- 7.3. 28.6/
LB 5 50 3.1! 44.6- 2.6. 30.3/
LB 5 250 4.7! 59.8- 3.4. 31.9/
Water 25 100 4.3! 50.7- 1.6. 31.5/ ",#,$,%,&, ', (, +,,,),*,!,-,., /
Superscripted symbols indicate means within inactivation parameters that are statistically different at P < 0.05 using the Tukey procedure. † Water activity (aw) =
0.920.††
Non-shocked control. LACB= lactose broth, TSBL = tr yptic soy broth supplemented with 0.5 % lactose, LA = lactic acid, LB = Luria-Bertani broth, Miller.
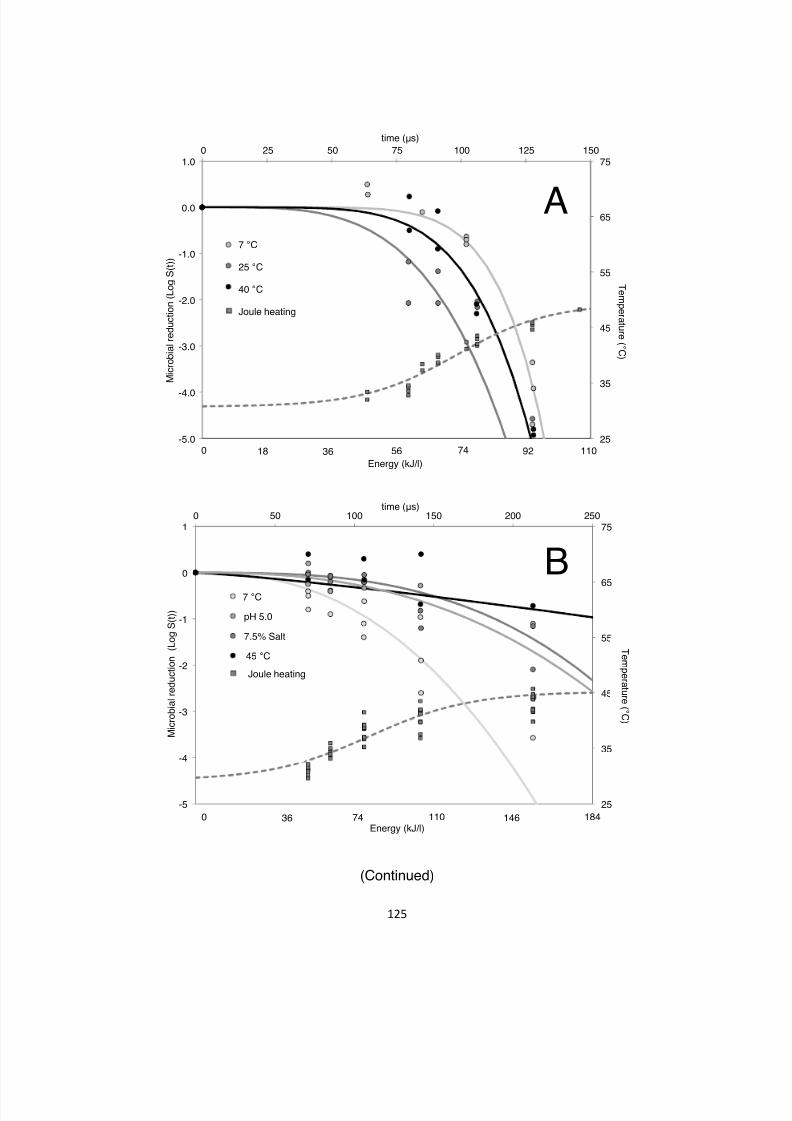
8/14/2019 Thesis-Org Complete (1)
http://slidepdf.com/reader/full/thesis-org-complete-1 143/194
+ #% %+ (% "++ "#% "%+25
35
45
55
65
75
-5.0
-4.0
-3.0
-2.0
-1.0
0.0
1.00 25 50 75 100 125 150
Energy (kJ/l)
T em p er a t ur e ( ' C )
M i c r o b i a l r e d u c t i o n ( L o g S
( t ) )
time (!s)
7 'C
25 'C
40 'C
7 'C
25 'C
40 'C
Joule Heating
Joule Heating
7 "C
25 "C
40 "C
Joule heating
T em p er a t ur e ( " C )
18 36 56 74 92 1100
A
time (!s)

8/14/2019 Thesis-Org Complete (1)
http://slidepdf.com/reader/full/thesis-org-complete-1 144/194
Figure 4-3. Inactivation trends of Escherichia coli O157:H7 by pulsed electric fields
+ #+ ,+ &+ )+ "++
25
35
45
55
65
75
-5
-4
-3
-2
-1
0
10 20 40 60 80 100
T em p er a t ur e ( ' C )
M i c r o b i a l r e d u c t i o n
( L o g
S ( t ) )
time (!s)
Control
Cold Shocked (50 h)Cold Shocked (250 h)
Starved
Control
CS 50
CS 250
Starved
Joule Heating
JH
Joule heating
T em p er a t ur e ( " C )
26 52 78 104 1300Energy (kJ/l)
C

8/14/2019 Thesis-Org Complete (1)
http://slidepdf.com/reader/full/thesis-org-complete-1 145/194
Several studies have shown that the resistance of bacterial cells to stress is
greater when they are in the stationary phase of growth. For example, Lou and Yousef
(1996) showed that the heat resistance of Listeria monocytogenes (measured as D 56°C
value) increased eight-fold from early logarithmic to early stationary phase. These
observations also apply to PEF, Wouters and others (2001) demonstrated that L.
plantarum cells exhibited higher sensitivity to PEF when they were at exponential phase
rather than the stationary phase of growth. They attributed the effect to the elongation of
the bacteria cells in preparation for division compared to stationary phase bacterial cells
that have been adapted to survive stress conditions.
Growth temperature prior to hydrostatic high pressure (HHP) treatment was
reported to affect the resistance of L. monocytogenes to inactivation (Bull and others
8/14/2019 Thesis-Org Complete (1)
http://slidepdf.com/reader/full/thesis-org-complete-1 146/194
Starvation and cold shock have been also evaluated quantitatively for their effect
on resistance. Lou and Yousef (1996) observed that the thermo-tolerance (D 56°C ) of L.
monocytogenes increased after starving the cells for up to 156 h. A similar trend of
increased thermo-tolerance (D 56°C ) was observed by Leenanon and Drake (2001) after
starving E. coli O157:H7 at 37 °C for 48 h with rpoS negative mutan ts exhibiting a lower
resistance. Moreover, Zhang and Griffiths (2003) suggested increased D 52°C values of
E. coli O157:H7 as a result of expression of stress response genes at various
temperatures. Leenanon and Drake (2001) reported that cold shock (at 5 °C for 1 week)
led to a decrease of the thermo-tolerance (D 56°C ) of E. coli cells except for the rpoS negative mutant.
When comparing all of the stresses applied in the present study it could have
been expected that starvation will produce more resistant cells as found by Lou and
8/14/2019 Thesis-Org Complete (1)
http://slidepdf.com/reader/full/thesis-org-complete-1 147/194
to membrane fluidity. Non-linear inactivation trends may result from microbial resistance
highlighted by “lag” periods (Juneja and others 1998), and by “tailing” (Hayman and
others 2007). “Tailing” as a consequence of PEF processing was reported by Alvarez
and others (2003) for the inactivation of Salmonella enterica, and Rodríguez-Calleja and
others (2006) with Staphylococcus aureus , and these results can be attributed to the
temperature control (below 35 °C) both research gro ups applied during their treatments.
Predictive microbiology is evolving by incorporating the effect of the physiological
characteristics on the inactivation kinetics under static and dynamic conditions including
the modified Dabes kinetics (Vladramidis and others 2007), and the Weibullian-log
logistic (Peleg and Penchina 2000, Corradini and Peleg 2009). Thus, it is important to
point out that most of these variations in the progression of the kinetics occur at
temperatures where metabolic reactions occur and this may in turn depend on both the
8/14/2019 Thesis-Org Complete (1)
http://slidepdf.com/reader/full/thesis-org-complete-1 148/194
4.4.Conclusions
The analysis of E. coli O157:H7 growth dynamics in two growth mediums
resulted in an enhanced ability to growth at challenging conditions when the nutrient
density was higher. In addition, the growth of E. coli at a lower pH (4.8) in a weaker acid
(LA), and a minimum water activity of 0.915 were predicted linear using secondary
models. The response ratios of the E. coli O157:H7 general stress reporters were
successfully modeled using mechanistic and probabilistic models, providing
advancement to predictive risk assessment. Also, the variation in resistance of cross
protected E. coli cells was reflected as mean time values from the Weibull model, and
onset temperatures for inactivation, at various PEF treatment conditions were
estimated, providing an additional insight to the mathematical analysis of PEF
inactivation of microbial cells

8/14/2019 Thesis-Org Complete (1)
http://slidepdf.com/reader/full/thesis-org-complete-1 149/194
5. General conclusion
As reviewed in the introductory section, non-thermal dairy processes continue to
be developed with several purposes including the inactivation or removal of
microorganisms to improve the safety of dairy products and their stability during
storage. Cross-flow micro-filtration is becoming well established in the dairy industry
with the objective of removing spores that cause cheese “late blowing” and to produce
extended shelf-life (ESL) milk with enhanced quality attributes.
Because the regulations related to pasteurization are based on temperature andtime combinations, the emergence of new processes is leading to the evaluation of
alternatives to thermal processing because of their potential benefits on enhanced
nutritional benefits, sensory attributes and shelf stability among others. For that reason
8/14/2019 Thesis-Org Complete (1)
http://slidepdf.com/reader/full/thesis-org-complete-1 150/194
Parallel to the development of new processes, their combination in sequence or
as a unit has also been implemented commercially, in what has been named hurdle
technology. The combination of non-thermal and thermal processes to achieve higher
safety and stability levels has also become a movement within the new processes. In
that regard, the flexibility on the application of PEF facilitates its potential to be
combined with other technologies.
One of the drawbacks of the application of hurdle technology with the objective of
minimal processing is the potential development of microbial stress responses that
increase their resistance to decreased intensity levels of treatment, and or may cause
cross-protection to heterologous stresses. Increasing research in the subject has
developed several techniques that facilitate the monitoring of the physiological status of
microbial cells when exposed to extreme environments Combining these novel
8/14/2019 Thesis-Org Complete (1)
http://slidepdf.com/reader/full/thesis-org-complete-1 151/194
By increasing the PEF inlet temperature from 5.0-6.3 °C to 34.0-34.3 °C the PEF
treatment time required to inactivate 3.0 or more Log CFU/ml of the mesophilic
population and more than 3.8 log CFU/ml was decreased from 1530 µs to 510 µs at 4.0
kV/mm and from 459 µs to 230 µs at 5.6 kV/mm. And by applying CFMF prior to PEF
the reduction was increased to more than 4.7 log CFU/ml in mesophilics, coliforms and
psychrotrophs, which was similar to the CFMF/HTST combination. In addition,
differences in cream (12%) homogenization were noticeable in the reduction of the
coliform population when applying 4.0 kV/mm for 1530 µs suggesting better PEF
inactivation effects in homogenized cream. This study concluded establishing therelation between conductivity and fat or solids content, which resulted in a decrease in
conductivity of 0.07 S/m per 10% of fat content in non-homogenized products, and an
increase in conductivity of 0.05 S/m per 1 % of solids in the non-fat products with

8/14/2019 Thesis-Org Complete (1)
http://slidepdf.com/reader/full/thesis-org-complete-1 152/194
and total thermoduric thermophiles were higher in thermally pasteurized milk, leading to
a conclusion that the kind of microorganisms inactivated by both technologies may differ
resulting in different profiles of microorganisms that recover from inactivation.
A different approach was taken in the third study where the growth of Escherichia
coli O157:H7 was monitored by means of absorbance in two mediums (LACB and
TSBL) resulting in an enhanced capability to growth at extreme temperature conditions
in a medium with higher nutrient density (TSBL). Also, TSBL was modified to growth E.
coli O157:H7 in acid and high salt concentrations. The Cardinal and Ratkowsky models
were used to describe the microbial growth from optimum to extreme environments.
Additionally microbial constructs allowed monitoring the expression of stress proteins by
means of fluorescence. The Gompertz, Logistic and Weibull models have similar
goodness of fit in explaining stress response ratios In general the kinetics of
8/14/2019 Thesis-Org Complete (1)
http://slidepdf.com/reader/full/thesis-org-complete-1 153/194
Also, E. coli O157:H7 cells grown at higher temperatures may require an increase in
treatment time to achieve similar reductions.
In general, this work addressed the various factors involved in the
implementation of PEF as a microbial inactivation technique in milk, its combination with
microfiltration, and explained the potential risks that need to be accounted when a
stress adapted microorganism (E. coli O157:H7) may represent when exposed to PEF
using advanced models.
5.1. Applications and future research
By studying the survival of natural microflora passing through various processing
steps of milk production critical factors were highlighted, which enable possible
implementation of CFMF in conjunction with PEF in a milk production line as a possible
8/14/2019 Thesis-Org Complete (1)
http://slidepdf.com/reader/full/thesis-org-complete-1 154/194
treating milk products of high fat level can reveal a different pattern of microbial
inactivation.
Research on the effects of environmental stress response of a model
microorganism as E . coli O157:H7 the observations can be extrapolated to similar
bacteria. As the study of modified liquid media revealed a protective effect of the
nutrients additional research in the effect of sugar content, and type (glucose, sucrose
or lactose), may expose different patterns of microbial growth at extreme conditions (i.e.
temperature and food ingredients like acids and salts) that can be further modeled. The
construction of fluorescent stress reporters (biosensors) of other types of
microorganisms (i.e. gram positives) may also reveal different trends. Also, further
studies in the cross-protective effect of environmental hardening prior PEF processing
at low temperatures may result in variation on microbial inactivation due to variation on
8/14/2019 Thesis-Org Complete (1)
http://slidepdf.com/reader/full/thesis-org-complete-1 155/194
6. References
Aaku EN, Collison EK, Gashe BA, Mpuchane S. 2004. Microbiological quality of milk
from two processing plants in Gaborone Botswana. Food Control. 15: 181-186.
Abee T, Wouters JA. 1999. Microbial stress response in minimal processing. Int J Food
Microbiol. 50: 65-91.
Advanced Electron Beams (AEB). 2009. AEB Blu sterilization for aseptic packaging:
ambient temperature, chemical free, water free sterilization with in-line electron
beams. Advanced Electron Beams. Wilmington, Massachusetts. Webminar.
Available at: http://www.aeb.com/downloads/
Advanced Electron Beams (AEB). 2009. The evolution of aseptic packaging: ambient
temperature, chemical free, water free sterilization with in-line electron beams.

8/14/2019 Thesis-Org Complete (1)
http://slidepdf.com/reader/full/thesis-org-complete-1 156/194
American Public Health Association. 1992. Compendium of Methods for the
Microbiological Examination of Foods, APHA Inc, Washington, DC, USA.
Amiali M, Ngadi MO, Raghavan VGS. 2006. Electrical conductivities of liquid egg
products and fruit juices exposed to high pulsed electric fields. Int J Food Prop. 9:
533-540.
Amiali M, Ngadi MO, Smith JP, Raghavan GSV. 2007. Synergistic effect of temperature
and pulsed electric field on inactivation of Escherichia coli O157:H7 and
Salmonella enteritidis in liquid egg yolk. J Food Eng. 79: 689-694.
Anderson IC, Rhodes M, Kator H. 1979. Sublethal stress in Escherichia coli : a functionof salinity. Appl Env Microbiol. 38 (6): 1147-1152.
Aronsson K, Borch E, Stenlöf B, Rönner U. 2004. Growth of pulsed electric field
exposed Escherichia coli in relation to inactivation and environmental factors. Int
8/14/2019 Thesis-Org Complete (1)
http://slidepdf.com/reader/full/thesis-org-complete-1 157/194
Baranyi J, Roberts TA, McClure P. 1993. A non-autonomous differential equation to
model bacterial growth. Food Microbiol. 10: 43-59.
Baranyi J, Roberts TA. 1994. A dynamic approach to predicting bacterial growth in food.
Int J Food Microbiol. 23: 277-294.
Baranyi J, Roberts TA. 1995. Mathematics of predictive food microbiology. Int J Food
Microbiol. 26: 199-218.
Barbosa-Cánovas GV, Altunakar B. 2006. Pulsed electric fields processing of foods: an
overview. In: Raso J, Heinz V. Pulsed electric fields technology for the food
industry: fundamentals and applications. New York, NY: SpringerScience+Business Media. 3-26.
Barbosa-Cánovas GV, Bermúdez-Aguirre D. 2010. Pasteurization of milk with pulsed
electric fields. In: Griffiths MW, editor. Improving the safety and quality of milk.

8/14/2019 Thesis-Org Complete (1)
http://slidepdf.com/reader/full/thesis-org-complete-1 158/194
Barer MR, Harwood CR. 1999. Bacterial viability and culturability. In: Poole RK, editor.
Advances in microbial physiology. Vol 41. London: Academic Press. 93-137.
Barnes G. 2009. Non-thermal pasteurization technology – is it ready for dairy beverage
processing?. Dairy Management. IDFA milk & cultured products seminar. March
31 to April 2. Personal communication.
Bazhal MI, Ngadi MO, Raghavan GSV, Smith JP. 2006. Inactivaion of Escherichia coli
O157:H7 in liquid whole egg using combined pulsed electric field and thermal
treatments. LWT Food Sci Technol. 39: 419-425.
Beolchini F, Cimini S, Mosca L, Veglio F, Barba D. 2005. Microfiltration of bovine andovine milk for the reduction of microbial content: effect of some operating
conditions on permeate flux and microbial reduction. Sep Sci Technol. 40: 757-
772.

8/14/2019 Thesis-Org Complete (1)
http://slidepdf.com/reader/full/thesis-org-complete-1 159/194
International Life Sciences Institute. Washington DC. 23 p. [Accessed 2010
August 28]. Available from:
http://www.icpmf.org/pp/S10_1_PM100_Application%20of%20QMRA%20to%20g
o%20beyond%20safe%20harbors_Part1.pdf
Brans G, Schroën CGPH, van der Sman RGM, Boom RM. 2004. Membrane
fractionation of milk: state of the art and challenges. J Membr Sci. 243: 263-272.
Brul S, Westerhoff HV. 2007. Systems biology and microbiology. In: Brul S, Van
Gerwen S, Zwietering M, editors. Modelling microorganisms in food. Boca Raton,
FL: CRC Press. 250-294.Bull MK, Hayman MM, Stewart CM, Szabo EA, Knabel. 2005. Effect of prior growth
temperature, type of enrichment medium, and temperature and time of storage
on recovery of Listeria monocytogenes following high pressure processing of
8/14/2019 Thesis-Org Complete (1)
http://slidepdf.com/reader/full/thesis-org-complete-1 160/194
Castro AJ, Swanson BG, Barbosa-Cánovas GV, Zhang QH. 2001. Pulsed electric field
modification of milk alkaline phosphatase activity. In: Barbosa-Cánovas GV,
Zhang QH, editors. Pulsed electric fields in food processing: fundamental aspects
and applications. Lancaster, PA: Technomic Publishing Co. p 83-103.
Center for Dairy Research (CDR). 2004. Membranes 101. Wisconsin Center for Dairy
Research. University of Wisconsin Madison. [Accessed 2010 December 12].
Available from:
http://www.cdr.wisc.edu/programs/dairyingredients/pdf/membranes_101.pdf
Cerf O. 1986. Introduction. In: International Dairy Federation (IDF). Monograph on
pasteurized milk. Bulletin of the International Dairy Federation no. 200. Brussels,
Belgium. 98 p.
Christiansson A, Naidu AS, Nilsson I, Wadström T, Pettersson, HE. 1989. Toxin

8/14/2019 Thesis-Org Complete (1)
http://slidepdf.com/reader/full/thesis-org-complete-1 161/194
Corradini MG, Peleg M. 2009. Dynamic model of heat inactivation kinetics for bacterial
adaptation. Appl Env Microbiol. 75 (8): 2590-2597.
Couvert O, Gaillard S, Savy N, Mafart P, Leguérinel I. 2005. Survival curves of heated
bacterial spores: effect of environmental factors on Weibull parameters. Int J
Food Microbiol. 101: 73-81.
Dalgaard P, Koutsoumanis K. 2001. Comparison of maximum specific growth rates and
lag times estimated from absorbance and viable count data by different
mathematical models. J Microbiol Methods. 43: 183-196.
Dalgaard P, Ross T, Kamperman L, Neumeyer K, McMeekin TA. 1994. Estimation of
bacterial growth rates from turbidimetric and viable count data. Int J Food
Microbiol. 23: 391-404.
Datta N, Deeth HC. 1999. High pressure processing of milk and dairy products.

8/14/2019 Thesis-Org Complete (1)
http://slidepdf.com/reader/full/thesis-org-complete-1 162/194
De Luis R, Arias O, Puértolas E, Benedé S, Sánchez L, Calvo M, Pérez MD. 2009.
Effect of high-intensity pulse electric fields on denaturation of bovine whey
proteins. Milchwissenschaft. 64: 422-426.
De Noni I, Pellegrino L, Cattaneo S, Resmini P. 2007. HPLC of proteose peptones for
evaluating ageing of packaged pasteurized milk. Int Dairy J. 17, 12-19.
Deeth HC, Datta N, Ross AIV, Dam XT. 2007. Pulsed electric field technology: effect on
milk and fruit juices. In: Tewari G, Juneja VK, editors. Advances in thermal and
non-thermal food preservation. Ames: Blackwell Publishing. 241-269.
Degen PJ, Kendall TA, Dehn J, inventors. Pall Corporation, assignee. 1995 Apr 9.
Production of sterile milk through dynamic microfiltration. US Patent 5,401,523.
DeHaan SWH. 2007. Circutry and pulse shapes in pulsed electric field treatment of
food. In: Lelieveld HLM, Notermans S, de Haan SWH, editors. Food preservation
8/14/2019 Thesis-Org Complete (1)
http://slidepdf.com/reader/full/thesis-org-complete-1 163/194
http://www.milkproduction.com/Library/article_series/idf_fao_symp/New_develop
ments_in_heating_technology.htm
Edgell JW, Thomas LF, Clegg, LFL, Cuthbert WA. 1950. Thermoduric organisms in
milk. Part III. Provisional standard technique for the laboratory pasteurization test
for milk, and rinses and swabs of dairy equipment, with suggestions for
interpretation of results. J Appl Microbiol. 13: 132-134.
Elez-Martínez, Martín-Belloso O, Rodrigo D, Sampedro F. 2007. Impact of pulsed
electric fields on food enzymes and shelf-life. In: Lelieveld HLM, Notermans S, de
Haan SWH, editors. Food preservation by pulsed electric fields: from research to
application. Boca Raton, FL: CRC Press. 212-246.
El-Hadi Sulieman AM. 2007. Effect of pretreatment of milk quality characteristics of
Jibna-Beida (white cheese). Int J Food Eng. 3(4): Article 15.

8/14/2019 Thesis-Org Complete (1)
http://slidepdf.com/reader/full/thesis-org-complete-1 164/194
Farber JM, Brown BE. 1990. Effect of prior heat shock on heat resistance of Listeria
monocytogenes in meat. Appl Environ Microbiol. 1584-1587.
Farid MM. inventor. University of New Zealand. Assignee. Pressure assisted thermal
sterilization or pasteurisation method and apparatus. 2009 Apr 10. US Patent
12/296,789.
Fernández A, Salmerón C, Fernández PS, Martínez A. 1999. Application of a frequency
distribution model to describe the thermal inactivation of two strains of Bacillus
cereus . Trends Food Sci & Technol. 10: 158-162.
Fernández-Molina JJ, Fernández-Gutiérrez SA, Altunakar B, Swanson BG, Barbosa-
Cánovas GV. 2005. The combined effect of pulsed electric fields and
conventional heating on the microbial quality and shelf life of skim milk. J Food
Process Preserv. 29: 390-406.

8/14/2019 Thesis-Org Complete (1)
http://slidepdf.com/reader/full/thesis-org-complete-1 165/194
[Accessed 2010 May 15]. Available from:
http://www.fda.gov/downloads/Food/FoodSafety/Product-
SpecificInformation/MilkSafety/NationalConferenceonInterstateMilkShipmentsNCI
MSModelDocuments/UCM209789.pdf
FOSS. 1998. Reference Manual of Milkoscan FT 120 (Type 71200). Foss Electric A/S:
Hillerød, Denmark. 115 p.
Fox J. 2009. R Commander. A Basic-Statistics Graphical User Interface to R. Version
1.5-3. Hamilton, ON, Canada: McMaster University [Accessed 2010 Apr 2].
Available from: http://socserv.mcmaster.ca/jfox/Misc/Rcmdr
Fox MB. 2007. Microbial inactivation kinetics of pulsed electric field treatment. In:
Lelieveld HLM, Notermans S, de Haan SWH. Food preservation by pulsed
electric fields: from research to application. Boca Raton, FL: CRC Press. 127-

8/14/2019 Thesis-Org Complete (1)
http://slidepdf.com/reader/full/thesis-org-complete-1 166/194
Fung D. 2009. Rapid methods and automation in food microbiology: 25 years of
development and predictions. In: Barbosa-Cánovas G, Mortimer A, Lineback D,
Spiess W, Buckle K, Colonna, P. Global issues in food science and technology.
Burlington, MA: Academic Press. 165-176.
García D, Gómez N, Mañas P, Raso J, Pagán R. 2007. Pulsed electric fields cause
bacterial envelopes permeabilization depending on the treatment intensity, the
treatment medium pH and the microorganism investigated. International J Food
Microbiol. 113: 219-227.
García D, Gómez N, Raso J, Pagán R. 2005. Bacterial resistance after pulsed electric
fields depending on the treatment medium pH. Innov Food Sci Emerg Technol. 6:
388-395.
García D, Mañas P, Gómez N, Raso J, Pagán R. 2006. Biosynthetic requirements for
8/14/2019 Thesis-Org Complete (1)
http://slidepdf.com/reader/full/thesis-org-complete-1 167/194
Geeraerd AH, Valdramidis VP, Van Impe JF. 2005. GInaFiT, a freeware tool to assess
non-log-linear microbial survivor curves. Int J Food Microbiol. 102: 95-105.
Gésan-Guiziou G. 2010. Removal of bacteria, spores and somatic cells from milk by
centrifugation and microfiltration techniques. In: Griffiths MW, editor. Improving
the safety and quality of milk. Vol 1: milk production and processing. Boca Raton
FL: Woodhead Publishing Ltd. 349-372.
Geveke DJ. 2005. Non-thermal processing by radio frequency electric fields. In: Sun D,
editor. Emerging technologies for food processing. San Diego, CA: Elsevier
Academic Press. 307-322.
Grahl T and Märkl H. 1996. Killing of microorganisms by pulsed electric fields. Appl
Microbiol Biotechnol. 45: 148-157.
Griffiths MW. 1986. Use of milk enzymes as indices of heat treatment. J Food Protect.
8/14/2019 Thesis-Org Complete (1)
http://slidepdf.com/reader/full/thesis-org-complete-1 168/194
Gunasekera TS, Attfield PV, Veal DA. 2000. A flow cytometry method for rapid
detection and enumeration of total bacteria in milk. Appl Env Microbiol. 66 (3):
1228-1232.
Gunasekera TS, Sørensen A, Attfield PV, Sørensen A, Veal DA. 2002. Inducible gene
expression by nonculturable bacteria in milk after pasteurization. Appl Env
Microbiol. 68 (4): 1988-1993.
Gunasekera TS, Veal DA, Attfield PV. 2003. Potential for broad applications of flow
cytometry and fluorescence techniques in microbiobiological and somatic cell
analyses of milk. Int J Food Microbiol. 85: 269-279.
Hanneman H, Robertson LJ. 2005. Heat recovery systems. In: International Dairy
Federation (IDF). Energy use in dairy processing. Bulletin of the International
Dairy Federation No. 401. Brussels, Belgium. p 32-48.
8/14/2019 Thesis-Org Complete (1)
http://slidepdf.com/reader/full/thesis-org-complete-1 169/194
Heinz V, Philips ST, Zenker M, Knorr D. 1999. Inactivation of bacillus subtilis by high
intensity pulsed electric fields under close to isothermal conditions. Food
Biotechnol. 13: 155-168.
Heinz V, Toepfl S, Knorr D. 2003. Impact of temperature on lethality and energy
efficiency of apple juice pasteurization by pulsed electric fields treatment.
Innovative Food Sci Emerg Tech. 4: 167-175.
Hening DR, Flowers R, Reiser R, Ryser ET. 2004. Pathogens in milk and milk products.
In: Wehr HM, Frank JF, editors. Standard methods for the examination of dairy
products. 17th ed. Washington DC: American Public Health Association. p 103-
152.
Hill C, Cotter PD, Sleator RD, Gahan CGM. 2002. Bacterial stress response in Listeria
monocytogenes : jumping the hurdles imposed by minimal processing. Int Dairy J.
8/14/2019 Thesis-Org Complete (1)
http://slidepdf.com/reader/full/thesis-org-complete-1 170/194
Holm C, Jespersen L. 2003. A flow-cytometric gram-staining technique for milk-
associated bacteria. Appl Env Microbiol. 69(5): 2857-2863.
Holm C, Mathiasen T, Jespersen L. 2004. A flow cytometric technique for quantification
and differentiation of bacteria in bulk tank milk. J Appl Microbiol. 97: 935-941.
Holm S, Elisabet IB, Holm EC, CF Holm. Inventors. Alfa-Laval Food and Dairy
Engineering AB. assignee. 1989 Jun 13. Method for producing milk with a
lowered bacterial content. US Patent 4,876,100.
Hoogland H, de Haan W. 2007. Economic aspects of pulsed electric field treatment of
food. In: Lelieveld HLM, Notermans S, de Haan SWH, editors. Food preservation
by pulsed electric fields: from research to application. Boca Raton, FL: CRC
Press. 257-265.
H*lsheger H, Potel J, Niemann EG. 1981. Kiling of bacteria with electric pulses of high
8/14/2019 Thesis-Org Complete (1)
http://slidepdf.com/reader/full/thesis-org-complete-1 171/194
http://www.usdairy.com/sustainability/TheCommitment/Documents/NonThermalP
rocessingProjectSummary063009.pdf
International Commission for the Microbiological Specifications of Foods (ICMSF).
2002. Microbiological Testing in Food Safety Management. New York, NY:
Science+Business Media Inc. 362 p.
International Dairy Federation (FIL-IDF), 1974. Bacteriological quality of cooled bulk
milk. Document 83. International Dairy Federation, Brussels, Belgium.
International Dairy Federation (FIL-IDF). 1990. Bactoscan technique. In: International
Dairy Federation (FIL-IDF). Methods for assessing the bacteriological quality of
raw milk from the farm. Bulletin No. 256. FIL-IDF: Brussels, Belgium. 24-30.
International Dairy Federation (FIL-IDF). 2009. Environmental / Ecological impact of the
dairy sector: literature review on dairy products for an inventory of key issues, list

8/14/2019 Thesis-Org Complete (1)
http://slidepdf.com/reader/full/thesis-org-complete-1 172/194
Jaeger H, Schulz A, Karapetkov N, Knorr D. 2009. Protective effect of milk constituents
and sublethal injuries limiting process effectiveness during PEF inactivation of Lb.
rhamnosus . Int J Food Microbiol. 134: 154-161.
Jayaram S, Castle GSP, Margaritis A. 1991. Effects of high electric field pulses on
Lactobacillus brevis at elevated temperatures. IEEE. 674-681.
Jayaram SH. 2000. Sterilization of liquid foods by pulsed electric fields. IEEE Electr
Insul Mag. 16(6): 17-25.
Jelen P. 1992. Pressure-driven membrane processes: principles and definitions. In:
International Dairy Federation (IDF). New applications of membrane processes.
IDF special issue no. 9201. p 33-50..
Jimenez-Lopez AJE, Leconte N, Dehainault O, Geneste C, Fromont L, Gésan-Guiziou
G. 2008. Role of milk constituents on critical conditions and deposit structure in

8/14/2019 Thesis-Org Complete (1)
http://slidepdf.com/reader/full/thesis-org-complete-1 173/194
Juneja VK, Marks HM. 2003. Mathematical description of non-linear survival curves of
Listeria monocytogenes as determined in a beef gravy model system at 57.5 to
65°C. Innov Food Sci and Emerg Technol. 4: 307-317.
Juneja VK, Novak JS. 2003. Adaptation of foodborne pathogens to stress from
exposure to physical intervention strategies. In: Yousef AE, Juneja VK, editors.
Microbial stress adaptation and food safety. Boca Raton, FL: CRC Press. p 31-
53.
Juneja VK, Valenzuela Melendres M, Huang L, Gumudavelli V, Subbiah J, Thippareddi
H. 2007. Modeling the effect of temperature on growth of Salmonella in chicken.
Food Microbiol. 24: 328-335.
Juneja VK, Valenzuela Melendres M, Huang L, Subbiah J, Thippareddi H. 2009.
Mathematical modeling of growth of Salmonella in raw ground beef under

8/14/2019 Thesis-Org Complete (1)
http://slidepdf.com/reader/full/thesis-org-complete-1 174/194
Kumar M, Hora R, Kostrzynska M, Warriner K. 2006. Mode of Salmonella and
Escherichia coli O157:H7 inactivation by a stabilized oxychloro-based sanitizer. J
Appl Microbiol. 102: 1427-1436.
Lado B, Yousef AE. 2007. Characteristics of Listeria monocytogenes important to food
processors. In: Ryser ET, Marth EH, editors. Listeria , Listeriosis, and Food
Safety. Third ed. Boca Raton, FL: CRC Press. p 157-213.
Laird DT, Gambrel-Lenarz SA, Scher FM, Graham TE, Reddy R. 2004. Microbiological
count methods. In: Wehr HM, Frank JF, editors. Standard methods for the
examination of dairy products. 17th ed. Washington DC: American Public Health
Association. p 153-186.
LASP. 2010. Electromagnetic Spectrum. University of Colorado Boulder. Available from:
http://lasp.colorado.edu/cassini/education/Electromagnetic Spectrum.htm

8/14/2019 Thesis-Org Complete (1)
http://slidepdf.com/reader/full/thesis-org-complete-1 175/194
8/14/2019 Thesis-Org Complete (1)
http://slidepdf.com/reader/full/thesis-org-complete-1 176/194
Mafart P, Couvert O, Gaillard S, Leguerinel I. 2002. On calculating sterility in thermal
preservation methods: application of the weibull frequency distribution model. Int
J Food Microbiol. 72: 107-113.
Makardij A, Chen XD, Farid MM. 1999. Microfiltration and ultrafiltration of milk: some
aspects of fouling and cleaning. Food Bioprod Process 77, 107-113.
Malmberg R, Holm S. 1998. Low bacteria skim milk by microfiltration. N Eur Food Dairy
J. 54: 75-78.
Mañas P, Barsotti L, Cheftel JC. 2001. Microbial inactivation by pulsed electric fields in
a batch treatment chamber: effects of some electrical parameters and food
constituents. Innovat Food Sci and Emerging Technol. 2: 239-249.
Marcelo PA, Rizvi SSH. 2009. Applications of membrane technology in the dairy
industry. In: Pabby AK, Rizvi SSH, Sastre AM. Handbook of membrane
8/14/2019 Thesis-Org Complete (1)
http://slidepdf.com/reader/full/thesis-org-complete-1 177/194
Mathys A. 2008. Inactivation mechanism of geobacillus and bacillus spores during high
pressure thermal sterilization. DPhil thesis. Berlin: TU Berlin. 162 p. [Accessed
December 10 2010]. Available from: @11?IJJE4?0>719EE69E4J
McBee LE. 1996. Innovative methods of energy transfer. Poult Sci. 75: 1137-1140.
McKellar RC, Knight K. 2000. A combined discrete – continuous model describing the
lag phase of Listeria monocytogenes . Int J Food Microbiol. 54: 171-180.
McKellar RC, Lu X. 2004. Modeling microbial responses in food. Boca Raton, FL, USA:
CRC Press. 343 p.
McKellar RC, Lu X. 2004. Primary Models. In McKellar, R. C., Lu, X. Modeling microbial
responses in food (pp. 21-62). Boca Raton: CRC Press.
McKellar RC. 2003. Modelling the effectiveness of pasteurization. In: Smit G. Dairy
processing: improving quality. Cambridge, England: Woodhead Publishing Ltd.

8/14/2019 Thesis-Org Complete (1)
http://slidepdf.com/reader/full/thesis-org-complete-1 178/194
August 28]. Available from:
http://www.icpmf.org/pp/S10_2_PM120_1h20_Application%20of%20QMRA%20t
o%20go%20beyond%20safe%20harbors_Part2.pdf
Mendiburu F. 2009. Agricoale. Statistical procedures for agricultural research. Version
1.0-8. Lima, Peru: National University of Engineering in Lima-Peru [Accessed
2010 Apr 2]. Available from: http://tarwi.lamolina.edu.pe/~fmendiburu
Mennane, Z., Ouhssine, M., Khedid, K., Elyachioui, M., 2007. Hygienic quality of raw
cow’s milk feeding from domestic waste in two regions in Morocco. Int J Agric
Biol. 9, 46-48.
Michalac S, Alvarez V, Ji T, Zhang QH. 2003. Inactivation of selected microorganisms
and properties of pulsed electric field processed milk. J Food Process Preserv.
27: 137-151.

8/14/2019 Thesis-Org Complete (1)
http://slidepdf.com/reader/full/thesis-org-complete-1 179/194
National Advisory Committee on Microbiological Criteria for Foods (NACMCF). 2006.
Requisite scientific parameters for establishing the equivalence of alternative
methods of pasteurization. J Food Prot. 69(5): 1190-1216.
Nebe-von Caron G, Stephens P, Bradley RA. 1998. Assessment of bacterial viability
status by flow cytometry and single cell sorting. J Appl Microbiol. 84: 988-998.
Needs E. 2001. High pressure processing of dairy products. In: Hendrickx MEG, Knorr
D, editors. Ultra high pressure treatments of foods. New York: Kluver
Academic/Plenum Publishes. p 269-296.
Ngadi M, Dehghannya J. 2010. Modeling microbial inactivation by a pulsed electric field.
In: Mohanned MF. 2010. Mathematical modeling of food processing (pp. 559-
573). Boca Raton, FL, USA: CRC Press.
Nicol RS, Kydas N, Robertson LJ. 2005. World standard energy practice. In: IDF.
8/14/2019 Thesis-Org Complete (1)
http://slidepdf.com/reader/full/thesis-org-complete-1 180/194
Odriozola-Serrano I, Bendicho-Porta S, Martín-Belloso O. 2006. Comparative study on
shelf life of whole milk processed by high-intensity pulsed electric field or heat
treatment. Journal Dairy Sci. 89: 905-911.
Olesen N, Jensen F. 1989. Microfiltration. The influence of operation parameters on the
process. Milchwissenschaft. 44 (8): 476-479.
Oliver SP, Jayarao BM, Almeida RA. 2005. Foodborne pathogens in milk and the dairy
farm environment: food safety and public health implications. Foodborne Pathog
Dis. 2: 115-129.
Ontario Ministry of Agriculture, Food and Rural Affairs (OMAFRA). 1990. Milk Act.
R.S.O. 1990. Chapter M. 12. [Accessed 2010 June 18]. Available from:
http://www.e-laws.gov.on.ca/html/statutes/english/elaws_statutes_90m12_e.htm
Ordoñez Pereda JA, Burgos González J, Raso Pueyo J, Lopez Buesa P, Cond'n Us'n

8/14/2019 Thesis-Org Complete (1)
http://slidepdf.com/reader/full/thesis-org-complete-1 181/194
Palmieri L, Cacae D. 2005. High intensity pulsed light technology. In: Sun D, editor.
Emerging technologies for food processing. San Diego, CA: Elsevier Academic
Press. p 279-306.
Palou E, López-Malo A. 2005. Growth/No-growth interface modeling and emerging
technologies. In: Barbosa-Cánovas GV, Tapia MS, Cano MP. Novel food
processing technologies. Boca Raton, FL: CRC Press. 629-651.
Payfylias I, Cheryan M, Mehaia MA, Saglam N. 1996. Microfiltration of milk with ceramic
membranes. Food Res Int. 29: 141-146.
Pedersen PJ. 1992. Microfiltration for the reduction of bacteria in milk and brine. In:
International Dairy Federation (IDF). New applications of membrane processes.
IDF special issue no. 9201. p 33-50.
Peleg M, Cole MB. 2000. Estimating the survival of Clostridium botulinum spores during
8/14/2019 Thesis-Org Complete (1)
http://slidepdf.com/reader/full/thesis-org-complete-1 182/194
Pereira RN, Vicente AA. 2010. Novel technologies for milk processing. In: Engineering
aspects of milk and dairy products. Boca Raton, FL, USA: CRC Press. p 155-
174.
Picart L, Dumay E, Cheftel JC. 2002. Inactivation of Listeria innocua in dairy fluids by
pulsed electric fields: influence of electric parameters and food composition.
Innovat Food Sci and Emerging Technol. 3: 357-369.
Pillai SD, Braby LA. 2007. Electronic pasteurization. In: Tewari G, Juneja VK, editors.
Advances in thermal and non-thermal food preservation. Ames: Blackwell
Publishing. p. 195-202.
Rajowkski KT, Calderone SM, Jones E. 1994. Effect of polyphosphate and sodium
chloride on the growth of Listeria monocytogenes and Staphylococcus aureus in
ultra-high temperature milk. J Dairy Sci. 77: 1503-1508.

8/14/2019 Thesis-Org Complete (1)
http://slidepdf.com/reader/full/thesis-org-complete-1 183/194
Reina LD, Jin ZT, Zhang QH, Yousef AE. 1998. Inactivation of Listeria monocytogenes
in milk by pulsed electric fields. J Food Protect. 61(9): 1203-1206.
Rodrigo D, Barbosa-Cánovas GV, Martínez A, Rodrigo M. 2003. Weibull distribution
function based on an empirical mathematical model for inactivation of
Escherichia coli by pulsed electric fields. J Food Protect. 66 (6): 1007-1012.
Rodrigo D, Martínez A, Harte F, Barbosa-Cánovas GV, Rodrigo M. 2001. Study of
inactivation of Lactobacillus plantarum in orange-carrot juice by means of pulsed
electric fields: comparison of inactivation kinetics models. J Food Protect. 64 (2):
259-263.
Rodrigo D, Zúñiga M, Rivas A, Martínez A. 2007. Adaptation potential of
microorganisms treated by pulsed electric fields. In: Lelieveld HLM, Notermans S,
de Haan SWH. Food preservation by pulsed electric fields: from research to

8/14/2019 Thesis-Org Complete (1)
http://slidepdf.com/reader/full/thesis-org-complete-1 184/194
Ross T, Dalgaard P. 2004. Secondary models. In: McKellar, R. C., Lu, X. Modeling
microbial responses in food (pp. 63-150). Boca Raton: CRC Press.
Rosso L, Lobry JR, Bajard S, Flandrois JP. 1995. Convenient model to describe the
combined effects of temperature and pH on microbial growth. Appl Env Microbiol.
61 (2): 610-616.
Rowe MT, Kirk R. 1999. An investigation into the phenomenon of cross-protection in
Escherichia coli O157:H7. Food Microbiol. 16: 157-164.
Ruhlman KT, Jin ZT, Zhang QH. 2001. Physical properties of liquid foods for pulsed
electric field treatment. In: Barbosa-Cánovas GV, Zhang QH. Pulsed electric
fields in food processing: fundamental aspects and applications. Lancaster:
Technomic Publishing Company, Inc. p 45-56.
Ryu J, Beuchat LR. 1998. Influence of acid tolerance responses on survival, growth,

8/14/2019 Thesis-Org Complete (1)
http://slidepdf.com/reader/full/thesis-org-complete-1 185/194
Sampedro F, Rodrigo M, Martinez A, Rodrigo D, Barbosa-Canovas GV. 2005. Quality
and safety aspects of PEF application in milk and milk products. Crit Rev Food
Sci Nutr. 45(1): 25-47.
Sauer A, Moraru CI. 2009. Inactivation of Escherichia coli ATCC 25922 and Escherichia
coli O157:H7 in apple juice and Apple Cider, Using Pulsed Light Treatment. J
Food Protect. 72 (5): 937-944.
Saulis G, Wouters PC. 2007. Probable mechanisms of microorganism inactivation by
pulsed electric fields. In: Lelieveld HLM, Notermans S, de Haan SWH. Food
preservation by pulsed electric fields: from research to application. Boca Raton,
FL: CRC Press. p 138-155.
Sepúlveda DR, Góngora-Nieto MM, Guerrero JA, Barbosa-Cánovas GV. 2005.
Production of extended-shelf life milk by processing pasteurized milk with pulsed
8/14/2019 Thesis-Org Complete (1)
http://slidepdf.com/reader/full/thesis-org-complete-1 186/194
Shapiro HM. 2003. Practical flow cytometry. 4th ed. New Jersey, NJ: John Wiley &
Sons. 681 p. Available from: http://www.coulterflow.com/bciflow/practical.php
Smiddy MA, Martin J, Huppertz T, Kelly AL. 2007. Microbial shelf-life of high-pressure-
homogenised milk. Int Dairy J. 17: 29-32.
Smith K, Mittal GS, Griffiths MW. 2002. Pasteurization of milk using pulsed electrical
field and antimicrobials. J Food Sci 67(6): 2304-2308.
Smith M. 2007. Regulatory acceptance. In: Lelieveld HLM, Notermans S, de Haan
SWH. Food preservation by pulsed electric fields: from research to application.
Boca Raton, FL: CRC Press. 352-357.
Sobrino-López A, Martín-Belloso O. 2008. Enhancing the lethal effect of high-intensity
pulsed electric field in milk by antimicrobial compounds as combined hurdles. J
Dairy Sci. 91: 1759-1768.

8/14/2019 Thesis-Org Complete (1)
http://slidepdf.com/reader/full/thesis-org-complete-1 187/194
Stephens PJ, Joyson JA, Davies KW, Holbrok R, Lappin-Scott HM, Humprey TJ. 1997.
The use of an automated growth analyser to measure recovery times of single
heat-injured Salmonella cells. J Applied Microbiol. 83: 445-455.
Suhren G, Reichmuth J, Heeschen W. 1990. Bactoscan technique. In: International
Dairy Federation (FIL-IDF). Methods for assessing the bacteriological quality of
raw milk from the farm. Bulletin No. 256. FIL-IDF: Brussels, Belgium. 24-30.
Sumnu G, Sahin S. 2005. Recent developments in microwave heating. In: Emerging
technologies for food processing. San Diego, CA: Elsevier Academic Press. 419-
444.
Sun D. 2005. Emerging technologies for food processing. San Diego, CA, USA: Elsevier
Academic Press. 771.
Swarts AJ, Hastings JW, Roberts RF, von Holy A. 1998. Flow cytometry demonstrates

8/14/2019 Thesis-Org Complete (1)
http://slidepdf.com/reader/full/thesis-org-complete-1 188/194
Tewari G, Juneja VK. 2007. Advances in thermal and non-thermal food preservation.
Blackwell Publishing: Ames, IA, USA. 281 p.
Tewari G. 2007. Microwave and radio-frequency heating. In: Tewari G, Juneja VK,
editors. Advances in thermal and non-thermal food preservation. Ames, IA:
Blackwell Publishing. 91-98.
Todar K. 2008. Todar’s online textbook of bacteriology. University of Wisconsin-
Madison Department of Bacteriology. [Accessed 2010 May 15]. Available at:
http://www.textbookofbacteriology.net/
Toepfl S, Heinz V, Knorr D. 2007. High intensity pulsed electric fields applied for food
preservation. Chem Eng Process. 46: 537-546.
Toepfl S, Mathys A, Heinz V, Knorr D. 2006. Review: potential of high hydrostatic
pressure and pulsed electric fields for energy efficient and environmentally

8/14/2019 Thesis-Org Complete (1)
http://slidepdf.com/reader/full/thesis-org-complete-1 189/194
Ulmer HM, Heinz V, Gänzle MG, Knorr D, Vogel RF. 2002. Effects of pulsed electric
fields on inactivation and metabolic activity of Lactobacillus plantarum in model
beer. J Appl Microbiol. 93: 326-335.
Unal R, Yousef AE, Dunne CP. 2002. Spectrofluorimetric assessment of bacterial cell
membrane damage by pulsed electric field. Innov Food Sci Emerg. Technol. 3:
247-254.
United States Department of Agriculture (USDA). 2010. Processing intervention
technologies for enhancing the safety and security of fluid foods and beverages.
Food Safety and Intervention Technologies Unit Research Project. [Accessed
2010 June 18] Available from:
http://www.ars.usda.gov/research/projects/projects.htm?ACCN_NO=410488
Valdramidis VP, Geeraerd AH, Van Impe JF. 2007. Stress-adapatative responses by
8/14/2019 Thesis-Org Complete (1)
http://slidepdf.com/reader/full/thesis-org-complete-1 190/194
preservation by pulsed electric fields: from research to application. Boca Raton,
FL: CRC Press. p 70-93.
Vasavada PC. 1988. Pathogenic bacteria in milk - a review. J Dairy Science. 71, 2809-
2816.
Vicente A, Castro IA. 2007. Novel thermal processing technologies. In: Advances in
thermal and non-thermal food preservation. Ames, IA: Blackwell Publishing. 99-
130.
Villar A, García JA, Iglesias L, García ML, Otero A. 1996. Application of principal
component analysis to the study of microbial populations in refrigerated raw milk
from farms. Int Dairy J. 6: 937-945.
Visvanathan C, Ben Aim R. 1989. Application of an electric field for the reduction of
particle and colloidal membrane fouling in crossflow microfiltration. Sep Sci

8/14/2019 Thesis-Org Complete (1)
http://slidepdf.com/reader/full/thesis-org-complete-1 191/194
electric fields and microfiltration, and conventional thermal pasteurisation in skim
milk. Int Food Microbiol (in press). DOI:10.1016/j.ijfoodmicro.2010.10.023.
Walkling-Ribeiro M. 2008. The impact of high voltage pulsed electric fields in hurdle
strategies on preservation and selected quality parameters of minimally
processed non-alcoholic beverages. DPhil thesis. Dublin: UCD Dublin. 210 p.
Walstra P, Wouters JTM, Geurts TJ. 2006. Dairy science and technology. Second
edition. Boca Raton: CRC Press. 782 p.
Wang Y, Hammes F, Düggelin M, Egli T. 2008. Influence of size, shape, and flexibility
on bacterial passage through micropore membrane filters. Environ Sci Technol.
42: 6749-6754.
Wardrop Engineering 1997. Guide to energy efficiency opportunities in the dairy
industry processing industry. Natural Resources Canada. Ottawa, Canada.
8/14/2019 Thesis-Org Complete (1)
http://slidepdf.com/reader/full/thesis-org-complete-1 192/194
Wouters PC, Bos AP, Ueckert J. 2001. Membrane permeabilization in relation to
inactivation kinetics of Lactobacillus species due to pulsed electric fields. Appl
Env Microbiol. 67 (7): 3092-3101.
Wu VCH, Fung DYC. 2001. Evaluation of thin agar layer method for recovery of heat-
injured foodborne pathogens. J Food Sci. 66 (4): 580-583.
Yamaguchi N, Sasada M, Yamanaka M, Nasu M. 2003. Rapid detection of respiring
Escherichia coli O157:H7 in apple juice, milk, and ground beef by flow cytometry.
Cytometry. 54A: 27-35.
Yousef AE, Courtney PD. 2003. Basics of stress adaptation and implications in new-
generation foods. In: Yousef AE, Juneja VK, editors. Microbial stress adaptation
and food safety. Boca Raton, FL: CRC Press. 105-158.
Zárate V, Belda F, Pérez C, Cardell E. 1997. Changes in the microbial flora of Tenerife

8/14/2019 Thesis-Org Complete (1)
http://slidepdf.com/reader/full/thesis-org-complete-1 193/194
7. Annex A1. Relative scale of energy sources at the electromagnetic spectrum.
10-1510-1210-910-610-311031061091012

8/14/2019 Thesis-Org Complete (1)
http://slidepdf.com/reader/full/thesis-org-complete-1 194/194
" # $
mmm
109106103110-310-610-910-1210-15
Wavelength(m)
10010.1
Wavelength(%&)
700400
UVVisible
Light
NearInfrared
IntermediateInfrared
FarInfrared
Thermal
Radiation
Electro-
magnetic
spectrum
HertzianWaves
RadioWaves
ElectricPower
XRays
GammaRays
10-18
CosmicRays
600
10
Frequency(()*+ ,-")
110310610910121015101810211024
500
Micro-wave
%m kmÅ nm
Thermal
Radiation
Energy(./)