thesis fc gielens - flux characterisation and application of h2 … · flux characterisation and...
TRANSCRIPT

Flux characterisation and application of H2-selective thinPd membranesGielens, F.C.
Published: 13/01/2016
Document VersionPublisher’s PDF, also known as Version of Record (includes final page, issue and volume numbers)
Please check the document version of this publication:
• A submitted manuscript is the author's version of the article upon submission and before peer-review. There can be important differencesbetween the submitted version and the official published version of record. People interested in the research are advised to contact theauthor for the final version of the publication, or visit the DOI to the publisher's website.• The final author version and the galley proof are versions of the publication after peer review.• The final published version features the final layout of the paper including the volume, issue and page numbers.
Link to publication
Citation for published version (APA):Gielens, F. C. (2016). Flux characterisation and application of H2-selective thin Pd membranes Eindhoven:Technische Universiteit Eindhoven
General rightsCopyright and moral rights for the publications made accessible in the public portal are retained by the authors and/or other copyright ownersand it is a condition of accessing publications that users recognise and abide by the legal requirements associated with these rights.
• Users may download and print one copy of any publication from the public portal for the purpose of private study or research. • You may not further distribute the material or use it for any profit-making activity or commercial gain • You may freely distribute the URL identifying the publication in the public portal ?
Take down policyIf you believe that this document breaches copyright please contact us providing details, and we will remove access to the work immediatelyand investigate your claim.
Download date: 01. Jun. 2018

Flux characterisation and application of H2-selective thin Pd membranes
PROEFSCHRIFT
ter verkrijging van de graad van doctor aan de Technische Universiteit Eindhoven, op gezag van de rector magnificus prof.dr.ir. F.P.T. Baaijens, voor een commissie aangewezen door het College voor Promoties, in het
openbaar te verdedigen op woensdag 13 januari 2016 om 16:00 uur
door
Franciscus Christophorus Gielens
geboren te Zaandam
Dit proefschrift is goedgekeurd door de promotoren en de samenstelling van de promotiecommissie is als volgt: voorzitter: prof.dr.ir. R.A.J. Janssen 1e promotor: prof.dr.ir. J.T.F. Keurentjes 2e promotor: prof.dr. J. Meuldijk copromotor(en): ir. M.A.G. Vorstman leden: prof.dr.ir. J.C. Schouten prof.dr.ir. A. van der Padt (WUR) prof.dr. C.J.M. van Rijn (WUR) dr.ir. T.A. Peters (SINTEF Materials and Chemistry)
Het onderzoek of ontwerp dat in dit proefschrift wordt beschreven is uitgevoerd in overeenstemming met de TU/e Gedragscode Wetenschapsbeoefening.

Flux characterisation and application of H2-selective thin Pd membranes

Flux characterisation and application of H2-selective thin Pd membranes By F.C. Gielens Technische Universiteit Eindhoven, 2015. A catalogue record is available from the Eindhoven University of Technology Library ISBN: 978-90-386-3990-1 Cover design by M.B. Castro Printed by Gildeprint Drukkerijen – The Netherlands The work described in this thesis is supported by: STW, DSM, ABB Lummus Global and Aquamarijn

i
TABLE OF CONTENTS
Chapter 1
Introduction to hydrogen-selective palladium membranes and their application in industry ... 1
1.1 General introduction ..................................................................................................... 2
1.2 Hydrogen removal strategies to improve the conversion .............................................. 3
1.3 Hydrogen-selective membranes ................................................................................... 5
1.4 Hydrogen transport through Pd membranes ................................................................ 8
1.5 Outline of the thesis ....................................................................................................10
References .................................................................................................................12
Chapter 2
Microsystem technology for high-flux hydrogen separation membranes .............................. 17
2.1 Introduction .................................................................................................................18
2.2 Experimental ...............................................................................................................19
2.2.1 Manufacturing of free hanging membranes ..........................................................19
2.2.2 Manufacturing of microsieve-supported membranes ............................................22
2.2.3 Metal film deposition ............................................................................................24
2.2.4 Module fabrication ...............................................................................................24
2.2.5 Characterization of membranes ...........................................................................26
2.3 Results and Discussion ...............................................................................................28
2.3.1 Membrane layer characteristics ...........................................................................28
2.3.2 Permeation Characteristics ..................................................................................29
2.3.3 Comparison to literature .......................................................................................36
2.4 Conclusions ................................................................................................................37
References .................................................................................................................39
Chapter 3
Measurement and modelLing of hydrogen transport through high-flux Pd membranes ...... 43
3.1 Introduction .................................................................................................................44
3.2 Experimental ...............................................................................................................45
3.2.1 Membrane preparation and packaging .................................................................45
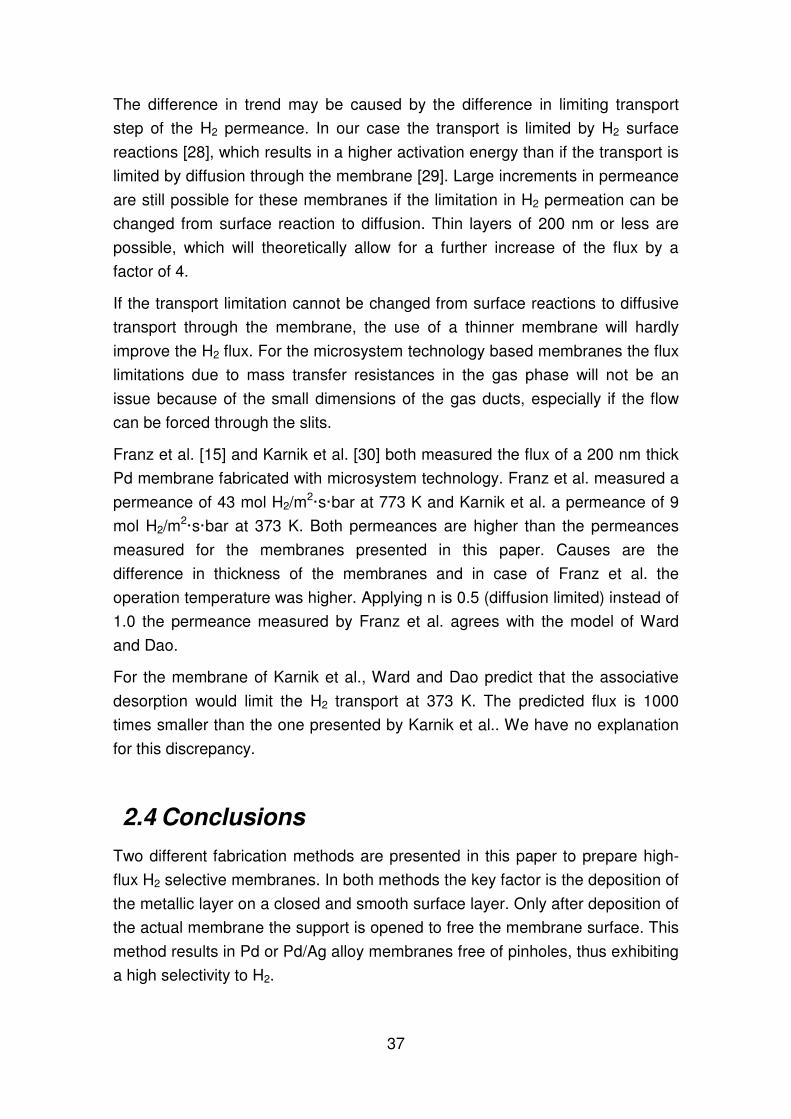
3.2.2 Membrane permeation .........................................................................................46
ii
3.2.3 Model description .................................................................................................48
3.3 Results and discussion ...............................................................................................51
3.3.1 Effect of steam activation on the H2 permeance ...................................................51
3.3.2 Modelling of the H2 permeance ............................................................................59
3.3.3 Selectivity and stability of the membrane .............................................................64
3.4 Conclusions ................................................................................................................67
References .................................................................................................................69
3.5 Appendix .....................................................................................................................71
Chapter 4
Influence of steam and carbon dioxide on the hydrogen flux through thin Pd/Ag and Pd
membranes ............................................................................................................................. 73
4.1 Introduction .................................................................................................................74
4.2 Theoretical background and previous work .................................................................75
4.3 Experimental ...............................................................................................................77
4.3.1 Membrane and module description ......................................................................77
4.3.2 Membrane permeation .........................................................................................78
4.3.3 Changes in feed composition caused by reactions ..............................................83
4.4 Results and discussion ...............................................................................................84
4.4.1 Feed composition change induced by the Water Gas Shift reaction .....................84
4.4.2 Steam influence on the H2 permeation .................................................................86
4.4.3 CO2 influence on the H2 permeation ....................................................................88
4.4.4 Comparison of the influence of H2O and CO2 on the H2 flux .................................93
4.4.5 Comparison to literature .......................................................................................94
4.5 Conclusions ................................................................................................................96
References .................................................................................................................97
Chapter 5
Influence of methane, propane and carbon monoxide on the hydrogen flux through thin
Pd membranes ..................................................................................................................... 101
5.1 Introduction ............................................................................................................... 102
5.2 Experimental ............................................................................................................. 102
5.2.1 Membrane and module description .................................................................... 102
5.2.2 Membrane permeation ....................................................................................... 103
5.3 Results and discussion ............................................................................................. 107
5.3.1 Methane and propane influence on H2 permeation ............................................ 107
5.3.2 Carbon monoxide influence on H2 permeation ................................................... 109
5.3.3 Selectivity .......................................................................................................... 112

iii
5.4 Comparison with literature ........................................................................................ 113
5.5 Conclusions .............................................................................................................. 115
References ............................................................................................................... 116
Chapter 6
Module design for a single wafer H2-selective high flux membrane by using
Computational Fluid Dynamics............................................................................................. 119
6.1 Introduction ............................................................................................................... 120
6.2 Model ........................................................................................................................ 120
6.3 Effect of wafer design on the mass transfer resistance of 2D membranes ................ 128
6.4 Design of 3D membranes ......................................................................................... 135
6.5 Conclusions .............................................................................................................. 139
References ............................................................................................................... 140
Chapter 7
Design of a H2-selective membrane module at macro scale and its application in a
propane dehydrogenation plant............................................................................................ 141
7.1 Introduction ............................................................................................................... 142
7.1.1 Aspen simulation – general ................................................................................ 142
7.1.2 Aspen simulation – reactor section .................................................................... 145
7.1.3 Aspen simulation – membrane section............................................................... 146
7.1.4 Aspen simulation – compressor section before purification section .................... 151
7.1.5 Aspen simulation – purification section .............................................................. 151
7.2 Process economics ................................................................................................... 153
7.2.1 Investment costs ................................................................................................ 153
7.2.2 Operating costs .................................................................................................. 155
7.2.3 Cash flow ........................................................................................................... 155
7.3 Conclusions .............................................................................................................. 157
References ............................................................................................................... 158
Chapter 8
Future Perspectives .............................................................................................................. 159
8.1 Introduction ............................................................................................................... 159
8.2 Membrane Stability – pinhole formation .................................................................... 159
8.3 Membrane Contamination ......................................................................................... 161
8.3.1 Reforming of alcohols ........................................................................................ 161

iv
8.3.2 Dehydrogenation of alkanes .............................................................................. 162
8.3.3 Reforming of methane ....................................................................................... 163
8.3.4 Water Gas Shift reaction .................................................................................... 164
8.4 Future work ............................................................................................................... 165
References .......................................................................................................................... 166
Summary ............................................................................................................................... 169
Dankwoord ............................................................................................................................ 173
Curriculum vitae .................................................................................................................... 175

1
1 INTRODUCTION TO HYDROGEN-SELECTIVE
PALLADIUM MEMBRANES AND THEIR APPLICATION IN INDUSTRY
Abstract
In this chapter the potential of hydrogen-selective membranes in different types of
industrial processes is introduced. A short introduction is given on how H2-selective
high-flux membranes can be manufactured and how the cost of these types of
membranes can be reduced by decreasing the thickness of the costly palladium
layer. A general introduction of the transport of H2 through dense metallic
membranes is given. Furthermore the objectives and the outline of this thesis are
presented.
2
1.1 General introduction
The single pass conversion of many commercially important chemical processes is
limited by thermodynamics. The limited conversion makes purification of the product
and recycling of the valuable feed necessary. The recycling of reagents increases
the process flow rates and therefore the operating and investment costs. A
favourable situation would be to shift the chemical equilibrium to the desired product.
One possible strategy to shift the chemical equilibrium in the product direction is to
remove one of the products from the reaction zone. The product purity will be higher
and the amount of the recycled feed will decrease. In processes where hydrogen is a
reaction product, this strategy can be realised by introducing a hydrogen-selective
membrane in the process.
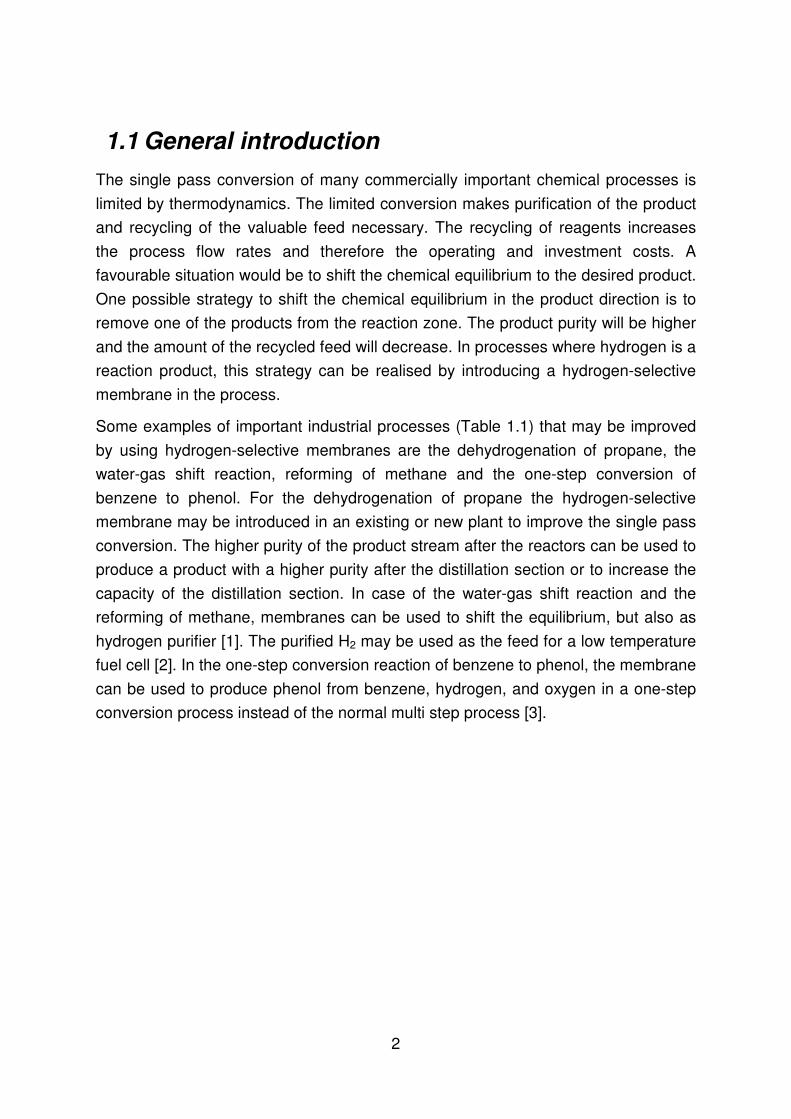
Some examples of important industrial processes (Table 1.1) that may be improved
by using hydrogen-selective membranes are the dehydrogenation of propane, the
water-gas shift reaction, reforming of methane and the one-step conversion of
benzene to phenol. For the dehydrogenation of propane the hydrogen-selective
membrane may be introduced in an existing or new plant to improve the single pass
conversion. The higher purity of the product stream after the reactors can be used to
produce a product with a higher purity after the distillation section or to increase the
capacity of the distillation section. In case of the water-gas shift reaction and the
reforming of methane, membranes can be used to shift the equilibrium, but also as
hydrogen purifier [1]. The purified H2 may be used as the feed for a low temperature
fuel cell [2]. In the one-step conversion reaction of benzene to phenol, the membrane
can be used to produce phenol from benzene, hydrogen, and oxygen in a one-step
conversion process instead of the normal multi step process [3].

3
Table 1.1 - Examples of important industrial reactions in which hydrogen is produced.
Dehydrogenation reactions [4-8] i.e. dehydrogenation of propane C3H8 ⇌ C3H6 + H2
Water-gas shift reaction[9] CO2 + H2 ⇌ CO + H2O
Reforming of methane[10-14] CH4 + 2 H2O ⇌ CO2 + 4 H2
CH4 + CO2 ⇌ 2 CO + 2 H2
2 CH4 + O2 ⇌ 2 CO + 4 H2
One-step conversion of benzene to phenol [3] H2 + O2 + 2 → 2
1.2 Hydrogen removal strategies to improve the conversion
Several reactor/membrane configurations are interesting to remove the hydrogen
from the reaction zone. Some of the possible configurations are shown in Figure 1.1.
In option I and II the membrane is installed as a separate unit, in option III, IV, and V
the membrane and reactor are combined into one single process unit. Option V is a
special case in which the membrane operates simultaneously as a membrane and
catalyst for the reaction; this is a true membrane reactor. A good example of the
membrane reactor is the one-step conversion of benzene to phenol by using a
hydrogen-selective palladium (Pd) membrane [3]. The H2 is fed separately of the
benzene and oxygen to the membrane reactor. The H2 will diffuse through the
membrane and at the other membrane side the H-atoms will activate the oxygen.
The activated hydrogen and oxygen reacts with the benzene to produce phenol in a
single step.
The advantages and disadvantages of the presented configurations will not be
discussed here, more detailed information can be found in several publications [6-
8,15-18]. In Chapter 7, configuration I will be used to investigate the implementation
of a hydrogen-selective membrane in a propylene plant to increase the production
capacity.

4
R-1 R-2 R-3
S-1 S-2
R-4
S-3
H2
A+BA
A+B
A+B+H2
A A+B+H2
H2 H2
A+B
A+B+H2
A+B
A+B+H2
A A+B+H2
H2 H2
H2 H2
H2
H2
H2
H2
A+B+H2
H2
H2
A
H2
H2
C+D
H2
H2
H2
H2
E
Wall Catalyst MembranePellets with
catalyst
I)
II)
III)
IV)
V)
Figure 1.1 - Options to apply a hydrogen separation membrane in a chemical process.

5
1.3 Hydrogen-selective membranes
Different types of H2 selective membranes have been developed in the past: polymer
membranes, ceramic membranes, thin sheets or thin-walled tubes of Pd, composite
membranes of Pd on a support material such as alumina or steel. However, not all
these membranes fulfil the criteria to be applied in the previously mentioned
reactions. This includes criteria such as a good resistance to high temperatures (>
400 °C), the presence of steam, alkanes and alkenes, high selectivity to H2, and a
high value of the ratio H2-flux/membrane costs.
In Table 1.2 the values of the H2 permeance and selectivity of some of the existing
membrane types are shown. From Table 1.2, it can be concluded that most of the
membranes do not fulfil all of the above criteria. The membranes based on polymers
or rubbers are not resistant to temperatures above 300°C and the selectivity is rather
low. The ceramic membranes are resistant to very high temperatures but the
selectivity is far too low, typically less than 20 (H2/N2). It has been attempted to
improve the selectivity of the ceramic membranes by impregnating the ceramic
membrane with Pd. However, the selectivity (H2/N2) is still rather low (11).
The selectivity and thermal stability of thin Pd sheets or thin-walled Pd tubes is
excellent, but the H2 fluxes are relatively low. For a thin Pd sheet membrane of 50
µm thick, a membrane area of at least 3000 m2 is necessary to remove 50% of the
hydrogen in the reactor effluent of a 300 kton/yr propane dehydrogenation plant
(Figure 1.2). The costs of the needed Pd alone would already be 14 M€. A reduction
in Pd cost has been obtained by deposition of thin Pd layers (0.2 to 10 µm) on a
porous support layer, e.g. alumina or sintered steel.
The decrease in thickness reduces the amount of membrane material and increases
the flux. As a consequence the reduction in Pd costs is quadratic. The pore size
distribution of the support is critical, because the Pd layers must be about 3 times
thicker than the largest pore diameter [19]. Therefore, composite membranes have
the tendency to have a low selectivity due to the formation of pinholes during
membrane production. Several types of supports and Pd deposition methods
(sputtering, electroless plating, repair steps) have been used, but it seems that pin-
hole free membranes thinner than 1.0 micron are very difficult to obtain or that the
transport resistance over the porous support becomes too large.
A novel method is to deposit the Pd membrane or Pd alloy, e.g. Pd/Ag or Pd/Cu, on
top of a closed support material. After the deposition step, the support is partly
removed by microsystem technology to make the membrane free at both sides [20].

6
This method results in a very thin high-flux Pd membrane of 1.0 µm thick (or even
submicron) with an excellent hydrogen flux and selectivity as will be shown in
chapters 2 and 3.
0.01
0.1
1
10
100
1000
10000
100000
0.1 1 10 100
membrane thickness (micron)
Pd
co
st
(ke
uro
)
Figure 1.2 - Estimated Pd material costs necessary for a dehydrogenation plant at a Pd price of 6772 €/kg (obtained from Kitco [21]).

7
Table 1.2 - Membrane fluxes and selectivities of various hydrogen-selective membrane types.
Membrane material Membrane thickness
Operating temperature
Permeance Selectivity H2 versus N2
Reference
(-) (µµµµm) (K) (mol H2/m2·s·bar) (-) (-)
Polysulfone 35 298 9.4⋅10-6 100* [22] poly(dimethyl siloxane) rubber 1500 298 1.3⋅10-5 3* [22] composite polysufone/poly(dimethyl siloxane) 300 298 9.9⋅10-4 70 [22] poly[bis-(3,5-di-tert-butylphenoxy)1.2 (chloro)0.8phosphazene] PDTBP 115 303 2.2⋅10-5 30* [23] poly[5-methyl-2-hexyne] P5M2H 50 308 3.0⋅10-4 8 [24] Silica - 773 1.1⋅10-1 18.8 [4] silica impregnated with Pd 100 673 2.6⋅10-3 10.9 [25] alumina – titania support 5 1073 8.5⋅10-5 7 [26] Pd (electroless plating) – alumina support 10.3 740 2.8⋅10-1 1000 [27] Pd (Metallorganic CVD) – alumina support 1.5 573 2.0⋅10-2 200 [28] Pd – vycor glass 4.5 673 1.6⋅10-1 N.D.** [29] Pd – Steel 13 723 5.7⋅10-2 - [30] Pd – alumina modified porous Hastelloy 7.5 823 3.3⋅10-1 N.D.** [31] Pd – porous stainless steel with yttria stabilized zirconia (YSZ) 1.3 673 7.4⋅10-1 1740 [32] Pd/Ag alloy (75/25 wt.%, sputtered) – alumina support 0.4 573 1.5⋅10-2 80 [28] Pd/Ag alloy (77/23 wt.%, electroless plating) – alumina support 5.8 714 2.6⋅10-2 N.D.** [29] Pd/Ag alloy (77/23 wt.%, sputtered) – self supporting 1.5 573 1.6 - [33] Pd/Cu alloy (81/19 wt.%) – alumina support 11.6 723 5.6⋅10-2 105* [34] Pd/Cu alloy (electroless plating) – alumina support 0.16 623 6.0⋅10-1 710 [35] Pd/Ni alloy (82/18 wt.%) – steel support 2 723 7.2⋅10-1 3000 [36] Pd/Au alloy (95/05 wt.%, sputtered) – self supporting 2 673 1.8 - [37] Pd-Au (sputtered) – alumina modified porous nickel 4 µm/50nm 673 1.1⋅10-1 336*** [38] Pd-Ta-Pd (sputtered) – self supporting 1-13-1 638 2.1⋅10-1 - [39] Pd (sputtered) – self supporting 0.5 723 6.4 200**** [40]
* ideal selectivity ** N2 has not been detected in the permeate *** H2/He selectivity ****estimated from the value of the H2/He selectivity

8
1.4 Hydrogen transport through Pd membranes
Palladium and its alloys are applied for hydrogen separation because of their
high selectivity to hydrogen. No other molecule can pass through a pinhole-free
Pd surface. This is due to the transport mechanism of hydrogen through a Pd
(alloy) layer.
The transport of H2 through a Pd (alloy) layer can be described by 7 steps
(Figure 1.3). The seven steps include the transport to and from the membrane
in the gas phase, the dissociative adsorption and associative desorption,
entrance of the H-atom from the surface into the Pd bulk and backwards, and
the diffusion of the H-atom through the metal layer.
H2Other
molecule
H2
Pd- layer
Membrane
Gas mixture
Pure H2
H2Other
molecule
H2
Pd- layer
Membrane
Gas mixture
Pure H2
1. Bulk gas to Pd surface transport of H2
2. Dissociative adsorption on the Pd surface3. Surface to bulk metal transition4. Interstitial diffusion of H atoms
5. Bulk metal to surface transition6. Recombinative desorption
7. Pd surface to bulk gas transport of H2
Mechanism
1. Bulk gas to Pd surface transport of H2
2. Dissociative adsorption on the Pd surface3. Surface to bulk metal transition4. Interstitial diffusion of H atoms
5. Bulk metal to surface transition6. Recombinative desorption
7. Pd surface to bulk gas transport of H2
Mechanism
Figure 1.3 - The transport steps of H2 permeation through Pd.
Each transport step can limit the H2 flux, depending on the operating conditions
and the thickness of the membrane layer. Several models have been reported
in the literature to describe the transport steps 2 to 6. Ward and Dao [41]
combined these models into one H2 transport model for Pd membranes. With
the constructed model, Ward and Dao have been able to estimate the H2
permeance of pure Pd membranes quite well for a broad range of conditions. In
Figure 1.4 the calculated permeances for three different membrane thicknesses
are given as function of the temperature. As can be seen from Figure 1.4, two
transport steps limit the flux in the calculated temperature range. At low
temperatures the desorption limits the H2 flux and therefore the H2 permeance
is independent of the membrane thickness. At high temperatures the bulk
diffusion of hydrogen through the Pd layer limits the H2 flux and therefore the
flux is inversely proportional to the membrane thickness. A transition zone
exists between the surface reaction limited and diffusion limited zones.

9
1,00 1,25 1,50 1,75100
101
102
surface reaction limitedDiffusion limited
10X
2X
1X
Per
mea
nce
(mol
H2 /
m2 ·
s ·
bar
0.5 )
Reciprocal Temperature (1000/K)
simulation Pd 1000 nm simulation Pd 500 nm simulation Pd 100 nm
900 750 600 T(K)
Figure 1.4 - Calculated H2 permeances as function of temperature for three Pd membranes with a thickness of 0.1, 0.5, and 1.0 micron, respectively.
The effect of contamination of the Pd surface is not described by the model of
Ward and Dao. It is expected that the presence of contamination reduces the
number of active sites at the Pd surface to dissociate or recombine H2. The
contamination at the retentate or permeate side will therefore limit the flux by
decreasing the dissociative adsorption or the recombinative desorption rate,
respectively. The effect of contamination on the flux is often described by the
following simple equation (extended Sievert’s law):
)()(222
n
permH
n
retHH PPTPJ −⋅= (1)
in which JH2 is the H2 flux, P(T) the permeance, and PH2 ret and PH2 perm are the
H2 partial pressure at the retentate and permeate side, respectively. The value
of the exponent n depends on the transport step that limits the hydrogen flux
(possibly caused by contamination), see Table 1.3. This model is able to
describe accurately a series of experiments and to investigate which transport
step limits the flux, but it cannot predict the effect of contaminants beforehand.
In this thesis, equation 1 is used to investigate which transport step limits the
flux during the experiments.
In order to determine the effect of contaminations, the effects of adding steam,
CO, CO2, methane and propane on the H2 permeation have been
experimentally investigated, for which the results are given in Chapters 4 and 5.

10
Table 1.3 - Values of the exponent n in equation 1 in case the flux is limited by one of the transport steps.
Value of n Possible step that limits the flux
n = 1
• Dissociative adsorption (contamination at the retentate side can be the cause)
• H2 transport in the gas phase at the retentate or the permeate side
n = 0.5 • Diffusion through the Pd layer
n = 0 • Recombinative desorption (contamination at the
permeate side can be the cause)
1.5 Outline of the thesis
In this thesis the use of hydrogen-selective Pd, Pd alloy and Pd-Ta-Pd
sandwiched membranes are explored for future application in processes like
the reforming of methane, the water-gas shift reaction and the dehydrogenation
of propane. The main focus of the research is the characterisation and
application of sub-micron thick high-flux H2-selective membranes produced by
microsystem technology. First, several types of membranes fabricated with
microsystem technology are characterised by measuring their H2 flux and
selectivity. Secondly, the influence of steam, CO, CO2, CH4 and propane on the
H2 permeation is determined. Finally, the feasibility of applying these
membranes in an industrial process is explored.
In Chapter 2 three membranes types are introduced: the pure Pd membrane,
the Pd/Ag alloy membrane, and the Pd coated Tantalum membrane. The
prepared membranes are characterized by measuring the H2 and He flux as a
function of temperature (623-723 K) and feed composition (0<pH2<0.83 bar)
and the limiting step of the hydrogen permeation is determined by Equation 1.
In Chapter 3 a new activation procedure to remove contaminants from the
membrane surface is presented. Besides the H2 activation step, the membrane
is activated with H2 and steam. In addition, a novel membrane module is
developed that can be used in a larger temperature range than the previous
module, due to the removal of pyro-glass as the holder material. Permeation
experiments were carried out with the old and novel module, with and without
steam-H2 activation. The H2 feed partial pressure is varied from 0 to 1 bar, and
the temperature is varied from 623 to 873 K. Moreover, a hydrogen permeation

11
model of the module is developed to estimate the hydrogen driving force at
several positions in the module. With the results of this model and the
permeation results, the limiting step of the hydrogen permeation is determined
for the membranes studied.
In Chapter 4 the influence of adding steam or CO2 to the membrane feed has
been studied for Pd and Pd/Ag membranes. The influence has been studied at
a CO2 or H2O fraction of 20 vol.% and at temperatures of 623, 673, and 723 K,
respectively.
In Chapter 5 the influence of adding CO or CH4 to the membrane is measured
for a Pd membrane. The measurements are carried out at 7.5 and 20 vol.%, CO
or CH4 fraction respectively, and temperatures of 623 and 723 K. The influence
of CO is compared to the influence of CO2 found in Chapter 4.
In Chapter 6 different designs for a membrane module are investigated by
simulation to optimize the membrane and module performance by reducing the
effect of concentration polarization. The investigations are carried out by using
computational fluid dynamics (CFD). From the calculated results several design
rules are defined.
In Chapter 7 the introduction of the developed membrane in an industrial
process is evaluated in more detail. A concept of an industrial membrane
module for the developed membranes is presented including an economic
evaluation of the membrane module in the dehydrogenation of propane to
propene.
In Chapter 8 the findings of recent research on H2 selective membranes is
discussed in relation to the main issues identified in this research work.
The outline of this thesis is such that each chapter is autonomous and can be
read independently from the other chapters. Consequently, some information is
repeated in different chapters.

12
References
1) REB Research & Consulting, Hydrogen Purifiers, Membrane Reactors
and Hydrogen Separations Consulting, http://www.rebresearch.com/, 2004.
2) Y.-M. Lin and M.-H. Rei, Process development for generating high purity
hydrogen by using supported palladium membrane reactor as steam reformer,
Int. J. Hydrogen Energy, 25 (2000) 211.
3) S.-I. Niwa, M. Eswaramoorthy, J. Nair, A. Raj, N. Itoh, H. Shoji, T.
Namba, and F. Mizukami, A one-step conversion of benzene to phenol with a
palladium membrane, Science, 295 (2002) 105.
4) J.P. Collins, R.W. Schwartz, R. Sehgal, T.L. Ward, C.J. Brinker, G.P.
Hagen, and C.A. Udovich, Catalytic dehydrogenation of propane in hydrogen
permselective membrane reactors, Ind. Eng. Chem. Res., 35 (1996) 4398.
5) Y. Yildirim, E. Gobina, and R. Hughes, An experimental evaluation of
high-temperature composite membrane systems for propane dehydrogenation,
J. Membr. Sci., 135 (1997) 107.
6) R. Dittmeyer, V. Höllein, and K. Daub, Membrane reactors for
hydrogenation and dehydrogenation processes based on supported palladium,
J. Mol. Cat. A, 173 (2001) 135.
7) P. Quicker, V. Höllein, and R. Dittmeyer, Catalytic dehydrogenation of
hydrocarbons in palladium composite membrane reactors, Catal. Today, 56
(2000) 21.
8) E. Kikuchi, Membrane reactor application to hydrogen production, Catal.
Today, 56 (2000) 97.
9) E. Kikuchi, S. Uemiya, N. Sato, H. Inoue, H. Ando, and T. Matsuda,
Membrane reactor using microporous glass-supported thin film of palladium.
Application to the water-gas shift reaction, Chem. Lett., 3 (1989) 489.

13
10) E. Kikuchi, Y. Nemoto, M. Kajiwara, S. Uemiya, and T. Kojima, Steam
reforming of methane in membrane reactors: comparison of electroless-plating
and CVD membranes and catalyst packing modes, Catal. Today, 56 (2000) 75.
11) T.M. Raybold and M.C. Huff, Analyzing Enhancement of CO2 Reforming
of CH4 in Pd Membrane Reactors, AIChE Journal, 48 (2002) 1051.
12) E.P.J. Mallens, A reaction path analysis of the catalytic partial oxidation
of methane by transient experiments, Technische Universiteit Eindhoven, ISBN
90-386-0118-2, 1996.
13) Personal communication with P.van Male, Eindhoven University of
Technology, 2004.
14) S. Uemiya, N. Sato, H. Ando, T. Matsuda, and E. Kikuchi, Steam
reforming of methane in a hydrogen-permeable membrane reactor, Appl. Catal.,
67 (1991) 223.
15) L.A. Bernstein and C.R.F. Lund, Membrane reactors for catalytic series
and series-parallel reactions, J. Membr. Sci., 77 (1993) 155.
16) A. Julbe, D. Farrusseng, and C. Guizard, Porous ceramic membranes for
catalytic reactors - overview and new ideas, J. Membr. Sci., 181 (2001) 3.
17) J. Shu, B.P.A. Grandjean, A. van Neste, and S. Kaliaguine, Catalyctic
palladium-based membrane reactors: A review, Can. J. Chem. Eng., 69 (1991)
1036.
18) J. Sanchez and T.T. Tsotsis, Current developments and future research
in catalytic membrane reactors, A.J. Burggraaf and L. Cot, Fundamentals of
inorganic membrane science and technology, Elsevier Science, ISBN 90-386-0-
444-81877,1996, pp. 529-568.
19) Y.H. Ma, I.P. Mardilovich, and P.P. Mardilovich, Effect of the porosity and
pore size distribution of the porous stainless on the thickness and hydrogen flux
of palladium membranes, in: Proceedings of the Symposium - Membrane
Technology in Petroleum, Petroch, 2001, 154.

14
20) H.D. Tong, Microfabricated palladium-based membranes for hydrogen
separation, University of Twente, ISBN 90-365-2058-4,2004.
21) New York Spot Price Palladium, http://www.kitco.com/market/, 2004.
22) X. Feng, P. Shao, R.Y.M. Huang, G. Jiang, and R.-X. Xu, A study of
silicone rubber/polysulfone composite membranes: correlating H2/N2 and O2/N2
permselectivities, Sep. Pur. Tech., 27 (2002) 211.
23) C.J. Orme, J.R. Klaehn, and F.F. Stewart, Gas permeability and ideal
selectivity of poly[bis-(phenoxy)phosphazene], poly[bis-(4-tert-butylphenoxy)
phosphazene], and poly[bis-(3,5-di-tert-butylphenoxy)1.2(chloro)0.8phospha
zene], J. Membr. Sci., 238 (2004) 47.
24) I. Pinnau, Z. He, and A. Morisato, Synthesis and gas permeation
properties of poly(dialkylacetylenes) containing isopropyl-terminated side-
chains, J. Membr. Sci., 241 (2004) 363.
25) J.-H. So, S.-M. Yang, and S.B. Park, Preparation of silica–alumina
composite membranes for hydrogen separation by multi-step pore
modifications, J. Membr. Sci., 147 (1998) 147.
26) A.L. Ahmad, M.R. Othman, and H. Mukhtar, H2 separation from binary
gas mixture using coated alumina-titania membrane by sol-gel technique at
high-temperature region, Int. J. Hydrogen Energy, 29 (2004) 817.
27) A. Li, W. Liang, and R. Hughes, Fabrication of dense palladium
composite membranes for hydrogen separation, Catal. Today, 56 (2000) 45.
28) G. Xomeritakis and Y.S. Lin, Fabrication of thin metallic membranes by
MOCVD and sputtering, J. Membr. Sci., 133 (1997) 217.
29) S. Uemiya, T. Matsuda, and E. Kikuchi, Hydrogen permeable palladium-
silver alloy membrane supported on porous ceramics, J. Membr. Sci., 56 (1991)
315.
30) I.P. Mardilovich, E. Engwall, and Y.H. Ma, Dependence of hydrogen flux
on the pore size and plating surface topology of asymmetric Pd-porous
stainless steel membranes, Desalination, 144 (2002) 85.

15
31) S.-K. Ryi, N. Xu, A. Li, C.J. Lim, and J.R. Grace, Electroless Pd
membrane deposition on alumina modified Hastelloy substrate with EDTA-free
bath, Int. J. Hydrogen Energy, 35 (2010) 2328.
32) Ø. Hatlevik, S.K. Gade, M.K. Keeling, P.M. Thoen, A.P. Davidson, and
J.D. Way, Palladium and palladium alloy membranes for hydrogen separation
and production: History, fabrication strategies, and current performance, Sep.
Pur. Tech., 73 (2010) 59.
33) A. Ramachandran, W.M. Tucho, A. L. Mejdell, M. Stange, H.J. Venvik,
J.C. Walmsley, R. Holmestad, R. Bredesen, and A. Borg, Surface
characterization of Pd/Ag 23wt% membranes after different thermal treatments,
Appl. Surf. Sci., 256 (2010) 6121.
34) F. Roa, M.J. Block, and J. Douglas Way, The influence of alloy
composition on the H2 flux of composite Pd-Cu membranes, Desalination, 147
(2002) 411.
35) H. Lim and S.T. Oyama, Hydrogen selective thin palladium-copper
composite membranes on alumina supports, J. Membr. Sci., 378 (2011) 179.
36) S.E. Nam, S.H. Lee, and K.H. Lee, Preparation of a palladium alloy
composite membrane supported in a porous stainless steel by vacuum
electrodeposition, J. Membr. Sci., 153 (1999) 163.
37) T.A. Peters, T. Kaleta, M. Stange, and R. Bredesen, Development of thin
binary and ternary Pd-based alloy membranes for use in hydrogen production,
J. Membr. Sci., 383 (2011) 124.
38) S.-K. Ryi, J.-S. Park, K.-R. Hwang, C.-B. Lee, and S.-W. Lee, Module
configuration in CO2 capture using Pd-based composite membranes, Int. J.
Hydrogen Energy, 36 (2011) 13769.
39) N.M. Peachey, R.C. Snow, and R.C. Dye, Composite Pd/Ta metal
membranes for hydrogen separation, J. Membr. Sci., 111 (1996) 123.

16
40) F.C. Gielens, H.D. Tong, M.A.G. Vorstman, and J.T.F. Keurentjes,
Measurement and modeling of hydrogen transport through high-flux Pd
membranes, J. Membr. Sci., 289 (2007) 15.
41) T.L. Ward and T. Dao, Model of hydrogen permeation behavior in
palladium membranes, J. Membr. Sci., 153 (1999) 211.

17
2 MICROSYSTEM TECHNOLOGY FOR HIGH-
FLUX HYDROGEN SEPARATION MEMBRANES
Abstract
The application of thin hydrogen-selective membranes suffers from the
occurrence of pinholes and a significant resistance to mass transfer in the
porous support. To overcome these problems, Pd, Pd/Ag and Pd-Ta-Pd
membranes with a thickness between 0.5 and 1.2 µm have been deposited on a
dense and smooth surface of a silicon wafer. After membrane deposition the
underground has been etched to release the membrane surface for H2
permeation. Membranes have been prepared with a 1 µm thick microsieve as
the support or without support. The prepared membranes have been
characterized by the H2 and He flux as a function of temperature (623-723 K)
and feed composition (0< PH2<0.83 bar). The highest H2 flux, 3.6 mol H2/m2·s,
has been found with a microsieve-supported 1 µm thick Pd/Ag membrane at
723 K and 0.83 bar hydrogen partial pressure. The fluxes measured here are
approximately one order of magnitude higher than the fluxes reported in the
literature for Pd or Pd alloy membranes deposited on porous supports.
Moreover, helium could not be detected in the permeate, thus indicating the
absence of pinholes.
This chapter is based on: F.C. Gielens, H. D. Tong, C.J.M. van Rijn, M.A.G. Vorstman and J.T.F. Keurentjes, Microsystem technology for high-flux hydrogen separation membranes, J. Membr. Sci., 243 (2004) 203-213.

18
2.1 Introduction
Palladium (Pd) membranes are selective for hydrogen and have been used to
produce ultra-pure H2 [1]. In processes like dehydrogenations, steam reforming
of methane, or the water gas shift reaction, the application of H2 selective
membranes has also been studied [2, 3]. In these processes the membranes
are used [4] to improve the single pass conversion by removing H2 from the
reaction zone [5]. Alternatively, the process conditions can be set milder without
a loss in conversion, thus reducing the formation of by-products. The membrane
can also be used in hydrogenation reactions as inter-stage H2 feed to improve
the yield [6]. However, application of Pd membranes on a large scale is still
expensive, thus requiring a significant cost reduction [7]. Increasing the H2 flux
while maintaining a high selectivity will reduce the required membrane area and
therefore the membrane investment costs.
During the past decades, the H2 flux has already been increased significantly by
decreasing the membrane thickness from about one millimetre to micrometres
and even sub-micrometres [8]. However, the increase in flux by reducing the
membrane thickness has its limits, as sub-micron membranes do have a high
flux but poor mechanical strength. Additionally, mass transfer resistances in the
gas phase at the retentate side and in the porous support can become limiting
factors. Although the specific resistance in the support is relatively low as
compared to that of the membrane layer, the H2 flux can significantly be limited
due to the thickness of the support. Moreover, resistances can occur at the
interface between the Pd surface and the bulk where H atoms are entering or
leaving the bulk Pd, or at the interface of the gas phase and the membrane
surface where H2 dissociates at the feed side and H atoms have to associate at
the permeate side [9].
The reduction of the membrane thickness is not only limited by the mechanical
strength, but also by the formation of pinholes during fabrication. To prevent
pinhole formation it has been advised to prepare membranes with a thickness
equal to at least three times the diameter of the pores in the top layer of the
support [10]. Moreover, as it is well known that ceramic porous supports are
seldom defect free, this will also decrease the selectivity of the supported
membranes.

19
In this chapter microsystem technology has been used to increase the hydrogen
flux through Pd-based membranes and to prevent the formation of pinholes
during membrane fabrication. The fabrication and characterization of three
different membrane materials will be presented: pure Pd, Pd/Ag alloy, and Ta
coated by Pd, respectively. Each of these membranes has specific advantages
and disadvantages. Pd is a simple system to study, but undergoes an α-β
phase transition between room temperature and 573 K [11]. Pd/Ag has a higher
H2 permeability than pure Pd; the highest permeability for Pd/Ag at 673 K can
be obtained with an alloy composition of 77/23wt.% Pd/Ag [12]. The molar ratio
of Pd/Ag is equal to the weight based ratio.
A disadvantage of Pd/Ag membranes, however, is the decreased Pd content at
the surface, which can limit the H2 flux because of the poorer ability of Ag to
dissociate/associate H2 compared to Pd. A Pd coated membrane consists of a
material that is more permeable for H2 than Pd (and is preferably cheaper). This
material is coated at both sides with a thin Pd layer. In this study we use Ta as
the more permeable material [13]. The Pd coating is necessary to allow the
dissociation and association of H2 at the membrane surface and to prevent
oxidation of the Ta surface. The Pd coated Ta membrane is expected to have a
better permeance than a Pd/Ag or Pd membrane with the same thickness, but
only in a certain temperature range. At low temperatures the surface reaction
limits the permeation rate, so that there will be no advantage of the high
permeability. At too high temperatures, however, Ta will have a lower H2
permeability compared to Pd or Pd/Ag due to the negative temperature
dependency of the H2 permeability of Ta.
Membranes have been prepared with a 1 µm thick microsieve as a support [14]
or without such a support (‘free hanging’). The microsieve as a membrane
support has also been applied by Franz et al. [15].
2.2 Experimental
2.2.1 Manufacturing of free hanging membranes
For all membranes described in this paper a double-side polished silicon
substrate with crystallographic cut <110> served as the basis. These
substrates, called wafers, were 350 µm thick and 3 inch in diameter. A 1 µm
protective layer of wet-thermally oxidized SiO2 was deposited on both sides of
the wafer (Figure 2.1).

20
Si<110>Si<110>
After <111> direction finding, narrow slits are patternedon front side, followed by SiO2 etching in BHF
Release of Pd/Ag membrane by BHF ( remove SiO2 and Ti )
Wet etching through Si wafer until SiO2 film is exposed( Pd/Ag side is protected by special chuck )
KOH etching until 50 µm silicon left
Deposition of 1 µm Pd/Ag (through shadow mask)
Si <110> covered with 1 µm SiO2
<110> Si wafer double-side polished
Figure 2.1 - Schematic view of the followed steps to manufacture a free-hanging membrane.
After precise alignment to the <111> crystal direction, parallelogram-shaped
structures of 25 by 1250 µm were imprinted on one of the SiO2 layers by
standard photolithography. The SiO2 layer was removed at the imprints with
BHF dry etching. When the SiO2 protection layer was removed, apertures could
be etched with KOH inside the wafer. The wet etching was stopped after the

21
apertures reached a depth of 300 µm. A Si layer of 50 µm remained to give
sufficient mechanical strength for the next step.
Subsequently, the actual membrane, Pd or Pd/Ag alloy, was deposited by (co)-
sputtering through a shadow mask on the other side of the wafer, using titanium
(Ti) as an adhesion layer. It has to be noted that at this point in the procedure
the underground is still closed, which is a large advantage to prevent the
formation of pinholes compared to depositing metal layers on top of a porous
material as discussed in the introduction.
After deposition, the remaining 50 µm silicon is removed with KOH etching,
followed by releasing the membrane layer by etching the SiO2 and Ti layer with
BHF. In Figure 2.2a the top-view of the aperture side is given; the white part in
the middle of the aperture is the Pd (alloy) membrane. In Figure 2.2b, a SEM
micrograph is given of the cross section of the apertures.
b:Cross-section A-A
Membrane
25 µmAperture
350
µm
Waf
er t
hic
knes
s
Figure 2.2 - Two photographs of the free-hanging membrane: a. top view of the aperture side; b. SEM picture of the cross section perpendicular to the apertures.
a
1250 µm
A
A
Aperture287 µm
Membrane
25
µm

22
2.2.2 Manufacturing of microsieve-supported membranes
The manufacturing of the microsieve-supported membranes deviated in some
steps from that of the unsupported membrane (Figure 2.3). First, a 0.3 µm
protective layer of SiO2 was deposited on both sides of the wafer, followed by a
0.7 µm SixNy layer.
Deposition of 0.3 µm SiO2 and 0.7 µm SiN
KOH etching to create apertures
Open windows on back-side, Dry etching SiN
Remove Si completely by KOH, etch stop at SiO2
Co-sputtering of Pd/Ag membrane layer
SixNy
SiO2
Si
5 µm
SixNy
SiO2
Pd/Ag
5 µm
Selective removal of SiO2 and SiN with dry etching
<110> Si wafer double-side polished
Release of membrane by removal of SiO2 with BHF
Figure 2.3 - Schematic view of the followed steps to manufacture a microsieve-supported membrane.
Parallelogram-shaped structures of 350 by 2100 µm were imprinted on the
SixNy layer on one side by standard photolithography. The long side of the
parallelogram was aligned to the <111> direction of the Si-wafer. The SixNy was
removed at the imprints by dry etching (Reactive Ion Etching, RIE). After the
SiO2 protection layer was removed, apertures could be etched with a KOH
solution inside the wafer (Figure 2.4 a).
23
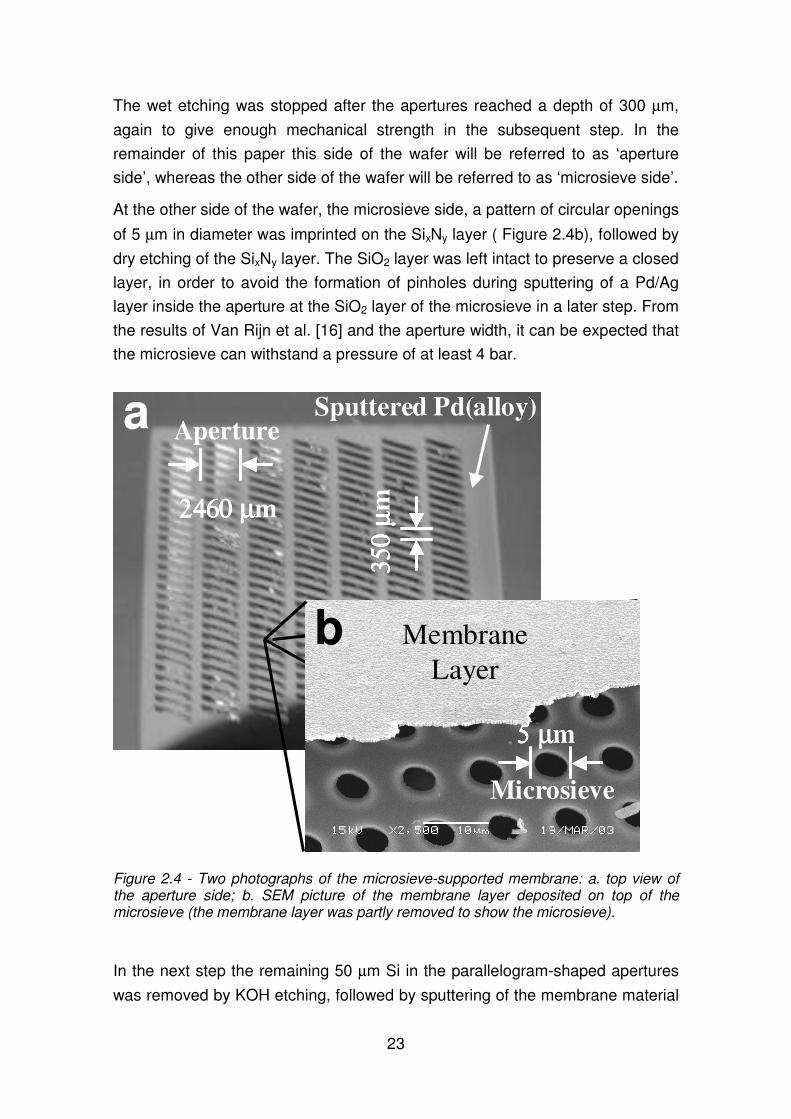
The wet etching was stopped after the apertures reached a depth of 300 µm,
again to give enough mechanical strength in the subsequent step. In the
remainder of this paper this side of the wafer will be referred to as ‘aperture
side’, whereas the other side of the wafer will be referred to as ‘microsieve side’.
At the other side of the wafer, the microsieve side, a pattern of circular openings
of 5 µm in diameter was imprinted on the SixNy layer ( Figure 2.4b), followed by
dry etching of the SixNy layer. The SiO2 layer was left intact to preserve a closed
layer, in order to avoid the formation of pinholes during sputtering of a Pd/Ag
layer inside the aperture at the SiO2 layer of the microsieve in a later step. From
the results of Van Rijn et al. [16] and the aperture width, it can be expected that
the microsieve can withstand a pressure of at least 4 bar.
a
2460 µ2460 µ2460 µ2460 µm
Aperture
350
µ35
0 µ
350
µ35
0 µm
b
5 µ5 µ5 µ5 µm
Microsieve
Membrane
Layer
Sputtered Pd(alloy)
Figure 2.4 - Two photographs of the microsieve-supported membrane: a. top view of the aperture side; b. SEM picture of the membrane layer deposited on top of the microsieve (the membrane layer was partly removed to show the microsieve).
In the next step the remaining 50 µm Si in the parallelogram-shaped apertures
was removed by KOH etching, followed by sputtering of the membrane material
24
onto a surface area of 18x18 mm at the aperture side (Figure 2.4a). Besides the
bottom of the aperture (Figure 2.4b), which later forms the actual membrane,
also the sidewall of the aperture and the wafer area around the aperture were
covered by the membrane material during sputtering.
Tong et al. [17] showed that a 0.5 µm thick Pd/Ag membrane supported by
microsieve can withstand a pressure of 4 bars at room temperature, which is
sufficient for industrial applications like the dehydrogenation processes of
alkanes and ethylbenzene. Prior to the sputtering of membrane material a Ti
layer was sputtered to obtain a good adhesion between the SiO2 and the
membrane layer. In the final step, the SiO2 and the Ti in the circular openings at
the microsieve side were removed with BHF to release the membrane area at
the microsieve side. A detailed description of the production of both the free-
hanging and microsieve-supported membranes is given by Tong et al. [18-20].
2.2.3 Metal film deposition
Pd, Ag and Ta targets were used to fabricate the three membrane types that
are described in the introduction. The purity of the targets was 99.99 wt.%. The
first type of membrane was fabricated by single cannon sputtering of a 1.0 µm
Pd layer on top of the SiO2 layer.
The Pd/Ag alloy membrane was fabricated using two ion cannons. The use of
two separate ion cannons enables to sputter Pd and Ag simultaneously with a
homogeneous Pd/Ag composition as a result. By changing the operating
conditions of the two sputter cannons all possible alloy compositions can be
obtained. The Pd/Ag ratio of the membrane was adjusted by using a previously
obtained relation between sputtering parameters and final Pd and Ag
concentrations. Membranes with alloy compositions close to the optimum of
77/23 wt% Pd/Ag were made. The thickness of the Pd/Ag membranes was
varied from 0.5 µm to 1.2 µm.
The Pd-Ta-Pd membrane was obtained by sequential sputtering from a Pd and
a Ta target. First, a 0.2 µm layer of Pd was sputtered on top of the SiO2
followed by a 0.6 µm layer of Ta, and finally a 0.2 µm Pd layer was sputtered on
top of the Ta layer.
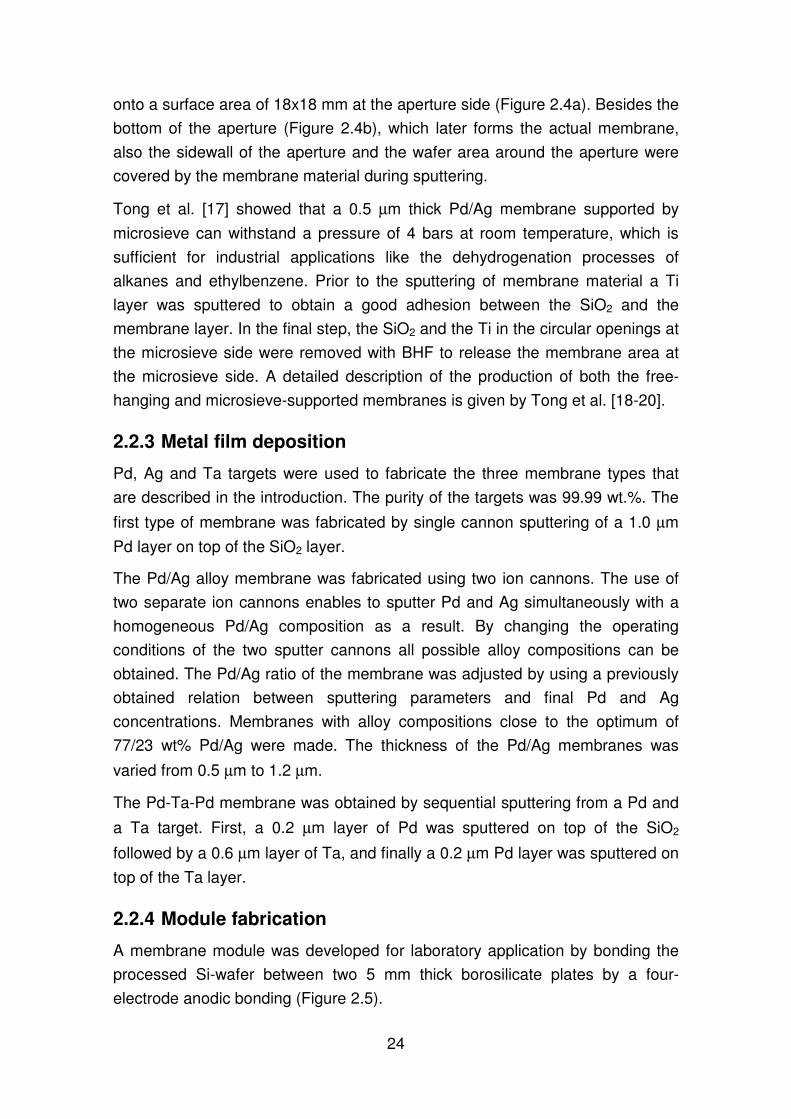
2.2.4 Module fabrication
A membrane module was developed for laboratory application by bonding the
processed Si-wafer between two 5 mm thick borosilicate plates by a four-
electrode anodic bonding (Figure 2.5).
25
Prior to bonding, two holes were drilled in each glass plate to serve as the inlet
and outlet of the gas flow at both sides of the membrane. Additionally, transport
ducts were powder blasted in the borosilicate plate to transport the gas from the
inlet over the membrane towards the outlet, for which two different designs have
been used.
A
A
A
A
Apertures in Si wafer
The module:Si wafer between two glass plates
Glass
Glass
Si 110
A-A cross-section
H2 + He H2 + He
N2 N2 + H2
Glass
Glass
Si 110
A-A cross-section
H2 + He H2 + He
N2 N2 + H2
— Microsieve side
— Aperture side
Figure 2.5 - Photograph and schematic drawing of the membrane module design without a forced gas flow through the slits. The gasses flow over the wafer and H2 transport to the membrane is mainly based on diffusion.
In the first design each glass wafer has one large duct (width 18 mm, length 30
mm, depth 0.2 mm) in which the gas flows over the wafer (Figure 2.5). As a
consequence, the gas at the aperture side of the membrane has to diffuse
through a stagnant layer in the apertures.
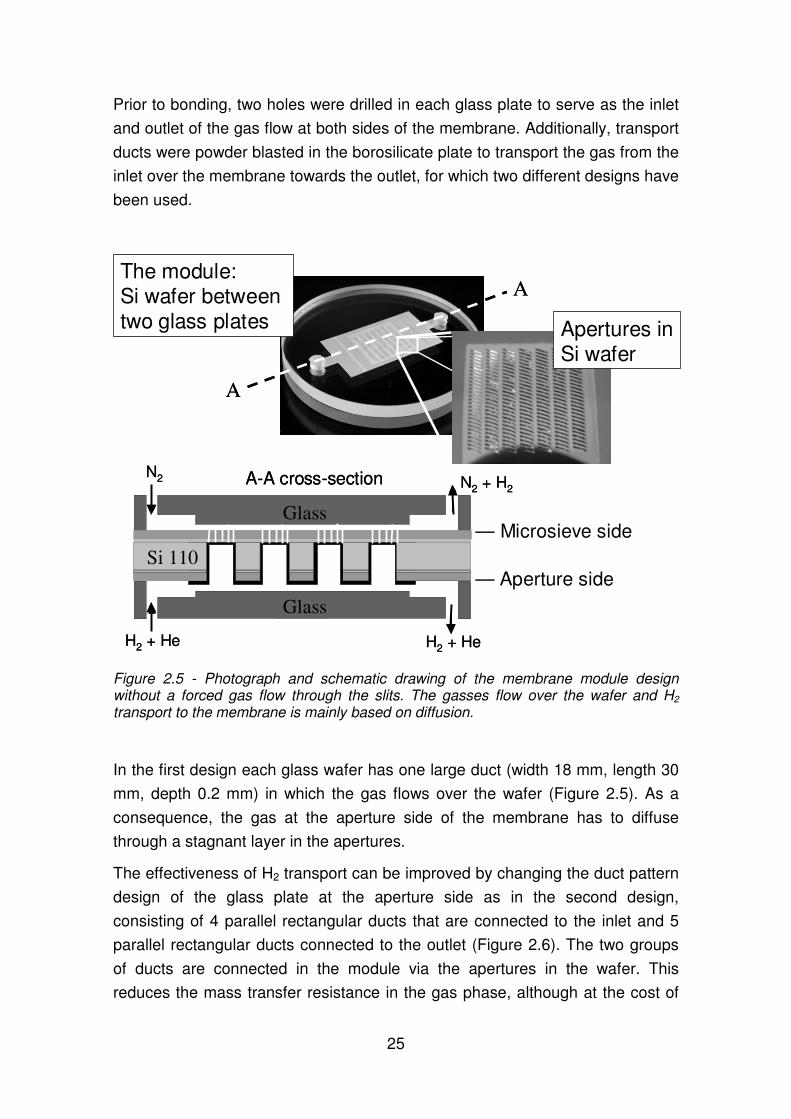
The effectiveness of H2 transport can be improved by changing the duct pattern
design of the glass plate at the aperture side as in the second design,
consisting of 4 parallel rectangular ducts that are connected to the inlet and 5
parallel rectangular ducts connected to the outlet (Figure 2.6). The two groups
of ducts are connected in the module via the apertures in the wafer. This
reduces the mass transfer resistance in the gas phase, although at the cost of
26
some additional pressure loss. At the wafer side without apertures the glass
plate is identical to the first design. The modules with forced flow through the
slits are referred to as ‘Pd-ff’.
Si waferDuct in
borosilicate platePd layer
Layer 1, ducts in borosilicate plate
Layer 2, Si wafer
Layer 3, Pd membrane
~ ~
~ ~
Layer 1, borosilicate plate Gas flow perpendicular under paper
Gas flow perpendicular above paper
A
A
Cross section A-A
~~
~~
Figure 2.6 - Photograph and schematic drawing of the membrane module design with a forced gas flow through the slits (ff). The gasses are forced through the apertures in the wafer, which results in a lower mass transfer resistance than in the design shown in Figure 2.5.
2.2.5 Characterization of membranes
The Pd/Ag ratio of the membrane was confirmed by measuring a sample by X-
ray Photoelectron Spectroscopy (XPS, Quantum 2000 Scanning ESCA
Microprobe). The sample was prepared by sputtering a Pd/Ag layer on a Si
wafer at conditions identical to those of the membrane fabrication. The Pd/Ag
ratio at various depths was also determined with XPS measurements.
The thickness of the membrane was measured using a Dektak surface profiler
and Scanning Electron Microscope (SEM, Jeol JSM-5600). The Dektak surface
profiler could only measure the thickness of the Pd/Ag layer at the surface of
the wafer at the aperture side. However, after breaking the wafer, it was
possible to determine the Pd/Ag layer thickness inside the aperture on the
microsieve by SEM.
The permeance and selectivity of the membranes were determined using the
experimental set-up shown in Figure 2.7. The retentate and permeate side were
continuously flushed: the retentate side with a known mixture of H2 and He, and
the permeate side with N2. All gas flows were regulated by mass flow
controllers. The retentate and permeate flow rates were varied between 100

27
and 1000 ml/min. The purity of H2, He and N2 was 99.999%. The absolute
pressure of the retentate side was controlled by a pressure controller and was
set slightly above atmospheric pressure. The trans-membrane pressure was
kept below 20 mbar. The permeance and selectivity were determined by
measuring the H2 and He concentration in the N2 stream by a GC, equipped
with a Thermal Conductivity Detector (TCD). More detailed information about
the experimental set-up has been given in a previous paper [21].
H2 N2
Handvalve
Gascylinder
PC
N2
Mass flow controller
ReducerH2
He
Buffer vessel
dP dP
GC
MembraneOven
Spiral Electric valve
dP
Normalmode
P
Sample-tubeHe
Exhaust
3-way valve
Pressurecontroller
PP
(d)P
(differential) Pressure transmitter
T
Figure 2.7 - Schematic drawing of the permeation setup.
To investigate the influence of the activation step, three membranes were not
activated, while the other membranes were activated for at least three hours at
a temperature of 673 or 723 K, respectively, depending on the operating
temperature of the first experiment. During activation, a mixture of 20/80 vol.%
H2/He was fed to both the retentate and permeate side of the membrane. The
activation state of the membranes used and the properties of the membrane
modules are summarized in Table 2.1.
After activation (or directly at the start of the measurement if no activation was
carried out) pure He was fed to the retentate side and pure N2 to the permeate
side in order to detect any He leak through the membrane. During the leak test
a trans-membrane pressure of 50 mbar was applied and 4 samples were taken.

28
Hydrogen permeation experiments were carried out at 623, 673, and 723 K,
respectively, and the H2 partial pressure in the feed was varied from 0 to 0.83
bar. For each condition, at least 4 samples were taken at a rate of 4 samples
per hour.
2.3 Results and Discussion
2.3.1 Membrane layer characteristics
The membrane thickness as given in Table 2.1 is derived from the sputtering
conditions, but has also been measured by the Dektak surface profiler and by
SEM for two membranes. The results of the three methods are in agreement
with each other. The composition and homogeneity of the prepared Pd/Ag alloy
samples measured by XPS equal the intended concentration of Pd and Ag.
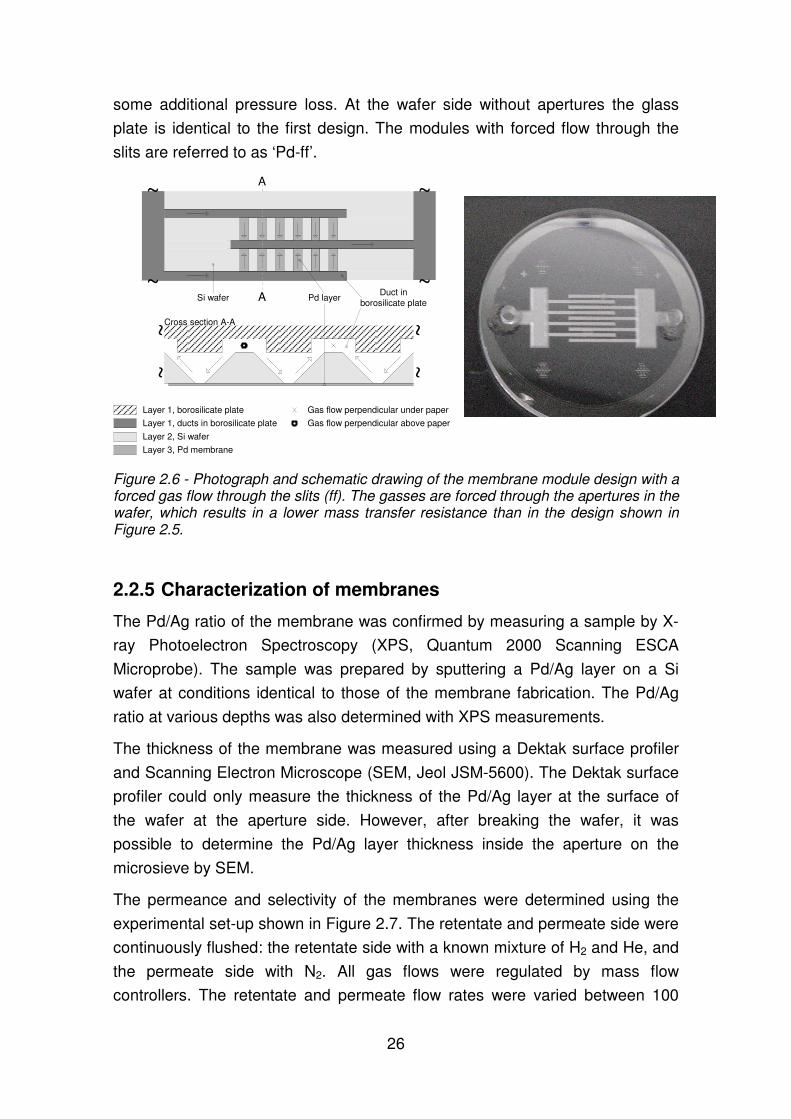
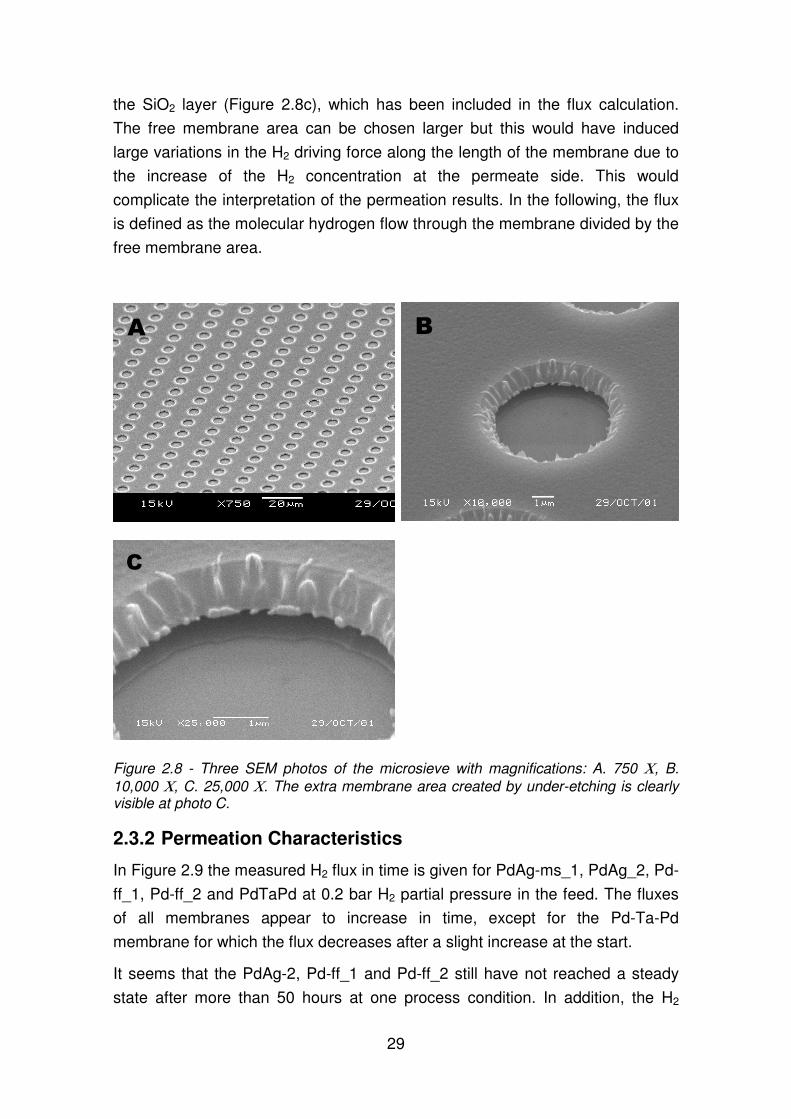
A microsieve-supported membrane without glass packaging has also been
examined by SEM. Three different magnifications of the microsieve side are
shown in Figure 2.8. As can be seen in the SEM pictures, microsystem
technology is a highly precise technology, able to produce very uniform
perforations.
Table 2.1 - Properties of the various types of fabricated membranes and modules characterized in the permeation setup. The code ‘ms’ in the membrane identification refers to the use of a microsieve-support and the code ‘ff’ refers to the use of a forced flow configuration at the feed side.
Membrane identification
Activated Forced
flow Thickness
(µµµµm) Microsieve
Composition (wt.%)
Pd Ag
PdAg-ms_1 yes no 0.7 yes 78 22
PdAg-ms_2 yes no 0.5 yes 77 23
PdAg_1 no no 1.2 no 78 22
PdAg_2 yes no 0.7 no 78 22
Pd-ms no no 1.0 yes 100 0
Pd-ff_1 yes yes 1.0 no 100 0
Pd-ff_2 yes yes 1.0 no 100 0
PdTaPd no no 1.0 no *
* Sandwich structure: Pd(0.2µm)-Ta(0.6µm)-Pd(0.2µm)
The total perforated area is 20% of the area that covers the apertures. The free
membrane surface is approximately 10% larger as a result of under-etching in
29
A
the SiO2 layer (Figure 2.8c), which has been included in the flux calculation.
The free membrane area can be chosen larger but this would have induced
large variations in the H2 driving force along the length of the membrane due to
the increase of the H2 concentration at the permeate side. This would
complicate the interpretation of the permeation results. In the following, the flux
is defined as the molecular hydrogen flow through the membrane divided by the
free membrane area.
B
C
Figure 2.8 - Three SEM photos of the microsieve with magnifications: A. 750 Χ, B. 10,000 Χ, C. 25,000 Χ. The extra membrane area created by under-etching is clearly visible at photo C.
2.3.2 Permeation Characteristics
In Figure 2.9 the measured H2 flux in time is given for PdAg-ms_1, PdAg_2, Pd-
ff_1, Pd-ff_2 and PdTaPd at 0.2 bar H2 partial pressure in the feed. The fluxes
of all membranes appear to increase in time, except for the Pd-Ta-Pd
membrane for which the flux decreases after a slight increase at the start.
It seems that the PdAg-2, Pd-ff_1 and Pd-ff_2 still have not reached a steady
state after more than 50 hours at one process condition. In addition, the H2

30
fluxes are rather low with respect to the membrane thickness. Most likely the
surface of the membrane was not well activated prior to the shown
measurements. A continued activation by H2 during the measurements reduces
the amount of contaminants at the Pd surface, resulting in a flux increase. A
further analysis will be made in the next paragraphs.
0 50 100 150 2000.0
0.2
0.4
0.6
0.8
1.0
1.2
Flu
x (m
ol H
2 / m
2 · s)
Time (h)
PdAg-ms_1 723 KPdAg-2 723 KPd-ff_1 723 KPd-ff_2 673 K PdTaPd 673 K
Figure 2.9 - Hydrogen flux as function of time for different types of membranes and modules. The feed consists of 0.2 bar H2 and 0.8 bar He.
Helium could not be detected in the permeate for the pure Pd and Pd/Ag alloy
membrane (Figure 2.10), so that the selectivity of membrane Pd-ff_1 and PdAg-
ms_1 are in excess of 1500 or 2000, respectively. This indicates that these
membranes are pinhole free or close to pinhole free. For the Pd-Ta-Pd
membrane some He could be detected in the permeate almost from the start of
the experiment. The He leak increased by a factor of 10 in four steps. We have
no explanation yet for the strange combination of decreasing H2 flux and
increasing He flux of the Pd-Ta-Pd membrane, but the measurement inaccuracy
can be excluded as a cause.

31
Ward and Dao [9] have presented a permeation model including the various
transport steps described in the introduction. Based on this model a flux of 2.5
mol H2/m2·s would have been expected for a 1.0 µm Pd membrane at the
conditions used in the experiments, whereas for the Pd/Ag membranes even
higher values are predicted. Moreover, from this analysis it would follow that the
transport step that limits the H2 flux is diffusion through the actual membrane
layer.
0 50 100 150 2000.000
0.005
0.010
0.015
Detection Limit (DL) for He
Flu
x (m
ol H
e / m
2 · s)
Time (h)
PdAg-ms < He DLPdAg_2 < He DLPd-ff_1 < He DLPd-ff_2 < He DLPdTaPd
Figure 2.10 - Helium flux during the same experiments as shown in Figure 2.9.
The measured H2 flux through the membrane can be described by:
)()(222
n
permH
n
retHH PPTPJ −⋅= (1)
in which JH2 is the H2 flux, P(T) the permeance, and PH2 ret and PH2 perm are the
H2 partial pressure at the retentate inlet and permeate outlet, respectively. The
value of the exponent n depends on the transport step that limits the hydrogen
flux.

32
Based on calculations the mass transfer resistance in the gas phase is
excluded as a limiting step. If diffusion through the membrane limits the flux, n
will be equal to 0.5 (Sievert’s law). If surface reactions at the retentate side limit
the flux, n will be unity, whereas when both transport steps are responsible for
flux limitations, n will vary between 0.5 and 1.0.
The results of the experiments with varying H2 concentration in the feed are
given in Figure 2.11a and Figure 2.11b at 673 and 723K, respectively. The
measured flux is plotted against the difference in H2 partial pressure of the feed
inlet and the permeate outlet. From Figure 2.11, it can be observed that some
spread occurs between the series of ascending and descending H2 feed
concentrations. The measured flux is equal or higher for the descending H2 feed
concentration. To determine which step limits the H2 transport rate, the
measurements with varying H2 feed concentrations have been fitted to equation
1 to obtain the corresponding value of n and the confidence intervals (see Table
2.2).
As expected from the flux behaviour presented in Figure 2.9 and from the
values of the exponent n in Table 2.2, the permeation through the membrane is
mainly limited by H2 surface reactions. In the case of the Pd membrane, the H2
permeation is partly limited by the diffusion through the membrane at 723 K (n
is smaller than 1), whereas at 673 K the relative influence of diffusion is hardly
noticeable (n is close to 1).
Table 2.2 - Permeances and exponents (n) calculated by non-linear regression of the measured data obtained from permeation experiments with varying H2 partial pressures in the feed and equation 1.
Membrane identMification
Temp.
Stable flux
Permeance
Standard deviation
n
Standard deviation
(K) (mol H2 /
m2⋅⋅⋅⋅s⋅⋅⋅⋅bar
n)
(mol H2 /
m2⋅⋅⋅⋅s⋅⋅⋅⋅bar
n)
(-) (-)
PdAg-ms_1 673 no 4.15 0.54 1.19 0.11
PdAg_1 673 yes 0.75 0.09 1.21 0.08
PdAg_1 723 yes 2.09 0.14 1.23 0.05
PdAg_2 723 no 4.79 0.07 1.20 0.05
Pd-ms 673 yes 1.74 0.14 0.96 0.06
Pd-ms 723 yes 1.80 0.14 0.80 0.07
In the case of Pd/Ag alloy membranes a value larger than 1 has been found for
n. A possible explanation for this phenomenon could be surface segregation.
The occurrence of surface segregation has been found for Pd alloys like Pd/Ni

33
and Pd/Rh [22, 23]. Additionally, the adsorption of gasses at the metal surface
can influence the degree of segregation [24]. Shu et al. [25] found that the
presence of hydrogen in the gas phase will repress the preference of Ag for a
location in the surface. Because more Pd will be present at the surface at
increasing H2 partial pressure, more active sites will be available for the
necessary surface reactions to adsorb and desorb H2 from Pd. As a result, the
dependency of the flux upon the H2 partial pressure can be larger than
proportional (n >1).
When the rate determining step remains the same over the temperature range
investigated and the number of free active sites for surface reactions remains
constant, the temperature dependence of the permeance can be described by
an Arrhenius-type of equation:
TR
E
CTP ⋅−
⋅= exp)( (2)
in which P is the permeance, C is the pre-exponential constant, R is the gas
constant, T is the operating temperature and E is the activation energy of the
rate determining step. Equation 2 implies that a plot of the logarithmic flux
values against the reciprocal temperature should result in straight lines.
Deviation from a straight line indicates that the activation energy for hydrogen
transport changes, i.e. the limiting transport step changes.

34
0,0 0,1 0,2 0,30,0
0,2
0,4
0,6
0,8
1,0
1,2
2nd P H2
decrease1st P H2
incre
ase2nd P H2
decre
ase
Flu
x (m
ol H
2 / m
2 · s
)
PH
2 feed
- PH
2 permeate
(bar)
Temperature 673K
PdAg-ms_1 PdAg_1 Pd-ms
1st P H2
increase
0.0 0.2 0.4 0.6 0.80
1
2
3
4
Flu
x (m
ol H
2 / m
2 · s)
PH
2 feed
- PH
2 permeate
(bar)
Temperature 723K
PdAg_1 PdAg_2 Pd-ms
Figure 2.11 - Hydrogen flux as function of the H2 partial pressure in the feed: a) measurements at 673 K; b) measurements at 723 K (the lines are to guide the eye).
a
b

35
In Figure 2.12 the measured fluxes at 623, 673, and 723 K are plotted against
the reciprocal temperature for four membranes. For the pure Pd membrane the
relationship between logarithmic flux and reciprocal temperature is almost linear
for both series, unlike most of the measured Pd/Ag membranes, thus indicating
that the limiting transport step of the Pd membrane does not change with
temperature. The slope variations of the Pd/Ag membranes indicate that the
limiting transport step changes with temperature for these membranes.
Combining these results with the exponent n as determined above, it is
plausible to ascribe the effect of temperature on Pg/Ag membranes to a
reduced number of free active sites caused by surface segregation or by
surface contamination. Moreover, this effect is so strong that it almost
completely overrules the expected diffusion limitation as it is predicted by the
Ward and Dao model. The effect of segregation can be excluded as a cause for
the differences between flux values in the consecutive series of PdAg-ms_1,
because the equilibrium concentration of Pd and Ag is established in minutes.
This is due to the fact that only a few atom layers at the surface are involved in
the segregation process [26].
1.4 1.5 1.610-2
10-1
100Feed: 20% H
2
80% He
Flu
x (m
ol H
2 / m
2 · s)
1000/T (1/K)
PdAg-ms_1 series 1 ,, series 2 ,, series 3 PdAg-ms_2 series 1 PdAg_1 series 1 Pd-ms series 1 ,, series 2
725 700 675 650 625
T (K)
Figure 2.12 - Hydrogen flux as function of the reciprocal temperature at a feed H2 partial pressure of 0.2 bar for different membrane, types and measurement series consecutive in time (the lines are to guide the eye).The hydrogen flux after reaching equilibrium is used (approximately 24 hours after the temperature change).

36
The observed drop in the flux in Figure 2.12 between consecutive series is most
likely attributed to increased surface contamination. Another indication for
surface limitation is that at 723 K the H2 flux for the 0.7 µm thick PdAg-ms_1 is
higher than of the 0.5 µm thick PdAg-ms_2 membrane. Cleaning the surface
with steam or oxygen can provide ways to revert the rate limiting mechanism
from H2 surface reactions to diffusion [27].
2.3.3 Comparison to literature
In Figure 2.13 the permeances of the membranes fabricated with microsystem
technology are compared to Pd and Pd/Ag alloy membranes deposited on
porous substrates. All permeances are calculated based on n=1. The
microsystem-fabricated membranes give the highest permeances, even up to a
factor 2.5 higher than for membranes deposited on porous substrates if a
membrane area of 25% of the wafer area is taken into account. The permeance
increases faster with increasing temperature for the membranes presented in
this paper compared to the membranes from the literature.
Figure 2.13 - Comparison of membrane permeances presented in this work with other H2 selective membranes deposited on a porous substrate [31-34].
37
The difference in trend may be caused by the difference in limiting transport
step of the H2 permeance. In our case the transport is limited by H2 surface
reactions [28], which results in a higher activation energy than if the transport is
limited by diffusion through the membrane [29]. Large increments in permeance
are still possible for these membranes if the limitation in H2 permeation can be
changed from surface reaction to diffusion. Thin layers of 200 nm or less are
possible, which will theoretically allow for a further increase of the flux by a
factor of 4.
If the transport limitation cannot be changed from surface reactions to diffusive
transport through the membrane, the use of a thinner membrane will hardly
improve the H2 flux. For the microsystem technology based membranes the flux
limitations due to mass transfer resistances in the gas phase will not be an
issue because of the small dimensions of the gas ducts, especially if the flow
can be forced through the slits.
Franz et al. [15] and Karnik et al. [30] both measured the flux of a 200 nm thick
Pd membrane fabricated with microsystem technology. Franz et al. measured a
permeance of 43 mol H2/m2·s·bar at 773 K and Karnik et al. a permeance of 9
mol H2/m2·s·bar at 373 K. Both permeances are higher than the permeances
measured for the membranes presented in this paper. Causes are the
difference in thickness of the membranes and in case of Franz et al. the
operation temperature was higher. Applying n is 0.5 (diffusion limited) instead of
1.0 the permeance measured by Franz et al. agrees with the model of Ward
and Dao.
For the membrane of Karnik et al., Ward and Dao predict that the associative
desorption would limit the H2 transport at 373 K. The predicted flux is 1000
times smaller than the one presented by Karnik et al.. We have no explanation
for this discrepancy.
2.4 Conclusions
Two different fabrication methods are presented in this paper to prepare high-
flux H2 selective membranes. In both methods the key factor is the deposition of
the metallic layer on a closed and smooth surface layer. Only after deposition of
the actual membrane the support is opened to free the membrane surface. This
method results in Pd or Pd/Ag alloy membranes free of pinholes, thus exhibiting
a high selectivity to H2.

38
The prepared Pd-Ta-Pd sandwich membrane, however, exhibits some
permeance for He. The highest flux has been measured for a 1µm Pd/Ag
membrane with the microsieve support: 3.6 mol H2/(m2·s). Fluxes found in this
study are approximately 2.5 times higher compared to membranes deposited on
a porous support.
H2 permeation through the Pd membrane appears not only to be limited by
diffusion through the membrane but also by H2 surface reactions. A better
activation of the membrane reduces the amount of contamination at the surface,
which leads to a higher flux. Eventually, diffusion through the membrane will
determine the H2 flux, which opens the possibility to further improve the flux by
applying thinner membranes as shown by Franz et al [15].

39
References
1) R.B. McBride and D.L. McKinley, A new hydrogen recovery route, Chem.
Eng. Prog., 61 (1965) 81.
2) Y. Yildirim, E. Gobina, and R. Hughes, An experimental evaluation of
high-temperature composite membrane systems for propane dehydrogenation,
J. Membr. Sci., 135 (1997) 107.
3) H. Weyten, J. Luyten, K. Keizer, L. Willems, and R. Leysen, Membrane
performance: the key issues for dehydrogenation reactions in a catalytic
membrane reactor, Catal. Today, 56 (2000) 3.
4) E. Kikuchi, Y. Nemoto, M. Kajiwara, S. Uemiya, and T. Kojima, Steam
reforming of methane in membrane reactors: comparison of electroless-plating
and CVD membranes and catalyst packing modes, Catal. Today, 56 (2000) 75.
5) A. Criscuoli, A. Basile, E. Drioli, and O. Loiacono, An economic feasibility
study for water gas shift membrane reactor, J. Membr. Sci., 181 (2001) 21.
6) A. Julbe, D.F. arrusseng, and C. Guizard, Porous ceramic membranes
for catalytic reactors - overview and new ideas, J. Membr. Sci., 181 (2001) 3.
7) R. Dittmeyer, V. Höllein, and K. Daub, Membrane reactors for
hydrogenation and dehydrogenation processes based on supported palladium,
J. Mol. Cat. A, 173 (2001) 135.
8) G. Xomeritakis and Y.S. Lin, Fabrication of thin metallic membranes by
MOCVD and sputtering, J. Membr. Sci., 133 (1997) 217.
9) T.L. Ward and T. Dao, Model of hydrogen permeation behavior in
palladium membranes, J. Membr. Sci., 153 (1999) 211.
10) Y.H. Ma, I.P. Mardilovich, and P.P. Mardilovich, Effect of the porosity and
pore size distribution of the porous stainless on the thickness and hydrogen flux
of palladium membranes, in Proc. Symposium - Membrane Technology in
Petroleum, Petroch, 2001, 154.

40
11) J.D. Fast, Interactions of metals and gases, The Macmillan Press Ltd,
Eindhoven, 1971.
12) S. Uemiya, T. Matsuda, and E. Kikuchi, Hydrogen permeable palladium-
silver alloy membrane supported on porous ceramics, J. Membr. Sci., 56 (1991)
315.
13) N.M. Peachey, R.C. Snow, and R.C. Dye, Composite Pd/Ta metal
membranes for hydrogen separation, J. Membr. Sci., 111 (1996) 123.
14) C.J.M. van Rijn, Membrane Filter and a method of manufacturing the
same as well as a membrane, WO 95/13860, 1994.
15) A.J. Franz, K.F. Jensen, and M.A. Schmidt, Palladium based
micromembranes for hydrogen separation and hydrogenation/dehydrogenation
reactions, in Proc. The third International Conference on Microreaction
Technology (IMRET3), 1999, 382.
16) C.J.M. van Rijn, M. van der Wekken, W. Nijdam, and M.C. Elwenspoek,
Deflection and Maximum Load of Microfiltration Membrane Sieves Made with
Silicon Micromachining, J. Microelectromech. Syst., 6 (1997) 48.
17) H.D. Tong, F.C. Gielens, J.G.E. Gardeniers, H.V. Jansen, W. Nijdam,
C.J.M. van Rijn, and M.C. Elwenspoek, Microsieve supporting palladium-silver
alloy membrane and application to hydrogen separation, J. Microelectromech.
Syst., 279 (2006) 176
18) H.D. Tong, F.C. Gielens, J.W. Berenschot, M.J. de Boer, J.G.E.
Gardeniers, W. Nijdam, C.J.M. van Rijn, and M.C. Elwenspoek, Fabrication and
characterization of MEMS based wafer-scale palladium silver alloy membranes
for hydrogen separation and hydrogenation/dehydrogenation reactions, in Proc.
International Conference on micro electro mechanical systems (MEMS 02),
2002, 268.
19) H.D. Tong, F.C. Gielens, H.T. Hoang, J.W. Berenschot, M.J. de Boer,
J.G.E. Gardeniers, H.V. Jansen, C.J.M. van Rijn, and M.C. Elwenspoek, A
hydrogen separation module based on wafer-scale micromachined palladium-

41
silver alloy membranes, in Proc. The 12th international conference on solid
state sensors, actuators and microsystems, Boston, 2003, 1742.
20) H.D. Tong, F.C. Gielens, J.W. Berenschot, M.J. de Boer, J.G.E.
Gardeniers, W. Nijdam, C.J.M. van Rijn, and M.C. Elwenspoek, Microfabrication
of palladium-silver alloy membranes for hydrogen separation, J.
Microelectromech. Syst., 12 (2003) 622.
21) F.C. Gielens, H.D. Tong, C.J.M. van Rijn, M.A.G. Vorstman, and J.T.F.
Keurentjes, High-flux palladium-silver alloy membranes fabricated by
microsystem technology, Desalination, 147 (2002) 417.
22) G.N. Derry, C.B. McVey, and P.J. Rous, The surface structure and
segregation profile of Ni50Pd50 (100): A dynamical LEED study, Surf. Sci., 326
(1995) 59.
23) J.A. Leiro, M.H. Heinonen, and I.G. Batirev, Surface segregation and
core-level shift of a Pd-Rh alloy studied by XPS, Appl. Surf. Sci., 90 (1995) 515.
24) F.J. Kuijers and V. Ponec, The Surface Composition of Pd-Ag Alloys, J.
Catal., 60 (1979) 100.
25) J. Shu, B.E.W. Bogondo, B.P.A. Grandjean, A. Adnot, and S. Kaliaguine,
Surface segregation of Pd-Ag membranes upon hydrogen permeation, Surf.
Sci., 291 (1993) 129.
26) Personal communication with H.H. Brongersma, Eindhoven, The
Netherlands, 2002.
27) F.C. Gielens, R.J.J. Knibbeler, P.F.J. Duysinx, H.D. Tong, M.A.G.
Vorstman, and J.T.F. Keurentjes, Influence of steam and CO2 on the H2 flux
through thin Pd/Ag and Pd membranes, J. Membr. Sci., 279 (2006) 176.
28) F.C. Gielens, H.D. Tong, M.A.G. Vorstman, and J.T.F. Keurentjes,
Extended characterisation of MEMS based hydrogen separation membranes, J.
Membr. Sci., 289 (2007) 15.

42
29) J.Chabot, J.Lecomte, C.Grumet, and J.Sannier, Fuel clean-up system:
poisoning of palladium-silver membranes by gaseous impurities, Fusion.
Technol., 14 (1988) 614.
30) S.V.Karnik, M.K.Hatalis, and M.V.Kothare, Towards a palladium micro-
membrane for the water gas shift reaction: microfabrication approach and
hydrogen purification results, J. Microelectromech. Syst., 12 (2003) 93.
31) K.Hou and R.Hughes, Preparation of thin and highly stable Pd/Ag
composite membranes and simulative analysis of transfer resistance for
hydrogen separation, J. Membr. Sci., 214 (2003) 43.
32) J.Shu, B.P.A.Grandjean, S.Kaliaguine, A.Giroir-Fendler, and J.A.Dalmon,
Hysteresis in hydrogen permeation through palladium membranes, J. Chem.
Soc., Faraday Trans., 92 (1996) 2745.
33) A.Li, W.Liang, and R.Hughes, Fabrication of dense palladium composite
membranes for hydrogen separation, Catal. Today, 56 (2000) 45.
34) B.McCool, G.Xomeritakis, and Y.S.Lin, Composition control and
hydrogen permeation characteristics of sputter deposited palladium-silver
membranes, J. Membr. Sci., 161 (1999) 67.

43
3 MEASUREMENT AND MODELLING OF
HYDROGEN TRANSPORT THROUGH HIGH-FLUX PD MEMBRANES
Abstract
The permeability of H2-selective palladium membranes fabricated with
microsystem technology has been studied. The permeation experiments have
been carried out at temperatures between 623 and 873 K at H2 feed partial
pressures of 0.2 - 1.0 bar. At 823 K, a permeance based on the free membrane
area of 18 mol H2/m2·s·bar0.58 has been measured for a Pd membrane with a
thickness of 0.5 µm. From the permeation experiments the rate determining
transport step and the stability of the membranes have been determined. At 873
K the H2/He selectivity decreases rapidly, indicating the formation of pinholes at
higher temperatures. From a combination of experiments and computer
simulations the limiting transport step has been determined to be H-atom
diffusion through the membrane at elevated temperatures and H2 surface
reactions at the retentate side at lower temperatures.
This chapter is based on: F.C. Gielens, H. D. Tong, M.A.G. Vorstman and J.T.F. Keurentjes, Measurement and modelling of hydrogen transport through high-flux Pd membranes, J. Membr. Sci., 289 (2007) 15-25.

44
3.1 Introduction
In the last decade a large increase in the H2 flux of Pd and Pd alloy membranes
has been achieved by reducing the membrane thickness using porous materials
such as alumina or sintered steel as support of the membrane. Microsystem
technology enables the fabrication of membranes with a thin support layer
(about 1 micron) or even without support [1-3]. The absence of the porous
support layer substantially reduces the mass transfer resistance and hence a
dramatic increase of the H2 flux can be achieved [4,5]. The well-defined surface
of free membrane area makes these membranes very well suited for studies of
the prevailing transport mechanism.
In previous work, we have presented the flux characterization of Pd membranes
fabricated with microsystem technology over a temperature range of 623 – 723
K [4, 6]. The measured H2 flux is higher than literature values for membranes of
comparable thickness deposited on a porous support, however, it appears to be
approximately 20% of the flux calculated with the model proposed by Ward and
Dao [7]. It also appears that the measured flux is not only limited by diffusion
through the membrane but also by H2 surface reactions due to contaminations.
In the present paper, the membrane has been activated with steam, which will
remove adsorbed carbon species from the Pd surface and will thus increase the
availability of sites for the dissociative adsorption and associative desorption of
H2.
In the literature, the rate-limiting step is often determined by fitting measured
data to the following equation:
)(222
n
permH
n
retHH PP(T)J −⋅Π= (1)
in which JH2 is the H2 flux, Π(T) the permeance, PH2 ret and PH2 perm are the H2
partial pressure at the retentate side and the permeate side, respectively, and
the exponent n is a parameter which value depends on the limiting transport
mechanism. If H2 surface reactions at the permeate side limit the flux then n=0
[7]. If diffusion through the membrane limits the flux then n=0.5 and if gas phase
resistance or surface reactions at the retentate side are limiting the flux, n
becomes unity. In the present study, the value of n and Π are determined in two
ways. First, the H2 feed partial pressure and the H2 partial pressure of the

45
permeate outlet are fitted to equation 1. Second, a theoretical model of the
membrane module is used to determine the local partial H2 pressures and
fluxes along the membrane which are used in the fitting procedure.
Furthermore, the stability of the membranes has been studied by monitoring the
selectivity during the permeation experiments.
3.2 Experimental
3.2.1 Membrane preparation and packaging
Two types of Pd membranes were prepared as described previously [1, 8]. One
type of Pd membrane was prepared without support, called ‘free-hanging
membrane’, and the other type was prepared on top of a 1.3 micron thick
microsieve of low stress silicon rich nitride and silicon oxide.
The first module contained a free-hanging membrane with a thickness of 0.9
µm, packaged between two borosilicate glass plates as shown schematically in
Gielens et al. [6]. The borosilicate plates were designed to force the feed
gasses to pass through the apertures in the silicon wafer as previously
described in more detail. To allow measurements at temperatures above 723 K,
the second module consisted of a microsieve-supported membrane of 0.5 µm,
packaged between two stainless steel holders (Figure 3.1). To compensate for
the large difference in thermal expansion of stainless steel and silicon, two
graphite rings (Egraflex GTC, 98% graphite, thickness 200 µm) were used as a
sealing material between the membrane and the holders. The two rings were
glued with high temperature glue (VP-3118/2 from Ingenieurbüro Große-
Perdekamp) between both sides of the silicon wafer and the stainless steel
holder. A clamp was applied to fixate the module during gluing and
measurements. After applying the clamp, the module was dried at room
temperature for one hour and subsequently the glue was hardened in an oven
at 453 K for two hours. Finally, the module was tested for the presence of leaks
by applying 100 mbar overpressure.

46
Figure 3.1 - Schematic view of the membrane packaging of the stainless steel module.
3.2.2 Membrane permeation
The H2 permeability and selectivity of the membranes were determined in the
experimental setup as shown in Figure 3.2. A known mixture of H2 and He was
flushed continuously through the retentate side and nitrogen through the
permeate side. Mass flow controllers regulated all gas flows. The retentate
pressure was regulated slightly above atmospheric pressure by a backpressure
controller and the permeate outlet was not restricted and was therefore at
atmospheric pressure. The gas flows were heated by a spiral that was placed in
the same oven as the membrane module. Steam to activate the membrane was
produced by evaporating water supplied by a high-pressure liquid
chromatography pump. The liquid flow rate of the pump determined the steam
flow. The water evaporation took place in a stainless steel spiral with inner
diameter of 0.8 mm and length of 1.5 m, placed inside the same oven. The
permeate composition was measured by means of a micro gas chromatograph
(Varian CP4900), equipped with a molsieve 5Å column and thermal conductivity
detector (TCD). Argon was used as the carrier gas, which made the TCD highly
sensitive to He and H2. The gasses were 99.999 vol% pure.
Cross-section AA Top view
holder
Ducts for gas transport
in the SS holder
B B Cross-section BB
Exploded top view
holder + graphite layer
Graphite sealing Si wafer including
membrane
Gl
ue
A
A
Graphite
Wafer
Swagelok
fitting
Swagelok
fitting
Exploded side view
holder, wafer,
and graphite
47
Figure 3.2 - Schematic view of the permeation setup.
After placing the membrane module in the system, He was fed to the retentate
and N2 to the permeate. A small positive transmembrane pressure was applied
to detect possible pinholes in the membrane layer by measuring the presence
of He in the permeate. If no pinholes were detected, the oven temperature was
increased with 3 K/min until the activation temperature of 723 K was reached.
Two activation steps with different feed gas mixtures were carried out to
compare the influence of H2 activation and steam activation.
During the H2 activation step a mixture of 20/80 vol% H2/He was fed to both the
retentate and permeate side of the membrane for 4 hours. During the
subsequent steam activation, a mixture of 20/20/60 vol% steam/H2/He was fed
to the retentate side and N2 to the permeate side for 72 hours. To measure the
effect of steam activation, series of permeation experiments with varying H2
concentrations in the feed were carried out before and after activation. The H2
partial pressure in the feed was varied from 0 to 1.01 bar in steps of 20 vol% H2
at temperatures of 623, 673, 723, 823 and 873 K, respectively.
After the permeation experiments the membrane surface was inspected and the
membrane thickness was confirmed using a Scanning Electron Microscope
(SEM, Jeol JSM-5600).
dP dP
dP
Oven
GC
PC
MFC H2
MFC He
MFC N2
MFC: Mass Flow ControllerPC: Pressure ControllerGC: Gas ChromatographdP: differential Pressure transducer
Pump H2O
dPdP dPdP
dPdP
Oven
GC
PC
MFC H2
MFC He
MFC N2
MFC: Mass Flow ControllerPC: Pressure ControllerGC: Gas ChromatographdP: differential Pressure transducer
Pump H2O
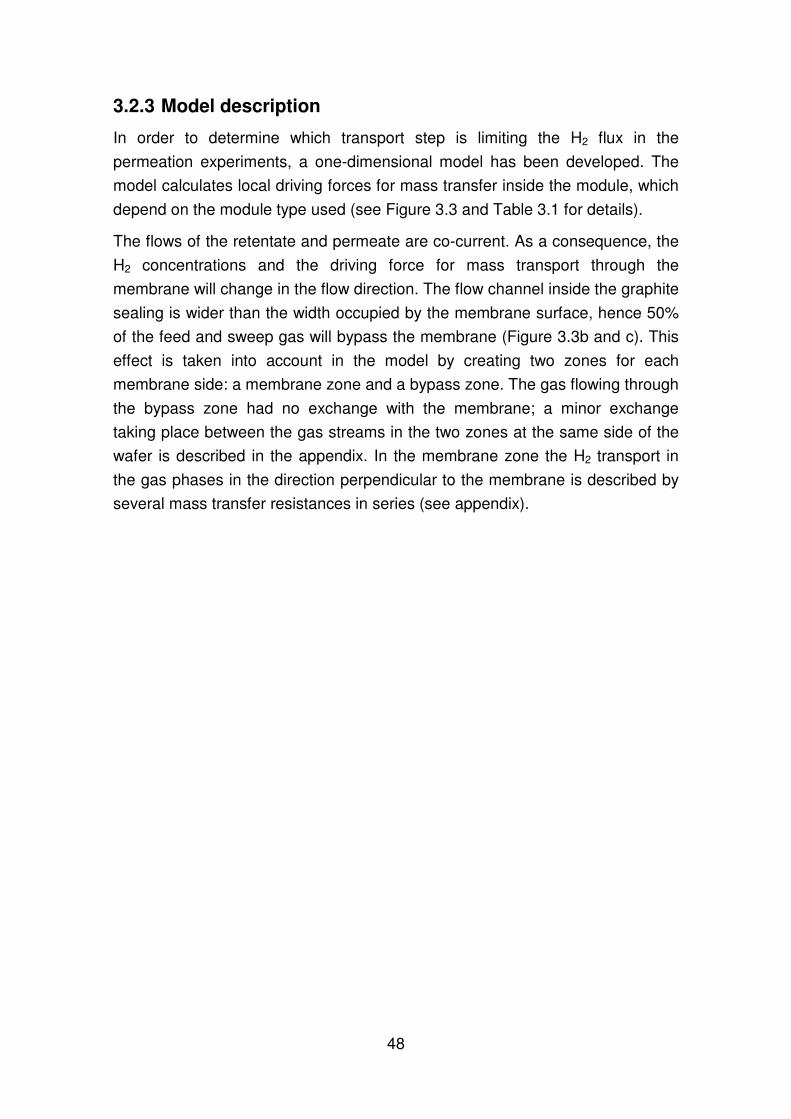
48
3.2.3 Model description
In order to determine which transport step is limiting the H2 flux in the
permeation experiments, a one-dimensional model has been developed. The
model calculates local driving forces for mass transfer inside the module, which
depend on the module type used (see Figure 3.3 and Table 3.1 for details).
The flows of the retentate and permeate are co-current. As a consequence, the
H2 concentrations and the driving force for mass transport through the
membrane will change in the flow direction. The flow channel inside the graphite
sealing is wider than the width occupied by the membrane surface, hence 50%
of the feed and sweep gas will bypass the membrane (Figure 3.3b and c). This
effect is taken into account in the model by creating two zones for each
membrane side: a membrane zone and a bypass zone. The gas flowing through
the bypass zone had no exchange with the membrane; a minor exchange
taking place between the gas streams in the two zones at the same side of the
wafer is described in the appendix. In the membrane zone the H2 transport in
the gas phases in the direction perpendicular to the membrane is described by
several mass transfer resistances in series (see appendix).

49
Figure 3.3 - Schematic view of the stainless steel module as it is modelled: a) cross-section in the flow direction, b) actual configuration of the rows of apertures, c) model configuration of a simplified column of apertures.
a
b c

50
Table 3.1 - Parameters used in the simulations of the modules. Operational conditions are equal to the experiments. The values of the physical parameters in the membrane model are equal to the values as presented by Ward and Dao [7] if no further changes are remarked.
Parameter
Stainless steel module “micosieve-supported”
Borosilicate module
“free hanging”
Membrane area (mm2) 3.3 8.8
Membrane thickness (µm) 0.5 0.9
Gas duct width (mm) 18 18 (permeate side)
Gas duct length (mm) 23 14 (permeate side)
Gas duct height (mm) 0.2 0.2 (permeate side)
Aperture width (µm) 600 317
Aperture length (µm) 2000 28
Aperture height (µm) 350 350
Number of aperture rows (-) 3 125
Number of aperture columns (-) 11 8
Space between apertures columns (µm) 300 1500
Correction aperture width at retentate side (µm)1 113 -
Correction aperture width at permeate side (µm)1 100 200
Fraction membrane area, ε, (membrane/microsieve)2 0.0833 1
Standard gas flow at retentate side (mlSTP/min)3 300 300
Standard gas flow at permeate side (mlSTP/min)3 300 300
Activation energy of the associative desorption (kJ/mol H2)
46.0 46.0
1) Extra width to include the mass transfer exchange between the area above the membranes and between the apertures, based on Fo=1 (see appendix) for a simple column of apertures. 2) Fraction is defined as effective membrane area divided by the total aperture area. 3) If a different gas flow is used, it will be notified in the caption of the figure.

51
Mass transport through the membrane is described according to the model of
Ward and Dao [7] which takes into account the following steps: dissociative
adsorption, surface to the Pd bulk transition, diffusion through the Pd bulk, the
Pd bulk to the surface transition, and associative desorption. The quasi-
chemical equilibrium approximation is used to describe the probability of two
adjacent empty hydrogen adsorption sites. For the activation energy of the
associative desorption a value of 46 kJ/mol H2 is used; the values of the other
parameters are taken from [7].
In the appendix the differential equations are presented and the method of
solving is indicated. Other parameters used in the simulations are given in
Table 3.1. The outcome of the model calculations will be compared with the
experimental flux data in the Results and discussion section.
3.3 Results and discussion
First the H2 permeances will be discussed, then the modelling and finally the
selectivity and stability of the membrane. The measured H2 fluxes were
corrected for the flow through pinholes that developed after some time of
operation in the membrane layer, by estimating the H2 flow through the pinholes
from the He concentration in the permeate assuming Knudsen diffusion. Fluxes
are based on the free membrane area in order to be able to make a comparison
with the predictions made by Ward and Dao.
3.3.1 Effect of steam activation on the H2 permeance
In Figure 3.4a and b, the effect of the two subsequent activation steps
(hydrogen and steam) on the H2 flux at 723 K is given for the two membranes,
respectively. In addition, the expected fluxes as calculated with the model are
given in the two figures. In Figure 3.4a the H2 flux before steam activation
gradually increases, as H2 activation will continue during permeation when H2 is
fed to only one side of the membrane. A flux of about 0.7 mol H2/m2·s is
reached 140 hours after the actual H2 activation step. The first activation with
steam induces an increase of the H2 flux, until a stable value of 1.1 mol H2/m2·s
is reached after 30 hours. A second steam activation does not improve the flux
anymore.

52
Figure 3.4 - The effect of steam activation (20/20/60 vol% steam/H2/He) on the H2 permeation in the 0.9 µm membrane (a) and the 0.5 µm membrane (b). All measurements are carried out at 20/80 vol% H2/He, 300 mlSTP/min (a) / 500 mlSTP/min (b), sweep gas N2 300 mlSTP/min, and 723 K. A malfunction in a valve after the first steam activation (a) has caused a drop in the feed flow rate to the module; after approximately 24 hours the malfunctioning of the valve was solved, which is visible by the sudden increase in flux.
0 20 40 60 80 100 120 1400.00
0.25
0.50
0.75
1.00
1.25
Flu
x (m
ol H
2/m2 ·s
)
Time (h)
Before steam addition After first steam addition After second steam addition Simulation
0 10 20 30 40 50 60 700.0
0.4
0.8
1.2
1.6
2.0
2.4
2.8
3.2
Flu
x (m
ol H
2/m
2 ·s)
Time (h)
Before steam addition After first steam addition Simulation
a
b

53
Steam activation obviously increases the number of free sites for the H2 surface
reactions, which are necessary for the permeation through the membrane. As
shown in Figure 3.4a, the measured fluxes after steam activation are in
agreement with the calculated fluxes using the model.
The H2 flux in Figure 3.4b is stable after the first H2 activation step. The
obtained flux of 1.6 mol H2/m2·s is relatively low as compared to the flux in
Figure 3.4a when taking into account that the thickness of this membrane is
almost half the thickness of the membrane used in Figure 3.4a. After steam
activation the flux increases to a maximum value of 2.5 mol H2/m2·s, but then
decreases to values below the flux before steam activation. This is most likely
caused by an increase of the carbon content of the palladium above a critical
level where it hampers the H2 surface reactions [9]. We think the carbon stems
from pyrolysis products from the glue or gaseous products from reactions
between steam or H2 and the glue or the graphite sealing; the methane or
carbon oxides formed may react under carbon deposition at the Pd surface. The
difference with the 0.9 µm membrane of Figure 3.5a is that glue was not present
and graphite to a far less extend in the glass bonded module. The figures are
presented in the same order as the experiments have been carried out. In both
figures the corresponding fits of equation 1 are given as well.

54
Figure 3.5 a) and b) - H2 permeation as a function of the H2 driving force between the feed and permeate outlet of the 0.9 µm membrane module at temperatures of 723 K (a) and 673 K (b). H2 up = series with increasing H2 partial pressure, H2 down = series with decreasing H2 partial pressure. At least 5 measurement points are shown per measurment condition. Measurements were taken equally spread over one hour after changing the H2 feed partial pressure.
0.0 0.2 0.4 0.6 0.8 1.00
1
2
3
4
Temperature 723 K
Flu
x (m
ol H
2/m
2 s)
Pret in
n- Pperm out
n (barn) , n=0.55 n=1.04
H2 up
H2 down
Fit H2 up
Fit H2 down
a
0.0 0.2 0.4 0.6 0.8 1.00
1
2
3
4
Temperature 723 K
Flu
x (m
ol H
2/m
2 s)
Pret in
n- Pperm out
n (barn) , n=0.55 n=1.04
H2 up
H2 down
Fit H2 up
Fit H2 down
a
0.0 0.2 0.4 0.6 0.8 1.00
1
2
3
4
Temperature 673 K
Flu
x (m
ol H
2/m
2 s)
Pret in
n- Pperm out
n (barn) , n=0.49 n=0.52
H2 up
H2 down
Fit H2 up
Fit H2 down
b
0.0 0.2 0.4 0.6 0.8 1.00
1
2
3
4
Temperature 673 K
Flu
x (m
ol H
2/m
2 s)
Pret in
n- Pperm out
n (barn) , n=0.49 n=0.52
H2 up
H2 down
Fit H2 up
Fit H2 down
b

55
0.0 0.2 0.4 0.6 0.8 1.00
1
2
3
Temperature 623 KF
lux
(mol
H2/
m2 s)
Pret in
n- Pperm out
n (barn) , n=0.57 n=0.50
H2 up
H2 down
Fit H2 up
Fit H2 down
c
Figure 3.5 c - H2 permeation as a function of the H2 driving force between the feed and permeate outlet of the 0.9 µm membrane module at the temperature of 623 K. H2 up = series with increasing H2 partial pressure, H2 down = series with decreasing H2 partial pressure.
The series with increasing H2 feed concentration and decreasing H2 feed
concentration are fitted separately, and are represented by different symbols.
The values of Π(T) and n (including the values of the standard deviation)
obtained by fitting the permeation results are summarized in Table 3.2.
For the 0.9 µm membrane, the flux at 723 K (Figure 3.5a) increases with
increasing H2 partial pressure in the feed. In the first measurements the
obtained fluxes are stable in time within 10 minutes. However, 190 hours after
steam activation (in the figure starting at a driving force of 0.65 bar0.55) the
fluxes start to decrease in time. This decrease in flux is ascribed to
contamination of the membrane surface, most likely by carbon. The decrease
continues during the series of decreasing H2 feed pressures, which results in a
value of n of 1.04. This high value of n is attributed to a combination of a
changing degree of contamination and a shift towards surface limitation at the
retentate side.

56
Table 3.2 - Fitted parameters n and Π of the experimental results and equation 1 (H2 ↑= increasing H2 feed partial pressure, H2 ↓ = decreasing H2 feed partial pressure). The corresponding values of the standard deviation (σ) are included.
Membrane (-)
Temp. (K)
n (-) ΠΠΠΠ (mol H2/m2·s·barn)
Average σσσσ Average σσσσ
H2 ↑↑↑↑ H2 ↓↓↓↓ H2 ↑↑↑↑ H2 ↓↓↓↓ H2 ↑↑↑↑ H2 ↓↓↓↓ H2 ↑↑↑↑ H2 ↓↓↓↓
0.9 µm
623 0.568 0.499 0.012 0.008 3.02 3.25 0.02 0.02
673 0.490 0.518 0.004 0.006 5.17 5.05 0.02 0.02
723 0.548 1.044 0.003 0.174 6.15 4.34 0.01 0.18
0.5 µm
723 0.815 0.690 0.006 0.011 7.36 8.05 0.02 0.04
723 1.408 0.710 0.061 0.016 6.46 7.65 0.10 0.05
823 0.581 0.583 0.008 0.011 17.6 17.7 0.11 0.15
The occurrence of contamination is supported by the fact that a stable and high
flux is obtained again after re-activating the membrane with steam and
hydrogen. At 673 and 623 K (Figure 3.5b and c) the fluxes of the series at
increasing and decreasing H2 feed pressure are almost equal. For all series the
fit describes the measured fluxes well, from which it can be concluded that
contamination does not play a role in these measurements. In general the
obtained fluxes are very high. Even when these fluxes are translated to values
based on the total wafer surface area, values are obtained that exceed the H2
flux of all Pd-based membranes supported by a porous medium reported in the
literature.
For the 0.5 µm membrane (stainless steel module) similar experiments have
been performed at temperatures of 723, 823 and 873 K. In Figure 3.6a and b,
the measured fluxes are given at 723 K before and after steam activation,
respectively. From Figure 3.6b it can be observed that the flux increases during
the measurement at each of the different feed concentrations during the ‘H2 up’
series. This is caused by the remaining water after the preceding steam
activation, where the time elapsed after the steam activation has been too short
to remove all the water from the system [9].

57
Figure 3.6 a and b - H2 permeation as a function of the H2 driving force between the feed and permeate outlet of the 0.5 µm membrane module at temperatures of 723 K before steam activation (a), 723 K and after steam activation (b) (in the same order as the experiments).
0.0 0.2 0.4 0.6 0.8 1.00
1
2
3
4
5
6
7
Steam influence still present
Temperature 723 K
Flu
x (m
ol H
2/m2 s)
Pret in
n- Pperm out
n (barn) , n=1.41 n=0.71
H2 up
H2 down
Fit H2 up
Fit H2 down
b
0.0 0.2 0.4 0.6 0.8 1.00
1
2
3
4
5
6
7Temperature 723 K
Flu
x (m
ol H
2/m2 s)
Pret in
n- Pperm out
n (barn) , n=0.82 n=0.69
H2 up
H2 down
Fit H2 up
Fit H2 down
a
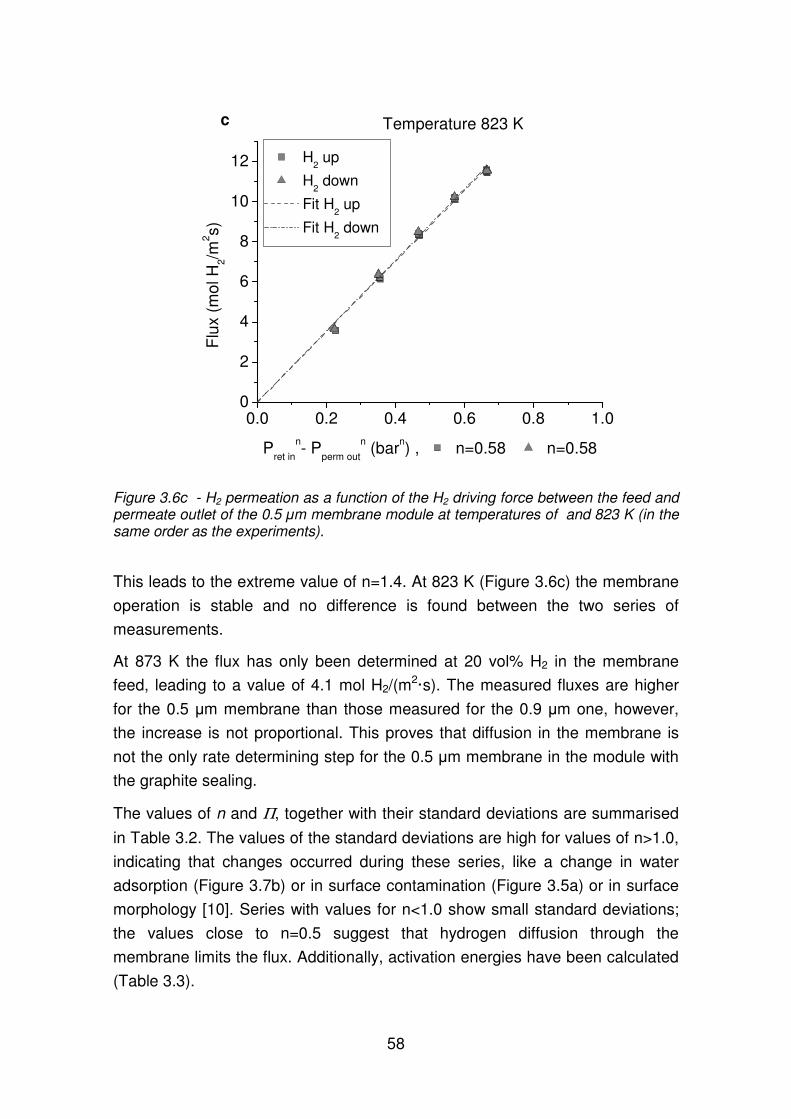
58
Figure 3.6c - H2 permeation as a function of the H2 driving force between the feed and permeate outlet of the 0.5 µm membrane module at temperatures of and 823 K (in the same order as the experiments).
This leads to the extreme value of n=1.4. At 823 K (Figure 3.6c) the membrane
operation is stable and no difference is found between the two series of
measurements.
At 873 K the flux has only been determined at 20 vol% H2 in the membrane
feed, leading to a value of 4.1 mol H2/(m2·s). The measured fluxes are higher
for the 0.5 µm membrane than those measured for the 0.9 µm one, however,
the increase is not proportional. This proves that diffusion in the membrane is
not the only rate determining step for the 0.5 µm membrane in the module with
the graphite sealing.
The values of n and Π, together with their standard deviations are summarised
in Table 3.2. The values of the standard deviations are high for values of n>1.0,
indicating that changes occurred during these series, like a change in water
adsorption (Figure 3.7b) or in surface contamination (Figure 3.5a) or in surface
morphology [10]. Series with values for n<1.0 show small standard deviations;
the values close to n=0.5 suggest that hydrogen diffusion through the
membrane limits the flux. Additionally, activation energies have been calculated
(Table 3.3).
0.0 0.2 0.4 0.6 0.8 1.00
2
4
6
8
10
12
Temperature 823 K
Flu
x (m
ol H
2/m
2 s)
Pret in
n- Pperm out
n (barn) , n=0.58 n=0.58
H2 up
H2 down
Fit H2 up
Fit H2 down
c

59
Table 3.3 - Calculated activation energy (kJ/mol H2) for various temperature intervals
Membrane (-)
Temperature range (K)
Activation energy kJ/mol H2
H2 ↑↑↑↑ H2 ↓↓↓↓
0.9 µm membrane
623 – 673 37 31
623 – 723 27 11
673 – 723 14 -12 1
0.5 µm membrane
723 – 823 49 41
723 – 873 41 34
823 – 873 8 8
1) As a result of contamination the flux at higher temperature is lower and causes the activation energy to be negative.
It has been shown in the literature that values of about 12 kJ/mol H2 correspond
with a diffusion limited permeation [7, 11, 12]. However, especially for lower
temperatures we calculate significantly higher values (between 30 and 50
kJ/mol H2), indicating that processes occurring at the surface become
important. Obviously, for the lower temperature ranges, the values for n and
the activation energy are not consistent. In the following section, the H2
permeance has been modeled in order to gain more insight in the underlying
phenomena.
3.3.2 Modelling of the H2 permeance
Model simulations are carried out for the input conditions (feed composition and
temperature) of all experiments without using experimental output like outlet
concentrations or H2 fluxes. The obtained simulation results are local and outlet
concentrations and fluxes. Four different definitions of the driving force (Table
3.4) have been used to calculate values of n and Π, fitting equation 1 to the
model results.

60
Table 3.4 - The driving forces used to determine the value of n of the results obtained by the model simulations.
model Flux H2
Driving force
variable
Driving force
variable Description
1 “average”
Average flux of the complete module P_H2,ret in
P_H2,perm out
H2 partial pressure of the feed and permeate out, respectively.
2 “local”
Local flux of one grid cell P_H2,ret P_H2,perm
Local H2 partial pressure in the gas
bulk of the membrane zone1.
3 “surface”
Local flux of one grid cell P_H2,ret P_H2,perm
Local H2 partial pressure at the
membrane surface1.
4 “diffusion”
Local flux of one grid cell
(H/Pd)ret diffusion
(H/Pd)perm diffusion
H/Pd ratio in the bulk Pd just below
the surface1. 1) In the fit procedure, the local H2 concentrations at two positions in the module have been used: the first and the last grid cell where Pd is present in the module.
The calculated fluxes and the experimentally observed fluxes are compared in
Figure 3.7a and Figure 3.7b for both modules, respectively. The values for n
and Π obtained from the fit of the simulation results are given in Table 3.5. From
Figure 3.7a it can be seen that the measured fluxes of the 0.9 µm membrane
are up to about 20% lower than the calculated fluxes. The experimental and
simulation results of the 0.5 µm membrane (Figure 3.7b) at 873 and 823 K
agree rather well, but at 723 K the measured fluxes are almost 50% lower. The
observed differences are most likely due to the fact that the model does not
account for contamination effects, as will be discussed later.
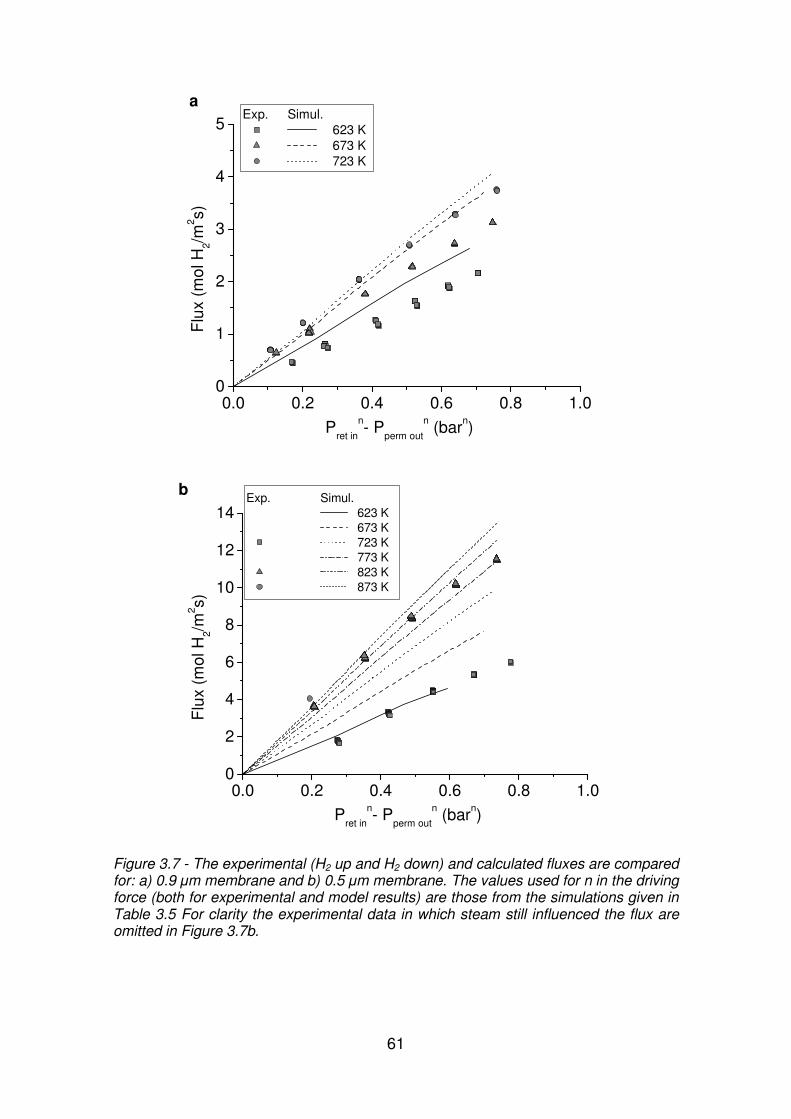
61
Figure 3.7 - The experimental (H2 up and H2 down) and calculated fluxes are compared for: a) 0.9 µm membrane and b) 0.5 µm membrane. The values used for n in the driving force (both for experimental and model results) are those from the simulations given in Table 3.5 For clarity the experimental data in which steam still influenced the flux are omitted in Figure 3.7b.
0.0 0.2 0.4 0.6 0.8 1.00
1
2
3
4
5
Flu
x (m
ol H
2/m2 s)
Pret in
n- Pperm out
n (barn)
Exp. Simul.623 K673 K723 K
a
0.0 0.2 0.4 0.6 0.8 1.00
2
4
6
8
10
12
14
Flu
x (m
ol H
2/m2 s)
Pret in
n- Pperm out
n (barn)
Exp. Simul.623 K673 K723 K773 K823 K
873 K
b

62
Table 3.5 - Fitted parameters n and Π of the simulation results and equation 1. The values of the standard deviation (σ) are included. The driving force is based on the average flux of the complete membrane module (P_H2,ret in - P_H2,perm out).
Membrane (-)
Temperature (K)
n (-) Π (mol H2/m2·s·barn)
Average σσσσ Average σσσσ
0.9 µm
623 0.476 0.031 3.93 0.111
673 0.613 0.028 5.16 0.094
723 0.702 0.028 5.88 0.090
0.5 µm
623 0.325 0.039 7.86 0.500
673 0.517 0.024 11.0 0.214
723 0.612 0.019 13.6 0.164
773 0.669 0.015 15.6 0.132
823 0.710 0.012 17.1 0.114
873 0.730 0.015 18.4 0.148
In Figure 3.8 the values of n are given as a function of temperature for the four
fits of the simulation results. Also the values fitted from the experimental
permeation results are given. For the simulations of both module types (Figure
3.8a and b respectively) it can be seen that upon an increase in temperature, a
shift in the transport limitation occurs from partly associative desorption limited
to a limitation by diffusion in the membrane (from n≅0.3 to n≅0.5 for the local
and surface based description). From the small difference in n in the ‘local’
series compared to the ‘surface’ series, it can be concluded that mass transfer
in the gas phase hardly causes extra resistance due to the small height of the
gas ducts in the module. As expected, the value of n of the diffusion-based fit is
constant (n=1) for all temperatures.
A clear difference exists between the values of the ‘local’ and the ‘average’
series, although the trend is comparable. The value of n of the ‘average’ series
increases to values of above 0.7, while the rate limiting transport step is still H-
atom diffusion through the membrane (n=0.5 ‘local’).
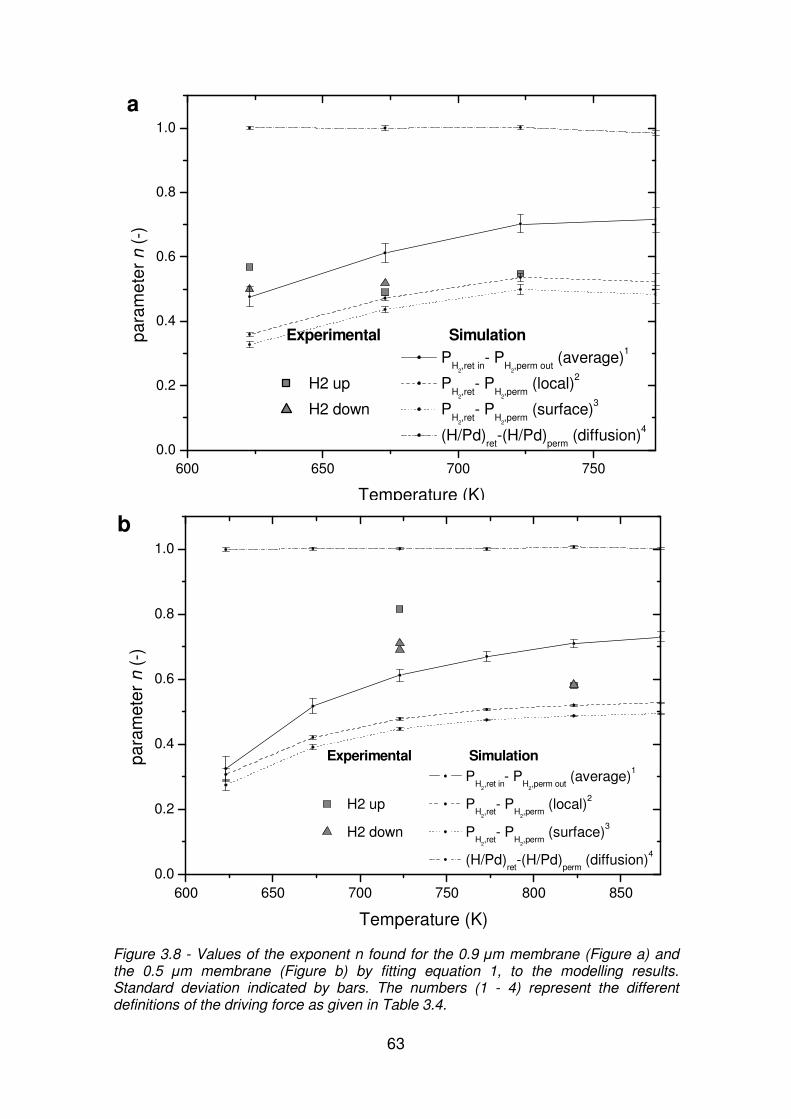
63
600 650 700 7500.0
0.2
0.4
0.6
0.8
1.0
para
met
er n
(-)
Temperature (K)
Experimental Simulation
PH
2,ret in
- PH
2,perm out
(average)1
H2 up PH
2,ret
- PH
2,perm
(local)2
H2 down PH
2,ret
- PH
2,perm
(surface)3
(H/Pd)ret
-(H/Pd)perm
(diffusion)4
a
600 650 700 750 800 8500.0
0.2
0.4
0.6
0.8
1.0
para
met
er n
(-)
Temperature (K)
Experimental Simulation
PH
2,ret in
- PH
2,perm out
(average)1
H2 up PH
2,ret
- PH
2,perm
(local)2
H2 down PH
2,ret
- PH
2,perm
(surface)3
(H/Pd)ret
-(H/Pd)perm
(diffusion)4
b
Figure 3.8 - Values of the exponent n found for the 0.9 µm membrane (Figure a) and the 0.5 µm membrane (Figure b) by fitting equation 1, to the modelling results. Standard deviation indicated by bars. The numbers (1 - 4) represent the different definitions of the driving force as given in Table 3.4.

64
Due to the definition used for the driving force in the ‘average’ series we can
conclude that bypassing of gas in the modules results in a value of n that does
not correspond with the underlying transport limitation.
The values found for n in the measurements can be compared to the n values
of the simulation calculated with the fit ‘average’. Without the model description,
the experimental values could be interpreted as a constant value for n of about
0.5, leading to the conclusion that transport is diffusion limited. However, the
model clearly indicates that n should decrease upon a decrease in temperature.
From the difference in trends it can be concluded that the shift of limiting steps
in the experiments is not the same as in the simulations. The trend found for n
in the experiments corresponds with a shift in transport limitation from surface
reactions at the retentate side to surface reactions at the permeate side or
diffusion through the membrane. This has also been observed in Figure 3.7.
Also the experimentally found values for the activation energy support the
suggestion that contamination of the surface limits the H2 transport at lower
temperatures.
3.3.3 Selectivity and stability of the membrane
For more than 65 days no helium has been detected in the permeate during the
measurements with the 0.9 µm membrane. After the temperature change from
673 to 623 K, however, the H2/He selectivity is 60 at a H2/He feed ratio of 20/80
(Table 3.6). From then on the hydrogen selectivity remains constant. At the
start-up of the 0.5 µm membrane also no helium has been detected in the
permeate, which changes after the activation step.

65
Table 3.6 - The selectivity and temperature history of the membranes.
0.9 µm membrane 0.5 µm membrane
Time (Days/hours)
Temperature (K)
Selectivity (H2/He)
Time (Days/hours)
Temperature (K)
Selectivity (H2/He)
0/0 298 ND1) 0/0 298 ND1
45/3 723 ND 1/0 723 200
51/22 723 ND 3/20 723 160
56/5 673 ND 4/2 723 200
65/8 673 ND 10/17 723 200
76/1 623 60 11/4 723 80
83/2 623 60 21/20 823 60
- - - 22/3 823 40
- - - 22/11 873 8
1) The membrane feed was pure He; no helium was detected at the permeate side. The detection limit is approximately 0.01 vol% He in N2.
The selectivity is 200 at a H2/He feed ratio of 20/80. As the value of n for He
equals unity and is below unity for H2, the selectivity is concentration
dependent. At 823 K, the helium flow through the membrane starts to increase
and the selectivity drops to values of 60 to 40. At 873 K the selectivity drops
gradually and becomes unity after several hours (Figure 3.9).
The total operation time under varying hydrogen feed concentrations and
temperatures has been 2000 and 540 hours for the 0.9 and 0.5 µm membrane,
respectively.

66
Exp. ConditionsH2 feed: 20 vol.%Ret. flow: 500 ml/minPerm. flow: 300 ml/minT: 823-873 K
0 2 4 6 8 10 12 140
10
20
30
40
Flu
x (m
ol H
/m2 ·s
, mol
He/
m2 ·s
)
Time (h)
H2
He T
700
750
800
850
900
Peaks of He and H2 arenot separated by the GC
Temperatureeffect
Tem
pera
ture
(K
)
Exp. ConditionsH2 feed: 20 vol.%Ret. flow: 500 ml/minPerm. flow: 300 ml/minT: 823-873 K
0 2 4 6 8 10 12 140
10
20
30
40
Flu
x (m
ol H
/m2 ·s
, mol
He/
m2 ·s
)
Time (h)
H2
He T
700
750
800
850
900
Peaks of He and H2 arenot separated by the GC
Temperatureeffect
Tem
pera
ture
(K
)
Figure 3.9 - Rapid increase of the He flow through the 0.5 µm membrane at 873K.
SEM micrographs of the membrane after the permeation experiments show that
irregularly shaped openings have been formed in the Pd layer at the openings
of the microsieve (Figure 3.10). A closer look at the membrane reveals that the
structure of the Pd has changed from a smooth surface without pin-holes
(Figure 3.10a) into a grain-structured surface (Figure 3.10b), probably due to a
combination of temperature-annealing and the effects of hydrogen. The size of
the grains is between 0.1 and 1 micron. Grain growth induces the membrane to
become locally thinner, eventually leading to the formation of holes (Figure
3.10c). Comparable results have been shown in a recent article for palladium-
copper membranes [13].

67
Figure 3.10 - SEM pictures of a pristine membrane (a) and the two sides of the 0.5 µm membrane operated at 873 K: the permeate side (b) and the retentate side (c).
3.4 Conclusions
The permeability of H2-selective palladium membranes fabricated with
microsystem technology has been studied. From the permeation experiments
the rate determining transport step and the stability of the membranes have
been determined. At 823 K, a permeance of 17.7 mol H2/m2·s·bar0.58 has been
measured for a Pd membrane with a thickness of 0.5 µm.
From the difference in trends of the flux versus temperature found in the
simulations and in the experiments, it can be concluded that at lower
temperatures the transport limitation in the experiments is due to surface
reactions at the retentate side rather than at the permeate side. With increasing
temperature, the flux starts to become limited by H-atom diffusion through the
a b
c

68
membrane or by surface reactions at the permeate side. At higher temperatures
the experimental and calculated fluxes are in good agreement. From the results
of model simulations it can be concluded that the method of calculating n in
previous papers has resulted in values of n larger than expected based on the
limiting transport step only; this is due to the presence of a bypass stream and a
varying driving force along the flow path in the module.
The membranes have shown to be stable for a rather long period. However,
SEM analysis shows the formation of a grain-structured surface. At 873 K the
H2/He selectivity decreases rapidly, caused by the formation of holes at higher
temperatures.

69
References
1) H.D. Tong, F.C. Gielens, J.W. Berenschot, M.J. de Boer, J.G.E.
Gardeniers, W. Nijdam, C.J.M. van Rijn, and M.C. Elwenspoek, Microfabrication
of palladium-silver alloy membranes for hydrogen separation, J.
Microelectromech. Syst., 12 (2003) 622.
2) C.J.M. van Rijn, Membrane Filter and a method of manufacturing the
same as well as a membrane, patent WO 95/13860, 1994.
3) A.J. Franz, K.F. Jensen, and M.A. Schmidt, Integrated palladium-based
micromembranes for hydrogen separation and hydrogenation/dehydrogenation
reactions, patent WO 00/32512, 2000.
4) F.C. Gielens, H.D. Tong, C.J.M. van Rijn, M.A.G. Vorstman, and J.T.F.
Keurentjes, High-flux palladium-silver alloy membranes fabricated by
microsystem technology, Desalination, 147 (2002) 417.
5) B.J. Wilhite, M.A. Schmidt, and K.F. Jensen, Palladium-based
micromembranes for hydrogen separation: device performance and chemical
stability, Ind. Eng. Chem. Res., 43 (2004) 7083.
6) F.C. Gielens, H.D. Tong, C.J.M. van Rijn, M.A.G. Vorstman, and J.T.F.
Keurentjes, Microsystem technology for high-flux hydrogen separation
membranes, J. Membr. Sci., 243 (2004) 203.
7) T.L. Ward and T. Dao, Model of hydrogen permeation behavior in
palladium membranes, J. Membr. Sci., 153 (1999) 211.
8) H.D. Tong, F.C. Gielens, J.G.E. Gardeniers, H.V. Jansen, W. Nijdam,
C.J.M. van Rijn, and M.C. Elwenspoek, Microsieve supporting palladium-silver
alloy membrane and application to hydrogen separation, J. Microelectromech.
Syst., 279 (2006) 176
9) F.C. Gielens, R.J.J. Knibbeler, P.F.J. Duysinx, H.D. Tong, M.A.G.
Vorstman, and J.T.F. Keurentjes, Influence of steam and CO2 on the H2 flux
through thin Pd/Ag and Pd membranes, J.Membr.Sci., 279 (2006) 176.

70
10) A. Kulprathipanja, G.O. Alptekin, J.L. Falconer, and J.D. Way, Effects of
water gas shift gases on Pd-Cu alloy membrane surface morphology and
separation properties, Ind.Eng.Chem.Res., 43 (2004) 4188.
11) A. Li, W. Liang, and R. Hughes, Fabrication of dense palladium
composite membranes for hydrogen separation, Catal. Today, 56 (2000) 45.
12) S. Ilias, N. Su, U.I. Udo-Aka, and F.G. King, Application of electroless
deposited thin-film palladium composite membrane in hydrogen separation,
Sep.Sci.Technol., 32 (1997) 487.
13) F. Roa and J.D. Way, The effect of air exposure on palladium-copper
composite membranes, Appl.Surf.Sci., 240 (2005) 85.
14) W.M. Rohsenow and J.P. Hartnett, Handbook of heat transfer, Mc Graw-
Hill, 1998.
15) W.E. Schiesser, Computational mathematics in engineering and applied
science: ODEs, DAEs and PDEs, CRC Press, 1994.

71
3.5 Appendix
For the description of mass transfer in the modules used, the following
mathematical description has been made for the geometry as presented in
Figure 3.3. Both in the membrane zone and in the by-pass zone concentration
gradients are assumed to be absent in the y-direction (perpendicular to the flow
but parallel to the membrane). Mass transport between the streams in the two
zones occurs by convection due to the change in the gas flow rates caused by
the H2 transfer through the membrane. To compensate for the diffusive
transport in the y-direction, the width of the membrane zone is extended with a
characteristic length calculated from the Fourier number (Fo). The characteristic
time in Fo is the gas residence time in a single grid cell and the value of Fo is
set to one. In the flow direction (x-direction) the convective and diffusive mass
transport are taken into account.
The transport of H2 through the membrane module at the retentate side in the
membrane zone can be described by
x
u
ww
wc
h
TccJ
x
cu
x
cPTcD
t
c r
brr
br
br
r
prrrrr
r
∂
∂
−⋅−
⋅−
∂
⋅∂−
∂
∂⋅=
∂
∂
,
,
,2
2 ),,(),,(
ε A1
where cr is the concentration of H2 at the retentate side in the membrane zone,
D is the diffusion coefficient, T the temperature, P the pressure; ur is the gas
velocity in the x-direction, J is the molar H2 flux through the membrane, ε is the
fraction of the membrane zone occupied by effective membrane area, wr,b is the
total width of the by-pass zone, t is an Eulerian time, x is a spatial coordinate, hr
is the height of the gas duct at the retentate and wr is the total width of the duct.
The transport in the bypass zone at the retentate side can be described by
x
uc
x
cu
x
cPTcD
t
cr
br
brrbr
br
br
∂∂
⋅+∂
⋅∂−
∂
∂⋅=
∂
∂,
,
2
,
2
,
,),,( A2
The change of velocity (ur,b=ur) caused by the removal of H2 is given by
r
brr
r
prr
w
ww
Ph
TRTccJ
x
u ,),,( −
⋅⋅
⋅⋅⋅−=
∂
∂ ε A3
where R is the gas constant and P is the total pressure. The influence of the
pressure drop can be neglected. The transport at the permeate side is
described by similar equations in which the subscript p denotes the permeate
side:

72
x
uc
h
TccJ
x
cu
x
cPTcD
t
c p
p
p
prppp
p
p
∂
∂⋅−
⋅+
∂
⋅∂−
∂
∂⋅=
∂
∂ ε),,(),,(
2
2
A4
x
u
w
wwc
x
cu
x
cPTcD
t
c p
bp
bpp
p
bppbp
bp
bp
∂
∂⋅
−⋅+
∂
⋅∂−
∂
∂⋅=
∂
∂
,
,,
2
,
2
,
,),,( A5
p
bpp
p
prp
w
ww
Ph
TRTccJ
x
u ,),,( −⋅
⋅
⋅⋅⋅=
∂
∂ ε A6
The flux J(cr, cp, T) is calculated with the model proposed by Ward and Dao [7]
and three mass transfer coefficients. The mass transfer coefficients in the gas
ducts at the retentate and permeate side are calculated using a Nusselt number
that is valid for the applied geometry and flow regime [14]. The third mass
transfer coefficient describing H2 transport through the stagnant gas layer in the
aperture is defined as the ratio of the aperture height and the H2 diffusion
coefficient. The effect of the net flux (Stefan diffusion) is taken into account for
all three cases.
The obtained system of 4 partial differential equations (PDE) and 2 ordinary
differential equations (ODE) are solved with the method of lines [15] and the
fourth-fifth order Runge-Kutta method. The grid of the model is examined by
doubling the number of cells in the x-direction and comparing the obtained
results.
Two differences between the glass and the stainless steel module made it
necessary to adjust the model. First, at the retentate side of the glass module
the gas flow is forced through the apertures, hence the mass transfer resistance
in the gas phase will be smaller and no bypassing of gas occurs at this side.
Second, the apertures are rotated 90 degrees with respect to permeate flow
and thus a cross flow configuration is created. To accommodate for this, an
average H2 concentration in the retentate has been applied to create a
mathematical link between retentate and permeate.

73
4 INFLUENCE OF STEAM AND CARBON DIOXIDE
ON THE HYDROGEN FLUX THROUGH THIN PD/AG AND PD MEMBRANES
Abstract
The influence of CO2 and steam on the H2 permeation behaviour of high-flux
Pd/Ag alloy and Pd membranes has been determined. The membranes –
fabricated with microsystem technology (MEMS technology) – are 1.0 and 0.5
µm thick; the thin membranes will reveal inhibitive effects more strongly than
relatively thick membranes. The H2 flux through the membranes has been
studied for periods of more than 80 hours during and after addition of CO2 or
H2O to the feed. Measurements have been carried out at 623, 673 and 723 K.
The largest flux reductions found are 70% and 69% at 623 K for H2O and CO2,
respectively. After stopping the steam addition the H2 permeance restores to its
original value. After stopping the CO2 addition the H2 permeance increases, but
to a value lower than before the CO2 addition. Surprisingly large time constants
have been found for the transient permeance behaviour. The inhibitive effect
caused by the addition of CO2 is almost certainly caused by the formation of CO
and H2O by the reverse water gas shift (WGS) reaction. Besides by adsorption
of CO2, CO and H2O, a far stronger inhibitive effect is caused by carbon, which
is formed by the dissociation of CO and CO2.
This chapter is based on: F.C. Gielens, R.J.J. Knibbeler, P.F.J. Duysinx, H. D. Tong, M.A.G. Vorstman and J.T.F. Keurentjes, Influence of steam and carbon dioxide on the hydrogen flux through thin Pd/Ag and Pd membranes, J. Membr. Sci., 279 (2006) 176-185.

74
4.1 Introduction
Steam reforming is an important process for the production of hydrogen. About
95% of the hydrogen demand in the US is supplied via steam reforming of light
hydrocarbons [1]. The two important chemical reactions in the steam reforming
process of methane are:
CH4 + H2O CO + 3 H2 steam reforming (1)
CO + H2O CO2 + H2 water gas shift (WGS) reaction (2)
To obtain high conversions it is necessary to use an operational temperature of
around 1100 K in the steam reforming reactor. The equilibrium of reaction 1 will
be shifted to the right hand side and of reaction 2 will be forced to the left.
Normally a second reactor, which is operated at a lower temperature and has a
different catalyst, is used to shift the equilibrium of reaction 2 to the H2 and CO2
side [2].
Changing the operation temperature is not the only way to shift reaction 2 to the
CO2 and H2 side; by removing the produced H2 the shift in equilibrium can also
be obtained [3-5]. Removing the H2 in the first reaction step by applying a
membrane could make the second reactor redundant. Shu et al. [3] measured a
40% higher methane conversion than the equilibrium conversion without
membrane using a Pd/Ag alloy membrane on a stainless steel support.
Criscuoli et al. [6] performed an economic feasibility study for a water gas shift
reactor and concluded that a reactor equipped with a Pd membrane of 20 µm
thick or less could be an alternative for the conventional apparatus. In their
calculation, it was assumed that H2 permeation through Pd membranes of 10
µm or more is limited by the diffusion of H-atoms through the membrane. For
membranes thinner than 10 µm an extra resistance term was added into the
permeation model to include the influence of adsorption and desorption at the
membrane surfaces. However, if the membrane surface is poisoned, the
diffusion of H-atoms through the membrane will not be the limiting factor for the
H2 permeation, as the lack of free sites for H2 dissociation may limit the H2 flux
substantially. Therefore, it is important to study the influences of the reactants
on the permeation behaviour.
The aim of the present study is to determine the effect of CO2 and steam
present in the feed on the H2 permeation behaviour, both during and after
addition. Pd and Pd/Ag alloy based membranes have been fabricated with

75
microsystem technology. By using this technology the formation of pinholes
caused by openings in the support layer can be prevented, so that very thin and
highly H2-selective membranes are made [7, 8]. Solely a 1.3 µm so-called
microsieve support layer or even no support layer has been used, which implies
that there is practically no resistance in the support.
4.2 Theoretical background and previous work
Chabot et al. [9] studied the influence of CO2, CO and CH4 on H2 permeation.
The relationship between the H2 flux, the inhibitor concentration and
temperature is depicted schematically by the dashed lines in Figure 4.1. In
Figure 4.1, the solid lines present the fluxes without contamination, according to
Ward and Dao [10], who showed in an extensive analysis of H2 transport in Pd
that the solid lines can be attributed to two different transport mechanisms. At
low temperature this is the surface reaction (associative desorption) at the
permeate side and at more elevated temperatures – the transition temperature
depends on the thickness of the membrane – H-atom diffusion in the Pd layer
(Sievert’s law). The steep flux lines for contaminated surfaces are caused by
limitation of H2 adsorption or desorption at the Pd surface.
In previous work no influence on the permeation has been found for CO2 at
temperatures above 623K, but relatively thick membranes (>80 µm) were used
[9, 11, 12]. Measurements with 5 µm thick membranes have been carried out by
Hou et al. [13], showing an inhibitive effect of CO2 on the flux at temperatures of
548-723 K. The membrane thickness is crucial for the extent of flux decrease by
contaminations. For example in Figure 4.1, the flux at 571 K (1.75·10-3 K-1) of a
1 µm membrane is affected by the medium and strong inhibitor, but the 10 µm
membrane only by the strong inhibitor. The 10 µm membrane is only affected by
the inhibitors at lower temperatures, because only then the flux will be limited by
the number of free sites for H2 dissociation. As mentioned, the diffusion through
the membrane itself is the rate determining step at higher temperatures; in this
case the flux is hardly affected by surface contamination. From Figure 4.1, it
becomes clear that for thinner membranes the effect of contaminants on the H2
flux will be more pronounced.

76
Figure 4.1- Schematic view of the influence of surface contamination on the H2 permeance of Pd or Pd alloy membranes (meaning of points 1, 2, 3 is explained in the text)
Besides CO2, Hou et al. [13] also investigated the effect of steam on the H2
permeability through a 5 to 6 µm thick Pd/Ag membrane, showing a significant
reduction of the H2 flux in the temperature range of 548-623 K. The influence of
steam on the flux decreased with increasing temperature and at temperatures
above 673 K almost no effect was found. Also Li et al. [14] reported a significant
reduction in H2 permeability of a 10 µm Pd membrane by adding steam to the
feed at a temperature of 653 K. The flux reduction is ascribed to contamination
of the surface by competitive adsorption of steam.
Besides adsorption of components from the feed, contamination of the
membrane surface may also be caused by chemical reactions of components in
the feed. From the literature it is known that Pd particles on a support such as
SiO2 or Al2O3 can act as catalyst for the hydrogenation of CO or CO2. Erdöhelyi
et al. [15] found that CO2 was converted to CH4, while CO was converted to
CH4, ethane, propane, methanol, dimethylether, and acetaldehyde by a Pd
catalyst supported by Al2O3. The quantities produced depend on the operating
1.0 1.2 1.4 1.6 1.8 2.0 2.2 2.40.01
0.1
1
10
100571 K
Lower inhibitor concentration
Higher inhibitor concentration
Membrane thickness 1 µm
Membrane thickness 10 µm
3
21
Flu
x (m
ol H
2/m2 ·s
)
1000/T (K-1)
Without contamination Weak inhibitor Medium inhibitor Strong inhibitor

77
conditions, the type of support, the structure of the Pd, and the type of additions
added to the Pd [16, 17]. It has also been found that adsorbed CO can react to
carbon and oxygen atoms, CHx and OHy molecules [18, 19]. The carbon formed
can diffuse into the Pd [20, 21] (Figure 4.2), where it can form an interstitial solid
solution of carbon in the Pd (palladium carbide) [22]. The H2 surface reactions
will be hindered by the presence of carbon at both membrane surfaces. As a
consequence, the H2 flux may decrease, even if the hydrogenation of CO or
CO2 occurs at only one side of the membrane.
Besides reactions that cause contamination of the membrane surface also
reactions may occur that remove contaminants from the surface. As an
example, carbon can be removed by hydrogenation of the carbon to methane.
This reaction is often used to activate Pd or Pd/Ag membranes. Hsiung et al.
[23] - using a commercial Pd/Ag membrane of 120 micron thick - found that
after CO2 addition was stopped for more than 4 hours, still H2O and CH4 were
detected in the retentate and CH4 but no H2O in the permeate. This implies that
reaction rates involved are rather low.
Figure 4.2 - Carbon formation and diffusion into the palladium membrane due to the hydrogenation of CO or CO2 and carbon removal by methanation.
4.3 Experimental
4.3.1 Membrane and module description
Pinhole free membranes were obtained by sputtering a thin layer of Pd or Pd/Ag
onto a closed SiO2 layer prepared on top of a silicon wafer. After sputtering, the
SiO2 is partly removed by etching apertures in the silicon wafer to free the
membrane. In the case of a so called microsieve supported membranes the
-CO
-CO
2
-C -O -CH
4
-H2O
-H
CC
C-
CH
4-
-H
-CO
-CO
2
-C -O -CH
4
-H2O
-H
CC
C-
CH
4-
-H
CO CO2
Retentate
Pd membrane
Permeate

78
SiO2 layer was supported by a layer of low stress silicon rich nitride. Circular
openings were made in the low stress silicon rich nitride to create the
microsieve. For the work described in this paper three membrane modules were
prepared: one module (Pd/Ag) contained a 77/23 wt.% Pd/Ag membrane layer
on a 1.3 µm thick microsieve of silicon rich nitride and silicon oxide and two
modules (Pd-1, Pd-2) contained a pure Pd membrane without microsieve
support. In the last two modules the flow was forced through the apertures
present in the Si wafer, leading to an even lower mass transfer resistance in the
gas phase. Both fabrication processes have been described in other
publications [24-26]. The free membrane area was 8.8 mm2 for all membranes.
The fluxes are based on this area. The thickness of the membranes and other
properties of the three membrane modules are given in Table 4.1.
4.3.2 Membrane permeation
The H2 permeance of the membranes is determined in the setup given in Figure
4.3. The retentate and permeate side were continuously flushed: the retentate
side with a known mixture of H2 and He, and the permeate side with N2. All gas
flows were regulated by mass flow controllers. The pressure at the retentate
side was regulated slightly above atmospheric pressure with a pressure
controller and at the permeate side the flow outlet was not restricted. The
permeate composition was measured by a gas chromatograph (GC), equipped
with a molsieve 5Å column and thermal conductivity detector (TCD). Argon was
used as carrier gas, which made the TCD highly sensitive to He and H2 and
much less sensitive for N2. The purities of H2, He, N2 and Ar were 99.999 vol.%;
the CO2 purity was 99.995 vol.%.
Carbon dioxide or water was added to the H2/He mixture by an additional mass
flow controller and a HPLC pump, respectively. The water was evaporated by
pumping it through a stainless steel spiral of 0.8 mm inner diameter and 1.5 m
length, which was placed in an oven together with the membrane module. After
the steam passed the spiral, it entered a second stainless steel spiral of 4 mm
inner diameter and 3 m length where the steam was mixed with the H2 and He
and temperatures were equalised. The steam flow rate was calculated from the
amount of liquid that was pumped by the HPLC pump into the spiral. During
steam addition, the steam was removed from the retentate outlet by a water-
cooled condenser and knockout drum. After the steam addition was stopped the
spiral was disconnected from the HPLC pump and most of the water was
removed from the spiral by the slight overpressure in the system; thereafter the
tube was closed with a plug.

79
After placing the membrane module in the experimental setup (and also when
the temperature was changed between experiments) the absence of pinholes in
the membrane was determined by feeding the retentate side with pure He and
the permeate side with N2. A small positive trans-membrane pressure was
applied and the permeate was checked on the presence of He. The
temperature of the oven was increased with 3K/min. After the desired
temperature was reached, the membrane was activated by feeding a mixture of
20 vol.% H2 in He to both membrane sides (retentate and permeate). The
applied activation times are given in Table 4.1
Table 4.1 - Membrane module parameters.
Membrane name
Composition Thickness (nm)
Flow forced through apertures
Micro- sieve
H2 activation temp. (K)
H2 activation time (hours)
Pd wt.%
Ag wt.%
Pd/Ag 77 23 500 No Yes 673 4
Pd-1 100 - 900 Yes No 723 3
Pd-2 100 - 1000 Yes No 673 3

80
Figure 4.3 - Schematic drawing of the permeation setup
NO
V2
CO
2H
2N
2
Han
d va
lve
Gas
cyl
inde
r
PC
N2
Mas
s flo
w c
ontr
olle
rR
educ
er
H2
He
CO
2
NO
V4
NC
V3
V1
Buf
fer
V6
dP3
GC
V7
Mem
bran
e
Ove
n
Hea
ting
spira
lA
utom
ated
val
ve
dP1
V5
Nor
mal
mod
e
Sam
ple-
poin
t
He
Ven
t
3-w
ay v
alve
dP
Pre
ssur
e se
nsor
T
Dem
iner
alis
ed w
ater
(l)
Pre
ssur
e co
ntro
ller
P
HP
LC p
ump
Liqu
id w
ater
P
Pha
se s
epar
ator
dP2
Coo
ling
wat
er

81
Table 4.2 - Measurement history of the Pd-1 membrane.
Time (hours)
Temperature (K)
Measurement type
0 723 H2 activation
4 723 Stabilization, 20 vol.% H2
148 723 Influence CO2, 20 vol.% CO2 and H2
291 723 Stabilization, 20 vol.% H2
405 723 Influence steam, 20 vol.% steam and H2
477 723 Stabilization, 20 vol.% H2
573 723 Influence CO2, 20 vol.% CO2 and H2
621 723 Stabilization, 20 vol.% H2
731 723 Influence steam, 20 vol.% steam and H2
793 723 Stabilization, 20 vol.% H2
883 723 Influence steam, 20 vol.% steam and H2
979 723 Stabilization, 20 vol.% H2
1047 723 Variable H2 feed concentration
1209 673 Temperature change and stabilization, 20 vol.% H2
1249 673 Influence steam, 20 vol.% steam and H2
1300 673 Variable H2 feed concentration
1518 673 Influence CO2, 20 vol.% CO2 and H2
1587 673 Stabilization, 20 vol.% H2
1680 623 Temperature change and stabilization, 20 vol.% H2
1703 623 Influence steam, 20 vol.% steam and H2
1751 623 Variable H2 feed concentration
1915 623 Influence CO2, 20 vol.% CO2 and H2
2107 623 Stabilization, 20 vol.% H2

82
Table 4.3 - Measurement history of the Pd-2 membrane.
Time (hours)
Temperature (K)
Measurement type
0 673 H2 activation
4 673 Stabilization, 20 vol.% H2
75 673 Influence CO2, 20 vol.% CO2 and H2
456 673 Stabilization, 20 vol.% H2
566 673 Influence CO2, 20 vol.% CO2 and H2
753 673 Stabilization, 20 vol.% H2
Table 4.4 - Measurement history of the Pd/Ag membrane.
Time (hours)
Temperature (K)
Measurement type
0 723 H2 activation
4 723 Stabilization, 20 vol.% H2
54 623 Stabilization, 20 vol.% H2
84 623 Stabilization, 20 vol.% H2
256 673 Influence CO2, 20 vol.% CO2 and H2
391 673 Stabilization, 20 vol.% H2
441 673 Influence CO2, 20 vol.% CO2 and H2
511 673 Stabilization, 20 vol.% H2
674 673 Stabilization, 20 vol.% , switched membrane sides feed/flush
720 673 Influence CO2, 20 vol.% CO2 and H2 (switched)
855 673 Stabilization, 20 vol.% (switched)
The permeation experiments with CO2 and steam were carried out separately
(CO2 and steam were never added together). The influence of CO2 and steam
were both measured at a feed concentration of 20 vol.% of CO2 or H2O. The H2
feed concentration was kept at 20 vol.% by adapting the He flow. Experiments
with and without 20 vol.% of CO2 or steam were carried out at 623, 673 and 723
K. The total feed flow rate was varied between 300 mL/min and 500 mL/min.
The sweep gas flow rate was kept constant at 300 mL/min. The measurement
history of the membranes used is summarized in the Table 4.2, Table 4.3 and
Table 4.4.
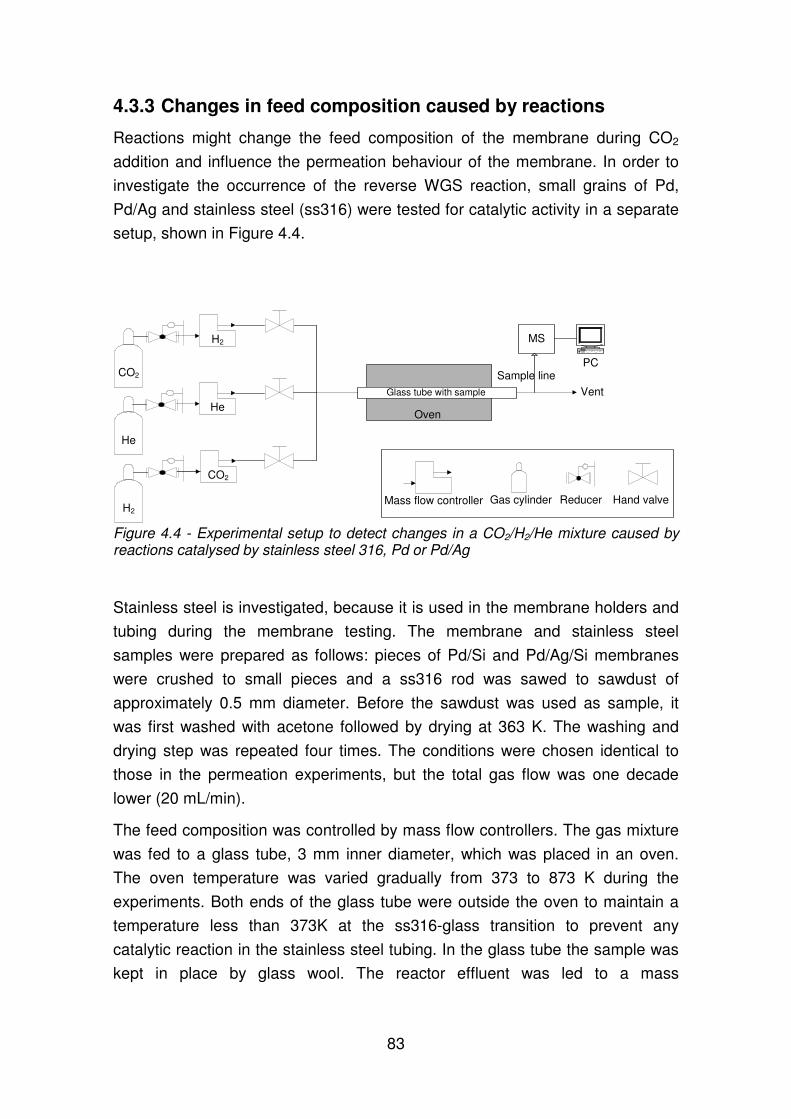
83
4.3.3 Changes in feed composition caused by reactions
Reactions might change the feed composition of the membrane during CO2
addition and influence the permeation behaviour of the membrane. In order to
investigate the occurrence of the reverse WGS reaction, small grains of Pd,
Pd/Ag and stainless steel (ss316) were tested for catalytic activity in a separate
setup, shown in Figure 4.4.
Figure 4.4 - Experimental setup to detect changes in a CO2/H2/He mixture caused by reactions catalysed by stainless steel 316, Pd or Pd/Ag
Stainless steel is investigated, because it is used in the membrane holders and
tubing during the membrane testing. The membrane and stainless steel
samples were prepared as follows: pieces of Pd/Si and Pd/Ag/Si membranes
were crushed to small pieces and a ss316 rod was sawed to sawdust of
approximately 0.5 mm diameter. Before the sawdust was used as sample, it
was first washed with acetone followed by drying at 363 K. The washing and
drying step was repeated four times. The conditions were chosen identical to
those in the permeation experiments, but the total gas flow was one decade
lower (20 mL/min).
The feed composition was controlled by mass flow controllers. The gas mixture
was fed to a glass tube, 3 mm inner diameter, which was placed in an oven.
The oven temperature was varied gradually from 373 to 873 K during the
experiments. Both ends of the glass tube were outside the oven to maintain a
temperature less than 373K at the ss316-glass transition to prevent any
catalytic reaction in the stainless steel tubing. In the glass tube the sample was
kept in place by glass wool. The reactor effluent was led to a mass
CO2
H2
PC
H2
He
CO2
MS
Oven
Sample line
He
Vent
Hand valveGas cylinder
Mass flow controller Reducer
Glass tube with sample

84
spectrometer (MS) to detect compounds of a molecular weight of 2 (H2), 4 (He),
18 (H2O), 28 (CO), 32 (O2), and 44 (CO2) gram/mol.
4.4 Results and discussion
Prior to the results of the permeation experiments to study the influence of
steam or CO2 addition, first the results will be presented of the reaction
experiments in the setup of Figure 4.4 since they help in the interpretation of the
permeation results.
4.4.1 Feed composition change induced by the Water Gas Shift reaction
From thermodynamic calculations the chemical equilibrium has been
determined for the CO2, H2, and He (20/20/60 vol.%) feed mixture as used
during the H2 permeation experiments with CO2 addition. In this calculation the
formation of methane has not been included because no methane has been
detected by GC during the permeation experiments (neither in the permeate nor
in the retentate); apparently the rate of the methanation reaction is too low.
Depending on the temperature, 18 to 27 % of the H2 and CO2 can be converted
into CO and H2O. Experiments in the setup of Figure 4.4 show that for the Pd
and Pd/Ag samples the gas composition does not change in the temperature
range of 473 to 873 K, but for the ss316 sample the gas composition changes,
confirming that the reverse WGS reaction occurs.
In Figure 4.5 the results of the experiment with ss316 as the catalyst are
presented. The Figure is divided into two regions: without CO2 addition to the
feed (hatched area, time < 0 min) and with CO2 addition (time > 0 min). The
signals of 18 (H2O) and 28 gr./mol (CO) increase with increasing temperature
and the signals decrease again with decreasing temperature. After the
experiment, the color of the ss316-sample had changed to shining yellow with
some black spots.
The trend of the measured feed composition change is compared to the
calculated equilibrium data by scaling both results with equation 3 [27], where I
is the signal intensity of the MS or the calculated equilibrium concentration.
KTKT
KTT
II
II
773873
773
==
=
−
− (3)

85
-10 0 10 20 30 40 50 601E-3
0.01
0.1
1
10
Nor
mal
ized
det
ecto
r re
spon
s
Time (min)
moleculair weight in gram/mol 2 (H
2) 18 (H
2O)
28 (CO) 44 (CO2)
Temperature (K)400
500
600
700
800
900
Tem
pera
ture
(K
)
Figure 4.5 - Sample temperature and mass spectrum signals measured after the feed passed the ss316 sample. The temperature of the sample as a function of time is depicted at the right hand axis, the composition change is given at the left hand axis by the detector signal of the MS, normalized to the helium signal. Feed composition: t<0 min. 20 vol.% H2 and 80 vol.% He, t > 0 min. 20 vol.% CO2, 20 vol.% H2 and 60 vol.% He.
Figure 4.6 clearly demonstrates that the temperature dependency of the CO
and H2O formation is consistent with the equilibrium calculations. At higher
temperatures more CO and H2O are formed and less CO2 and H2 are present in
the gas mixture. Therefore, we conclude that if CO2 and H2 are present, the
formation of H2O and CO will occur during the permeation experiments. In
retrospect the interpretation of the results would have been simpler if no
stainless steel parts had been applied in the experimental setup.

86
773 798 823 848 873
-1.0
-0.5
0.0
0.5
1.0
Sca
led
com
posi
tion
(-)
Temperature (K)
CO2-MS CO
2 calc. equil.
H2-MS CO calc. equil.
CO-MS H
2O-MS
Figure 4.6 - Mass Spectrometer results of catalytic activity of ss316 sample compared to thermodynamic equilibrium calculations (scaled according to eq.3). Gas feed composition was 20 vol.% H2, 20 vol.% CO2 and 60 vol.% He.
4.4.2 Steam influence on the H2 permeation
In Figure 4.7, the influence of steam on the permeation behaviour of membrane
Pd-1 is given as a function of time at three temperatures: 623, 673 and 723 K.
In the graph the permeation is given before, during and after feeding the
membrane with the steam mixture.
These three stages are represented by first the hatched area, then the area
from the hatched area until the corresponding vertical line, at 48, 39, and 60
hours, respectively (line style is equal to the corresponding data), and finally the
area after the vertical line. Directly after the start of the steam addition, a sharp
decrease in flux can be observed at all three temperatures. It is assumed that
H2O adsorbs at the Pd surface causing a reduction in the number of active sites
where H2 dissociates into hydrogen atoms. The reduction in available active
sites leads to a reduction of the H2 flux.

87
Figure 4.7 - Effect of steam on the H2 flux at 623, 673, and 723 K for the Pd-1 membrane. The steam and H2 concentrations in the feed were 20 vol.%. Exceptions are: the measurement at 723 K from 0 to 14 hours the steam concentration was 30 vol.% and the measurement at 623 K from 59 to 63 hours the H2 concentration was 10 vol.%.
After the sharp initial drop, the flux gradually rises in all series. At higher
temperatures this occurs at a higher rate, which suggests a chemical reaction to
be responsible. Most likely the initial number of active sites is reduced by
carbon contaminations, which could have come from the Pd bulk or from
carbon-rich compounds present in the feed that are deposited on the Pd
surface.
Steam may remove the contaminants from the Pd surface by the following
reaction: H2O + C � CO + H2. The formed CO can also reduce the number of
active sites; the effect will be small since Li et al. [14] reported that CO has a
smaller inhibitive effect than steam. At all 3 temperatures the hydrogen flux is
larger after the steam treatment than before. The initial flux at 723 K is lower
than the flux at 673 K because the membrane has undergone a more intensive
steam cleaning prior to the measurement at 673 K.
-20 0 20 40 60 80 100 1200.00
0.25
0.50
0.75
1.00
1.25F
lux
(mol
H2 /
m2 ·
s)
Time (hours)
723 K 673 K 623 K

88
After stopping the steam addition, the H2 flux increases sharply and then levels
off to a stable flux after 10 to 20 hours. The time required for stabilization is
needed to remove all the water that remains in the feed tubes. This is confirmed
by a permeation experiment in which the remaining water was removed from
the feed tube, leading to a much shorter time to reach a stable flux.
After reaching the stable flux, measurements with varying H2 concentration
show that diffusion of H-atoms through the membrane is the rate determining
mechanism [8]. Before the first steam addition, the flux is not limited by the
diffusion through the membrane [28] and it is likely that the membrane surface
has been contaminated or has not been activated properly. It can be concluded
that H2O cleans the Pd surface and it makes the surface more active for H2
dissociation and association. This supports the idea proposed in the previous
paragraph that surface contamination can be removed by the addition of steam.
4.4.3 CO2 influence on the H2 permeation
Permeation experiments with the Pd-1 membrane and at a feed composition of
20 vol.% H2 and 20 vol.% CO2 show a significant reduction in H2 flux compared
to the flux before CO2 addition, as shown in Figure 4.8 (presentation of data is
the same as in Figure 4.7).
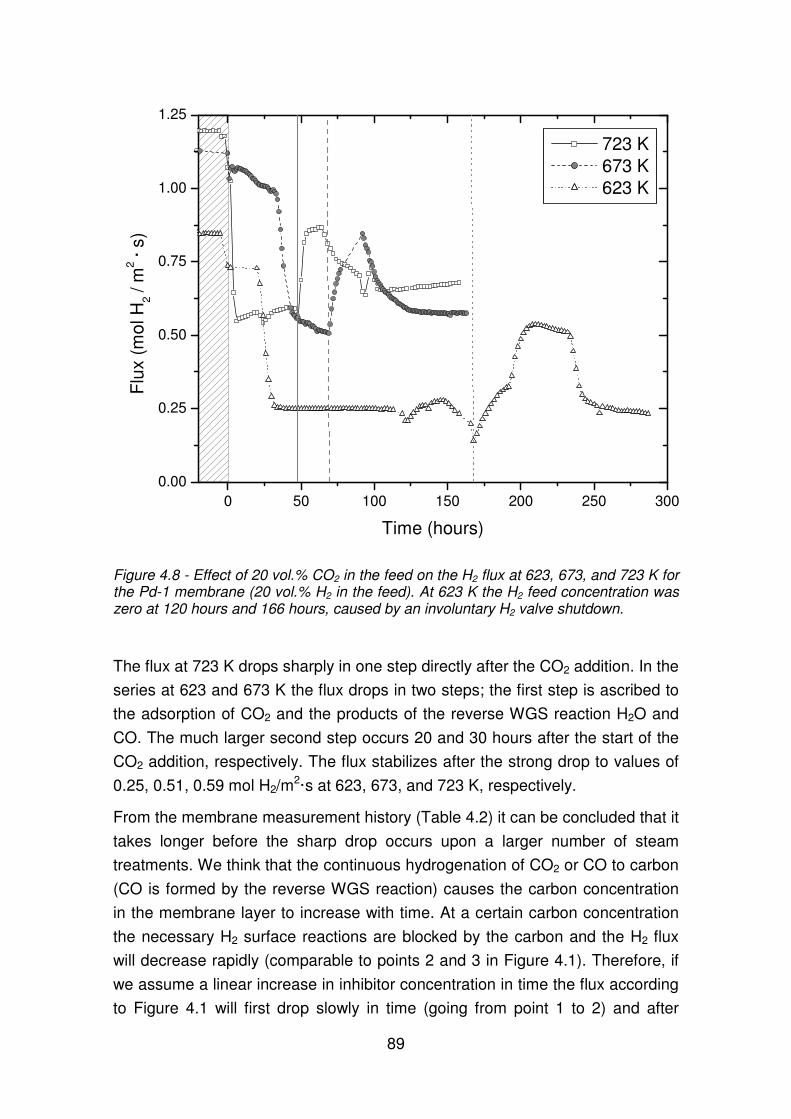
89
0 50 100 150 200 250 3000.00
0.25
0.50
0.75
1.00
1.25
Flu
x (m
ol H
2 / m
2 · s)
Time (hours)
723 K 673 K 623 K
Figure 4.8 - Effect of 20 vol.% CO2 in the feed on the H2 flux at 623, 673, and 723 K for the Pd-1 membrane (20 vol.% H2 in the feed). At 623 K the H2 feed concentration was zero at 120 hours and 166 hours, caused by an involuntary H2 valve shutdown.
The flux at 723 K drops sharply in one step directly after the CO2 addition. In the
series at 623 and 673 K the flux drops in two steps; the first step is ascribed to
the adsorption of CO2 and the products of the reverse WGS reaction H2O and
CO. The much larger second step occurs 20 and 30 hours after the start of the
CO2 addition, respectively. The flux stabilizes after the strong drop to values of
0.25, 0.51, 0.59 mol H2/m2·s at 623, 673, and 723 K, respectively.
From the membrane measurement history (Table 4.2) it can be concluded that it
takes longer before the sharp drop occurs upon a larger number of steam
treatments. We think that the continuous hydrogenation of CO2 or CO to carbon
(CO is formed by the reverse WGS reaction) causes the carbon concentration
in the membrane layer to increase with time. At a certain carbon concentration
the necessary H2 surface reactions are blocked by the carbon and the H2 flux
will decrease rapidly (comparable to points 2 and 3 in Figure 4.1). Therefore, if
we assume a linear increase in inhibitor concentration in time the flux according
to Figure 4.1 will first drop slowly in time (going from point 1 to 2) and after

90
reaching the line of surface limitation it decreases rapidly (going from point 2 to
3 in half of the time).
After stopping the CO2 addition the flux increases to a maximum value and
finally drops to a value comparable to the value measured during the CO2
addition (see Table 4.5). From Figure 4.8 it is clear that the slope of the flux
increase after disconnecting the CO2 is strongly temperature dependent, which
indicates that reactions – like the removal of carbon by the formation of
methane – determine the flux change.
During the H2-activation of a carbon contaminated 50 µm thick Pd membrane at
873 K, Jung et al. [29] have measured a doubling of the flux in approximately 10
hours, being of the same order of magnitude as in Figure 4.7 Due to the
thickness of the membranes the amount of carbon to be removed is much lower
in our case, but so are the temperatures. The large value of the time constant
excludes the diffusion of carbon in the membrane layer as explanation for this
effect. From the maximum solubility and the diffusivity [20, 21] of carbon in Pd,
a time constant of 60 seconds can be calculated to reach an almost
homogeneous carbon concentration starting from a carbon-free 1 µm thick Pd
layer. This also implies that carbon formed at one membrane surface will
contaminate the opposite surface.
Table 4.5 - Clean H2 flux and comparison of flux ratios as a result of steam and CO2 addition for the Pd-1 membrane.
Temperature (K)
Clean flux (mol H2/m
2·s)
Flux ratios (flux/clean flux) x 100%
With steam
With CO2
After stopping CO2 addition
Max. after stopping CO2 addition
623 0.8 30 31 30 68
673 1.1 43 45 55 77
723 1.2 50 42 50 67
723 1.25 52 44 52 68
723 1.25 64 - - -
The cause for the subsequent decrease in H2 flux in Figure 4.8 is not yet
understood. Possible explanations are the release of compounds from the
stainless steel tubing (e.g. metal carbonyls or CO) or a change in Pd-
morphology.

91
The influence of CO2 on the H2 flux has also been measured for a Pd/Ag
membrane and a second Pd membrane (Pd-2). In contrast to the Pd-1
membrane, the other membranes have not been treated with steam. The
measured fluxes at 673 K and a feed of 20 vol.% CO2 and 20 vol.% H2 are
given in Figure 4.9, also including the results of the Pd-1 membrane. The initial
fluxes of the three membranes are not equal; the flux of Pd-2 and Pd/Ag is 50%
and 20% of the Pd-1 flux, respectively. The lower fluxes are caused by the
difference in steam pretreatment and by segregation of Pd/Ag [30, 31].
0 50 100 150 2000.0
0.2
0.4
0.6
0.8
1.0
1.2
Flu
x (
mol
H2 /
m2 ·
s)
Time (hours)
Pd-1 Pd-2 PdAg
Figure 4.9 - Influence of 20 vol.% CO2 on the H2 flux of the Pd-1 and Pd-2 membrane, and Pd/Ag membranes at 673 K and 20 vol.% H2 in the feed. The Pd-2 and Pd/Ag membrane are not pretreated with steam.
The surface enrichment of Ag results in a lower availability of active sites for H2
dissociation, which will cause the flux to decrease if H2 surface reactions are
rate limiting. Directly after the start of the CO2 addition, the H2 flux of the Pd-2
and Pd/Ag membrane drops by a factor of 3 and 4, respectively. This single-
step drop is in accordance with the reasoning at the beginning of this section for
contaminated surfaces. In contrast to the behavior of the Pd-1 membrane, the

92
fluxes of the Pd-2 and Pd/Ag membrane increase again after this drop and
subsequently reach a stable value.
The increase of the flux can also be ascribed to the difference in pretreatment
and - in addition for the Pd/Ag membrane - to segregation. Carbon or carbon
compounds present at the membrane surface can be partially oxidized by CO2,
or by H2O from the reverse WGS reaction, which will increase the activity of the
Pd for the dissociation of H2 and association of H-atoms. Moreover, for the
Pd/Ag membrane the addition of CO2 may suppress or increase the preference
of Ag for the surface, which will lead to a change in the number of free Pd sites
for H2 dissociation. This flux increase does not occur for the Pd-1 membrane,
because contaminations are already removed by the steam pretreatment prior
to the measurement.
After stopping the CO2 addition, the H2 flux reaches a maximum - like for the
Pd-1 membrane - before reaching a stable value. The final fluxes of the two Pd
membranes are almost equal, but the final flux of the Pd/Ag membrane is much
lower. Remarkable is that the absolute difference between the stable and
maximum flux of the Pd/Ag membrane is much larger than the difference for the
two Pd membranes. This difference in behaviour of the Pd and Pd/Ag
membranes has been confirmed by applying a short 20 vol.% CO2 pulse to the
feed for 15 minutes (H2 concentration remains 20 vol.%). In Figure 4.10 the
measured fluxes are normalized by dividing the fluxes by the value of the flux
prior to applying the CO2 pulse. Both, the relative and absolute effect on the flux
are larger for the Pd/Ag membrane than for the Pd membrane. Segregation or
the change in catalytic properties of the Pd/Ag alloy for the H2 surface reactions
may have caused the larger effect on the flux for the Pd/Ag membrane.

93
-10 0 10 20 300.0
0.2
0.4
0.6
0.8
1.0
1.2
1.4
Flu
x / (
Flu
x @
mea
sure
men
t bef
ore
star
t pul
s)
Time (hours)
Pd-2 membrane PdAg membrane
Figure 4.10 - H2 flux response on 15 min. CO2 ‘pulse’ of 20 vol.% for a Pd and a Pd/Ag membrane (no steam pre-treatment). The H2 feed concentration and the temperature were 20 vol.% and 673 K, respectively. The absolute value of the initial flux of the Pd-2 and Pd/Ag membrane are 0.39 and 0.21 mol H2/m
2·s, respectively.
4.4.4 Comparison of the influence of H2O and CO2 on the H2 flux
In Figure 4.11 the influence of steam and CO2 on the flux are compared as a
function of the reciprocal temperature for the Pd-1 membrane. The fluxes found
after steam treatment are the highest and can be described by Sievert’s law
(called ‘Clean’ in legend). After stopping the CO2 treatment the flux increases
slightly but the stabilized flux remains affected by the CO2. The relative
influence of CO2 and H2O on the flux decreases with increasing temperature,
more strongly for H2O than for CO2.

94
1,35 1,40 1,45 1,50 1,55 1,600,0
0,2
0,4
0,6
0,8
1,0
1,2
1,4
Flu
x (
mol
H2
/ m2 ·
s)
1000/T (1/K)
Clean Steam CO2 After CO2 Max after CO2
740 720 700 680 660 640 620
Figure 4.11 - Comparison of the H2 fluxes of the Pd-1 membrane with 20 vol.% H2 / 80 vol.% He and with 20 vol.% CO2 or 20 vol.% H2O combined with 20 vol.% H2 / 60 vol.% He.
4.4.5 Comparison to literature
As mentioned in ‘Theoretical background and previous work’, most authors
have not measured any inhibitive effect of CO2 on the H2 permeability at
temperatures above 623K, because they used thick membranes. However, Hou
et al. [13] reported some effects using 5 µm membranes. In Figure 4.12 the
influences found of H2O and CO2 in this study are compared with the results
obtained by Hou et al. and by Li et al. [14] (including the influence of CO). The
effect of inhibition is expressed as the ratio of the H2 flux measured during
addition of the CO2, H2O or CO divided by the measured flux value before the
addition and is called ‘relative flux ratio’.
Compared to the permeation experiments with CO2 of Hou et al., a smaller
relative flux ratio has been measured. The difference can be attributed to a
number of reasons. These are: the higher CO2 feed concentration (2.4 to 6.0
times larger), the lower H2 feed concentration and the smaller membrane

95
thickness (5 to 10 times) in the present study. Moreover, the presence of a
porous support also affects the results.
Figure 4.12 - Comparison of the influence of CO2 and H2 on the H2 permeation found in this work with thicker hydrogen selective membranes [13, 14]. Different H2 feed concentrations were used in the permeation experiments by the authors: a) this work, 20 vol.% H2, Pd-1 membrane, thickness 0.9 µm, b) Hou et al. [13], besides the contaminant only H2 was present in the feed, membrane thickness 5-6 µm, c) Li et al. [14], besides the contaminant only H2 was present, membrane thickness 10 µm.
Compared to the supported side the Pd surface area is larger at the non-
supported side. If the flux is (partly) limited by H2 surface reactions at the non-
supported side, the additional surface area at this side may have a positive
effect on the H2 flux. In the present study this effect is absent since the
membrane is very thin compared to the openings in the silicon wafer (for the
Pd-membranes) or in the microsieve (for the Pd/Ag membrane). All these
differences result in an increased inhibitive effect, thus in a lower value of the
relative flux ratio in our case.
The effect of temperature on the relative flux ratio for H2O with Hou et al. and
our data agree: a decrease of inhibition with increasing temperature. This can
be ascribed to the reduction of water adsorption at the Pd surface with
increasing temperature. The trend in CO2 inhibition shows a slight increase with
500 550 600 650 700 7500.0
0.2
0.4
0.6
0.8
1.0
ra
tio H
2 F
lux w
ith H
2O/C
O2/ H
2 F
lux or
igin
al
Temperature (K)
H2O, 20 vol.% a CO
2, 20 vol.% a
H2O, 3.3 vol.% b CO
2, 7.4 vol.% b
H2O, 8.4 vol.% c CO, 5.8 vol.% b

96
temperature, which might be attributed to a competition between the speeds of
carbon deposition and the hydrogenation of carbon to methane.
The inhibitive effect found in this study for CO2 as well as H2O is larger than
reported by the other authors. The absolute value of the measured fluxes are
about the same in spite of the higher contaminant concentrations and lower H2
feed concentration in the experiments presented in this paper.
4.5 Conclusions
A clear influence on the H2 flux has been found for steam and CO2. After
stopping the steam addition, the limiting step of H2 permeation returns from
surface limited – due to H2O adsorption at the Pd surface – to a situation in
which permeation is purely controlled by diffusion through the membrane, so
steam has a cleaning effect on the membrane, but it has only a positive effect
on the hydrogen flux after its addition is stopped. Only a small part of the
inhibitive effect of CO2 is caused by the adsorption of CO and H2O, which are
formed by the reverse WGS reaction as was proven by separate experiments.
The largest inhibitive effect is ascribed to carbon deposition on the Pd or Pd/Ag
layer by the dehydrogenation of CO2 or CO. The slow rates of both, the carbon
forming and carbon removing reactions cause the large time constants found in
this study. Due to their thinness, well-defined surface area and absence of
pinholes, microsystem fabricated membranes are very suitable for inhibition
studies.

97
References
1) W.F. Baade, U.N. Parekh, and V.S. Raman, Hydrogen, Kirk-Othmer
Encyclopedia of Chemical Technology, John Wiley & Sons, Inc, 2001.
2) P. Häussinger, R. Lohmüller, and A.M. Watson, Hydrogen, Ullmann's
Encyclopedia of Industrial Chemistry, Wiley-VCH Verlag GmbH & Co. KGaA,
2000.
3) J. Shu, B.P.A. Grandjean, and S. Kaliaguine, Asymmetric Pd-
Ag/stainless steel catalytic membranes for methane steam reforming, Catal.
Today, 25 (1995) 327.
4) E. Kikuchi, S. Uemiya, N. Sato, H. Inoue, H. Ando, and T. Matsuda,
Membrane reactor using microporous glass-supported thin film of palladium.
Application to the water gas shift reaction, Chem. Lett., 3 (1989) 489.
5) S. Uemiya, N. Sato, H. Ando, T. Matsuda, and E. Kikuchi, Steam
reforming of methane in a hydrogen-permeable membrane reactor, Appl.Catal.,
67 (1991) 223.
6) A. Criscuoli, A. Basile, E. Drioli, and O. Loiacono, An economic feasibility
study for water gas shift membrane reactor, J. Membr. Sci., 181 (2001) 21.
7) F.C. Gielens, H.D. Tong, C.J.M. van Rijn, M.A.G. Vorstman, and J.T.F.
Keurentjes, High-flux palladium-silver alloy membranes fabricated by
microsystem technology, Desalination, 147 (2002) 417.
8) F.C. Gielens, H.D. Tong, M.A.G. Vorstman, and J.T.F. Keurentjes,
Measurement and modeling of hydrogen transport through high-flux Pd
membranes, J. Membr. Sci., 289 (2007) 15.
9) J. Chabot, J. Lecomte, C. Grumet, and J. Sannier, Fuel clean-up system:
poisoning of palladium-silver membranes by gaseous impurities, Fusion.
Technol., 14 (1988) 614.
10) T.L. Ward and T. Dao, Model of hydrogen permeation behavior in
palladium membranes, J. Membr. Sci., 153 (1999) 211.

98
11) M. Amano, C. Nishimura, and M. Komaki, Effects of high-concentration
carbon monoxide and carbon dioxide on hydrogen permeation through the
palladium membrane, Mater.Trans. JIM, 31 (1990) 404.
12) H. Yoshida, S. Konishi, and Y. Naruse, Effects of impurities on hydrogen
permeability through palladium alloy membranes at comparatively high
pressures and temperatures, J. Less-Common Met., 89 (1983) 429.
13) K. Hou and R. Hughes, The effect of external mass transfer, competitive
adsorption and coking on hydrogen permeation through thin Pd/Ag membranes,
J. Membr. Sci., 206 (2002) 119.
14) A. Li, W. Liang, and R. Hughes, The effect of carbon monoxide and
steam on the hydrogen permeability of a Pd/stainless steel membrane, J.
Membr. Sci., 165 (2000) 135.
15) A. Erdöhelyi, M. Pásztor, and F. Solymosi, Catalytic hydrogenation of
CO2 over supported palladium, J.Catal., 98 (1986) 166.
16) A.P. Gloor and R. Prins, Influence of chlorine and metal cation impurities
in the CO hydrogenation over Pd/SiO2 and Rh/SiO2, Recl.Trav.Chim.Pays-Bas,
113 (1994) 481.
17) B. Klötzer, W. Unterberger, and K. Hayek, Adsorption and hydrogenation
of CO on Pd(1 1 1) and Rh(1 1 1) modified by subsurface vanadium, Surf. Sci.,
532-535 (2003) 142.
18) T. Mori, H. Masuda, H. Imai, A. Miyamoto, R. Hasebe, and Y. Murakami,
Kinetics, isotope effects, and mechanism of the hydrogenation of carbon
monoxide on a supported palladium catalyst, J.Phys.Chem., 87 (1983) 3648.
19) V. Matolin, M. Rebholz, and N. Kruse, Defect-induced dissociation of CO
on palladium, Surf.Sci., 245 (1991) 233.
20) R.T. Yang, P.J. Goethel, J.M. Schwartz, and C.R.F. Lund, Solubility and
diffusivity of carbon in metals, J.Catal., 122 (1990) 211.
21) H. Yokoyama, H. Numakura, and M. Koiwa, The solubility and diffusion
of carbon in palladium, Acta Mater., 46 (1998) 2823.
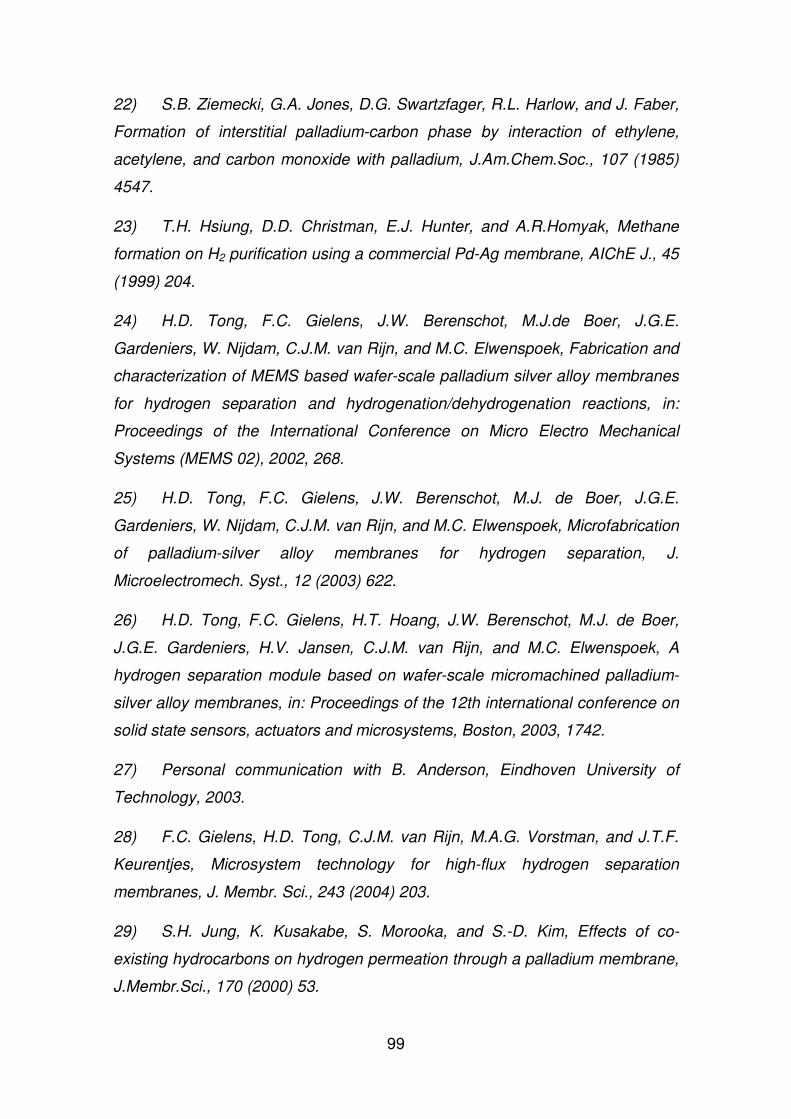
99
22) S.B. Ziemecki, G.A. Jones, D.G. Swartzfager, R.L. Harlow, and J. Faber,
Formation of interstitial palladium-carbon phase by interaction of ethylene,
acetylene, and carbon monoxide with palladium, J.Am.Chem.Soc., 107 (1985)
4547.
23) T.H. Hsiung, D.D. Christman, E.J. Hunter, and A.R.Homyak, Methane
formation on H2 purification using a commercial Pd-Ag membrane, AIChE J., 45
(1999) 204.
24) H.D. Tong, F.C. Gielens, J.W. Berenschot, M.J.de Boer, J.G.E.
Gardeniers, W. Nijdam, C.J.M. van Rijn, and M.C. Elwenspoek, Fabrication and
characterization of MEMS based wafer-scale palladium silver alloy membranes
for hydrogen separation and hydrogenation/dehydrogenation reactions, in:
Proceedings of the International Conference on Micro Electro Mechanical
Systems (MEMS 02), 2002, 268.
25) H.D. Tong, F.C. Gielens, J.W. Berenschot, M.J. de Boer, J.G.E.
Gardeniers, W. Nijdam, C.J.M. van Rijn, and M.C. Elwenspoek, Microfabrication
of palladium-silver alloy membranes for hydrogen separation, J.
Microelectromech. Syst., 12 (2003) 622.
26) H.D. Tong, F.C. Gielens, H.T. Hoang, J.W. Berenschot, M.J. de Boer,
J.G.E. Gardeniers, H.V. Jansen, C.J.M. van Rijn, and M.C. Elwenspoek, A
hydrogen separation module based on wafer-scale micromachined palladium-
silver alloy membranes, in: Proceedings of the 12th international conference on
solid state sensors, actuators and microsystems, Boston, 2003, 1742.
27) Personal communication with B. Anderson, Eindhoven University of
Technology, 2003.
28) F.C. Gielens, H.D. Tong, C.J.M. van Rijn, M.A.G. Vorstman, and J.T.F.
Keurentjes, Microsystem technology for high-flux hydrogen separation
membranes, J. Membr. Sci., 243 (2004) 203.
29) S.H. Jung, K. Kusakabe, S. Morooka, and S.-D. Kim, Effects of co-
existing hydrocarbons on hydrogen permeation through a palladium membrane,
J.Membr.Sci., 170 (2000) 53.

100
30) F.J. Kuijers and V. Ponec, The Surface Composition of Pd-Ag Alloys, J.
Catal., 60 (1979) 100.
31) J. Shu, B.E.W. Bogondo, B.P.A. Grandjean, A. Adnot, and S. Kaliaguine,
Surface segregation of Pd-Ag membranes upon hydrogen permeation, Surf.
Sci., 291 (1993) 129.

101
5 INFLUENCE OF METHANE, PROPANE AND
CARBON MONOXIDE ON THE HYDROGEN FLUX THROUGH THIN PD MEMBRANES
Abstract
In this chapter the effect of methane, propane and CO on the H2 permeation
behaviour of high-flux palladium (Pd) membranes is described. The
membranes, fabricated with microsystem technology (MEMS technology), are
0.5 µm thick. The thin membranes will reveal inhibitive effects more pronounced
than relatively thick membranes. The H2 flux through the membranes has been
studied with and without the addition of CO, methane or propane to the feed.
The measurements have been carried out at 623 and 723 K. After adding
propane or CO to the feed, the H2 flux reduces to 16% and 47% of the initial
flux, respectively. Subsequently, the H2 flux could be restored to its original
value by treating the membrane with steam. The inhibitive effect of propane and
CO is probably caused by the formation of carbon at the Pd surface. The
addition of methane did not reveal any effect on the H2 flux.
This chapter is based on: F.C. Gielens, H. D. Tong, M.A.G. Vorstman and J.T.F. Keurentjes, Influence of methane, propane and carbon monoxide on the hydrogen flux through thin Pd membranes, to be submitted.

102
5.1 Introduction
The increased interest into hydrogen as a main energy carrier has resulted in a
burst of research papers in the fields of hydrogen production, fuel cells and
hydrogen separation membranes. The work on hydrogen separation
membranes is mainly focused on increasing the H2 flux by decreasing the
membrane thickness or by the search for better permeable materials than
palladium (Pd). Many of the developed high flux membranes are thin Pd layers
deposited on top of a porous support. The reduced membrane thickness results
in higher fluxes but a further flux increase is limited by the additional mass
transfer resistance over the porous support.
The introduction of microsystem technology in the membrane production
process allows the manufacturing of ultra-thin Pd or Pd alloy membranes
without or almost without any support. In this way, high fluxes are obtained as
shown in previous work [1, 2]. However, the H2 permeation of the membranes is
most often determined under ideal conditions that do not represent the process
conditions of a typical application very well. In applications like the production of
syngas or (de)hydrogenation reactions, gasses like hydrocarbons, CO, CO2 and
steam can be present in the membrane feed. Therefore, the H2 permeation
needs to be determined in the presence of those gasses. In a previous study
[3], a negative effect of the presence of steam or CO2 in the membrane feed on
the H2 permeation behaviour of the microsystem fabricated Pd membranes has
been found. The aim of the present paper is to extend the previous study with
the effects of CO, methane, and propane in the membrane feed.
5.2 Experimental
5.2.1 Membrane and module description
A short description of the fabrication process of the membranes will be given
here, a more detailed description is given in previous work [4, 5]. Apertures
were created in a silicon wafer by wet etching the silicon away until a 0.3 micron
thick SiO2 protection layer was reached at the outer surface of the silicon wafer.
At the other side of the SiO2 layer, a layer of low stress silicon rich nitride with
circular openings of 5 µm, a so called microsieve, was present to strengthen the
SiO2 layer. After sputtering a 0.5 µm thick pinhole-free Pd layer at the inside of

103
the apertures, the SiO2 layer was removed from the microsieve openings to free
the membrane.
For the present work two identical membranes were prepared, Pd-1 and Pd-2,
with a free membrane area of 3.3 mm2 each. The measured fluxes are based
on this membrane area. Pd-1 was placed in a stainless steel module. A leak-
tight seal was obtained by using two graphite rings between the silicon and the
stainless steel plates. Pd-2 was placed between two glass plates which
improved the mechanical strength of the wafer. More details were given in by
Gielens et al. [2]. Photographs of the two membranes are shown in Figure 5.1.
Figure 5.1 - Photographs of Pd-1 module without glass (A) and the glass packaged Pd-2 membrane module (B).
5.2.2 Membrane permeation
The H2 permeance and selectivity of the membranes were determined in two
slightly different setups. A schematic view of both setups is given in Figure 5.2.
Pd-1 was measured in setup 1 and Pd-2 in setup 2. Setup 1 was equipped with
an ordinary oven, mass flow controllers that could be varied between 100 and
1000 mL/min, and a micro gas chromatograph (Varian CP4900) equipped with
a molsieve 5Å column and a thermal conductivity detector (TCD). The micro
gas chromatograph was able to measure 0.001 vol.% He in N2 during the
permeance measurements. Setup 2 was equipped with a tunnel oven, mass
flow controllers that could be varied between 10 and 100 mL/min, and an
ordinary gas chromatograph equipped with a molsieve 5Å column and a TCD.
With this gas chromatograph 0.1 vol.% He in N2 could be measured. A more
extensive description of experimental setup 1 is given by Gielens et al. [3].

104
After placing the membrane module in the experimental setup, the absence of
pinholes was determined by applying pure He and N2 at the retentate and
permeate side, respectively. A positive trans-membrane pressure was applied
and the permeate was checked on the presence of He. Thereafter, the oven
was heated at a rate of 3 K/min to the chosen activation temperature.
After the activation temperature was reached the membrane was activated with
a 20/80 vol.% hydrogen/helium mixture at both membrane sides followed by an
activation with a 20/20/60 vol.% steam/hydrogen/helium mixture at the retentate
side and N2 at the permeate side. During the H2 permeance measurements the
H2 concentration in the feed was always kept at 20 vol.% by adapting the
helium flow in the feed if contaminant gasses were added.
The permeate side was flushed by a fixed N2 flow. The influence of methane on
the H2 permeance was determined at methane concentrations up to 80%. The
influences of propane and CO were determined at concentrations of 20 and 5
vol.%, respectively. One experiment was carried out with 20/20/20/60 vol.%
CH4/CO2/H2/He at temperatures between 623 to 723 K.
The other experiments were carried out at 623 K or 723 K. The membrane was
reactivated with steam after a measurement with CO, methane or propane. The
measurement histories of the membranes are summarized in Table 5.1 and
Table 5.2. The measured H2 fluxes were corrected for the possible formation of
pin-holes in the membrane layer upon operation by estimating the H2 flow
through the pinholes from the He concentration in the permeate assuming
Knudsen diffusion.
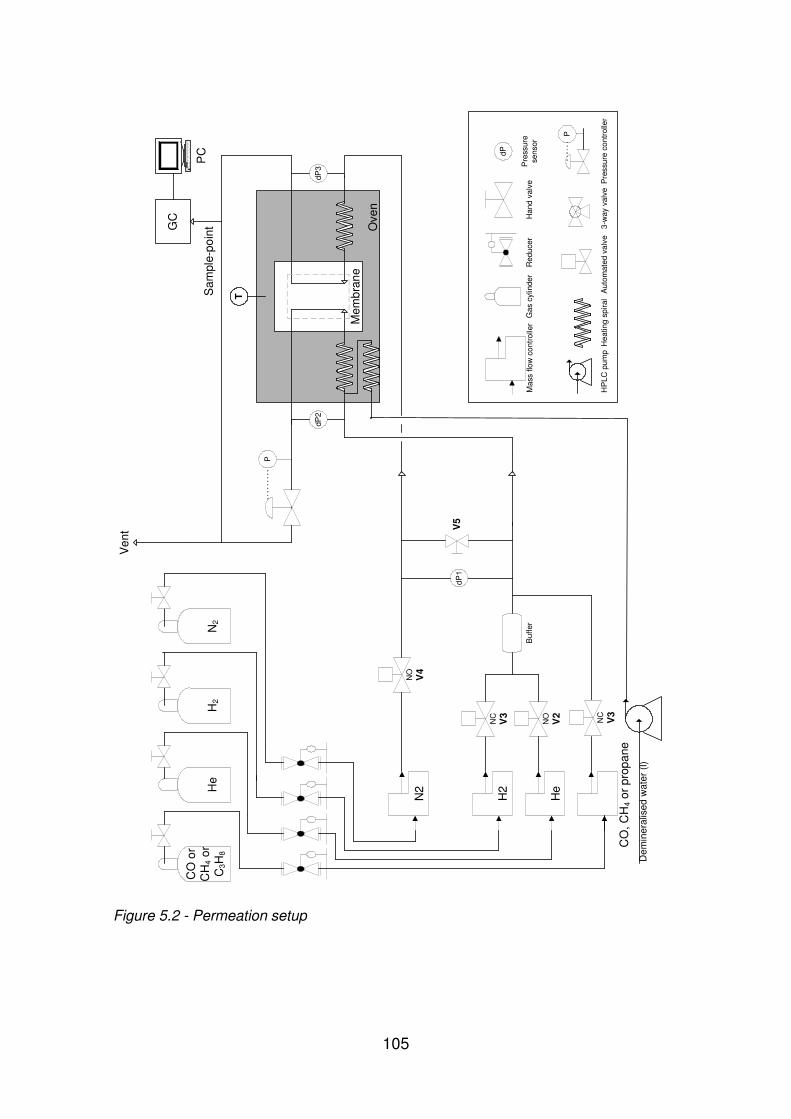
105
Figure 5.2 - Permeation setup
NO
V2
CO
or
CH
4 or
C3H
8H
2N
2
Han
d va
lve
Gas
cyl
inde
r
PC
N2
Mas
s flo
w c
ontr
olle
rR
educ
er
H2
He
CO
, CH
4 or
pro
pane
NO
V4
NC
V3
Buf
fer
dP2
dP3
GC
Mem
bran
e
Ove
n
Hea
ting
spira
lA
utom
ated
val
ve
dP1
V5
P
Sam
ple-
poin
tH
e
Ven
t
3-w
ay v
alve
dP
Pre
ssur
e se
nsor
T
Dem
iner
alis
ed w
ater
(l)
Pre
ssur
e co
ntro
ller
P
HP
LC p
ump
NC
V3
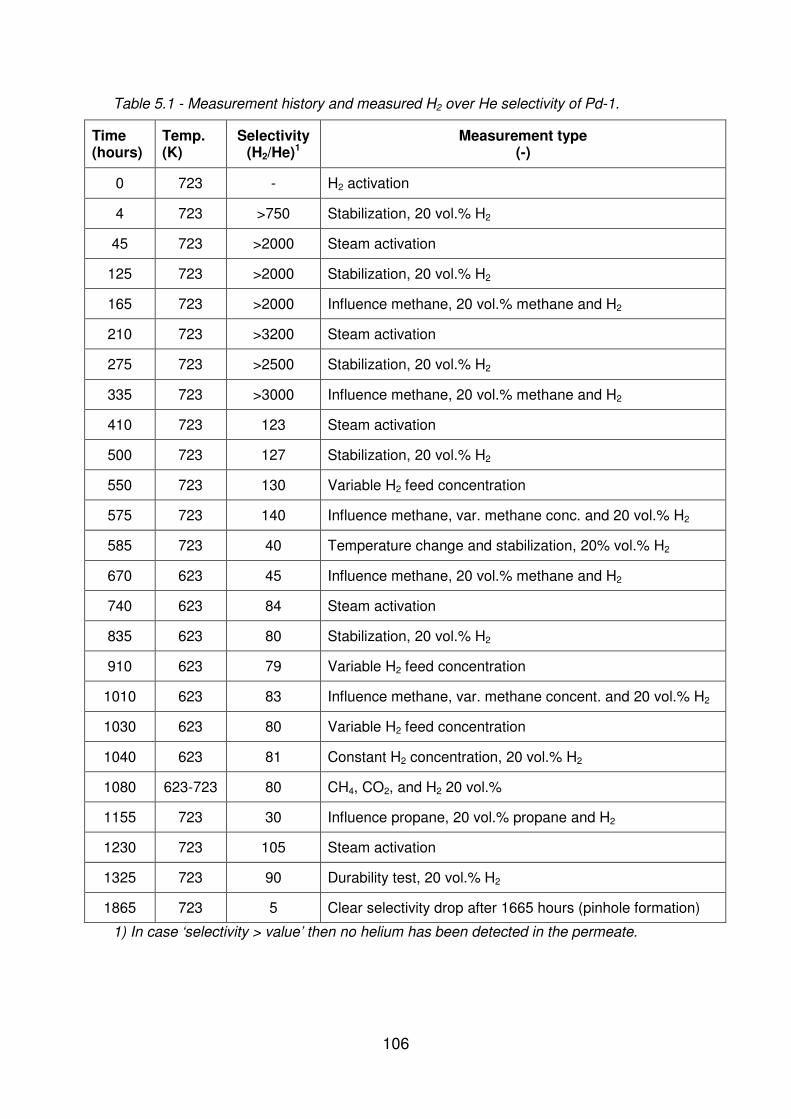
106
Table 5.1 - Measurement history and measured H2 over He selectivity of Pd-1.
Time (hours)
Temp. (K)
Selectivity (H2/He)1
Measurement type (-)
0 723 - H2 activation
4 723 >750 Stabilization, 20 vol.% H2
45 723 >2000 Steam activation
125 723 >2000 Stabilization, 20 vol.% H2
165 723 >2000 Influence methane, 20 vol.% methane and H2
210 723 >3200 Steam activation
275 723 >2500 Stabilization, 20 vol.% H2
335 723 >3000 Influence methane, 20 vol.% methane and H2
410 723 123 Steam activation
500 723 127 Stabilization, 20 vol.% H2
550 723 130 Variable H2 feed concentration
575 723 140 Influence methane, var. methane conc. and 20 vol.% H2
585 723 40 Temperature change and stabilization, 20% vol.% H2
670 623 45 Influence methane, 20 vol.% methane and H2
740 623 84 Steam activation
835 623 80 Stabilization, 20 vol.% H2
910 623 79 Variable H2 feed concentration
1010 623 83 Influence methane, var. methane concent. and 20 vol.% H2
1030 623 80 Variable H2 feed concentration
1040 623 81 Constant H2 concentration, 20 vol.% H2
1080 623-723 80 CH4, CO2, and H2 20 vol.%
1155 723 30 Influence propane, 20 vol.% propane and H2
1230 723 105 Steam activation
1325 723 90 Durability test, 20 vol.% H2
1865 723 5 Clear selectivity drop after 1665 hours (pinhole formation)
1) In case ‘selectivity > value’ then no helium has been detected in the permeate.

107
Table 5.2 - Measurement history and measured H2 over He selectivity of Pd-2.
Time (hours)
Temp. (K)
Selectivity (H2/He)1
Measurement type (-)
0 723 - H2 activation
22 723 >50 Steam activation
67 723 >60 Stabilization, 20 vol.% H2
120 723 >25 Influence CO, 5 vol.% CO and 20 vol.% H2
190 723 >60 Steam activation
260 723 >60 Stabilization, 20 vol.% H2
285 723 >60 Variable H2 feed concentration
293 723 >45 Influence CO, 5 vol.% CO and 20 vol.% H2
365 723 >70 Steam activation
455 723 >80 Stabilization, 20 vol.% H2
550 723 >70 Variable H2 feed concentration
575 723 >65 Influence CO, 5 vol.% CO and 20 vol.% H2
690 723 1) In case ‘selectivity > value’ then no helium has been detected in the permeate.
5.3 Results and discussion
5.3.1 Methane and propane influence on H2 permeation
The influence of methane on the permeation of H2 as a function of the methane
concentration in the membrane feed at 623 and 723 K is given in Figure 5.3. At
both temperatures methane has been added to the feed for approximately 10
hours. In this graph, two points are given at 0 vol.% methane in the feed for
each temperature. The point indicated with ‘1st’ in the figure is the H2 flux
before methane is added to the feed and the one indicated with ‘Last’ is the H2
flux at the end of the experiment. During these 10 hours of H2 permeation in the
presence of CH4 no reduction in H2 flux was observed. At 623 K the H2 flux is
limited by the H2 surface reactions at the retentate side [2]. Therefore, if CH4
contaminates the Pd surface, the H2 flux would decrease. Since no decrease in
the H2 flux is found, it can be concluded that CH4 does not contaminate the Pd
surface.

108
0,0 0,2 0,4 0,6 0,8 1,00,0
0,2
0,4
0,6
0,8
Last
1st
Last
1st
20 vol.% H2
0 - 80 vol.% He
Flu
x (m
ol H
2 / m
2 · s
)
Volume fraction CH4 (ml/ml)
723 K 623 K
Figure 5.3 - Effect of CH4 on the H2 flux at 623 and 723 K for the Pd-1 membrane. The H2 concentrations was kept at 20 vol.% in the feed and the CH4 concentration was varied from 0 to 80 vol.% by adjusting the He flow rate. During the first and last measurement the methane concentration in the feed was zero.
The influence of 20 vol.% propane on the permeation behaviour of membrane
Pd-1 versus time is given in Figure 5.4. Figure 5.4 is divided into two regions:
before propane addition to the feed (hatched area, time < 0 hours) and with
propane addition (time > 0 hours). Directly after the start of the propane
addition, the flux decreases sharply. It is assumed that propane adsorbs at the
Pd surface at the retentate side, resulting in a decrease of the number of
available sites where H2 dissociates into hydrogen atoms. After the sharp initial
drop, the flux gradually further decreases and seems to stabilize at a new
stationary value.
However, after about 20 hours the flux starts to decline faster and at around 30
hours the flux again stabilizes at a new stationary value. This flux behaviour
suggests that at least two processes are occurring after the adsorption of
propane at the Pd surface. Firstly, carbon will be formed at the Pd surface as a
result of coking of the propane. The formed carbon decreases the number of
active sites for the dissociation reaction of H2. Secondly, the carbon will diffuse

109
into the Pd (which will have an effect on the diffusion and solubility of hydrogen
in Pd) and can deactivate the active sites for the hydrogen association reaction
at the permeate side. It seems plausible to assume that after 15 hours the
influence of the second process on the H2 flux starts to become visible.
0 10 20 30 40 50 600.0
0.2
0.4
0.6
0.8
Flu
x (m
ol H
2 / m
2 · s)
Time (hours)
H2 Flux
H2 Flux before propane addition
Figure 5.4 - Effect of propane on the H2 flux at 723 K for the Pd-1 membrane. Feed 20 vol.% H2, 0 or 20 vol.% propane, 60 or 80 vol.% He.
After 60 hours adding propane to the feed, the H2 flux has dropped to 16% of
the initial flux. At the end of the experiment (not shown in Figure 5.4) the
propane concentration has been increased to 60 vol.% with a H2 concentration
of 20 vol.% by adapting the He concentration accordingly. However, the H2 flux
did not change as a result of the concentration increase of propane. After steam
treatment, the H2 flux could be restored to the value before the propane
addition.
5.3.2 Carbon monoxide influence on H2 permeation
The results of three permeation experiments at 723 K with the addition of 5
vol.% CO to the feed of the Pd-2 membrane are given in Figure 5.5. The three
data series in Figure 5.5 are presented in the same layout as in Figure 5.4. The
moment that CO addition is stopped for series one and two is indicated by the

110
vertical line at 44 hours and for series 3 by the dashed vertical line at 69 hours.
The preceding activation steps are different for the three series; the first series
is measured after a H2-activation step, the second after a steam activation step,
and the last series after a second steam activation step. From Figure 5.5 it is
clear that the H2 activation step is less effective than the steam activation and
that the steam activation restored the fluxes after contamination. All three series
do show a fast decline in flux after the start of adding CO to the feed. This is
ascribed to the adsorption of CO on the retentate Pd surface.
0 10 20 30 40 50 60 70 80 90 1000.00
0.05
0.10
0.15
0.20
0.25
0.30
Flu
x (m
ol H
2 / m
2 · s)
Time (hours)
series 1 series 2 series 3
Figure 5.5 - Influence of CO on the H2 flux of the Pd membrane membranes at 723K.
The observed effect of CO addition on the H2 flux is for series 1 most
pronounced, followed by series 2 and 3. This difference can be ascribed to the
difference in availability of active sites necessary to dissociate/associate
hydrogen into atoms/molecules. In the diffusion limited region or in the transition
region from diffusion limited to surface reaction limited, surface contamination
will hardly affect the flux in contrast to the situation that the membrane is
operated in the surface-reaction limited region [3]. In the latter case any
increase in surface contamination will lead to a serious decrease in available
free sites on the surface and hence to a serious decrease in flux.

111
After the fast initial decline a flux increase is visible for series 3 with a peak
around 6 hours. Kulprathipanja et al. [6] have shown that as a result of the
presence of CO or CO2, a restructuring of the Pd surface will take place for a
Pd/Cu membrane, leading to a higher flux and eventually to the formation of
pinholes. As a result of the surface restructuring caused by passing air over the
membrane at 500 K a surface increase of 30% was found for a Pd membrane
by Roa et al. [7], which is in the same range as the flux increase for series 3.
However, our series 2 shows a smaller increase and series 1 does not show the
increase at all.
It should also be noted that the flux of series 1 is relatively stable after 15 hours,
whereas the fluxes of series 2 and 3 are not yet stabilized after 44 and 69
hours, respectively. The obtained fluxes at these moments are 26%, 59% and
47% of the H2 flux before CO addition, respectively.
After stopping the CO addition, for series 2 and 3 the H2 flux increases to a
maximum value and finally drops to a value lower than the original flux before
CO addition. This behaviour has also been found for permeation experiments
with CO2 addition to the feed as shown in Figure 5.6 [3]. In Figure 5.6 the two
flux responses after CO or CO2 addition are compared for membranes activated
with steam. The thickness of the membrane used in the CO measurement is
half the thickness of the membrane used in the CO2 measurement. The
measured fluxes are normalized with respect to the initial flux to exclude the
effect of different initial fluxes (flux prior to the CO or CO2 addition, are 0.2 and
1.2 mol H2/m2 s, respectively).
A strong temperature dependency is found for the flux increase after
disconnecting the CO2 [3], which indicates that reactions – like the removal of
carbon by the formation of methane – determine the flux change. The same
explanation holds for the observed flux increase after disconnecting the CO.
The cause for the subsequent decrease is ascribed to the release of
contaminants from the stainless tubing or to a change in Pd-morphology.

112
0 10 20 30 40 50 60 70 80 900.00
0.25
0.50
0.75
1.00
1.25
1.50
ratio
Flu
x / F
lux
befo
re a
dditi
on o
f CO
or
CO
2
Time (hours)
CO series CO
2 series
Figure 5.6 - Normalised H2 flux response after CO or CO2 addition to the membrane feed at 723 K.
5.3.3 Selectivity
Table 5.1 and Table 5.2 show the selectivity of H2 over He at the end of each
permeation measurement. At the start of the measurement of Pd-1 and Pd-2 no
He has been detected. The large difference found in the selectivities of Pd-1
and Pd-2 is mainly caused by the difference in detection limit of the two gas
chromatographs used (the micro gas chromatograph is a factor of 100 more
sensitive to He than the other gas chromatograph).
After more than 410 hours of operation the H2/He selectivity of the Pd-1
membrane drops suddenly to 123. At this point, a pin-hole has been formed, as
shown in a previous paper [2]. Subsequently, the selectivity varies but this effect
is caused by the variation in the H2 flux; i.e. the He flux is constant. After 1865
hours of operation and many variations in operational conditions (see Table 5.1)
the selectivity drops fast to a value of 5. For the Pd-2 membrane no He has
been detected in the permeate during all measurements.

113
5.4 Comparison with literature
Several studies have been conducted to investigate the influence of CO,
methane and propane on the H2 flux through Pd membranes. In Table 5.3 the
results of some of these studies are summarized in combination with the results
obtained in the present work. Most authors found equal trends as presented
here. Most differences can be explained by the difference in membrane
thickness in combination with the used operating temperature. The combination
of membrane thickness and operating temperature determine which transport
step is the rate limiting step for hydrogen transport. In this work the transport
rate is limited by surface reactions.
Therefore, any contamination would directly affect the H2 flux. In case the rate
limiting step is the hydrogen diffusion through the membrane, the membrane
surface could become contaminated without any effect on the H2 flux as can be
seen from the results of Jung et al. [8] for propane and Chabot et al. [9] for CO.
The above explanation does not hold for the H2 flux reduction found for
methane by Chen et al. [10] and the cause for the difference remains unclear.
The membrane thickness (700 micron) and operating temperatures applied
suggest that the rate limiting step of the H2 transport is diffusion through the
membrane. This implies that a severe surface contamination reduced the H2
flux or methane influenced the hydrogen diffusion coefficient negatively, while
this was not found by the other authors.

114
Table 5.3 - Effect of CH4, CO, and CO2 on the H2-flux found in the present work and literature.
Literature Component Temperature Membrane
thickness
Ratio H2
Fluxcontaminated/
Fluxclean
(-) (-) (K) (µµµµm) (-)
This paper CH4 (20-80 vol.%) 623 0.5 (Pd) 1
723 1
Jung et al. [8] CH4 (50 vol.%) 623 - 873 50 (Pd) 1
Chen et al. [10] CH4 (10 vol.%) 523 700 (Pd) 0.89
573 0.91
623 0.92
673 0.94
723 0.95
This paper C3H8 (20 vol.%) 723 0.5 (Pd) 0.16
Jung et al. [8] C3H8 (50 vol.%) 623 - 873 50 (Pd) 1
This paper CO (5 vol.%) 723 0.5 0.26, 0.59, 0.47
Hou et al. [11] CO (5.8 vol.%) 550 5-6 (Pd) 0.52
600 0.80
673 0.91
723 0.92
Li et al. [12] CO (12 vol.%) 653 10 (Pd) 0.78
Chabot et al. [9] CO (9.5 vol.%) 573-723 250 (Pd/Ag) No practical effect
< 573 Fast decrease

115
5.5 Conclusions
The influence of adding CH4, propane and CO to the membrane feed of a H2-
selective Pd membrane has been studied. In the temperature range of 623 –
723 K the rate limiting step for H2 transport through the 0.5 micron thick
membrane is the dissociative H2 adsorption at the retentate side, which makes
the membrane rather sensitive for surface contamination.
Methane has been fed to the membrane up to 80 vol.% and for more than 10
hours during which no decline in H2 flux has been observed. It can therefore be
concluded that methane does not contaminate the Pd membrane.
Propane and CO affect the H2 flux negatively at 723 K; propane more strongly
than CO. The time necessary to stabilize the contaminating effect of propane
and CO is relatively large. The dynamic behaviour of the H2 flux is not
completely understood but in the case of CO the dynamic permeation behaviour
is comparable to that of adding CO2 to the membrane feed. After operation with
propane or CO the original H2 flux could be restored by re-activating the
membrane with steam.

116
References
1) F.C. Gielens, H.D. Tong, C.J.M. van Rijn, M.A.G. Vorstman, and
J.T.F.Keurentjes, Microsystem technology for high-flux hydrogen separation
membranes, J. Membr. Sci., 243 (2004) 203.
2) F.C. Gielens, H.D. Tong, M.A.G. Vorstman, and J.T.F .Keurentjes,
Measurement and modelling of hydrogen transport through high-flux Pd
membranes,J. Membr. Sci., 289 (2007) 15.
3) F.C. Gielens, R.J.J. Knibbeler, P.F.J. Duysinx, H.D. Tong,
M.A.G.Vorstman, and J.T.F.Keurentjes, Influence of steam and CO2 on the H2
flux through thin Pd/Ag and Pd membranes, J.Membr.Sci., 279 (2006) 176.
4) H.D. Tong, F.C. Gielens, J.W. Berenschot, M.J. de Boer, J.G.E.
Gardeniers, W. Nijdam, C.J.M. van Rijn, and M.C. Elwenspoek, Microfabrication
of palladium-silver alloy membranes for hydrogen separation, J.
Microelectromech. Syst., 12 (2003) 622.
5) H.D. Tong, F.C. Gielens, J.G.E. Gardeniers, H.V. Jansen, W. Nijdam,
C.J.M. van Rijn, and M.C. Elwenspoek, Microsieve supporting palladium-silver
alloy membrane and application to hydrogen separation, J. Microelectromech.
Syst., 14 (2005) 113.
6) A. Kulprathipanja, G.O. Alptekin, J.L. Falconer, and J.D. Way, Effects of
water gas shift gases on Pd-Cu alloy membrane surface morphology and
separation properties, Ind.Eng.Chem.Res., 43 (2004) 4188.
7) F. Roa and J.D. Way, The effect of air exposure on palladium-copper
composite membranes, Appl.Surf.Sci., 240 (2005) 85.
8) S.H. Jung, K. Kusakabe, S. Morooka, and S.-D. Kim, Effects of co-
existing hydrocarbons on hydrogen permeation through a palladium membrane,
J.Membr.Sci., 170 (2000) 53.

117
9) J. Chabot, J. Lecomte, C .Grumet, and J. Sannier, Fuel clean-up system:
poisoning of palladium-silver membranes by gaseous impurities, Fusion.
Technol., 14 (1988) 614.
10) F.L. Chen, Y. Kinari, F. Sakamoto, Y. Nakayama, and Y. Sakamoto,
Hydrogen permeation through palladium-based alloy membranes in mixtures of
10% methane and ethylene in the hydrogen, Int. J. Hydrogen Energy, 21 (1996)
555.
11) K. Hou and R. Hughes, The effect of external mass transfer, competitive
adsorption and coking on hydrogen permeation through thin Pd/Ag membranes,
J. Membr. Sci., 206 (2002) 119.
12) A. Li, W. Liang, and R. Hughes, The effect of carbon monoxide and
steam on the hydrogen permeability of a Pd/stainless steel membrane, J.
Membr. Sci., 165 (2000) 135.

118

119
6 MODULE DESIGN FOR A SINGLE WAFER H2-
SELECTIVE HIGH FLUX MEMBRANE BY USING COMPUTATIONAL FLUID DYNAMICS
Abstract
At elevated temperatures the flux of thin hydrogen selective membranes can be
limited by the transport resistance in the gas phase. To investigate the
possibilities to optimize mass transport in the gas phase, Computational Fluid
Dynamics (CFD) calculations have been used to model the flow in the gas
phase surrounding the membrane. The results of the calculations demonstrate
that the largest mass transfer resistance should be chosen at the retentate side
(30% higher flux, 58% reduction in mass transfer resistance compared to the
case with the highest mass transfer resistance at the permeate side). Forcing
the feed through slits reduces the mass transfer resistance significantly (43%
reduction, 25% higher flux) at the cost of additional pressure drop (from 0.1 to
14.3 kPa). A three dimensional structure of the membrane increases the H2
throughput per wafer by 255 % without forced flow. By using a forced flow,
even higher values can be obtained.

120
6.1 Introduction
To reach the full potential of high-flux H2 selective thin palladium membranes [1]
it is necessary to prevent concentration polarization near the membrane
surface. A study has been made to investigate the different options to reduce
concentration polarization with a limited increase in pressure drop. For this
study a three-dimensional model of the membrane module has been developed
using Computational Fluid Dynamics (CFD). The CFD package used is Ansys
CFX4.2, capable to compute gas flows through complex geometries. It solves
the transport equations for mass, momentum and species for an arbitrary
geometry. In the next sections, first the model is described (geometry,
membrane model, density and fluid properties), followed by the design of a flat
membrane (2D). Finally, the design of a three dimensional membrane structure
will be presented.
6.2 Model
The membrane module and the slit etched in the silicon wafer, as described in
previous work [1-3] and shown in Figure 6.1 and Figure 6.2, are translated in
the model into a geometry (domain) as shown in Figure 6.3. The geometry of
the slit is relatively complex, as a result of the KOH etching (KOH only etches
the silicon in the < 1 1 1 > plane). The geometry is too complex to model the
complete module, but by using adequate boundary conditions, it is possible to
obtain a good approximation. Three boundary conditions are applied at the
domain:
• The inlet is defined as a Diriclet boundary condition (fixed values of
parameters are set at the boundary condition).
• The outlet is defined as a pressure boundary condition (A Diriclet
boundary condition is imposed to the pressure and a Neuman boundary
condition to the other variables with the gradients set to zero).
• The domain side borders are defined by the periodic boundary. This
boundary multiplies the domain with an infinite number in the direction as
given in Figure 6.3c.
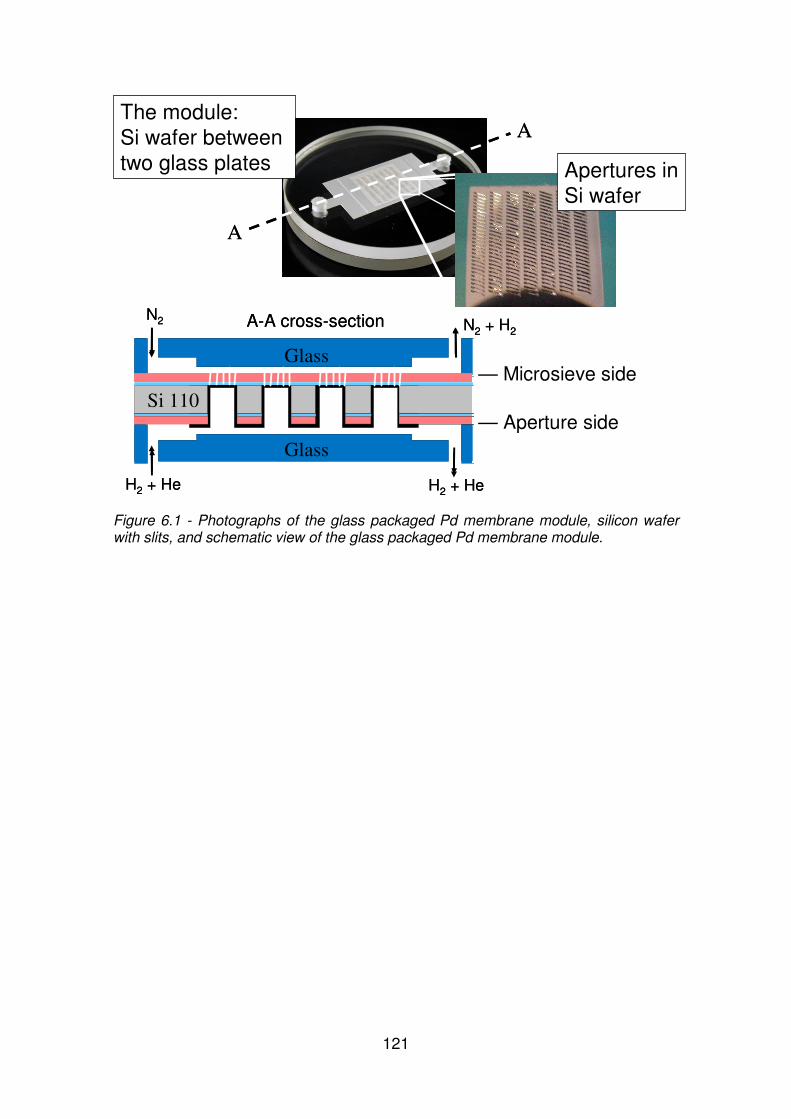
121
A
A
A
A
Apertures in Si wafer
The module:Si wafer between two glass plates
Glass
Glass
Si 110
A-A cross-section
H2 + He H2 + He
N2 N2 + H2
Glass
Glass
Si 110
A-A cross-section
H2 + He H2 + He
N2 N2 + H2
— Microsieve side
— Aperture side
Figure 6.1 - Photographs of the glass packaged Pd membrane module, silicon wafer with slits, and schematic view of the glass packaged Pd membrane module.

122
Figure 6.2 - Schematic top (a) and side view (b) of the etched slit in the silicon wafer.
The values of the parameters used in the simulation are given in Table 6.1. The
standard software is not able to incorporate the dependency of density and fluid
properties on pressure, temperature and composition. Furthermore, there is no
membrane model available. Therefore, the following components are
incorporated to make the modelling of the membrane possible. The density is
calculated by using the ideal gas law as an equation of state. The ideal gas law
predicts the density well for the conditions in the operating window used here.
The viscosity is calculated by the Lucas method [4]. The binary diffusion
coefficients are calculated by the Fuller method [4]. The flux through the Pd
membrane is calculated by Sievert’s law. The temperature dependency of the
Sievert’s constant and the diffusion coefficient of hydrogen atoms through Pd
are incorporated in the model as well [5].
70.53 o
54.74 o
W
L 1
L2
D
30o 30Silicon
30o
A A
A-A
a
b

123
1/2 DR1/2 DR
L2
slit
L1
unsupportedmembrane area
1/2DS1/2DS
W
PeriodicInletPressure
Boundaries19.47
D
Hup
Hdown
membrane
slit
InletPressure
Boundaries
Figure 6.3 - Top (a) and side view (b) of the defined geometry and the physical effect of cyclic boundaries (c)
a
b
c

124
Table 6.1 - Values of the parameters of the standard case.
Parameter Symbol Value Unit
Wafer height D 350 µm
Slit length L1 1500 µm
Unsupported membrane length L2 287 µm
Slit width W 28 µm
Distance between slits DS 100 µm
Membrane thickness dmem 1 µm
Height of the glass channel H 200 µm
Temperature T 673 K
Molar hydrogen fraction xH2 0.2 mol/mol
Molar helium fraction xHe 0.8 mol/mol
Molar nitrogen fraction xN2 1.0 mol/mol
Volume flow (both sides) ΦV 300 Nml/min
At each iteration step the above fluid properties are calculated for each cell with
as input the composition and temperature of that cell in that iteration step.
A simple method to implement a membrane is not available in CFX4.2.
Therefore several steps must be made in the model to transport mass from one
closed geometry to the other. The steps are schematically shown in Figure 6.4:
1) The first step is to create a group of cells, two grid cells thick (dashed
lines in Figure 6.4a). These cells will have the membrane functionality.
2) The second step is to couple the adjacent cells (Figure 6.4b).
3) The third step is to read the hydrogen fractions in these cells (Figure
6.4c).
4) The fourth step is to calculate the H2 flux (Figure 6.4d). This is done for
each pair of adjacent cells.
5) The fifth step is to set the mass fractions of the surrounding fluid on the
inlets of the membrane (Figure 6.4e). At this boundary, the velocities and the
mass fractions must be set. The mass fraction of the components are read from
the cells and set as a boundary condition. The error introduced because in
reality the membrane is hydrogen selective (so the hydrogen fraction should be
1) will be corrected in step 8. If the hydrogen fraction would be set to 1 the mass
balances would be incorrect.

125
6) The sixth step is to calculate and to set the fluid density in the cells
(Figure 6.4f)
7) The seventh step is to calculate and set the calculated gas velocities to
and from the membrane (Figure 6.4g).
8) The eighth step is to correct the error that is introduced in step 5 (Figure
6.4h). Not only hydrogen was added or removed by step 5, but also the other
components that are present. To compensate for this, source terms are added
to the species mass fraction equations. The hydrogen that is added or removed
is corrected by the source term in the hydrogen fraction equation. The opposite
is done for the other components that are added or removed.
In Figure 6.5 the results of the solved model, with the parameters used as given
in Table 6.1, are presented for the H2 molar fraction at the retentate and
permeate side.
The results of the model calculation have been compared to the results of
several mass transfer correlations for laminar flow by using a geometry of two
infinite parallel plates. The results are in good agreement with each other. The
Sherwood number from the CFX calculations is 3.6% higher than the Sherwood
number calculated by using the Von Kármán analogy.

126
MEMBRANE
a: Gridded geometry with membrane
MEMBRANE
b: Coupling of cells adjacent to membrane
MEMBRANE RETENTATE
PERMEATE
H2
H2
c: Determination of hydrogen concentration
MEMBRANE RETENTATE
PERMEATE
H2
H2
d: Determination of the flux
MEMBRANE RETENTATE
PERMEATE
ci
ci
INLET
e: Determination of the composition
MEMBRANE RETENTATE
PERMEATE
ρρρρ
ρρρρ
INLET
f: Determination of the density
MEMBRANE RETENTATE
PERMEATE
INLET
g: Determination of the velocity
MEMBRANE RETENTATE
PERMEATE
INLET
SOURCE
h: Compensation by adding or removing
Figure 6.4 - Implementation steps for flux model.

127
Figure 6.5 - Molar H2 fractions at the retentate and permeate side shown at two different molar H2 fraction scales, see also Figure 6.3.
Retentate
Permeate
Permeate
Retentate

128
6.3 Effect of wafer design on the mass transfer resistance of 2D membranes
Using the model described in the previous section, the effect of the mass
transfer resistance in the gas phase on the H2 flux is determined for varying slit
geometries, switched permeate/retentate side, and membrane feed forced
through the slit or flowing above the slit. The different options are compared by
determining the mass transfer resistance factor (MTR) for each option, which is
defined as:
−=
corH
H
totJ
JMTR
max,,2
21%100 (1)
Where JH2 / JH2,max,cor is the ratio of the calculated flux and the ideal flux without
mass transfer resistance according to Sievert’s law. Besides the total mass
transfer resistance, the mass transfer resistance is calculated for each
membrane side separately, by assuming that no mass transfer resistance exists
at the opposite side.
The slit geometry is varied in three dimensional directions - length (L1), width
(W) and height of the slit (D) -, and the distance between the slits (DS) (see
Figure 6.2 and Figure 6.3). In Table 6.2, the results for different slit geometries
are presented. Besides the mass transfer resistance, the calculated average H2
flux JH2, the ideal H2 flux without mass transfer resistance in the gas phase
JH2,max,cor, the average molar hydrogen fraction near the membrane surface
xH2,ret and xH2,perm, and the average molar H2 fraction at exit xH2,ret,out and
xH2,perm,out are given. The results in italic are the results of the standard situation
as defined in Table 6.1 (standard case geometry).
From the difference in MTR at the permeate and retentate side shown in Table
6.2, it can be concluded that the flux is mostly affected by the mass transfer
resistance in the gas phase at the permeate side (location of the slit) for all
variations. The variation in total mass transfer resistance in the gas phase did
not vary much (max 3.6%).

129
Table 6.2 - Influence of slit dimensions on the flow through the membrane.
Various slit lengths
L1
(µm)
JH2
(mol/m2s)
JH2,max,cor
(mol/m2s)
xH2,perm
(mol/mol)
xH2,ret
(mol/mol)
xH2,perm,out
(mol/mol)
xH2,ret,out
(mol/mol)
MTRtot
(%)
MTRperm
(%)
MTRret
(%)
1500 0.986 1.538 0.0361 0.1950 0.0054 0.1955 35.94 35.15 0.79
3000 0.757 1.260 0.0558 0.1854 0.0257 0.1783 39.56 38.21 1.35
Various slit widths
W
(µm)
JH2
(mol/m2s)
JH2,max,cor
(mol/m2s)
xH2,perm
(mol/mol)
xH2,ret
(mol/mol)
xH2,perm,out
(mol/mol)
xH2,ret,out
(mol/mol)
MTRtot
(%)
MTRperm
(%)
MTRret
(%)
28 0.986 1.538 0.0361 0.1950 0.0054 0.1955 35.94 35.15 0.79
56 0.962 1.479 0.0372 0.1921 0.0086 0.1928 35.00 33.71 1.29
140 0.931 1.405 0.0383 0.1879 0.0135 0.1886 33.70 31.66 2.04
Various slit heights
D
(µm)
JH2
(mol/m2s)
JH2,max,cor
(mol/m2s)
xH2,perm
(mol/mol)
xH2,ret
(mol/mol)
xH2,perm,out
(mol/mol)
xH2,ret,out
(mol/mol)
MTRtot
(%)
MTRperm
(%)
MTRret
(%)
200 0.942 1.403 0.0384 0.1906 0.0137 0.1886 32.79 31.62 1.18
350 0.986 1.538 0.0361 0.1950 0.0054 0.1955 35.94 35.15 0.79
Various distances between slits
DS
(µm)
JH2
(mol/m2s)
JH2,max,cor
(mol/m2s)
xH2,perm
(mol/mol)
xH2,ret
(mol/mol)
xH2,perm,out
(mol/mol)
xH2,ret,out
(mol/mol)
MTRtot
(%)
MTRperm
(%)
MTRret
(%)
50 0.959 1.478 0.0375 0.1925 0.0087 0.1928 35.02 33.85 1.17
100 0.986 1.538 0.0361 0.1950 0.0054 0.1955 35.94 35.15 0.79
200 1.003 1.592 0.0351 0.1967 0.0031 0.1974 36.97 36.41 0.55

130
The following observations can be made for the four varied parameters:
• L1. The increase of the slit length causes a relatively large increase in
free membrane area; a double slit length increases the free membrane
area at least three times. As a result, the total hydrogen flow increases
with increasing slit length, while the increase of mass transfer resistance
and loss of membrane strength is small. Therefore, it is advantageous to
maximise the slit length to obtain the highest hydrogen flow through the
unsupported membrane area.
• W. The increase in slit width decreases the mass transfer resistance at
the permeate side, caused by extra convective transport in the slit. The
mass transfer resistance at the retentate side increases, caused by the
higher flux. The effect at the permeate side is larger, so the total mass
transfer resistance drops with increasing slit width. Another positive
effect of a wider slit is the increase of the free membrane area per wafer.
Therefore, the slit should be as wide as mechanically possible.
• D. The decrease in slit height increases the free membrane length,
therefore the same observations and conclusions are valid as in the case
of increasing the slit length. In addition, the mass transfer resistance at
the permeate side decreases as a result of the shorter diffusion length.
This is advantageous to obtain a higher hydrogen flow per wafer.
However, D is determined by the thickness of the wafer.
• Ds. The decrease in distance between the slits results in a decrease of
the mass transfer resistance at the permeate side (diffusion length is
shorter) and it increases at the retentate side. The larger free membrane
area results in a higher hydrogen flow per wafer. Mechanical strength of
the wafer will limit the reduction of Ds, but should be chosen as small as
possible.
Because the wafer is asymmetric, the effect of switching the retentate and
permeate sides is investigated. Table 6.3 and Figure 6.6 show the effect of
switching the retentate and permeate side on the mass transfer resistance in
the gas phase. The mass transfer resistance at the retentate side increased as
a result of the slit, however, the increased mass transfer resistance has less
influence on the H2 transport because of the square root dependency of the flux
on the partial H2 pressure according to Sievert’s law. Therefore, it is
advantageous to have the highest mass transfer resistance at the retentate side
to obtain the highest hydrogen flow per wafer. In the case a vacuum is applied
instead of a sweep gas, the opposite counts. The vacuum must be applied at

131
the side with the highest geometrical mass transfer resistance, unless the
strength of the membrane makes this impossible.
Table 6.3- Influence of switched retentate and permeate side on the H2 flux through the membrane.The results of the reference case (without switched retentate and permeate) are given in the row with the grey background.
Exchanged permeate and retentate side
dmem
(µm)
T
(K)
JH2
(mol/m2s)
JH2,max,cor
(mol/m2s)
xH2,perm
(mol/mol)
xH2,ret
(mol/mol)
xH2,perm,out
(mol/mol)
xH2,ret,out
(mol/mol)
MTRtot
(%)
MTRperm
(%)
MTRret
(%)
0.25 673 3.416 5.319 0.1463 0.0270 0.1845 0.0196 35.73 19.24 16.49
1.00 623 1.080 1.251 0.1828 0.0084 0.1952 0.0061 13.72 9.36 4.36
1.00 673 1.279 1.504 0.1804 0.0097 0.1943 0.0072 15.04 10.02 5.02
1.00 673 0.986 1.538 0.0361 0.1950 0.0054 0.1955 35.94 35.15 0.79
1.00 723 1.476 1.763 0.1783 0.0110 0.1934 0.0082 16.37 10.76 5.60
The effect of the slit on the mass transfer resistance can be reduced by forcing
the flow through the slit. In Figure 6.7 several cross sections are given with a
sweeping gas forced through the slit. The mass transfer resistance decreases
and the H2 flux increases but at the cost of extra pressure drop (Figure 6.8). For
the standard case the mass transfer resistance decreases from 35 to 20%, the
H2 flux increases from 1.0 to 1.2 mol H2/m2s and the pressure drop increases
strongly from 0.1 to 14.3 kPa. In general, forcing the flow through the slit
increases the mass transfer of hydrogen to the free membrane area, at the cost
of additional pressure drop.

132
0
10
20
30
40
50
60
623K_1.00mu 673K_1.00mu 723K_1.00mu 673K_0.25mu
Ma
ss
tra
ns
fer
res
ista
nc
e (
%)
Standard (up) Standard (down) Changed (up) Changed (down)
623K 1.00µm 673K 1.00µm 723K 1.00µm 673K 0.25µm623K 1.00µm 673K 1.00µm 723K 1.00µm 673K 0.25µm
Figure 6.6 - Mass transfer resistance and fluxes compared with retentate and permeate side switched. ‘Standard’ is not switched and ‘Changed’ indicates that retentate and permeate switched side. ‘Up’ is the ‘aperture’ side of the membrane and ‘down’ is the microsieve side.
0.0E+00
5.0E-04
1.0E-03
1.5E-03
2.0E-03
2.5E-03
3.0E-03
3.5E-03
623K_1.00mu 673K_1.00mu 723K_1.00mu 673K_0.25mu
JH
2 (
km
ol/
m2s
)
Standard Changed
623K 1.00µm 673K 1.00µm 723K 1.00µm 673K 0.25µm

133
Figure 6.7 - Molar H2 fraction for different configurations, see also Figure 6.3.
a. Forced, W = 28 µm
b. Forced, W = 56 µm
c. Forced, W = 140 µm

134
0.0
0.2
0.4
0.6
0.8
1.0
1.2
No bloc
ks (
W =
28 m
u)
Force
d
(W =
28 m
u)
No bloc
ks (
W =
56 m
u)
Force
d
(W =
56 m
u)
No bloc
ks (
W =
140
mu)
Force
d
(W
= 14
0 mu)
JH
2 (
mo
l/m
2s
)
No blo
cks (W
=28 µ
m)
Force
d (W=2
8 µm)
No blo
cks (W
=56 µ
m)
Force
d(W
=56 µ
m)
No blo
cks (W
=140
µm)
Force
d(W
=140
µm)
a
0
5
10
15
20
25
30
35
40
No bloc
ks (
W =
28 m
u)
Force
d
(W =
28 m
u)
No bloc
ks (
W =
56 m
u)
Force
d
(W =
56 m
u)
No bloc
ks (
W =
140 m
u)
Force
d
(W
= 1
40 m
u)
Ma
ss
tra
ns
fer
res
ista
nc
e (
%)
No bloc
ks(W
=28 µ
m)
Force
d(W
=28 µ
m)
No bloc
ks(W
=56 µ
m)
Force
d(W
=56 µ
m)
No blo
cks (W
=140 µ
m)
Force
d(W
=140 µ
m)
b
Figure 6.8 - a) H2-fluxes for different configurations, b) mass transfer resistance at the slit side for different configurations, see also Figure 6.3.

135
0
2
4
6
8
10
12
14
16
No bloc
ks
(W
= 2
8 mu)
Force
d
(W =
28 m
u)
Force
d
(W =
56 m
u)
Force
d
(W =
140
mu)
∆∆ ∆∆p
(k
Pa
)
No bloc
ks(W
=28 µ
m)
Force
d (W=2
8 µm)
Force
d(W
=56
µm)
Force
d(W
=140 µ
m)
No bloc
ks(W
=28 µ
m)
Force
d(W
=140 µ
m)
Force
d (W=2
8 µm)
No bloc
ks(W
=28 µ
m)
Force
d(W
=140 µ
m)
Force
d(W
=56 µm)
Force
d(W
=28 µ
m)
No bloc
ks(W
=28 µ
m)
Force
d(W
=140
µm)
c
Figure 6.8 – c) Pressure drop for different configurations.
However, if the slit width is increased by a factor of 5 then the pressure drop
can be reduced to 0.6 kPa, while the MTR only increases slightly to 22%,
compared to a MTR of 20% for the standard forced case (W= 28 µm, Forced).
6.4 Design of 3D membranes
The price per square meter of membrane can possibly be reduced by creating a
three-dimensional membrane instead of the flat 2D-membrane used in the
previous section. The three-dimensional membrane is hanging in the slit (see
Figure 6.9), creating one or more bowls in the slit. The walls of the bowl are the
additional free membrane area. The used molar hydrogen fraction for the 3D-
membrane simulation is 0.3 (mol/mol), which is 50% higher than the 2D-
membrane case. In Figure 6.10 the increase in free membrane area is given as
function of bowl depth. For this, it is assumed that the wall thickness of the bowl
is uniform and that the bowl does not deflect at all. In reality, deflection of the
bowl will limit its dimensions.

136
70.53o
54.74o
W
L1
L2
D
30o 30
BB
B-B
Pd
Silicon
BOWL
VACUUM
PdMembrane
H
CH
L2
Activearea
1/2 DS
W
a
b
Cross-section
Top view
Figure 6.9 - Design of bowl concept for a 3D-membrane.
0.0
0.2
0.4
0.6
0.8
1.0
0 50 100 150 200 250 300 350Depth (µµµµm)
Am
em
(m
m2)
Figure 6.10 .- Membrane area per slit as function of membrane depth.

137
A CFD model of the three-dimensional membrane has been made. This 3D
model is an adjusted model of the 2D model. For the 3D model a symmetry
boundary is applied in the centre of the membrane feed channel, i.e. one feed
channel has a membrane as top and bottom. To compare the results of the
simulations two parameters are defined. The first is the hydrogen permeating
flow per square meter of wafer:
W
memH
W
H
A
AJ
A
22 =Φ
(2)
Where ΦH2 is the molar hydrogen flow, JH2 is the hydrogen flux, Amem is the
membrane area and AW is the wafer area. In this case, the membrane area is
the area of the free Pd membrane in one slit and the wafer area is the area
around one slit, including the slit itself.
The second parameter is the utilization ratio of the membrane:
%100ratio nUtilizatio,,,
,,,
22
22
thoutHinH
compoutHinH
xx
xx
−
−= (3)
Where xH2,in is the molar hydrogen fraction at the inlet of the domain, xH2,out,comp
is the average molar hydrogen fraction at the outlet computed with CFX4.2 and
xH2,out,th is the theoretical minimal molar hydrogen fraction at the outlet. This
theoretical fraction is calculated with Sievert’s law and assuming a perfect plug
flow over the unsupported Pd membrane area.
Several calculations have been made with varying forms of the bowl, only the
results of varying bowl depth are presented here. The effect of the bowl depth is
investigated for H = 0, 50, 100, 200 and 350 µm. The other dimension are dmem
= 1 and 4 µm, W = 120 µm, a = 20 µm, L2 = 1087 µm and CH = 0.5 mm. The
inlet velocities are proportionally increased with the increase of free membrane
area (20 to78 m/s for dmem = 1 µm, 5.0 to 19 m/s for dmem = 4 µm). In Figure
6.11 the contour plot of the molar H2 fraction in the slit is given for the different
bowl depths. The lower limit of the legend in the contour plots is not constant
which makes it difficult to compare the contours by colour. However, it is clear
from the Figure that the deeper the bowl the less efficient the membrane at the
bottom of the slit is used as a result of the increased diffusion path. Table 6.4
shows the calculated average H2 fraction of the retentate, total flux, theoretical
flux, utilization ratio and H2 flow per wafer area. The utilization ratio shows the
same result as Figure 6.11; the deeper the bowl, the less effective the
membrane (Figure 6.12).

138
a. H = 0.00 mm
b. H = 0.05 mm
c. H = 0.10 mm
d. H = 0.35 mm
Figure 6.11 - Molar hydrogen fractions for different bowl depths of the 3D-membrane.
Table 6.4 - Influence of the depth of the bowl on the H2 flow through the 3D-membrane
H
(µm)
dmem
(µm)
Uin
(m/s)
xH2,out,comp
(mol/mol)
Amem
(m2)
JH2
(mol/m2s)
JH2,theo
(mol/m2s)
Utilization ratio (%)
ΦΦΦΦH2/AW
(mol/m
2s)
50 1 20.140 0.2827 2.491×10⁻⁷ 2.289 3.024 74.91 1.25
100 1 29.727 0.2854 3.676×10⁻⁷ 1.939 3.024 63.23 1.57
200 1 48.901 0.2898 6.047×10⁻⁷ 1.377 3.024 44.18 1.83
350 1 77.661 0.2933 9.604×10⁻⁷ 0.917 3.024 29.02 1.94
50 4 5.035 0.2788 2.491×10⁻⁷ 0.691 0.756 91.80 0.38
100 4 7.439 0.2800 3.676×10⁻⁷ 0.654 0.756 86.70 0.53
200 4 12.225 0.2827 6.047×10⁻⁷ 0.573 0.756 74.92 0.76
350 4 19.415 0.2866 9.604×10⁻⁷ 0.450 0.756 58.03 0.95
However, the increased free membrane area results in a higher H2 flow per
wafer (b). At a bowl depth of 350 µm the H2 flow per wafer increases with 255%
compared to the standard 2D case. The utilization ratio and therefore also the
H2 flow per wafer can be increased even more by forcing the membrane feed
through the slits, obviously at the cost of an increased pressure drop.
The above demonstrates that the H2 flow can be increased by applying the 3D
structure. However the extra cost in membrane production and mechanical
strength could be an issue in introducing the 3D membrane. These issues
should be investigated in future work.

139
A
0102030405060708090
100
0 50 100 150 200 250 300 350 400Depth (µµµµm)
Uti
lizati
on
ra
tio
(%
) 1 mu4 mu
B
0.00.20.40.60.81.01.21.41.61.82.0
0 100 200 300
Depth (µµµµm)
ΦΦ ΦΦH
2/A
W (
mo
l/m
2s
)
1 mu4 mu
Figure 6.12 - a) Utilization ratio, b) hydrogen flow per wafer area.
6.5 Conclusions
Some general conclusions can be drawn from the CFD simulations in relation to
the design of the membrane stack:
The module side with the largest mass transfer resistance should be chosen as
retentate side of the membrane to obtain the highest H2 flow per wafer (30%
higher flux, 58% reduction in mass transfer resistance). The slit height (depends
on wafer height) should be minimized or the mass transfer rate of H2 can be
increased (25% higher flux) by forcing the flow through the slit at the cost of an
increase in pressure drop (from 0,1 to 43,3 kPa) .
The membrane width should be maximized with regard to the mechanical
strength of Pd layer. This will allow to optimize the membrane area and reduce
pressure drop inside the slit (2D). The membrane length should be maximized
with regard to the percentage of hydrogen removed to optimize the membrane
area (2D).
The 3D-membrane structure is an effective way to increase the membrane
area, but with increasing bowl depth the mass transfer rate to the membrane
decreases. Overall, the hydrogen flow per wafer area can be increased by
255% for a one µm thick membrane. The full potential of the 3D-membrane
structure can be used by forcing the flow through the slit.

140
References
1) F.C. Gielens, H.D. Tong, C.J.M. van Rijn, M.A.G. Vorstman, and J.T.F.
Keurentjes, High-flux palladium-silver alloy membranes fabricated by
microsystem technology, Desalination, 147 (2002) 417.
2) F.C. Gielens, H.D. Tong, C.J.M. van Rijn, M.A.G. Vorstman, and J.T.F.
Keurentjes, Microsystem technology for high-flux hydrogen separation
membranes, J. Membr. Sci., 243 (2004) 203.
3) F.C. Gielens, H.D. Tong, C.J.M. van Rijn, M.A.G. Vorstman, and J.T.F.
Keurentjes, Measurement and modelling of hydrogen transport through high-
flux Pd membranes, J. Membr. Sci., 289 (2007) 15.
4) R.C. Reid, J.M. Prausnitz, and B.E. Poling, The properties of gases and
liquids, 1988.
5) T.L. Ward and T. Dao, Model of hydrogen permeation behavior in
palladium membranes, J. Membr. Sci., 153 (1999) 211.

141
7 DESIGN OF A H2-SELECTIVE MEMBRANE
MODULE AT MACRO SCALE AND ITS APPLICATION IN A PROPANE DEHYDROGENATION PLANT
Abstract
The economic viability of applying hydrogen selective membrane in a 325
kton/year propylene plant has been investigated. The profitability of four
scenarios (50, 60, 70 and 80% hydrogen removal) has been calculated using
the membranes developed in the work described in this thesis. In this
investigation it has been assumed that propane and the reaction products have
no influence on the performance of the membrane. The scenario with 50% H2
removal shows the most positive business case. However, it will be necessary
to improve the business case by increasing the membrane life time and/or to
reduce the membrane cost significantly.

142
7.1 Introduction
This chapter will focus on the design and application of a hydrogen selective
membrane module in a propane dehydrogenation plant. This includes the
presentation of a module concept that can house several wafers with
membranes (as presented in Chapter 6) and spacers, and the investigation of a
business case to apply this concept in a propylene plant.
Various processes have been developed for catalytic dehydrogenation of
propane to propene, but for this case-study the Oleflex process licensed by
UOP has been chosen (Figure 7.1) [1]. The Oleflex process operates slightly
above atmospheric pressure and a platinum catalyst is used. Fresh propane
feed is mixed with recycled and unconverted propane and is fed to a train of
three adiabatic reactors (radial-flow moving-bed catalytic reaction vessels), in
which the heat of reaction is supplied by reheating the process stream between
the different reaction stages (600 °C). The overall selectivity is around 90%. The
Oleflex process has been modelled with and without H2 removal in Aspen Plus
version 11.1, build 192, platform win32. The model is used to calculate the
economic advantage of using a H2 selective membrane within an existing plant
by removing 50, 60, 70 or 80% of the H2 present at the reactor outlet,
respectively. A description of the Aspen model is given below, followed by the
process economics and finally the conclusions.
Q Q Q
To propene recovery
/purification
CATR2 R3R1
Fuel
Propane
Figure 7.1 - Schematic view of the Oleflex process.
7.1.1 Aspen simulation – general
The modelled process is given schematically in Figure 7.2 and Table 7.1,
including the membrane section and propene purification section. The Benedict-
Webb-Rubin-Lee-Starling equation of state is used, which is capable to handle
non-polar components and hydrogen containing systems. It is assumed that the

143
dehydrogenation plant produces 325 kton propene/year with a purity of 99.5%
to 99.8% (polymer grade, concentration of ethylene and methane < 100 ppm).
Table 7.1 - Explanation of the components used in the Aspen flow sheet.
Symbol Item
C SEP Coke separator
COMP Compressor
DE Deethanizer
Fi Furnaces
H2 SEP Hydrogen separator
HP High pressure C3 splitter
HX Heat exchangers
LP Low pressure C3 splitter
MEM Membrane unit
Ri Reactors

144
F1
R1
F2
R2
F3
R3
SE
P
H2
SE
P
SE
P
CS
EP
CO
OL
ER
1
CO
MP
1M
IX1
DE
HP
LP
MIX
2
SE
P
ME
M
B1
FE
ED
+R
R1
INR1
OU
T
R2
IN
R2
OU
T
RE
TM
EM
R3
IN
R3
OU
TO
UT
CO
OL
E
H2
C
OU
TC
SE
P1
FE
ED
RE
CY
CL
E
C,C
2
OU
TH
P
OU
TL
PPR
OD
UC
TH
2M
EM
Figure 7.2 - Schematic process scheme of the propylene plant including H2 separation by the developed Pd membrane.

145
7.1.2 Aspen simulation – reactor section
The propane dehydrogenation reaction is described by the following reactions in
the model:
Dehydrogenation reaction 26383 HHCHC +⇔ (1st reaction)
Cracking reaction 42483 HCCHHC +→ (2nd reaction)
Coke formation 283 43 HCHC +→ (3rd reaction)
The second and third reaction are defined to model the formation of lighter
compounds and coke [2]. The three reactions are described by a kinetic
reaction model [2, 3]. The parameter values of this kinetic model are based on
experimental data (see Table 7.2). However, the values of the parameters of
the second and third reaction are measured with a different catalyst,
AlCrO3/Al2O3 instead of a platinum catalyst, and therefore the values have been
adapted in order to obtain the prescribed overall selectivity of 90%.
Table 7.2 - Parameters of the kinetic model of the dehydrogenation of propane.
Reaction Kfor Efor Krev Erev Reference
(-) (s-1
Pa-1
) (kJ mol-1
) (s-1
Pa-1.763
) (kJ mol-1
) (-)
1 169 E-6 31.8 322 E-9 -89.5 M Larsson [3]
2 0.07 318 - - Calculated
3 0.01 318 - - Calculated
763.01
1
1
11 26383 HHCrevHCfor ppkpkr −= (1)
83HCifori pkr = i=2,3 (2)
In Equation 1 and 2, kifor and k1rev represent the rate constants for the forward
and backward reactions, respectively. These rate constants can be defined by
the centred Arrhenius equation.
−
−
= 0
0 11
0
TTR
E
ii
i
ekk (3)
In these equations, T0 =800K and i stands for both the forward and reverse
reactions, see Table 7.2. The kinetic description of the reaction is implemented
in Aspen via the plug flow adiabatic reactor model. The length and diameter of
the first two reactors are 1.0 m and 0.2m, respectively. For the third reactor, the
length and diameter are 0.7 m and 0.2m, respectively. The reactor dimensions

146
are chosen in such a way that the residence time in the reactors is sufficient to
reach equilibrium.
7.1.3 Aspen simulation – membrane section
Membrane module concept at macro level
For an economic success of the membrane it is necessary to obtain a high
throughput of H2 through the membrane to reduce the membrane area required
[4, 5]. Besides the membrane, the stack of membranes and the stack-holder are
important components for this success. To obtain a high throughput the
following factors are important for the design of the module and holder:
1) Optimal ratio of membrane area versus seal and gas-transport area
2) Low-pressure drop in the module and holder
3) A high mass transfer coefficient at the retentate side
4) Equal distribution of the flow through each duct
5) Gas-tight module
In Figure 7.3, a concept of the stack-holder and the membrane stack is
presented. The stack-holder is a stainless steel hull (Figure 7.3a) which
contains the stack of silicon wafers. The holder keeps the stack at the operating
temperature, collects the hydrogen, provides a tight seal between the retentate
and permeate and enables replacement of the membrane stack. The stack is
placed on top of a bottom plate which is supported by a spring. The spring
introduces enough force to obtain a gas-tight connection without breaking the
stack.
The stack itself is build up by repeating the following sequence: silicon wafer
with membrane on the top, spacer, silicon wafer with membrane at the bottom,
silicon wafer with membrane on the top, spacer, silicon wafer with membrane at
the bottom, etc. (Figure 7.3b and c).
Silicon is used as the support for the H2-selective Pd layer, which is a material
that has a lower thermal expansion coefficient than common metals. A solution
to prevent leakage as a result of this difference is to fabricate the whole stack
out of silicon. However, the crystalline silicon wafers are expensive. To reduce
costs, it might be possible to use non-crystalline silicon as spacer in between
the wafers, as it has the same thermal expansion coefficient.
In the next section this concept of stack holder is used in a propane
dehydrogenation plant of 325 kton/year (standard case). The number of wafers

147
per stack, the dimension of ducts and the membrane area are calculated by
using the following criteria/assumptions:
• Diameter of the wafer is 0.304 m
• Sealing width is 7 mm
• Membrane has a square or rectangular shape
• Of the membrane area 25% is effective (microsieve is for 25% open)
• Pressure drop of maximum 10% of the absolute pressure

148
Figure 7.3 - Proposed design of the membrane stack holder: a. schematic picture of the stack holder, b. side view of the stack of membranes including spaces, c top view of the membrane wafer and the two types of spacers. The drawings are not at scale.

149
The inlet area between the wafers is half the area of the feed duct to the wafers
(insure an equal distribution over the different membranes [6]). In one pass over
the membrane the hydrogen is removed to the desired concentration (50 %
reduction for the standard case). The height of the retentate side has been fixed
at 1 mm and for the permeate side 3 and 5 mm at a permeate pressure of 2000
and 1000 Pa, respectively.
Applying membrane module in process
The membrane stack can be positioned after the first and/or second reactor.
The best result is obtained after the second reactor because more H2 will be
removed with equal membrane area (if the equilibrium state is reached in the
third reactor). The membrane is placed before the third heater, because the
lower temperature increases the stability of the membrane at the expense of a
lower H2 flux. The membrane is modelled in Aspen as a black box that
selectively removes a certain percentage of H2 from the feed. The dimensions
of the membrane stack (including other characteristics) are given in Table 7.3
for the calculated scenarios and are based on the design details in the previous
paragraph. Wmem and Lmem are respectively the width and the length of the
membrane, Hstack is the height of the membrane stack, Hret and Hperm are
respectively the height of the chamber between two opposite membranes at the
retentate side and between two opposite wafer surfaces at the permeate side. It
is assumed that the flux of the membrane can be described by Sievert’s law and
that the flux is not affected by contamination [7]. The membrane thickness is 1
µm. The value of Hret is an important factor, if Hret is chosen too high then
concentration polarization will affect the flux negatively, too low and the
pressure drop will increase too much. The calculated pressure drop over the
membrane stack for retentate side and permeate, and the number of wafers
and stacks necessary for the different scenarios are given in Table 7.4.
The permeate side of the membrane is kept at a pressure of 1000 or 2000 Pa
by a vacuum pump. A large vacuum pump is necessary to keep the permeate at
the right permeate pressure. The energy consumption of this vacuum pump is
given in Table 7.5 and will be counted as operating costs.

150
Table 7.3 - Dimensions and characteristics of membrane stacks.
H2
(%)
Wmem
(m)
Lmem
(m)
Hstack
(m)
Hret
(m)
Hperm
(m)
Permeate pressure – 1000 Pa
50 0.212 0.184 0.128 0.001 0.005
60 0.156 0.230 0.064 0.001 0.005
70 0.129 0.245 0.048 0.001 0.005
80 0.129 0.245 0.042 0.001 0.005
Permeate pressure – 2000 Pa
50 0.212 0.184 0.128 0.001 0.003
60 0.156 0.230 0.064 0.001 0.003
70 0.129 0.245 0.048 0.001 0.003
80 0.129 0.245 0.042 0.001 0.003 The width of the area to seal the wafer is 0.007 m
Table 7.4 - characteristics of membrane stacks.
H2
(%)
Feed
(kmol/hr)
∆∆∆∆Pret
(%)
∆∆∆∆Pperm
(%)
Wafers/stack
(-)
Nº wafers
(-)
Nº stacks
(-)
Permeate pressure – 1000 Pa
50 5036 8.8 4.2 32 12660 396
60 5045 8.7 3.4 16 19070 1192
70 5032 1.6 1.5 12 46710 3893
80 5012 0.7 0.5 12 163800 13650
Permeate pressure – 2000 Pa
50 5036 5.4 3.7 32 16380 512
60 5045 4.2 2.6 16 28030 1752
70 5032 0.9 1.0 12 87590 7299
80 5012 0.3 0.3 12 397800 33150

151
Table 7.5 - Vacuum pump and heat exchangers duties versus percentage of H2 removed.
1000Pa permeate pressure
2000Pa permeate pressure
H2 Work vacuum pump
Heat duty Work vacuum pump
Heat duty
(%) (MW) (MW) (MW) (MW)
50 3.0 -4.46 2.45 -3.91
60 3.6 -5.36 2.90 -4.70
70 4.2 -6.23 3.37 -5.47
80 4.8 -7.10 3.84 -6.24
7.1.4 Aspen simulation – compressor section before purification section
As a result of the increase in propane processing the capacity of the furnaces,
coolers and existing compressor will change. The propane stream through the
furnaces increases and results in a larger energy consumption (Table 7.6). The
mass flow to the purification section increases but the hydrogen content is
lower, which results in less work for the compressor but a higher need of
cooling capacity (see heat exchanger and cooler duties, Table 7.6). It is
assumed that the capacities of the existing furnaces, heat exchangers and
coolers can be increased without investments and therefore only the extra
operating costs are included (heat integration is not included, which would
decrease the extra operating costs)
Table 7.6 - Heat duties of furnaces, heat exchangers and work of the compressor.
H2 Tot. Furnace Comp. Heat ex.1 Heat ex.2
(%) (MW) (MW) (MW) (MW)
0 119.2 20.0 -63.8 -28.2
50 126.2 19.5 -64.8 -31.9
60 126.4 19.2 -64.2 -32.3
70 125.9 18.8 -63.3 -32.6
80 125.3 18.4 -62.3 -32.8
7.1.5 Aspen simulation – purification section
After the third reactor, the coke and hydrogen are removed. Subsequently, the
methane, ethylene and propane are removed in a C2 (de-ethanizer) and two C3
splitters (propane/propene splitter). The advantages of using two splitters is

152
energy saving and reduction of size/weight of the first column. The heat
integration of the two columns is not implemented in this Aspen simulation.
The dimensions and other characteristics of the splitters are determined from
the simulation without membrane and are given in Table 7.7. These
characteristics have been kept constant during the other simulations. The
diameter of the splitters is calculated by fixing the maximum flooding velocity at
85%, the position of the feed tray is determined iteratively from the
concentration profiles inside the splitter. The reflux ratio and boiler and
condenser duties have been optimised for every simulation case, but only the
reflux ratio of the low-pressure C3-splitter changed significantly from 80 to 66 by
removing the H2 (see Table 7.8 for the other conditions). The high number of
stages and high reflux ratio are a result of the difficult separation of propane and
propylene.
Table 7.7 - Dimensions, tray spacing, number of trays, used tray efficiency and number of the feed tray of the C2 and C3 splitters.
Splitter Diameter Height Tray spacing
nº of trays
Tray efficiency
Feed tray a.s.1
(-) (m) (m) (m) (-) (%) (-)
C2 5 20 0.6 30 85 7
First C3 9 90 0.45 200 85 180
Second C3 13 90 0.45 200 85 110
1) a.s.: above the stage
Table 7.8 - Operating specification of the C2 and C3 splitters.
Splitter Pressure Reflux ratio
Condensor duty
Reboiler duty
Temp. top
Temp. Bottom
(-) (bar) (-) (MW) (MW) (°°°°C) (°°°°C)
C2 25 20 -13.1 16.3 10 50
C3 high pressure (HP)
25 42 -62.0 63.5 50 60
C3 low pressure (HP)
18 81 -143.4 143.1 43 50
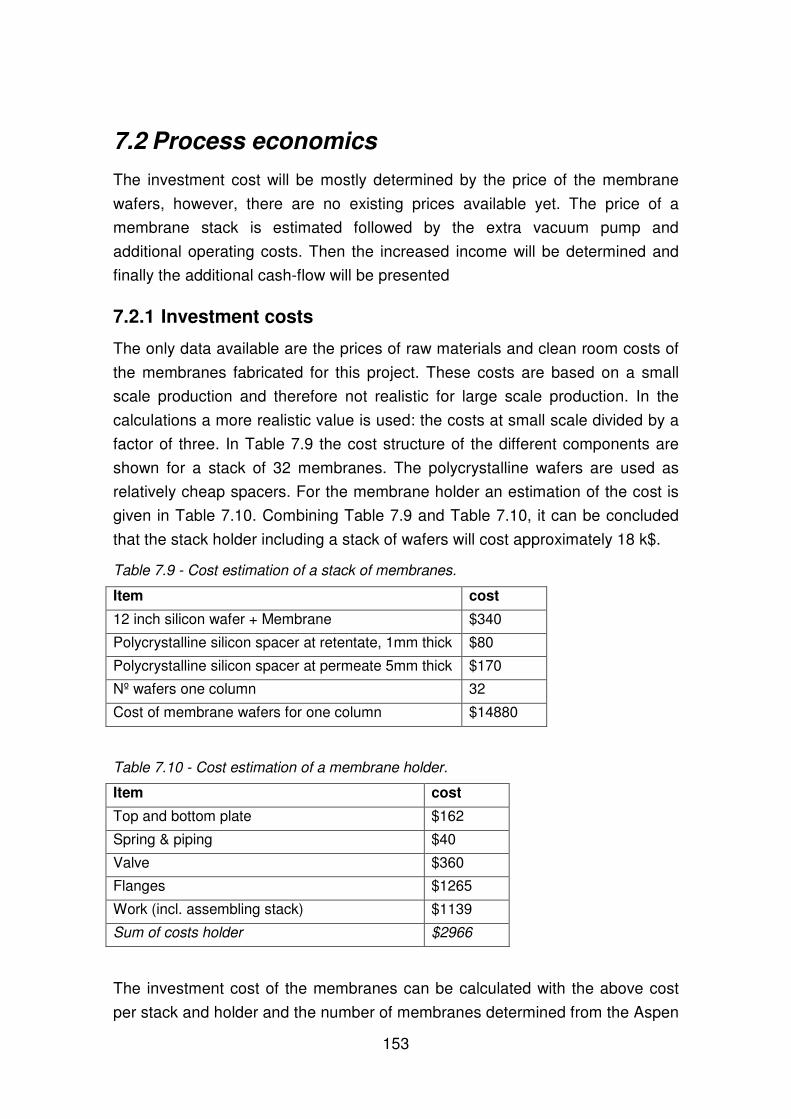
153
7.2 Process economics
The investment cost will be mostly determined by the price of the membrane
wafers, however, there are no existing prices available yet. The price of a
membrane stack is estimated followed by the extra vacuum pump and
additional operating costs. Then the increased income will be determined and
finally the additional cash-flow will be presented
7.2.1 Investment costs
The only data available are the prices of raw materials and clean room costs of
the membranes fabricated for this project. These costs are based on a small
scale production and therefore not realistic for large scale production. In the
calculations a more realistic value is used: the costs at small scale divided by a
factor of three. In Table 7.9 the cost structure of the different components are
shown for a stack of 32 membranes. The polycrystalline wafers are used as
relatively cheap spacers. For the membrane holder an estimation of the cost is
given in Table 7.10. Combining Table 7.9 and Table 7.10, it can be concluded
that the stack holder including a stack of wafers will cost approximately 18 k$.
Table 7.9 - Cost estimation of a stack of membranes.
Item cost
12 inch silicon wafer + Membrane $340
Polycrystalline silicon spacer at retentate, 1mm thick $80
Polycrystalline silicon spacer at permeate 5mm thick $170
Nº wafers one column 32
Cost of membrane wafers for one column $14880
Table 7.10 - Cost estimation of a membrane holder.
Item cost
Top and bottom plate $162
Spring & piping $40
Valve $360
Flanges $1265
Work (incl. assembling stack) $1139
Sum of costs holder $2966
The investment cost of the membranes can be calculated with the above cost
per stack and holder and the number of membranes determined from the Aspen

154
simulation. The cost of membranes and stack holders are multiplied with an
installation factor of 1.3 and 2.5, respectively (based on Guthrie’s approach [8]).
It is assumed that the membranes have a life expectancy of four years. The
total membrane installation and replacement costs are given in Table 7.11.
Table 7.11 - Total investment costs of the membranes (including holders) and replacement costs of the membranes alone.
1000 Pa 2000 Pa
H2
(%) Cost module 4 years stack
wafer Cost module 4 year stack
wafer 50 $10.6M $8.0M $13.7M $10.3M
60 $20.4M $12.5M $29.9M $18.3M
70 $53.5M $29.3M $107.1M $58.6M
80 $200.2M $109.7M $486.3M $266.3M
The low pressure at the permeate side is created by a vacuum pump including
heat exchangers. The investment costs of the vacuum system are estimated
from the purchase costs given by Aspen Icarus multiplied by the Hand factor of
2.5 and 3.5 for the vacuum pump and heat exchanger, respectively [8]. The
total investment costs for the vacuum system are given in Figure 7.4 for all the
calculated scenarios. The total investment costs rise exponentially with the
hydrogen removal degree as a result of the exponential need of membrane area
(Figure 7.5). For a hydrogen removal of 60% or higher, the membrane costs are
the major investment costs.
0
2
4
6
8
10
12
0.45 0.5 0.55 0.6 0.65 0.7 0.75 0.8 0.85
Fraction of hydrogen removed (-)
Inve
stm
ent c
osts
(M
$)
Permeate at 1000 Pa
Permeate at 2000 Pa
Figure 7.4 - Relation between investment costs vacuum system and fraction H2 removed by the membrane after the second reactor.

155
0
50
100
150
200
250
300
350
400
450
500
0.45 0.50 0.55 0.60 0.65 0.70 0.75 0.80 0.85
Fraction of hydrogen removed (-)
Tot
al in
vest
men
t cos
ts (
M$)
Permeate at 1000 Pa
Permeate at 2000 Pa
Figure 7.5 - Total installed cost of the membrane stacks (incl. holders) and extra equipment for all scenarios.
7.2.2 Operating costs
The operating cost of the reference situation will be affected by implementing
the membranes in the process. The furnaces use more gas caused by the
increase of propane feed and the compressor in front of the purification section
uses less electricity caused by the pre-removal of H2 by the membrane. In
addition the operating costs are increased by a new vacuum system at the
permeate side of the membranes. In Table 7.12 the new operating costs are
given based on a price of electricity of $0.1/kWh and methane of $ 0.027/m3
gas.
Table 7.12 - Extra operating costs per year related to the scenarios.
H2
(%) Tot. Furnace Comp. Comp.1000Pa Comp.2000Pa
50 $0.17M $-0.40M $2.40M $1.96M
60 $0.18M $-0.64M $2.88M $2.32M
70 $0.17M $-0.96M $3.36M $2.69M
80 $0.15M $-1.28M $3.84M $3.07M
7.2.3 Cash flow
As a result of the removal of hydrogen by the membrane, the propane
conversion rate will increase. An increase of the productivity between 12 and
17% is obtained for the different scenarios (Figure 7.6). From these numbers

156
and the estimation that the earnings will increase with 180$/ton propylene
(market price propylene minus propane and losses due to the 90% selectivity of
the process) the total earnings can be calculated.
The cash flow can be calculated from the total earnings, investment costs and
extra operational costs. In Figure 7.7 the cash flow is given for the 50% H2
removal scenario for permeate pressures of 1000 and 2000 Pa, respectively.
The zigzag trend is caused by the cost of replacing the membrane stack every
four years. For the 50% H2 removal scenario at a permeate pressure of 2000
Pa the extra income is 4.7 M$/year, the membrane replacement costs are 10.3
M$/4 years. Over a period of four years, the average cash flow is 2.1 M$/year.
From Figure 7.7, it can be seen that the break-even point in the investment
occurs after seven years for both cases (permeate pressure at 1000 or 2000
Pa).
The extra membrane costs in the 2000 Pa scenario are compensated by the
lower operating costs. The cash flow of the three other scenarios are even
worse than that of the 50% H2 removal scenario. For the 60% scenario with
1000 Pa permeate pressure, the break-even point occurs after approximately
18 years, and with 2000 Pa it will never occur. The other scenarios (70 and 80%
H2 removal) will never become break-even, because of the necessary
membrane replacement investments. Obviously, it will be necessary to improve
the business case by increasing the membrane life time and/or to reduce the
membrane costs significantly.
900
1000
1100
1200
1300
0.00 0.20 0.40 0.60 0.80
Fraction of hydrogen removed (-)
Flo
w (
kmol
/hr)
Feed
Product
Figure 7.6 - Propane demand and propylene production as function of hydrogen removal.

157
-20
-15
-10
-5
0
5
10
15
20
2013 2015 2017 2019 2021 2023 2025 2027
Date (year)
Cash
flo
w (
M$)
Permeate at 1000 Pa
Permeate at 2000 Pa
Figure 7.7 - Cash flow for the scenarios with 50% H2 removal and a permeate pressure of 1000 and 2000 Pa.
7.3 Conclusions
The economic viability of applying the membrane in a 325 kton/year propylene
plant has been investigated for four scenarios 50, 60, 70 and 80% hydrogen
removal at two permeate pressure (1000 or 2000 Pa). The scenario with 50%
H2 removal has the most positive business case (12.4 % more propylene
produced, average profit increase of 2.1 M$/year (membrane replacement
included), investments 17.5 M$ in case of a permeate pressure of 2000 Pa). It
will be necessary to improve the business case by increasing the membrane life
time and/or to reduce the membrane costs significantly.

158
References
1) P. Eisele, R. Killpack, Ullman’s encyclopaedia of industrial chemistry,
Willey-VCH verlag GmbH & Co. DOI 10.1002/14356007, 2002.
2) J. Gascon, C. Tellez, J. Herguido, and M. Mendez, Propane
dehydrogenation over a Cr2O3/Al2O3 catalyst: transient kinetics model of
propane and coke formation, Appl. Catal. A, 248 (2008) 105.
3) M. Larsson, N. Hendriksson, and B. Andersson, Investigation of kinetics
of a deactivating system by transient experiments, Appl. Catal. A, 166 (1998) 9.
4) F.C. Gielens, H.D. Tong, C.J.M. van Rijn, M.A.G. Vorstman, and J.T.F.
Keurentjes, High-flux palladium-silver alloy membranes fabricated by
microsystem technology, Desalination, 147 (2002) 417.
5) F.C. Gielens, H.D. Tong, C.J.M. van Rijn, M.A.G. Vorstman, and J.T.F.
Keurentjes, Microsystem technology for high-flux hydrogen separation
membranes, J. Membr. Sci., 243 (2004) 203.
6) D.S. Miller, Internal flow system, BHRA fluid engineering series, 1978
7) T.L. Ward and T. Dao, Model of hydrogen permeation behavior in
palladium membranes, J. Membr. Sci., 153 (1999) 211.
8) J.M. Douglas, Conceptual design chemical processes, McGraw-Hill,
International Edition, 1988.

159
8 FUTURE PERSPECTIVES
8.1 Introduction
As shown in the propylene application in the previous chapter, it is important
that the life time of the membrane is sufficiently long (four years) and fluxes are
several orders higher than conventional membranes in order to have a positive
business case to implement membrane technology for this application. In the
previous chapters, two problems have been encountered that prevent the
implementation of the developed membranes for a wide range of applications.
First, at elevated operating temperatures (>573 K) pin-holes were formed within
two months of continuous operation. Secondly, the reactants of the propylene
process contaminate the membrane surface resulting in a strong flux decline.
In the last years, several research groups have addressed these challenges
and published their progress. In the following sections their findings will be
discussed in relation to the main issues identified in this research work. Finally,
some possible future research directions are suggested.
8.2 Membrane Stability – pinhole formation
In chapter three of this thesis it was shown that during permeation experiments
pin-holes were formed in the free Pd layer. In literature, various authors
describe the phenomena, but mainly for free hanging thin Pd or Pd alloy films
(up to several microns) [1-3].
McLeod [1] investigated the formation of pin-holes of free hanging Pd/Ag
membranes prepared by sputtering. The membranes were tested for an
extended period of time at elevated temperature. The author postulated pinhole
formation finds its origin in structural relaxation of the internal stress in the film.

160
Although no rigorous characterization was performed, the stress in the sputter-
deposited Pd/Ag film was found to be tensile by measuring the curvature of the
Si wafer both before and after deposition. The formation of voids in the free-
standing membrane is a result of the system approaching thermodynamic
equilibrium by reducing the internal stress in the metal lattice introduced by the
manufacturing process. The author concluded that the formation of voids in a
tensile film can therefore not be avoided. To prevent pinhole formation, the
author suggests to ensure that the deposited metal layer is compressive rather
than tensile. The internal stress of a sputter-deposited metal film can be
controlled by adjusting the gas pressure during deposition. This is also
demonstrated by Castrup et al. [4]; they could influence the residual stresses in
nanocrystalline palladium films by the Ar-sputtering gas pressure. At low
pressures, the metal films exhibited strong compressive stresses, which rapidly
changed to highly tensile with increasing pressure, and then gradually
decreased upon a further increase in pressure.
Guazzone et al. [2] studied the leak rate increase of Pd membranes
manufactured by electroless plating using Pd layers of 3 to 10 micron thick. The
authors claim that the high activation energy observed for the leak growth
indicates that pinhole formation is a diffusion-limited mechanism, and therefore
related to the sintering process. Incoherent sintering which can occur during
membrane fabrication leads to evolution of pinholes due to local densification or
differential shrinkage. Differential shrinkage is characteristic of sintering of
ultrafine materials. This mechanism was also described for sputtered thin films
of TiB2 by Chen et al. [5]. After sputtering the residual stress of the TiB2 films is
compressive, but during an annealing step at 673 K larger grains are formed out
of the smaller grains and the remaining stresses shift to tensile.
Peters et al. [3] studied the long-term stability of a 2.6 micron thick Pd/23%Ag
membrane. The thin Pd/Ag layer was prepared by sputtering a Pd/23%Ag target
onto a polished silicon wafer. After sputtering, the metallic layer was removed
and wrapped around a tubular macroporous stainless steel support. During
permeation experiments it was found that the selectivity of the membrane
decreased irreversibly after operating the membrane for 100 days at
temperatures ranging from 623 to 723K and a feed pressure of 10 bar. After the
permeation experiments, pieces of the membrane were thoroughly investigated
by SEM, TEM, STEM/EDS, XRD and XPS. From these results the authors
conclude that grain growth has taken place and pin holes are formed.
The membranes used in this thesis are prepared at an argon pressure of 0.1 to
1.0 Pa during sputtering [6]. The substrate temperature was chosen in the

161
range of 673 to 700 K to prevent the formation of a tensile film. Sputtering
conditions at 700-800 K would lead to a metallic film with higher density and
finer grain sizes. However, as can be seen from SEM pictures in Chapter 3,
structural changes of the Pd surface are taking place during the permeation
experiments. Following the mechanism of Guazzone et al. [2] and Chen et al.
[5], it is expected that despite the compressive stress present after membrane
production, during the permeation experiments tensile stresses caused by
sintering/grain growth result in pin-hole formation. More research should be
focused on the stress and grain development at permeation conditions for
periods of more than 500 hours [7]. By changing the sputtering conditions
and/or alloying of Pd less grain development could be obtained.
8.3 Membrane Contamination
In chapter 4 and 5 a negative effect of CO, CO2, H2O and propane was found
on the H2 flux of Pd (alloy) membranes. These are common reactants/products
in the WGS reaction, steam reforming/auto oxidation of methane/alcohols
(methanol/(bio)ethanol/glycerol) and dehydrogenation of alkanes.
Research groups have studied the effects of these components on the
membrane layer with model-mixtures of the reactants, or studied the shift in
reaction equilibrium by using H2 selective membranes. Some research groups
have tried to overcome the problems of membrane contamination by alloying
the Pd layer with secondary or even tertiary alloy elements. The results of some
authors are described below per reaction type. The overview presented here is
not meant to be complete but rather to give an impression of the achieved
results of recent years.
8.3.1 Reforming of alcohols
Seelam et al. [8] used a Pd/PSS (Porous Stainless Steel) membrane reactor to
produce H2 from bio-ethanol (membrane thickness of 20 micron). The reaction
was operated at 8-12 bar, 673K with a Ni/ZrO2 or Co/Al2O3 catalyst. The flux of
H2 through the membrane was declining after each reaction test. As a result,
the H2 recovery per mole ethanol decreased. The cause for this was found to be
coke deposition. Basile et al. [9] found similar results for their Pd/PSS
membrane reactor to convert ethanol by steam reforming (25 micron thick Pd
layer), although the reaction was performed at lower pressure, from 3.0 to 8.0
bar, at 673K and a Co/Al2O3 catalyst was used. In this case the permeating flux
of H2 also declined during the reaction tests. They concluded from scanning

162
Auger spectroscopy (SAM) analysis that a consistent carbon contamination,
and in a lower degree chloride and sulfur contamination, led to a decrease in
membrane performance. In addition, small holes of 10 to 100 nm were
observed in the Pd layer by SEM.
Yun et al. [10] investigated a Pd membrane and a Pd/Cu membrane (1.3 and
2.0 micron thick, respectively) in the application of steam reforming of ethanol.
They found that the Pd membrane showed a significant lower H2 yield due to
contamination of CO or carbon compounds. In addition, for the Pd/Cu
membrane the yield was 19% higher and the conversion 22% higher compared
to a normal packed bed reactor. The H2 permeance versus H2 formation rate
was between 0.1 and 0.3. The Pd/Cu membrane gave a better overall
performance.
Iulianelli et al. [11] investigated a Pd/Ag membrane reactor for the steam
reforming of glycerol at 673K (50 micron thick membrane). A higher conversion
rate was found compared to a traditional reactor. However, the formation of
coke limited the performance of the membrane and resulted in a lower
hydrogen recovery on the permeate side.
From the research described above, the Pd/Cu membrane seems the most
promising for steam reforming of alcohols with regard to membrane
contamination and conversion.
8.3.2 Dehydrogenation of alkanes
Yu et al. [12] investigated the use of a Pd membrane reactor to increase the
yield of styrene from the dehydrogenation of ethylbenzene. They used a 10
micron thick supported Pd membrane and obtained 11.3% enhancement in
styrene yield without a decrease in styrene selectivity. However, the effects of
the reaction conditions on the membrane are not mentioned. Gimeno et al. [13]
and Gbenedio et al. [14] investigated the application of a 6 µm thick Pd/alumina
hollow fiber membrane reactor (HFMR) for the dehydrogenation of propane to
propene. They concluded that as a result of the H2 removal, the coke deposition
rate increased, which makes this reactor type more interesting for catalytic
reactions, such as the water gas shift reaction and steam reforming (less coke
deposition). Ryi [15] investigated the enrichment of ethylene using a 4 µm thick
Pd/1%Au membrane. The ethylene concentration could be increased from 5%
to 82% and a H2 recovery ratio of > 96% was attained by using the membrane
(673 K, 15 bar). Significant amounts of methane were detected in the retentate.
The methane was formed from the decomposition of ethylene at the stainless
steel tubes and not at the membrane surface, as revealed by SEM/EDX. They

163
concluded that the permeation behavior was not influenced by the presence of
5% ethylene.
8.3.3 Reforming of methane
Borgognoni et al. [16, 17] investigated the reforming of methane by steam or
auto-thermal in combination with a Pd/Ag membrane (150 micron thick). The
reforming reactor and membrane separation were decoupled. The reforming
section was operated at a temperature in the range of 840 to 993 K and the
membrane section between 573 to 673K. With both methods, a hydrogen flow
was obtained but no details were given about the membrane performance with
regard to membrane contamination. It is expected that the membrane has
operated diffusion limited and therefore the influence of contaminants on the
membrane surface, if present, will only have a limited effect.
Chiappetta et al. [18] studied the catalytic steam reforming of methane in a
Pd/Ag-based membrane reactor (membrane is 100 micron thick). The methane
conversion could be increased by a factor of three compared to the
thermodynamic equilibrium of a traditional reactor. A side effect of the removal
of H2 is the tendency of increased carbon deposition. However, the extra
formation of carbon could be reduced by increasing the operating temperature
and/or pressure and increase the steam/methane ratio. The permeation
behavior of the membrane was equal before and after the reactions tests
indicating that the steam reforming did not change the membrane behavior.
Basile et al. [19] investigated a similar system, but with a Pd/Ag membrane of
50 micron. In Basile’s study, the H2 permeation was lower during the operation
of reforming methane. The authors expect that concentration polarization is the
main cause of the drop in H2 permeation. Although, no drop in H2 permeation
was found with mixtures of H2 and methane or H2 and N2. Bosko et al. [20]
compared the application of a Pd and a Pd/Ag PSS supported membrane
reactor for the dry reforming of methane at 723 and 773 K. The membrane
thickness was 20 and 23 micron for the Pd and Pd/Ag membrane, respectively.
Both membranes showed a good operation and a conversion enhancement
higher than 80%. The Pd-membrane showed the best behavior with regard to
the ratio H2 permeated / mole CH4 fed, but the Pd membrane showed the
formation of pinholes in time, according to the authors due to the temperature
cycling. Surface contamination effects are not clearly mentioned, but the
authors also did not differentiate the results between the Pd or Pd/Ag
membranes.

164
8.3.4 Water Gas Shift reaction
Hwang et al. [21] investigated the use of Pd-Au membrane (2.6 micron thick,
porous nickel support) in a membrane reactor to improve the WGS reaction.
They found that steam and CO present in the feed limited the H2 flux through
the membrane. By increasing the pressure at the retentate side the inhibition
effect of H2O was completely stopped and that of CO decreased. The CO
conversion could be increased with 26% at max compared to an operation
without membrane and 81% of the H2 could be recovered at the permeate side.
Augustine [22] used a top layer of Pd (7-10 micron thick), a Pd/Ag intermediate
layer (5-8 micron thick) and a porous Inconel tube and found that at a retentate
pressure of 14 bar and temperature of 623 K, CO has an inhibitory effect on the
membrane performance. At 723 K no effect was found for CO. For CO2 a slight
inhibitory effect was found for the temperature range measured (623-723 K). A
CO conversion of 98% and a H2 recovery of 81% were achieved at 723 K. The
membrane permeance remained constant over the course of permeating tests
including the WGS testing if the H2O/CO ratio was 1.6 or 2.6. During operation
the membrane selectivity decreased. The selectivity of two membranes
decreased slowly and was in line with the leak growth mechanisms as
discussed in the previous paragraph “Membrane Stability – pinhole formation”.
However, for two other membranes the selectivity decline was too rapid to be
explained by grain boundary rearrangements. Abdollahi [23] used a Pd
membrane (3 micron thick) for more than a month at WGS conditions without a
change of the permeance conditions of the membrane. They achieved a CO
conversion of approximately 99% and a hydrogen recovery of 90% at 573K and
4.46 bar. Guazzone et al. [24] tested the use of a highly structured Pd and Pd-
Au membrane (membrane thickness 7-14 micron, thickness of Au top-layer 0.2
micron) in a desulfurized, H2-enriched syngas stream form a coal gasifier. No
specific catalyst was present to promote the WGS reaction.
The membrane was used to remove H2 from the product stream of the gasifier.
The membrane operated stable for 200 hrs at 723 K and 12.6 bar. At the start of
processing, the H2 permeance dropped with 50-60% due to contamination,
probably as a result of coking. No large difference was found between the pure
Pd and the Pd-Ag membrane. Gade [25] investigated the effect of H2S on the
H2 permeance of Pd/Au membranes produced by cold working or by magnetron
sputtering. Membranes with increased Au showed less flux inhibition by either
carbon or H2S. The permeability of a Pd/20%Au membrane was equal to that of
a membrane without Au and only dropped 40% in permeability in the presence

165
of 20 ppm H2S. Surprisingly, the stability of the magnetron sputtered membrane
was not as good as the cold worked membrane in the presence of H2S. Gade et
al. proposed corrosion spalling as mechanism, in which large palladium sulfides
are formed that flake off in the gas stream. The sputtered membranes are more
prone to sulfidation flaking. Due to the pattern of grain boundaries, sulfur can
enter deeply into the bulk, unlike the cold worked membranes.
8.4 Future work
From the literature above it was shown that pin-hole formation is due to tensile
stresses. These originate from grain growth and/or residual tensile stress in the
crystal lattice. The tensile stress can be prevented by choosing different sputter
conditions and by preventing the formation of larger grains. Therefore it is
suggested to investigate the possibilities of different sputter conditions and
search for the right alloy to prevent the formation of larger grains and differential
shrinkage during operational conditions.
With regard to contamination, alloying the membrane can help to prevent a drop
in flux as result of coking or adhesion of contaminants on the membrane
surface. However, it is clear from literature that the effects of contamination, i.e.
steam and CO, can be limited by changing the operation conditions of the
reaction. The Pd/Cu and Pd/Au alloy show a better resistance against
contamination, however it is expected that the resistance can be further
improved by optimizing the alloy composition. Probably, the first application will
not be the dehydrogenation of propane, but the simpler WGS reaction.
Therefore it is advisable to focus on the WGS and make the Pd alloy membrane
successful in this application.

166
References
1) L. S. McLeod, Hydrogen permeation through microfabricated palladium-
silver alloy membranes, PhD. Thesis, 2008
2) F. Guazzon and Y.H. Ma, Leak Growth Mechanism in composite Pd
membranes prepared by the electroless deposition method, AIChE J., 54 (2008)
487
3) T.A. Peters, W.M. Tucho, A. Ramachandran, M. Stange, J.C. Walmsley,
R. Holmestad, A. Borg, and R. Bredesen, Thin Pd-23%Ag/stainless steel
composite membranes: Long-term stability, life-time estimation and post-
process characterization, J. Membr. Sci., 326 (2009) 572
4) A. Castrup, C. Kübel, T. Scherer, and H. Hahn, Microstructure and
residual stress of magnetron sputtered nanocrystalline palladium and palladium
gold films on polymer substrates, J. Vac. Sci. Technol. A, 29 (2011), 21013
5) J. Chen and J.A. Barnard , Growth, structure and stress of sputtered TiB2
thin films, Mat. Sci. and Eng. A, 191 (1995), 233
6) T.D. Hien, Microfabricated Palladium-based membranes for hydrogen
separation, PhD. Thesis, 2004, p. 64
7) M.E. Ayturk, E.A. Payzant, S.A. Speakman, and Y.H. Ma, Isothermal
nucleation and growth kinetics of Pd/Ag alloy phase via in situ time-resolved
high-temperature X-ray diffraction (HTXRD) analysis, J. Membr. Sci., 316
(2008), 97
8) P. K. Seelam, S. Liguori, A. Iulianelli, P. Pinacci, V. Calabrò, M.
Huuhtanen, R. Keiski, V. Piemonte, S. Tosti, M.D. Falco, and A. Basile,
Hydrogen production from bio-ethanol steam reforming reaction in a Pd/PSS
membrane reactor, Catal. Today, 193 (2012), 42
9) A. Basile, P. Pinacci, A. Iulianelli, M. Broglia, F. Drago, S. Liguori, T.
Longo, and V. Calabrò, Ethanol steam reforming reaction in a porous stainless

167
steel supported palladium membrane reactor, Int. J. Hydrogen Energy, 36
(2011), 2029
10) S. Yun, H. Lim, and S.T. Oyeama, Experimental and kinetic studies of
the ethanol steam reforming reaction equipped with ultrathin Pd and Pd-Cu
membranes for improved conversion and hydrogen yield, J. Membr. Sci., 409-
410 (2012), 222
11) A. Iulianelli, P.K. Seelam, S. Liguori, T. Longo, R. Keiski, V. Calabrò, and
A. Basile, Hydrogen production for PEM fuel cell by gas phase reforming of
glycerol as byproduct of bio-diesel. The use of a Pd-Ag membrane reactor at
middle reaction temperature, Int. J. of Hydrogen Energy, 36 (2011), 3827
12) C. Yu and H. Xu, An efficient palladium membrane reactor to increase
the yield of styrene in ethylbenzene dehydrogenation, Sep. Purif. Technol., 78
(2011), 249
13) M.P. Gimeno, Z.T. Wu, J. Soler, J. Herguido, K. Li, and M. Menéndez,
Combination of a Two-Zone Fluidized Bed Reactor with a Pd hollow fibre
membrane for catalytic alkane dehydrogenation, Chem. Eng. J., 155 (2009),
298
14) E. Gbenedio, Z. Wu, I. Hatim, B.F.K. Kingsbury, and K. Li, A
multifunctional Pd/alumina hollow fibre membrane reactor for propane
dehydrogenation, Catal. Today, 156 (2010), 93
15) S.-K. Ryi, C.-B. Lee, S.-W. Lee, K.-R. Hwang, and J.-S. Park, Hydrogen
recovery from ethylene mixture with Pd-Au composite membrane, Energy, 47
(2012), 3
16) F. Borgognoni, S. Tosti, M. Vadrucci, and A. Sanctucci, Pure hydrogen
production in a Pd-Ag multi-membranes module by methane steam reforming,
Int. J. of Hydrogen Energy, 36 (2011), 7550
17) F. Borgognoni and S. Tosti, Pd-Ag multi-membranes module for
hydrogen production by methane auto-thermal reforming, Int. J. of Hydrogen
Energy, 37 (2012), 1444

168
18) G. Chiappetta, G. Barbieri and E. Drioli, Pd/Ag-based membrane
reactors on small scale: Assessment of the feed pressure and design
parameters on the performance, Chem. Eng. Process., 49 (2010), 722
19) A. Basile, S. Campanari, G. Manzolini, A. Iulianelli, T. Longo, S. Liguori,
M.D. Falco, and V. Piemonte, Methane steam reforming in a Pd-Ag membrane
reformer: An experimental study on reaction pressure influence at middle
temperature, Int. J. of Hydrogen Energy, 36 (2011), 1531
20) M.L. Bosko, and J.F. Múnera, E.A. Lombardo, L.M. Cornaglia, Dry
reforming of methane in membrane reactors using Pd and Pd-Ag composite
membranes on a NaA zeolite modified porous stainless steel support, J.
Membr. Sci., 364 (2010), 17
21) K.-R. Hwang, S.-W. Lee, S.-K. Ryi, D.-K. Kim, T.-H. Kim, and J.-S. Park,
Water-gas shift reaction in a plate-type Pd-membrane reactor over a nickel
metal catalyst, Fuel Process. Technol., 106 (2013), 133
22) A.S. Augustine, Y. H. Ma, and N. K. Kazantzis, High Pressure palladium
membrane reactor for the high temperature water-gas shift reaction, Int. J. of
Hydrogen Energy, 36 (2011), 5350
23) M. Abdollahi, J. Yu, P.K.T. Liu, R. Ciora, M. Sahimi, and T.T. Tsotsis,
Ultra-pure hydrogen production from reformate mixtures using a palladium
membrane reactor system, J. Membr. Sci., 390-391 (2012), 32
24) F. Guazzone, J. Catalano, I.P. Mardilovich, J. Kniep, S. Pande, T. Wu,
R.C. Lambrecht, S. Datta, N.K. Kazantzis, and Y.H. Ma, Gas permeation field
tests of composite Pd and Pd-Au membranes in actual coal derived syngas
atmosphere, Int. J. of Hydrogen Energy, 37 (2012), 14557
25) S.K. Gade, S.J. DeVoss, K.E. Coulter, S.N. Paglieri, G.O. Alptekin, and
J.D. Way, Palladium-gold membranes in mixed gas streams with hydrogen
sulfide: Effect of alloy content and fabrication technique, J. Membr. Sci., 378
(2011), 35

169
SUMMARY
The application of thin hydrogen-selective membranes suffers from the
occurrence of pinholes and a significant resistance to mass transfer in the
porous support. To overcome these problems, a thin Pd based membrane has
been developed in cooperation with the Transducer Science Technology Group
at the MESA+ Research institute of the University of Twente using microsystem
technology. Thin Pd, Pd alloy or Pd-Ta-Pd layers have been deposited on a
dense and smooth surface of a silicon wafer by microwave sputtering.
After membrane deposition, the underground has been etched to release the
membrane surface for H2 permeation. Membranes have been prepared with
and without support layer. As support layer, a 1 µm thick microsieve with a large
number of round openings of 5 µm diameter has been used. This fabrication
process resulted in pinhole-free Pd, Pd/Ag and Pd-Ta-Pd membranes with a
thickness between 0.5 and 1.2 µm.
The focus of the research described in this thesis is the exploration of the
membrane performance at various conditions. The selectivity and permeance of
the membranes have been established, also with the presence of H2O,
methane, propane, CO and CO2 at the retentate side of the membrane.
The membranes have been characterized by determining the H2 and He flux as
function of temperature (623-873K) and feed composition (0<pH2<1.0 bar). At
823K, a permeance based on the free membrane area of 18 mol H2/m2·s·bar0.58
has been measured for a Pd membrane with a thickness of 0.5 µm. This is
considerably higher compared to Pd membranes prepared on porous materials
like alumina. At 873K the H2/He selectivity decreases rapidly, indicating the
formation of pinholes at higher temperatures. At lower temperature the stability
of the layer improves but after some weeks, pinholes are still formed. Therefore,
further research is necessary to increase the stability of the membrane layer.
The rate limiting transport step of H2 has been determined from a combination
of experiments and computer simulations. At elevated temperatures the limiting
transport step has been determined to be H-atom diffusion through the
membrane and at lower temperatures the H2 surface reactions at the retentate

170
side. A reduction of membrane thickness is only meaningful as long as the
diffusion through the membrane limits the transport of H2 across the membrane.
An advantage of the very thin membranes is that contaminants will reveal their
inhibitive effects more strongly than relatively thick membranes. The H2 flux
through the membranes has been studied for periods of more than 80 hours
during and after addition of CO2 or H2O to the feed. Measurements have been
carried out at 623, 673 and 723K. The largest flux reductions found are 70%
and 69% at 623K for H2O and CO2, respectively.
After stopping the steam addition, the H2 permeance restored to its original
value. After stopping the CO2 addition the H2 permeance increases, but to a
value lower than before the CO2 addition. Surprisingly large time constants
have been found for the transient permeance behavior. The inhibitive effect
caused by the addition of CO2 is almost certainly caused by the formation of CO
and H2O by the reverse water gas shift (WGS) reaction. Besides by adsorption
of CO2, CO and H2O, a far stronger inhibitive effect is caused by carbon, which
is formed by the dissociation of CO and CO2.
In addition, the inhibitive effect of the presence of CO, methane or propane in
the feed has been measured. The measurements have been carried out at 623
and 723K. After adding propane or CO to the feed, the H2 flux reduces to 16%
and 47% of the initial flux, respectively. Subsequently, the H2 flux could be
restored to its original value by treating the membrane with steam. The inhibitive
effect of propane and CO is probably caused by the formation of carbon at the
Pd surface. The dynamic behavior of the H2 flux is not completely understood,
but in the presence of CO the dynamic permeation behavior is comparable to
that of adding CO2 to the membrane feed. The addition of methane did not
reveal any effect on the H2 flux.
Besides polluting compounds, the flux can be limited by the transport resistance
in the gas phase. To investigate the possibilities to optimize mass transport in
the gas phase, Computational Fluid Dynamics (CFD) calculations have been
used to model the flow in the gas phase surrounding the membrane. The
calculations show that the largest mass transfer resistance should be chosen at
the retentate side (58% reduction in mass transfer resistance, 30% higher flux)
and forcing the feed through slits reduces the mass transfer resistance
significantly (43% reduction in mass transfer resistance, 25% higher flux) at the
cost of additional pressure drop (from 0.1 to 14.3 kPa). A three dimensional
structure of the membrane increases the H2 throughput per wafer by 255 %
without forced flow. Using a forced flow, even higher values can be obtained.

171
A desk-study has been made on the industrial application of the designed
membrane and module. For this purpose a 325 kton/year propylene plant has
been chosen to study four different scenarios with varying H2 removal. The
scenario with 50% H2 removal shows the most positive business case in an
ideal environment (no pinhole formation and no inhibitive effects of compounds
present). However, it will be necessary to improve the business case by
increasing the membrane life time and/or to reduce the membrane cost
significantly. Options are to increase the membrane surface by using the 3D-
membrane structure and/or improve the stability of the membrane layer by
preventing the formation of pinholes.
The research described in this thesis has explored the use of thin hydrogen-
selective membranes fabricated with microsystem technology. Advantages of
the membranes obtained are high H2 fluxes and pin-hole free membranes. In
addition, some drawbacks of the used membranes have been found: unstable
Pd layer at elevated temperatures and difficult module fabrication as a result of
the different thermal expansion coefficients of the materials used. Future
research should be focused on sputter conditions and grain growth to overcome
these drawbacks to obtain the full potential of the fabricated membranes. In
addition, Pd/Cu and Pd/Au membranes show a better resistance against
contamination, however, it is expected that the resistance can be further
improved by optimizing the alloy composition and membrane (reactor) operating
conditions.

172

173
DANKWOORD Dankzij de hulp van een groot aantal mensen bij de Technische Universiteit
Eindhoven en Universiteit Twente is dit proefschrift tot stand gekomen. Bij
dezen wil ik iedereen bedanken die op een of andere wijze heeft bijgedragen
aan dit eindresultaat.
In het bijzonder wil ik Jos Keurentjes bedanken voor het in mij gestelde
vertrouwen en de vrijheid die ik van Jos heb gekregen tijdens de uitvoering van
mijn promotieonderzoek. Jos, je hebt veel geduld moeten hebben, maar dan is
het boekje er toch. Bedankt, om ook deze laatste fase samen met mij op te
pakken. Ditzelfde geldt ook voor Marius Vorstman. Marius, bedankt voor alle
input die je hebt geleverd en voor de heerlijke wetenschappelijk discussies die
we samen hebben gevoerd over dit onderwerp maar ook vele meer. Daarnaast
wil ik ook Jan Meuldijk bedanken voor zijn enthousiasme en steun in met name
de laatste fase.
Zonder Cees van Rijn was dit promotieonderzoek er nooit geweest. Cees
bedankt voor de initiatie van dit prachtige onderwerp en voor je enthousiasme
om microsyteem technologie op de kaart te zetten.
Hien, I would like to thank you for all your support during the years and fruitful
discussions about membrane design. Without your membranes the work would
be limited to simulations only. It was a pleasure to work together with you.
Daarnaast wil ik Erwin Harbers bedanken voor zijn werk aan hoofdstuk 6
(eindopdracht twAiO proces en productontwerp). Het is je toch gelukt om in
CFX een membraan te implementeren. Antonio Martino thanks for your work
published in chapter 7, not a paper but a chapter. Your Italian humour was a
good medicine against the frustrations at times that the membrane broke during
the placement in the membrane holder.
Tevens hebben een viertal afstudeerders een goed stuk werk afgeleverd Hans
de Bock, Ralf Knibbeler, Paul Duysinx en Chris Aarnoutse. Alle vier van harte
bedankt voor jullie enthousiasme en inzet. Zonder jullie inzet waren de artikelen
er niet gekomen.

174
Voor de experimenten zijn twee volledig geautomatiseerde opstellingen
gebouwd. Ik wil hiervoor onder andere Jovita, Anton, Chris, Piet en Vincent
bedanken.
Mijn kamergenoot Chris Scholtens wil ik bedanken voor de leuke tijd en de hulp
bij de praktische problemen van het experimenteren. Voor die goede sfeer
hebben natuurlijk ook alle andere oud collega’s gezorgd zoals (waarvan
sommige nog steeds collega’s zijn) Zwannet, Marc, Arjan, Maartje, Peter,
Johan, Wil, Joop, Joost, Thijs, Marcus, Martijn, Henny, Ana.
Niet alleen mensen van de TUE en UT moet ik bedanken, maar ook Cleem
Köllmann van FrieslandCampina. Cleem bedankt voor het laatste duwtje in de
rug en voor de support anders was dit boekje er niet meer gekomen. Ook mijn
andere FrieslandCampina collega’s in de Basic Products groep wil ik bedanken,
met name voor het blijven vragen ‘Hoe gaat het met je proefschrift?’.
Tot slot wil ik mijn nabije familie bedanken voor alle support. Natuurlijk mijn
eigen ouders en zus die steun bleven geven. Mas tamben minha familia em
Potugal, muito obrigado pelo apoio e confiance em mim. Daarnaast natuurlijk
Bernardete die het hele traject met mij heeft meegemaakt en onze kinderen
Ana en Ricardo. Jullie hebben het met periodes zwaar gehad tijdens de
vakanties en weekenden. Bedankt voor jullie geduld en hulp.
Iedereen bedankt.
Frank Gielens

175
CURRICULUM VITAE Frank Gielens was born on July 16th, 1973 in Zaandam. In 1991 he graduated
from the St. Michaël College Zaandam (VWO, high school). Subsequently, he
started his university study, chemistry, at the University of Amsterdam (UVA). In
1996 he graduated with the specialization chemical engineering. In 1997 he
started at the design course Process and Product design (TwAIO) at the
Eindhoven University of Technology. Subsequently, in 1999 he started his PhD-
project in the Process Development Group at the Eindhoven University of
Technology, supervised by ir. M.A.G. Vorstman and prof. dr. ir. J.T.F.
Keurentjes. After a short period of giving classes of chemistry and general
natural sciences at the Lyceum VOS in Vlaardingen (VWO) he started in 2005
as process technologist within the process development group of ir. Cleem
Köllmann at the dairy company Campina (predecessor of the Royal
FrieslandCampina dairy company).