thermodynamic analysis of reaction-induced phase separation in epoxy-based polymer dispersed liquid...
TRANSCRIPT

ELSEVIER PII: S0032.3861(97)00276-0
Polymer Vol. 39 No. 4, pp. 845-853, 1998 © 1997 Elsevier Science Ltd
Printed in Great Britain. All rights reserved 0032-3861/97/$17.00+0.00
Thermodynamic analysis of reaction-induced phase separation in epoxy-based polymer dispersed liquid crystals (PDLC) Julio Borrajo a, Carmen C. Riccardi a, Roberto J.J. Williams a'*, Humaira Masood Siddiqi b, Michel Dumon b and Jean P. Pascault b alnstitute of Materials Science and Technology (INTEMA), University of Mar del Plata and National Research Council (CONICET), J.B. Justo 4302, (7600) Mar del Plata, Argentina bLaboratoire des Materiaux Macromol6culaires (UMR CNRS n ° 5627), Institut National des Sciences Appliqu6es de Lyon, 20 Av. Albert Einstein, F-69621 Villeurbanne Cedex, France (Revised I April 1997)
The Flory-Huggins theory for the free energy of mixing in isotropic phases, in conjunction with the Maier-Saupe theory for phase transition of a nematic liquid crystal, was applied to a diepoxide-diamine-liquid crystal blend in pre- and post-gel stages. The analysis was performed taking the distribution of polymeric species into account at any conversion level. In the post-gel stage, the elastic energy contribution was included in the free energy expression. Cloud-point and shadow curves, characteristic of isotropic-isotropic and nematic-isotropic equilibria, were generated in temperature v e r s u s composition coordinates covering the whole conversion range. Experimental results for the isotropic-nematic transition could be reproduced by numerical simulation, using an interaction parameter inversely proportional to temperature and decreasing with conversion. The thermodynamic analysis can be used to control the morphologies of polymer dispersed liquid crystals. © 1997 Elsevier Science Ltd.
(Keywords: polymer dispersed liquid crystals; reaction-induced phase separation; epoxy-amine reaction)
INTRODUCTION
Polymer dispersed liquid crystal (PDLC) films are materials which have potential for applications such as optical switches, displays and variable transmittance windows 1-3. The PDLC device operates by electrically controlling the refractive index of a dispersed liquid crystal (LC) phase to match that of an optically transparent polymer matrix. A typical example is a nematic LC dispersed as droplets in a polymer matrix. In the absence of a field, the nematic director is randomly distributed from one droplet to another, leading to a mismatch of LC and polymer refractive indices. This gives rise to light scattering and an opaque appearance. When an electric field is applied across the film thickness, the directors orient parallel to the field direction (LC with a positive dielectric anisotropy). In this state the film becomes transparent due to the matching between the ordinary refractive index of the LC and that of the polymer.
PDLC films are prepared by phase separating an initially homogeneous mixture of the LC in: (a) monomers that undergo polymerization (RIPS: reaction induced phase separation or polymerization induced phase separation, PIPS), (b) a thermoplastic polymer followed by cooling (TIPS: thermally induced phase separation), or (c) a thermoplastic polymer and a common solvent, followed by solvent evaporation (SIPS: solvent induced phase separation) 3. As the performance of PDLC films depends on the final morphology of the dispersed LC domains, it is
* To whom correspondence should be addressed
important to analyse the thermodynamic and kinetic factors involved in the phase separation process.
The aim of this study is to present a thermodynamic analysis of RIPS for a system consisting of an LC dissolved in epoxy-amine monomers that react to form a thermo- setting polymer. The analysis will be focused on the determination of cloud-point curves both for isotropic- isotropic and nematic-isotropic equilibria, in pre- and post- gel stages of the polycondensation. The polydispersity of the thermosetting polymer in the course of the reaction will be considered in the analysis. Theoretical predictions will be compared with experimental results obtained for a particular LC-epoxy-amine system. This paper is an extension of previous thermodynamic analysis of rubber- and thermoplastic-modified thermosetting polymers 4-6. In the present case, the isotropic-nematic equilibrium is included and the analysis is extended to the post-gel stage, considering the elastic contribution to the free energy. The analysis of phase separation beyond the cloud-point curves, i.e. describing a macroscopic phase separation in terms of coexistence curves, is under way.
A large number of thermodynamic studies in LC- polymer systems have been published. Kronberg and
7 Patterson developed a simple theory for the nematic- isotropic equilibrium in the region of high LC concentra- tions. The theory was tested with a particular LC (p- ethoxybenzylidene-p-n-butylaniline, EBBA) with two series of polymeric solutes: polystyrene and polyethylene oxide 8. Dubault e t a l . 9 presented the main types of phase diagrams obtained with flexible polymers in nematic
POLYMER Volume 39 Number 4 1998 845
Thermodynamic analysis of phase separation in PDLC: J. Borrajo et al.
solvents. Experimental data were compared with two theoretical descriptions. Ballauff m-lz used the extended Flory lattice theory to describe the phase behaviour of L C - polymer blends, including liquid-liquid phase separation in the isotropic phase. Kelkar and Manohar 13 extended the Flory-Huggins lattice theory of regular solutions to describe mixtures of nematic liquid crystals with non- nematic polymeric solutes. The nematic phase was described in terms of the Maier-Saupe approximation 14'15. A similar approach was used by Shen and Kyu 16 to describe the equilibrium limits of phase separation and the location of spinodals in a polymer dispersed liquid crystal. However, a thermodynamic description of reactive systems is not available. Only rough approximations, based on the evolution of the liquid-liquid spinodal curve with increase in the average degree of polymerization, have been described 17:8. No previous analysis has considered the influence of polydispersity of the reactive polymer both in pre- and post-gel stages and the contribution of the elastic energy in the post-gel stage.
EXPERIMENTAL
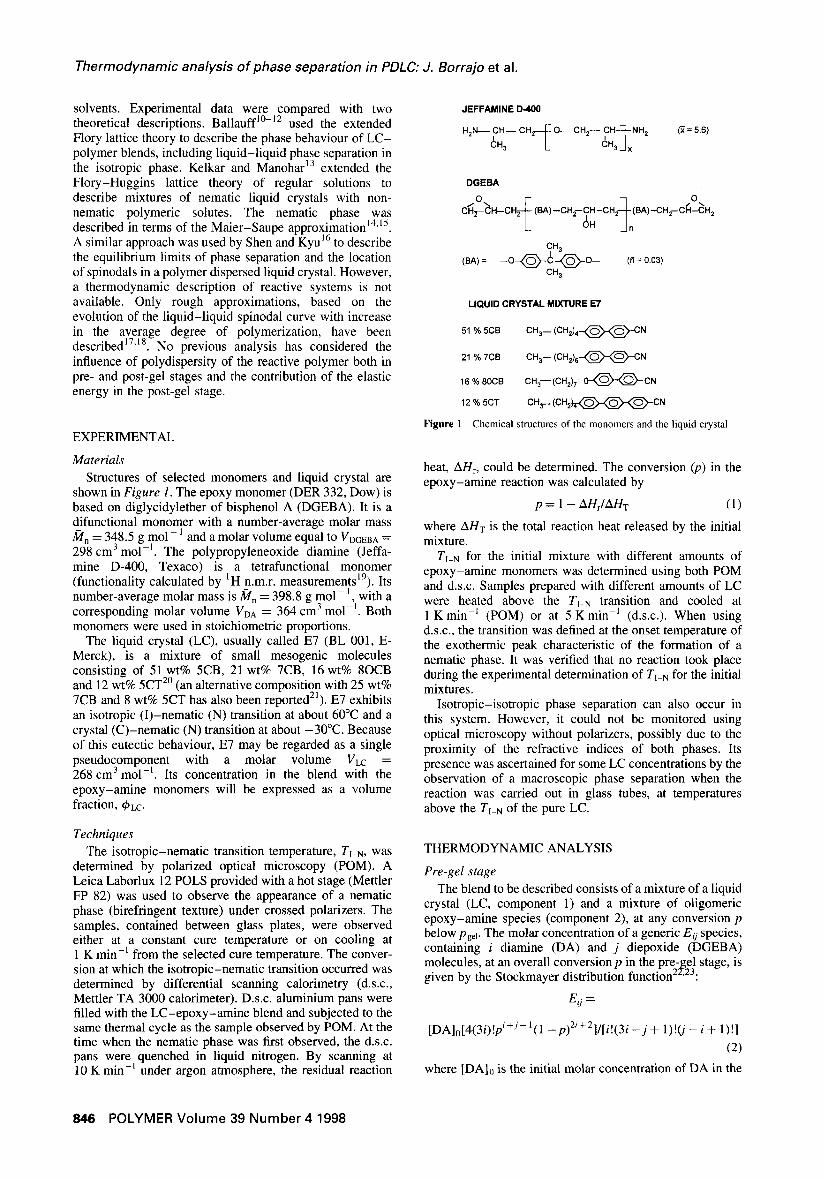
Materials Structures of selected monomers and liquid crystal are
shown in Figure 1. The epoxy monomer (DER 332, Dow) is based on diglycidylether of bisphenol A (DGEBA). It is a difunctional monomer with a number-average molar mass
1 ~/n = 348.5 g mol - and a molar volume equal to VDGEBA = 3 I 298 cm m o l - . The polypropyleneoxide diamine (Jeffa-
mine D-400, Texaco) is a tetrafunctional monomer (functionality calculated by IH n.m.r, measurementsm). Its number-average molar mass is/]~n = 398.8 g mol - 1, with a corresponding molar volume VDA = 364 cm 3 mol-L Both monomers were used in stoichiometric proportions.
The liquid crystal (LC), usually called E7 (BL 001, E- Merck), is a mixture of small mesogenic molecules consisting of 51 wt% 5CB, 21 wt% 7CB, 16 wt% 8OCB and 12 wt% 5CT 2° (an alternative composition with 25 wt% 7CB and 8 wt% 5CT has also been reported21). E7 exhibits an isotropic (I)-nematic (N) transition at about 60°C and a crystal (C)-nematic (N) transition at about -30°C. Because of this eutectic behaviour, E7 may be regarded as a single pseudocomponent with a molar volume VLC = 268 cm 3 mol -~. Its concentration in the blend with the epoxy-amine monomers will be expressed as a volume fraction, d)LC.
Techniques The isotropic-nematic transition temperature, T[_N, was
determined by polarized optical microscopy (POM). A Leica Laborlux 12 POLS provided with a hot stage (Mettler FP 82) was used to observe the appearance of a nematic phase (birefringent texture) under crossed polarizers. The samples, contained between glass plates, were observed either at a constant cure temperature or on cooling at 1 K min-1 from the selected cure temperature. The conver- sion at which the isotropic-nematic transition occurred was determined by differential scanning calorimetry (d.s.c., Mettler TA 3000 calorimeter). D.s.c. aluminium pans were filled with the LC-epoxy-amine blend and subjected to the same thermal cycle as the sample observed by POM. At the time when the nematic phase was first observed, the d.s.c. pans were quenched in liquid nitrogen. By scanning at 10 K min-~ under argon atmosphere, the residual reaction
JEFFAMINE D-400
H2N---- CH-- CH.~-~ E O--- CH2--- CH-'-~NH 2 C;H3 - k (~H3]x
(~ = 5.6)
DGEBA
/ O . . O. CH~---CH--CH2-- ~ (BA)--CH2--?H-CH2--- ~- (BA)-CH2-- C~'I-CH 2
L_ OH J n
CH3 (BA) = - - 0 - ~ --~O--
dH 3
LIQUID CRYSTAL MIXTURE E7
51% 5CB
21% 7CB
16 % 80CB
12 % 5CT
Figure 1
(fi = 0.03)
CH 3 - ( C H 2 ) 4 ~ N
CH 3- (CH2)6-4~-~)--CN
CH3--- (CH2) 7- ~ C N
CH~-- ( C H 2 ) z ~ ( ~ - C N
C h e m i c a l s t ruc tu res o f the m o n o m e r s and the l iqu id c rys t a l
heat, AHr, could be determined. The conversion (p) in the epoxy-amine reaction was calculated by
p = 1 - z ~ r - / r / Z ~ / T (1)
where M-/T is the total reaction heat released by the initial mixture.
TI-N for the initial mixture with different amounts of epoxy-amine monomers was determined using both POM and d.s.c. Samples prepared with different amounts of LC were heated above the T]_N transition and cooled at 1 K m i n -j (POM) or at 5 K min i (d.s.c.). When using d.s.c., the transition was defined at the onset temperature of the exothermic peak characteristic of the formation of a nematic phase. It was verified that no reaction took place during the experimental determination of T~_N for the initial mixtures.
Isotropic-isotropic phase separation can also occur in this system. However, it could not be monitored using optical microscopy without polarizers, possibly due to the proximity of the refractive indices of both phases. Its presence was ascertained for some LC concentrations by the observation of a macroscopic phase separation when the reaction was carried out in glass tubes, at temperatures above the TI N of the pure LC.
THERMODYNAMIC ANALYSIS
Pre-gel stage The blend to be described consists of a mixture of a liquid
crystal (LC, component 1) and a mixture of oligomeric epoxy-amine species (component 2), at any conversion p below Pgel. The molar concentration of a generic Eij species, containing i diamine (DA) and j diepoxide (DGEBA) molecules, at an overall conversion p in the pre-gel stage, is
2 Z 2 3 given by the Stockmayer distribution function ' :
Eij =
[DA]o[4(3i)!pi+j-l(1 -p)2i+ 2]/[i!(3i-j + 1) ! ( j - i -F 1)!]
(2)
where [DA]0 is the initial molar concentration of DA in the
846 POLYMER Volume 39 Number 4 1998

Thermodynamic analysis o f phase separat ion in PDLC: J. Borrajo et al.
blend. Equation (2) assumes that the polycondensation is ideal, i.e. equal reactivity of functional groups, no substi- tution effects and no intramolecular cycles. The experimen- tal epoxy-amine system devoid of LC showed an ideal behaviour as revealed by the gel conversion value and the equal reactivity of secondary and primary amine hydro- gens 19. In the presence of LC, the secondary amine hydro- gens were less reactive than the primary amine ones. This factor, together with the possible presence of intramolecular cyclization, produced a slight increase of the experimental gel conversion (from the ideal value 0.577 to 0.62 for LC mass fractions comprised within the range 0.1 --0.5) 19. HOW- ever, the theoretical simulation will consider that the poly- condensation is ideal independently of the LC concentration in the blend.
The volume fraction of an E o species in the mixture is given by
fPij = EijVij = Eij[iVDA -]-jVDGEBA] (3)
where Vij is the molar volume of Eij. The volume fraction of polymer in the blend is obtained
from
02 = ZZ0ij (4)
The corresponding volume fraction of liquid crystal is
¢~1 = 1 - ~b 2 ( 5 )
In order to describe the free energy of the mixture using a Flory-Huggins lattice model, the unit cell is assigned a molar volume V~. The number of moles of cells occupied by one LC mole is
r I = VLc/Vr (6)
The corresponding value for a generic E 0 species is
rij = Vij/Vr (7)
For a mixture of n l moles of LC and a distribution of oligomeric species (nij moles of the generic species), we can state expressions for the free energy of mixing in both an isotropic phase and a nematic phase. In an isotropic phase, the free energy of mixing may be expressed by the Flory-Huggins equation as 24
AGl = R T [ n l , l l n ~ l , l + ~ n i j , lln Oij, l + r ln l , lX02, l] (8)
where I stands for isotropic, R is the gas constant, T is the absolute temperature, and X is the Flory-Huggins interac- tion parameter, assumed to be a function of temperature and conversion. The dependence on conversion is introduced to take into account the variation of the chemical structure of the polymer during the reaction 5"6. Although equations were also derived for the case that X is also dependent on com- position, it was not necessary to consider this effect for the particular system under study.
Volume fractions are related to the number of moles by:
dat = nl rj/(nl rj + ~Y]nijrij ) (9)
4~ij = nijrij/(nlrl + S, Enijrij) (10)
Chemical potentials in the isotropic phase may be obtained from equation (8):
A#1,1 =OAGl/Onl,l =
RT{ 1 + in ~bl, ~ - rj [(~bl,ffrl) + (q~2,1/r2,i)] -I- rlX(~2,1) 2 }
(11)
Al~ij, l = OAGt/Onij, ] =
RT{ 1 + In ~ij, l -- rij[(dPl,l/rl) -[- (~b2, I/r2,I)] + rijx(dPl,l) 2 }
(12)
where
r2, I : ~2, l / ~ ( dPij, ~/rij ) (13)
In a nematic phase, the free energy of mixing may be expressed combining Flory-Huggins and Maier-Saupe the- oriesl3,16:
AGN = RT[nl,N In ~bl,y + ~'nij, N In ~)ij, Y AC- rlnl,NXOz, N
+ 0'/2)~bl. Nnl, NS 2 -- nl, Nln Z] (14)
N stands for nematic and u is the Maier-Saupe quadrupole interaction parameter, given by
v = 4.54T l_ N/T (15)
where T~_y is the isotropic-nematic transition temperature of the pure liquid crystal. Z is the orientational partition function for the nematic component of the mixture,
Y Z = 0exp [(m/2)(3cos20- 1)]d(cos 0) (16)
where 0 is the angle between a reference axis and the direc- tor of a liquid crystal molecule, and m is a mean field para- meter characterizing the strength of the potential field. It can be expressed as 16
m = ~bl. N ~'s (17)
where s represents the orientational order parameter, defined as
s =
f' (l/Z) 0(1/2)(3cos20- 1)exp [(m/2)(3cos:O- l)]d(cos 0)
(18)
By expanding the exponential function in series, Z and s may be calculated by:
Z = exp ( - m/2) ~-" (1.5m)n/[n!(2n + 1)1 (19) n = 0
s={n=~o l .5 (1 .5m)n / [n ! (2n+3) ] } /
1.5m)nl[n!(2n + 1 - 0.5 (20)
Both functions are rapidly convergent, which is useful for computational calculations. Values of Z and s arising from equations (19) and (20), truncated at high values of n, con- stitute a more rigorous approach than fourth-order poly- nomial expansions that have been proposed in the literature 16. A value of n = 100 was used in the present calculations.
For a given temperature and composition, the orienta- tional order parameter, s, is obtained from the simultaneous solution of equations (17) and (20). The limits of s where a stable nematic order can be found are ~6
0.44-< s - - 1 (21)
POLYMER Volume 39 Number 4 1998 847

Thermodynamic analysis of phase separation in PDLC: J. Borrajo et a l.
The corresponding mean field parameter of the nematic phase is
m -> 2 (22)
Chemical potentials in the nematic phase may be obtained from equation (14):
Ap, i, N = OAGNIOnl, N
= RT{ 1 + In ( ~ l , g - - rl [(q~l,g/rl) ÷ (q~2,N/r2,N)]
+ rl X(q52, N)2 + (v/2)s 2 (~bl ' N)2 _ In Z } (23)
Atxij, N = OAGN/Onij, N
= RT{ 1 + in dPij, N - - rij[(dPi,N/rl) ÷ (q~2,N/r2,N)]
+ rijx(C~l,y) 2 + (rij/rl)(v/2)s2(Ol, N) 2 }
where
(24)
r2, N = qb2, N / ~ ( ~ t j , N/rij) (25)
At equilibrium, the following equations must be verified:(i) Isotropic- isotropic
A//'I, I(Or) = A/*I, 1(/3) (26)
Algij, I( Ot ) = Atl"ij, 1(/3) (27)
where o~ represents the primary phase and/3 the differential segregated phase. Coordinates of the a-phase define the cloud-point curve (CPC) whereas conditions of the /3- phase determine the shadow curve. At any temperature, a point located in the CPC has a conjugated point at equi- librium in the shadow curve. (ii) I so tropic -nemat ic
A/Xl, I = A/Zl, N (28)
Algij, I = A/g0, N (29)
Both sets of equations were solved independently, using the procedure developed by Kamide et al. 25. Temperature versus composition curves representing a particular equi- librium at a given conversion were generated. From these curves, the prevailing phase equilibrium at particular values of temperature, composition and conversion could be determined.
To solve each set of equations it was necessary to truncate the distribution of Eij species at selected values of/max and jmax" These values were defined such that the mass-average molar mass of the generated distribution agreed with the theoretical prediction 22 within an error of 0.5%. The number of species to be considered increased significantly when the conversion p got close to Pgel = 0.577. Numerical simulations were performed from p = 0 to p = 0.5, although it was possible to get closer to Pgel by increasing the computation time. The reference volume was taken as V, = VLC, such that r l = 1.
In order to verify the mathematical procedure, simula- tions presented in the literature for simple binary systems were reproduced. In particular, the phase diagram presented by Shen and Kyu 16, showing liquid-liquid and nematic- isotropic equilibria for a binary system characterized by r2/r~ = 9/4 and X = - 0.3 + 217/T, could be exactly reproduced.
Post-gel stage In the post-gel stage the polymer consists of one molecule
of gel (I/NA moles, where NA is the Avogadro number) and a distribution nii of moles of sol. Molecular parameters of
the sol-gel distribution may be obtained from statistical models describing the polycondensation in the post-gel stage 26,27.
The mass fraction of sol, w~, for a conversion p >- Pge~, is given by
4 3 W s = WDAX ÷ WDGEBALDX ÷ 1 - -p ]2 (30)
where
x = [( 1/p 2) - 0.75] 1/2 _ 0.5 (31 )
is the probability of seeing a finite chain when looking out from a randomly chosen amine hydrogen, and WDA and WDCEBA are the mass fractions of both monomers (defined such that their sum is equal to one).
The mass fraction of gel, Wg, is obtained from
wg = 1 - Ws (32)
In order to determine the contribution of the elastic energy to the free energy it is necessary to estimate the concentra- tion of elastic chains in the gel. In this regard, it is necessary to establish the concentration and type of crosslinking points. In general, for A 4 (diamine, DA) + B2 (diepoxide, DGEBA) systems, crosslinking points of functionality 3 (X3) and 4 (X4) may be defined 26. These are, respectively, the DA units with 3 or 4 paths issuing to infinity. But, in our case, the chain joining the two amine groups of the diamine must be counted among the elastic chains. Therefore, only X3 crosslinking points should be considered. Their concen- tration, per unit mole of diamine, is given by
[X3[DA = 2P(X4) + P(X3) (33)
where P(X4) and P(X3) are, respectively, the probabilities of finding a diamine unit with 4 and 3 paths issuing to infinity. Equation (33) may be written, in terms of x defined by Equation (31), as
[X3]DA = 2(1 -- X) 4 + 4X(1 -- X) 3 (34)
In turn, one mole of DA in the stoichiometric formulation is associated with a total volume VDA + 2VDcEBA, of which a fraction Wg constitutes the gel volume per mole of DA. Therefore, the concentration of crosslinking points per unit volume of gel is given by
[X 3 ] = [2(1 - x) 4 + 4x(1 - x)3]/[wg(VDA + 2VDcEBA)]
(35)
As (3/2) elastic chains issue from a crosslinking point X3, the concentration of elastic chains per unit volume of gel is given by:
v A = (3/2)[X3] (36)
Another way to count elastic chains is to consider only the DA units, a situation arising when this unit is long and flexible compared to the diepoxide structure 28'29. With this way of counting elastic chains, their concentration may be alternatively expressed by:
v B = (1/2)[X3] (37)
In what follows, the concentration of elastic chains per unit volume of gel will be denoted by re, implying that either VA or v8 may be used in the numerical calculations.
Let us now determine some characteristics of the sol phase which are necessary for the thermodynamic analysis. In order to establish the molecular distribution in the sol it is necessary to calculate the conversion of functionalities of type A (amine hydrogens), PAs, and of type B (epoxy
848 POLYMER Volume 39 Number 4 1998

Thermodynamic analysis of phase separation in PDLC: d. Borrajo et al.
groups), PBs. These quantities are given by 27
PAs ~--- (P/X)(P x3 -'l- 1 - p) (38)
PBs = px3 /(P x3 + 1 -- p ) (39)
The stoichiometric ratio of amine hydrogens to epoxy groups in the sol is given by
rso I = pBs/Pas = x 4 / ( p x 3 --}- 1 - p)2 (40)
The molar concentration of a generic E 0 species in the sol, containing i diamine and j diepoxide molecules, at an over- all conversion p in the post-gel stage, may be calculated from the Stockmayer distribution function3°:
Eij ----- [DA]0 x4 [4( 1 - PAs)( 1 -- PBs)/PBs]
× [(3i)~'!(vTi!)(6i/ j!)]/[(3i--j+ 1)!(j-- i + 1)!] (41)
where [DA] 0 is the initial molar concentration of DA in the blend, and
3' = PBs(1 - PAs)3/(1 -- PB~) (42)
= PAs(1 -- PBs)/(1 -- PAs) (43)
The volume fraction of an E 0 species in the mixture is given by
q~ij = E i j ( iVDA +jVDGEBA) (44)
The volume fraction of polymer sol in the blend is obtained f rom
q~s = ~ i j (45)
The corresponding volume fraction of polymer gel results f rom
4~g = 4~sWJ(1 - Wg) (46)
The volume fraction of polymer in the mixture with LC is given by
q~2 = t~s + ~g (47)
To establish convenient values for the truncation of the distribution of E 0 species, we will make use of the mass- average molar mass of the sol, defined by 27
aT/w (sol) = { (rsol/2)[ 1 + rsol(PAs)Z](MDA) 2
+ [1 + 3rsoI(PAs)2](MDGEBA) 2
+ 4rsolPAsMDAMDGEBA }/{ [(rsol/2)MDA
+ MDGEBA][I -- 3rsol(PAs) 2] } (48)
aS/w (sol) decreases with conversion. Values of/max andjmax at a given p > Pge~ were obtained by imposing a maximum error of 0.5% between the mass-average molar mass of the sol arising from the truncated distribution and the one cal- culated by equation (48).
Having characterized the sol and gel fractions as a function of conversion, we can now proceed to the calculation of the different contributions (mixing, elastic and nematic) to the free energy.
The extensive free energy of mixing may be expressed by the Flory-Huggins equation, as24:
A G m = RT[nt ln dpj + EP.nijln 06 + (1/NA)In ~g Jr- n I r I X~b2]
(49)
But, as the term containing the Avogadro number, NA, is negligible, equation (49) reduces to
AGm = R T [ n l l n ~bl + £r-noln Oij-k-nlrlXC~2] (50)
The mixing contribution to the chemical potential may be obtained from the corresponding derivatives of equation (50), i.e. as in equations (11) and (12). This gives:
A#I, m = RT{ 1 + In ~1 - - rl [(~ l/rJ ) + (Os/r~)] + rl X(~b2)2 }
(51)
Ap'ij, m = RT{ 1 + In ~b/j - rij[(Ol/rl) + (0s/rs)] + rqx(d& )2 }
(52)
where
r S = OslE~,(OoIrij) (53)
According to the molecular theory of rubber elasticity 31, the elastic free energy per unit volume of gel for iso- tropic dilatation, by a linear factor R, of a perfect network containing trifunctional crosslinking points is given by a general expression that may be reduced to two limiting cases:
Affine network
AGe.v = veRT[(3/2)O x2 - 1) - (2/3)1n X 3] (54)
Phantom network
AGe, v = (re/2)( ~k2 -- 1) (55)
where
X = (W/Wo) 1/3 = ~ £ 1/3 (56)
V and V0 being the prevailing volume of the network and the volume in the state of reference; i.e., the state of rest in which the chains of the network assume their random, unperturbed configurations at the given temperature.
The elastic contribution to the chemical potentials may be obtained by expressing the elastic free energy in an extensive form and performing the corresponding deriva- tions. The following equations were obtained:
A#I. e = RT[rl Pe Vrf(~g)] (57)
Alzij, e = RT[rijue Vrf ( (Og) ] (58)
where Ue is given by either equation (36) or equation (37), and
,h 1/3 - (2/3)~g (affine network) (59) f(~bg) = .~g
f (0g) = (1/3)4~1g/3 (phantom network) (60)
Finally, the nematic contribution to the chemical potentials is obtained from equations (23) and (24) as:
A#I,N = R T { ( v / 2 ) S 2 ( O I , N ) 2 -- In Z} (61)
A#ij, N = RT{ (rij/r j )(vl2)s2(dal, N) 2 } (62)
At equilibrium, the following equations must be verified: (i) Gel- isotropic phase (sol + LC)
AgI,G = Agl,l (63)
A/tO, G = A/zij ' ~ (64)
POLYMER Volume 39 Number 4 1998 849
Thermodynamic analysis of phase separation in PDLC: J. Borrajo et al.
Adding the different contributions, the chemical potentials may be written as:
A/~t, G =RT{1 + In ~bl, G -- rl[(O1,Uq ) + (~s,G/r~,6)]
+ r lX(~2 ,G) 2 + rl veVrf(q~g,G) } (65)
AI£1, I = R T { 1 + In 01,1 -- rl [(~b], I/rl ) + (~s, l/rs, I)]
+ rlX(q~s,l) 2 } (66)
Agij, G = RT{ 1 + in Oij, G - r6[(01, G/r, ) + (q~s,G/rs, G)]
+ ri jX(~l ,G) 2 + rijveVrf(dPg, G)}
Alzij, i = R T { 1 + In ~b/j, l - rij[(4~l,l/rl) + (0s, i/r~,l)]
+ rijx((91,1) 2 }
w h e r e ~ l , l -~- ~s,l = 1. (ii) Gel-nematic phase (sol + LC)
Agl , G = Ap, l, N
A#ij, G : AtJ'ij, N
The chemical potentials
A~I,N = R T { 1 +ln 01,N
+ rl X(q~s, N) 2 +
(68)
0.8
0.6
0.4
(69)
(70)
in the nematic phase are given by:
-- r I [(q~l,N/rl) + (q~s,N/rs, N)]
(V/2)S2(OI,N) 2 -- In Z} (71)
A g 0, N = R T { 1 + In 0,7, N -- rij [(•1, N/rl ) + (q~s, N/rs, N)]
+ rijx(Cbl, N) 2 + (rij/r l)(v/2)s2(OI, N) 2 } (72)
where 4~l,N + ¢s,N = 1. Both sets of equations were solved independently, using
the procedure developed by Kamide et al. 25 Temperature versus composition curves representing a particular equi- librium at a given conversion were obtained. The prevailing phase equilibrium for particular values of temperature, composition and conversion was determined. Numerical solutions were obtained in the conversion range, p > 0.70, although it was possible to get closer to Pgel (0.577) by increasing the computation time.
RESULTS AND DISCUSSION
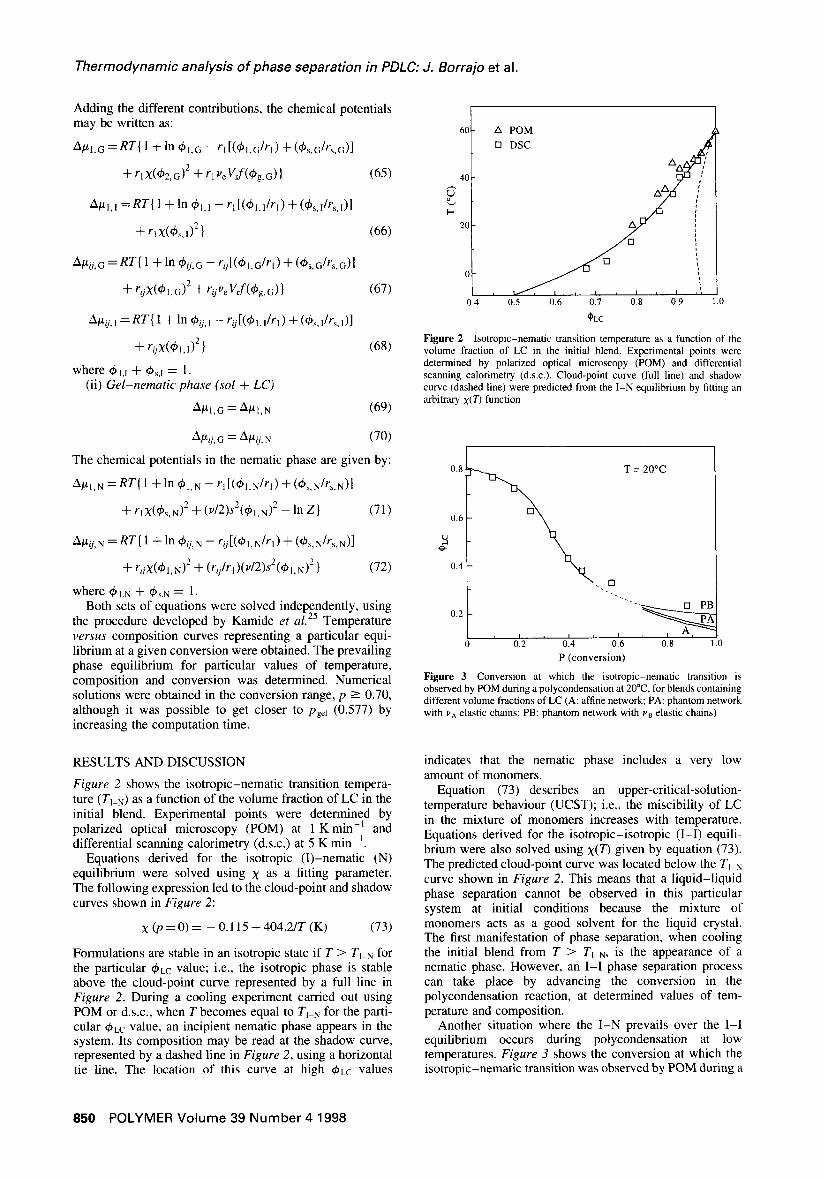
Figure 2 shows the isotropic-nematic transition tempera- ture (TI-N) as a function of the volume fraction of LC in the initial blend. Experimental points were determined by polarized optical microscopy (POM) at 1 K min -1 and differential scanning calorimetry (d.s.c.) at 5 K min -l.
Equations derived for the isotropic (I)-nematic (N) equilibrium were solved using X as a fitting parameter. The following expression led to the cloud-point and shadow curves shown in Figure 2:
X ( p = 0 ) = - 0.115 + 404.2/T (K) (73)
Formulations are stable in an isotropic state if T > TI_ N for the particular ~bLC value; i.e., the isotropic phase is stable above the cloud-point curve represented by a full line in Figure 2. During a cooling experiment carried out using POM or d.s.c., when T becomes equal to TI-N for the parti- cular 4~LC value, an incipient nematic phase appears in the system. Its composition may be read at the shadow curve, represented by a dashed line in Figure 2, using a horizontal tie line. The location of this curve at high 4~LC values
60 A POM
[] DSC
AA~' J / ;
o i i
I OIt.~'~. i I ! 0.4 0.5 0.6 0.7 018 9 1.0
i
0LC
Figure 2 Isotropic-nematic transition temperature as a function of the volume fraction of LC in the initial blend. Experimental points were determined by polarized optical microscopy (POM) and differential scanning calorimetry (d.s.c.). Cloud-point curve (full line) and shadow curve (dashed line) were predicted from the I -N equilibrium by fitting an arbitrary x(T) function
(67)
T = 20°C
. [] " ' - . .
0.2
r i - - i , i L I ,
0.2 0.4 0.6 0.8 1.0 P (conversion)
Figure 3 Conversion at which the isotropic-nematic transition is observed by POM during a polycondensation at 20°C, for blends containing different volume fractions of LC (A: affine network; PA: phantom network with VA elastic chains; PB: phantom network with vB elastic chains)
indicates that the nematic phase includes a very low amount of monomers.
Equation (73) describes an upper-critical-solution- temperature behaviour (UCST); i.e., the miscibility of LC in the mixture of monomers increases with temperature. Equations derived for the isotropic-isotropic (I-I) equili- brium were also solved using x(T) given by equation (73). The predicted cloud-point curve was located below the TI_N curve shown in Figure 2. This means that a liquid-liquid phase separation cannot be observed in this particular system at initial conditions because the mixture of monomers acts as a good solvent for the liquid crystal. The first manifestation of phase separation, when cooling the initial blend from T > TI-N, is the appearance of a nematic phase. However, an I - I phase separation process can take place by advancing the conversion in the polycondensation reaction, at determined values of tem- perature and composition.
Another situation where the I -N prevails over the I-I equilibrium occurs during polycondensation at low temperatures. Figure 3 shows the conversion at which the isotropic-nematic transition was observed by POM during a
850 POLYMER Volume 39 Number 4 1998
Thermodynamic analysis of phase separation in PDLC: J. Borrajo et al.
100 [ ] t t
t t ¢ t it it i t /
p = l , , ,, / " t t I t /
¢ t ' i 80 ] ] , ,, , + ] p = 0.85 ,' "
• J * " t t s s + / J
60 / ,' ,' ,, / ,,' 0.7 ,' r.) p= / j
o t . i ,, • i s • v # ,i i / • .*
• t . • . , i , ,
[~ 40 , , " '. , 'p = 0.5 , - ' " / , " t t " , l ,, , .~ ,'p=0.40 / , , ,
20 . . . . / ~ ~0 "
,y/ /" , - " , - - " P - O ' / - p = 0
0.1 0.2 0.3 0.4 0.5 0.6 0.7 0.8 0.9 1.0
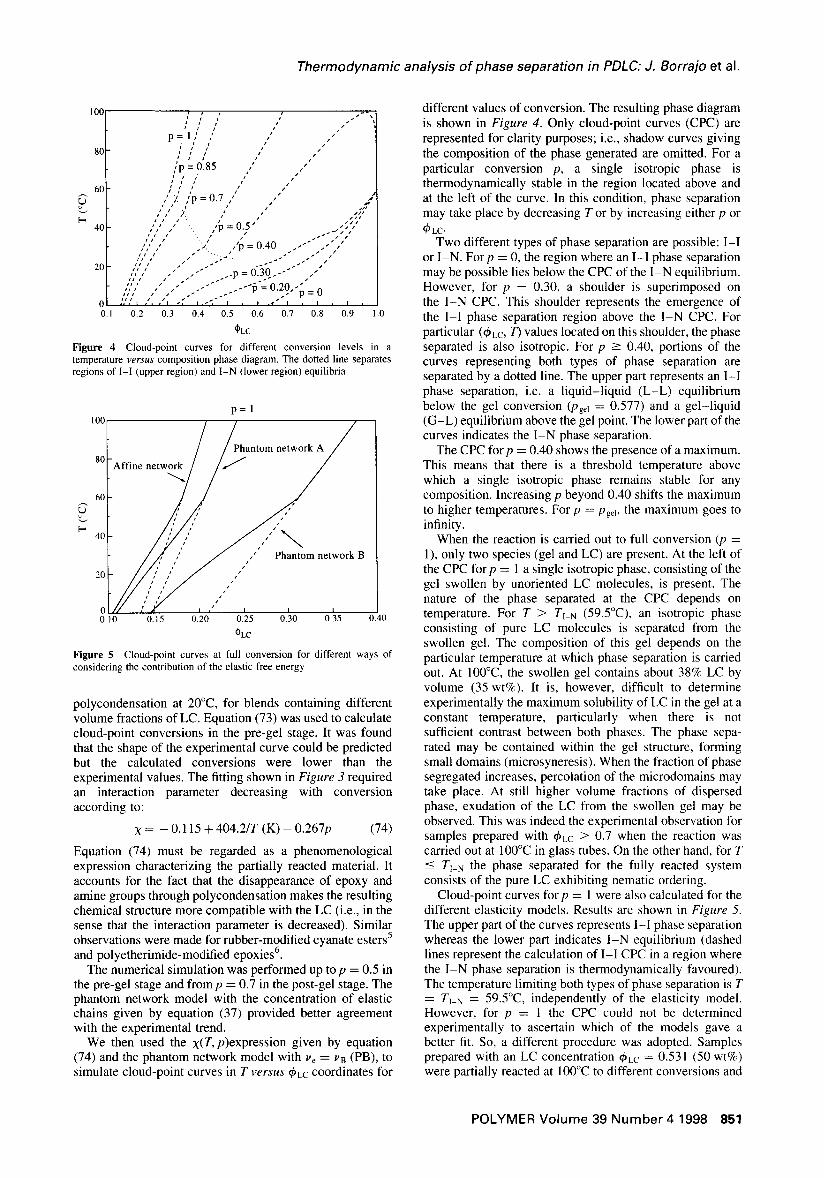
Figure 4 Cloud-point curves for different conversion levels in a temperature versus composition phase diagram. The dotted line separates regions of I-I (upper region) and I-N (lower region) equilibria
p = l 100
////Phantom network A /
80 "Affine netw..0~ / ~ " /
6O ~ , ,' , 7
['-" 40 ~ , , " "
20 / ~ , , , ' ~ , , , ' Phantom network B
/ / ',,U it / j l
0 //I r'/J~'/ I , ' I I I 0 . 1 0 0 . 1 5 0 . 2 0 0 . 2 5 0 . 3 0 0 . 3 5 0 . 4 0
~ec
Figure 5 Cloud-point curves at full conversion for different ways of considering the contribution of the elastic free energy
polycondensation at 20°C, for blends containing different volume fractions of LC. Equation (73) was used to calculate cloud-point conversions in the pre-gel stage. It was found that the shape of the experimental curve could be predicted but the calculated conversions were lower than the experimental values. The fitting shown in Figure 3 required an interaction parameter decreasing with conversion according to:
X = - 0.115 + 404.2/T (K) - 0.267p (74)
Equation (74) must be regarded as a phenomenological expression characterizing the partially reacted material. It accounts for the fact that the disappearance of epoxy and amine groups through polycondensation makes the resulting chemical structure more compatible with the LC (i.e., in the sense that the interaction parameter is decreased). Similar observations were made for rubber-modified cyanate esters 5 and polyetherimide-modified epoxies 6.
The numerical simulation was performed up to p = 0.5 in the pre-gel stage and from p = 0.7 in the post-gel stage. The phantom network model with the concentration of elastic chains given by equation (37) provided better agreement with the experimental trend.
We then used the x(T, p)expression given by equation (74) and the phantom network model with Ve = UB (PB), to simulate cloud-point curves in T versus ~bLC coordinates for
different values of conversion. The resulting phase diagram is shown in Figure 4. Only cloud-point curves (CPC) are represented for clarity purposes; i.e., shadow curves giving the composition of the phase generated are omitted. For a particular conversion p, a single isotropic phase is thermodynamically stable in the region located above and at the left of the curve. In this condition, phase separation may take place by decreasing T or by increasing either p or ~LC"
Two different types of phase separation are possible: I - I or I -N. Forp = 0, the region where an I - I phase separation may be possible lies below the CPC of the I - N equilibrium. However, for p = 0.30, a shoulder is superimposed on the I - N CPC. This shoulder represents the emergence of the I - I phase separation region above the I - N CPC. For particular (~bLC, T) values located on this shoulder, the phase separated is also isotropic. For p - 0.40, portions of the curves representing both types of phase separation are separated by a dotted line. The upper part represents an I - I phase separation, i.e. a liquid-liquid (L-L) equilibrium below the gel conversion (Pgel = 0.577) and a gel-liquid (G-L) equilibrium above the gel point. The lower part of the curves indicates the I - N phase separation.
The CPC forp = 0.40 shows the presence of a maximum. This means that there is a threshold temperature above which a single isotropic phase remains stable for any composition. Increasing p beyond 0.40 shifts the maximum to higher temperatures. For p = Pgeb the maximum goes to infinity.
When the reaction is carried out to full conversion (p = 1), only two species (gel and LC) are present. At the left of the CPC for p = 1 a single isotropic phase, consisting of the gel swollen by unoriented LC molecules, is present. The nature of the phase separated at the CPC depends on temperature. For T > T1 N (59-5°C), an isotropic phase consisting of pure LC molecules is separated from the swollen gel. The composition of this gel depends on the particular temperature at which phase separation is carried out. At 100°C, the swollen gel contains about 38% LC by volume (35 wt%). It is, however, difficult to determine experimentally the maximum solubility of LC in the gel at a constant temperature, particularly when there is not sufficient contrast between both phases. The phase sepa- rated may be contained within the gel structure, forming small domains (microsyneresis). When the fraction of phase segregated increases, percolation of the microdomains may take place. At still higher volume fractions of dispersed phase, exudation of the LC from the swollen gel may be observed. This was indeed the experimental observation for samples prepared with 4~Lc > 0.7 when the reaction was carried out at 100°C in glass tubes. On the other hand, for T -< TI-N the phase separated for the fully reacted system consists of the pure LC exhibiting nematic ordering.
Cloud-point curves for p = 1 were also calculated for the different elasticity models. Results are shown in Figure 5. The upper part of the curves represents l - I phase separation whereas the lower part indicates I - N equilibrium (dashed lines represent the calculation of I - I CPC in a region where the I - N phase separation is thermodynamically favoured). The temperature limiting both types of phase separation is T = T1_N = 59.5°C, independently of the elasticity model. However, for p = 1 the CPC could not be determined experimentally to ascertain which of the models gave a better fit. So, a different procedure was adopted. Samples prepared with an LC concentration ~bl~C = 0.531 (50 wt%) were partially reacted at 100°C to different conversions and
POLYMER Volume 39 Number 4 1998 851

Thermodynamic analysis of phase separation in PDLC: J. Borrajo et a l.
60
50
40
0 ° 30 v
20
10
/ (~LC ---- 0.531 /
/ [] : by cooling / [ ] : b y P I P S / [] [] []
/ []
,,in []
0.2 0.4 0.6 0.8 P (conversion)
Figure 6 Predicted cloud-point curve for blends containing a ~LC = 0.531 (mass fraction equal to 50%), in a temperature v e r s u s conversion phase diagram. Dashed lines represent the continuation of I - I and I -N equilibria in conditions where phase separation is driven by the other equilibrium. Experimental values of Tz-N were determined by cooling from 100°C or by RIPS (PIPS) at 20°C and 30°C
100 t p ~ I
ttt x~l I
80 / ', ',
t • I
60 ' !
[" ", i 40 , ,
20 p - .4 II 0 4 0 I 1 I' I I I f
0 • " 0.1 0.2 0.3 0.4 0.5 0.6 0.7 0.8 0.9 1.0
CLC
Figure 7 Cloud-point curves (full lines) and shadow curves (dashed lines) for conversions in pre- and post-gel stages
cooled to determine TI_ N. Another set of samples was polymerized at constant temperature (20 or 30°C), and the conversion at which the nematic droplets appeared in the PIPS process was determined. Results are shown in Figure 6 together with the predicted cloud-point curve using the phantom network B model to account for the elastic contribution. It is interesting to note that experimental results lying in the region where phase separation is determined by the I -N transition are in excellent agreement with the numerical simulation for both methods of driving the blend to the cloud point, i.e. by cooling or by RIPS. The rest of the experimental points correspond to a situation where I - I separation preceded the I -N transition (although the I - I process could not be monitored due to the proximity of refractive indices of both components). The simulation of this case would require us to follow the macroscopic phase separation process beyond the cloud point, which is at present under analysis.
Figure 7 shows cloud-point and corresponding shadow curves, both in I - I and in I -N regions, for one conversion in the pre-gel stage (p -- 0.4) and another conversion in the post-gel stage (p = 0.7). At the particular point where cloud- point curves exhibit the transition between I -N and I - I equilibria, shadow curves show a discontinuity, meaning
that three phases (two isotropic and one nematic) are at equilibrium• The composition of the nematic phase gets closer to the pure LC when conversion increases. Obviously, for p = 1, the segregated phase is pure LC. The intercept between cloud-point and shadow curves in the pre-gel stage defines the critical point• Its location is shifted to higher temperatures (and ~bLC values) as conversion increases• However, the threshold temperature (maximum of the cloud-point curve) is located at significantly higher temperatures and LC concentrations than the critical point. This effect, which is a direct consequence of the polymer polydispersity, is not predicted by simple models based on monodisperse constituents•
The composition of an isotropic phase segregated from another isotropic phase may be richer or poorer in LC, depending on the particular conditions of the phase separation. For example, cloud-point and shadow curves for p = 0.40 are intercepted at the critical point located at T = 48°C and ~bLC = 0•62• For lower values of T (keeping always a cloud-point conversion, p = 0.40), the segregated phase will be richer in LC and in oligomeric species with low molar masses (specially in the residual monomers). In these conditions, at the time of phase separation the phase richer in LC will be dispersed in a primary phase rich in the polymer• On the other hand, for an initial composition ~LC ---- 0.91 and a polymerization temperature equal to 95°C, the cloud point is again obtained at p -- 0.40. At the time of phase separation, the phase richer in LC constitutes the primary phase. But now the segregated phase is poorer in LC and richer in the high molar mass species of the polymer distribution (the mass-average molar mass of the primary phase is /f/w = 1735.2; the calculated value for the segregated phase is/f/w = 16 624.2).
The fractionation becomes dramatic in the case of an I -N phase separation. For a cloud-point conversion, p --- 0.4 and T---- 20°C, the simulation shows that the mass-average molar mass of the isotropic phase is /(/w = 1735.2 while the corresponding value for the nematic phase is Mw = 395.8• This means that the nematic phase accepts only the unreacted monomers and a very small concentration of low molar mass species (epoxy and amine conversions in the species segregated to the nematic phase are 0.026 and 0•078, respectively, for an overall conversion of 0.4 in the isotropic phase).
As phase separation continues beyond the cloud point (macroscopic phase separation), the fractionation of epoxy- amine species will produce changes in the network structures of both phases• An experimental manifestation of the fractionation effect may be a shift in gel conversions and the occurrence of a secondary phase separation inside dispersed domains 4.
Knowledge of the stability limits of the blend may aid in the design of cure cycles leading to desired compositions
• • 32 and morphologies of PDLC films. For example, Hlral et al. ~ suggested that the best compositions to obtain suitable PDLC materials for a light shutter seem to be compositions where the spinodal L - L decomposition and the LC segregation occur at the same time. This should lead to a uniform size of LC domains which is required for high contrast ratio in low voltage drive• One possibility of promoting L - L spinodal demixing is by initiating the phase separation process in conditions very close to the critical point 33. For the particular system under analysis, using a blend with ~bLC ----- 0.62 and carrying out the polycon- densation at 48°C will lead to an L - L phase separation at p = 0.40, i.e. at the critical point. At these conditions,
852 POLYMER Volume 39 Number 4 1998

Thermodynamic analysis of phase separation in PDLC: J. Borrajo et a I.
spinodal demixing will most likely take place. However, to analyse the possible evolution of morphologies generated it is necessary to establish the thermodynamic boundaries (coexistence curves) during a macroscopic phase separation.
CONCLUSIONS
The Flory-Huggins theory for the free energy of mixing in isotropic phases in conjunction with the Maier-Saupe theory for phase transition of a nematic liquid crystal, was applied to a polydisperse reactive polymer-LC blend in both pre- and post-gel stages. The isotropic-nematic transition was experimentally determined for a particular epoxy-amine-LC blend. Values of TL-N for the initial blend and Pl-N for the partially reacted mixture at 20°C could be reproduced by numerical simulation, using an interaction parameter inversely proportional to temperature and decreasing with conversion. Cloud-point and shadow curves characteristic of isotropic-isotropic and nematic- isotropic equilibria were established in temperature v e r s u s
composition coordinates covering the whole range of conversions. Knowledge of the stability limits of the blend for different conversions can be used to control the morphologies and properties generated in PDLC films.
ACKNOWLEDGEMENTS
The financial support of Fundaci6n Antorchas (Argentina) and the CONICET (Argentina)-CNRS (France) coopera- tion agreement is gratefully acknowledged.
REFERENCES
1. Doane, J. W., Vaz, N. A., Wu, B. G. and Zumer, S., Appl. Phys. Lett., 1986, 48, 269.
2. Vaz, N. A., Smith, G. W. and Montgomery, G. P. Jr, Mol. Cryst. Liq. Cryst., 1987, 146, 17.
3. West, J. L., Mol. C~st. Liq. Cryst., 1988, 157, 427.
4. Riccardi, C. C., Borrajo, J. and Williams, R. J. J., Polymer, 1994, 35, 5541.
5. Borrajo, J., Riccardi, C. C., Williams, R. J. J., Cao, Z. Q. and Pascault, J. P., Polymer, 1995, 36, 3541.
6. Riccardi, C. C., Borrajo, J., Williams, R. J. J., Girard-Reydet, E., Sautereau, H. and Pascault, J. P., Z Polym. Sci. B: Polym. Phys., 1996, 34, 349.
7. Kronberg, B. and Patterson, D., J. Chem. Soc.. Faraday Trans. 2, 1976, 72, 1686.
8. Kronberg, B., Bassignana, I. and Patterson. D., J. Phys. Chem., 1978, 82, 1714.
9. Dubault, A., Casagrande, C. and Veyssie, M., Mol. Co'st. Liq. Co'st., 1982, 72, 189.
10. Ballauff, M., Mol. Co.st. Liq. Cryst. Lett., 1986, 4, 15. 11. Ballauff, M., Mol. Cryst. Liq. Co'st., 1986, 136, 175. 12. Orendi, H. and Ballauff, M., Liq. Co'st., 1989, 6, 497. 13. Kelkar, V. K. and Manohar, C., MoL Co, st. Liq. Co'st., 1986, 133,
267. 14. Maier, W. and Saupe, A., Z. Naturforsch. A, 1959, 14, 882. 15. Maier, W. and Saupe, A., Z. Naturforsch. A, 1960, 15, 287. 16. Shen, Ch. and Kyu, T., J. Chem. Phys., 1995, 102, 556. 17. Smith, G. W., Mol. Cryst. Liq. Cryst., 1993, 225, 113. 18. Lin, J. Ch. and Taylor, P. L., Mol. Cryst. Liq. C~st., 1993,237, 25. 19. Masood Siddiqi, H., Dumon, M., Elondou, J. P. and Pascault, J. P.
Polymer, 1997, in press. 20. Chiu, H. W., Zhou, Z. L., Kyu, T., Cada, L. G. and Chien, L. C.,
Macromolecules, 1996, 29, 1051. 21. Kim, W. K. and Kyu, T., MoL Co'st. Liq. Cryst., 1994, 250, 131. 22. Stockmayer, W. H., J. Polym. Sci., 1952, 9, 69. 23. Stockmayer, W. H., J. Polym. Sci., 1953, 11,424. 24. Flory, P. J., J. Chem. Phys., 1944, 12, 425. 25. Kamide, K., Matsuda, S. and Shirataki, H., Eur. Polym. J., 1990, 26,
379. 26. Miller, D. R. and Macosko, C. W., Macromolecules, 1976, 9, 206. 27. Miller, D. R., Valles, E. M. and Macosko, C. W., Polym. Eng. Sci.,
1979, 19, 272. 28. Dusek, K., Ilavsky, M. and Somv~rsky, J., Polym. Bull., 1987, 18,
209. 29. Williams, R. J. J., Riccardi, C. C. and Dusek, K., Polym. Bull., 1991,
25, 231. 30. Peebles, L. H., Molecular Weight Distributions in Polymers.
Wiley-Interscience, New York, 1971, p. 257. 31. Erman, B. and Flory, P. J., Macromolecules, 1986, 19, 2342. 32. Hirai, Y., Niiyama, S., Kumai, H. and Gunjima, T., SPIE, 1990,
1257, 2. 33. Williams, R. J. J., Rozenberg, B. A. and Pascault, J. P., Adv. Polym.
Sci., 1997, 128, 95.
POLYMER Volume 39 Number 4 1998 853