thermo scientific cellomics cell motility v4
TRANSCRIPT

Thermo Scientific Cellomics®
Cell Motility V4
BioApplication Guide


Cellomics® Cell Motility BioApplication Guide
V4 Version


PUBLISHED BY
Thermo Fisher Scientific Inc. 100 Technology Drive Pittsburgh, Pennsylvania 15219 Telephone: (412) 770-2200
Copyright Copyright © 1999–2010 by Thermo Fisher Scientific Inc. .All rights reserved. Portions of this document are protected by one or more issued patents, patent applications, trade secrets, copyrights, and/or other proprietary material. Use of the Cell Motility BioApplication requires a license from Cellomics, Inc., a subsidiary of Thermo Fisher Scientific Inc., and is entered into in conjunction with the purchase of the software.
Thermo Fisher Scientific Inc. reserves the right to make modifications and additions to the information in this document without notice. No part of this document may be reproduced or transmitted in any form or means, electronic, photographic, mechanical, or otherwise, for any purpose without the express written permission of Thermo Fisher Scientific Inc.
Trademarks Cellomics, ArrayScan, iDev, and vHCS are trademarks or registered trademarks of Cellomics, Inc.
Falcon and Biocoat are registered trademarks of Becton, Dickenson and Company. Other products or company names mentioned in this document may be trademarks or registered trademarks of their respective owners and are treated as such. All other trademarks are property of Thermo Fisher Scientific Inc. and its subsidiaries.
WARNING
Use this product only in the manner described in this guide. When used other than as specified, the safety protections may be impaired. Failure to adhere to safety precautions and/or procedures outlined in this document may result in system failure, personal injury, or death. Thermo Fisher Scientific Inc. shall not be held liable under any circumstances.
P/N LC06080800

Cellomics, Inc. Software License Agreement
This Software License Agreement (“Agreement”) for the Cell Motility BioApplication software (“Software”) is entered into in conjunction with the purchase of the license to the Software. By installing and/or using the Software, Licensee accepts the Software and agrees to be bound by the terms of this Agreement. 1) Licensor’s Rights Cellomics, Inc. ("Licensor") represents that it has all rights necessary to grant the license herein. The Software is protected by patents
(including United States Patent No. 6,875,578, Japanese Patent No. 3683591, European Patent No. 0983498, Canadian Patent No. 2,282,658, and Australian Patent No. 730100), patent applications, and copyrights and includes valuable trade secrets and other proprietary material.
2) License Grant: Licensor grants the purchaser ("Licensee") a non-exclusive, non-transferable license (“License”) under the such patent rights and copyrights to use the Software, and associated manuals and documentation, in conjunction with a Cellomics instrument or other system authorized by Cellomics, Inc., at the designated Licensee’s business location until this License is terminated in accordance with the terms and conditions specifically set out in the Agreement. This License permits the Licensee to make one copy of the Software in machine-readable form for backup purposes only.
3) Limitations: Licensee agrees to treat the Software as confidential and not to copy, reproduce, sub-license, or otherwise disclose the Software or its associated manuals and documentation to third parties, including any parent, subsidiaries, or affiliated entities, without the prior written consent of Licensor. Licensee agrees not to disassemble, decompose, reverse engineer, or otherwise translate the Software. Licensee agrees not to modify the Software, not to allow access to the Software through any terminal located outside of Licensee’s location, and that any derivative works and the backup copy are the sole property of the Licensor.
4) Additional License Rights: The hardware or software product accompanying this manual (the “Product”) and/or the method of use thereof may be covered by one of more of United States Patent Nos. 6,743,576; 6,631,331; 6,738,716; 6,615,141; and 6,651,008 and certain other patents pending owned by Cytokinetics, Inc. (the “Cytokinetics Patent Rights”). In consideration of the purchase of the Product, the direct purchaser (the “Purchaser”) hereby acquires a non-exclusive, non-transferable license under the Cytokinetics Patent Rights to use the Product solely for its intended purposes for research and development in the life sciences field, including the discovery of human and animal therapeutics and diagnostics, but not diagnostic testing (the “Research Field”), excluding, however, any rights under the Cytokinetics Patent Rights for that portion of the Research Field in which assays are performed directed toward any mitotic kinesin target (the “Excluded Field”). Purchaser hereby agrees not to use the Product for any application in the Excluded Field. Any use of the Product shall constitute acceptance of and agreement to be bound by the foregoing limitation with respect to the Excluded Field. Except as expressly provided above, the Purchaser receives no rights, express, implied or otherwise, under the Cytokinetics Patent Rights.
5) Term: This License is effective at the time the Licensee receives the Software, and shall continue in effect for the period indicated below, based upon the indicated type of License: □ Perpetual Termination shall occur when Licensee ceases all use of the Software and returns or destroys all copies thereof. □ Annual Termination shall occur ONE (1) YEAR from the date of installation. □ Beta Termination shall occur ___________ DAYS from the date of installation. □ Trial Termination shall occur at the end of the evaluation period mutually agreed upon by Licensor and Licensee, but
in no event more than ____________ DAYS from the date of installation. This License shall automatically terminate upon the failure of the Licensee to comply with any of the terms of this Agreement. Sections 3, 6, and 7 shall survive the termination of the License for any reason.
6) LIMITATION OF LIABILITY: LICENSOR SHALL HAVE NO LIABILITY WITH RESPECT TO ITS OBLIGATIONS UNDER THIS AGREEMENT OR OTHERWISE FOR ANY INDIRECT, INCIDENTAL, SPECIAL, OR CONSEQUENTIAL DAMAGES, HOWEVER CAUSED AND ON ANY THEORY OF LIABILITY, WHETHER FOR BREACH OF CONTRACT, TORT (INCLUDING NEGLIGENCE) OR OTHERWISE, ARISING OUT OF OR RELATED TO THIS AGREEMENT, INCLUDING BUT NOT LIMITED TO LOSS OF ANTICIPATED PROFITS, LOSS OR INTERRUPTION OF USE OF OR CORRUPTION OF ANY FILES, DATA OR EQUIPMENT, EVEN IF LICENSOR HAS BEEN ADVISED OF THE POSSIBILITY OF SUCH DAMAGES. THESE LIMITATIONS SHALL APPLY NOTWITHSTANDING ANY FAILURE OF ESSENTIAL PURPOSE OF ANY LIMITED REMEDY. THE PARTIES AGREE THAT THE FOREGOING LIMITATIONS REPRESENT A REASONABLE ALLOCATION OF RISK UNDER THIS AGREEMENT.
7) DISCLAIMER OF WARRANTY: LICENSOR AND ITS DISTRIBUTORS MAKE NO PROMISES, REPRESENTATIONS OR WARRANTIES, EITHER EXPRESS, IMPLIED, STATUTORY, OR OTHERWISE, WITH RESPECT TO THE SOFTWARE, MANUALS, AND DOCUMENTATION, INCLUDING THEIR CONDITION, THEIR CONFORMITY TO ANY REPRESENTATION OR DESCRIPTION, OR THE EXISTENCE OF ANY LATENT OR PATENT DEFECTS, AND LICENSOR AND ITS DISTRIBUTORS SPECIFICALLY DISCLAIM ALL IMPLIED WARRANTIES OF MERCHANTABILITY, NONINFRINGEMENT AND FITNESS FOR A PARTICULAR PURPOSE. NOTWITHSTANDING, LICENSOR REPRESENTS THAT THE SOFTWARE IS Y2K COMPLIANT. LICENSEE ACKNOWLEDGES THAT THE LOADING OF THIS OR ANY THIRD PARTY SOFTWARE ON A COMPUTER SYSTEM MAY RESULT IN SYSTEM DAMAGE, DATA LOSS, DATA CORRUPTION OR SOFTWARE INCOMPATIBILITY.
8) Miscellaneous: Licensee may not assign this Agreement or any rights or obligations hereunder, directly or indirectly, by operation of law or otherwise, without the prior written consent of Licensor. Subject to the foregoing, this Agreement shall inure to the benefit of and be binding upon the parties and their respective successors and permitted assigns. No waiver or modification of this Agreement shall be valid unless in writing signed by each party. The waiver of a breach of any term hereof shall in no way be construed as a waiver of any other term or breach hereof. If any provision of this Agreement is held to be unenforceable, such provision shall be reformed only to the extent necessary to make it enforceable. This Agreement shall be governed by Pennsylvania law (except for conflict of laws principles). This Agreement contains the complete agreement between the parties with respect to the subject matter hereof, and supersedes all prior or contemporaneous agreements or understandings, whether oral or written. All questions concerning this Agreement shall be directed to: Cellomics, Inc., 100 Technology Drive, Pittsburgh, PA 15219, Attention: Director, Licensing.

I
Table of Contents Chapter 1 Overview of the Cell Motility BioApplication............................................................ 1
System Compatibility ................................................................................................................. 1 Cell Biology Background ........................................................................................................... 1 BioApplication Overview............................................................................................................ 2 BioApplication Measurements................................................................................................... 4 Example Biology........................................................................................................................ 4 References ................................................................................................................................ 7
Chapter 2 Description of the Algorithm...................................................................................... 9 Overview.................................................................................................................................... 9 Object Identification Methods .................................................................................................... 9 Description of Assay Parameters and Settings ....................................................................... 13
Assay Parameters for Image Analysis .............................................................................. 13 Basic Assay Parameters................................................................................................... 19 Object Selection Parameters ............................................................................................ 19 Gating................................................................................................................................ 20 Image Overlays ................................................................................................................. 21
Assay Parameters for Population Characterization................................................................. 21 Overview of Population Characterization.......................................................................... 21 Advanced Assay Parameters............................................................................................ 25
Description of Output Features................................................................................................ 26 Cell Features..................................................................................................................... 26 Well Features .................................................................................................................... 27 Reference Well Features .................................................................................................. 28
Chapter 3 iDev Software Workflow ........................................................................................... 29 iDev Protocol Optimization Tasks............................................................................................ 29
Image Preprocessing ........................................................................................................ 29 Cell Identification Ch2 ....................................................................................................... 30 Cell Validation Ch2............................................................................................................ 31 Cell Selection Ch3 through ChN....................................................................................... 32 Track Identification............................................................................................................ 33 Track Validation ................................................................................................................ 34 Reference Levels .............................................................................................................. 35


1
Overview of the Cell Motility BioApplication High Content Screening (HCS) uses fluorescence-based reagents, advanced optical imaging systems and sophisticated image analysis software (BioApplications) to analyze targets and physiological processes in living cells. This guide provides a brief description for using one such versatile and flexible BioApplication, Cell Motility. A separate protocol detailing the preparation of sample microplates for performing a high content assay for cell motility is provided in the Cell Motility HCS Reagent Kit. This guide contains the following chapters:
Chapter 1 provides an overview of the Cell Motility BioApplication, with example cell biological situations where it can be used.
Chapter 2 describes the quantitative algorithm used to analyze the results and gives a brief description of input parameters and output features.
Chapter 3 describes the Protocol optimization tasks that are available in the iDev™ Assay Development workflow.
System Compatibility
The Cell Motility BioApplication described in this document is designed to run on the following platforms:
• ArrayScan® HCS Reader version VTI • Cellomics® vHCS™ Discovery Toolbox versions 1.5 and 1.6
Cell Biology Background
This assay provides measurement of the net movement of cells over a several-hour interval. It measures an amalgam of cell-substrate adhesion, cell spreading, lamellar protrusion, and directional control, all of which combine to produce net translocation. Whole-cell activities are regulated by external factors such as cell attachment factors, which requires adhesion molecules including integrins, selectins, extracellular matrix proteins and proteoglycans, and soluble growth factors, which require specific molecules including G-protein coupled receptors, tyrosine kinase-mediated receptors, cytokines, peptide growth factors, hormones, and autacoids. With the appropriate combination of cell type, specific stimulant, substrate, and negative controls, the Cell Motility BioApplication can produce functional information that predicts the efficacy of drugs for a number of therapeutic areas. For example:
Chapter
1
Selected images from other sources (e.g., images up to 15-bits) may be imported and used with your platform.

2 Chapter 1 Overview of the Cell Motility BioApplication
• Cancer: Cancer cell motility is a target that is distinct from cell growth. High lamellar protrusion activity correlates with metastatic potential and tumorigenesis.
• Angiogenesis: Endothelial cell movement is a key point of control for proper tube formation during tumor-induced angiogenesis.
• Vascular Disease: Vascular cell movement is necessary for repair to prevent thrombosis, restenosis after angioplasty, heart disease, and vascular overgrowth during macular degeneration.
• Inflammatory Disease: Leukocytes change shape and move during the inflammatory response. Leukocyte adherence and movement are rate-limiting steps in inflammatory diseases such as rheumatoid arthritis, inflammatory bowel disease, multiple sclerosis, psoriasis, and asthma.
• Wound Healing: Keratinocyte, fibroblast, endothelial cell, and leukocyte polarity and movement are required for wound healing. Reepithelialization of wounds is critical for developing wound strength and to reduce scarring.
Movement of Cancer Cells Cancer cells disrupt the normal function of local or distant tissues, which leads to organ failure and death. However, cancer can be controlled by inhibiting the growth of tumors and limiting the dispersion of cells (metastasis). Tumor cell aggressiveness, metastatic potential, and even tumor regression are all predicted, in large part, by the adhesiveness and motility of the cells involved (Klemke et al. 1998; Runger et al. 1994; Taniguchi et al. 1989). Therefore, developing therapeutic interventions that target cell movement is an important goal. Bone metastasis is a critical clinical problem in patients with breast, prostate, and other cancers. Cancers of the breast and prostate selectively metastasize to bone by specific adhesion molecules, such as integrins, selectins, extracellular matrix proteins, and proteoglycans, in target vascular beds and tissues (Orr et al. 1995; Kostenuik et al. 1996). Localization is also determined by selective promotion of cytokine production in host tissues, which act as motogens as well as mitogens (Coppolino and Dedhar 1999). Preventing cancer cell motility by interfering with signaling from adhesion proteins or soluble cytokines may help prevent the metastasis of the primary tumor.
BioApplication Overview
The Cell Motility BioApplication provides information on net cell movement over a time interval that you have defined with a set of images of fixed cells. This is accomplished by plating cells on a fluorescent lawn of small beads. As cells move, they phagocytose, displace the beads, clearing phagokinetic tracks behind them.
A phagokinetic track assay was first described by Albrecht-Buehler (1977) for microscopic gold particles that were deposited on glass microslides. Cells scoop up the beads as they crawl, displace them to the side or carry them on their dorsal sides, and phagocytose them without toxic effects (Albrecht-Buehler 1977; Albrecht-Buehler 1979; Obeso and Auerbach 1984). Movement has been measured for endothelial cells, smooth muscle cells, and pericytes (Bernstein, Antoniades, and Zetter 1982). In other studies, adherent leukocytes, line J774, phagocytose fluoresceinated Escherichia coli particles in 96 well plates, and internalized particles can be counted by fluorescence measurements, indicating cell movement (Wan, Park, and Lau 1993). Serum growth factor

Chapter 1 Overview of the Cell Motility BioApplication 3
stimulation of endothelial cells produces directed movement (long tracks) on BSA (bovine serum albumin) and random movement on gelatin, even though track area is identical in the two conditions. Track area was greater on collagen than on fibrin (Obeso and Auerbach 1984). The responsiveness of endothelial cells to nearby tumor cells has been established by measuring phagokinetic tracks on gold. Endothelial cell movement has been measured on lawns of polystyrene beads as well as on gold particles (Obeso and Auerbach 1984). Thus, the area and shape of tracks can reveal subtle effects of the environment on cell behavior.
The area of single cell tracks is measured as cells move on a lawn of fluorescent beads (Figure 1 and Figure 2). The track area swept out by the cells over time is proportional to the integrated mean square displacement of cell movement and depends on net lamellar activity. The shape of the track can distinguish speed, directed versus random movement, and non-productive membrane ruffling. A unique feature of this assay is that cell motility is measured with a fixed endpoint assay and does not require multiple kinetic measurements. Thus, the track assay provides kinetic information (integrated displacement area) over a known time interval from a single image.
Figure 1. Tracks are identified in the Tracks Channel, Channel 1, (left) and cells/colonies are identified in the Cells Channel (Channel 2) (right). Valid tracks and cells are outlined in a Track Channel overlay.
Figure 2. One track at high magnification is shown to illustrate the outlines produced by the Cell Motility Application. The MotionTrackAreaCh1 refers to the area of the track, excluding the cell and is illustrated by the stippled zone between the track and cell outlines.
The Cell Motility BioApplication can be used to measure the efficacy of motogenic ligands by evaluating cell behavior. It is a functional assay, not a ligand binding assay, and so measures the efficacy of compounds on cells rather than the potency of drug binding alone. The assay selectively measures the whole-cell response to soluble receptor ligands as well as immobile substrate proteins. The Cell Motility BioApplication can eliminate compound leads that bind to

4 Chapter 1 Overview of the Cell Motility BioApplication
the target receptor with little effect on cell function. Functional cell assays predict drug activity more accurately in animal trials and the human trials that will follow.
BioApplication Measurements
The Cell Motility BioApplication reports both Cell and Well Features. Cell Features are reported for each cell, and Well Features are reported for each well and are derived from the Cell Features for all the cells imaged and analyzed in that well. Table 1 shows the number of Cell and Well Features available based on the number of channels selected.
Measurement Cell
Region Measured
Cell Features Well Features
General Cell & Well Features Reported
General
Cell # Top Left Width Height X Centroid Y Centroid
ValidTrackCount Valid Field Count ValidTrackCountPerValidField Valid Cell Count Selected Cell Count %Selected Cells Selected Cell Count Per Valid Field Selected Cell Count Per Valid Track
Cell & Well Features Reported for Channel 1:
Count Cells within Track Track Cell Count, Status
Morphology Track
Full Track Area, Status Motion Track Area, Status Full Track Area Per Cell, Status Motion Track Area Per Cell, Status
MEAN, SD, SE, CV, %HIGH
Cell & Well Features Reported for Channel 2:
Morphology Cells within Track
Total Area, Status Average Area, Status MEAN, SD, SE, CV, %HIGH
Table 1. Cell Motility BioApplication Measurements at the Cell and Well levels
Example Biology
Freshly trypsinized cells are plated into protein-coated microplates that are over-coated with a contiguous lawn of microscopic fluorescent beads. After several hours, the cells are fixed and stained with a fluorescent marker for the cytoskeleton and fluorescent images of the beads; images are collected on the Cellomics HCS Reader and analyzed by the Cell Motility BioApplication. The rates of cell motility can be assayed at fixed-time intervals by measuring the track area for each cell and comparing these values to control standards. Drugs that inhibit cell motility will limit the number and the size of tracks that develop. The Cell Motility Reagent Kit combines fluorescent dyes, buffers, validated bead preparations and protocols for sample preparation and measurement by the Cell Motility BioApplication. After fixation, the plates are stable for several weeks. Protein coated plates work best for providing a standardized surface for measuring cell motility. The Cell Motility BioApplication works well with several matrix proteins, custom-coated plates, and commercial plates. Falcon® Biocoat® 96 Well Assay Plates coated with collagen I are versatile and work with several cell types to promote uniform

Chapter 1 Overview of the Cell Motility BioApplication 5
adhesion, reduce cell clumping, and promote uniform movement of cells. The Cell Motility BioApplication has been applied to breast, prostate, and lung carcinoma as well as L929, epithelial, and endothelial cells. Negative controls for A549 lung cancer cells are provided by simply removing serum from the media during the measurement of motility. Pre-starvation of cells is not needed to provide negative control conditions for A549 cells, but may provide unstimulated control conditions for other cell types such as endothelial cells.
It is important to understand what the Cell Motility BioApplication reveals about cell movement. It does not report the sensitivity of cells to chemical gradients, but, instead, reveals the size, uniformity, and morphology of the paths taken by cells. The most accurate way of measuring cell movement is time-lapse microscopy, but this method is difficult to automate. The Cellomics ArrayScan VTI HCS Reader and the Cellomics Discovery Toolbox (v1.6) offer a Live Module that can track cells over time. Please see the appropriate user’s guides for more information.
The Cell Motility BioApplication also provides an automated method for collecting motility data similar to time-lapse microscopy, since the cell tracks reveal the motile history of cells between plating and fixing them. Cells will first adhere and spread onto the bead-coated substrate (Figure 3A) and then move in various patterns (Figure 3B). Time-lapse observation of cells moving through the lawn of beads shows that the track is formed by lamellipodial activity and cell translocation. As tracks develop over time, assay statistics improve, but cells frequently cross and join tracks. Therefore, track area is normalized by subtracting the cell area. The Cell Feature, MotionTrackAreaCh1 is based on total track area minus the area of all cells contained within the track. Cells that are nearly immotile will have a MotionTrackAreaCh1 value close to zero since the cell and MotionTrackAreaCh1 will be similar in size (see Figure 3 and Figure 4). An additional advantage of normalizing track area by subtracting cell area is that the assay window is increased since track area is minimized for slowly moving cells.
Figure 3. Principle of cell motility measurements by track formation. Time-lapse evaluation of the movement of A549 lung cancer cells grown on a lawn of beads in media containing FBS. Images were recorded every ten minutes. Single cells moved and ingested beads. Cells would double back on their tracks and cross over,
A
C
1 hr 0 min 5 hr 20 min
9 hr 40 min 18 hr 20 min D
BA
C
1 hr 0 min 5 hr 20 min
9 hr 40 min 18 hr 20 min D
B

6 Chapter 1 Overview of the Cell Motility BioApplication
joining formerly separate cell tracks. The MotionTrackAreaCh1 is a measure of the integrated mean square displacement of cells within the track rather than a measure of the linear path length of the cells, thus measuring the productive movement of cells and accounting for backtracking.
Cells move in a variety of patterns from random walk to long straight paths. The pattern varies from cell type to cell type and with substrate and stimuli for the same cell type. For example, the tracks formed by primary human microvascular endothelial cells are globular in the presence of serum and linear in the presence of the growth factor, IGF-1 (see Figure 4). The Cell Motility BioApplication was designed to report on motility from all varieties of track shapes. Under all assay conditions, MotionTrackAreaCh1 measures the integrated mean square displacement of cells within the track. The MotionTrackAreaCh1 feature is representative of the productive movement of cells, accounting for backtracking. In some cases, the track area is proportional to the linear path length of the cells, but only for cells with long persistence times or at very short assay duration. Tracks with multiple cells will naturally be larger than tracks with single cells. While longer time intervals provide larger tracks to measure and better statistics, shorter time intervals avoid problems of crossed tracks and phagocytosis of beads. The linearity of the assay was evaluated and it was determined that the Cell Motility algorithm returns statistically useful results for assay durations between 3 and 22 hours (see Figure 5). The area of the tracks produced during cell movement increases proportionally with time during the first day. Within the error of the assay, the rate of cell motility is constant during the first day and is not reduced due to progressive phagocytosis of beads or crossed tracks.
Figure 4. Human Microvascular Endothelial cells plated on a lawn of fluorescent beads and incubated overnight. A: Basal medium. B: Basal medium plus 10% FCS. C: Basal medium plus insulin-like growth factor I. Notice the difference in tracks when comparing untreated to FCS and IGF-1.
0
500
1000
1500
2000
2500
0 5 10 15 20 25
Hours
Ave
rage
Tra
ck A
rea
A B C
Untreated FCS IGF-I
A B C
Untreated FCS IGF-I

Chapter 1 Overview of the Cell Motility BioApplication 7
Figure 5. Useful assay duration for motility measurements. The area of the tracks produced by bead displacement and phagocytosis during cell movement increases proportionally with time during the first day. Within the observed time period, the rate of cell motility is constant and not reduced due to the progressive phagocytosis of beads.
References
Albrecht-Buehler, G. 1977. The phagokinetic tracts of 3T3 cells. Cell 11:395-404.
Albrecht-Buehler, G. 1979. The angular distribution of directional changes of guided 3T3 cells. J. Cell Biol. 80:53-60.
Bernsetien, L. R., H. Antoniades, and B. R. Zetter. 1982. Migration of cultured vascular cells in response to plasma and platelet-derived factors. J. Cell Sci. 56:71-82.
Coppolino, M. G., and S. Dedhar. 1999. Ligand-specific, transient interaction between integrins and careticulin during cell adhesion to extracellular matrix proteins is dependent upon phosphorylation/dephosphorylation events. Biochem. J. 340:41-50.
Klemke, R. L., J. Leng, R. Molander, P. C. Brooks, K. Vuori, and D. A. Cheresh. 1998. CAS/Crk coupling serves as a “molecular switch” for induction of cell migration. J. Cell Biol. 140:961-72.
Kostenuik, P. J., O. Sanchez-Sweatman, F. W. Orr, and G. Singh.1996. Bone cell matrix promotes the adhesion of human prostatic carcinoma cells via the alpha 2 beta 1 integrin.Clin. Exp. Metastasis. 14:19-26.
Obeso, J. L., and R. Auerbach. 1984. A new microtechnique for quantitating cell movement in vitro using polystyrene bead monolayers. J. Immunol Methods. 70:141-52.
Orr, F.W., O. H. Sanchez-Sweatman, P. Kostenuik, and G. Singh. 1995. Tumor-bone interactions in skeletal metastasis. Clin. Orthop. 312:19-33.
Runger, T. M., C. E. Klein, J. C. Becker, and E.B. Brocker. 1994. The role of genetic instability, adhesion, cell motility, and immune escape mechanisms in melanoma progression. Curr. Opin. Oncol. 6:188-96.
Taniguchi, S., M. Tatsuka, K. Nakamatsu, M. Inoue, H. Sado, H. Okazaki, H. Iwamoto, and T. Baba. 1989. High invasiveness associated with augmentation of motility in a fos-transferred highly metastatic rat 3YI cell line. Cancer Res. 49:6738-44.
Wan, C. P., C. S. Park, and B. H. Lau. 1993. A rapid and simple microflourometric phagoctyosis assay. J. Immunol Methods. 162:1-7.
Zhang, J. H., T. D. Y. Chung, and K. Oldenburg. 1999. A simple statistical parameter for use in evaluation and validation of high throughput screening assays. J. Biomolecular Screening. 4:67-73.
References


9
Description of the Algorithm
The Assay Parameters described in this guide function in the same manner regardless of using the Classic or iDev versions of the ArrayScan software. For descriptions of each task for optimizing a Protocol in the iDev Assay Development Workflow, please refer to Chapter 3 of this guide.
Acquired images are analyzed by an image-processing algorithm. This chapter briefly describes how this algorithm works and describes the Assay Parameters and Output Features of the BioApplication.
Overview
The algorithm measures the area of tracks in a lawn of fluorescent beads and the area of single cells or colonies stained with a fluorescently labeled form of the actin marker, phalloidin. Not all bare spots in the lawn of beads are tracks. Therefore, the Cell Motility algorithm excludes tracks that do not contain cells. This assay has a minimum of two channels: one channel identifies tracks in fluorescent beads and the other identifies cytoplasm of the cell within each track. Images from each channel are acquired and Background Correction is applied to each (if selected). Primary objects (tracks) in Channel 1 are identified. Tracks along the border of the field may be rejected from analysis if the RejectBorderTracksCh1 Assay Parameter is applied. Cells in Channel 2 are then identified and cell clusters can be segmented if needed. Tracks are validated due to cell count and area, and Cell and Well Output Features are generated. Dark objects, scratches, tracks that have lost their cells, and large dark areas at the edge of the well can be excluded if they have no cells or if their areas exceed or fall below limits that you have defined. The reported MotionTrackAreaCh1 feature excludes the area of the cells it contains (see Figure 1 and Figure 2). Cells or small colonies are identified as a single object if their cytoplasms are contiguous. Thus, cells are characterized by the total area of their lamellipodia. An upper limit of cells per track can be specified by using the Object Selection Parameter TrackCellCountCh1, thereby qualifying the population of tracks that is measured, enabling analysis of single-cell tracks, if desired. In practice, it is preferable to include tracks with multiple cells in order to collect data from the majority of tracks.
Object Identification Methods
To identify objects in each of the images from the different channels, an independent intensity threshold must be set for each channel. In Channel 1, tracks are identified; only pixels with intensities above this threshold will be considered as belonging to these structures. Thus the proper setting of an intensity threshold is a key early step in identification and thus configuring the application. In Channel 2, cells within the tracks are identified, and pixels with intensities
Chapter
2

10 Chapter 2 Description of the Algorithm
above this threshold are used to help estimate target counts. Depending on the properties of the objects being identified in Channel 1 and Channel 2, the proper setting of intensity thresholds for the channels is necessary to ensure proper quantitative analysis. There are four different options or methods for determining intensity thresholds, and sub-sets of these are available for each channel. For each Channel, you must select both a method and a value. The different options and values available for each channel are summarized in the Table 2, and the descriptions of the different methods follow in Table 3.
Channel Availability Intensity Threshold
Method Value Range
Channel 1 Channel 2 Channels 3 - 6
None 0
Isodata -0.99 – 9.99
Triang -0.99 – 9.99
Fixed 0 - 32767
Table 2. Intensity Threshold Methods Available for Each Channel
Of the four intensity threshold method options, None means that no intensity threshold is applied. This option is not available in Channel 1 or 2 because in these channels an intensity threshold is required to define the pixels making up the tube and the targets. The choice of the None threshold is the only option in Channels 3-6. The Fixed Threshold method sets an intensity threshold independently of the image data. In this case, you select an intensity level between 0 and 32767, and any pixel above this intensity is retained for the analysis specific to the channel.
The other threshold methods (Isodata and Triang) are known as histogram-derived thresholds in that the threshold is chosen from the histogram of pixel intensities in the image (i.e., the image’s brightness histogram). The schematics in Figure 6 demonstrate how these histogram-derived threshold values are calculated.
The values entered for the Object Identification in the application for the two histogram-derived threshold methods are offsets applied to determine the final threshold which is applied to the image. If the histogram-derived threshold is T, then its relationship to the actual (final) threshold, TF, which is finally applied to the image, is determined from the user-entered offset value, o, as:
ToTF )1( +=
All Intensity Thresholds are applied to the background-corrected image (when Background Correction is used).
When “None” is selected as the Intensity Threshold Method (Channels 3-6), the value must be 0.
The effective range for object identification is limited to 0-4095 for Cellomics HCS Readers (ArrayScan VTI and ArrayScan X.5 HCS Readers). However, the entire range may be available on images from other sources.

Chapter 2 Description of the Algorithm 11
For example, suppose for a particular image, an Isodata Threshold, T, of 1000 is obtained. Then entering an offset value, o, of 0.9 will result in a final threshold of 1900 being applied to the image, whereas entering an offset value of -0.9 will result in a final threshold of 100 being applied. The range of possible values for the offset o is –0.999 to 9.999. However, note that the resulting applied threshold, TF, will be restricted to the range 1-32767.
The two histogram-derived methods are dependent on the contents of the image, unlike the Fixed Threshold method. For example, supposing a blank image that contains no cellular objects and only has background pixels with a mean intensity value of 500 and standard deviation of 50, then it is unlikely that a Fixed Threshold of 1000 will cause any pixels to be registered as objects. However, the Isodata Threshold method will give thresholds causing pixels in the image to be registered for potential analysis; this is because the histogram is of the pixel intensity distribution of that image, even though there are no cellular objects in the image. The Triangle Threshold method is more robust for the situation of blank fields that may contain rare bright objects; this is because the peak is of the background intensity, and the “triangle”-derived offset can be set to always be above the background, yet low enough to pick any bright objects. Thus, in situations where blank images are expected (e.g., from a loss of signal due to a compound condition, a loss of protein expression, or a lack of label), the Isodata Threshold method should be avoided; instead either a Fixed Threshold or the Triangle Threshold method with a large offset can be entered.
Threshold Option Description
Range of Possible Values Entered
Resulting Applied
Threshold Range
None No threshold applied 0 none
Isodata
Adjusts the object identification threshold relative to the Isodata value.
The threshold T is chosen so that it is equal to the average of the mean of the pixel intensities to the left of the threshold (mL) and the mean of the pixel intensities to the right of the threshold (mR).
A negative value identifies dimmer objects and results in larger object masks. A positive value results in smaller object masks.
-0.999 – 9.999
(offset) 1 - 32767
Triang
Adjusts the object identification threshold relative to the Triangle value.
The threshold T which gives the maximum distance d
A negative value identifies dimmer objects and results in larger object masks. A positive value results in smaller object masks
-0.999 – 9.999
(offset) 1 - 32767

12 Chapter 2 Description of the Algorithm
Threshold Option Description
Range of Possible Values Entered
Resulting Applied
Threshold Range
Fixed A fixed pixel intensity value between 0-32767 is applied
0 – 32767
(actual intensity in image)
0 - 32767
Table 3. Intensity Threshold Descriptions and ranges available for the Cell Motility BioApplication
Number of Pixels
Pixel Intensity0
Isodata Thresholdm L
T
mR
+ mT = (mL R )/2
32767
Number Of Pixels
Pixel Intensity0 32767
Triangle Threshold
d
T
Figure 6. Histogram-derived Intensity threshold methods: Background peak is shown in gray and object peak is shown in white. Methods shown represent Isodata (top) and Triangle (bottom) Thresholding.

Chapter 2 Description of the Algorithm 13
Description of Assay Parameters and Settings The Cell Motility bioassay uses an algorithm and reagents which has been extensively tested and validated for robust screening performance. Assay Parameter values determined from validation plates for representative cell types have been supplied as defaults in the standard Assay Protocol. Parameters are adjustable to allow customization of the algorithm to your own samples and conditions. These parameters do not have to be changed once they are established and stored in an Assay Protocol unless the sample or its preparation method has been changed significantly. Input parameters can be found in the Create Protocol View of the ArrayScan Classic software or in the Protocol Optimization task list of the iDev software. In the ArrayScan Classic software , the available input parameters will vary depending on the Mode in which you are running: Basic Mode or Advanced Mode. Basic Mode is recommended for morphological selection of cells. Advanced Mode is recommended when you want to perform population analysis.
Assay Parameters for Image Analysis General Assay Parameters General Assay Parameters control general aspects of image processing and analysis:
• Reference Well Control • Units for Morphological Measurements • Object Type • Background Correction • Object Smoothing • Rejecting Border Objects
Reference Well Control The two general Assay Parameters controlling the use of Reference Wells are: UseReferenceWells and MinRefAvgTrackCountPerField. The UseReferenceWells Assay Parameter allows you to choose whether Reference Wells are to be used to determine the population characterization thresholds. If Reference Wells are to be used (value = 1), then the Assay Parameter MinRefAvgTrackCountPerField must be set. This is the minimum number of objects detected per field that are required for acceptance of data from that well. If the average number of cells per field is less than the number you set for MinRefAvgTrackCountPerField, the Reference Wells data will not be used and the manually set FeatureChNLevelHigh Assay Parameter values will be applied. In addition to these general Assay Parameters, there are additional Assay Parameters for Reference Well processing that are specific for particular features and channels. These Assay Parameters will be described in later sections. Units for Morphological Measurements You have the option of either choosing micrometers or pixels as the unit to report morphological measurements. This is done with the UseMicrometers parameter, which when set to 0, causes the area of the objects to be reported in pixels. Otherwise, if the parameter is set

14 Chapter 2 Description of the Algorithm
to 1, the measurements are reported in micrometers. This information is calculated automatically from the chosen magnification and camera resolution settings. ObjectTypeChN TrackTypeCh1, ObjectTypeCh2 The “Object Type” Assay Parameters allow you to specify whether the objects of interest are brighter or darker than the background of the image. Setting the value to 1 makes dark areas within an image to be considered as potential objects, while leaving it as 0 considers bright areas on a dark background as potential objects (Table 4).
Setting Detects 0 Objects that are brighter than the background (most typical) 1 Objects that are dimmer than the background
Table 4. Binary settings for TrackTypeCh1 and ObjectTypeCh2 Typical fluorescence microscopy images show bright objects on a dark background. The signal that comes from an object is proportional to the amount of fluorescent label in it. Thus, the objects of interest will have intensities that are above the background intensity, and applying the intensity threshold will identify pixels higher than the threshold as object and those lower than the threshold as background. In some assays dark objects are of interest, such as an unlabelled nucleus within a labeled cell body or cytoplasm. In this case the dimmer areas of the image are considered objects of interest to be identified and measured. The strategy for object identification/detection is the similar in the two cases; that is, you will always optimize the threshold value so that it separates objects from background based on intensity. If you are detecting dark objects on a bright background, you will need to increase the threshold value to detect more objects or to enlarge them.
Background Correction BackgroundCorrectionChN Prior to image analysis, the non-cellular background can be computed and subtracted from the image separately in each channel, if desired, as shown in Figure 7.
Figure 7. Image depicting calculation of Background Correction that can be used in each channel The background-corrected image is computed by suppressing high frequency components in the image (low pass filtration). You can control the creation of the background image by adjusting the BackgroundCorrectionChN Assay Parameter. This Assay Parameter refers to the radius of the area that is sampled around each pixel in the image to determine its local background. The value of this Assay Parameter should be much larger than the radii of the

Chapter 2 Description of the Algorithm 15
objects in the image. If the value is set to 0 (zero), background correction is not performed, and analysis is done using the raw, uncorrected images. If the BackgroundCorrectionChN Assay Parameter is given a negative value, an optional background correction method based on the 3D surface fitting is applied. The absolute value entered corresponds to the radius of an area used to find local minima across the image. Found minimum values are used to construct a 3D surface of a background which is then subtracted from the original image. The main advantage of the method is that it minimizes the effect of the background correction (removal) procedure on the intensity values of the analyzed objects. In both cases, the larger the absolute value, the larger the sampled region, and the less subtraction is done. Setting the Assay Parameter to –1 lets the application decide on the value needed for the optimal background correction. Table 5 gives an overview of the different Background Correction settings that can be used for each channel.
Table 5. Possible Background Correction Methods in the Cell Motility BioApplication
In all cases (except where the value = 0), the reported image pixel intensity values will be reduced.
Background Correction can be adjusted on each channel separately.
The background-corrected image is not stored or shown.
Object Smoothing TrackSmoothFactorCh1, ObjectSmoothFactorCh2 Channel 1 and Channel 2 have independent Assay Parameters that enable control over the degree of image smoothing, or blurring, before the identification of tracks (Channel 1) or objects (Channel 2). These Assay Parameters are called TrackSmoothFactorCh1 and ObjectSmoothFactorCh2 for Channel 1 and Channel 2 respectively. These Assay Parameters correspond to the radius in pixels of the area used to smooth the image. A small value, such as 3, means that a region with a radius of 3 pixels is used to smooth the image (region with dimensions 7×7 pixels, or 49 pixels total). Doubling the value to 6 means that a larger region (13×13 pixels or 169 pixels total) is used to smooth the image, and thus the image will be more smoothed. A value of 0 means that smoothing is not done. These Assay Parameters are used to smooth images with a lot of contrast to improve identification of tracks (Channel 1) or objects (Channel 2).
Reject Border Objects RejectBorderTracksCh1 When running the BioApplication, you have the option of not including and analyzing objects that touch the border of your image field. This is controlled by the RejectBorderTracksCh1 Assay Parameter. If this parameter has a value of 1, objects touching the border are not
Setting Background Correction Method 0 No background correction is performed
Positive Local minimum in the box specified by the value entered is subtracted from that region of the image
Negative Local minima detected are used to fit a surface representing the background, which is then subtracted
-1 Automated surface fitting is performed and the computed background is subtracted

16 Chapter 2 Description of the Algorithm
analyzed. On the other hand, a value of 0 results in all objects in the image field to be eligible for analysis, whether or not they touch the image border.
Channel-Specific Assay Parameters Track Separation You have the option of separating tracks from different cells that are touching each other. This is accomplished by assigning a value to the Assay Parameter TrackSeparationCh1. The value assigned to this Assay Parameter is the number of erosions performed on tracks touching each other. It is recommended that small values (such as 1 or 2) be assigned to this Assay Parameter if tracks touching each other are to be separated, as high values may separate tracks that are not necessarily formed by touching of tracks from different cells. If track separation is not desired, then this Assay Parameter must be set to 0.
Object Segmentation in Channel 2 Even though you may have chosen an optimal intensity threshold and an appropriate degree of smoothing for object identification, you may encounter situations where individual objects cannot be properly resolved, such as in the case of densely packed objects. Object Segmentation will help resolve and identify individual objects. Two methods are available for object segmentation in the Cell Motility BioApplication: Geometric (shape and size) and Intensity (intensity peaks). These methods are illustrated in Figure 8.
Figure 8: Object Segmentation Options. The image on the left illustrates the Geometric Method while the image on the right illustrates the Intensity Method.
The Geometric method splits touching objects on the basis of shape, relying on boundary indentations to locate the line of separation. This method works best if the individual objects have smooth boundaries with pronounced indentations at their point of contact. The Geometric method can be used to separate objects that are uniform in intensity (i.e., saturated) or that have multiple intensity peaks (i.e., noisy or textured).
The Intensity method separates touching objects using intensity peaks. Successful segmentation requires a single, dominant intensity peak for each object. This method will not work well if the objects are noisy, textured, or uniform in intensity. The peak intensity method can be used to separate objects that have no boundary indentations.
The ObjectSegmentationCh2 Assay Parameter (see Table 6) controls both methods. A positive value for this parameter selects the Geometric method, and the value is the approximate radius (in pixels) of the smaller of the objects being separated. The value of this
Boundary Indentations Intensity Peaks
Lines of SeparationLines of Separation

Chapter 2 Description of the Algorithm 17
parameter for the Geometric method depends on the magnifying power of the microscope objective and camera setting (pixel binning).
Setting ObjectSegmentationCh2 to a negative value selects the peak Intensity method. In this case, the absolute value of the parameter specifies the minimum relative height of the intensity peak (image contrast) to be used in the segmentation. Making ObjectSegmentationCh2 more negative reduces the number of objects created by the segmentation. In case of noisy and textured objects, the use of object smoothing may be required to reduce over-segmentation. The value of this parameter for the Intensity method does not depend on the power of the microscope objective or camera setting (pixel binning).
A value of zero for ObjectSegmentationCh2 disables the segmentation.
Segmentation Method ObjectSegmentationCh2
Assay Parameter Value Range
None 0 0
Geometric radius (in pixels) of smaller object 1 to 255
Intensity minimum relative height of intensity peak (local contrast) -1 to -32767
Table 6: Channel 2 Object Segmentation Options The following section describes the functioning of the two segmentation methods.
Geometric Method Setting the ObjectSegmentationCh2 parameter to R1 (Figure 9A) produces object separation shown in Figure 9B. Setting the ObjectSegmentationCh2 parameter to R3 results in segmentation shown in Figure 9C. Setting the ObjectSegmentationCh2 parameter to R2 (the largest radius of all touching objects) produces no segmentation.
Figure 9: Object segmentation: Geometric Method. A) Radii of touching objects: R1 = 24, R2 = 30, R3 = 7; B) Result of segmentation using ObjectSegmentationCh2 = R1; C) Result of segmentation using ObjectSegmentationCh2 = R3.
Intensity Method Figure 10 shows the intensity profile along the cordial line of an object with four intensity peaks from Figure 8. Relative peak intensity heights measured from the top of a peak to the nearest valley for each of the objects are: 1500 (#1), 1250 (#2), 500 (#3), and 200 (#4).
Line of Separation Lines of Separation
R1
R2
R3
A B C

18 Chapter 2 Description of the Algorithm
In general terms, these peak intensity heights are nothing but measures of local contrast of an image. The degree of object segmentation can be controlled by setting the ObjectSegmentationCh2 parameter value equal to the lowest relative height of intensity peaks of objects that need to be separated. The lower the value, the more objects will be segmented and vise versa. In case of over-segmentation, setting the ObjectSmoothFactorCh2 value greater than 0 should be used to alleviate the problem.
Figure 10: Intensity profile of an object with four intensity peaks. Peak #1 height = 1500, peak #2 height = 1250, peak #3 height = 500, and peak #4 height = 200. Only two peaks in Figure 10, #1 and #2, have relative intensity greater than 1000. Thus, setting the ObjectSegmentationCh2 parameter to -1000 marks only two peaks to be used for segmentation (or marks the two objects that need to be separated) and results in object segmentation as shown in Figure 11A. Setting the ObjectSegmentationCh2 parameter to - 400 or -100 marks three or all four objects that need to be separated. The results of segmentation of three and four objects are shown in Figure 11B and 11C.
Figure 11: Object segmentation: Intensity Method. A) Result of segmentation using parameter ObjectSegmentationCh2 = -1000; B) Result of segmentation using parameter ObjectSegmentationCh2 = -400; C) Result of segmentation using parameter ObjectSegmentationCh2 = -100,
Mask Size Modification CellMaskModifierChN The identified objects in Channel 2 are used to define a mask. Only the pixels that fall under the defined mask are used for the intensity measurements in all channels. The size of the mask can be modified by the CellMaskModifierChN Assay Parameter for Channels 3-6. The mask for Channel 1 cannot be modified. This CellMaskModifierChN Assay Parameter sets the number of pixels for which the object mask will be dilated or eroded based on the value being positive or negative respectively. Please see the Gating section for more information.
Distance (pixels)
1
2
3
4
Relative Peak Heights
A B C

Chapter 2 Description of the Algorithm 19
Basic Assay Parameters Basic Assay Parameters control the functioning of the image analysis algorithm and mainly pertain to morphological object identification and controlling the use of Reference Wells (Table 7).
Parameter Units Description
UseReferenceWells Binary Determines if reference wells will be used to set various limits (1= enabled; 0 = disabled).
TrackTypeCh1 Binary Type of tracks to be identified in Ch1: 0 = Bright tracks on dark background, 1 = Dark tracks on bright background
BackgroundCorrectionChN Pixels Radius (in pixels) of region used to compute background in ChN: Negative value = Use surface fitting, 0 = Do not apply background correction, Positive value = Use low pass filter
TrackSmoothFactorCh1 Number Degree of image smoothing (blurring) prior to object (track) detection in Ch1: 0 = Do not apply smoothing
TrackSeparationCh1 Pixels Number of pixels to shrink (erode) track mask required to separate slightly touching objects (tracks). 0 = Do not separate touching objects (tracks).
RejectBorderTracksCh1 Binary Reject objects (tracks) that touch image edges: 0 = No, 1 = Yes
ObjectTypeCh2 Binary Type of objects (cells) to be identified in Ch2: 0 = Bright objects on dark background, 1 = Dark objects on bright background
ObjectSmoothFactorCh2 Number Degree of image smoothing (blurring) prior to objects (cells) detection in Ch2: 0 = Do not apply smoothing
ObjectSegmentationCh2 Pixels Radius (in pixels) of touching objects (cells) that should be separated in Ch2: Negative value = Use intensity peaks method, 0 = Do not apply object segmentation, Positive value = Use shape geometry method
CellMaskModifierChN Number Number of pixels to modify Ch2 object (cell) mask in ChN: Negative value = Shrink mask, 0 = Do not modify mask, Positive value = Expand mask
Table 7. Basic Assay Parameters available in the Cell Motility BioApplication. *Note that “ChN” refers to Channels 1-6 for Background Correction and Channels 3-6 for CellMaskModifier.
Object Selection Parameters Object Selection Parameters are available for the Tracks Channel (Channel 1) and the Cells Channel (Channel 2) when running in Advanced Mode.
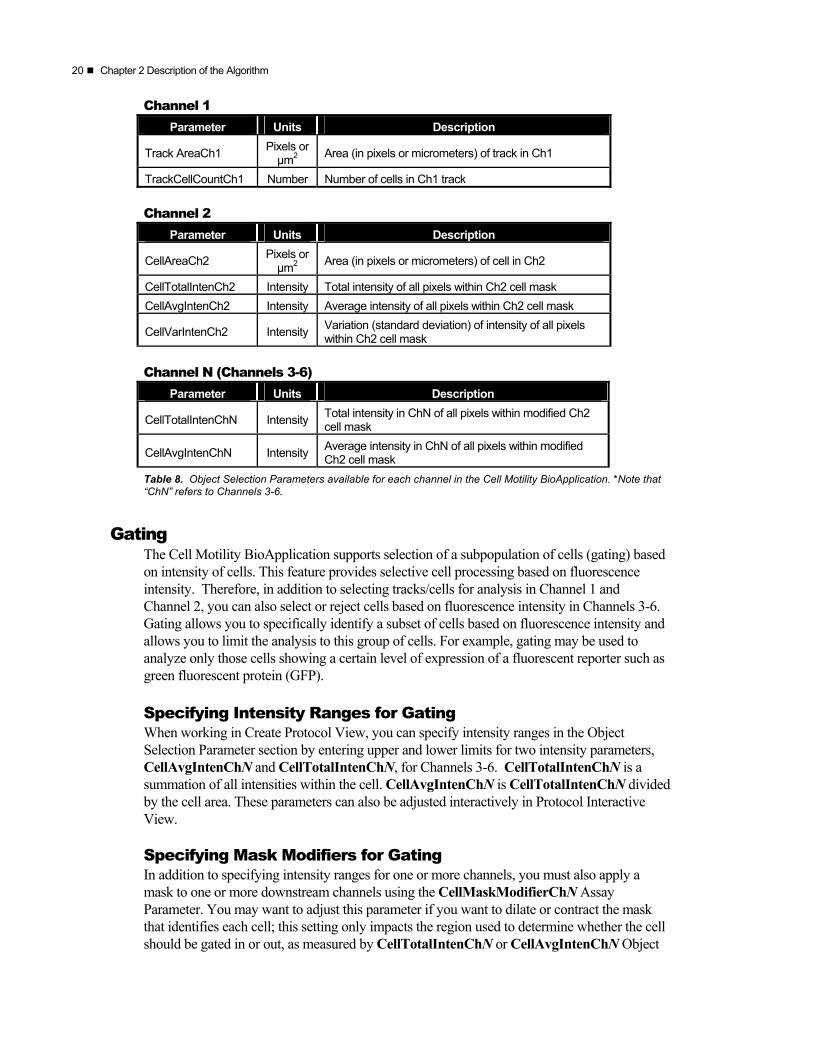
Each channel has a set of specific Object Selection Parameters associated with it (Table 8). If an object in the particular channel’s image has all measured features within the range specified by the appropriate Object Selection Parameters, then it is analyzed; otherwise, it is rejected from the analysis. Channel 1 Object Selection Parameters are used to identify tracks and Channel 2 Object Selection Parameters are used to identify cells. The selection parameters for Channels 3-6 further qualify whether the object is analyzed. A valid cell that satisfies Object Selection Parameters for Channels 3-6 is defined as a selected cell. Only the selected cells are analyzed within the tracks.
Select the Hide Advanced Parameters checkbox to display only Basic Assay Parameters.
20 Chapter 2 Description of the Algorithm
Channel 1 Parameter Units Description
Track AreaCh1 Pixels or µm2 Area (in pixels or micrometers) of track in Ch1
TrackCellCountCh1 Number Number of cells in Ch1 track Channel 2
Parameter Units Description
CellAreaCh2 Pixels or µm2 Area (in pixels or micrometers) of cell in Ch2
CellTotalIntenCh2 Intensity Total intensity of all pixels within Ch2 cell mask CellAvgIntenCh2 Intensity Average intensity of all pixels within Ch2 cell mask
CellVarIntenCh2 Intensity Variation (standard deviation) of intensity of all pixels within Ch2 cell mask
Channel N (Channels 3-6)
Parameter Units Description
CellTotalIntenChN Intensity Total intensity in ChN of all pixels within modified Ch2 cell mask
CellAvgIntenChN Intensity Average intensity in ChN of all pixels within modified Ch2 cell mask
Table 8. Object Selection Parameters available for each channel in the Cell Motility BioApplication. *Note that “ChN” refers to Channels 3-6.
Gating
The Cell Motility BioApplication supports selection of a subpopulation of cells (gating) based on intensity of cells. This feature provides selective cell processing based on fluorescence intensity. Therefore, in addition to selecting tracks/cells for analysis in Channel 1 and Channel 2, you can also select or reject cells based on fluorescence intensity in Channels 3-6. Gating allows you to specifically identify a subset of cells based on fluorescence intensity and allows you to limit the analysis to this group of cells. For example, gating may be used to analyze only those cells showing a certain level of expression of a fluorescent reporter such as green fluorescent protein (GFP). Specifying Intensity Ranges for Gating When working in Create Protocol View, you can specify intensity ranges in the Object Selection Parameter section by entering upper and lower limits for two intensity parameters, CellAvgIntenChN and CellTotalIntenChN, for Channels 3-6. CellTotalIntenChN is a summation of all intensities within the cell. CellAvgIntenChN is CellTotalIntenChN divided by the cell area. These parameters can also be adjusted interactively in Protocol Interactive View.
Specifying Mask Modifiers for Gating In addition to specifying intensity ranges for one or more channels, you must also apply a mask to one or more downstream channels using the CellMaskModifierChN Assay Parameter. You may want to adjust this parameter if you want to dilate or contract the mask that identifies each cell; this setting only impacts the region used to determine whether the cell should be gated in or out, as measured by CellTotalIntenChN or CellAvgIntenChN Object

Chapter 2 Description of the Algorithm 21
Selection Parameters. The mask can be dilated or eroded, but will not overlap with other masks from adjacent objects.
Image Overlays During a scan, various features can be displayed as color overlays on the channel images. The colors of these overlays can be changed by choosing the color block beside the overlay name in the Create Protocol or Protocol Interactive View. Overlays available for the Cell Motility BioApplication can be found in Table 9.
Parameter Description Include This Channel In Composite Determines if image for this channel is included in composite
image. Composite Color Determines what color will be assigned to this channel in the
composite image. Selected Track Indicates selected tracks in the displayed image. Rejected Track Indicates rejected tracks in the displayed image. Selected Cell Indicates selected cells in the displayed image. Rejected Cell Indicates rejected cells in the displayed image.
Table 9. Image display settings for the Cell Motility BioApplication
Assay Parameters for Population Characterization
Overview of Population Characterization The Cell Motility BioApplication provides the ability to characterize motility of cells based on their response compared to a control population. For a particular output feature, a range is determined from a control population (e.g., tracks in untreated wells) that has the normal physiological distribution for that feature. An upper limit (known as FeatureChNLevelHigh) sets the boundary for this feature. The FeatureChNStatus indicates whether a particular compound-treated track/cell within a track is below or above this boundary. For a particular Feature, a Status value of 0 means that it is below the limit and a value of 1 means that the feature value is above the limit (Table 10).
Value Cell Status Definition
0 Feature value within defined range
1 Feature value > upper threshold
Table 10. Binary explanation of Cell Feature Status when using population characterization The corresponding %HIGH_FeatureChN reports the percentage of cells in that well with the Well Feature greater than the limit. Figure 12 illustrates this concept by showing the distribution of a normal physiological population of cells for a particular Cell Feature and the shift in this distribution upon compound treatment. Please note that the shift in feature distribution can occur either to above or below the normal physiological distribution.

22 Chapter 2 Description of the Algorithm
Figure 12. Population characterization principle
Setting Cellular Response Levels There are two ways of setting the limit to characterize the cell population: manually or automatically.
To set the limit (FeatureChNLevelHigh) manually, specify the limits for the different features that are to be used to perform cell population characterization in the Assay Parameters of the BioApplication. This requires prior knowledge of typical feature values. The BioApplication then uses the defined levels to calculate the percentage of cells outside the bounds of the specific FeatureChNLevelHigh values.
To set the limit automatically, designate particular wells on the sample plate as Reference Wells. Typically, Reference Wells contain a control, untreated, population of cells that display the normal basal physiological response for the parameter being measured. These wells are first analyzed and then the population distribution for the different features are determined. The population characterization levels are then set by adding to the mean of the distribution its standard deviation multiplied by a coefficient that you define, named correction coefficient (_CC) in the Assay Parameters. You can use positive values for the correction coefficient to set the limit above the mean value of the feature and negative values for the correction coefficient to set limits below the mean value for the feature. The advantage of using Reference Wells to automatically calculate thresholds is that the thresholds are determined by a control population of cells and are independent of run-to-run variations such as different illumination conditions, fluorophore levels, or changes in cell conditions
Example for Setting Levels The appropriate value for MotionTrackAreaCh1LevelHigh used to calculate the output feature %HIGH_MotionTrackAreaCh1 can be set with the Protocol Interactive View.
Collect an image pair from a control well that has not been treated with a motility stimulant. Run the algorithm in the Protocol Create View on several images from such control wells and view the Well Output Feature MEAN_MotionTrackAreaCh1. Based on the MEAN_MotionTrackAreaCh1 values observed for these images, set a new value for the
Physiological distribution of measured parameter
Effect of compound treatment

Chapter 2 Description of the Algorithm 23
Assay Parameter MotionTrackAreaCh1LevelHigh. Check the effect of this level on the output feature %HIGH_MotionTrackAreaCh1 by re-running the algorithm in the Protocol Interactive View on images from compound (motility stimulant) treated wells. This interactive method is adequate for estimating the optimal threshold value. See Figure 13 below for a schematic of setting the Assay Parameter MotionTrackAreaCh1LevelHigh.
MotionTrackAreaLevelCh1
MotionTrackArea
# of
Cel
ls
MotionTrackAreaLevelCh1
MotionTrackArea
# of
Cel
ls
Figure 13. Using levels to count the percentage of tracks from stimulated cells. Shaded cells and area under the histogram curve indicate the responders (i.e., motile cells), while unshaded cells and curve represent a subpopulation of non-responding, stationary cells. An example of one Assay Parameter shown above is MotionTrackAreaCh1LevelHigh, which is then used to calculate the Well Output Feature %HIGH_MotionTrackAreaCh1. Reference Wells Processing Sequence By setting the UseReferenceWells Assay Parameter to 1, the Reference Wells processing is engaged. The specified Reference Well fields are acquired/analyzed, and Well and Plate Features are computed. Plate Feature values are directly used for cell population characterization. After this sequence is completed, computed values will be assigned to the Assay Parameters associated with each Reference Feature and regular scanning of the plate will begin. Again, if the feature value for MinRefAvgTrackCountPerField obtained from the Reference Wells is below the value set for that Assay Parameter, the BioApplication aborts the use of Reference Wells and processes the plate as if UseReferenceWells is set to 0. The Cell Motility BioApplication only uses Known Reference Wells. The sequence of computation for Reference Wells is as follows: 1) Cell Features are computed for every valid object within a field.
2) For each Cell Feature to be used for population characterization, the mean and standard deviation are computed over all cells in the field.
3) The automatically calculated level values for each feature are reported as Reference Features having the name RefFeatureChNLevelHigh.
4) Reference Well Features are computed as average values for fields in a well, weighted for the number of cells per field, and then Reference Plate Features are computed as arithmetic averages for all Reference Wells on a plate. Use of a weighted average minimizes the effect of sparse fields.

24 Chapter 2 Description of the Algorithm
Identifying Reference Wells and Control Parameters Reference Wells are specified in the Reference Wells Configuration Window (choose Change Reference Wells from the Tools menu). Select the wells to be set as Reference Wells and then select the button for the appropriate type of Reference Well (Known). Next, enter the Starting Field and Number of Fields. Click the Apply button to save the settings. Please see the appropriate User’s Guide for details.
The Reference Well settings are not saved as part of the Assay Protocol, rather they are saved in the Scan software.
TIP: To document the Reference Wells used in a scan, enter them in the Scan Comments box in the Scan Plate View.
Specifying and Controlling Reference Wells Two general Assay Parameters controlling the use of Reference Wells are: UseReferenceWells and MinRefAvgTrackCountPerField. UseReferenceWells is a binary Assay Parameter that allows you to indicate whether Reference Wells are used to determine the levels necessary to characterize cell populations.
• UseReferenceWells = 0 (zero) specifies that Reference Wells are not to be used, resulting in the use of manually entered levels for population characterization.
• UseReferenceWells = 1 specifies that Reference Wells are to be used.
If Reference Wells are to be used, the Assay Parameter MinRefAvgTrackCountPerField is used to specify the minimum average number of selected cells per field that you consider acceptable in the Reference Wells. If the measured cell density is less than or equal to this value, the Reference Features will not be used, rather the manually entered levels for population characterization are used. The Cell Features used to characterize various levels are associated with Assay Parameters in the form:
• FeatureChNLevelHigh (when Reference Wells are not used) OR
• FeatureChNLevelHigh_CC (when Reference Wells are used) where Feature refers to the name of the Cell Feature (such as FullTrackAreaCh1LevelHigh) and N refers to the specific channel. The FeatureChNLevelHigh Assay Parameter type specifies the actual levels and must be manually entered if Reference Wells are not used. The FeatureChNLevelHigh_CC Assay Parameter type is a correction coefficient (CC) used to derive the FeatureChNLevelHigh value from the mean and standard deviation of the reference well population according to the formula:
FeatureChNLevelHigh = Mean + FeatureChNLevelHigh_CC × SD If the correction coefficient is positive, the level will be greater than the mean, and if it is negative, the level will be less than the mean. A _CC value of 0 generates a level that equals the mean. If you are using Reference Wells, it is important to set the values for the correction coefficient Assay Parameters so that the appropriate subpopulations can be identified. Individual cells having feature values above the set or calculated value are identified as responder cells. The number of responder cells, expressed as a percentage of the entire cell population analyzed, is calculated for each assay well.

Chapter 2 Description of the Algorithm 25
Advanced Assay Parameters In Advanced Mode, all basic and advanced input parameteres are adjustable. The Hide Advanced Features checkbox will hide or show the advanced Assay Parameters. When you check the box, only the Basic Assay Parameters are shown; when you uncheck the box, all Basic and Advanced Assay Parameters are shown. The Advanced Mode Assay Parameters pertain to setting the levels for population characterization.
For each feature undergoing population characterization, there are two advanced Assay Parameters that control its levels: FeatureChNLevelHigh that sets the upper threshold and the presence of the _CC suffix which designates those levels are set using Reference Wells. For example, the Assay Parameters controlling the motion track area in Channel 1 are:
• MotionTrackAreaCh1LevelHigh • MotionTrackAreaCh1LevelHigh_CC
In the listing of Advanced Parameters in Table 11, instead of listing both level parameters for each feature, one entry for the feature will be listed giving the two different options, as shown in the following example for the Ch1 motion track area:
• MotionTrackAreaCh1LevelHigh, High_CC Units are expressed as FeatureChNLevelHigh, knowing that _CC is expressed as a number.
Parameter Units Description
MinRefAvgTrackCountPerField Number Minimum average number of tubes per field required for acceptance of reference well results
UseMicrometers Binary Measure lengths and areas in: 0 = Pixels, 1 = Micrometers
PixelSize µm Pixel size in micrometers (depends on objective selection)
FullTrackAreaCh1LevelHigh, High_CC Pixels or µm2
Defines FullTrackAreaCh1 population characterization thresholds
MotionTrackAreaCh1LevelHigh, High_CC Pixels or µm2
Defines MotionTrackAreaCh1 population characterization thresholds
TrackCellCountCh1LevelHigh, High_CC Number Defines TrackCellCountCh1 population characterization thresholds
FullTrackAreaPerCellCh1LevelHigh, High_CC Pixels or µm2
Defines FullTrackAreaPerCellCh1 population characterization thresholds
MotionTrackAreaPerCellCh1LevelHigh, High_CC Pixels or µm2
Defines MotionTrackAreaPerCellCh1 population characterization thresholds
TrackCellTotalAreaCh2LevelHigh, High_CC Pixels or µm2
Defines TrackCellTotalAreaCh2 population characterization thresholds
TrackCellAvgAreaCh2LevelHigh, High_CC Pixels or µm2
Defines TrackCellAvgAreaCh2 population characterization thresholds
Table 11. Advanced Assay Parameters available for the Cell Motility BioApplication.

26 Chapter 2 Description of the Algorithm
Description of Output Features
Output features are the biological measurements produced by the BioApplication. All features are categorized and accessible using the View application (see the User’s Guide for more details). Additionally, a subset of features, the Well Features, is listed in the Scan Plate View and Create Protocol View so that screening results can be viewed concurrently with scanning.
Cell Features Table 12 shows the output features reported for each selected cell, accessible in the Cell Feature window in the View application.
Parameter Units Description Cell# Number Unique object (track) ID
Top Pixels Y coordinate (in pixels) of top-left corner of image-aligned bounding box of Ch1 object (track)
Left Pixels X coordinate (in pixels) of top-left corner of image-aligned bounding box of Ch1 object (track)
Width Pixels Width (in pixels) of image-aligned bounding box of Ch1 object (track)
Height Pixels Height (in pixels) of image-aligned bounding box of Ch1 object (track)
XCentroid Pixels X coordinate (in pixels) of center of Ch1 object (track) YCentroid Pixels Y coordinate (in pixels) of center of Ch1 object (track)
FullTrackAreaCh1 Pixels or µm2
Area (in pixels or micrometers) of Ch1 track including cell area
FullTrackAreaCh1Status Binary FullTrackAreaCh1 status: 0 = No response, 1 = High response
MotionTrackAreaCh1 Pixels or µm2
Area (in pixels or micrometers) of Ch1 track excluding cell area
MotionTrackAreaCh1Status Binary MotionTrackAreaCh1 status: 0 = No response, 1 = High response
TrackCellCountCh1 Number Number of cells selected for analysis in a track
TrackCellCountCh1Status Binary TrackCellCountCh1 status: 0 = No response, 1 = High response
FullTrackAreaPerCellCh1 Pixels or µm2
Full track area (in pixels or micrometers) over all cells selected for analysis in a track
FullTrackAreaPerCellCh1Status Binary FullTrackAreaPerCellCh1 status: 0 = No response, 1 = High response
MotionTrackAreaPerCellCh1 Pixels or µm2
Motion track area (in pixels or micrometers) over all cells selected for analysis in a track
MotionTrackAreaPerCellCh1Status Binary MotionTrackAreaPerCellCh1 status: 0 = No response, 1 = High response
TrackCellTotalAreaCh2 Pixels or µm2
Total area (in pixels or micrometers) of all cells selected for analysis in a track
TrackCellTotalAreaCh2Status Binary TrackCellTotalAreaCh2 status: 0 = No response, 1 = High response
TrackCellAvgAreaCh2 Pixels or µm2
Average area (in pixels or micrometers) of all cells selected for analysis in a track
TrackCellAvgAreaCh2 Binary TrackCellAvgAreaCh2 status: 0 = No response, 1 = High response
Table 12. Cell Features available for the Cell Motility BioApplication

Chapter 2 Description of the Algorithm 27
Well Features Many Well features are derived from the Cell Features. Such features are identified by a prefix, as listed in Table 13, to the Cell Feature name (FeatureChNStatus).
Feature Prefix
Well Feature Description Units
MEAN_ Average of Feature_X for all objects selected for analysis in the well Same as cell feature
SD_ Standard deviation of Feature_X for all objects selected for analysis in the well
Same as cell feature
SE_ Standard error of mean of Feature_X for all objects selected for analysis in the well
Same as cell feature
CV_ Coefficient of variation of Feature_X for all objects selected for analysis in the well
Percent
%HIGH_ Percentage of selected objects in the well with Feature_X above high-response level Percent
Table 13. General Well Feature prefixes available for the Cell Motility BioApplication The algorithm also reports the following additional Well Features (Table 14) in the Scan Plate View of the Scan application in addition to the Well Detail window of the View application.
Well Feature Description
ValidTrackCount Number of valid objects (tracks) identified in the well. (Ch1 object selection parameters applied)
ValidFieldCount Number of fields in which valid tracks were identified in the well ValidTrackCountPerValidField Average number of valid tracks per valid field in the well
ValidCellCount Number of valid cells identified in the well.(Ch2 object selection parameters applied)
SelectedCellCount Number of valid cells selected for analysis in the well. (Ch3-6 object selection parameters applied)
%SelectedCells Percentage of valid cells selected for analysis in the well
SelectedCellCountPerValidField Average number of cells selected for analysis per valid field in the well
SelectedCellCountPerValidTrack Average number of cells selected for analysis per valid track in the well
Table 14. Well Features available for the Cell Motility BioApplication

28 Chapter 2 Description of the Algorithm
Reference Well Features Plate Features provide information about the various Reference Wells. These values are calculated and displayed only when the UseReferenceWells Assay Parameter = 1. In addition to Reference Well, the exposure times for various channels are also displayed only when viewing data in the View application. The list of reference features and their values are displayed in the Scan Plate View of the Scan application and entered into the plate database in the same way as regular Well Features and can be viewed via the View application. Table 15 lists the following Plate Output Features available for the Cell Motility BioApplication.
Plate Feature Description RefAvgTrackCountPerField Average count of objects (tracks) per field in reference wells
RefTrackFullAreaCh1LevelHigh High-response level for TrackFullAreaCh1 computed from reference well results
RefTrackMotionAreaCh1LevelHigh High-response level for TrackMotionAreaCh1 computed from reference well results
RefTrackCellCountCh1LevelHigh High-response level for TrackCellCountCh1 computed from reference well results
RefTrackFullAreaPerCellCh1LevelHigh High-response level for TrackFullAreaPerCellCh1 computed from reference well results
RefTrackMotionAreaPerCellCh1LevelHigh High-response level for TrackMotionAreaPerCellCh1 computed from reference well results
RefTrackCellTotalAreaCh2LevelHigh High-response level for TrackCellTotalAreaCh2 computed from reference well results
RefTrackCellAvglAreaCh2LevelHigh High-response level for TrackCellAvgAreaCh2 computed from reference well results
Table 15. Reference Features Available for the Cell Motility BioApplication

29
iDev Software Workflow This chapter describes the tasks in the workflow for Protocol optimization of the Cell Motility V4 BioApplication using the iDev software. More detailed technical descriptions of each Assay Parameter can be found in Chapter 2 of this guide.
iDev Protocol Optimization Tasks
The iDev Assay Development software provides guided workflows for Assay Protocol optimization. Assay Parameters which are user adjustable input parameters that control image analysis are organized in a task list. Each task contains only the Assay Parameters necessary for optimization of that task and has been designed to walk you through a defined workflow for Protocol optimization. Below are basic descriptions of each task and a summary of the Assay Parameters contained within that task. Chapter 2 describes the technical feature of each of the Assay Parameters in greater detail.
Image Preprocessing Image Preprocessing is the processing of images prior to object identification. The task comprises background removal for all selected channels. In this task, you can set operations such as background removal methods and values for each of the channels in the Protocol.
Figure 14. Protocol Optimization Task – Image Preprocessing
Chapter
3

30 Chapter 3 iDev Software Workflow
Cell Identification Ch2 Cell Identification is the identification of cells in the Channel 2 image. The task involves setting up methods and values for primary cell identification, cell smoothing, and cell segmentation for Channel 1 objects.
Figure 15. Protocol Optimization Task – Cell Identification Ch2

Chapter 3 iDev Software Workflow 31
Cell Validation Ch2 Cell Validation is cell selection based on area and intensity features calculated for the cells in Channel 2. In this task you will set minimal and maximal values for validating (equivalent to selecting and rejecting objects in the ArrayScan Classic software) cells in Channel 1 based on object selection features. Additionally in this task you will also determine if objects that are on the border of the field are included or rejected from analysis.
Figure 16. Protocol Optimization Task – Cell Validation Ch2

32 Chapter 3 iDev Software Workflow
Cell Selection Ch3 through ChN Cell Selection Ch3 through ChN is cell selection based on intensity features computed in Channels 3 through ChannelN under the circ mask derived from the Channel 2 cell mask. In this task you will set selection / rejection of the primary object based on intensity measurements in Channel 2 under a modified primary object mask. This task is similar to setting the assay parameter MaskModifierCh2 in the ArrayScan Classic software. The primary object mask can be dilated (Circ > 0), or eroded (Circ < 0) if the ROI Mask Creation box is checked.
Figure 17. Protocol Optimization Task – Cell Selection Ch3 through ChN

Chapter 3 iDev Software Workflow 33
Track Identification Track Identification is the identification of tracks in Channel 1. In this task you can set the methods and values for smoothing, thresholding, and segmentation of the tracks in Channel 1.
Figure 18 Protocol Optimization Task – Track Identification

34 Chapter 3 iDev Software Workflow
Track Validation Track Validation is track selection based on area and cell count in tracks. In this task you will set minimal and maximal values for validating (equivalent to selecting and rejecting objects in the Arrayscan Classic software) tracks in Channel 1 based on the area and number of cells in each track in Channel 1.
Figure 19. Protocol Optimization Task – Track Validation

Chapter 3 iDev Software Workflow 35
Reference Levels In this task, you can set level high and level low for computing % responders and/or %High and %Low based on several calculated Reference Level features. Reference Levels can be manually or automatically set by adjusting the level value or correction coefficient under the Reference Level task.
Figure 20. Protocol Optimization Task – Reference Levels


37
Index A
Algorithm Description, 9 overview, 9
Assay Parameters, 13, 19 advanced, 25 description, 13
B Background correction, 14 BioApplication
design, 2 example biology, 4 measurements, 4 overview, 1
C Cell Biology Background, 1 Cell Motility BioApplication
overview, 1
F Fixed threshold, 10, 11
G Gating
mask modifiers, 20
H High Content Screening, 1
I iDev Software, 29 Image Display Options, 21 Input Parameters
object identification, 16 Intensity thresholds
Fixed, 10, 11
Isodata, 10 None, 10 Triang, 10
Isodata, 10
M Mask Modifiers, 20
O Object Segmentation, 16 Object Selection Parameters, 16, 18 Output Features
description, 26 Plate Features, 28 Well Features, 26
R Reference Wells
control, 13 population characterization, 21
References, 7
S Settings
image display, 21 levels, 22 limits, 22
Smoothing, 16 System Compatibility, 1
T Track Separation, 16 Triang, 10
W Well Features, 26, 27