thermal synthesis of t 3o5 micro-fibers from c-doped …
TRANSCRIPT
In: Nanofibers: Synthesis, Properties, and Applications ISBN: 978-1-62257-085-0 Editors: Wei Dong Li and Xue Ping Wang © 2012 Nova Science Publishers, Inc.
Chapter 6
THERMAL SYNTHESIS OF TI3O5 MICRO-FIBERS
FROM C-DOPED TIO2 ON P-TYPE SI<100>
Nair Stem* and Sebastião G. dos Santos Filho# Laboratório de Sistemas Integráveis – Depto de Engenharia de Sistemas Eletrônicos
Escola Politécnica de Engenharia Elétrica - Universidade de São Paulo, Brasil
ABSTRACT
Magneli phases are TinO2n-1 compounds, where n=4-10. Such phases (Ti3O5, Ti4O7, Ti5O9, Ti6O11, etc.) have been synthesized using titania activated with additives (C, Nb, V, Fe, etc.) and thermal treatment in an inert or reducing atmosphere over a wide temperature range of 1000oC - 1300oC, as will be discussed during the introduction and overview of the present chapter.
A novel technique for obtaining crystalline phases of Ti3O5 (75%) over rutile (25%) by annealing 3%wt. carbon-doped TiO2 film on Si (100) at 1000oC in wet nitrogen (0.8% H2O) will be presented. Aiming to better understand the chemical bonds of Ti3O5 and the role of carbon in this process, the films were analyzed using several physical characterization techniques including Atomic Force Microscopy (AFM) performed with a Nanoscope III Digital Instrument, X-ray diffraction (XRD) using a Cu Ksource with a grazing angle of 0.4o over an angular range of 10o - 140o with a step size of 0.03o, Rutherford Backscattering (RBS), Fourier Transform Infrared Spectroscopy (FTIR – Digilab Bio Rad FTS 4000), Raman spectroscopy (Renishaw 2000), X-ray photoelectron emission and Photoluminescence spectroscopy between 500 nm and 900 nm with an Ar+ laser centered at 488 nm (Renishaw System 3000, detector CCD, Olympus Microscope).
According to the AFM analyses, different distributions of microfibers could be observed in different regions after annealing 3% wt. carbon-doped TiO2 film on Si (100) at 1000oC in wet nitrogen (0.8% H2O), as demonstrated by the bearing volume ratio and by height histograms. The XRD, Raman, FTIR and RBS analyses confirmed the presence of a structure composed of a crystalline phase of Ti3O5 as a mesh of microfibers on a bilayer of rutile TiO2/ SiO2. Meanwhile, the XPS and PL spectra supported the formation of a Magneli phase, indicating the presence of Ti3+
state. In addition, the high intensity of
* Email: [email protected].
# Email: [email protected].
No part of this digital document may be reproduced, stored in a retrieval system or transmitted commercially in any form or by any means. The publisher has taken reasonable care in the preparation of this digital document, but makes no expressed or implied warranty of any kind and assumes no responsibility for any errors or omissions. No liability is assumed for incidental or consequential damages in connection with or arising out of information contained herein. This digital document is sold with the clear understanding that the publisher is not engaged in rendering legal, medical or any other professional services.

Nair Stem and Sebastião G. dos Santos Filho 132
the Ti4+ peak allowed one to infer that there was a high adsorption of water, where Ti3+ and Ti4+ were believed to react with –OH radicals on the surface of the mesh of microfibers. Carbon doping is also inferred to occupy interstitial positions due to the absence of Ti-C bonds.
The extension of the FTIR spectrum to 4800 cm-1 indicated the presence of Ti4+-OH bonds and was supported by the PL and XPS analyses.
Thus, from studying the evolution of rutile TiO2 and Ti3O5 as a function of temperature (700oC, 900oC and 1000oC), a novel technique for obtaining Ti3O5 directly from carbon-doped TiO2 films on Si (100) by thermal annealing in wet nitrogen was established.
I. INTRODUCTION AND OVERVIEW Magneli phases have been synthesized using Titania (TiO2) doped with different
elements (C, Nb, V, Fe, etc.) and with different thermal treatments in inert or reductive atmospheres over a wide temperature range from 1000oC -1300oC [1-5].
For instance, Iwasaki et al. [6] showed that Ti3O5 could be obtained by three different methods: a) hydrogen reduction (3TiO2 + H2 = Ti3O5 + H2O), annealing at 1250oC during 3 h; b) reduction by Ti metal powder (Ti + 5 TiO2 = 2Ti3O5), by annealing in a vacuum furnace at 1250oC - 1280oC during 3 hours; and c) reduction by CO (3TiO2+CO = Ti3O5 + CO2), by annealing at 1250oC during 2 h.
More recently, Zheng [7] obtained Ti3O5 by hydrogen reduction of TiO2 using the sol-gel technique with thermal annealing at 1200oC – 1250oC. Meanwhile, Hiratani et al. [8] deposited TiO2 by r.f. magnetron sputtering and annealed in an oxygen-rich atmosphere, followed by a post-annealing in a nitrogen atmosphere using Rapid Thermal Annealing to obtain the Magneli phase.
In addition, suboxides such as Ti3O5 can also be obtained either by TiC oxidation to obtain titanium oxides (stoichiometric and non-stoichiometric) and carbon dioxide [4,10] or by adding Ti into TiO2. Leford et al. [10] showed that Ti3O5 is a subproduct of the TiC route (obtained by a mixture of TiO2 and C), demonstrating that TiC could be obtained by two different routes, either TiO2->Ti3O5->Ti2OC->TiC or TiO2->Ti3O5->Ti2O3->Ti2OC->TiC, depending on the temperature, pressure and grain size of the starting material.
Asbrink et al. [11] obtained -Ti3O5 by heating a stoichiometric mixture of TiO2 and Ti2O3 in an evacuated silica tube for two weeks over the temperature range 1273 K - 1373 K. Maitre et al. [12] obtained Ti3O5 and CO by heating a mixture of fine TiO2 and lamp black carbon for 8 h at a temperature of 1383 K in an argon atmosphere.
All Magneli phases possess a triclinic system and very similar lattice parameters, which makes it difficult to observe a single phase product and to identify the obtained compounds [5]. Meanwhile, Ti3O5 is usually obtained in polymorph forms , and ), which exhibit a variety of behaviors as a function of temperature and present altered physical parameters such as conductivity, magnetic susceptibility, and so on [7, 13, 14, 15].
The and forms of Ti3O5 are considered to be thermodynamically stable phases, whereas the -phase is generally obtained at temperatures above 1200 K and presents a crystallographic structure similar to an orthorhombic pseudo-brookite with a slight monoclinic deformation.

Thermal Synthesis of Ti3O5 Micro-Fibers … 133
The -phase has a monoclinic structure and is generally obtained from the -phase at temperatures below 450 K [16]. The -phase is considered a metastable phase; it presents an isomorphous structure (I2/c) and is generally obtained at temperatures greater than 1200 K and becomes stable at temperatures above 236 K.
However, the -phase can only be transformed into the -phase (P 2/c space group) at temperatures of approximately 236 K [17, 18, 19, 20, 21]. The -phase also presents a similar monoclinic structure (C2/m) to the alpha phase. Note that Ti3O5 can undergo a photoreversible transition from the λ to the β phase when subjected to light irradiation [22], and it is an adequate material for a wide range photoluminescence [20, 23, 24].
In this work, a novel technique for producing Ti3O5 from C-doped TiO2 on Si and the formation of Ti3O5 micro-fibers was carefully analyzed by considering the chemical bonds and the role of carbon during the structure formation [25, 26].
In particular, when a 3% wt. carbon-doped TiO2 film on Si (100) is annealed at 1000oC in wet nitrogen (0.8%H2O), the amorphous TiO2 phase gave rise to the crystalline phases of Ti3O5 (75%) and rutile TiO2 (25%).
As discussed previously [27, 28, 29], the oxygen vacancies in rutile TiO2 were produced either by carbon doping or by hydrogen reduction. The Ti3O5 Magneli phase could be associated with three different reactions: a) carbothermal reaction (TiO2 + C = Ti3O5 + CO); b) TiO2/Si under nitrogen atmosphere (TiO2 +Si = Ti3O5 +SiO2); and c) TiO2/Si under oxygen
atmosphere ( TiO2 + O2 = Ti3O5 or TiO2 + O2 + Si = TiO2 + SiO2) [5, 6, 27, 28].
The preliminary analysis inferred that rutile TiO2 was formed as the annealing temperature increased from 700oC to 900oC at the inner layer located at the interface next to the Si, and as the annealing temperature increased, Ti3O5 was formed and microfibers were obtained.
II. SYNTHESIS OF TI3O5 An RCA-based standard cleaning for silicon wafers was used with the following steps: a)
RCA 1 cleaning: 1 : 4 parts deionized (DI) water (H2O), 1 part 35% ammonium hydroxide (NH4OH), 1 part 30% hydrogen peroxide (H2O2) (heated at 75oC for 15 min); and b) RCA 2 cleaning: 4 parts DI H2O, 1 part 35% ammonium hydroxide (NH4OH), 1 part 35% hydrogen chloride (HCl), 1 part 30% hydrogen peroxide (H2O2) (heated at 80oC for 15 min) [25, 26, 29, 30].
Then, the metallization step consisted of the co-deposition of TiO2 (rutile) and C by e-beam evaporation using an EB Multihearth Electron Beam Source from Edwards and targets with 99.99% of purity from Sigma Aldrich. The carbon concentration was 3%wt., as previously described [25, 26].
The deposition pressure range was (2.3 – 4.0) Torr, and the e-beam current was fixed at approximately 150 mA, which resulted in 200 nm after deposition. After co-deposition, the samples were annealed at 1000oC for 120 min under a nitrogen + H2O (0.8%wt.) atmosphere. A block diagram of the experimental procedure is presented in figure 1, where an image of the Ti3O5 nanofiber mesh is also shown.

Nair Stem and Sebastião G. dos Santos Filho 134
Figure 1. Block diagram of the experimental procedures employed to obtain meshes of microfibers.
III. FORMATION MECHANISM OF TI3O5 NANO- AND MICROFIBERS Rutile titanium dioxide, or nearly stoichiometric TiO2-x, are stable forms with a small
number of point defects; however, as the number of point defects increases, some rearrangements of the crystalline structure (the shear planes, CSP) are observed to accommodate the defects, and sometimes, new compositions are formed. The point defects are often correlated with oxygen deficiencies, such as Ti interstitials and oxygen vacancies, or a combination of both, and are generally also associated with oxygen diffusion or doping [1-7].
When the concentrations of these anion vacancies in the crystallographic shear planes (SP) increases enough, the formation of Magneli phases, TijO2-j (Ti3O5, Ti4O7, Ti5O9, Ti6O11, etc.) is the most probable thermodynamic reaction [16]. The distance around the oxygen-oxygen planes in the CSP of Magneli phases is smaller and built up from octahedral TiO6, which is joined by edges and corners to form slabs of rutile-type structures [32, 33, 34]. Table 1 presents the reactions that can occur depending on the type of defect. In this table, it can be observed that the oxygen vacancy can be of two different types: doubly and singly ionized vacancies and the interstitial titanium can be present in either the Ti3+ or Ti4+ states, depending on the reaction [32]. For the Ti3O5 Magneli phase, the ratio between the Ti3+ and Ti4+ states is supposed to be approximately 2:1 [33].
Table 1. Defects in rutile TiO2 as reported in [32]
Major defect Reaction of formation Doubly ionized oxygen vacancy, Vo
.. Oox <-> (1/2) O2 (g) + Vo
.. + 2e’ Singly ionized oxygen vacancy Vo
. Oox <-> (1/2) O2 (g) + Vo
. + e’ Titanium interstitial Tii
4+ TixTi + 2 Oo
x -> Tii4+ + 4e’+ O2 (g)
Titanium interstitial Tii3+ Tix
Ti + 2 Oox -> Tii
3+ + 3e’+ O2 (g) Figure 2 presents a review of the formation mechanism of nano- and micro-fibers with
respect to the chemical bonds: a) carbon-doped rutile TiO2 crystals are deposited by an e-beam onto the silicon surface; b) at thermal treatment <900oC under 0.8% wt H2O, the nanosheets are detached and defects in rutile are produced, resulting in Ti4+ states; c) thermal

Thermal Synthesis of Ti3O5 Micro-Fibers … 135
treatment at temperatures <1000oC produces nano- and microfibers, where both the Ti3+ and Ti4+ states are present. As it will be discussed below, a small percentage of the Ti4+ bonds are provided from the Ti3O5 (Magneli Phase): Ti4+ : Ti3+ 1:2 [31]. The dominant bondings of Ti4+ can be associated with the reaction of the Ti3+ states with –OH radicals [35, 2]. A more detailed analysis of the obtained structures is provided below.
Figure 2. Formation of the Ti3O5 nano- and micro-fibers: a) carbon-doped TiO2 film is deposited onto the silicon <100> surface; b) thermal heating (<900oC) of the amorphous carbon-doped TiO2 makes the film a crystalline form of rutile – in this phase, the dominant chemical bonding is related to Ti4+ cores; c) the increase in the temperature under an atmosphere of 0.8% wt. gave rise to an increase of defects in rutile, resulting in the formation of the Magneli phase, Ti3O5.
IV. MATERIAL CHARACTERIZATION Focusing on the AFM analysis performed in previous works [26, 27], small islands (0.05
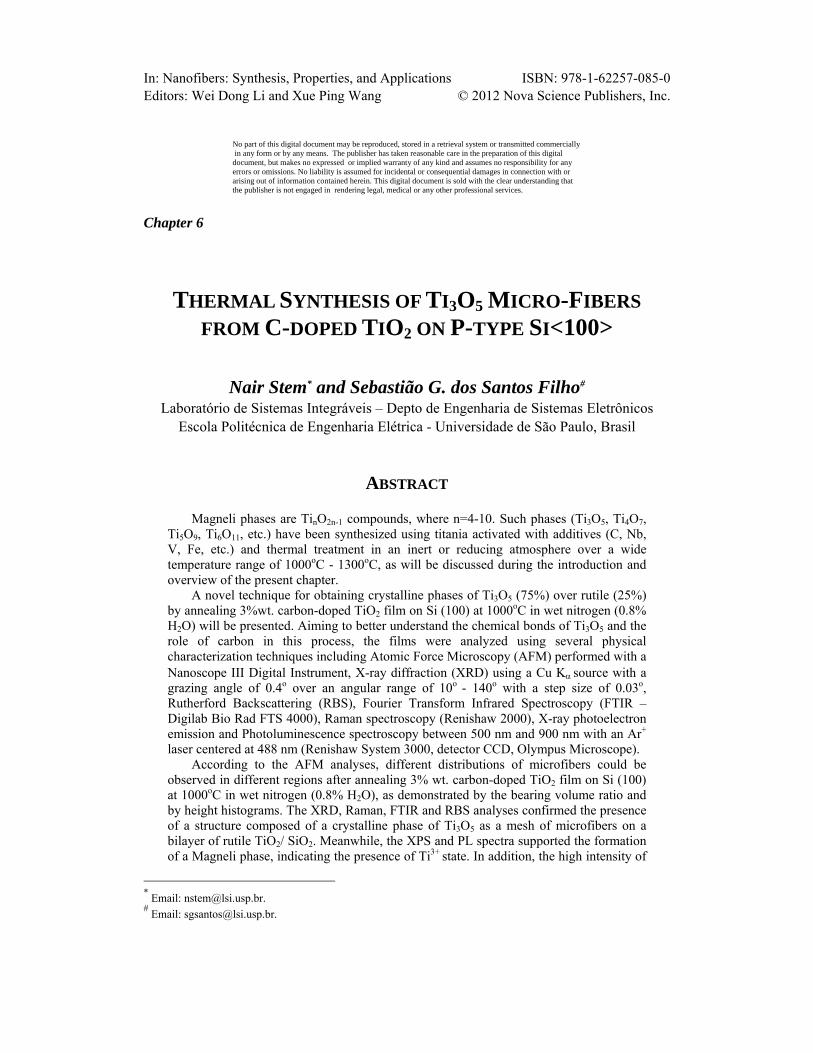
– 0.2) m in diameter were shown to evolve in microscale meshes that were randomly distributed and (0.1-1.1)m in length and (170±20) nm in width. The threshold temperature was shown to be 900°C, where the diameter was approximately 80 nm - 190 nm and the length was approximately 2.5 m. Concerning the distribution of the micro-fibers, AFM analyses of different regions in the same sample were obtained for 1000oC, showing that the height and length of the nanofibers varies along the sample. For the typical limits of the AFM images presented in figures 3.a and 3.b (extremeness of roughness), the average root mean square roughness varies from 2.52 nm to 5.80 nm. Figures 3.c and 3.d show 5-times amplification of figures 3.a and 3.b, respectively.
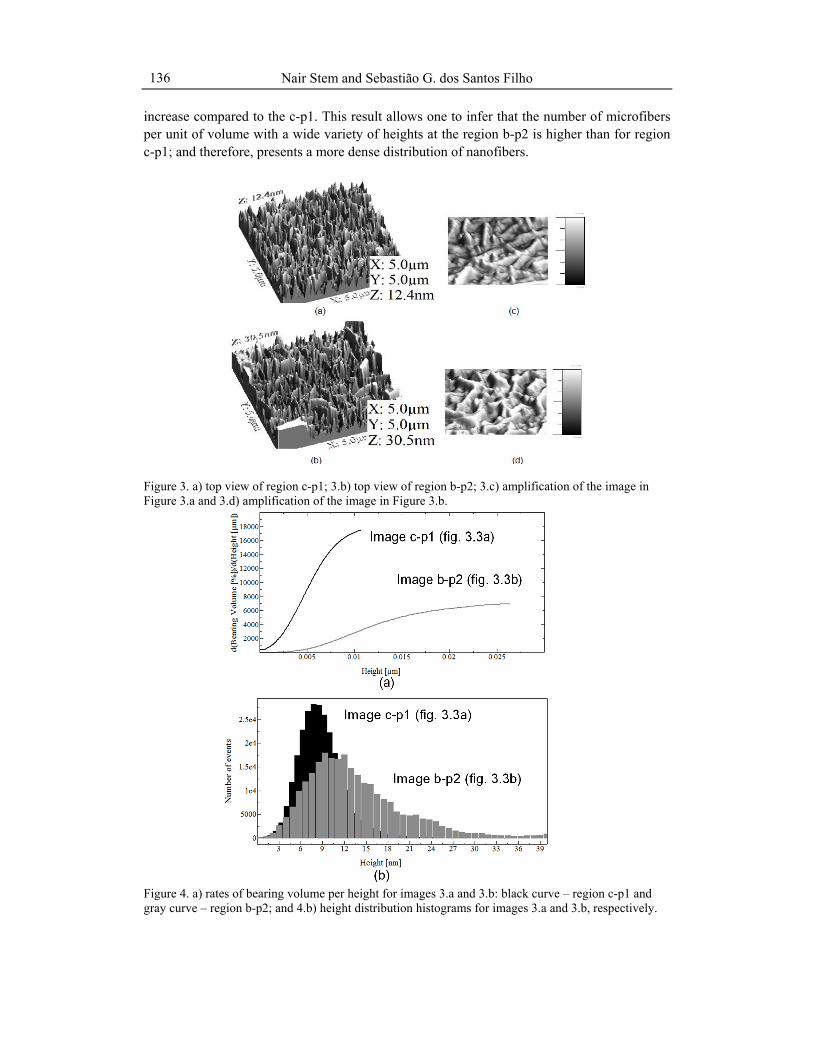
Figures 4.a and 4.b show the bearing volume ratio of the sample in the flood condition (obtained from the respective average height as the maximum height) and the height histograms, respectively. The bearing volume ratio (%), presented in figure 4.a, was calculated based on the ratio of the volume of holes to the real area by considering the volume of holes filled by 3D triangles, with the WSxM version 5.0 Develop 4.2 code [36]. The derivative of this curve shows that the bearing volume of the region b-p2 has a slower
Nair Stem and Sebastião G. dos Santos Filho 136
increase compared to the c-p1. This result allows one to infer that the number of microfibers per unit of volume with a wide variety of heights at the region b-p2 is higher than for region c-p1; and therefore, presents a more dense distribution of nanofibers.
Figure 3. a) top view of region c-p1; 3.b) top view of region b-p2; 3.c) amplification of the image in Figure 3.a and 3.d) amplification of the image in Figure 3.b.
Figure 4. a) rates of bearing volume per height for images 3.a and 3.b: black curve – region c-p1 and gray curve – region b-p2; and 4.b) height distribution histograms for images 3.a and 3.b, respectively.

Thermal Synthesis of Ti3O5 Micro-Fibers … 137
Figure 5.a presents the XRD spectra of the films deposited with 3% wt for different annealing temperatures: sample G (T=700oC), sample F (T=900oC) and sample E (T=1000oC). In figure 5.b an ampliation of XRD spectrum of sample 1E is also presented.
Figure 5. a) XRD after different annealings at: 1000oC (1E), 900oC (1F) and 700oC (1G) and b) an amplification of the most intense peak in the spectrum for sample 1E.
As discussed in a previous work [22, 23], sample G presented an amorphous structure, presenting some peaks that correspond to the rutile TiO2 phase. As the temperature is increased, the Magneli phase Ti3O5 (space group C2/m) appears, which is more evident at T=900oC, and a complete change in the morphology and crystallinity was observed at T=1000oC, where the microfibers were obtained, as shown in figure 3. According to XRD analysis, the lattice parameters of the Ti3O5 are a=9.8280 Å, b=3.7760 Å and c=9.8980 Å where alpha 90.000o, beta=91.3200o and gama=90.000o with a density of 4.05g/cm3 [6]. In

Nair Stem and Sebastião G. dos Santos Filho 138
addition, the RBS analysis allowed evaluation of the contribution of the TiO2 and Ti3O5 components for each studied temperature. A summary of the results is presented in table 2, where the Ti3O5 Magneli phase is shown to contribute to approximately 75% of the predicted stoichiometry which was confirmed by both RBS and XRD.
Table 2. Stoichiometry of the titanium oxide and aerial concentration of the silicon oxide
[SiO2], after fitting the rump-code simulation to the experimental RBS data. The contributions of the TiO2 and Ti3O5
phases were considered [25, 26], and the average concentration of carbon was 3%wt
Sample Temperature (oC) Stoichiometry [SiO2] X1016 cm-2
1G 700 TiO2.00 7.5 1F 900 0.75TiO2+0.25Ti3O5 8.0 1E 1000 0.25TiO2+0.75Ti3O5 9.0
Focusing on rutile TiO2, Raman spectra were collected as function of Raman shift for the
as-deposited and C-doped TiO2 films (3%wt.) annealed at 700oC, 900oC and 1000oC, peaks were observed at 429 cm-1, 610 cm-1 and 823 cm-1, respectively, which correspond to the rutile phase, as shown in figure 6. However, the intensities of these peaks were lower than the intensity of the Si peak, which makes it difficult to separate the interference and suggests that rutile TiO2 is an inner layer. Also note that there is no signal that could be attributed to the band of Ti3O5, which is in agreement with a previous work [37].
Figure 6. Raman spectra of films: a) as-deposited; b) sample 1G (700oC); c) sample 1F (900oC); and d) sample E (1000oC).
Thermal Synthesis of Ti3O5 Micro-Fibers … 139
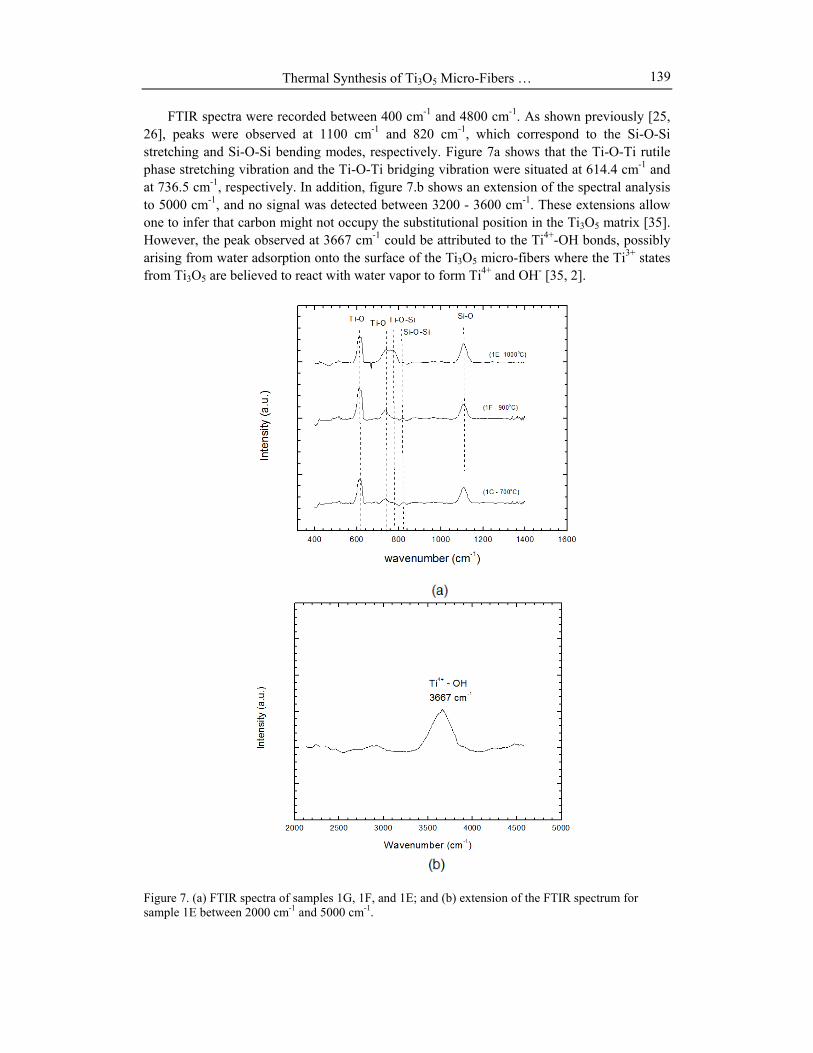
FTIR spectra were recorded between 400 cm-1 and 4800 cm-1. As shown previously [25, 26], peaks were observed at 1100 cm-1 and 820 cm-1, which correspond to the Si-O-Si stretching and Si-O-Si bending modes, respectively. Figure 7a shows that the Ti-O-Ti rutile phase stretching vibration and the Ti-O-Ti bridging vibration were situated at 614.4 cm-1 and at 736.5 cm-1, respectively. In addition, figure 7.b shows an extension of the spectral analysis to 5000 cm-1, and no signal was detected between 3200 - 3600 cm-1. These extensions allow one to infer that carbon might not occupy the substitutional position in the Ti3O5 matrix [35]. However, the peak observed at 3667 cm-1 could be attributed to the Ti4+-OH bonds, possibly arising from water adsorption onto the surface of the Ti3O5 micro-fibers where the Ti3+ states from Ti3O5 are believed to react with water vapor to form Ti4+ and OH- [35, 2].
Figure 7. (a) FTIR spectra of samples 1G, 1F, and 1E; and (b) extension of the FTIR spectrum for sample 1E between 2000 cm-1 and 5000 cm-1.

Nair Stem and Sebastião G. dos Santos Filho 140
To carefully analyze the chemical state that the carbon can be in or occupy, whether substitutional or interstitial, and to better understand the chemical bonds formed after annealing, XPS analyses were performed. In this technique, the sample is irradiated by hard X-Rays; the absorbed energy by some atoms excites electrons from the core levels of the elements, resulting in the emission of photons with a characteristic kinetic energy.
Figure 8 presents the spectra of the most prominent peaks that correspond to the two types of observed emissions: a) due to Auger transitions, C KLL and O KLL; and b) due to characteristic core emissions, O1s, Ti 2p3/2, C1s, and Si 2s and 2p as function of the binding energies (characteristic of the energy level of each atomic species and chemicals).
Figure 8. XPS spectra of samples 1G (T=700oC), 1F (T=900oC) and 1E (T=1000oC) as a function of the binding energy.
The main peaks (Ti 2p3/2, O1s, C 1s, Si 2s and Si 2p) are detailed and deconvoluted in figure 9. During these deconvolutions, the baseline was subtracted from the spectra and a Gaussian function was adopted to fit each signal.
The Ti 2p3/2 core level state was deconvoluted into the Ti4+ and Ti3+ states, and the O 1s presented the bondings: a) OI associated to Ti-O (referring to rutile TiO2); b) OII associated to Si-O and –OH arising from different sources as discussed below; c) OIII associated either to C-O (due to carbon doping) or to Si-O-Si due to the formation of the SiO2 interface layer.
Table 3 presents the main binding energies of the core levels: O 1s, Ti 2p3/2, C 1s and Si 2p and their corresponding relative areas.
Thermal Synthesis of Ti3O5 Micro-Fibers … 141
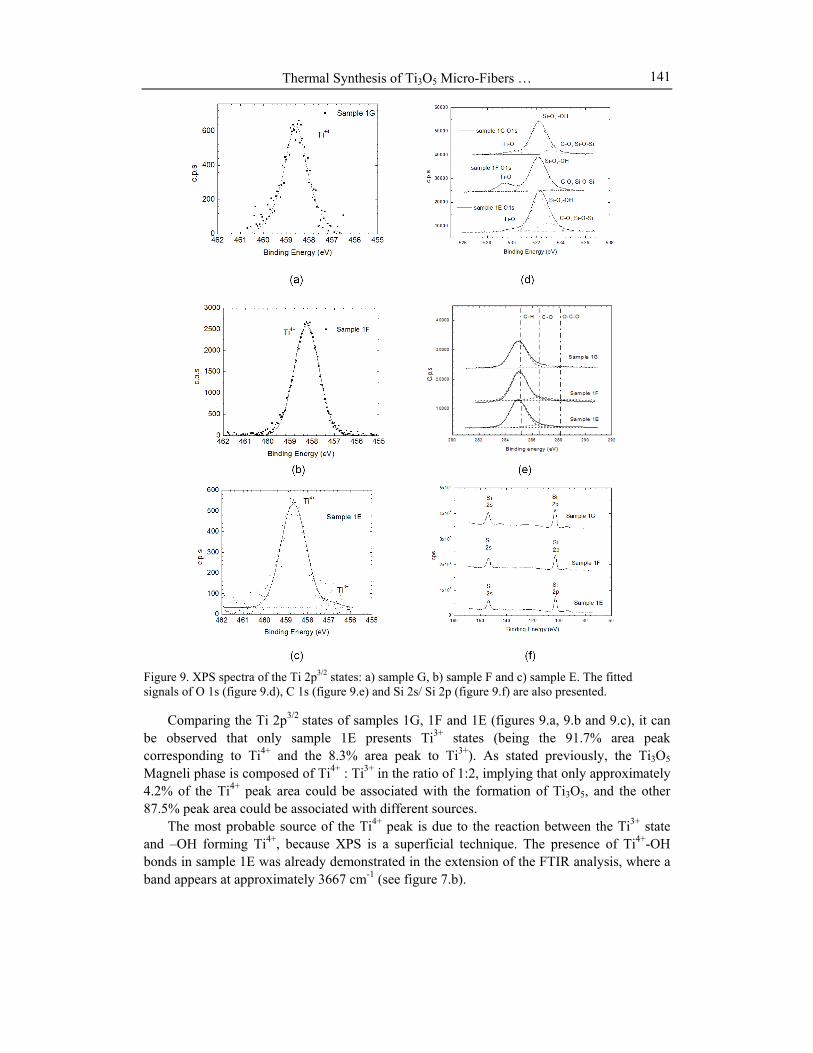
Figure 9. XPS spectra of the Ti 2p3/2 states: a) sample G, b) sample F and c) sample E. The fitted signals of O 1s (figure 9.d), C 1s (figure 9.e) and Si 2s/ Si 2p (figure 9.f) are also presented.
Comparing the Ti 2p3/2 states of samples 1G, 1F and 1E (figures 9.a, 9.b and 9.c), it can
be observed that only sample 1E presents Ti3+ states (being the 91.7% area peak corresponding to Ti4+ and the 8.3% area peak to Ti3+). As stated previously, the Ti3O5 Magneli phase is composed of Ti4+ : Ti3+ in the ratio of 1:2, implying that only approximately 4.2% of the Ti4+ peak area could be associated with the formation of Ti3O5, and the other 87.5% peak area could be associated with different sources.
The most probable source of the Ti4+ peak is due to the reaction between the Ti3+ state and –OH forming Ti4+, because XPS is a superficial technique. The presence of Ti4+-OH bonds in sample 1E was already demonstrated in the extension of the FTIR analysis, where a band appears at approximately 3667 cm-1 (see figure 7.b).

Nair Stem and Sebastião G. dos Santos Filho 142
Table 3. Main binding energies of the core levels: O1s, Ti 2p3/2, C1s and Si 2p and their corresponding relative areas
Chemical Bondings
Sample 1G Sample 1F Sample 1E
[eV] Area [%]
[eV] Area [%]
[eV] Area [%]
Ti Ti4+ 458.6 100.0 458.2 100.0 458.6 91.7
2p 3/2 Ti3+ _____ _____ _____ _____ 458.6 8.3
Ti-O (OI) 530.2 10.1 529.5 19.5 530.2 8.0
O Si-O,-OH (OII)
532.2 77.3 532.2 76.8 532.2 71.1
1s C-O, 533.2 12.7 533.8 3.7 533.0 20.9
Si-O-Si (OIII)
C-H 285.0 86.2 285.0 84.8 285.0 88.9
C C-O 286.6 11.0 286.5 11.8 286.5 10.1
1s O-C=O 288.7 2.8 288.9 3.3 288.7 1.0
Si Si-O 103.0 2.2 102.7 100.0 103.1 100.0
2p Other sources could also contribute to forming Ti4+, as in the case of figures 9.a, 9.b and
9.c, such as the rutile TiO2 bonds because of the porosity of the Ti3O5 microfiber mesh. These results are also supported by the O 1s spectra presented in figure 9.d and table 3, where it can be observed that OI type bonds associated with Ti-O at 530 eV occupy a small percentage of the peak area, approximately 10.1% (for sample 1G, where the film is mostly amorphous), 19.5% (for sample 1F) and 8.0% (for sample 1E). In contrast, the OII type bonds, such as Si-O and –OH, appear at 532 eV and are associated with water adsorption and are dominant in each analyzed case (corresponding to the range of area peaks between 71.1%-77.3%); this is further supported by the Raman analysis, where it was inferred that rutile TiO2 was an inner layer [26].
In addition, according to previous works [38, 39, 40, 41], the Ti3+ states can also be generated at the surface of rutile TiO2 as defects due to water adsorption by reacting to hydroxyl groups. For instance, in a previous work [37], the control of these defects has been achieved by Ar+ with low temperature vacuum annealing, which increased the porosity and the hydrophilicity. Another reaction that can contribute to the formation of Ti3+ ions is carbon doping, where carbon atoms can occupy either interstitial positions (TiO2Cx-> TiO2-xC + xVo+ x/2O2) or substitutional positions (TiO2Cx->TiO2-2xCx +Cx+xVo+x/2O2) [40, 5].
Additionally, from the analysis of the O1s spectra, there is another type of bonding, the OIII type, such as C-O and Si-O-Si, which appears at 533 eV and is associated with carbon doping and the formation of the SiO2 layer during thermal annealing, respectively. Comparing this result to the C 1s spectra, note that sample 1G basically did not present C-O bonding that was different from sample 1F and sample 1E. Despite not being possible to establish a direct comparison because of peak overlap and the variation of the sensitivity factor of each

Thermal Synthesis of Ti3O5 Micro-Fibers … 143
analyzed element, it would be possible to infer that sample 1E presents a higher contribution of the SiO2 layer because the peak area of Si-O-Si is approximately 20.9% of the total area.
From the C 1s spectrum (figure 9.e), it can be observed that the main chemical bonding is due to C-H bridges on the surface, probably due to water adsorption [42]. Another important point is that none of the samples presented either Ti-C (282.4 eV) or Si-Ti (281.8 eV) [43] chemical bonds, allowing one to infer that carbon occupies interstitial positions in the TiO2/Ti3O5 matrix, which is supported by the extended FTIR analysis, as shown in figure 7.
Comparing figure 9.d (Si-O-Si chemical bonds) with 9.f (Si 2p), note that the presence of SiO2 formed at 103 eV [44] during the 0.8% wt of water vapor thermal annealing of the film, but it is also not possible to isolate the contribution of this bond from the bonds related to C-O because of peak overlap, as shown in figure 9.e.
Generally speaking, photoluminescence measurements are associated with an excitation of electrons from the valence band and the long wavelength emitted (luminescence) because of the electron-hole recombination. According to previous works [25, 26], the analysis of PL spectra between 520 nm to 800 nm shows three typical bands: a) sample 1G: at 2.2 eV and 2.0 eV; b) sample 1F: at 2.2 eV and 1.9 eV and c) sample 1E: at 2.2 eV, 2.0 eV and 1.9 eV. The broad peak at 2.0 eV is associated with defects such as oxygen vacancies and Ti interstitials; 1.9 eV is associated with ionic point defects or excitons bound to these defects, and finally, the peak at 2.2 eV likely corresponds to self-trapped excitons [45]. In addition, by extending the spectra to a wavelength of 900 nm, a different band at approximately 1.46 eV is also observed. Figure 10 shows a comparison between the PL spectra for samples 1E, 1F and 1G.
Figure 10. Photoluminescence spectra of samples 1G (700oC), 1F (900oC) and 1E (1000oC) and the corresponding peak deconvolutions. Excitation source: Ar+ laser centered at 488nm.

Nair Stem and Sebastião G. dos Santos Filho 144
From the analysis of the PL spectra, note that samples F and G basically does not present a band at approximately 1.46 eV (850nm); the low signal that is observed is almost noisy. However, sample E present a significant band near 1.46eV (850 nm), inferring the presence of Ti3+ states, as in the case of the reference [45], which is associated with the Ti3O5 Magneli phase; part of this band could also be associated with typical defects present on the rutile TiO2 surface, as discussed previously [46]. These results are in agreement with the XRD spectra, where sample G is practically amorphous and Ti3O5 started to form at 900oC and significantly increased in concentration at 1000oC, which corresponds to the higher intensity in the PL spectra at 850 nm (1.46eV). However, note that the difference in the intensities of the 850 nm band are not quantitative because, as previously discussed, at the surface of the Ti3O5 nanofibers, a reaction with water to form Ti4+ and –OH might have occurred, as also indicated from the XPS analyses.
CONCLUSION A novel technique for obtaining C2/m-Ti3O5 directly from carbon-doped TiO2 films on Si
(100) by thermal annealing in wet nitrogen was established. The AFM analyses enabled the study of the height distribution and the microfiber distribution on the surface of sample 1E. Meanwhile, the XRD spectrum indicated that 1000oC is the threshold annealing temperature for obtaining meshes of microfibers. In the referred spectrum, rutile TiO2 and Ti3O5 could be observed. Raman and FTIR allowed one to infer that the rutile TiO2 layer is an inner layer, which is situated next to the SiO2/Si surface. In support of these results, the XPS analyses showed that only the samples annealed at 1000oC presented a Ti3+ signal in XPS spectra, which confirmed the formation of the Magneli phase. However, because the dominating signal is Ti4+, it could also be inferred that Ti3+ reacted with water to form Ti4+-OH, and due to the porosity of the material, it was possible to detect the corresponding bonds of rutile TiO2, despite the fact that XPS is a surface technique. In addition, as discussed in a previous work, the defects of rutile TiO2 allowed one to obtain a broad photoluminescence spectrum in the visible region. Further analysis, by extending the analysis to the wavelength of 900 nm, allowed one to obtain a small band that was centered at approximately 850 nm (1.46eV). This band could be associated with Ti3+ cores, which supported the XPS analysis. The carbon doping effect was also carefully studied, and the absence of Ti-C bonds allowed one to infer that carbon might occupy interstitial positions.
ACKNOWLEDGMENTS The authors would like to thank prof. Dr. Peter Hammer from LEF-IQ- UNESP - for the
measurements and discussions about XPS analysis; prof. Dr. Dalva Lucia Araújo de Faria and Msc. Michele Lemos de Souza from LEM-IQUSP for the measurements of PL spectra and prof. Dr. Evaldo Jose Corat from INPE for the discussions about Raman spectra. The authors also thank LSI-EPUSP staff for the support with e-beam, and the laboratories LCT-EPUSP, Lamfi-IFUSP, CCS-Unicamp for the XRD, RBS and FTIR measurements, respectively. The

Thermal Synthesis of Ti3O5 Micro-Fibers … 145
AFM images of this chapter were acquired at LFF-IFUSP. Nair Stem was supported by a CNPq post-doctoral scholarship under process number 151745/2008-0.
REFERENCES
[1] Lu, Y.; Matsuda, Y.; Sagara, K.; Hao, L.; Otomitsu, T. & Yoshida, H.. (2012) Advanced Materials Research, vol. 415 – 417, p. 1291 – 1296
[2] Wiesner, M. R. & Botero, J. Y.; Chapter 5 – Reative species generation on nanoparticulate material. In: Enviromental nanotechnology – Apllications and Impact of Nanomaterials, MacGraw Hill (2007), p.155-201.
[3] Liborio, L. & Harrison, N. (2008) Phys. Rev. B, vol. 77, issue 104104, p. 1-22. [4] Sen, W., Xu, B.-q., Yang, B. , Sun, H.-y., Song, J.-x., Wan, H.-l. & Dai, Y.-n.. (2011).,
Trans. Nonferrous Met. Soc. China, vol. 21, no1, p. 185-190. [5] Valentin, C. D.; Pacchioni, G. & Selloni, A. (2005). Chem. Mater., vol. 17, p. 6656-
6665. [6] Iwasaki, H.; Bright, N. F. H. & Rowland, J. F..(1967), Journal of the Less-Common
Metals, vol. 17, p. 99 – 104. [7] Zheng, L.. (2003). Sensors and Actuators B - Chemical, vol. 94, p. 294 – 297. [8] Hiratani, M.; Kadoshima, M.; Hirano, T.; Shimamoto, Y.; Matsui, Y.; Nabatame, T.;
Torii, K. & Kimura, S.. (2009). Applied Surface Science, vol. 207, p. 23-29. [9] Chen, Y.; Deng, Y.; Zhang, H.; Wang, L. & Ma, J. (2011). Materials Sciences and
Apllications, vol. 2, p. 1622-1626.. [10] Lefort, P.; Maitre, A. & Tristant, P. (2000).Journal of Alloys and Compounds, vol. 302,
p. 287-298. [11] Asbrink, S.; Gerward, L. &Olsen, J. S. (1989)J. App. Cryst., vol.. 22, p. 119-122. [12] Maitre, A.; Tetand, D. & Lefort, P. (2000) Journal of European Ceramic Society vol.
20, p. 15-22. [13] Makiura, R.; Takabayashi, Y.;Fitch, A. ;Tokoro, H.; Ohkosh, S. & Prassides, K. (2011).
Chem. Asian Journal, vol. 6 , p. 1886 – 1890. [14] Keys, L. K.andMulay, L. N. (1966). Applied Physics Letters, vol. 9, no 6, p. 248 – 250. [15] Baumard, J. F.; Panis, D. & Anthony, A. M. (1977). Journal of Solid State Chemistry,
vol. 20, p. 43-51. [16] Asblink, S. and Magnéli, A. (1959). Acta Cryst., vol. 12, p.575. . [17] Szot, K.; Rogala, M.; Speier, W.; Klusek, Z.; Beshmen, A. and Waser, R. (2011).
Nanotechnology, vol. 22, p. 1-21.. [18] Hashimoto, K.; Irie, H. and Fujishima, A. (2007). AAPPS Bulletin, vol. 17, no 6, p. 12 -
17. [19] Liu, R. and Shang, J.-X. (2012) Modelling and Simulation in Materials Science and
Engineering, vol. 20, p. 1-9. [20] Asbrink, S. and Pietrasko, A. (1991); Physica Status Solidi (a), vol. 128, issue 2, p.K77-
K81. [21] Rao, C. N. R. & Ramdas, S,. (1971). Journal of Solid State Chemistry, vol. 3, issue 1, p.
83-88.

Nair Stem and Sebastião G. dos Santos Filho 146
[22] Ohkoshi, S. I.; Tsunobuchi, Y.; Matsuda, T.; Hashimoto, K.; Namai, A.; Hakoe, F.; Tokoro, H. (2010), Nature Chemistry, vol. 2, p. 539–545.
[23] Konstantinova, E. A.; Kokorin, A. I.; Saktivel, S.; Kisch, H. & Lips, K. (2007), Chimia, vol. 61, no 12, p. 810-814.
[24] Reyes-Garcia, A.; Sun, Y.; Reyes-GLL, K. R. and Raftery, D. (2009). Solid State Nuclear Magnetic Resonance in Catalysis, vol. 35, no 2, p. 74-81.
[25] Stem, N.; Chinaglia, E.F. & dos Santos Filho, S.G. (2011) Materials Science & Engineering. B, Solid-State Materials for Advanced Technology, vol. 176, p. 1190-1196.
[26] Stem, N.; Chinaglia, E.F. & S. G. dos Santos Filho. (2011) Chapter 7: Physical and Optical Properties of Microscale Meshes of Ti3O5 nano and microfibers prepared via annealing of C-doped TiO2 thin films aiming at solar cells and photocatalysis applications. In: Solar Cells - Dye-Sensitized Devices. Editor: Prof. Leonid Kosyachenko. (Org.). InTechWeb, v. 04, p. 149-170, ISBN 978-953-307-735-2.
[27] Richards, B. S. (2002), Novel Uses of Titanium Dioxide for Silicon Solar Cells, Ph.D. Thesis, University of New South Wales.
[28] Iowaki, T. (1983). J. Chem. Soc., Faraday Trans. 1, vol. 79, p. 137-146. [29] Kern, W. (1990).The Journal of Eletrochemical Society, vol. 137, no 6, p. 1887-1892.
[30] Reinhardt, K. A. & Wern, K. (2008); Handbook of Silicon Wafer Cleaning Technology, Materials Science and Process Technology Series, 2nd Edition, Willian Andrew.
[31] Laidane, N.; Cheyssac, P.; Perrière, J.; Gottardi, G.; Luciu, I.; & Micheli, V. (2010). Journal of Physics D.: Applied Physics, vol. 43, p. 1-11.
[32] Zakerzweska, K. (2012). Advances in Materials Science and Engineering, vol. 2012, Article ID 826873, doi:10.1155/2012/826873.
[33] Stoianov, E.; Langehorst, F. and Steinle-Neumann (2007). American Mineralogist, vol. 92, p. 377-386.
[34] Nowotny, J. (2011). Chapter 3 Basic Properties of TiO2. In: Oxide Semiconductors for Solar Energy Converison Titanium Dioxide, p. 145-163, ISBN 978-1-4398-4839-5.
[35] Lin, X.; Rong, F.; Xiangi, J.; Fu, D. (2011). Microporous and Mesoporous Materials, vol. 142, p. 276 – 281.
[36] Horças, I.; Fernandez, R.; Gomez-Rodrigues, J. M.; Colchero, J.; Gomez-Herrero, J. and Barço, A. M. (2007). Rev. Sci. Instrum., vol. 78, issue 013705, doi: 10.1063/1.2432410.
[37] Balachandran, U. and Eror, N. G. (1982). Journal of Solid State Chemistry, vol. 42, p. 276-282.
[38] Guillemot, F.; Porté, M. C.; Labrugere, C.and Baquey, Ch. (2002). Journal of Colloid and Interface Science, vol. 255, p. 75-78.
[39] Sanchez, C. S. (2011). Structure and electronic of different adsorbates on the rutile TiO2 (110) surface. Doctorade thesis from Departamento de Fisica de La Materia Condensada; Universidad Autonoma de Madrid.
[40] Zvrev, G. M.; Sidoryuk and Skvortsov (1983), , Sov. J. Quantum Electron, vol. 11, p. 1393 – 1395.
[41] Rong, W., Nobuyuki, S.,Fujishima, A.; Watanabe, T. & Hashimoto, K. (1999). , J. Phys. Chem. B, vol. 103, issue12, p. 2188–2194.
[42] Svábora, M.; Weishauptová, Z. &Prybyl, O. (2011), Fuel, vol. 90, issue 5, p. 1892-1899.

Thermal Synthesis of Ti3O5 Micro-Fibers … 147
[43] Wen, Qi-Ye; Zhang, H.-W.; Yang, A.-H.; Gu, De-En.; Li, Y.-X.; Liu, Y.-Li; Shen, J. & Xiao, J. Q. (2009). IEEE Transactions on Magnetics, vol. 45, no 10, p. 4096 – 4099.
[44] Abad, J.; Gonzalez, C.; Andres, P.L.; & Roman, E. (2010), Phys. Rev. B, vol. 82, 165420.
[45] Enache, C. S.; Schoonman, J.; Krol, R. V. D. (2004). J. Electroceram.; vol. 13, p. 177-182.
[46] Poznyak, S. K.; Sviridov, V. V.; Kulak, A. I. & Samtsov, M. P. (1992), J. Eletroanal. vol. 340, p. 73-97.