thermal properties of granular silica aerogel for high
TRANSCRIPT
Thermal Properties of Granular Silica Aerogel for High-Performance Insulation Systems
by
Adam Neugebauer
Bachelors of Science, Materials Science and Engineering University of California, Berkeley (2004)
Submitted to the Department of Architecture in Partial Fulfillment of the Requirements for the Degree of
Master of Science in Building Technology
at the
Massachusetts Institute of Technology
June, 2013
© 2013 Massachusetts Institute of Technology. All rights reserved.
Signature of Author:
Department of Architecture May 16, 2013
Certified by:
Leon Glicksman Professor of Building Technology and Mechanical Engineering
Thesis Supervisor
Accepted by: Takehiko Nagakura
Associate Professor of Design and Computation Chair of the Department Committee on Graduate Students

Page | 2
Page | 3
Thermal Properties of Granular Silica Aerogel for High-Performance Insulation Systems
by
Adam Neugebauer
Submitted to the Department of Architecture on May 16, 2013 in Partial Fulfillment of the
Requirements for the Degree of Master of Science in Building Technology
ABSTRACT
Based on mounting evidence in support of anthropogenic global climate change, there is an urgency for developments in high-performance building techniques and technologies. New construction projects provide substantial opportunities for energy efficiency measures, but they represent only a small portion of the building stock. Conversely, while existing buildings are plentiful, they typically have a much narrower range of feasible energy efficiency options. Therefore, there will continue to be a need for the development of new and improved energy efficiency measures for new building construction and even more so for deep retrofits of existing buildings. This thesis provides an overview of the research performed into the on-going development at MIT of a high-performance panelized insulation system based on silica aerogel. Two test methods were used for measuring the thermal conductivity of the granules: the transient hot-wire technique and the guarded hot-plate system. Utilizing the hot-wire set-up, it was demonstrated that compressing a bed of granules will decrease the thermal conductivity of the system until a minimum point is reached around the monolithic density of the aerogel. For the Cabot granules, this was seen at 13 mW/m-K and about 150 kg/m3. The MIT granules showed equal performance to the Cabot granules at bed densities 20-30 kg/m3 lower. The hot-plate testing was able to experimentally evaluate previous analytical predictions regarding the conductivity impact of the internal panel truss and the under-prediction of radiant heat transfer in the hot-wire method. Hot-wire testing was also done in a vacuum chamber to quantify potential performance improvements at reduced air pressures. Since a vacuum would require the incorporation of a barrier film into the panel system, some analyses were done into the thermal bridging potential and gas diffusion requirements of such a film. Additionally, physical prototyping was done to explore how the film would be incorporated into the existing panel design. The aerogel-based insulation panel being developed at MIT continues to show promise, though there are still plenty of opportunities remaining in the development cycle.
Thesis Supervisor: Leon Glicksman
Title: Professor of Building Science and Mechanical Engineering

Page | 4
Page | 5
ACKNOWLEDGEMENTS
First I want to thank my advisor, Prof. Leon Glicksman, for his immeasurable help and guidance
throughout my time here at MIT. I couldn’t have had a better advisor. You have been the perfect fit to
help me through the ups and downs, while still being ready to give me a good nudge when needed.
Thank you, Leon, for inviting me to be a part of this research, which was exactly the type of project I was
looking for.
I also need to thank the rest of the research team at MIT – Prof. Lorna Gibson, Kevin Chen, Prof.
Gang Chen, Taofang Zeng and Yi He – and at DuPont – Dr. Vivek Kapur and Fan Li. We also were helped
along the way by a couple MIT UROPs: Mary Zhuang and Delphine Kaiser. Thanks also to Ellann Cohen
for an excellent passing of the baton. And thanks to the invaluable backbones of BT who managed to
handle all of our urgent and always last minute requests: Kathleen Ross and Alex Golledge.
It is also important to note that this research was supported through funding by the DuPont-MIT
Alliance. So thank you, DMA, for making all of this possible.
Then there’s the Fraunhofer Center for Sustainable Energy Systems, which provided invaluable
support for this research. Not only allowing us access to their equipment, but also their time involved in
testing our samples. In particular I want to thank Kurt Roth, Nitin Shukla, Alliston Watts and Bryan
Urban.
The technical support team at LaserComp was alway ready, willing and able to find an answer to
my many questions. Special thanks to Andrzej Brzezinski, Kevin Collins and Akhan Tleoubaev.
Thankfully there was a long list of people that were there to help me when things went wrong,
but I only have time for a few highlights. Daniel Kraemer and Ken McEnaney came to the rescue more
times than I can recall. Jianjian Wang, Sungwoo Yang and Amy Marconnet all provided troubleshooting
support with my equipment. I should also thank Bolin Liao and Sean Buhrmester for all of their support
in the 5-004 and 3-245 labs.
When I wasn’t getting help fixing things, I was probably getting help making things. I loved my
times in the MIT Rapid Prototyping Shop, Woodshop and Hobby Shop. Thanks specifically to Chris
Dewart, David Costanza, Richard Ong, Kristen Zeiber and Ken Stone. And a lot of this work was related to
Prof. John Fernandez’s prototyping class. Thanks, John, for all of your input and guidance.
My BT labmates deserve a standing ovation. I’m really going to miss you and our lunches near
Steam Café. Mighty Ducts softball will always be a cherished memory.

Page | 6
There are a few other folks around MIT that didn’t fit neatly into any of the above categories,
but I don’t want to miss them. Emily Ranken, Christine Sherratt, Dr. Anna Maria Coclite, Dr. Barbara
Hughey, Jessica B. and Simon Howard, thank you for each of your unique contributions.
Last though anything but least, there are my friends and family. My relief valves, my sanity
checks, my support staff. I wish I could thank each and every one of you but, again I must limit myself.
To our wonderful cat, Tippy: thank you for constantly and incessantly reminding me that I could always
take yet another break to pet you. And to my wife, Riddhi: I literally would not have made it here
without you.
Page | 7
TABLE OF CONTENTS
ABSTRACT ...................................................................................................................................................... 3
ACKNOWLEDGEMENTS ................................................................................................................................. 5
TABLE OF CONTENTS ..................................................................................................................................... 7
LIST OF FIGURES ............................................................................................................................................ 8
LIST OF TABLES ............................................................................................................................................ 10
LIST OF SYMBOLS ........................................................................................................................................ 11
1 BACKGROUND ..................................................................................................................................... 15
1.1 Aerogels as Thermal Insulation ................................................................................................... 17
1.2 Aerogel Synthesis ........................................................................................................................ 19
1.3 Aerogel Insulation Products ........................................................................................................ 20
1.4 Previous Research at MIT............................................................................................................ 21
1.5 Summary of Thesis Research ...................................................................................................... 23
2 THERMAL CONDUCTIVITY TESTING .................................................................................................... 24
2.1 Transient Hot-Wire Testing – Background .................................................................................. 24
2.2 Transient Hot-Wire Testing – Methods and Materials ............................................................... 27
2.3 Transient Hot-Wire Testing – Results ......................................................................................... 29
2.4 Guarded Hot-Plate Testing – Methods and Materials ................................................................ 32
2.5 Guarded Hot-Plate Testing – Results .......................................................................................... 37
2.6 Thermal Conductivity Testing – Concurrent Research ............................................................... 39
2.7 Discussion of Thermal Conductivity Results ............................................................................... 43
3 LOW PRESSURE PANEL DESIGN........................................................................................................... 47
3.1 Barrier Films – Impacts on Thermal Conduction......................................................................... 47
3.2 Barrier Films – Analysis of Diffusion ........................................................................................... 52
3.3 Barrier Films – Design Considerations ........................................................................................ 56
3.4 Barrier Films – Design Prototyping ............................................................................................. 57
4 CONCLUSIONS AND FUTURE WORK ................................................................................................... 61
4.1 Conclusions ................................................................................................................................. 62
4.2 Future Work ................................................................................................................................ 63
5 REFERENCES ........................................................................................................................................ 65
6 APPENDIX ............................................................................................................................................ 68
Page | 8
LIST OF FIGURES
Figure 1.1: Energy use break-down by sector (left) and end-use in buildings (right).[2] ........................... 16
Figure 1.2: Thermal conductivity performance of various insulation materials.[3][4][5][6][7][8][9] ........ 17
Figure 1.3: Phase diagram demonstrating supercritical drying.[3]............................................................. 18
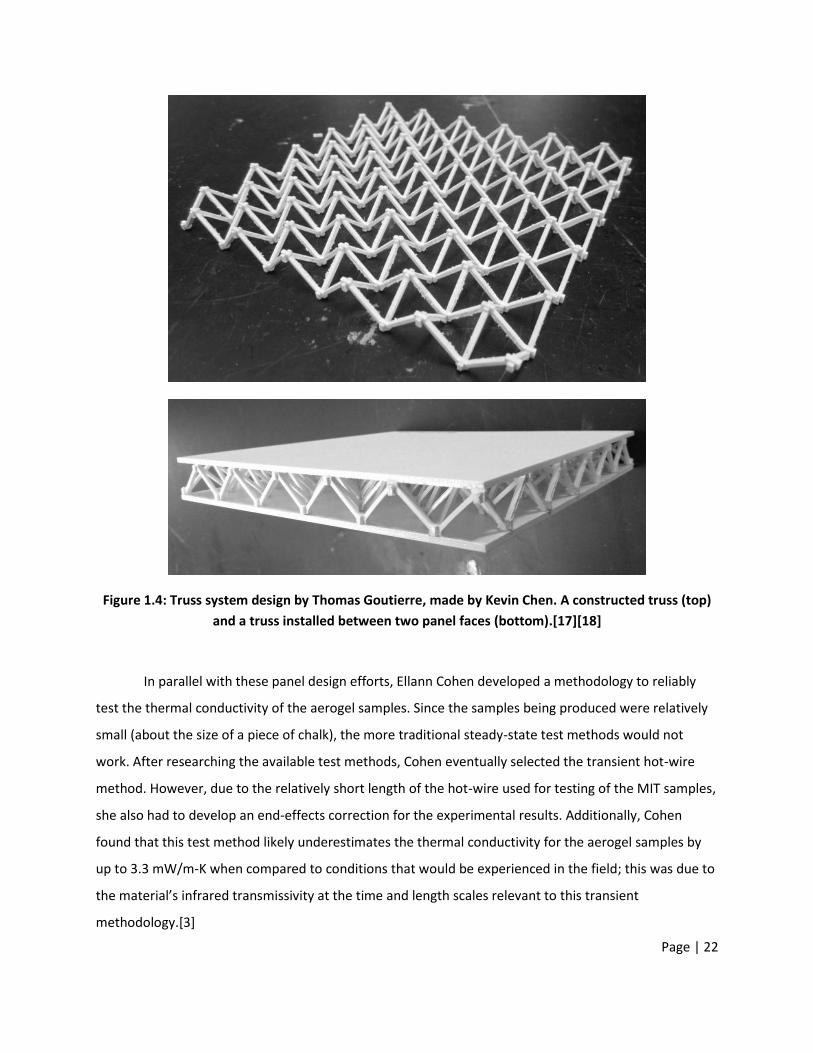
Figure 1.4: Truss system design by Thomas Goutierre, made by Kevin Chen. A constructed truss (top) and
a truss installed between two panel faces (bottom).[17][18] .................................................. 22
Figure 2.1: Representative plot of results from a typical hot-wire test.[3] ................................................ 25
Figure 2.2: Diagram of the test chamber for the hot-wire testing of aerogel granules. ............................ 28
Figure 2.3: Diagram of the vacuum chamber set-up for the hot-wire testing of aerogel granules. .......... 29
Figure 2.4: End-effect corrected thermal conductivity hot-wire test results for granular silica aerogels
samples under compression. .................................................................................................... 30
Figure 2.5: End-effect corrected thermal conductivity hot-wire test results for Cabot and MIT silica
aerogel granules under vacuum compared to results by Cohen of a monolithic MIT sample.[3]
.................................................................................................................................................. 31
Figure 2.6: Schematic of 1D heat flow through insulation panel. .............................................................. 33
Figure 2.7: Schematic of 1D heat flow through panel core. ....................................................................... 34
Figure 2.8: Schematic of 1D heat flow through stack of polystyrene sheets. ............................................ 36
Figure 2.9: Micro-CT scans of aerogel granules (dark color) immersed in water (light color). Granular bed
densities (in air) for each test are listed.[18] ............................................................................ 40
Figure 2.10: Micro-CT results of volume fraction of inter-granular voids for compressed Cabot aerogel
granules.[18] ............................................................................................................................. 41
Figure 2.11: Pore volume calculations from gas sorption testing of compressed Cabot aerogel
granules.[18] ............................................................................................................................. 42
Figure 2.12: Qualitative visualization of contributing factors to granule bed conductivity. ...................... 44
Figure 3.1: Schematic and circuit diagrams of 1D conduction through the panel. .................................... 48
Figure 3.2: Schematic and circuit diagrams of 2D conduction through the panel. .................................... 49
Figure 3.3: Composition of a simple barrier film system.[29] .................................................................... 51
Figure 3.4: Calculated loss in whole-panel resistance values (including surface resistances) across a range
of square panel lengths and total metalized layer thicknesses within the barrier film. .......... 51
Figure 3.5: Typical barrier film installation (a) for a vacuum panel and two alternatives: installing the film
inside the panel faces (b) and sandwiching the film between two face pieces (c). ................. 56
Page | 9
Figure 3.6: Schematic of the barrier film design with pre-installation seams highlighted in blue and post-
installation seams in gold. (Top) Shape of a single barrier film piece. (Bottom) Barrier film
piece prepared for installation into panel. ............................................................................... 57
Figure 3.7: Wooden prototype for a flexible panel design developed by Ellann Cohen.[3] ....................... 58
Figure 3.8: Schematic of sub-panel joints when straight (top) and flexed (bottom).[3] ............................ 58
Figure 3.9: Potential sub-panel joint construction using a foam bead to act as the interface. Schematic
with the full bead (top) and after cutting to the desired concave/convex shape (bottom). ... 59
Figure 3.10: Prototype of a method to address geometric incompatibility of the film at each panel
corner. The curve at the intersection has been highlighted in gold. ........................................ 60
Page | 10
LIST OF TABLES
Table 2.1: Comparison of compression testing results between hot-plate and hot-wire methods........... 38
Table 3.1: Calculated barrier film performance requirements. .................................................................. 55
Table 6.1: List of chemicals used in synthesis of MIT aerogels.[16] ........................................................... 68
Table 6.2: Material properties of MIT and Cabot aerogels.[3][6][27] ........................................................ 68
Page | 11
LIST OF SYMBOLS
= Surface area of the film [m2]
= Cross-sectional area of the aerogel, normal to heat flow through the aerogel [m2]
= Cross-sectional area of the core, normal to heat flow through the aerogel [m2]
= Total cross-sectional area of the film along the edges, normal to the 1D heat flow [m2]
= Cross-sectional area of the panel (without film), normal to the 1D heat flow [m2]
= Cross-sectional area of the sample [m2]
= Cross-sectional area of the truss, normal to heat flow through the truss [m2]
= Cross-sectional area of the truss, parallel to [m2]
= Cross-sectional area of the vacuum panel (with film), normal to the 1D heat flow [m2]
= Specific heat capacity of the insulation material [J/kg-K]
= Diameter of the hot-wire [m]
= Increment of time for gas diffusion [day]
= Corrected value of the increase in temperature of the mid-point of the hot-wire [K]
= Experimental value of the average increase in temperature along the hot-wire [K]
= Increase in temperature of the hot-wire [K]
= Euler’s number = 0.577215665 [unitless]
= Current applied to the hot-wire [A]
= Gas transmission rate across the film [(cm3)STP/m2-day-atm]
= Thermal conductivity of the material around the hot-wire [W/m-K]
= Thermal conductivity of the aerogel [W/m-K]
= Thermal conductivity of the core material [W/m-K]
= Experimental value for thermal conductivity of the insulation material [W/m-K]
= Thermal conductivity of the facing material [W/m-K]
= Thermal conductivity of the test stack of sheets [W/m-K]
= Thermal conductivity of a polystyrene sheet [W/m-K]
= Thermal conductivity of the sample [W/m-K]
= Thermal conductivity of the truss material [W/m-K]
= Contribution to thermal conductivity of the panel by the truss [W/m-K]
= Length of the hot-wire [m]
Page | 12
= Thickness of the film [m]
= Length of a truss segment, parallel to heat flow through the truss [m]
= Mass transmission rate across the film [g/m2-day-atm]
= Moles of gas [mol]
= Number of sheets in the test stack [unitless]
= Rate of internal (partial) pressure increase [atm/day]
= Ambient (partial) pressure [atm]
= Final internal (partial) pressure (or internal (partial) pressure at “failure”) [atm]
= Internal (partial) pressure [atm]
= Original internal (partial) pressure [atm]
= Standard (partial) pressure ≡ 0.986 (for air) [atm]
= Permeability coefficient of the film material for a given gas [(cm3)STP/m-day-atm]
= Resistance heat generated in the hot-wire [J]
= Steady-state energy flux through the sample [W]
= Ideal gas constant ≡ 8.206x10⁻⁵ [m3-atm/mol-K]
= Electrical resistance of the hot-wire [Ω]
= Resistance of the film along the edge, parallel to the 1D heat flow [m2-K/W]
= Resistance of the film along the face, parallel to the 1D heat flow [m2-K/W]
= Resistance of the th element [m2-K/W]
= Resistance of the test stack of sheets [m2-K/W]
= Resistance of the core aerogel panel, parallel to the 1D heat flow [m2-K/W]
= Net resistance of elements in parallel [m2-K/W]
= Contact resistance between a polystyrene sheet and an instrument plate [m2-K/W]
= Contact resistance between two polystyrene sheets [m2-K/W]
= Surface resistance from the panel to the surroundings [m2-K/W]
= Net resistance of elements in series [m2-K/W]
= Net resistance of the panel system assuming 1D conduction only [m2-K/W]
= Net resistance of the panel system assuming complete 2D conduction [m2-K/W]
= Time since the current was applied [sec]
= Panel lifetime [day]
= Reference time [sec]
Page | 13
= Steady-state temperature of the cold-side plate [K]
= Steady-state temperature of the hot-side plate [K]
= Internal temperature of the panel [K]
= Standard temperature ≡ 273.15 [K]
= Effective volume of gas inside the panel [m3]
= Volumetric flow rate across the film, at STP [(cm3)STP/day]
= Thickness of the core [m]
= Thickness of a single panel facing [m]
= Total thickness of the test stack of sheets [m]
= Thickness of a single polystyrene sheet [m]
= Thickness of the sample [m]
= Steady-state temperature split across the sample [K]
= Angle between the panel facing and the truss [degrees]
= Gas density at ambient temperature and pressure [g/m3]
= Density of the insulation material [kg/m3]
= Correction factor [unitless]
= Volume fraction of aerogel in the core [unitless]
= Cross-sectional area fraction of the film along the edge, normal to the 1D heat flow [unitless]
= Cross-sectional area fraction of the th element in parallel [unitless]
= Cross-sectional area fraction of the core aerogel panel, normal to the 1D heat flow [unitless]
= Volume fraction of truss in the core [unitless]

Page | 14
Page | 15
1 BACKGROUND
The push for ever-more-efficient buildings (both new and existing) continues to be driven by
various carrots and sticks in the industry. Building standards, energy codes and emission regulations all
continue to raise the bar for the minimum performance of buildings while government incentives, utility
rebates and market differentiation encourage projects to go above and beyond these baselines. These
drivers have been seeing increased attention and urgency in the face of mounting evidence in support of
anthropogenic global climate change. Therefore the industry needs to match this pace with
developments in high-performance building techniques and technologies.
Since new construction provides an array of energy efficiency opportunities that may not be
feasible – or in some cases even possible – in existing buildings, these new building projects often
represent the low-hanging fruit for energy efficiency potential in the building market. The up-front
construction costs in buildings are also relatively small in comparison to the operation and maintenance
costs over their lifetime, further encouraging the implementation of energy efficiency features prior to
construction. On the other hand, however, new construction represents only a small fraction of the
building stock. For example, as of 2010 the total building stock in the United States was approximately
275 billion square feet. In a typical year, the United States adds approximately 5 billion square feet of
new buildings, which is less than 2% of the market. Apparently a similar amount of the existing building
stock is renovated each year.[1] Therefore, there will continue to be a need for the development of new
and improved energy efficiency opportunities in both new building construction (to achieve zero net
energy and other high-performance targets) and existing buildings (to perform deep energy retrofits).
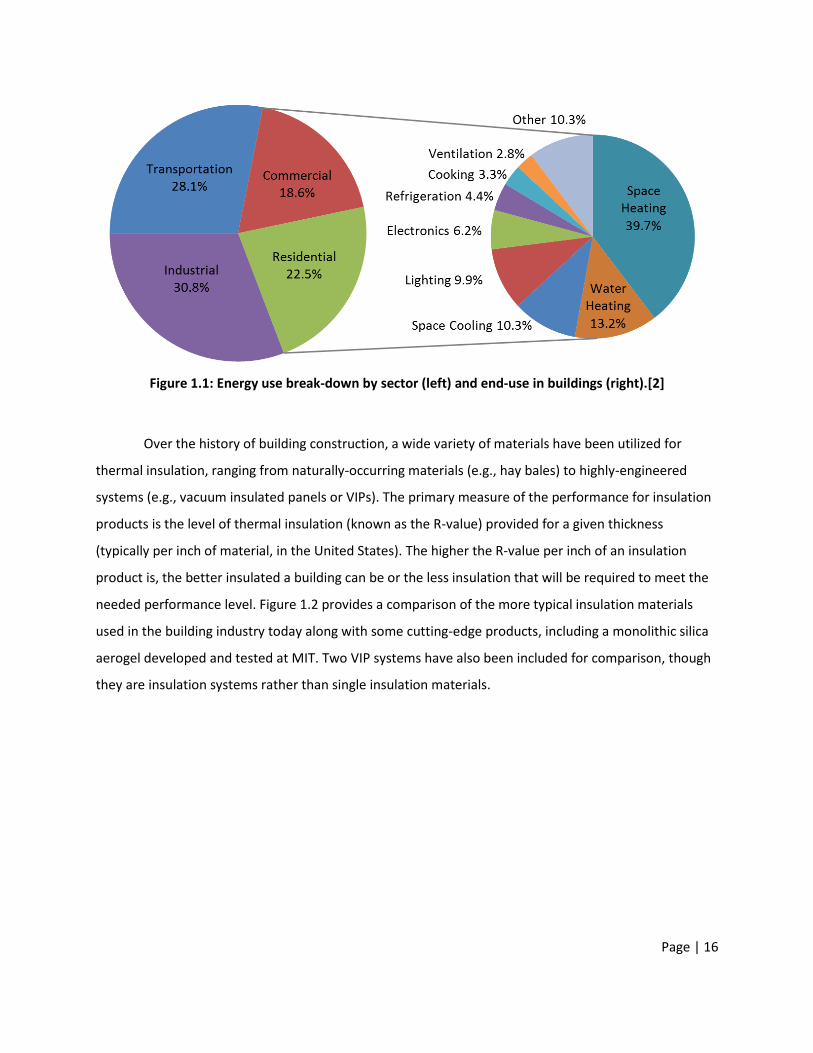
Energy use from building operation continues to be dominated by space heating and cooling
loads. According to the latest Department of Energy research, space conditioning represents about half
of building energy consumption in the United States (see Figure 1.1).[2] The two main ways to minimize
this source of energy consumption are to reduce the heating and cooling loads on the building and to
meet these loads with more efficient heating, ventilating and air-conditioning (HVAC) systems. The
former can be addressed with a higher-performance thermal envelope, including higher-performance
thermal insulation.
Page | 16
Figure 1.1: Energy use break-down by sector (left) and end-use in buildings (right).[2]
Over the history of building construction, a wide variety of materials have been utilized for
thermal insulation, ranging from naturally-occurring materials (e.g., hay bales) to highly-engineered
systems (e.g., vacuum insulated panels or VIPs). The primary measure of the performance for insulation
products is the level of thermal insulation (known as the R-value) provided for a given thickness
(typically per inch of material, in the United States). The higher the R-value per inch of an insulation
product is, the better insulated a building can be or the less insulation that will be required to meet the
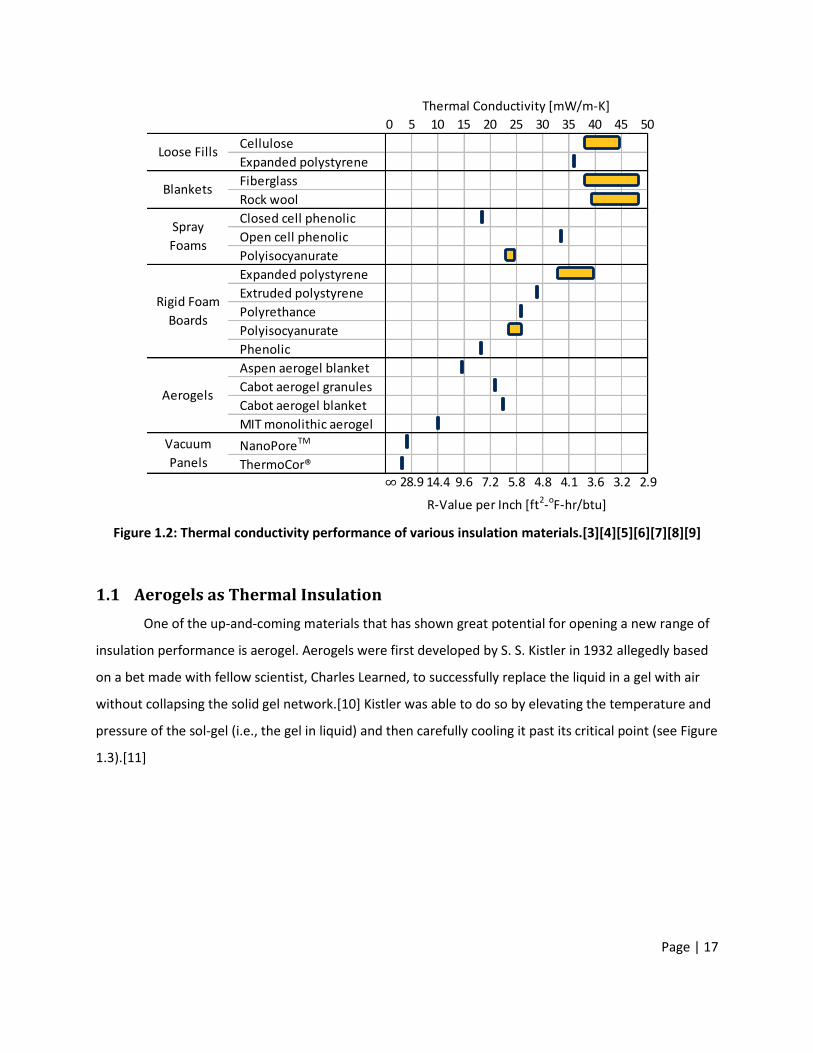
needed performance level. Figure 1.2 provides a comparison of the more typical insulation materials
used in the building industry today along with some cutting-edge products, including a monolithic silica
aerogel developed and tested at MIT. Two VIP systems have also been included for comparison, though
they are insulation systems rather than single insulation materials.
Page | 17
Figure 1.2: Thermal conductivity performance of various insulation materials.[3][4][5][6][7][8][9]
1.1 Aerogels as Thermal Insulation
One of the up-and-coming materials that has shown great potential for opening a new range of
insulation performance is aerogel. Aerogels were first developed by S. S. Kistler in 1932 allegedly based
on a bet made with fellow scientist, Charles Learned, to successfully replace the liquid in a gel with air
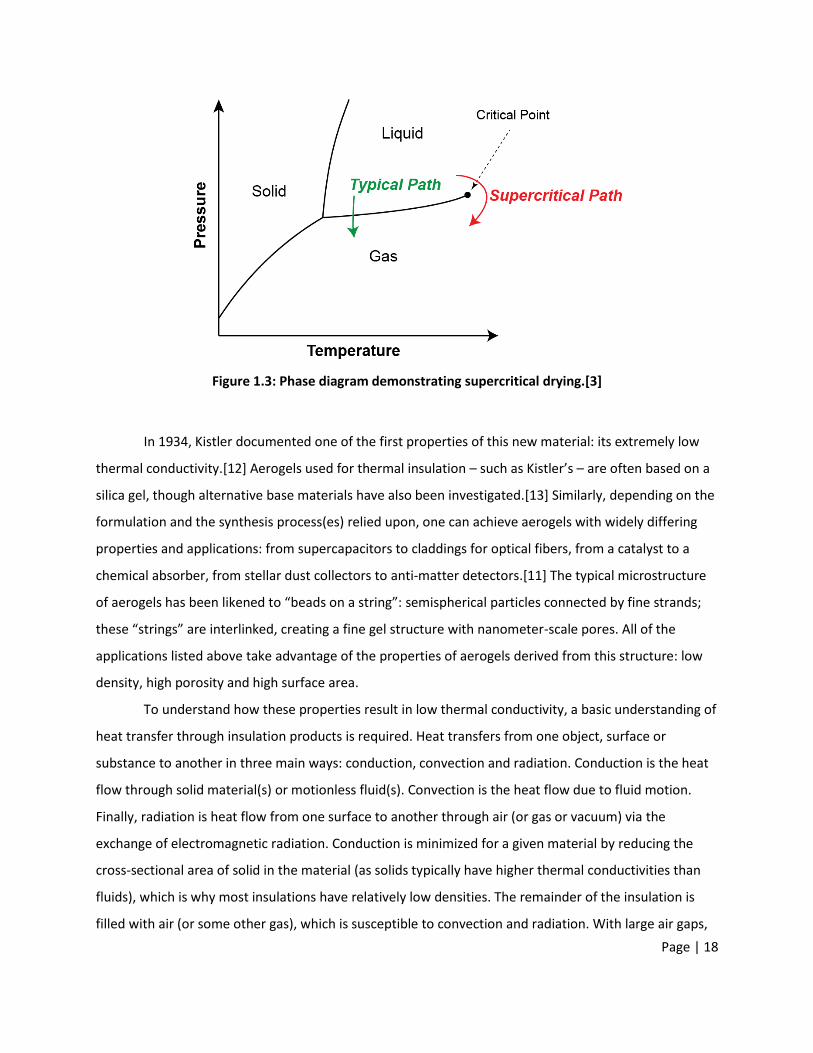
without collapsing the solid gel network.[10] Kistler was able to do so by elevating the temperature and
pressure of the sol-gel (i.e., the gel in liquid) and then carefully cooling it past its critical point (see Figure
1.3).[11]
Cellulose
Expanded polystyrene
Fiberglass
Rock wool
Closed cell phenolic
Open cell phenolic
Polyisocyanurate
Expanded polystyrene
Extruded polystyrene
Polyrethance
Polyisocyanurate
Phenolic
Aspen aerogel blanket
Cabot aerogel granules
Cabot aerogel blanket
MIT monolithic aerogel
NanoPoreTM
ThermoCor®
Thermal Conductivity [mW/m-K]
R-Value per Inch [ft2-oF-hr/btu]
Loose Fills
Blankets
Spray
Foams
Aerogels
Vacuum
Panels
Rigid Foam
Boards
0 5 10 15 20 25 30 35 40 45 50
∞ 28.9 14.4 9.6 7.2 5.8 4.8 4.1 3.6 3.2 2.9
Page | 18
Figure 1.3: Phase diagram demonstrating supercritical drying.[3]
In 1934, Kistler documented one of the first properties of this new material: its extremely low
thermal conductivity.[12] Aerogels used for thermal insulation – such as Kistler’s – are often based on a
silica gel, though alternative base materials have also been investigated.[13] Similarly, depending on the
formulation and the synthesis process(es) relied upon, one can achieve aerogels with widely differing
properties and applications: from supercapacitors to claddings for optical fibers, from a catalyst to a
chemical absorber, from stellar dust collectors to anti-matter detectors.[11] The typical microstructure
of aerogels has been likened to “beads on a string”: semispherical particles connected by fine strands;
these “strings” are interlinked, creating a fine gel structure with nanometer-scale pores. All of the
applications listed above take advantage of the properties of aerogels derived from this structure: low
density, high porosity and high surface area.
To understand how these properties result in low thermal conductivity, a basic understanding of
heat transfer through insulation products is required. Heat transfers from one object, surface or
substance to another in three main ways: conduction, convection and radiation. Conduction is the heat
flow through solid material(s) or motionless fluid(s). Convection is the heat flow due to fluid motion.
Finally, radiation is heat flow from one surface to another through air (or gas or vacuum) via the
exchange of electromagnetic radiation. Conduction is minimized for a given material by reducing the
cross-sectional area of solid in the material (as solids typically have higher thermal conductivities than
fluids), which is why most insulations have relatively low densities. The remainder of the insulation is
filled with air (or some other gas), which is susceptible to convection and radiation. With large air gaps,
Page | 19
these two mechanisms can provide much higher heat transfer than solid conduction. Large voids allow
radiation to quickly bypass significant lengths of the solid material and also allow for the formation of
convection currents. Therefore to minimize these heat transfer modes, the air (or gas) should be
contained in small pockets or voids throughout the material; this is why most insulation materials are
designed to have micro-porous structures. Additionally, conduction through the gas will be limited by
the voids if the void size is on the order of the mean free path of the gas or smaller. Insulation materials
can also decrease the heat transfer through the air within the pores by replacing it with a lower
conductivity gas (such as argon), by decreasing the air pressure inside the insulation (such as with
vacuum insulated panels) or by decreasing the emissivity of the solid material (to slow the rate of
radiative heat flow).[14]
Aerogels take these same conductivity-reducing principles that are used in everyday insulation
products, but push them to a new level: an aerogel’s extremely low density minimizes conduction
through its solid gel network and its nano-sized pores prevent the development of convection cells,
reduce the rate of radiation transfer through the network and limit the conduction by the gas molecules
within the pores. This research also investigated the thermal performance of aerogels in a vacuum.
1.2 Aerogel Synthesis
There are two main challenges that are faced by aerogels for use as thermal insulation. The first
is to reduce the energy/material/time/cost intensity of the manufacturing process. The second
challenge is to obtain a material with low thermal conductivity and sufficient mechanical strength. Both
of those properties are highly dependent on the structure of the aerogel and therefore are
interdependent with the first challenge. Unfortunately, improvements of one property typically come at
the detriment of the other: in general, the mechanical strength of the aerogel is improved with a
thicker, more robust solid silica network while lower thermal conductivity requires a finer, thinner,
lower volume percent network with smaller pores. In other words, while lowering the density of the
aerogel typically decreases its thermal conductivity, it also will tend to lead to decreased mechanical
integrity.
These aerogel properties are affected by the manufacturing process, which can be broken down
into two main stages: synthesis and aging of the sol-gel and drying of the sol-gel into an aerogel. The sol-
gel synthesis and aging processes are where the structure of the solid gel network is determined; the
drying process mostly impacts the quality of the final aerogel product. The synthesis procedure is often

Page | 20
a multi-step process where various chemical compounds are mixed in order to obtain the solid gel
network in a liquid bath. For example, a typical recipe for silica aerogels uses either tetraethyl
orthosilicate (TEOS) or tetramethyl orthosilicate (TMOS) as the precursor for the gel. This is then mixed
with specific reagents and catalysts to cause the three synthesis reactions – hydrolysis (preparation of
silica hydroxides from the precursor), condensation (combining silica hydroxides into silica oxide chains)
and gelation (cross-linking of the silica oxide chains into a solid network) – in order to produce the silica
gel in a solution of ethanol or methanol. See Table 6.1 in the Appendix for a list of chemicals used for the
synthesis of the MIT aerogel used in this research. This is followed by an aging step to finalize the cross-
linking and flush out as much of the remaining synthesis products as possible from within the gel.
Additional surface treatments can also be applied at this point, such as to provide hydrophobicity (silica
aerogels are naturally hydrophilic and water absorption can increase the material’s thermal
conductivity).
In the final stage of synthesis, the liquid solution is carefully dried in order to preserve the
structure of the solid gel. Typically this is done in a process called supercritical drying. The sol-gel is
placed in an autoclave and the pressure and temperature inside the chamber are gradually increased.
Due to the potential danger of having a flammable organic solvent at these conditions, there is an
optional solvent exchange step in which the original solvent is flushed out with carbon dioxide. In
addition to being non-flammable, CO2 also boasts a critical point with a much lower temperature than
the typical organic solvents: 31oC at 7.4 MPa compared to 241oC at 6.3 MPa for ethanol. Once the
solvent has achieved its supercritical state (in which the liquid and gaseous phases are
indistinguishable), the chamber is carefully brought back to room conditions while avoiding the critical
point (see the graphical representation in Figure 1.3) in order to safely bring the solvent into its gaseous
state. The chamber is then opened and the aerogel is removed. If the solvent in the sol-gel was instead
allowed to evaporate normally, the liquid-to-gas phase change occurring inside the pores of the gel
would rupture its structure. Research has been done to find subcritical drying methods that produce
useable aerogels, but those will not be discussed here since the MIT aerogel formulation uses the
supercritical drying method.[11][15]
1.3 Aerogel Insulation Products
Thermal insulation products based on aerogel are already commercially available. The two
largest manufacturers – Aspen Aerogels and Cabot Corporation – produce a number of different forms
Page | 21
of aerogel insulation, including aerogel granules, aerogel-impregnated blankets, aerogel-filled windows,
coatings and paints and hybrid spray-foam systems.[5][6] While the largest markets for these aerogel
insulation products continues to be industrial applications (such as subsea pipelines and cryogenic
containers), there has been some limited penetration into the buildings market. In particular, the
building retrofit market can be an attractive application since most methods of insulation retrofits using
traditional insulation products are very invasive, time-consuming and/or space-intensive; aerogel
blankets, on the other hand, can be quickly installed and provide decent insulation value without taking
up significant interior volume (due to their high R-value per inch). In most cases, however, aerogel
products are not a cost-competitive alternative to traditional insulation materials.
1.4 Previous Research at MIT
As part of the DuPont MIT Alliance (DMA), research began in 2009 to develop a higher-
performance, cost-effective insulation product based on aerogels. This research has been conducted in
parallel and in coordination with a team at DuPont led by Dr. Vivek Kapur. The MIT team has focused on
silica aerogels while DuPont has been investigating alternative base materials, including organics.
The first research goal for the MIT team was to develop a new silica aerogel formulation and
synthesis process. This task was initially led by graduate student Yanjia Zuo and, upon graduation, taken
over by Yi He. Their efforts produced a 3-step sol-gel synthesis process based on a TEOS/ethanol
formulation followed by supercritical drying with a CO2 solvent exchange. This silica aerogel
demonstrated reduced shrinking, improved mechanical properties and very low monolithic thermal
conductivity (down to 9 mW/m-K at ambient conditions).[16] Yi He also identified means to reduce the
duration of both the sol-gel synthesis and the CO2 solvent exchange processes, which typically can be
very time-consuming as they are diffusion-limited processes.
The second research goal for the MIT team was to develop a design for a panel system that
would eventually hold the aerogels being produced. The panel would need to provide structural
integrity in order for the system to withstand the expected wear-and-tear experienced in the field.
However, since the panel material would have a higher thermal conductivity than the aerogel, this first
goal would have to be achieved while minimizing the panel material’s impact on the thermal
conductivity of the insulation panel as a whole. Thomas Goutierre developed an internal pyramidal truss
design made from thin polystyrene sheets that should theoretically only contribute an additional 2
mW/m-K to the conductivity of the panel core (see Figure 1.4).[17]
Page | 22
Figure 1.4: Truss system design by Thomas Goutierre, made by Kevin Chen. A constructed truss (top)
and a truss installed between two panel faces (bottom).[17][18]
In parallel with these panel design efforts, Ellann Cohen developed a methodology to reliably
test the thermal conductivity of the aerogel samples. Since the samples being produced were relatively
small (about the size of a piece of chalk), the more traditional steady-state test methods would not
work. After researching the available test methods, Cohen eventually selected the transient hot-wire
method. However, due to the relatively short length of the hot-wire used for testing of the MIT samples,
she also had to develop an end-effects correction for the experimental results. Additionally, Cohen
found that this test method likely underestimates the thermal conductivity for the aerogel samples by
up to 3.3 mW/m-K when compared to conditions that would be experienced in the field; this was due to
the material’s infrared transmissivity at the time and length scales relevant to this transient
methodology.[3]
Page | 23
1.5 Summary of Thesis Research
The research covered in this thesis focused exclusively on the testing of granular silica aerogels.
In addition to granules made from the MIT aerogel formulation, a commercial aerogel granule product
from Cabot was also utilized for testing. See Table 6.2 in the Appendix for a comparison of the different
aerogels used in this research. The work was split into two main areas: thermal conductivity testing and
panel design analysis.
Chapter 2 of the thesis covers the thermal conductivity research. The hot-wire test set-up
developed by Ellann Cohen and previous MIT students was again utilized, though new test chambers
were made for the testing of granular materials at ambient conditions and under vacuum. A guarded
hot-plate LaserComp system was also used for testing of aerogel-filled panels; this system allowed for
tested of analytical results from previous research and also provided a comparison for the hot-wire
results. Finally, this chapter covers some concurrent research done by Kevin Chen into the
characterization of the aerogel beds under compression.
Chapter 3 reviews the research done regarding the panel design. There has been interest in
developing an aerogel-filled vacuum panel, which would require the incorporation of a barrier film.
Analyses were performed on the potential thermal bridging effects of such a film and the necessary
diffusion barrier characteristics required of the film. Physical prototyping was also done to evaluate one
method to incorporate the barrier film into the current panel design with the internal truss.
Chapter 4 draws some conclusions from the research and highlights some future research
opportunities.
Page | 24
2 THERMAL CONDUCTIVITY TESTING
The most critical parameter of any material or panel system that comes out of the MIT aerogel
research is its thermal conductivity. There are a number of other important parameters that also need
to be considered (e.g., mechanical properties, sound and light transmission, material intensity, flame
spread rating, manufacturing time, production cost, embodied energy, etc.), but those are secondary
compared to conductivity. Therefore, thermal conductivity testing is a central portion of this research
work.
Two separate techniques have been employed for thermal conductivity testing: a transient hot-
wire method and a guarded hot-plate method. Each technique had its own benefits and short-comings;
they also provided a level of corroboration for each other. The hot-wire method allows for the testing of
small monolithic or granular samples, and a series of hot-wire tests can be completed in a matter of
minutes; however, this transient method is less representative of the type of thermal conditions that an
insulation material would typically experience once installed. The hot-plate method is a more
traditional, steady-state test that is commonly used for evaluating insulation products; however, this
test requires larger, rigid samples and a single test takes hours to run.
This chapter will describe each of these tests in more detail and then review and discuss their
results. There will also be a review of some relevant physical characterization testing performed by
Kevin Chen.[18]
2.1 Transient Hot-Wire Testing – Background
As mentioned in Chapter 1.4, Ellann Cohen had previously selected the transient hot-wire as the
preferred test method for the aerogel samples produced at MIT. In this test, a very fine platinum wire
(25.4 μm in diameter, in the MIT set-up) is surrounded by an insulation material (the aerogel) and a
steady electrical current (about 65 amps, for these tests) is run through the wire for a short duration
(about 1 second, for these tests). This applied current creates resistance heating in the platinum wire
based on Ohm’s Law (see Equation 2.1). This heat generated in the wire will cause the temperature of
the wire to increase. This produces a temperature difference between the wire and its surroundings,
and the heat will begin dissipating through the surrounding material. The lower the conductivity of the
surrounding material, the slower the heat will dissipate from the wire and the greater the temperature
of the wire will increase over time. Therefore, by measuring the temperature increase of the wire, one
can calculate the conductivity of the surrounding material (see Equation 2.2) using data from the linear
Page | 25
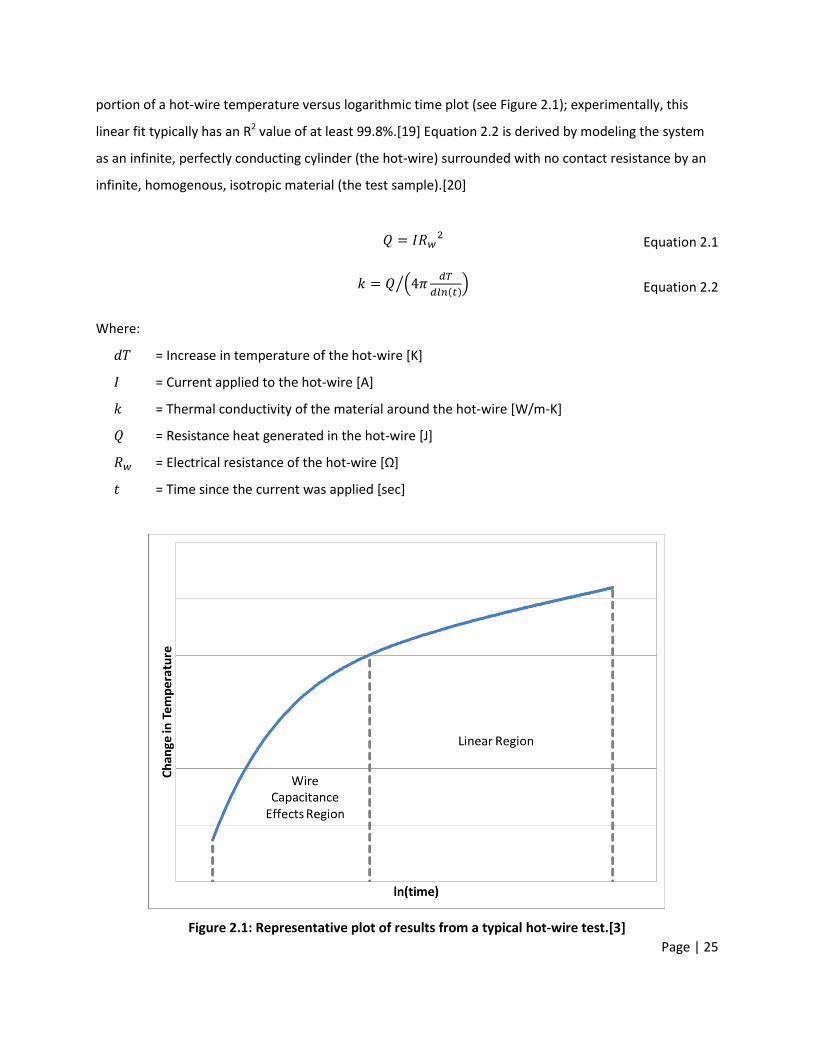
portion of a hot-wire temperature versus logarithmic time plot (see Figure 2.1); experimentally, this
linear fit typically has an R2 value of at least 99.8%.[19] Equation 2.2 is derived by modeling the system
as an infinite, perfectly conducting cylinder (the hot-wire) surrounded with no contact resistance by an
infinite, homogenous, isotropic material (the test sample).[20]
Equation 2.1
(
( ))⁄ Equation 2.2
Where:
= Increase in temperature of the hot-wire [K]
= Current applied to the hot-wire [A]
= Thermal conductivity of the material around the hot-wire [W/m-K]
= Resistance heat generated in the hot-wire [J]
= Electrical resistance of the hot-wire [Ω]
= Time since the current was applied [sec]
Figure 2.1: Representative plot of results from a typical hot-wire test.[3]
Page | 26
One issue Cohen found with this technique was that the calculated conductivity from the
experimental data was dependent on the length of the wire. This effect was due to the fact that the
platinum wire was being soldered to a much larger copper lead, which was acting as a heat sink. This
created a gradient in the temperature along the hot-wire, when the calculations assumed it was
homogenous in temperature and effectively infinite in length; therefore, the experimentally-measured
temperature increase of the hot-wire is more of an average temperature increase across the length of
the wire. Cohen was able to develop an analytical method to correct for this end-effect (see Equation
2.3 and Equation 2.4), which was verified with a standard reference material from the National Institute
of Standards and Technologies (NIST); end-effect corrected test results for the NIST sample were within
5% of its listed conductivity value. These equations are used to calculate corrected temperatures for the
mid-point along the length of the hot-wire (where the end-effects should be minimal) using the
experimental results and design parameters. These corrected temperatures are then used to calculate
the corrected thermal conductivity. For this technique, the experimental values are calculated using
reference times of 0.5 sec and 1.0 sec and then the resulting corrected thermal conductivities based on
these two reference times are averaged together to get a final thermal conductivity value.[3] This end-
effect correction methodology is applied to all hot-wire test results.
(
( ))
Equation 2.3
[ (
)]
Equation 2.4
Where:
= Specific heat capacity of the insulation material [J/kg-K]
= Corrected value of the increase in temperature of the mid-point of the hot-wire [K]
= Experimental value of the average increase in temperature along the hot-wire [K]
= Diameter of the hot-wire [m]
= Euler’s number = 0.577215665 [unitless]
= Experimental value for thermal conductivity of the insulation material [W/m-K]
= Length of the hot-wire [m]
= Reference time [sec]
= Density of the insulation material [kg/m3]
Page | 27
= Correction factor [unitless]
Due to the transient nature of the test compared to the typical steady-state hot-plate method,
Cohen discovered that this method would underestimate the contribution of radiation to the overall
heat transfer within the aerogel. Based on laboratory tests into the transmissivity of aerogel, it was
analytically estimated that the hot-wire tests could be underestimating the thermal conductivity of the
aerogel samples compared to steady-state conditions by up to 3.3 mW/m-K.[3] Results looking into this
issue will be discussed in Chapter 2.5.
2.2 Transient Hot-Wire Testing – Methods and Materials
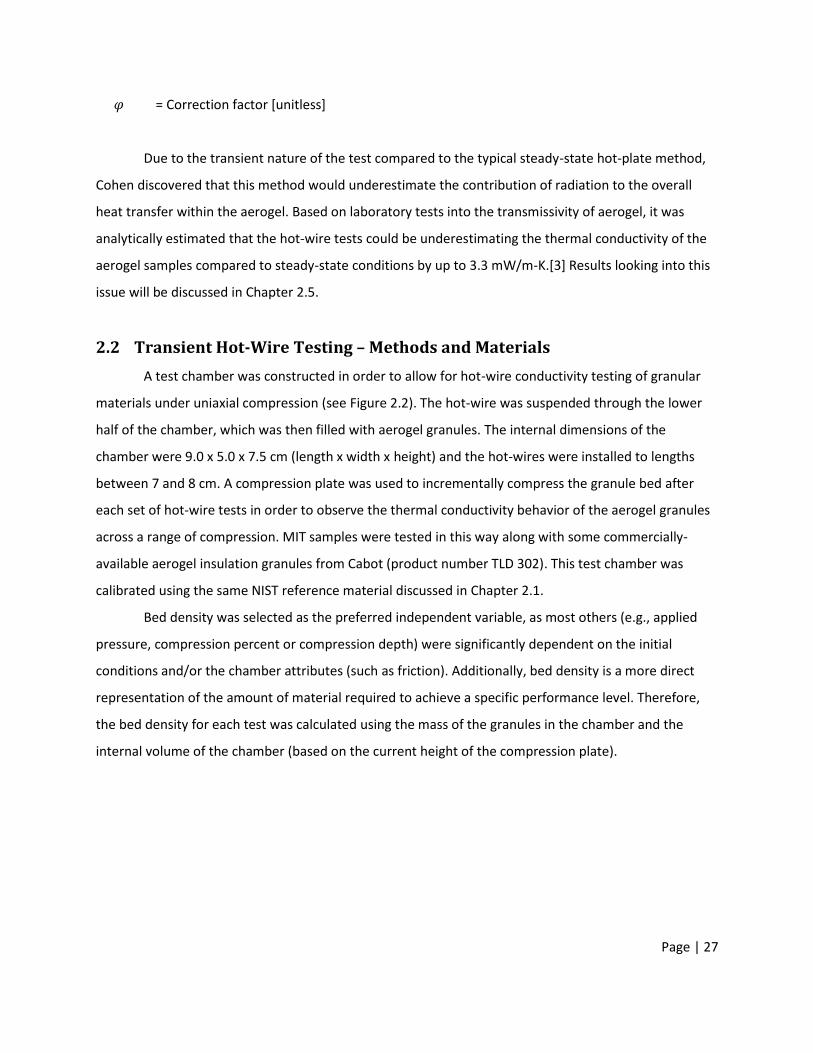
A test chamber was constructed in order to allow for hot-wire conductivity testing of granular
materials under uniaxial compression (see Figure 2.2). The hot-wire was suspended through the lower
half of the chamber, which was then filled with aerogel granules. The internal dimensions of the
chamber were 9.0 x 5.0 x 7.5 cm (length x width x height) and the hot-wires were installed to lengths
between 7 and 8 cm. A compression plate was used to incrementally compress the granule bed after
each set of hot-wire tests in order to observe the thermal conductivity behavior of the aerogel granules
across a range of compression. MIT samples were tested in this way along with some commercially-
available aerogel insulation granules from Cabot (product number TLD 302). This test chamber was
calibrated using the same NIST reference material discussed in Chapter 2.1.
Bed density was selected as the preferred independent variable, as most others (e.g., applied
pressure, compression percent or compression depth) were significantly dependent on the initial
conditions and/or the chamber attributes (such as friction). Additionally, bed density is a more direct
representation of the amount of material required to achieve a specific performance level. Therefore,
the bed density for each test was calculated using the mass of the granules in the chamber and the
internal volume of the chamber (based on the current height of the compression plate).
Page | 28
Figure 2.2: Diagram of the test chamber for the hot-wire testing of aerogel granules.
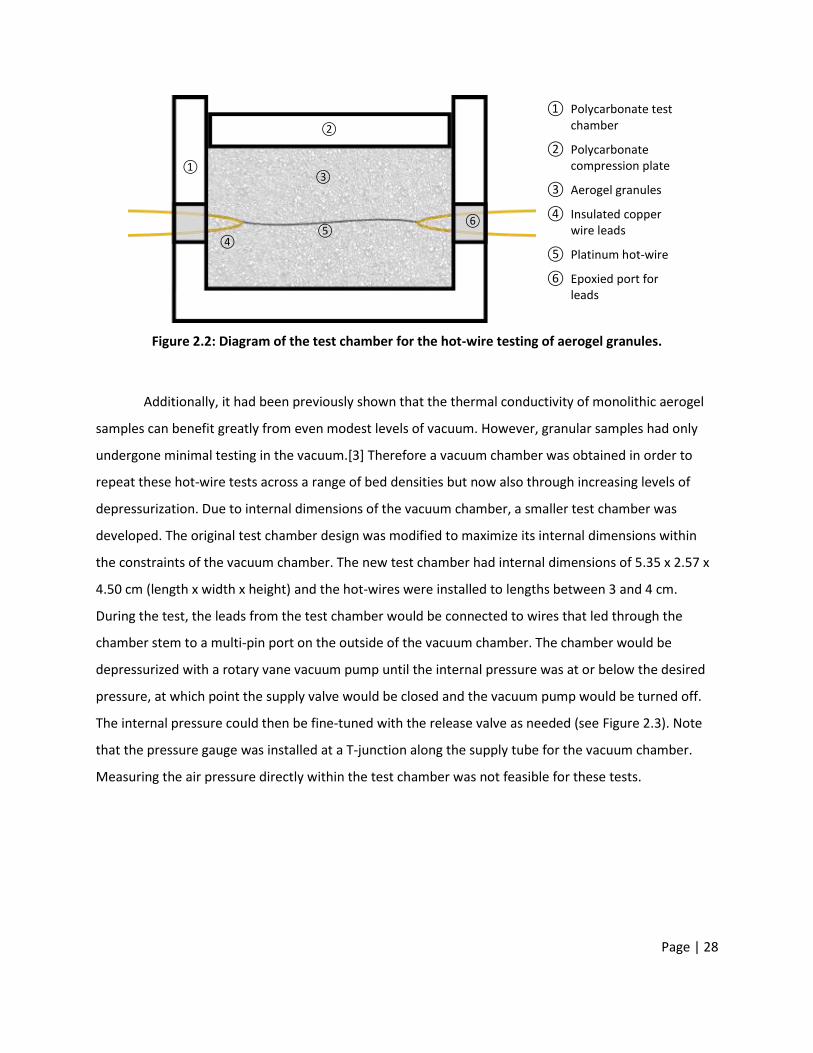
Additionally, it had been previously shown that the thermal conductivity of monolithic aerogel
samples can benefit greatly from even modest levels of vacuum. However, granular samples had only
undergone minimal testing in the vacuum.[3] Therefore a vacuum chamber was obtained in order to
repeat these hot-wire tests across a range of bed densities but now also through increasing levels of
depressurization. Due to internal dimensions of the vacuum chamber, a smaller test chamber was
developed. The original test chamber design was modified to maximize its internal dimensions within
the constraints of the vacuum chamber. The new test chamber had internal dimensions of 5.35 x 2.57 x
4.50 cm (length x width x height) and the hot-wires were installed to lengths between 3 and 4 cm.
During the test, the leads from the test chamber would be connected to wires that led through the
chamber stem to a multi-pin port on the outside of the vacuum chamber. The chamber would be
depressurized with a rotary vane vacuum pump until the internal pressure was at or below the desired
pressure, at which point the supply valve would be closed and the vacuum pump would be turned off.
The internal pressure could then be fine-tuned with the release valve as needed (see Figure 2.3). Note
that the pressure gauge was installed at a T-junction along the supply tube for the vacuum chamber.
Measuring the air pressure directly within the test chamber was not feasible for these tests.
① Polycarbonate test chamber
② Polycarbonate compression plate
③ Aerogel granules
④ Insulated copper wire leads
⑤ Platinum hot-wire
⑥ Epoxied port for leads
①
②
③
④ ⑤
⑥
Page | 29
Figure 2.3: Diagram of the vacuum chamber set-up for the hot-wire testing of aerogel granules.
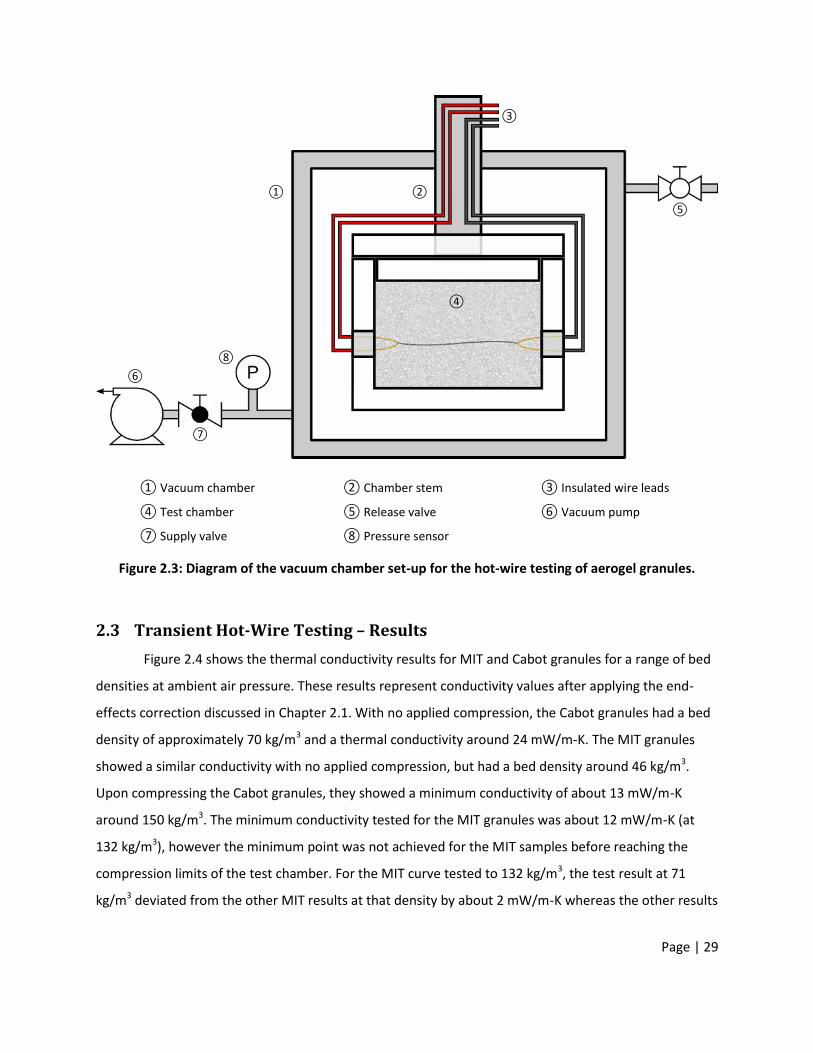
2.3 Transient Hot-Wire Testing – Results
Figure 2.4 shows the thermal conductivity results for MIT and Cabot granules for a range of bed
densities at ambient air pressure. These results represent conductivity values after applying the end-
effects correction discussed in Chapter 2.1. With no applied compression, the Cabot granules had a bed
density of approximately 70 kg/m3 and a thermal conductivity around 24 mW/m-K. The MIT granules
showed a similar conductivity with no applied compression, but had a bed density around 46 kg/m3.
Upon compressing the Cabot granules, they showed a minimum conductivity of about 13 mW/m-K
around 150 kg/m3. The minimum conductivity tested for the MIT granules was about 12 mW/m-K (at
132 kg/m3), however the minimum point was not achieved for the MIT samples before reaching the
compression limits of the test chamber. For the MIT curve tested to 132 kg/m3, the test result at 71
kg/m3 deviated from the other MIT results at that density by about 2 mW/m-K whereas the other results
① Vacuum chamber ② Chamber stem ③ Insulated wire leads
④ Test chamber ⑤ Release valve ⑥ Vacuum pump
⑦ Supply valve ⑧ Pressure sensor
④
② ①
⑤
⑧
⑦
⑥
③
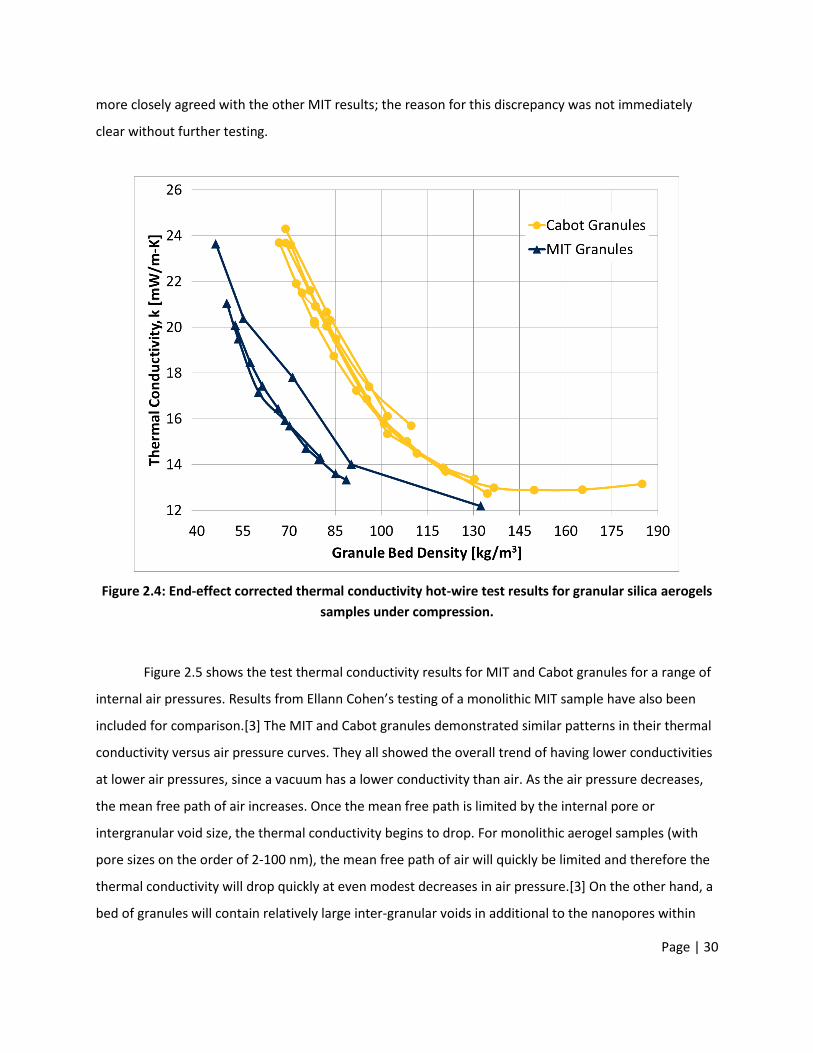
Page | 30
more closely agreed with the other MIT results; the reason for this discrepancy was not immediately
clear without further testing.
Figure 2.4: End-effect corrected thermal conductivity hot-wire test results for granular silica aerogels
samples under compression.
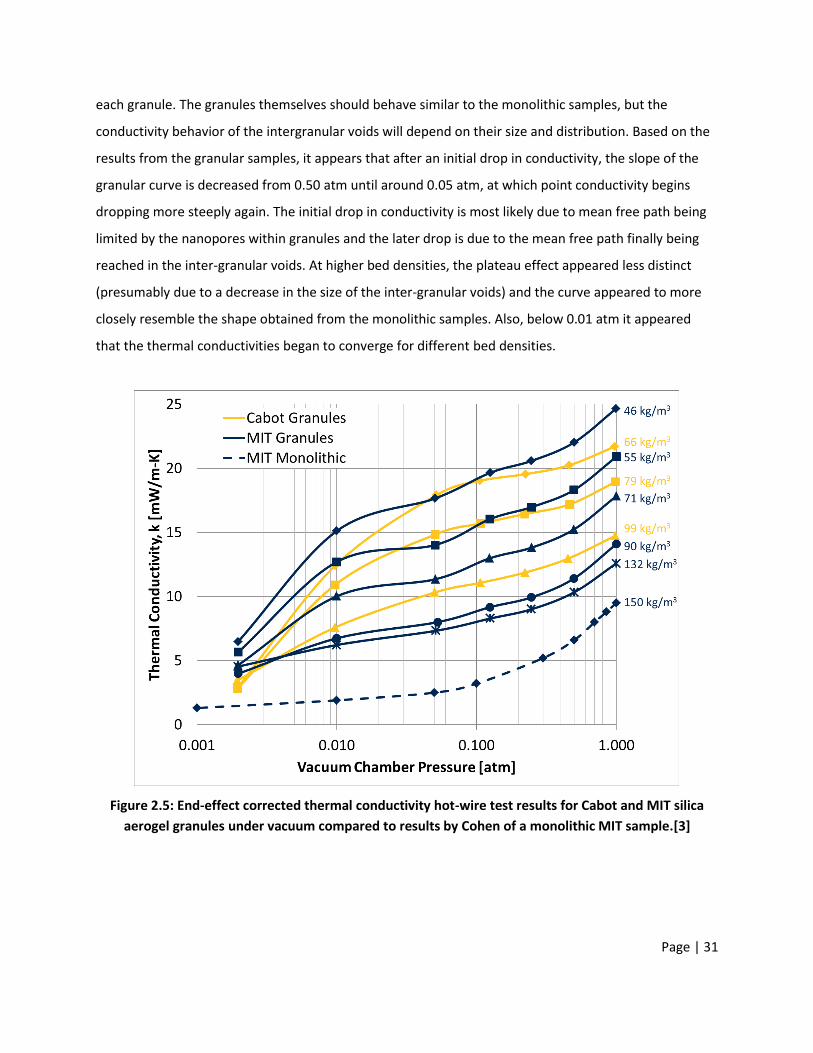
Figure 2.5 shows the test thermal conductivity results for MIT and Cabot granules for a range of
internal air pressures. Results from Ellann Cohen’s testing of a monolithic MIT sample have also been
included for comparison.[3] The MIT and Cabot granules demonstrated similar patterns in their thermal
conductivity versus air pressure curves. They all showed the overall trend of having lower conductivities
at lower air pressures, since a vacuum has a lower conductivity than air. As the air pressure decreases,
the mean free path of air increases. Once the mean free path is limited by the internal pore or
intergranular void size, the thermal conductivity begins to drop. For monolithic aerogel samples (with
pore sizes on the order of 2-100 nm), the mean free path of air will quickly be limited and therefore the
thermal conductivity will drop quickly at even modest decreases in air pressure.[3] On the other hand, a
bed of granules will contain relatively large inter-granular voids in additional to the nanopores within
Page | 31
each granule. The granules themselves should behave similar to the monolithic samples, but the
conductivity behavior of the intergranular voids will depend on their size and distribution. Based on the
results from the granular samples, it appears that after an initial drop in conductivity, the slope of the
granular curve is decreased from 0.50 atm until around 0.05 atm, at which point conductivity begins
dropping more steeply again. The initial drop in conductivity is most likely due to mean free path being
limited by the nanopores within granules and the later drop is due to the mean free path finally being
reached in the inter-granular voids. At higher bed densities, the plateau effect appeared less distinct
(presumably due to a decrease in the size of the inter-granular voids) and the curve appeared to more
closely resemble the shape obtained from the monolithic samples. Also, below 0.01 atm it appeared
that the thermal conductivities began to converge for different bed densities.
Figure 2.5: End-effect corrected thermal conductivity hot-wire test results for Cabot and MIT silica
aerogel granules under vacuum compared to results by Cohen of a monolithic MIT sample.[3]
Page | 32
2.4 Guarded Hot-Plate Testing – Methods and Materials
As mentioned in Chapter 1.4, Thomas Goutierre previously developed a panel and truss design
(see Figure 1.4) that provides the necessary mechanical integrity for an aerogel-filled panel while
minimizing its contribution to the thermal conductivity of the system. Kevin Chen constructed a number
of 24.7 x 24.7 x 1.9 cm (external length x width x height) panels for testing following Goutierre’s design;
the face and edge pieces for the panel were all made from 2 mm rigid polystyrene sheets. The thermal
conductivity of these panels was then tested by the guarded hot-plate method using a LaserComp
FOX304 system (with a listed accuracy of ±1%); as a precaution, a piece of foam board insulation was
put around each panel to fill in the remainder of the 30.5 x 30.5 cm test chamber.[21] In this set-up, the
thermal conductivity is evaluated by placing the sample between two parallel plates that are held at
constant temperatures with a selected temperature split between them. Once the system has reached a
thermal steady-state, the conductivity of the sample can be calculated using Fourier’s Law (see Equation
2.5 and Equation 2.6). The flux flowing through the system from the hot-side plate to the cold-side plate
is determined based on the energy required to hold the plates at constant temperature.
( )
Equation 2.5
( ) Equation 2.6
Where:
= Cross-sectional area of the sample [m2]
= Thermal conductivity of the sample [W/m-K]
= Steady-state energy flux through the sample [W]
= Steady-state temperature split across the sample [K]
= Steady-state temperature of the cold-side plate [K]
= Steady-state temperature of the hot-side plate [K]
= Thickness of the sample [m]
As shown above, this method provides the thermal conductivity of the sample as if it was one
homogeneous material. Therefore, further calculations are required in order to determine the thermal
conductivity of the core of the panel based on the experimental conductivity and design of the panel
Page | 33
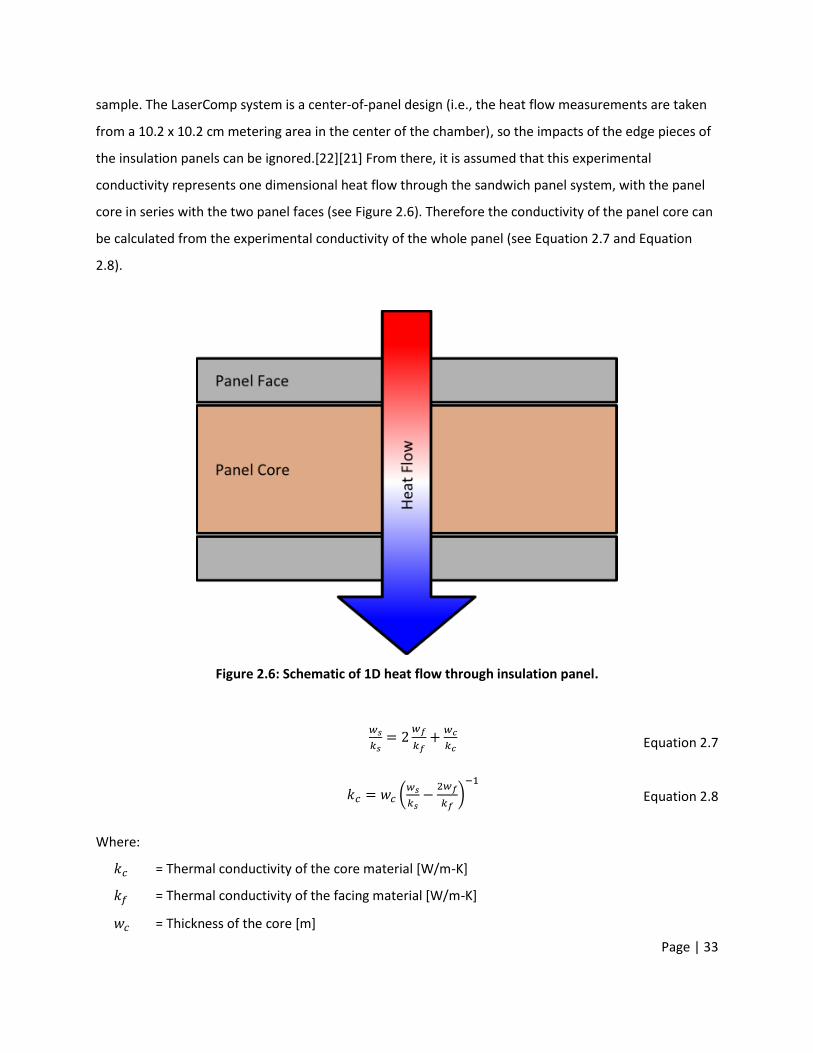
sample. The LaserComp system is a center-of-panel design (i.e., the heat flow measurements are taken
from a 10.2 x 10.2 cm metering area in the center of the chamber), so the impacts of the edge pieces of
the insulation panels can be ignored.[22][21] From there, it is assumed that this experimental
conductivity represents one dimensional heat flow through the sandwich panel system, with the panel
core in series with the two panel faces (see Figure 2.6). Therefore the conductivity of the panel core can
be calculated from the experimental conductivity of the whole panel (see Equation 2.7 and Equation
2.8).
Figure 2.6: Schematic of 1D heat flow through insulation panel.
Equation 2.7
(
)
Equation 2.8
Where:
= Thermal conductivity of the core material [W/m-K]
= Thermal conductivity of the facing material [W/m-K]
= Thickness of the core [m]
Page | 34
= Thickness of a single panel facing [m]
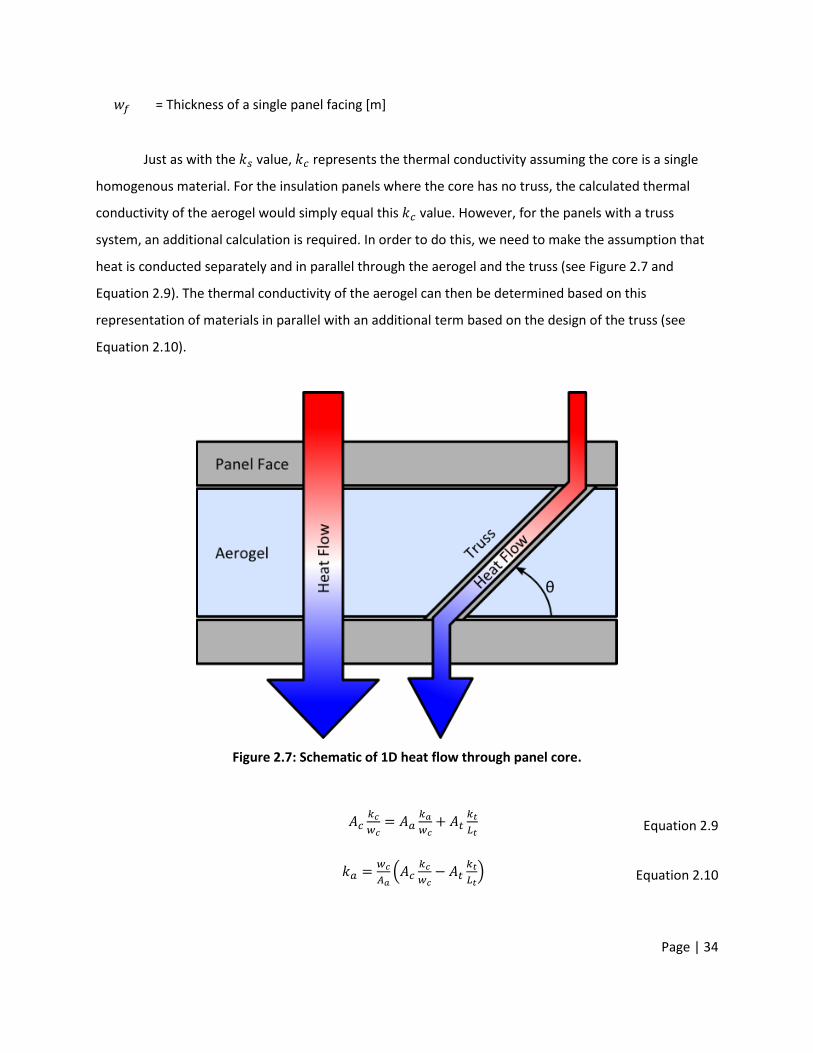
Just as with the value, represents the thermal conductivity assuming the core is a single
homogenous material. For the insulation panels where the core has no truss, the calculated thermal
conductivity of the aerogel would simply equal this value. However, for the panels with a truss
system, an additional calculation is required. In order to do this, we need to make the assumption that
heat is conducted separately and in parallel through the aerogel and the truss (see Figure 2.7 and
Equation 2.9). The thermal conductivity of the aerogel can then be determined based on this
representation of materials in parallel with an additional term based on the design of the truss (see
Equation 2.10).
Figure 2.7: Schematic of 1D heat flow through panel core.
Equation 2.9
(
) Equation 2.10
Page | 35
Where:
= Cross-sectional area of the aerogel, normal to heat flow through the aerogel [m2]
= Cross-sectional area of the core, normal to heat flow through the aerogel [m2]
= Cross-sectional area of the truss, normal to heat flow through the truss [m2]
= Thermal conductivity of the aerogel [W/m-K]
= Thermal conductivity of the truss material [W/m-K]
= Length of a truss segment, parallel to heat flow through the truss [m]
Furthermore, Equation 2.8 and Equation 2.10 can be combined (see Equation 2.11), updated
with a number of substitutions (see Equation 2.12) and further simplified to form a single calculation for
the aerogel conductivity based on the experimental results and the panel design (see Equation 2.13).
Additionally, it can be worthwhile to also determine the impact that the truss system has to the thermal
conductivity of the whole panel (see Equation 2.14); as mentioned in Chapter 1.4, the truss was
designed so this value would be no more than 2 mW/m-K.
[ (
)
] Equation 2.11
( )
(
)
Equation 2.12
(
)
(
)
Equation 2.13
(
) Equation 2.14
Where:
= Cross-sectional area of the truss, parallel to [m2]
= Contribution to thermal conductivity of the panel by the truss [W/m-K]
= Volume fraction of aerogel in the core [unitless]
= Volume fraction of truss in the core [unitless]
= Angle between the panel facing and the truss [degrees]
Assuming:
≡
Page | 36
=
≡
=
≡
≡
= ( )
All of these calculations are dependent upon the conductivity of the facing and truss materials
(both polystyrene sheets), but the material data sheets provided by the manufacturer of the polystyrene
sheets did not include values for thermal conductivity.[23] Literature research provided conductivity
values for solid polystyrene of 126 and 150 mW/m-K.[24][25] This uncertainty in polystyrene
conductivity could result in significant uncertainty in the calculated aerogel conductivity. Therefore,
additional hot-plate tests were required to determine the polystyrene conductivity. The sheets were too
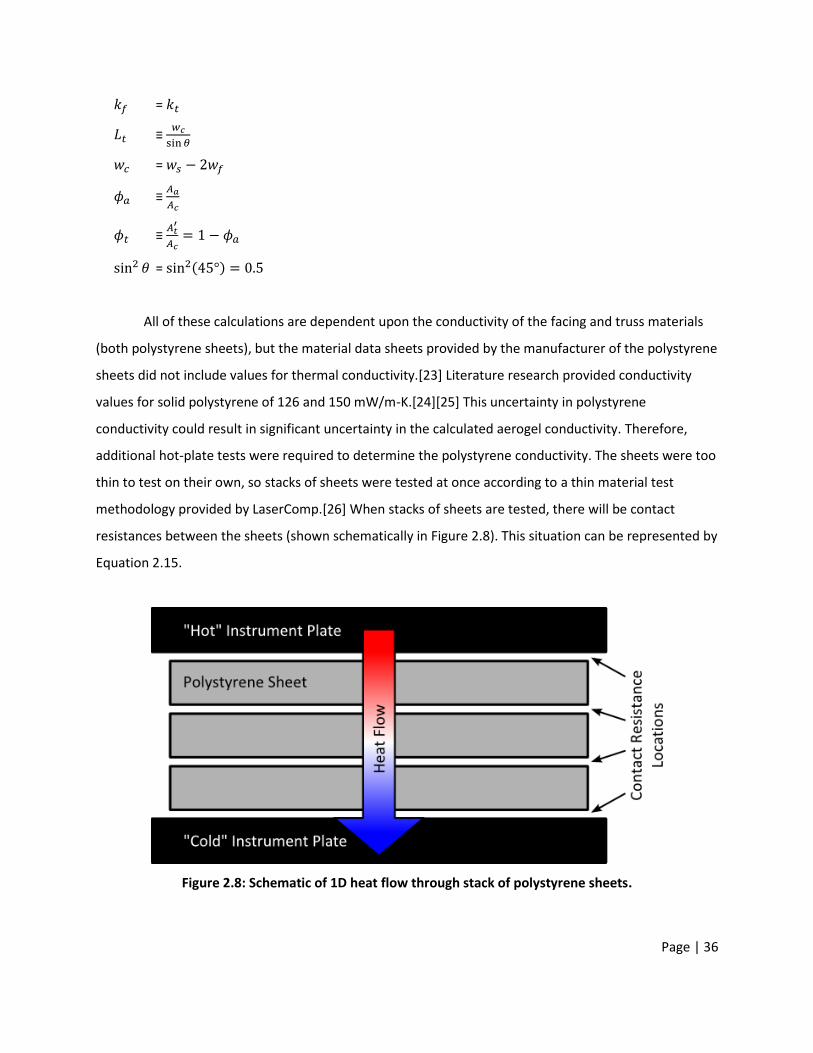
thin to test on their own, so stacks of sheets were tested at once according to a thin material test
methodology provided by LaserComp.[26] When stacks of sheets are tested, there will be contact
resistances between the sheets (shown schematically in Figure 2.8). This situation can be represented by
Equation 2.15.
Figure 2.8: Schematic of 1D heat flow through stack of polystyrene sheets.
Page | 37
( ) Equation 2.15
Where:
= Thermal conductivity of the test stack of sheets [W/m-K]
= Thermal conductivity of a polystyrene sheet [W/m-K]
= Number of sheets in the test stack [unitless]
= Resistance of the test stack of sheets [m2-K/W]
= Contact resistance between a polystyrene sheet and an instrument plate [m2-K/W]
= Contact resistance between two polystyrene sheets [m2-K/W]
= Total thickness of the test stack of sheets [m]
= Thickness of a single polystyrene sheet [m]
These contact resistances cannot readily be directly quantified, so according to the LaserComp
protocol multiple tests need to be completed using different numbers of sheets. These experimental
results could then be plotted as the tested stack resistances versus the number of sheets. Assuming the
contact resistances shown in Figure 2.8 are constant between tests, the slope of the best fit line across
these points should be represented by Equation 2.16, which is derived from Equation 2.15. As long as
the contact resistance between the sheets is much less than the resistance of a single sheet (i.e.,
), Equation 2.16 can be simplified to solve for the conductivity of the polystyrene sheets using
only known values (see Equation 2.17). In order to minimize these contact resistances, a thin layer of
high-conductivity thermal paste can be applied between the sheets prior to testing.
Equation 2.16
(
)⁄ Equation 2.17
2.5 Guarded Hot-Plate Testing – Results
A variety of panel configurations was tested with the LaserComp system: panels of
uncompressed aerogel beds with and without a truss; panels of compressed aerogel beds with and
without a truss; panels of compressed aerogels using different compression techniques; and panels of
Page | 38
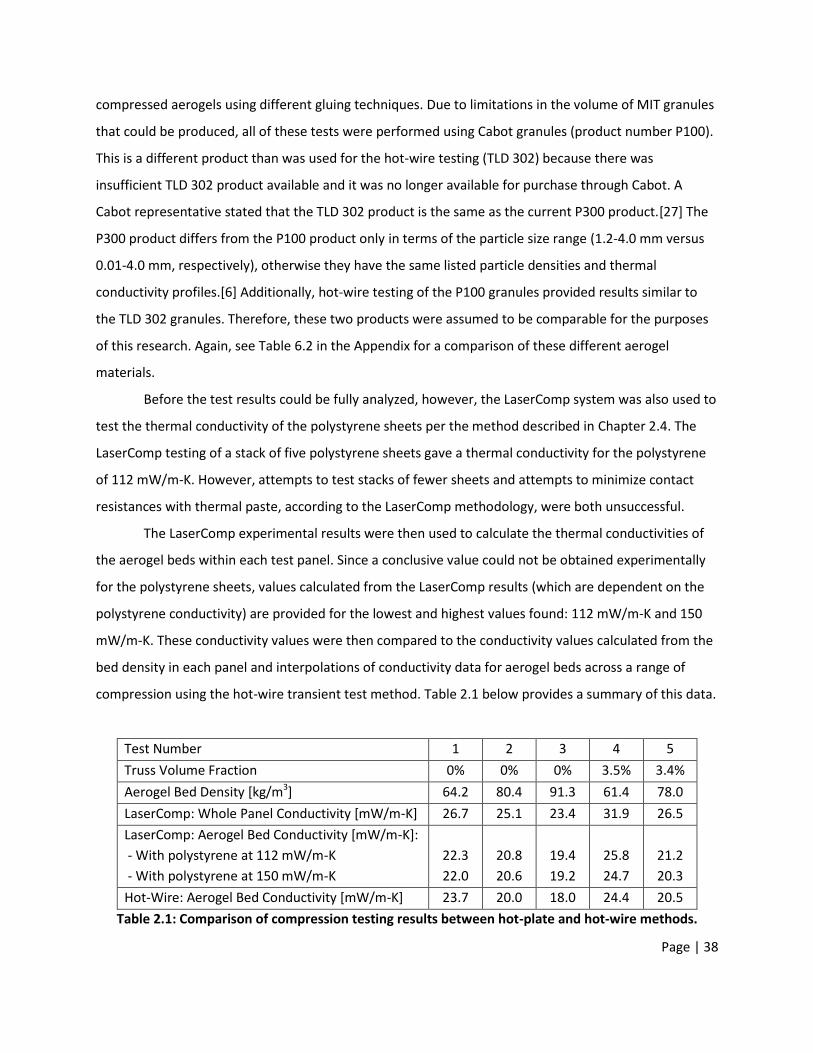
compressed aerogels using different gluing techniques. Due to limitations in the volume of MIT granules
that could be produced, all of these tests were performed using Cabot granules (product number P100).
This is a different product than was used for the hot-wire testing (TLD 302) because there was
insufficient TLD 302 product available and it was no longer available for purchase through Cabot. A
Cabot representative stated that the TLD 302 product is the same as the current P300 product.[27] The
P300 product differs from the P100 product only in terms of the particle size range (1.2-4.0 mm versus
0.01-4.0 mm, respectively), otherwise they have the same listed particle densities and thermal
conductivity profiles.[6] Additionally, hot-wire testing of the P100 granules provided results similar to
the TLD 302 granules. Therefore, these two products were assumed to be comparable for the purposes
of this research. Again, see Table 6.2 in the Appendix for a comparison of these different aerogel
materials.
Before the test results could be fully analyzed, however, the LaserComp system was also used to
test the thermal conductivity of the polystyrene sheets per the method described in Chapter 2.4. The
LaserComp testing of a stack of five polystyrene sheets gave a thermal conductivity for the polystyrene
of 112 mW/m-K. However, attempts to test stacks of fewer sheets and attempts to minimize contact
resistances with thermal paste, according to the LaserComp methodology, were both unsuccessful.
The LaserComp experimental results were then used to calculate the thermal conductivities of
the aerogel beds within each test panel. Since a conclusive value could not be obtained experimentally
for the polystyrene sheets, values calculated from the LaserComp results (which are dependent on the
polystyrene conductivity) are provided for the lowest and highest values found: 112 mW/m-K and 150
mW/m-K. These conductivity values were then compared to the conductivity values calculated from the
bed density in each panel and interpolations of conductivity data for aerogel beds across a range of
compression using the hot-wire transient test method. Table 2.1 below provides a summary of this data.
Test Number 1 2 3 4 5
Truss Volume Fraction 0% 0% 0% 3.5% 3.4%
Aerogel Bed Density [kg/m3] 64.2 80.4 91.3 61.4 78.0
LaserComp: Whole Panel Conductivity [mW/m-K] 26.7 25.1 23.4 31.9 26.5
LaserComp: Aerogel Bed Conductivity [mW/m-K]:
- With polystyrene at 112 mW/m-K
- With polystyrene at 150 mW/m-K
22.3
22.0
20.8
20.6
19.4
19.2
25.8
24.7
21.2
20.3
Hot-Wire: Aerogel Bed Conductivity [mW/m-K] 23.7 20.0 18.0 24.4 20.5
Table 2.1: Comparison of compression testing results between hot-plate and hot-wire methods.
Page | 39
LaserComp testing was also done to evaluate the aerogel compression and truss adhesion
methods. When compressing a bed of granules, there is a degree of spring-back when the compression
force is released. Kevin Chen tested two compression methods that produced similar reductions in
spring-back: holding the bed under compression for an hour or cycling between full and no compression
ten times over about 10-15 minutes.[18] LaserComp test results from panels constructed using each
compression method provided similar conductivity results. Therefore, all future panels were made using
the cycling method in order to save time. For the panels with an internal truss, the truss needed to be
epoxied to the inside of the panel faces. Again, Kevin Chen tested two methods to apply this epoxy to
the inside of each panel face: spot gluing at each contact point or applying a continuous layer across the
entire face. The spot-gluing method was problematic as it was challenging to apply the epoxy to all 162
contact points on a single face and affixing it to the truss before the epoxy had begun to set. Both
methods produced similar LaserComp test results and therefore all future panels were made using a
continuous layer of epoxy in order to save time.
2.6 Thermal Conductivity Testing – Concurrent Research
In addition to these thermal conductivity tests, a number of experiments were performed by
Kevin Chen to physically characterize the aerogel granules.[18] Of particular interest were two
experiments done by Chen to evaluate the physical impacts of compacting a bed of aerogel granules.
The first set of tests performed were micro-computed tomography (micro-CT) in order to observe the
change in the macroscopic, intergranular voids in the aerogel bed. The second set of tests was gas
absorption/desorption, which was used to determine the microscopic pore size distribution within the
granules themselves. As with the LaserComp testing, these experiments were all performed with the
Cabot granules due to limitations in the availability of sufficient volumes of MIT samples.
In micro-CT, a sample is scanned with an x-ray beam which is used to develop a three
dimensional density map of the sample. The map is then viewed as grayscale images of planar cross-
section slices through the sample. Darker shades correspond to lower density materials; lighter colors to
higher densities. Therefore, if two materials have similar densities, it may be difficult to distinguish
between them in the micro-CT grayscale images. Since the Cabot granules have a density close to that of
air (120-180 kg/m3 compared to 128 kg/m3, respectively), the samples were immersed in water (with a
density of 1,000 kg/m3) to provide the necessary contrast.[6] It was assumed that replacing the air with
water would not significantly impact the void distribution during compression.
Page | 40
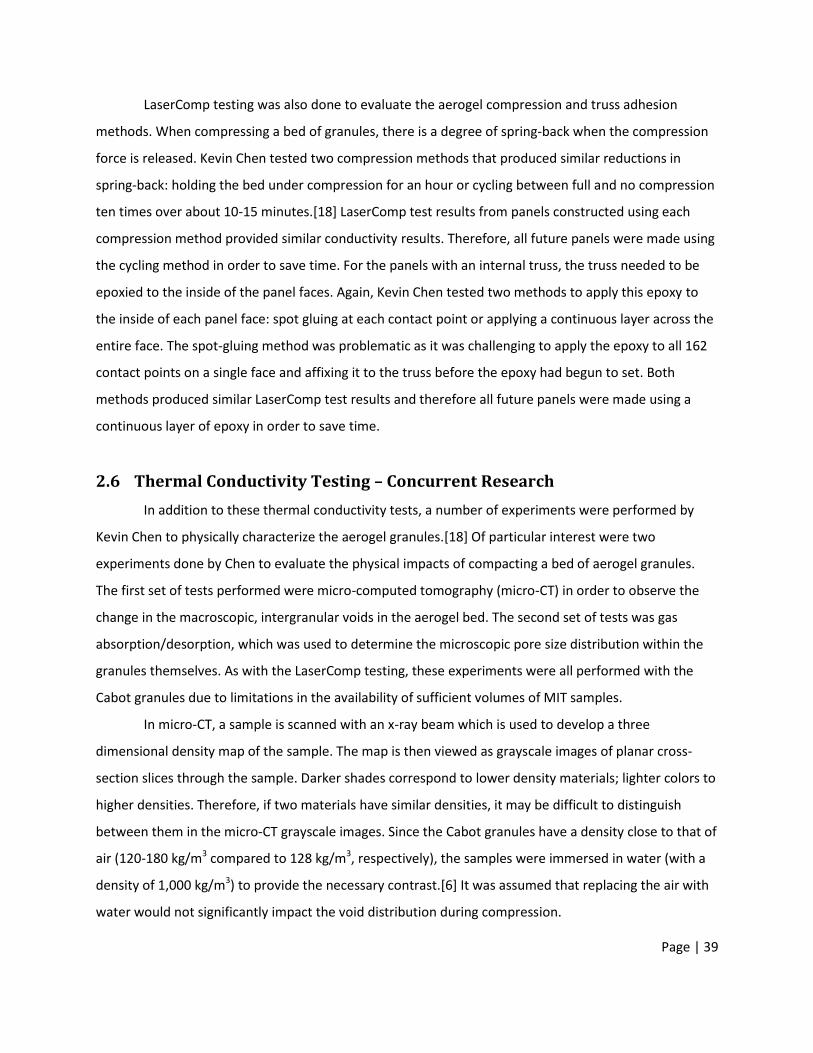
The samples were put in closed-off syringes, which were then compressed to the desired level.
Excess water was allowed to flow out of the syringe through a filter so as to avoid any build-up of
pressure that could damage the aerogel granules, which would in turn affect the results. The samples
were then tested using a GE eXplore CT 120 system at the David H. Koch Institute for Integrative Cancer
Research at MIT. Figure 2.9 below shows a representative set of scans from a range of different
compression levels tested.
68 kg/m3
113 kg/m3
76 kg/m3
136 kg/m3
85 kg/m3
170 kg/m3
97 kg/m3
Figure 2.9: Micro-CT scans of aerogel granules (dark color) immersed in water (light color). Granular
bed densities (in air) for each test are listed.[18]
These micro-CT scans were then analyzed using ImageJ – an image-processing software
developed at the National Institute of Health (NIH) – in order to calculate the volume fraction of
interstitial voids present at each compression level. At the lower compression levels, the grayscale
histogram of the image provided a clear distinction between the aerogel portions of the image and the
water-filled interstitial spaces. At higher compression levels, however, this distinction became less clear.
Page | 41
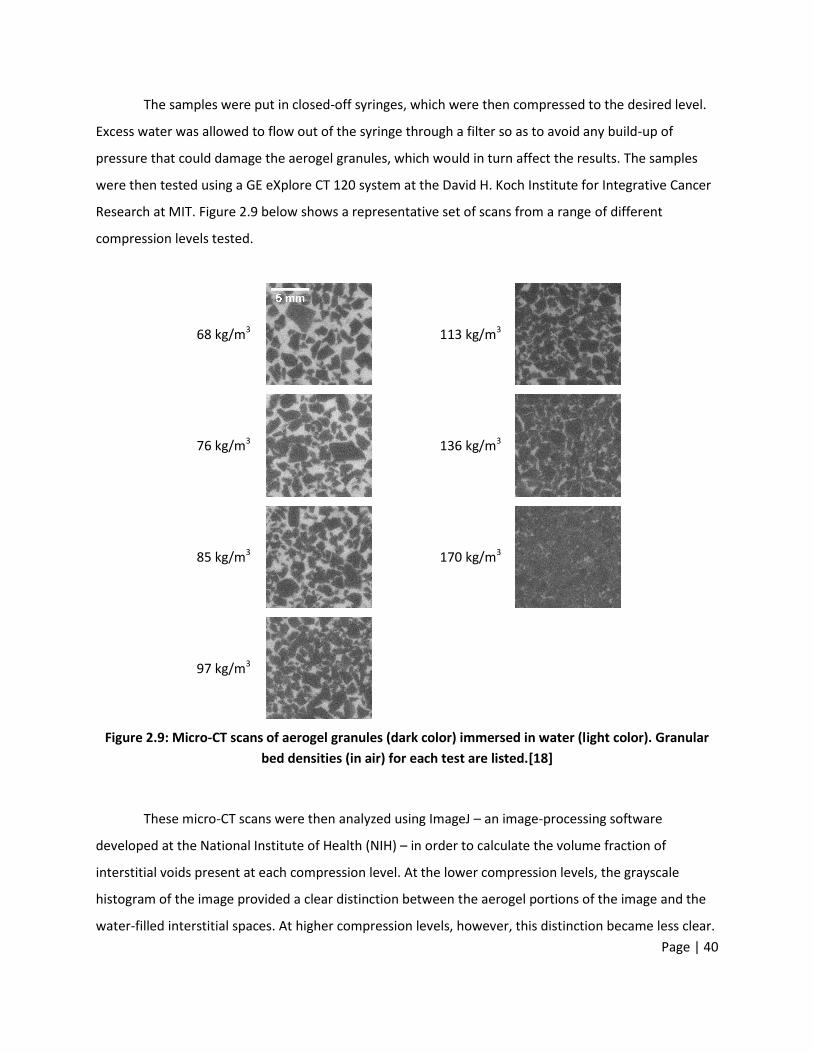
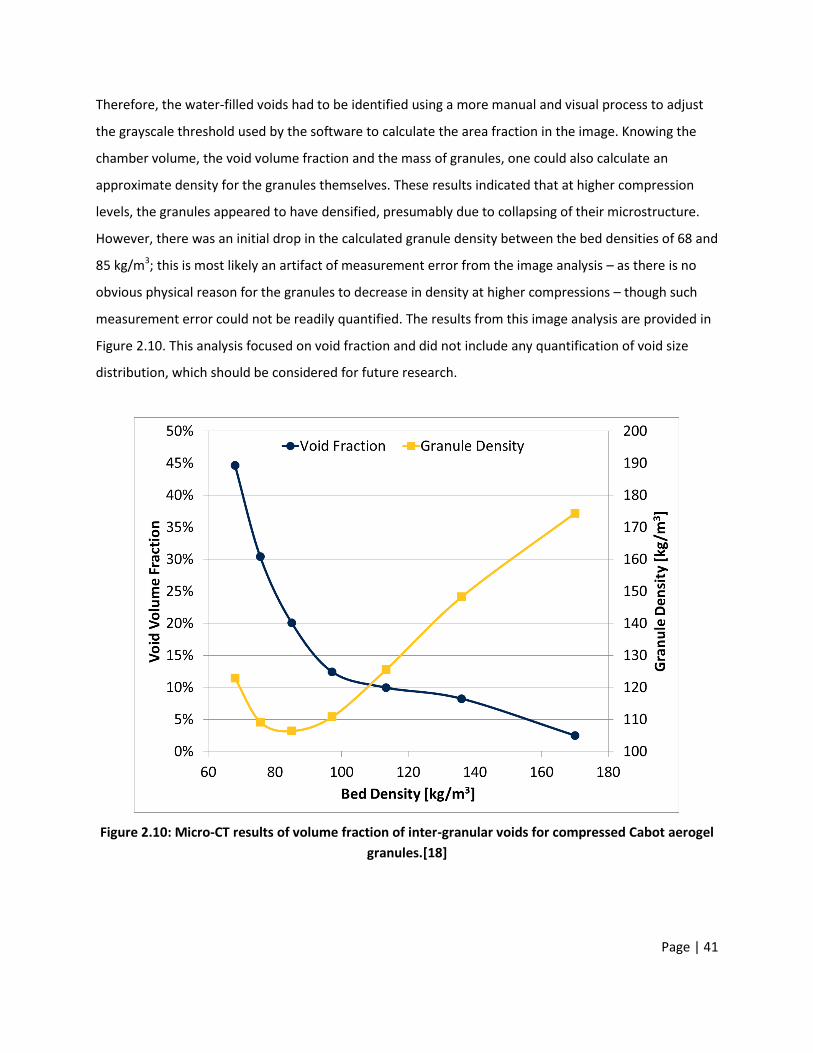
Therefore, the water-filled voids had to be identified using a more manual and visual process to adjust
the grayscale threshold used by the software to calculate the area fraction in the image. Knowing the
chamber volume, the void volume fraction and the mass of granules, one could also calculate an
approximate density for the granules themselves. These results indicated that at higher compression
levels, the granules appeared to have densified, presumably due to collapsing of their microstructure.
However, there was an initial drop in the calculated granule density between the bed densities of 68 and
85 kg/m3; this is most likely an artifact of measurement error from the image analysis – as there is no
obvious physical reason for the granules to decrease in density at higher compressions – though such
measurement error could not be readily quantified. The results from this image analysis are provided in
Figure 2.10. This analysis focused on void fraction and did not include any quantification of void size
distribution, which should be considered for future research.
Figure 2.10: Micro-CT results of volume fraction of inter-granular voids for compressed Cabot aerogel
granules.[18]
Page | 42
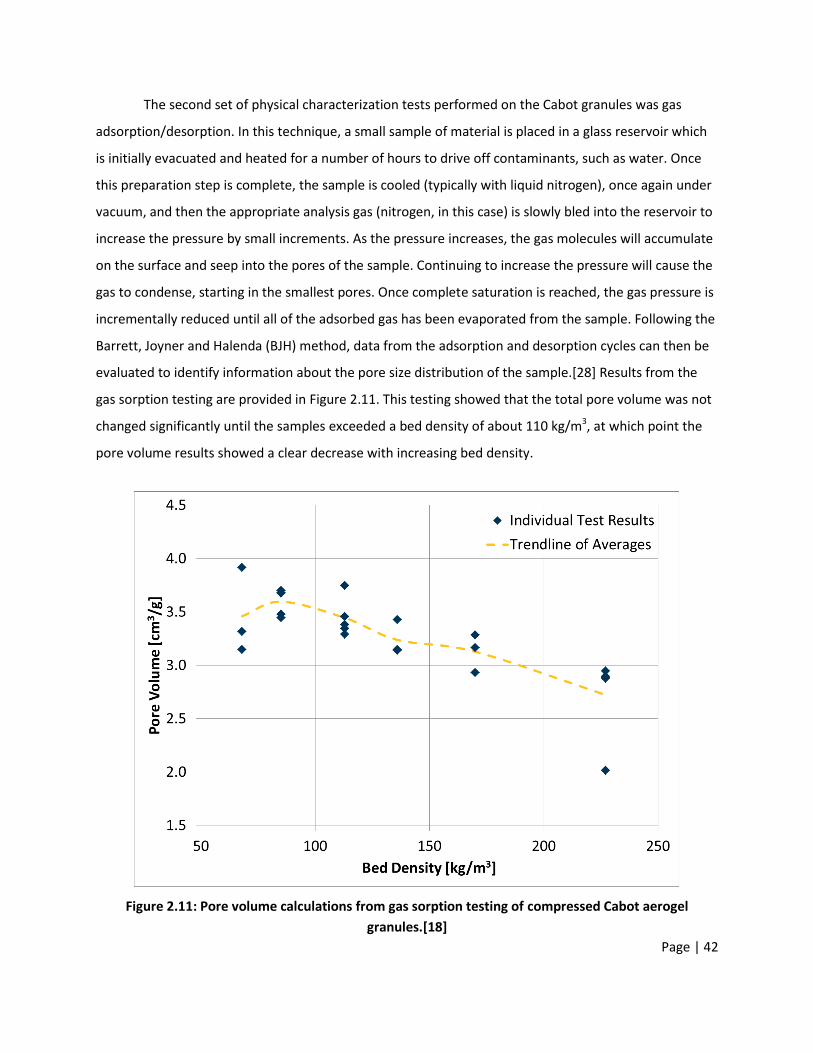
The second set of physical characterization tests performed on the Cabot granules was gas
adsorption/desorption. In this technique, a small sample of material is placed in a glass reservoir which
is initially evacuated and heated for a number of hours to drive off contaminants, such as water. Once
this preparation step is complete, the sample is cooled (typically with liquid nitrogen), once again under
vacuum, and then the appropriate analysis gas (nitrogen, in this case) is slowly bled into the reservoir to
increase the pressure by small increments. As the pressure increases, the gas molecules will accumulate
on the surface and seep into the pores of the sample. Continuing to increase the pressure will cause the
gas to condense, starting in the smallest pores. Once complete saturation is reached, the gas pressure is
incrementally reduced until all of the adsorbed gas has been evaporated from the sample. Following the
Barrett, Joyner and Halenda (BJH) method, data from the adsorption and desorption cycles can then be
evaluated to identify information about the pore size distribution of the sample.[28] Results from the
gas sorption testing are provided in Figure 2.11. This testing showed that the total pore volume was not
changed significantly until the samples exceeded a bed density of about 110 kg/m3, at which point the
pore volume results showed a clear decrease with increasing bed density.
Figure 2.11: Pore volume calculations from gas sorption testing of compressed Cabot aerogel
granules.[18]

Page | 43
2.7 Discussion of Thermal Conductivity Results
There are a number of observations that can be made from the hot-wire results including: the
performance of aerogel beds under compression, the performance of aerogel beds under compression
and vacuum and the relative performance of MIT aerogel granules compared to commercially available
granules.
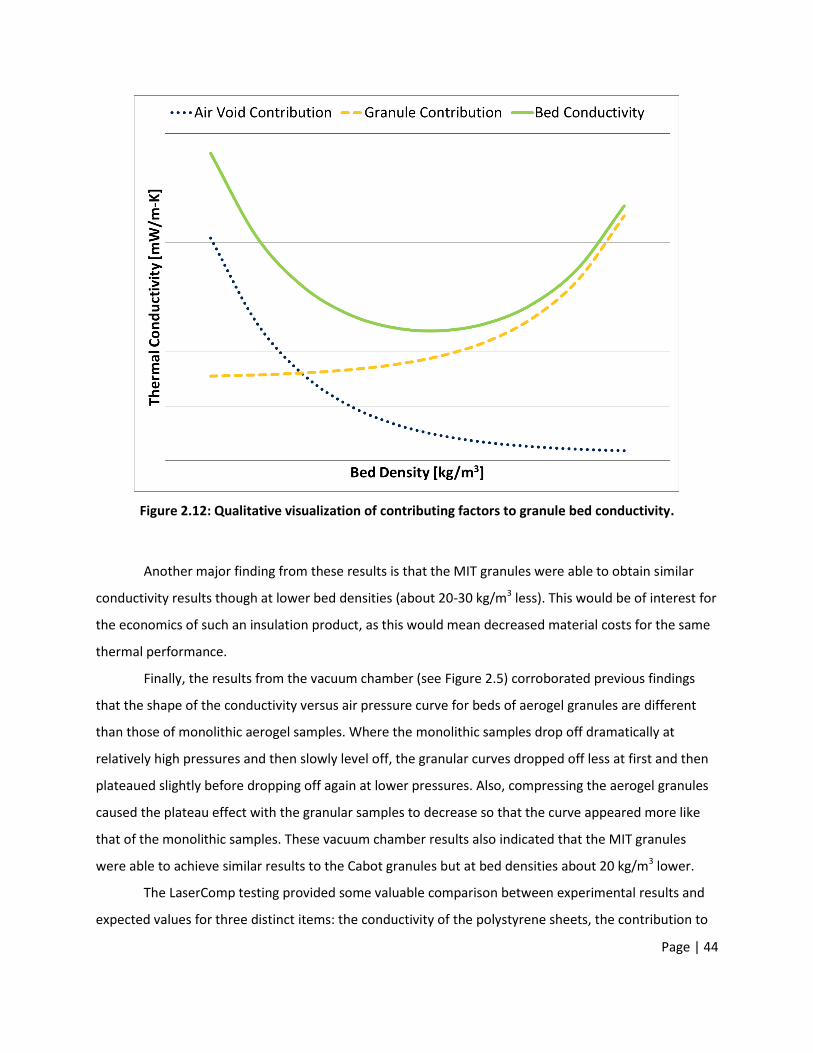
Compressing a bed of aerogel granules would have two main effects: shrinking the intergranular
air-filled voids and collapsing the microstructure within individual granules. The former mechanism
would decrease the thermal conductivity of the bed because the air in the voids should have a higher
thermal conductivity than the individual aerogel granules (25 mW/m-K for air versus about 10-15
mW/m-K for bulk aerogel); the latter mechanism would increase the thermal conductivity of the
granules (and by extension the granule bed) because these aerogels derive their low thermal
conductivity from their low-density, nanoporous structure (see Chapter 1.1).[3][11] The micro-CT results
(see Figure 2.10) show that the volume fraction of air in the granule bed was decreased by more than
two thirds when it was compressed from 68 kg/m3 to 97 kg/m3. Meanwhile, the gas sorption results
indicate that there is negligible impact on pore volume until the bed density exceeded about 110 kg/m3.
Combining this information, it could be expected that the thermal conductivity of a loosely packed bed
of aerogel granules would initially decrease under compression before bottoming out and eventually
increasing again at higher compression levels (see Figure 2.12). The hot-wire results for the Cabot
granules appear to demonstrate this hypothesis (see Figure 2.4). The Cabot samples showed a minimum
thermal conductivity of about 13 mW/m-K at about 150 kg/m3, which is in the density range of the
material itself (as specified in Cabot’s documentation).[6]
Page | 44
Figure 2.12: Qualitative visualization of contributing factors to granule bed conductivity.
Another major finding from these results is that the MIT granules were able to obtain similar
conductivity results though at lower bed densities (about 20-30 kg/m3 less). This would be of interest for
the economics of such an insulation product, as this would mean decreased material costs for the same
thermal performance.
Finally, the results from the vacuum chamber (see Figure 2.5) corroborated previous findings
that the shape of the conductivity versus air pressure curve for beds of aerogel granules are different
than those of monolithic aerogel samples. Where the monolithic samples drop off dramatically at
relatively high pressures and then slowly level off, the granular curves dropped off less at first and then
plateaued slightly before dropping off again at lower pressures. Also, compressing the aerogel granules
caused the plateau effect with the granular samples to decrease so that the curve appeared more like
that of the monolithic samples. These vacuum chamber results also indicated that the MIT granules
were able to achieve similar results to the Cabot granules but at bed densities about 20 kg/m3 lower.
The LaserComp testing provided some valuable comparison between experimental results and
expected values for three distinct items: the conductivity of the polystyrene sheets, the contribution to
Page | 45
conductivity from the truss design and the conductivity of the aerogel granules. The expected values for
each item came from three separate sources: literature values, theoretical calculations and previous
hot-wire experiments, respectively.
As discussed in Chapter 2.4, there was uncertainty in the thermal conductivity of the
polystyrene sheets, which were used to make the panel faces and trusses. A stack of five polystyrene
sheets tested in the LaserComp system gave a conductivity of 112 mW/m-K. Unfortunately, attempts to
remove the impacts of contact resistances per the LaserComp methodology for thin materials were
unsuccessful. Therefore, analysis of the LaserComp results includes some additional uncertainty because
of the uncertainty in the conductivity of the polystyrene components.
During the original development of the truss design and material selection for the panel system,
Thomas Goutierre designed the truss system so that it would increase the conductivity of the panel core
by no more than 2 mW/m-K, which assumed a thermal conductivity of 126 mW/m-K for the truss
material; in other words, the term (see Equation 2.14) should not exceed 2 mW/m-K.[17] To evaluate
this experimentally, the LaserComp data for the panels with a truss (see Table 2.1, tests 4 and 5) were
compared to results from panels with similar bed densities but without a truss (see Table 2.1, tests 1 and
2, respectively). After correcting for the difference in the bed densities between the panels, the
conductivity contribution of the truss was calculated to be about 4.6 mW/m-K (according to tests 1 and
5) or 1.5 mW/m-K (according to tests 2 and 5).These values are not impacted significantly by the
uncertainty in the polystyrene conductivity. The latter comparison fits within the previous analytical
expectations. The former comparison, however, is over twice the predicted value. The reason for such a
discrepancy between these two comparisons is currently unknown and will require additional testing to
definitively determine. The final comparison provided by the LaserComp data was for the measured
conductivity of the aerogel granules. Separate conductivity measurements had been completed on
compressed granule beds using the transient hot-wire method. One shortcoming of the hot-wire
method for silica aerogel is that it underestimates the impacts of radiative heat transfer as compared to
other, large scale test methods, such as the steady-state hot-plate method. The reason behind this is
that the aerogel is relatively transparent to long-wave radiation for the timescales used in the hot-wire
method. It was previously calculated by Ellann Cohen that the hot-wire method may underestimate
thermal conductivity up to 3.3 mW/m-K.[3] The calculated aerogel conductivities based on the
LaserComp results were all within this margin compared to the expected aerogel conductivities from the
hot-wire results except for test 5 (when derived assuming the high polystyrene conductivity) and test 1
Page | 46
at either polystyrene conductivity (see Table 2.1); these tests had LaserComp results lower than the hot-
wire expectations. The reason for this unexpected result is currently unclear. It may indicate that the
higher conductivity value assumed for polystyrene is too high, though that cannot be definitively
determined from these results and still does not resolve the issue with test 1.
There are a number of potential sources of error in these calculations. One such source could be
in the manufacturing of the trusses. The truss pieces are currently made with a laser cutter and it
creates some imperfections along the cut edges. However, water displacement measurements were
performed on some truss pieces and they were consistently measured to be within 5% of the predicted
volume according to the CAD files used to create the trusses. Some of the assumptions made in the
theoretical calculation may also need to be reviewed. For example, it was assumed for the purposes of
the calculations that heat traveling through the core travels separately through the aerogel and the
truss, as if they were completely in parallel with each other. However, in reality it is likely that some
amount of heat traveling through the low-conductivity aerogel would transfer to the relatively high-
conductivity truss; this would increase the contribution to conductivity by the truss. This possibility has
not been quantitatively reviewed. The calculations for the LaserComp results also assumed that the
aerogel inside the panel was evenly distributed and compacted. When the truss was introduced, a grid
was cut into the compression plate in order to fit around the truss; this grid was approximately 42% of
the surface area of the compression plate. Calculations were done to see how the core conductivity
would change if the aerogel was evenly compressed and if the aerogel was left completely
uncompressed under the grid in the compression plate. For the (average) bed densities shown in Table
2.1, these two scenarios were within 1 mW/m-K of each other (with the homogenous compression
scenario having the higher calculated conductivities). Also, since test 1 was involved in both of the
discrepancies noted above, it is possible that some physical or tested measurement was incorrect.
Though there is no way to know without repeating this test scenario.
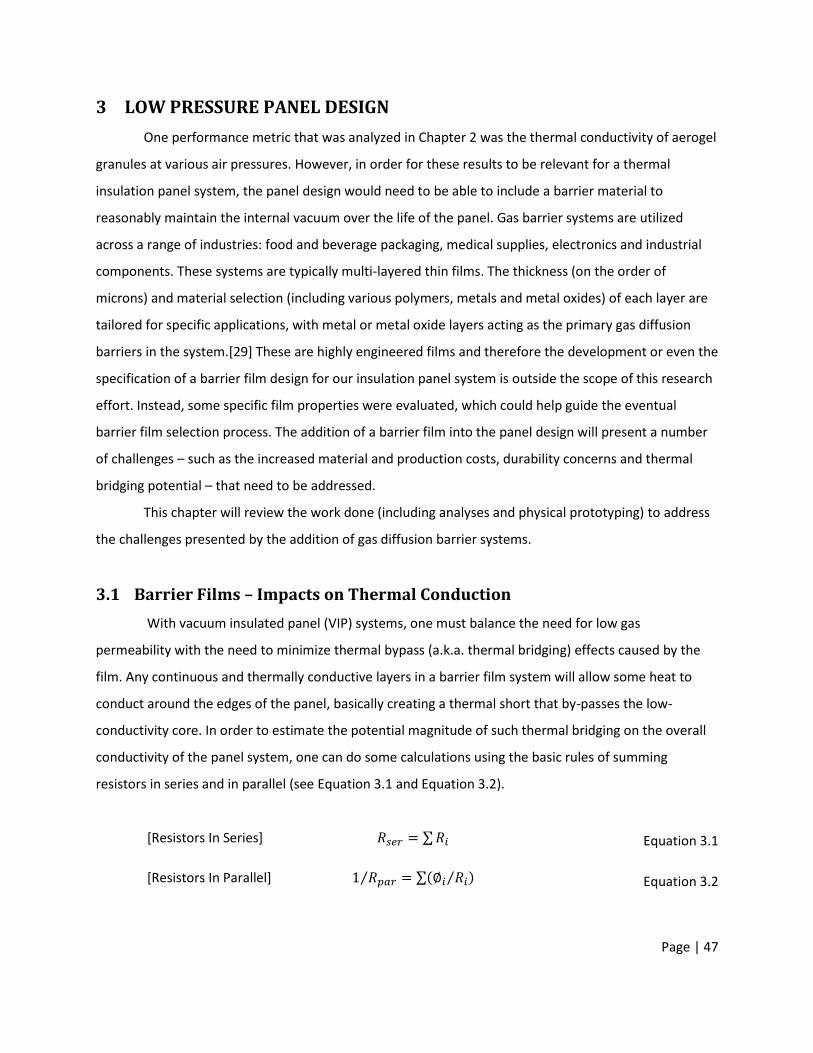
Page | 47
3 LOW PRESSURE PANEL DESIGN
One performance metric that was analyzed in Chapter 2 was the thermal conductivity of aerogel
granules at various air pressures. However, in order for these results to be relevant for a thermal
insulation panel system, the panel design would need to be able to include a barrier material to
reasonably maintain the internal vacuum over the life of the panel. Gas barrier systems are utilized
across a range of industries: food and beverage packaging, medical supplies, electronics and industrial
components. These systems are typically multi-layered thin films. The thickness (on the order of
microns) and material selection (including various polymers, metals and metal oxides) of each layer are
tailored for specific applications, with metal or metal oxide layers acting as the primary gas diffusion
barriers in the system.[29] These are highly engineered films and therefore the development or even the
specification of a barrier film design for our insulation panel system is outside the scope of this research
effort. Instead, some specific film properties were evaluated, which could help guide the eventual
barrier film selection process. The addition of a barrier film into the panel design will present a number
of challenges – such as the increased material and production costs, durability concerns and thermal
bridging potential – that need to be addressed.
This chapter will review the work done (including analyses and physical prototyping) to address
the challenges presented by the addition of gas diffusion barrier systems.
3.1 Barrier Films – Impacts on Thermal Conduction
With vacuum insulated panel (VIP) systems, one must balance the need for low gas
permeability with the need to minimize thermal bypass (a.k.a. thermal bridging) effects caused by the
film. Any continuous and thermally conductive layers in a barrier film system will allow some heat to
conduct around the edges of the panel, basically creating a thermal short that by-passes the low-
conductivity core. In order to estimate the potential magnitude of such thermal bridging on the overall
conductivity of the panel system, one can do some calculations using the basic rules of summing
resistors in series and in parallel (see Equation 3.1 and Equation 3.2).
[Resistors In Series] ∑ Equation 3.1
[Resistors In Parallel] ⁄ ∑( ⁄ ) Equation 3.2
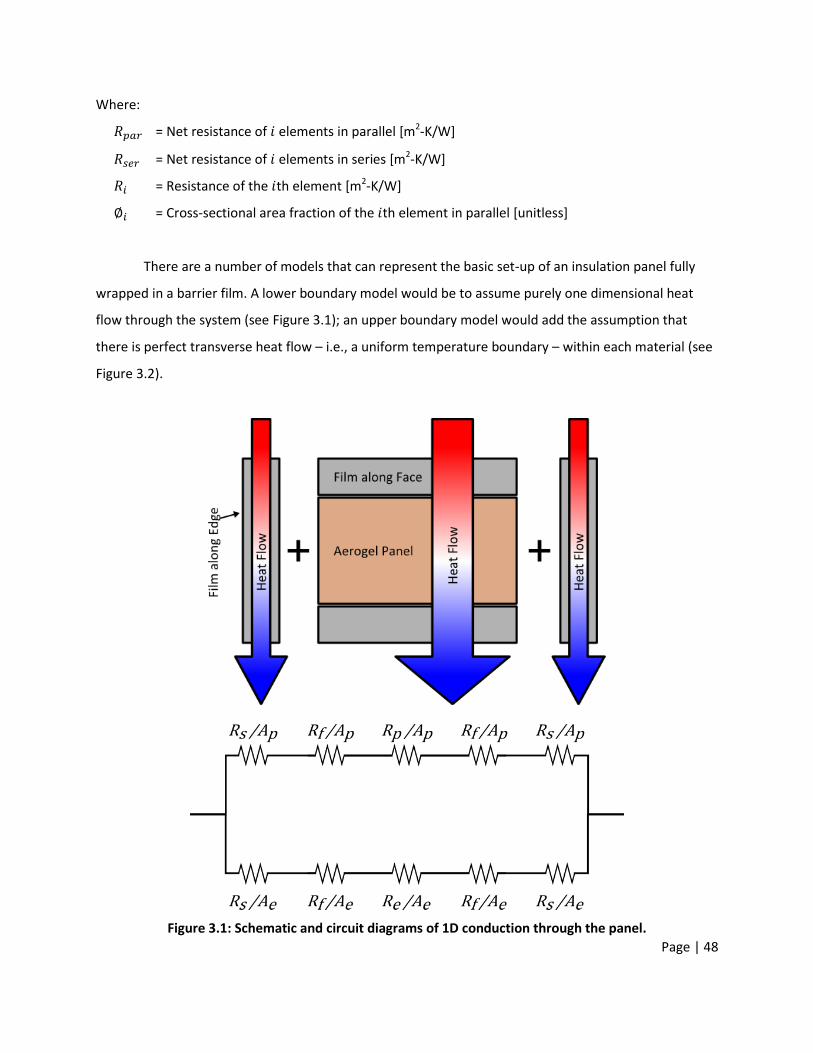
Page | 48
Where:
= Net resistance of elements in parallel [m2-K/W]
= Net resistance of elements in series [m2-K/W]
= Resistance of the th element [m2-K/W]
= Cross-sectional area fraction of the th element in parallel [unitless]
There are a number of models that can represent the basic set-up of an insulation panel fully
wrapped in a barrier film. A lower boundary model would be to assume purely one dimensional heat
flow through the system (see Figure 3.1); an upper boundary model would add the assumption that
there is perfect transverse heat flow – i.e., a uniform temperature boundary – within each material (see
Figure 3.2).
Figure 3.1: Schematic and circuit diagrams of 1D conduction through the panel.
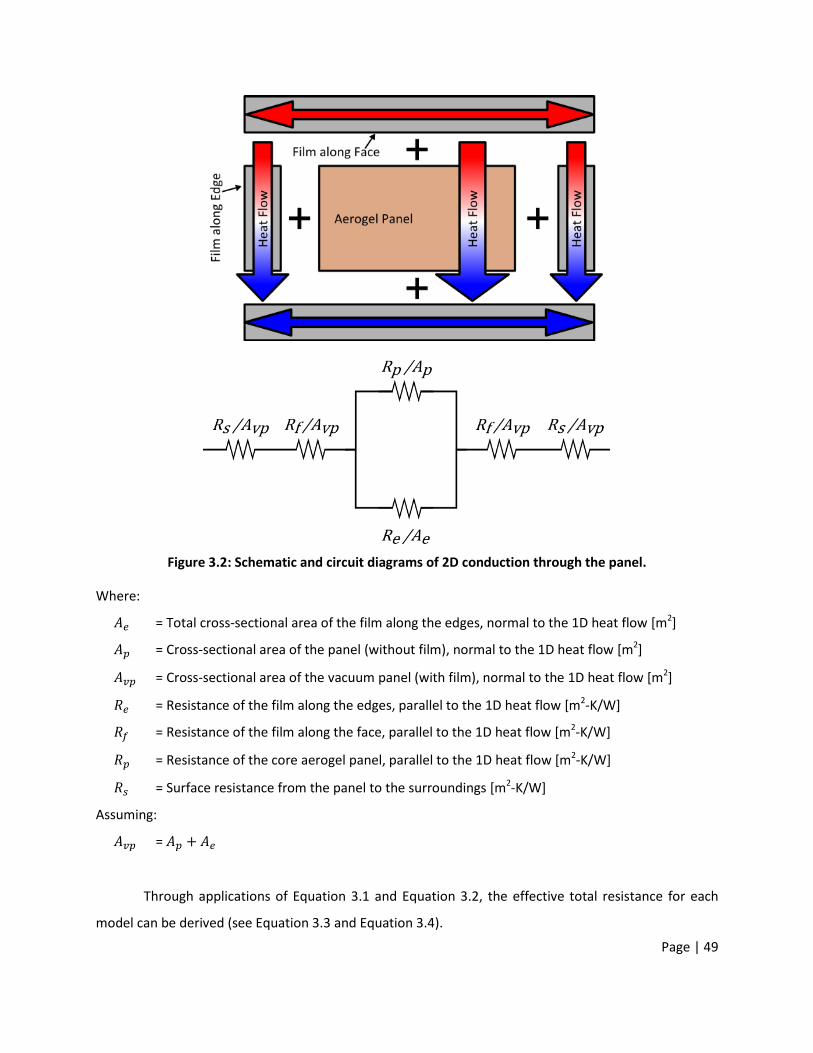
Page | 49
Figure 3.2: Schematic and circuit diagrams of 2D conduction through the panel.
Where:
= Total cross-sectional area of the film along the edges, normal to the 1D heat flow [m2]
= Cross-sectional area of the panel (without film), normal to the 1D heat flow [m2]
= Cross-sectional area of the vacuum panel (with film), normal to the 1D heat flow [m2]
= Resistance of the film along the edges, parallel to the 1D heat flow [m2-K/W]
= Resistance of the film along the face, parallel to the 1D heat flow [m2-K/W]
= Resistance of the core aerogel panel, parallel to the 1D heat flow [m2-K/W]
= Surface resistance from the panel to the surroundings [m2-K/W]
Assuming:
=
Through applications of Equation 3.1 and Equation 3.2, the effective total resistance for each
model can be derived (see Equation 3.3 and Equation 3.4).
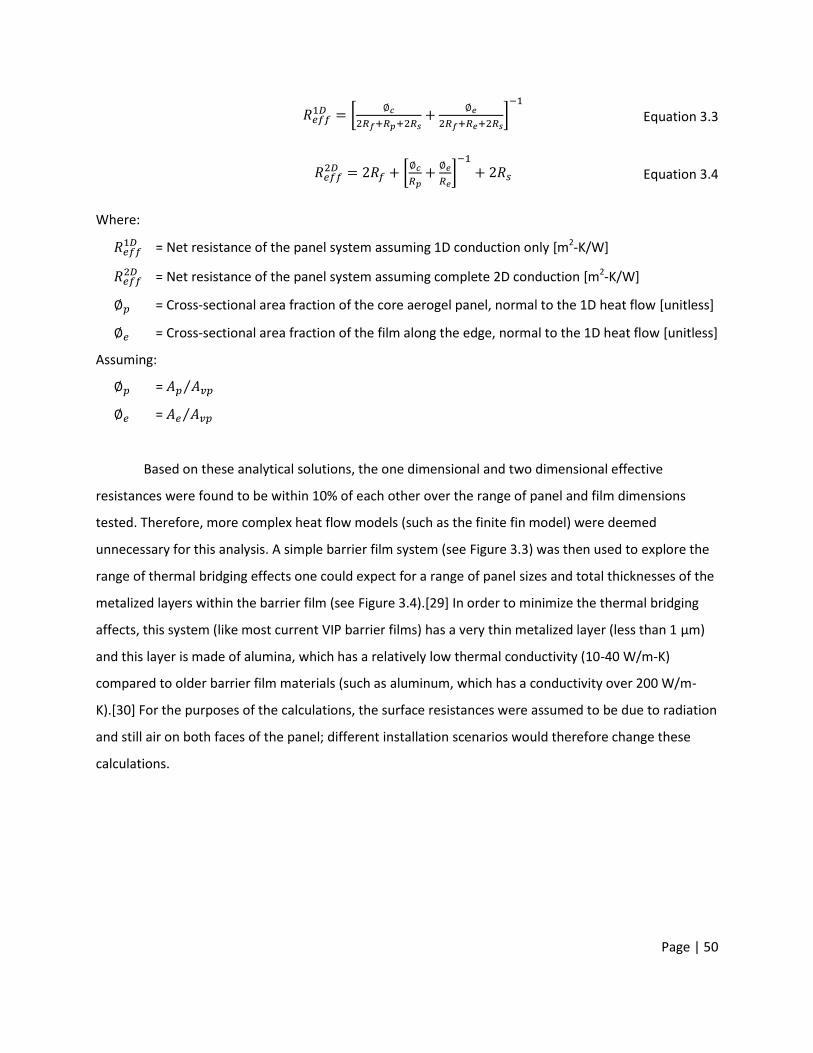
Page | 50
[
]
Equation 3.3
[
]
Equation 3.4
Where:
= Net resistance of the panel system assuming 1D conduction only [m2-K/W]
= Net resistance of the panel system assuming complete 2D conduction [m2-K/W]
= Cross-sectional area fraction of the core aerogel panel, normal to the 1D heat flow [unitless]
= Cross-sectional area fraction of the film along the edge, normal to the 1D heat flow [unitless]
Assuming:
= ⁄
= ⁄
Based on these analytical solutions, the one dimensional and two dimensional effective
resistances were found to be within 10% of each other over the range of panel and film dimensions
tested. Therefore, more complex heat flow models (such as the finite fin model) were deemed
unnecessary for this analysis. A simple barrier film system (see Figure 3.3) was then used to explore the
range of thermal bridging effects one could expect for a range of panel sizes and total thicknesses of the
metalized layers within the barrier film (see Figure 3.4).[29] In order to minimize the thermal bridging
affects, this system (like most current VIP barrier films) has a very thin metalized layer (less than 1 μm)
and this layer is made of alumina, which has a relatively low thermal conductivity (10-40 W/m-K)
compared to older barrier film materials (such as aluminum, which has a conductivity over 200 W/m-
K).[30] For the purposes of the calculations, the surface resistances were assumed to be due to radiation
and still air on both faces of the panel; different installation scenarios would therefore change these
calculations.
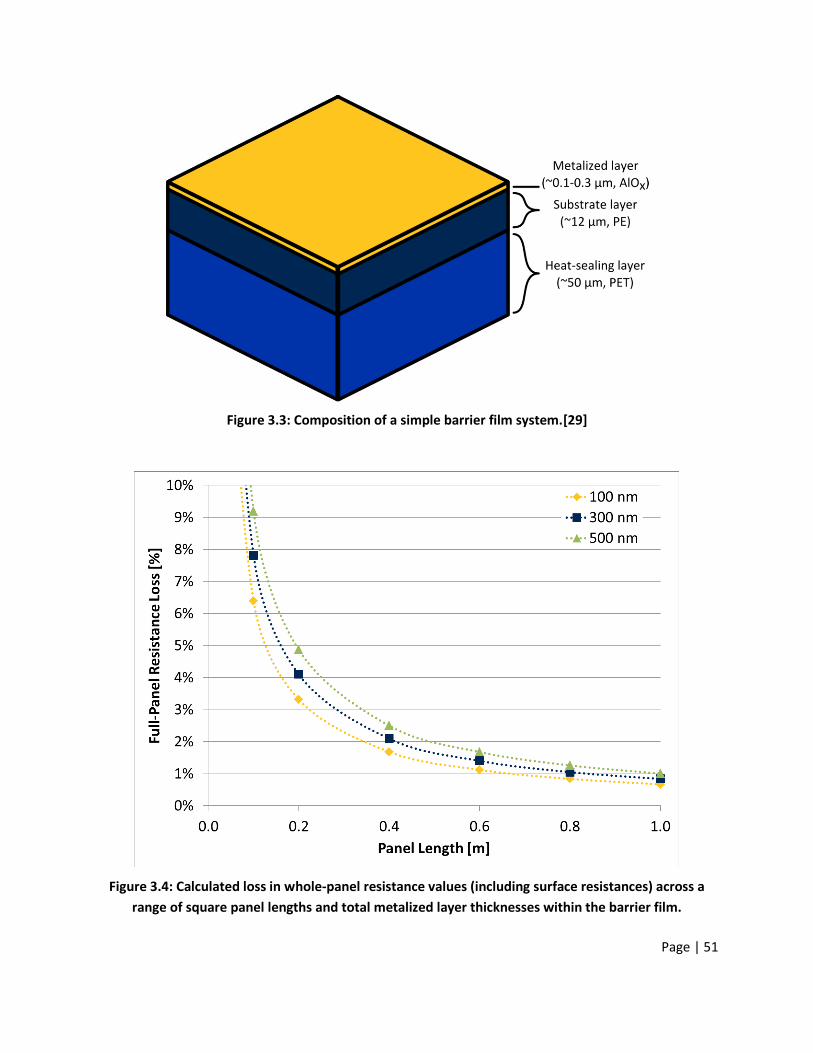
Page | 51
Figure 3.3: Composition of a simple barrier film system.[29]
Figure 3.4: Calculated loss in whole-panel resistance values (including surface resistances) across a
range of square panel lengths and total metalized layer thicknesses within the barrier film.
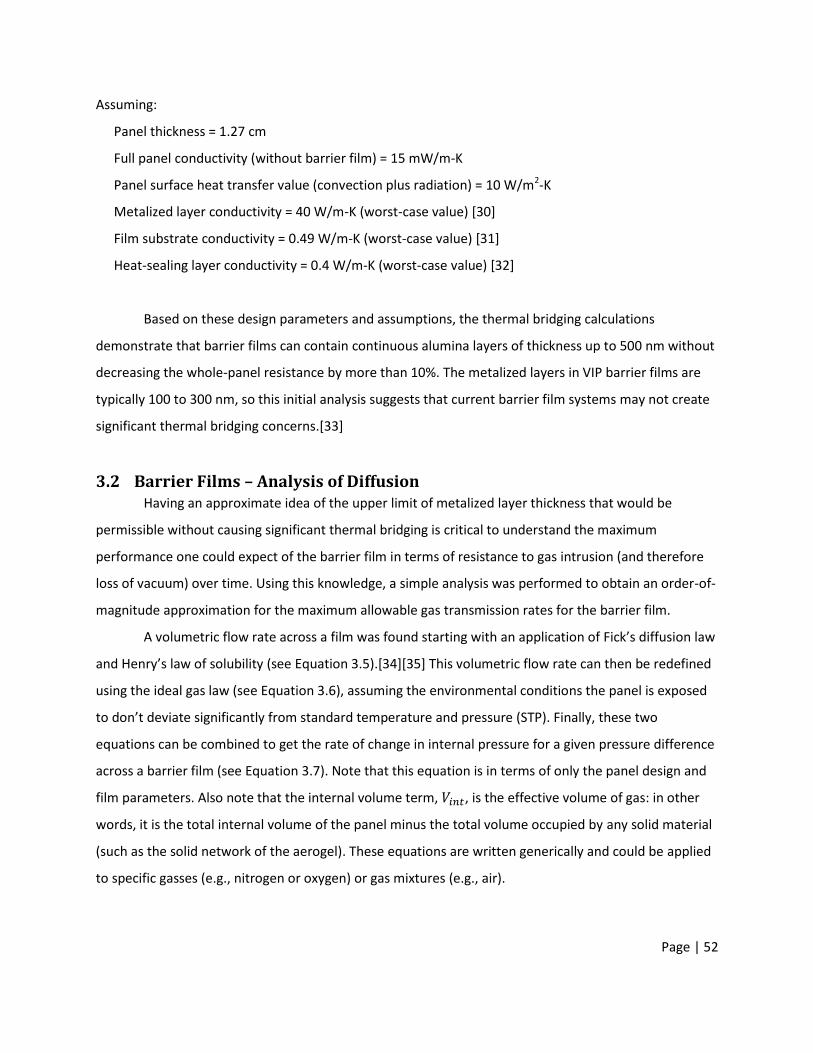
Page | 52
Assuming:
Panel thickness = 1.27 cm
Full panel conductivity (without barrier film) = 15 mW/m-K
Panel surface heat transfer value (convection plus radiation) = 10 W/m2-K
Metalized layer conductivity = 40 W/m-K (worst-case value) [30]
Film substrate conductivity = 0.49 W/m-K (worst-case value) [31]
Heat-sealing layer conductivity = 0.4 W/m-K (worst-case value) [32]
Based on these design parameters and assumptions, the thermal bridging calculations
demonstrate that barrier films can contain continuous alumina layers of thickness up to 500 nm without
decreasing the whole-panel resistance by more than 10%. The metalized layers in VIP barrier films are
typically 100 to 300 nm, so this initial analysis suggests that current barrier film systems may not create
significant thermal bridging concerns.[33]
3.2 Barrier Films – Analysis of Diffusion Having an approximate idea of the upper limit of metalized layer thickness that would be
permissible without causing significant thermal bridging is critical to understand the maximum
performance one could expect of the barrier film in terms of resistance to gas intrusion (and therefore
loss of vacuum) over time. Using this knowledge, a simple analysis was performed to obtain an order-of-
magnitude approximation for the maximum allowable gas transmission rates for the barrier film.
A volumetric flow rate across a film was found starting with an application of Fick’s diffusion law
and Henry’s law of solubility (see Equation 3.5).[34][35] This volumetric flow rate can then be redefined
using the ideal gas law (see Equation 3.6), assuming the environmental conditions the panel is exposed
to don’t deviate significantly from standard temperature and pressure (STP). Finally, these two
equations can be combined to get the rate of change in internal pressure for a given pressure difference
across a barrier film (see Equation 3.7). Note that this equation is in terms of only the panel design and
film parameters. Also note that the internal volume term, , is the effective volume of gas: in other
words, it is the total internal volume of the panel minus the total volume occupied by any solid material
(such as the solid network of the aerogel). These equations are written generically and could be applied
to specific gasses (e.g., nitrogen or oxygen) or gas mixtures (e.g., air).
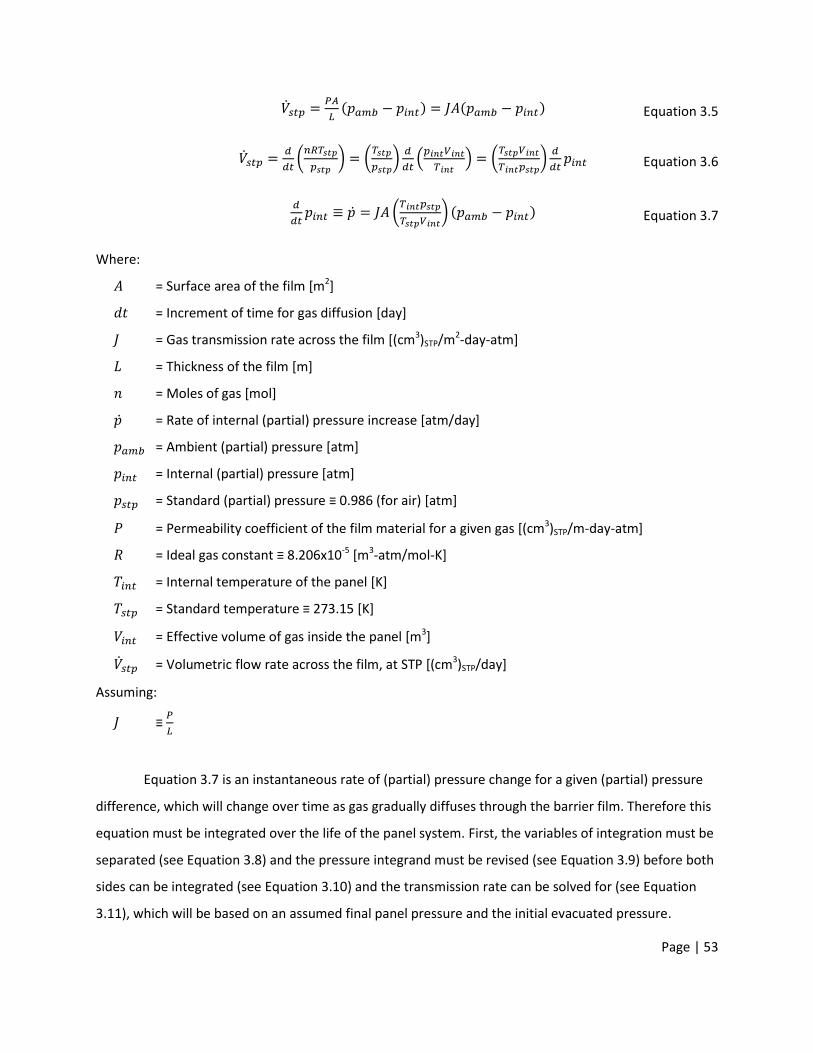
Page | 53
( ) ( ) Equation 3.5
(
) (
)
(
) (
)
Equation 3.6
(
) ( ) Equation 3.7
Where:
= Surface area of the film [m2]
= Increment of time for gas diffusion [day]
= Gas transmission rate across the film [(cm3)STP/m2-day-atm]
= Thickness of the film [m]
= Moles of gas [mol]
= Rate of internal (partial) pressure increase [atm/day]
= Ambient (partial) pressure [atm]
= Internal (partial) pressure [atm]
= Standard (partial) pressure ≡ 0.986 (for air) [atm]
= Permeability coefficient of the film material for a given gas [(cm3)STP/m-day-atm]
= Ideal gas constant ≡ 8.206x10⁻⁵ [m3-atm/mol-K]
= Internal temperature of the panel [K]
= Standard temperature ≡ 273.15 [K]
= Effective volume of gas inside the panel [m3]
= Volumetric flow rate across the film, at STP [(cm3)STP/day]
Assuming:
≡
Equation 3.7 is an instantaneous rate of (partial) pressure change for a given (partial) pressure
difference, which will change over time as gas gradually diffuses through the barrier film. Therefore this
equation must be integrated over the life of the panel system. First, the variables of integration must be
separated (see Equation 3.8) and the pressure integrand must be revised (see Equation 3.9) before both
sides can be integrated (see Equation 3.10) and the transmission rate can be solved for (see Equation
3.11), which will be based on an assumed final panel pressure and the initial evacuated pressure.
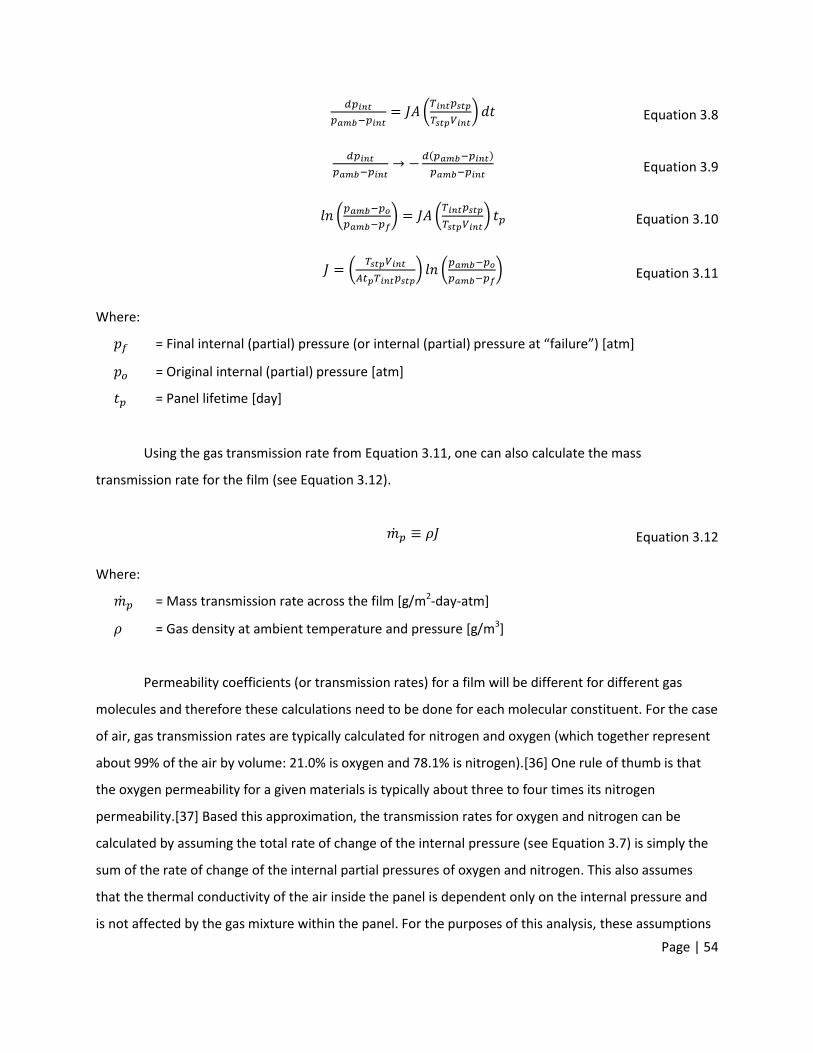
Page | 54
(
) Equation 3.8
( )
Equation 3.9
(
) (
) Equation 3.10
(
) (
) Equation 3.11
Where:
= Final internal (partial) pressure (or internal (partial) pressure at “failure”) [atm]
= Original internal (partial) pressure [atm]
= Panel lifetime [day]
Using the gas transmission rate from Equation 3.11, one can also calculate the mass
transmission rate for the film (see Equation 3.12).
Equation 3.12
Where:
= Mass transmission rate across the film [g/m2-day-atm]
= Gas density at ambient temperature and pressure [g/m3]
Permeability coefficients (or transmission rates) for a film will be different for different gas
molecules and therefore these calculations need to be done for each molecular constituent. For the case
of air, gas transmission rates are typically calculated for nitrogen and oxygen (which together represent
about 99% of the air by volume: 21.0% is oxygen and 78.1% is nitrogen).[36] One rule of thumb is that
the oxygen permeability for a given materials is typically about three to four times its nitrogen
permeability.[37] Based this approximation, the transmission rates for oxygen and nitrogen can be
calculated by assuming the total rate of change of the internal pressure (see Equation 3.7) is simply the
sum of the rate of change of the internal partial pressures of oxygen and nitrogen. This also assumes
that the thermal conductivity of the air inside the panel is dependent only on the internal pressure and
is not affected by the gas mixture within the panel. For the purposes of this analysis, these assumptions
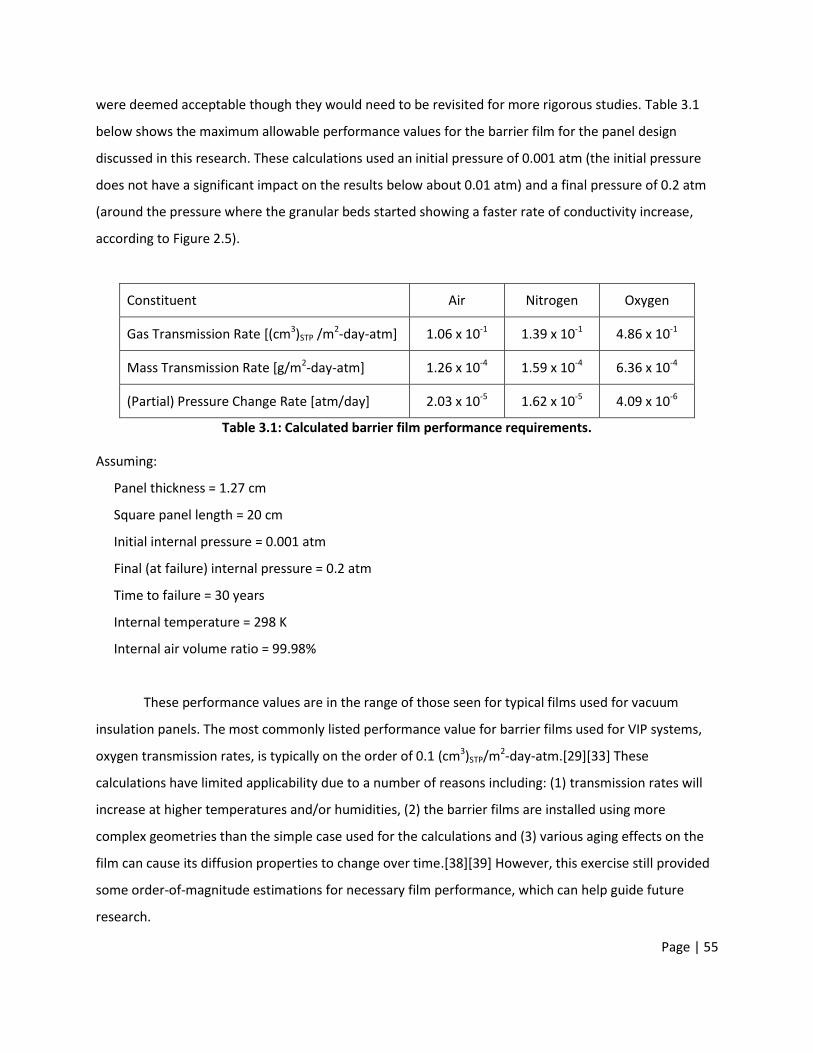
Page | 55
were deemed acceptable though they would need to be revisited for more rigorous studies. Table 3.1
below shows the maximum allowable performance values for the barrier film for the panel design
discussed in this research. These calculations used an initial pressure of 0.001 atm (the initial pressure
does not have a significant impact on the results below about 0.01 atm) and a final pressure of 0.2 atm
(around the pressure where the granular beds started showing a faster rate of conductivity increase,
according to Figure 2.5).
Constituent Air Nitrogen Oxygen
Gas Transmission Rate [(cm3)STP /m2-day-atm] 1.06 x 10⁻¹ 1.39 x 10⁻¹ 4.86 x 10⁻¹
Mass Transmission Rate [g/m2-day-atm] 1.26 x 10⁻⁴ 1.59 x 10⁻⁴ 6.36 x 10⁻⁴
(Partial) Pressure Change Rate [atm/day] 2.03 x 10⁻⁵ 1.62 x 10⁻⁵ 4.09 x 10⁻⁶
Table 3.1: Calculated barrier film performance requirements.
Assuming:
Panel thickness = 1.27 cm
Square panel length = 20 cm
Initial internal pressure = 0.001 atm
Final (at failure) internal pressure = 0.2 atm
Time to failure = 30 years
Internal temperature = 298 K
Internal air volume ratio = 99.98%
These performance values are in the range of those seen for typical films used for vacuum
insulation panels. The most commonly listed performance value for barrier films used for VIP systems,
oxygen transmission rates, is typically on the order of 0.1 (cm3)STP/m2-day-atm.[29][33] These
calculations have limited applicability due to a number of reasons including: (1) transmission rates will
increase at higher temperatures and/or humidities, (2) the barrier films are installed using more
complex geometries than the simple case used for the calculations and (3) various aging effects on the
film can cause its diffusion properties to change over time.[38][39] However, this exercise still provided
some order-of-magnitude estimations for necessary film performance, which can help guide future
research.
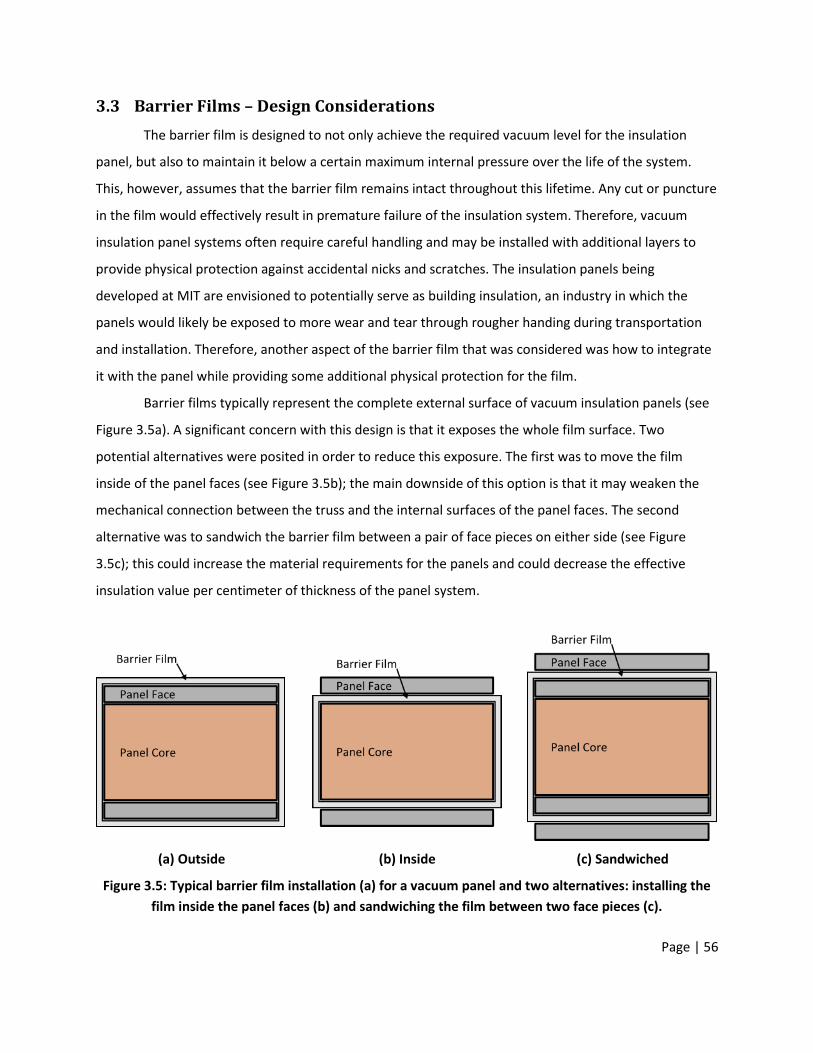
Page | 56
3.3 Barrier Films – Design Considerations
The barrier film is designed to not only achieve the required vacuum level for the insulation
panel, but also to maintain it below a certain maximum internal pressure over the life of the system.
This, however, assumes that the barrier film remains intact throughout this lifetime. Any cut or puncture
in the film would effectively result in premature failure of the insulation system. Therefore, vacuum
insulation panel systems often require careful handling and may be installed with additional layers to
provide physical protection against accidental nicks and scratches. The insulation panels being
developed at MIT are envisioned to potentially serve as building insulation, an industry in which the
panels would likely be exposed to more wear and tear through rougher handing during transportation
and installation. Therefore, another aspect of the barrier film that was considered was how to integrate
it with the panel while providing some additional physical protection for the film.
Barrier films typically represent the complete external surface of vacuum insulation panels (see
Figure 3.5a). A significant concern with this design is that it exposes the whole film surface. Two
potential alternatives were posited in order to reduce this exposure. The first was to move the film
inside of the panel faces (see Figure 3.5b); the main downside of this option is that it may weaken the
mechanical connection between the truss and the internal surfaces of the panel faces. The second
alternative was to sandwich the barrier film between a pair of face pieces on either side (see Figure
3.5c); this could increase the material requirements for the panels and could decrease the effective
insulation value per centimeter of thickness of the panel system.
(a) Outside (b) Inside (c) Sandwiched
Figure 3.5: Typical barrier film installation (a) for a vacuum panel and two alternatives: installing the
film inside the panel faces (b) and sandwiching the film between two face pieces (c).
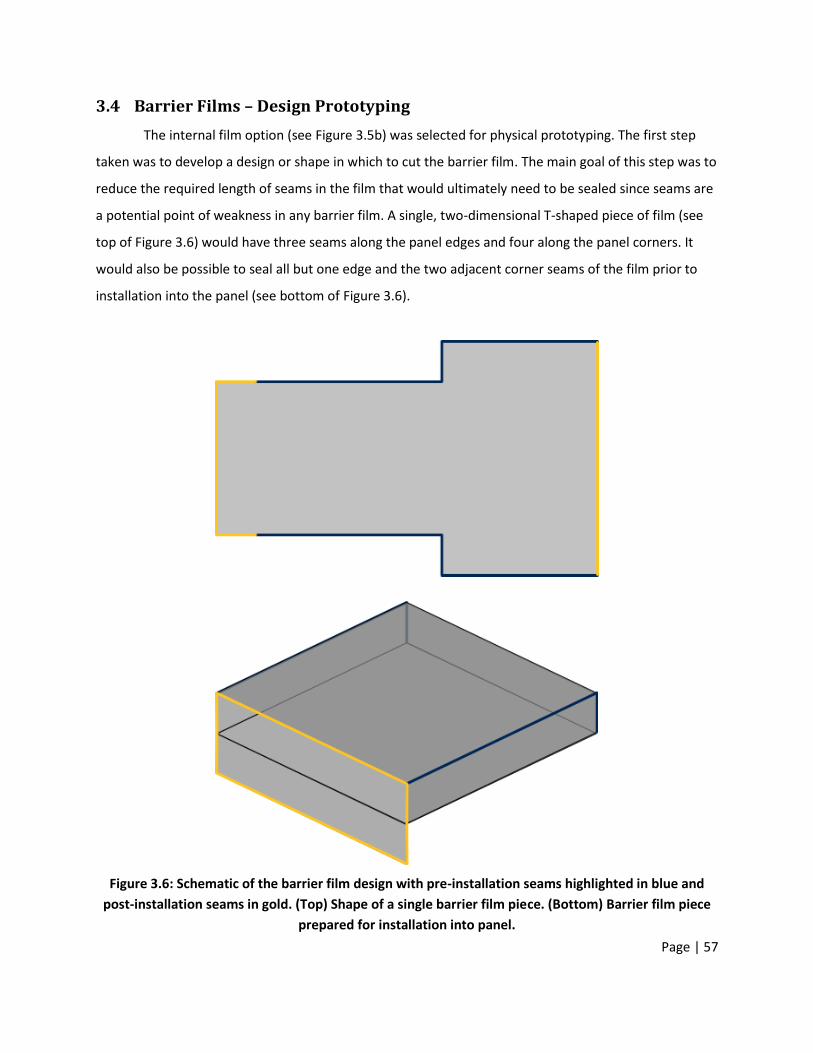
Page | 57
3.4 Barrier Films – Design Prototyping
The internal film option (see Figure 3.5b) was selected for physical prototyping. The first step
taken was to develop a design or shape in which to cut the barrier film. The main goal of this step was to
reduce the required length of seams in the film that would ultimately need to be sealed since seams are
a potential point of weakness in any barrier film. A single, two-dimensional T-shaped piece of film (see
top of Figure 3.6) would have three seams along the panel edges and four along the panel corners. It
would also be possible to seal all but one edge and the two adjacent corner seams of the film prior to
installation into the panel (see bottom of Figure 3.6).
Figure 3.6: Schematic of the barrier film design with pre-installation seams highlighted in blue and
post-installation seams in gold. (Top) Shape of a single barrier film piece. (Bottom) Barrier film piece
prepared for installation into panel.
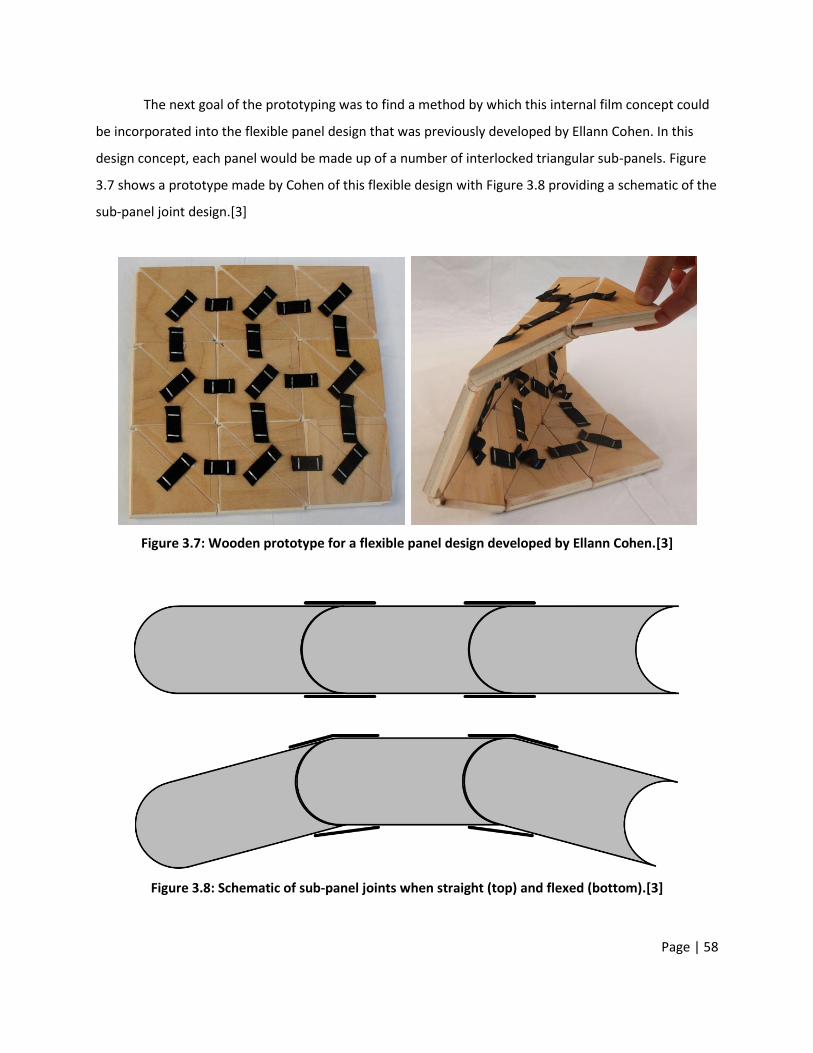
Page | 58
The next goal of the prototyping was to find a method by which this internal film concept could
be incorporated into the flexible panel design that was previously developed by Ellann Cohen. In this
design concept, each panel would be made up of a number of interlocked triangular sub-panels. Figure
3.7 shows a prototype made by Cohen of this flexible design with Figure 3.8 providing a schematic of the
sub-panel joint design.[3]
Figure 3.7: Wooden prototype for a flexible panel design developed by Ellann Cohen.[3]
Figure 3.8: Schematic of sub-panel joints when straight (top) and flexed (bottom).[3]
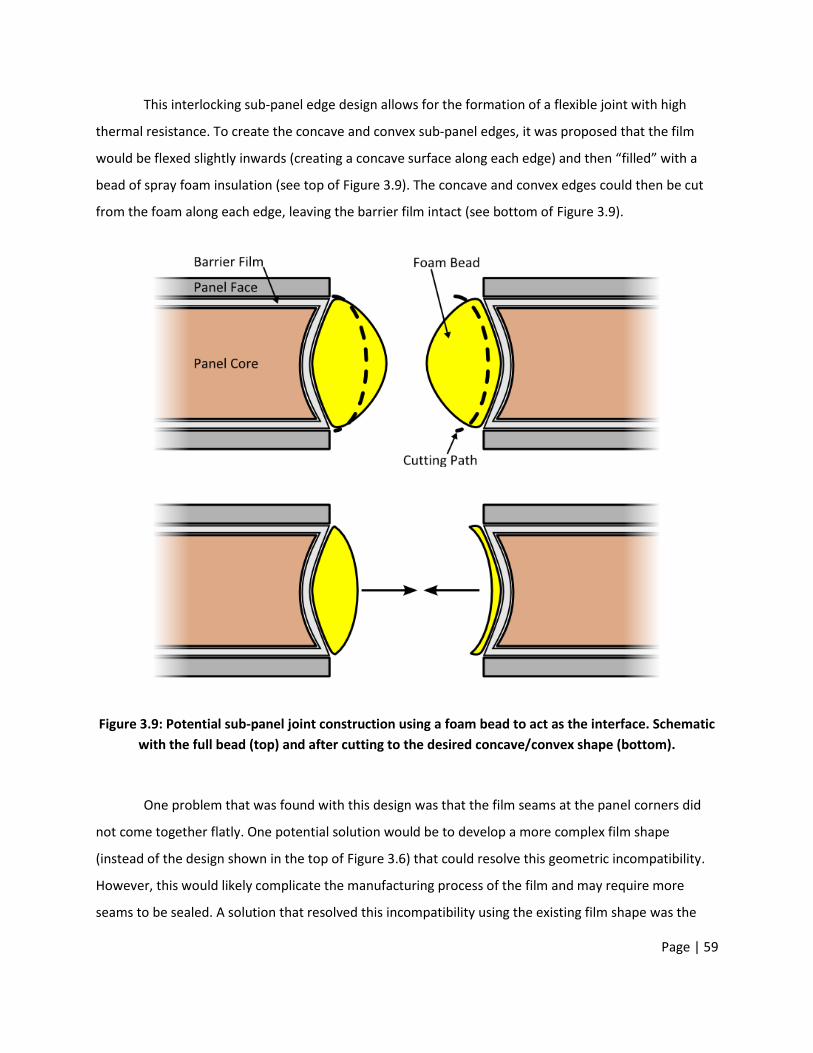
Page | 59
This interlocking sub-panel edge design allows for the formation of a flexible joint with high
thermal resistance. To create the concave and convex sub-panel edges, it was proposed that the film
would be flexed slightly inwards (creating a concave surface along each edge) and then “filled” with a
bead of spray foam insulation (see top of Figure 3.9). The concave and convex edges could then be cut
from the foam along each edge, leaving the barrier film intact (see bottom of Figure 3.9).
Figure 3.9: Potential sub-panel joint construction using a foam bead to act as the interface. Schematic
with the full bead (top) and after cutting to the desired concave/convex shape (bottom).
One problem that was found with this design was that the film seams at the panel corners did
not come together flatly. One potential solution would be to develop a more complex film shape
(instead of the design shown in the top of Figure 3.6) that could resolve this geometric incompatibility.
However, this would likely complicate the manufacturing process of the film and may require more
seams to be sealed. A solution that resolved this incompatibility using the existing film shape was the
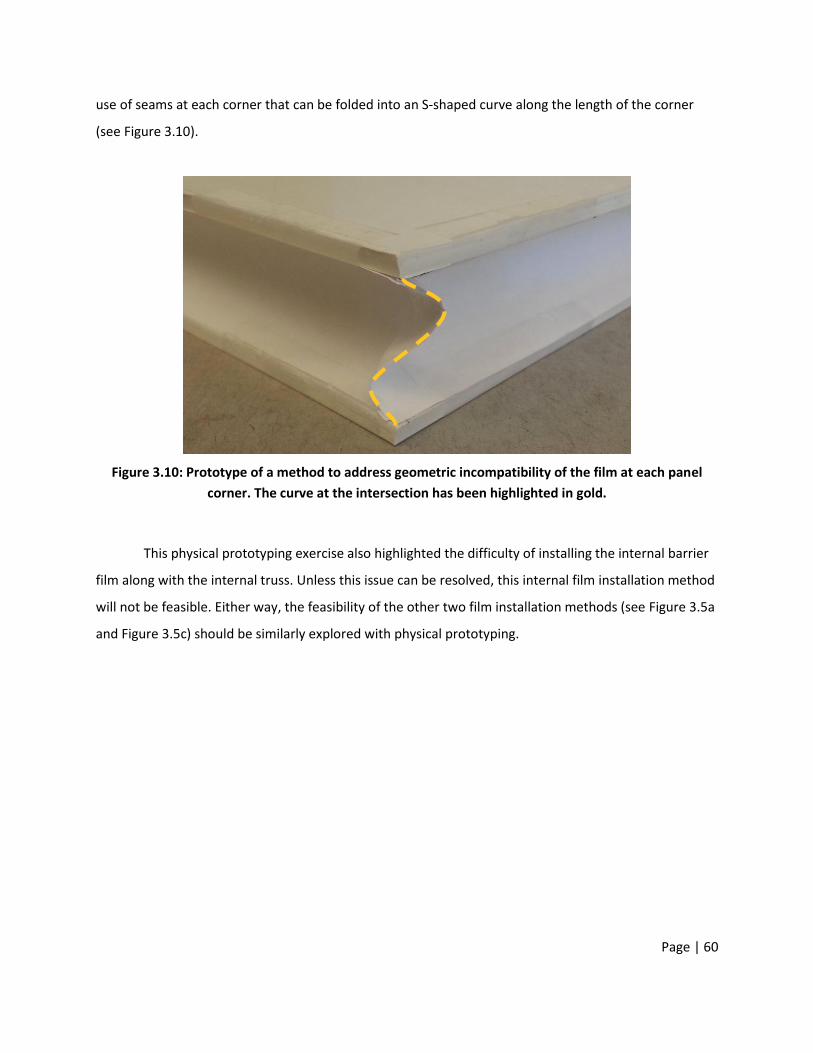
Page | 60
use of seams at each corner that can be folded into an S-shaped curve along the length of the corner
(see Figure 3.10).
Figure 3.10: Prototype of a method to address geometric incompatibility of the film at each panel
corner. The curve at the intersection has been highlighted in gold.
This physical prototyping exercise also highlighted the difficulty of installing the internal barrier
film along with the internal truss. Unless this issue can be resolved, this internal film installation method
will not be feasible. Either way, the feasibility of the other two film installation methods (see Figure 3.5a
and Figure 3.5c) should be similarly explored with physical prototyping.
Page | 61
4 CONCLUSIONS AND FUTURE WORK
Aerogels show great promise for a variety of uses, including thermal insulation. However, the
use of monolithic pieces of aerogel on the scale of typical building materials presents challenges in
terms of manufacturing and product design:
The synthesis process for aerogel requires molds and vessels that would need to be sized
accordingly. The larger the individual aerogel pieces required, the larger the equipment
needed.
Aerogels shrink during the drying stage, even when processed carefully. This can cause
complications when the aerogel is being dried inside of a composite structure (such as was
proposed previously with the MIT panel design). It also requires the sol-gels to be slightly
oversized compared to the desired final dimensions.
The synthesis process includes multiple diffusion-limited steps. Larger, thicker pieces with
lower surface area-to-volume ratios could dramatically increase the processing time and
material costs (e.g., ethanol and carbon dioxide).
Due to the inherent fragility of low-conductivity silica aerogel formulations, there is a
significant risk that a large monolithic piece could be damaged (whether during
manufacturing, transportation, installation and/or use), which could decrease the thermal
performance of the system. A major design consideration therefore would have to be to
minimize this risk of damage.
Based on these concerns regarding monolithic aerogels, the research at MIT was refocused
towards granular aerogel samples. While going with granular samples addressed many of the concerns
with monolithic samples, it brought up some new issues:
Since the aerogel formulations being worked with have a lower thermal conductivity than
air, a bed of aerogel granules will always have a higher conductivity than a monolithic piece
of the same aerogel. Therefore, the granule bed will likely need to be compressed to
minimize intergranular voids.
Monolithic aerogel samples showed significant improvements in their thermal performance
at modestly reduce air pressures; previous testing of aerogel granules, however, showed
Page | 62
only minimal improvements until much lower pressures were reached. Therefore, before a
reduced-pressure, granule-filled panel was going to be considered, it would need to be
demonstrated that such a system would not require such low pressures.
Assuming the granules will need to be packed into the panel (rather than simply loose-
filled), a method will need to be devised to assemble the panels in such a way that the
granules are compressed as needed when installed.
4.1 Conclusions
The aerogel research at MIT continues to work towards demonstrating the feasibility of a new
aerogel-based thermal insulation panel system. Over the last two years, this research has focused on
addressing the above-listed concerns regarding granular aerogels. This research has demonstrated the
thermal conductivity of aerogel granules using the hot-wire method across a range of compression for
both a commercial product from Cabot and a formulation developed at MIT. Under compression, it was
found that the granule bed appears to reach a minimum point in the range of the monolithic density of
the aerogel itself. For Cabot (with a monolithic density in the range of 120-180 kg/m3) this occurred
around 150 kg/m3 at 13 mW/m-K. The research was unable to reach a minimum point for the MIT
granules, but the lowest conductivity recorded was 12 mW/m-K (monolithic samples of MIT aerogels
were previously measured to be 10 mW/m-K at ambient conditions). Overall, the MIT granules were
able to achieve similar conductivities as the Cabot granules, but at bed densities about 20-30 kg/m3
lower; this indicates the potential for material (and therefore cost) savings if this product were to be
commercialized.
The same Cabot and MIT granular samples were similarly tested inside of a vacuum chamber.
Again the MIT granules appeared to achieve similar conductivity levels at bed densities 20 kg/m3 lower
than the Cabot samples. The granular samples showed an initial decrease in conductivity at small
pressure drops, then an almost plateau in conductivity until the decreasing again below about 0.01 atm.
At higher compression levels, however, the conductivity versus bed density curve began to more closely
mimic the exponential shape seen with monolithic samples. For example, the curve for the MIT granular
samples at 132 kg/m3 looked similar to the MIT monolithic curve (150 kg/m3), though at conductivities
2-3 mW/m-K higher.
Guarded hot-plate thermal conductivity testing was also performed on aerogel-filled panels
using a LaserComp system. This testing provided some initial corroboration for previous analytical work.
Page | 63
It was previously determined by Ellann Cohen that the transient hot-wire tests should underestimate
the contribution of radiative heat transfer through a sample compared to the steady-state hot-plate test
by up to 3.3 mW/m-K. The thermal conductivities calculated from the LaserComp results were up to 1.5
mW/m-K greater than the corresponding hot-wire values. Thomas Goutierre designed the internal truss
system to contribute no more than 2 mW/m-K to the conductivity of the panel core. Comparing two
pairs of LaserComp results, this value was calculated at either 4.6 mW/m-K or 1.5 mW/m-K. Further
testing will need to be done to resolve this discrepancy.
Finally, work was also done to address various design concerns with the panel system,
specifically regarding the incorporation of a barrier film to support an internal vacuum. Analyses were
done into the potential thermal bridging effects and gas diffusion rates based on current design
parameters for the panel system. Based on a simple barrier film system, thermal bridging was found to
decrease the whole-panel resistance by no more than 10%. The maximum allowable oxygen
transmission rate that would still preserve sufficient internal vacuum over the life of the panel was
calculated to be about 0.45 cc/m2-day-atm; commercial barrier films used in VIP systems have rated
oxygen transmission rates on the order of 0.1 cc/m2-day-atm. While promising, these were only
preliminary analytical estimates and they will need to be followed up with more robust analytical and
experimental work. Physical prototyping of an internal film design highlighted a number of issues that
must be addressed for the design to be feasible (such as how to minimize the number of seams to seal
and how to provide the concave/convex edges needed for the flexible joint design while keeping the
barrier film intact). Potential solutions were identified for most of these issues, but the main unresolved
problem with this design is how the internal film will interact with the internal truss without
compromising the integrity of the barrier film or the mechanical properties of the panel.
4.2 Future Work
Over the last two years, the research at MIT has progressed the development of a new, high-
performance panelized aerogel insulation system as part of the DuPont-MIT Alliance. This work is far
from over, however. Some necessary next steps and promising avenues of research include:
Aerogel synthesis: Currently, the MIT granules are made manually from small monolithic
samples. This is an imprecise and time-consuming process. It would be valuable to develop a
method to synthesize the aerogel samples as granules. There are also a number of ways that
Page | 64
the synthesis process could be expedited, though it has not been verified which of these
options can be implemented without negatively impacting the performance of the final
aerogel product.
Hot-wire testing: It would be valuable to obtain a full conductivity versus bed density curve
for MIT granules past their minimum point and to continue the vacuum chamber testing
across a broader range of bed densities and air pressures. The vacuum testing could also be
done at different gas mixtures (to account for different diffusion rates of oxygen and
nitrogen) to see if that impacts the overall conductivity.
LaserComp testing: Additional testing is needed under new and previously-tested conditions
in order to obtain a more robust data set with which to analyze the analytical expectations
of the system. Also, it would be interesting to test a panel system with radiant barriers
installed on the inside faces to observe the potential to reduce radiative heat transfer
through the panel.
Barrier film analyses: More robust analytical work needs to be done into the thermal
bridging and gas diffusion behavior of relevant barrier film systems. Eventually,
experimental work will be required.
Panel design: Physical prototyping uncovered design problems and potential solutions that
had not previously been identified. This work should continue, including exploring other film
installation methods, in order to better transfer the laboratory results into a fully functional
insulation product.

Page | 65
5 REFERENCES
[1] Architecture 2030, “Solution: The Building Sector.” [Online]. Available:
http://architecture2030.org/the_solution/buildings_solution_how. [Accessed: 08-May-2013].
[2] D&R International, Ltd., “2011 Buildings Energy Data Book,” Mar. 2012.
[3] E. Cohen, “Thermal Properties of Advanced Aerogel Insulation,” Massachusetts Institute of
Technology, 2011.
[4] R. T. Bynum, Insulation Handbook. New York: McGraw-Hill, 2001.
[5] Aspen Aerogel, “Aspen Aerogel Spaceloft Data Sheet.” [Online]. Available:
http://www.aerogel.com/products/pdf/Spaceloft_DS.pdf. [Accessed: 08-May-2013].
[6] Cabot Corporation, “Data Sheet - Cabot aerogel particles.” [Online]. Available: http://www.cabot-
corp.com/wcm/download/en-
us/ae/Data%20Sheet%20Cabot%20Aerogel%20P100_200_300_400_4_2011_FINAL.pdf. [Accessed:
07-May-2013].
[7] Cabot Corporation, “Data Sheet - Cabot Thermal Wrap.” [Online]. Available: http://www.cabot-
corp.com/wcm/download/en-
us/ae/Data%20Sheet%20Thermal%20Wrap%20TW350_600_800_4_2011_FINAL.pdf. [Accessed: 09-
May-2013].
[8] ThermoCor, “ThermoCor Vacuum Insulated Panels.” [Online]. Available:
http://thermocorvip.com/vacuum-insulation-panels/. [Accessed: 09-May-2013].
[9] NanoPore, “NanoPore Vacuum Insulation Panels and Inserts.” [Online]. Available:
http://www.nanopore.com/documents/NanoPore%20VIP.pdf. [Accessed: 09-May-2013].
[10] S. S. Kistler, “Coherent Expanded Aerogels and Jellies,” Nature, vol. 127, no. 3211, p. 741, May 1931.
[11] Aerogels Handbook. New York: Springer Science+Business Media, LLC, 2011.
[12] S. S. Kistler and A. G. Caldwell, “Thermal Conductivity of Silica Aerogel,” Industrial & Engineering
Chemistry, vol. 26, no. 6, pp. 658–662, 1934.
[13] Aerogel.org, “What is Aerogel?” [Online]. Available: http://www.aerogel.org/?p=3. [Accessed: 09-
May-2013].
[14] L. R. Glicksman, “Heat Transfer in Foams,” in Low Density Cellular Plastics: Physical Basis of
Behaviour, 1st ed., London; New York: Chapman & Hall, 1994, pp. 104–152.
[15] Aerogel.org, “How is Aerogel Made?” [Online]. Available: http://www.aerogel.org/?p=4. [Accessed:
08-May-2013].
Page | 66
[16] Y. Zuo, “Preparation of Silica Aerogels with Improved Mechanical Properties and Extremely Low
Thermal Conductivities through Modified Sol-Gel Process,” Massachusetts Institute of Technology,
2010.
[17] T. Goutierre, “Advanced Thermal Insulation for Energy Efficient Buildings: Structural Performance of
Aerogel Composite Panels,” Massachusetts Institute of Technology, 2011.
[18] K. Chen, “Truss Core Sandwich Panels with Compacted Aerogel Insulation,” Massachusetts Institute
of Technology, 2013.
[19] M. J. Assael, K. D. Antoniadis, and W. A. Wakeham, “Historical Evolution of the Transient Hot-Wire
Technique,” International Journal of Thermophysics, vol. 31, no. 6, pp. 1051–1072, 2010.
[20] H. S. Carslaw, Conduction of Heat in Solids, 2nd ed. Oxford: New York: Clarendon Press; Oxford
University Press, 1986.
[21] “LaserComp FOX304: Thermal Conductivity Instrument.” LaserComp, Inc.
[22] K. Collins (LaserComp), Email: “RE: Information request on FOX304 system,” 05-Jun-2012.
[23] McMaster-Carr, “More About Plastics,” 2012. [Online]. Available:
http://www.mcmaster.com/#8574kac/=mrj9os. [Accessed: 15-May-2013].
[24] Cambridge Engineering Selector. Granta Design Limited, 1999.
[25] R. Weast, Handbook of Chemistry and Physics, 66th ed. Chemical Rubber Company, 1985.
[26] “Tests of thin samples stacked (using FOX50 instrument).” LaserComp, Inc., 23-Oct-2008.
[27] W. P. Lewis (Cabot), Email: “Fw: The following web inquiry has been sent to your attention,” 31-Jan-
2012.
[28] Micromeritics Instrument Corporation, “Gas Adsorption Theory.” [Online]. Available:
http://www.micromeritics.com/repository/files/gas_adsorption_theory_poster.pdf. [Accessed: 07-
May-2013].
[29] “IB-Film General Brochure 2012.” Dai Nippon Printing Company, 21-Mar-2012.
[30] D. G. Cahill, S. M. Lee, and T. I. Selinder, “Thermal Conductivity of κ-Al2O3 and α-Al2O3 Wear-
Resistant Coatings,” Journal of Applied Physics, vol. 83, no. 11, pp. 5783–5786, 1998.
[31] INEOS Olefins and Polymers USA, “Typical Engineering Properties of HDPE.pdf.” [Online]. Available:
http://www.ineos.com/Global/Olefins%20and%20Polymers%20USA/Products/Technical%20inform
ation/Typical%20Engineering%20Properties%20of%20HDPE.pdf. [Accessed: 10-May-2013].
[32] “Polyethylene Terephthalate (Polyester, PET, PETP) Material Information.” [Online]. Available:
http://www.goodfellow.com/E/Polyethylene-terephthalate.html. [Accessed: 13-May-2013].
[33] D. Kaczmarek, “Barrier films for vacuum insulation panels (VIP),” 7th International Vacuum
Insulation Symposium, p. 91, 2005.
[34] A. F. Mills, Mass Transfer. Upper Saddle River, N.J.: Prentice Hall, 2001.
Page | 67
[35] E. C. Suloff, “Sorption Behavior of an Aliphatic Series of Aldehydes in the Presence of Poly(ethylene
terephthalate) Blends Containing Aldehyde Scavenging Agents,” 06-Dec-2002. [Online]. Available:
http://scholar.lib.vt.edu/theses/available/etd-12042002-124439/. [Accessed: 14-Jun-2012].
[36] “Air Composition,” The Engineering Toolbox. [Online]. Available:
http://www.engineeringtoolbox.com/air-composition-d_212.html. [Accessed: 13-May-2013].
[37] D. K. Murphy, “Are Nitrogen Molecules Really Larger Than Oxygen Molecules?” [Online]. Available:
http://www.getnitrogen.org/pdf/graham.pdf. [Accessed: 09-May-2013].
[38] A. Binz and A. Moosmann, “Vacuum Insulation in the Building Sector: Systems and Applications,”
IEA/ECBCS Annex, vol. 39, Dec. 2005.
[39] H. Simmler and S. Brunner, “Vacuum insulation panels for building application: Basic properties,
aging mechanisms and service life,” Energy and Buildings, vol. 37, no. 11, pp. 1122–1131, Nov. 2005.
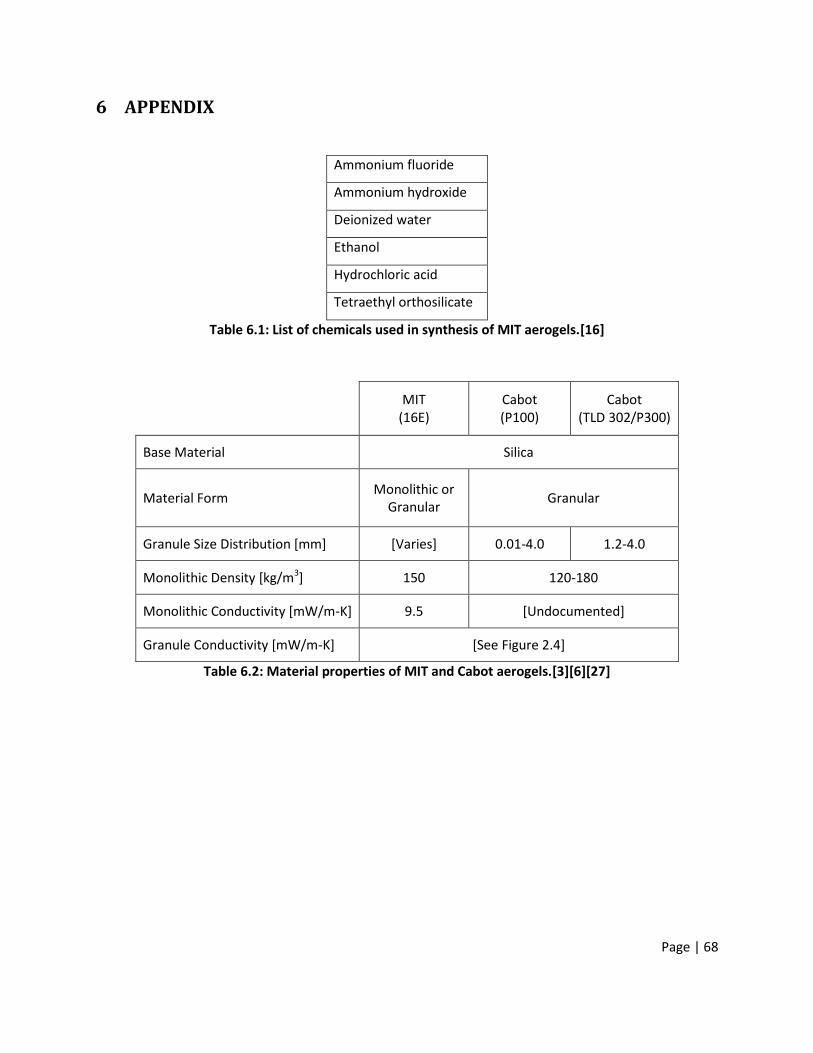
Page | 68
6 APPENDIX
Ammonium fluoride
Ammonium hydroxide
Deionized water
Ethanol
Hydrochloric acid
Tetraethyl orthosilicate
Table 6.1: List of chemicals used in synthesis of MIT aerogels.[16]
MIT
(16E) Cabot (P100)
Cabot (TLD 302/P300)
Base Material Silica
Material Form Monolithic or
Granular Granular
Granule Size Distribution [mm] [Varies] 0.01-4.0 1.2-4.0
Monolithic Density [kg/m3] 150 120-180
Monolithic Conductivity [mW/m-K] 9.5 [Undocumented]
Granule Conductivity [mW/m-K] [See Figure 2.4]
Table 6.2: Material properties of MIT and Cabot aerogels.[3][6][27]