thermal integration of different compression-train
TRANSCRIPT
Vol.:(0123456789)1 3
Clean Technologies and Environmental Policy (2021) 23:1641–1654 https://doi.org/10.1007/s10098-021-02056-5
ORIGINAL PAPER
Thermal integration of different compression‑train configurations for coal‑fired power plant with carbon capture
Gerardo G. Esquivel‑Patiño1 · Fabricio Nápoles‑Rivera1
Received: 29 May 2020 / Accepted: 15 January 2021 / Published online: 6 March 2021 © The Author(s), under exclusive licence to Springer-Verlag GmbH Germany, part of Springer Nature 2021
AbstractDifferent compression-train configurations in a coal-fired power plant with CO2 capture were thermally integrated to reduce the energetic impact of the capture process and global warming potential for the life cycle of the power plant and the produc-tion of the absorbent. The thermal integration was performed using formal optimization techniques, with consideration given to all the available streams for the different compression-train configurations. The different compression-train configurations produced different temperature levels in the process streams and different heat exchanger networks, which included the power plant, compression train, and waste energy recovery technologies, such as organic Rankine cycles. The initial observation was that for the different configurations of the compression trains, the best result in terms of the net power output was 374.26 MWe, with a reduction of 84.3% in the global warming potential compared with a power plant without carbon capture. This result was obtained for an eight-stage train with integrally geared centrifugal compressors. Subsequently, with thermal integration, the configuration that included advanced supersonic shockwave compressors exhibited the best conditions for the heat transfer between hot and cold streams, achieving a reduction of 84.65% in the global warming potential and a net power output of 382.9 MWe.
* Fabricio Nápoles-Rivera [email protected]
1 Chemical Engineering Department, Universidad Michoacana de San Nicolás de Hidalgo, 58060 Morelia, Michoacán, Mexico
1642 G. G. Esquivel-Patiño, F. Nápoles-Rivera
1 3
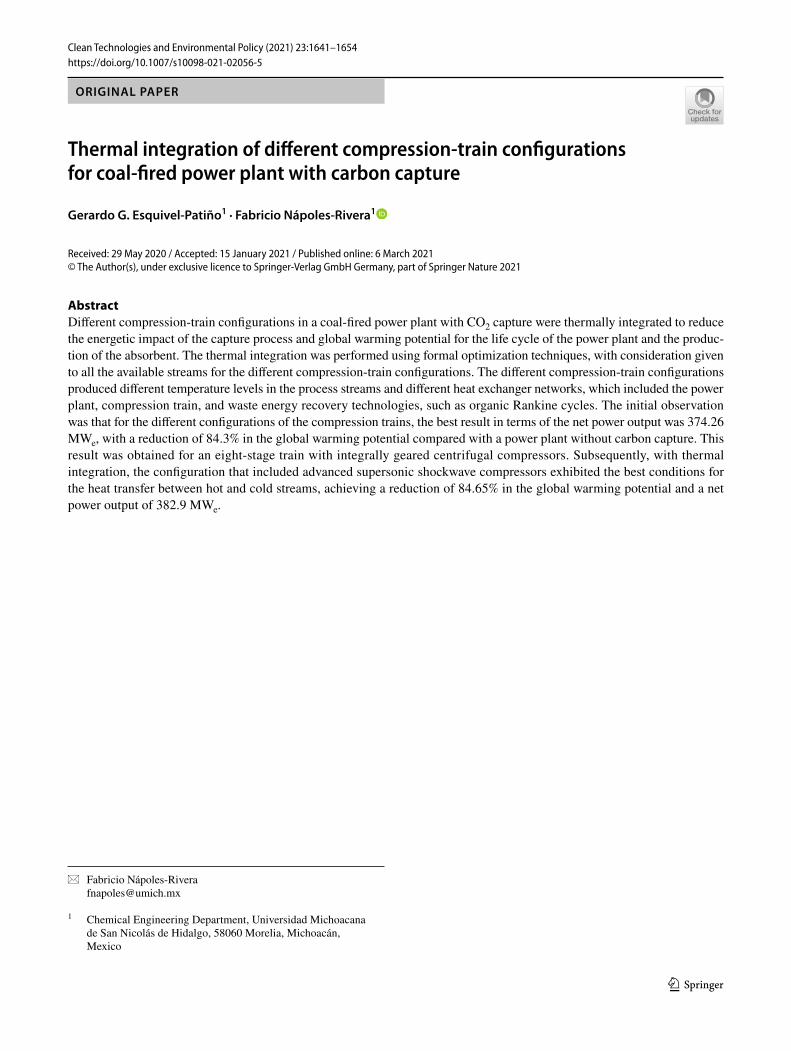
Graphic abstract
Coal-fired power plant
FGD
GWP
Coal Combus�on gases
MEA
CO2
LP STEAM
Hot water
GWP
Water to HSRG
ORC
Compression Train
CO2 capture
MEA Produc�on
Hot streams
Environmental Energe�c Economic
Keywords Coal-fired power plant · Compression train · Thermal integration · Global warming potential
AbbreviationsCOE Cost of electricityCFPP Coal-fired power plantCTC Compression-train configurationDOE/NETL Department of Energy and National Energy
Technology LaboratoryGWP Global warming potentialHEN Heat exchanger networkHRSG Heat recovery steam generatorMEA MonoethanolamineORC Organic Rankine cyclePCC Post-combustion carbon capture
Introduction
Electric power is primarily produced through processes that use fossil fuels. Coal-fired power plants (CFPPs) account for 70% of the total energy produced by these processes (Hanak
et al. 2015), but such power plants have lower heating value efficiencies of approximately 45% (Li et al. 2019). These processes generate the largest proportion of electrical power and emissions among all the power generation technolo-gies used and even when the CFPP power generation had a diminution of 3% in 2019 mainly due to the COVID-19 pandemic, coal is still the leader fuel in electricity generation (IEA 2020b). In contrast to that diminution, it was seen an increment in the use of coal in Asia, specifically in China, where the use of coal in power plants has exceeded 50% of the domestic coal consumption (Wang et al. 2021); also there are more CFPPs under construction or approved to be built (Ouyang et al. 2021), maintaining the 36% of the total power generation for the CFPPs (IEA 2020a). Around the world, it is expected a 2.6% rise in global coal demand in 2021 because of an expected recovery in the world economy, driven by higher electricity demand and industrial output. Because of this, countries like the USA and countries in Europe may have their first increases in coal consumption

1643Thermal integration of different compression‑train configurations for coal‑fired power…
1 3
in nearly a decade (IEA 2021). Governments and companies around the world have goals to achieve net-zero emissions in the coming decades, more specifically on 2050 (GCCSI 2020); achieving this target could prevent the estimates of 1.5 °C of global warming between 2030 and 2052 if the growth continues at the current rate (IPCC 2019). It became fundamental to solve the dilemma of how to reconcile the rising demand for energy with the needs of reducing the greenhouse gas emissions and fight the global climate change (Gallagher et al. 2021). That is why, all possible alternatives must be considered to reduce the greenhouse emissions but maintaining an adequate level of power gen-eration to ensure that society’s requirements continue to be satisfied. Analyzing carbon capture processes has been an important strategy for achieving these goals (Pacala and Socolow 2004; Desideri and Antonelli 2014; Zhai et al. 2017). However, further research is needed to make the cou-pling of power plants and carbon capture processes sustain-able via methods such as thermal integration, environmental analysis, safety analysis, and optimization (Gingerich and Mauter 2018). In addition, practical alternatives for achiev-ing environmental and power goals have been proposed. Var-ious methods or processes for CO2 capture have been studied to determine the best configuration (Araujo and Medeiros 2017). These include the oxy-combustion process, where the power plant suffers an energy penalty depending on the conventional combustion (Xiong et al. 2011); CaO-based capture, where a large amount of CO2 is captured in a fluid-ized-bed process (Wang et al. 2011a, 2011b); and processes that use membranes (Gong et al. 2017), ionic liquids (Fara-hipour and Karunanithi 2014), and microalgae (Sarat-Chan-dra et al. 2018). Within these methods, the most advanced technology used for CO2 sequestration is a process involving post-combustion capture using chemical absorption. This technology has been investigated with different absorbents, including ammonia (Linnenberg et al. 2012), glycerol as a green absorbent (Flowers et al. 2017), aqueous potassium carbonate (Ghosh et al. 2009), and alcohol amines such as monoethanolamine (MEA), diethanolamine, and triethanola-mine (Suleiman et al. 2016; Boucif et al. 2008; Nuchitprasit-tichai and Cremaschi 2013; Cormos et al. 2018; Wang et al. 2011a, 2011b). Many investigations have been conducted on these types of amines in water solutions and using mixtures of two or more amines. The kinetics and thermodynamics of the amines were studied via simulations and pilot plants (Choi et al. 2009; Zhang et al. 2002; El-Hadri et al. 2017). The main equipment used in the post-combustion process is an absorption tower, in which the CO2 in the combus-tion gases reacts with an absorbent that is regenerated using a stripping column. The solvent is recovered and recircu-lated, and the CO2 is separated and subsequently sent to the compression train as a stream with a CO2 concentration of ≥ 90%. Because of the large amount of CO2 generated in
a CFPP, the main obstacle to its sustainable capture is the energy expenditure due to the regeneration of the solvent and the power expended in the compression of the CO2 stream (Goto et al. 2013). As previously mentioned, many alterna-tive solvents have been considered, among which MEA is currently the most widely used (Zhang et al. 2017). Despite the potential for reducing CO2 emissions with a carbon cap-ture process, a reduction in the net power output is inevitable with the use of these systems. Several studies have focused on this important limitation.
Parvareh et al. (2014) comprehensively reviewed the integration of solar energy in CFPPs with carbon capture. The main aim of using solar energy is to reduce the energy penalty for the use of carbon capture technologies, which indicates the importance of developing alternative methods to reduce the net power output loss. Luo et al. (2015) exam-ined the heat transfer between the streams of the compres-sion train using the heat recovery steam generator (HRSG) and stripper reboiler of the capture process. Farajollahi and Hossainpour (2017) proposed the use of organic Rankine cycles (ORCs) to exploit the low-grade heat and increase the thermal efficiency of the plant; however, the process streams were matched heuristically. Sanchez del Rio et al. (2017) proposed the integration of a CFPP with post-combustion carbon capture (PCC) using a gas turbine windbox. In this configuration, only a single match between streams was proposed. Oh et al. (2018) proposed a system integration approach for reducing the energy penalty of capture pro-cesses in a CFPP and compared their results with those for a pilot-scale plant.
Although previous studies have addressed process inte-gration in CFPPs with carbon capture and compression, none of them involved the use of formal optimization tech-niques to identify the most suitable matches between process streams. In the best cases, previously reported works used heuristic approaches to determine the optimal matches, and a maximum of three streams were considered in the heat integration.
Methods have been proposed for the formal optimization of a heat exchanger network (HEN). For example, Khal-ilpour and Abbas (2011) performed a pinch analysis for a 227 MW CFPP. However, it is important to note that pinch analysis is a sequential approach in which the number of heat exchangers and the area are not optimized. Hanak et al. (2014) performed a heat integration and exergy analysis for a CFPP with PCC and a compression train with nine com-pression stages.
This study analyzed a CFPP with CO2 capture and differ-ent compression-train configurations (CTCs). Each of these configurations offered an alternative for thermal integration, which was performed using formal mathematical program-ming techniques because of the different levels of energy that could be transferred as a result of the changes in the

1644 G. G. Esquivel-Patiño, F. Nápoles-Rivera
1 3
number and type of compressors, temperature level in each stage, and pressure ratios. This allowed the energy penalties to be reduced. Thus, all the possible matches between the process streams were considered, which maximized the heat recovery and minimized the number of heat exchangers and their area. Furthermore, the addition of a low-grade heat recovery system such as an ORC was considered to increase the overall thermal efficiency and decrease the energy pen-alty of the capture process. The steam that was used to regenerate the solvent is considered as one of the streams that can be integrated with the ORC, and this is because the temperature level is not high enough to be integrated with other part of the process. This allowed a heat transfer with the ORC, which is a practical method for using waste energy (Tchanche et al. 2011). The variable levels of cap-ture were subsequently subjected to sensitivity analyses to determine the variation in the most important results based on the decrease or increase in the amount of CO2 (in kg/s) at the end of the capture and compression process.
Materials and methods
The following simulations were conducted to calculate the parameters:
(a) A 550 MW CFPP,(b) A PCC MEA-based process,(c) A CO2 compression train with different configurations,
(d) An ORC with R245FA as the working fluid.
When all the parameters were obtained, the thermal integration was performed using SYNHEAT (Yee and Grossmann 1990). SYNHEAT consists of a mixed-integer nonlinear mathematical model programmed in GAMS that calculates the optimal HEN by minimizing the cost, which includes the investment cost, annual cost, and utility cost. Thereby, the available hot and cold streams of a process were matched, and the heating and cooling requirements were sat-isfied. Table 1 presents the main economic parameters used in the model, which were obtained from the study of Gonza-lez-Bravo et al. (2015). This study principally modified the numbers of hot and cold streams and their operational con-ditions according to each compression-train configuration (CTC) to obtain the optimal HEN for each scenario studied.
Finally, the global warming potential (GWP) and power output were calculated for the base cases with a fixed amount of CO2 capture (90%). Sensitivity analyses were then per-formed with varying amounts of CO2 capture using the model analysis tools of Aspen Plus™.
Aspen Plus™ simulations
The simulation depicted in Fig. 1 was conducted for a CFPP with a capacity of 550 MW using the parameters used by Oh et al. (2018) and those used in case 11 of a supercritical power plant in a report published by the U.S. Department of Energy and National Energy Technology Laboratory (DOE/NETL) (2013). Thus, all the necessary data for the thermal integration, such as the stream temperatures and heat capaci-ties, were obtained for the capture process, in which the flow of combustion gases from the thermoelectric plant was fed to the absorber with a 35 wt% MEA as absorbent, using the models and parameters employed by Zhang et al. (2009) for the capture process simulation. Separate simulations of steam turbines with three levels of pressure were carried out with the parameters of the DOE/NETL report, HP tur-bine (24.23 MPa/593 °C), IP turbine (4.52 MPa/593 °C),
Table 1 Cost parameters for SYNHEAT model
Parameter Value
Heating cost 5 $/109 JCooling cost 4 $/109 JFixed cost of exchangers 5500 $/yearFixed cost of heaters 150 $/yearFixed cost of coolers 150 $/year
AIR-FANS
FURNACE FGD
ABS STR
CO2AIR
COAL
ASH
FLUEGAS CO2-E
L-MEA
Fig. 1 Simulation of CFPP with CO2 capture process
1645Thermal integration of different compression‑train configurations for coal‑fired power…
1 3
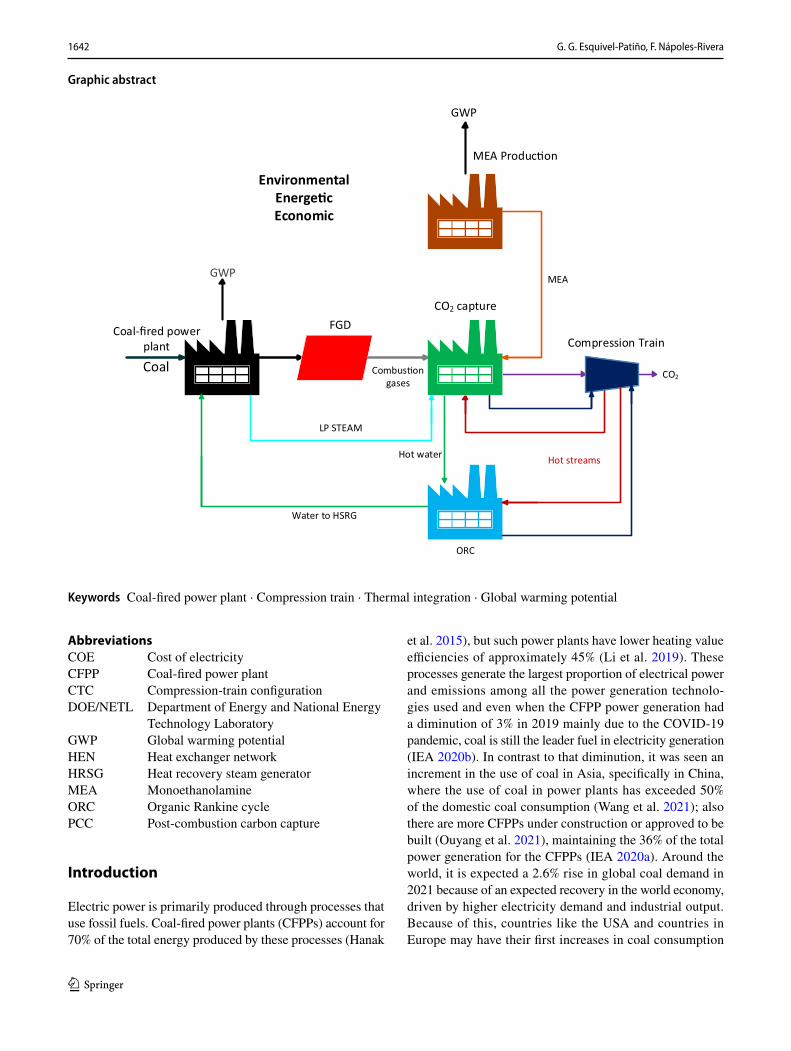
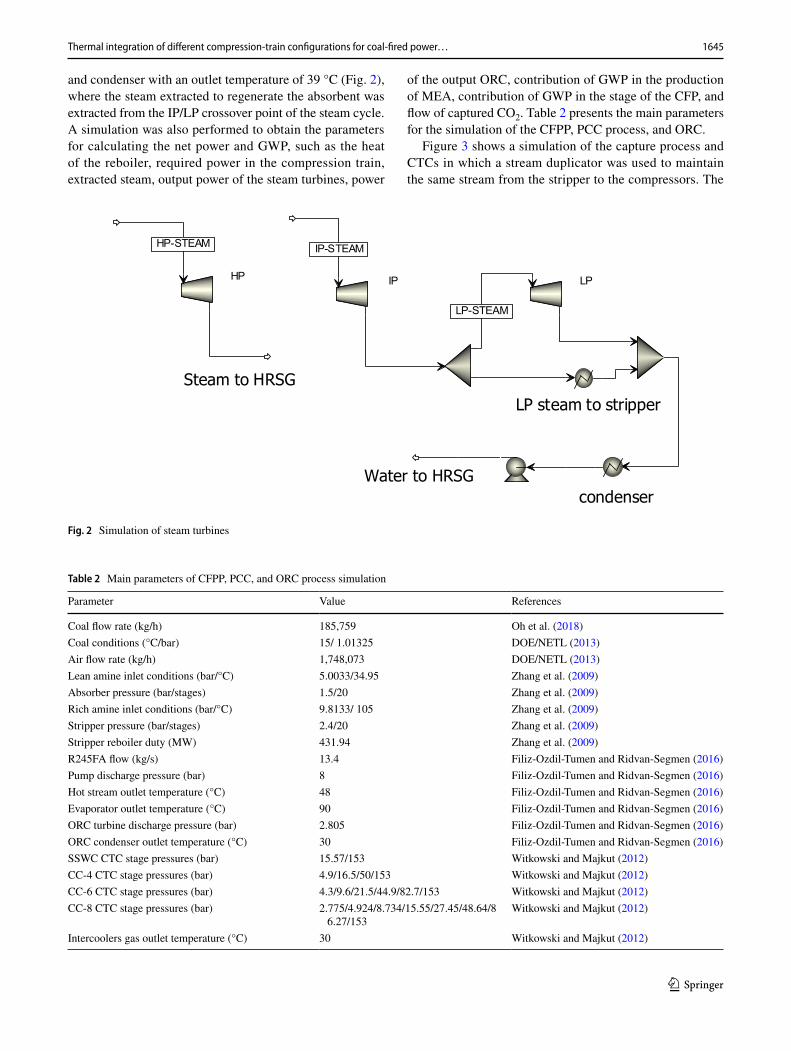
and condenser with an outlet temperature of 39 °C (Fig. 2), where the steam extracted to regenerate the absorbent was extracted from the IP/LP crossover point of the steam cycle. A simulation was also performed to obtain the parameters for calculating the net power and GWP, such as the heat of the reboiler, required power in the compression train, extracted steam, output power of the steam turbines, power
of the output ORC, contribution of GWP in the production of MEA, contribution of GWP in the stage of the CFP, and flow of captured CO2. Table 2 presents the main parameters for the simulation of the CFPP, PCC process, and ORC.
Figure 3 shows a simulation of the capture process and CTCs in which a stream duplicator was used to maintain the same stream from the stripper to the compressors. The
HP IP LP
HP-STEAM IP-STEAM
LP-STEAM
Fig. 2 Simulation of steam turbines
Table 2 Main parameters of CFPP, PCC, and ORC process simulation
Parameter Value References
Coal flow rate (kg/h) 185,759 Oh et al. (2018)Coal conditions (°C/bar) 15/ 1.01325 DOE/NETL (2013)Air flow rate (kg/h) 1,748,073 DOE/NETL (2013)Lean amine inlet conditions (bar/°C) 5.0033/34.95 Zhang et al. (2009)Absorber pressure (bar/stages) 1.5/20 Zhang et al. (2009)Rich amine inlet conditions (bar/°C) 9.8133/ 105 Zhang et al. (2009)Stripper pressure (bar/stages) 2.4/20 Zhang et al. (2009)Stripper reboiler duty (MW) 431.94 Zhang et al. (2009)R245FA flow (kg/s) 13.4 Filiz-Ozdil-Tumen and Ridvan-Segmen (2016)Pump discharge pressure (bar) 8 Filiz-Ozdil-Tumen and Ridvan-Segmen (2016)Hot stream outlet temperature (°C) 48 Filiz-Ozdil-Tumen and Ridvan-Segmen (2016)Evaporator outlet temperature (°C) 90 Filiz-Ozdil-Tumen and Ridvan-Segmen (2016)ORC turbine discharge pressure (bar) 2.805 Filiz-Ozdil-Tumen and Ridvan-Segmen (2016)ORC condenser outlet temperature (°C) 30 Filiz-Ozdil-Tumen and Ridvan-Segmen (2016)SSWC CTC stage pressures (bar) 15.57/153 Witkowski and Majkut (2012)CC-4 CTC stage pressures (bar) 4.9/16.5/50/153 Witkowski and Majkut (2012)CC-6 CTC stage pressures (bar) 4.3/9.6/21.5/44.9/82.7/153 Witkowski and Majkut (2012)CC-8 CTC stage pressures (bar) 2.775/4.924/8.734/15.55/27.45/48.64/8
6.27/153Witkowski and Majkut (2012)
Intercoolers gas outlet temperature (°C) 30 Witkowski and Majkut (2012)

1646 G. G. Esquivel-Patiño, F. Nápoles-Rivera
1 3
device before absorber B2 is a splitter that ensures that the relationships between the lean solvent and the flue gas remain constant for all the points considered in the analy-sis. The simulation parameters for all the compression con-figurations were obtained from the study of Witkowski and Majkut (2012). The first CTC in Fig. 3 corresponds to the advanced supersonic shockwave compressors (SSWCs), and the other three correspond to centrifugal compressors, with the number of compression stages varying from 4 to 8.
A comparison was made of the parameters of case 11 in the DOE/NETL report for the stream of the combustion gases (Stream 18 in the DOE/NETL report). The lean amine stream flux was estimated using the parameters of Oh’s stud-ies on the lean amine ratio (CO2 mol/MEA mol) and a CO2 recovery of 90%, obtaining a lean amine ratio of 0.26 with a total flux of 1681.58 kg/s, and the rich amine ratio resulting of the simulation is 0.43. This study analyzed the impact of coupling the carbon capture to the CFPP with the same feed of coal as in case 11.
The most important results of the base simulation in this study were compared for a base case scenario. The output power of 550.06 MW, specific reboiler heat of 3.43 GJ/tCO2, the reboiler temperature of 108.2 °C and the liq-uid–gas (kg/kg) ratio of 2.86 were close to the values of 550 MW, 3.57 GJ/tCO2, 108 °C and 3.08 obtained by Oh et al., respectively. Additionally, the power output of a base simulation of the ORC (0.2602 MW) was compared with that reported by Filiz-Ozdil-Tumen and Ridvan-Segmen (2016) (0.2604 MW).
The results for the CFPP as a base case scenario for com-parison were also obtained from the simulation. Initially,
the GWP for a CFPP without capture was calculated. The emission was 802.15 e-CO2 g/kWh, and a gross power value of 580.46 MW was obtained from a simulation of the steam turbines. The net power output was calculated using this information and the data on the consumption of energy in the auxiliary services of the plant found in the DOE/NTEL report.
Thermal integration
Figure 4 shows the thermal integration scheme, which con-sidered the possibility of a match between the hot streams of the compression-train section and the cold streams in the amine regeneration process, as well as the streams of the ORC. The hot streams had different temperature levels with different compression configurations. The possibility of using the stream of hot water at the output of the capture process (Fig. 3) in the ORC to generate power was also considered. This stream was generated by the condensa-tion of a stream of low-pressure (LP) steam used in the stripper to regenerate the amine. It was subsequently used as hot liquid water that still had a temperature of approxi-mately 151 °C, because it had a considerable mass flow in the scenario without thermal integration (179.36 kg/s). Its flux decreased according to the thermal integration of each scenario; thus, the amount of steam used in the strip-per reboiler was reduced. The matching between the hot water stream and the ORC was fixed for each scenario, but as the hot water flow differed among the cases studied, the ORC produced different levels of electrical power for the
STRABSB2C-2C-1
C-1-CCC-2-CC C-3-CC C-4-CC
C-4-CC6C-3-CC6C-2-CC6C-1-CC6 C-5-CC6 C-6-CC6
DUPL
C-8-CC8C-7-CC8C-6-CC8C-5-CC8C-1-CC8 C-2-CC8 C-3-CC8 C-4-CC8
CO2-CT
L-MEA
L-CO2
GAS-PCC R-CO2
CO2-E
GAS-MEA
SWC-CO2
CO2-SWC
CO2-4CC
CO2-6CC
CO2-8CC
B4
Fig. 3 Simulation of CO2 capture process with different CTCs

1647Thermal integration of different compression‑train configurations for coal‑fired power…
1 3
different cases. These power values were then added to the results of the thermal integration conducted in SYNHEAT.
Table 3 presents details of the hot and cold streams con-sidered for all the thermal integrations for each CTC. The cold streams were the same for each scenario studied. C1 was the stream at the inlet of the stripper reboiler, and its temperature conditions were obtained from the Aspen Plus simulations. C2 was the stream that was fed into the ORC evaporator, and the hot streams were the compression-train streams of each configuration scenario.
The heat capacity flow rate of each hot and cold stream was calculated from the simulation results and for the sce-nario of ORC evaporator stream C2, whose heat capacity flow rate was initially calculated for a 0.2602 MW ORC. For each scenario studied, the value of the heat capacity flow rate was incremented in the thermal integration in SYN-HEAT until the stream began to consume hot utility instead of using the compression-train hot streams. Thus, the maxi-mum duty transferred to stream C1 in the scenario analyzed without an ORC was maintained.
Calculating GWP and net power output by varying capture level percentages
The scheme for analyzing the GWP and net power output is shown in Fig. 5. The main objective was to observe the variation in the aforementioned parameters according to the decrease in the capture level, which directly affected the amount of greenhouse gases emitted, amount of absor-bent fed, amount of LP steam extracted for the desorption, amount of heat in the reboiler of the stripper, GWP values in the stages considered, global GWP, and production of energy. The simulation results were used to calculate the net energy generated from the process and the GWP for each point in the sensitivity analysis for each CTC. When calcu-lating the GWP, the emissions due to the production of the absorbent and the emissions in the CFPP were considered. The net power was calculated using Eq. (1), which shows the gross power generated in the steam turbines and ORC
PCC
CO2LP STEAM
Hot water
Water to HRSG
ORC
Compression train
Hot streams
CFPP
R245FA
Fig. 4 Thermal integration scheme
Table 3 Hot and cold streams for each scenario studied
Study scenario Hot and cold stream temperatures (°C in/out)
CFPP + PCC + SSWC H1 (254/38) H2 (273/38) C1 (108/118.7) C2 (48/90)CFPP + PCC + CC-4 H1 (136/38) H2 (155/38) H3 (151/38) H4 (154/38) C1 (108/118.7) C2 (48/90)CFPP + PCC + CC-6 H1 (121/38) H2 (110/38) H3 (113/38) H4 (110/38) H5 (98/38) H6 (80/38)
C1 (108/118.7) C2 (48/90)CFPP + PCC + CC-8 H1 (83/38) H2 (89/38) H3 (91/38) H4 (92/38) H5 (93/38) H6 (95/38)
H7 (95/38) H8 (71/38) C1 (108/118.7) C2 (48/90)
Coal-fired power plant
Power produc�onGWP GWP
ORCCompression trainCO2 capture MEA produc�on
Power produc�onPower
consup�onSteam
consup�on
Fig. 5 Scheme of GWP and net power output estimation

1648 G. G. Esquivel-Patiño, F. Nápoles-Rivera
1 3
minus the power values for the auxiliary energy consump-tion (Paux), which is taken from the DOE/NETL and equal to 30.41 MWe; the energy consumption in the compression train (Pcomp), which depends on each study case; and the energy used in the capture process (Pcap), which depends on the LP steam extracted from the HRSG to the PCC. The CFPP efficiency was calculated using Eq. (2), where HVV was taken from the report by Oh et al. and is equal to 27,113 kJ/Kg and Fcoal is the flow rate of coal to the CFPP. The values in equivalent grams of CO2 from the IPCC were used as the parameters, and data from the ECOINVENT database (2019) were used for the absorber emissions. The points considered in the analysis were for capture levels of 90%, 70%, 50%, and 25%, and thermal integration was con-ducted for the SSWC configuration to obtain the GWP and net power output for each point.
To obtain another decision criterion for the CTCs, an
economic analysis was performed in Aspen Plus, in which the equipment cost, capital cost, and annual operation and maintenance cost were calculated in separate simulations for each CTC. Using these data, the cost of electricity (COE) was calculated for each CTC considered. The COEs of the standalone CFPP were identical for all the cases and were calculated using Eq. (3) in the DOE/NETL report.
Here, COE represents the revenue produced by the gen-erator ($/MWh); CCF = 0.124 represents the capital charge factor; TOC represents the total overnight capital (in base-year dollars); OCFIX represents the sum of all the fixed annual operating costs (in base-year dollars); OCVAR rep-resents the sum of all the variable annual operating costs, including the fuel at a capacity factor of 100% (in base-year dollars); CF represents the plant capacity factor, which was
(1)nP = Gross power − (Paux + Pcap + Pcompr)
(2)n =nP
HHV ∗ Fcoal
.
(3)COE =CCF ∗ TOC + OCFIX + OCVAR
CF ∗ MWH.
assumed to be constant (85%) over the operational period; and MWH represents the annual net megawatt-hours of power generated at a 100% capacity factor.
Results and discussion
Table 4 and Fig. 6 present the results of the simulations for a CFPP with carbon capture for all the CTCs, for a capture level of 90% CO2 recovery. The net power output of each scenario differed from that of the CFFP without capture. The first scenario corresponded to the advanced SSWCs, and the subsequent scenarios corresponded to centrifugal compressors (CC-4, 6, and 8).
The net power output decreased by 31–34% for each sce-nario compared with the CFPP without carbon capture and thermal integration, and the GWP decreased by 83–84% for each scenario. The best results for the net power (374.26 MWe) and GWP (a decrease of 84.3%) were obtained for the eight-stage integrally geared centrifugal compressors (CC-8) compared with the power plant without carbon capture. This is because the CC-8 configuration had a lower energy con-sumption. The SSWC configuration had a lower net power output because of the energy consumed to compress the CO2 to make its GWP greater than that of the CC configurations. Figures 7, 8, and 9 show the heat transfer networks obtained for each configuration. Different matches and results were obtained.
Case 1: SSWC configuration
Figure 6 shows the HEN of case 1, in which there were four matches between the hot and cold streams. The main conclu-sions were as follows:
• Steams H1 and H2 were coupled with C1, and 41.578 MW of power was transferred; this reduced the LP steam to be extracted to satisfy the remaining 390.4 MW of heat required for the stripper reboiler oper-ation.
• Streams H1 and H2 were used to evaporate the working fluid in the ORC, which produced 1.526 MW.
Table 4 Results of simulations
Result CFPP CFPP + PCC + SSWC CFPP + PCC + CC-4 CFPP + PCC + CC-6 CFPP + PCC + CC-8
Stripper reboiler duty (MW) – 431.94 431.94 431.94 431.94Power consumed by compressors (MW) – 46.12 42.18 38.45 37.12Net power output (MWe) 550 365.26 369.2 372.93 374.26CO2 captured (kg/s) 110.3 110.3 110.3 110.3 110.3GWP (e-CO2 g/kWh) 802.15 129.07 127.7 126.42 125.97CFPP efficiency (HHV) 39.3% 26.1% 26.38% 26.64% 26.74%

1649Thermal integration of different compression‑train configurations for coal‑fired power…
1 3
• The required consumption of the cold utility to cool the streams of the compression train without thermal integration was 64.249 MW; with the obtained HEN, it decreased to 21.184 MW.
Case 2: CC‑4 configuration
Figure 7 shows the HEN obtained for case 2. There were eight matches between the hot and cold streams. The main results were as follows:
Fig. 6 GWP and net power output results
Fig. 7 HEN for SSWC configu-ration
Fig. 8 HEN for CC-4 configura-tion

1650 G. G. Esquivel-Patiño, F. Nápoles-Rivera
1 3
• H1, H2, H3, and H4 were coupled with C1, and the heat transfer between them was 19.409 MW; this reduced the amount of LP steam that needed to be extracted to pro-vide the remaining 412.53 MW of heat required for the stripper reboiler operation.
• The heat in streams H1, H2, H3, and H4 was transferred to C2 to evaporate the working fluid in the ORC, which produced 3.43 MW.
• The required consumption of the cold utility to cool the streams of the compression train without thermal inte-gration was 69.635 MW; with the HEN, it decreased to 46.852 MW.
Case 3: CC‑6 configuration
Figure 9 shows the HEN obtained for case 3; there were six matches between the hot and cold streams, and the observa-tions were as follows:
• Stream H6 was not used in the HEN because of its low temperature.
• H1 was coupled with C1, and 0.357 MW of power was transferred; this reduced the amount of LP steam that needed to be extracted for the stripper reboiler, whose heat requirement became 431.58 MW.
• Streams H1, H2, H3, H4, and H5 were used to evapo-rate the working fluid in the ORC, which produced 3.243 MW.
• The consumption of the cold utility decreased from 64.791 to 61.269 MW with thermal integration.
Case 4: CC‑8 configuration
None of the hot streams were used to transfer heat to the C1 or C2 streams in case 4. This was because all the streams had a temperature below 100 °C; thus, the stripper reboiler duty and consumption of cold utility to cool the streams of the
compression train maintained the same value. A match with stream H6 was observed only when the heat capacity flow rate of the C2 stream in the thermal integration decreased. However, it required an additional consumption of hot utility in the ORC, which contributed to the cold utility utilized to condense the working fluid and had an energy production of only 0.1 MW (in the ORC). This had a negligible impact on the global process. The only match in this scenario was between the hot water streams at the output of the stripper reboiler and the ORC that could generate 4.67 MWe, which contributed to the global energy production of the CFPP.
The results for the net power output and GWP are pre-sented in Table 5 for the scenario with thermal integration, in which the GWP initially decreased because the net power output of each scenario increased as a result of the matches between the hot and cold streams calculated for each sce-nario. In contrast to the case without thermal integration, in which the CC-8 configuration exhibited the best energetic and environmental results, the SSWC configuration with thermal integration produced a higher net power output of 382.9 MWe and a lower GWP (by 84.65%) than the scenario without carbon capture; it also had a lower consumption of cold utility in the compression-train intercooler. This was because the hot streams attained temperatures higher than 200 °C, which allowed for thermal integration with the stripper reboiler and ORC, yielding better results compared with those of the other configurations, whose streams had temperatures below 150 °C. Figure 10 shows a flowchart of a CFPP with carbon capture and an SSWC configuration with initial thermal integration between compression-train hot streams H1 and H2, and the stripper reboiler and streams of the working fluid used in the ORC.
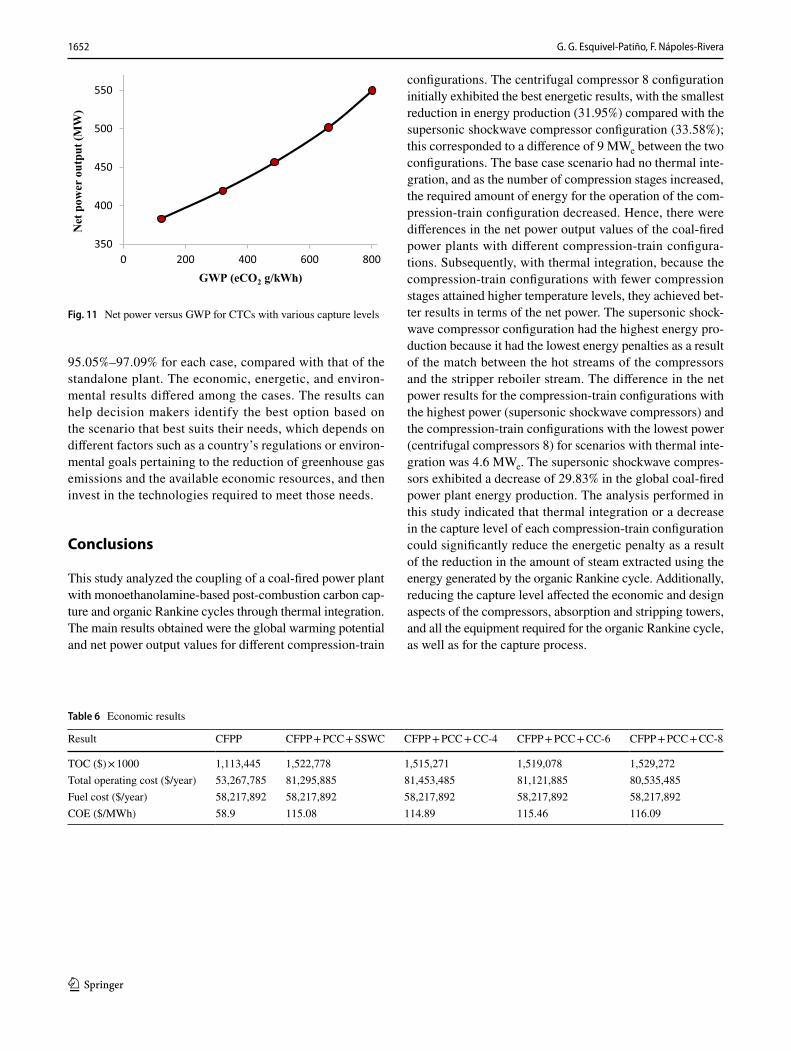
Based on the analysis of the variation in the capture level, the GWP and net power were obtained for capture levels ranging from 0 to 90% for each CTC. The variation in the GWP against the net power output is shown in Fig. 11 for the SSWC configuration, because it was the CTC with thermal
Fig. 9 HEN for CC-6 configura-tion

1651Thermal integration of different compression‑train configurations for coal‑fired power…
1 3
integration that exhibited the best energetic result. The net power output increased as the amount of carbon captured decreased; decision makers can use this to observe the tradeoffs between the environmental impact and the power generation. The minimum GWP value obtained for the four CTCs was 123.12 eCO2g/kWh, which corresponded to the
scenario of the SSWC configuration with a 90% level of capture and thermal integration.
With regard to the economic aspect, Table 6 pre-sents the COE calculation results for each case studied. The CTC with the smallest COE in this study was C-4 (114.84 $/MWh), and the COE exhibited an increase of
Table 5 Results of thermal integration
Result CFPP CFPP + PCC + SSWC CFPP + PCC + CC-4 CFPP + PCC + CC-6 CFPP + PCC + CC-8
Stripper reboiler duty (MW) – 390.4 412.53 431.58 431.94LP steam extracted (kg/s) – 162.1 171.3 179.21 179.36Power consumed by the com-
pressors (MW)– 46.12 42.18 38.45 37.12
ORC power output (MWe) – 5.8 7.9 7.91 4.67Net power output (MWe) 550 382.9 382.64 380.9 379.61CO2 captured (kg/s) 110.3 110.3 110.3 110.3 110.3GWP (e-CO2 g/kWh) 802.15 123.12 123.21 123.35 124.42CFPP efficiency (HHV) 39.3% 27.4% 27.34% 27.22% 27.12%
COMP-1
COMP-2
AIR-FANS
FURNACE
ORC-COND
ORC-TURB
FGD
ABS STR
CO2
H1
CO2-A
H2
AIR
C1
LP-STEAMHOTWATERC2
R245FA
COAL
ASH
FLUEGAS CO2-E
L-MEA
Fig. 10 Flowchart of SSWC configuration with thermal integration
1652 G. G. Esquivel-Patiño, F. Nápoles-Rivera
1 3
95.05%–97.09% for each case, compared with that of the standalone plant. The economic, energetic, and environ-mental results differed among the cases. The results can help decision makers identify the best option based on the scenario that best suits their needs, which depends on different factors such as a country’s regulations or environ-mental goals pertaining to the reduction of greenhouse gas emissions and the available economic resources, and then invest in the technologies required to meet those needs.
Conclusions
This study analyzed the coupling of a coal-fired power plant with monoethanolamine-based post-combustion carbon cap-ture and organic Rankine cycles through thermal integration. The main results obtained were the global warming potential and net power output values for different compression-train
configurations. The centrifugal compressor 8 configuration initially exhibited the best energetic results, with the smallest reduction in energy production (31.95%) compared with the supersonic shockwave compressor configuration (33.58%); this corresponded to a difference of 9 MWe between the two configurations. The base case scenario had no thermal inte-gration, and as the number of compression stages increased, the required amount of energy for the operation of the com-pression-train configuration decreased. Hence, there were differences in the net power output values of the coal-fired power plants with different compression-train configura-tions. Subsequently, with thermal integration, because the compression-train configurations with fewer compression stages attained higher temperature levels, they achieved bet-ter results in terms of the net power. The supersonic shock-wave compressor configuration had the highest energy pro-duction because it had the lowest energy penalties as a result of the match between the hot streams of the compressors and the stripper reboiler stream. The difference in the net power results for the compression-train configurations with the highest power (supersonic shockwave compressors) and the compression-train configurations with the lowest power (centrifugal compressors 8) for scenarios with thermal inte-gration was 4.6 MWe. The supersonic shockwave compres-sors exhibited a decrease of 29.83% in the global coal-fired power plant energy production. The analysis performed in this study indicated that thermal integration or a decrease in the capture level of each compression-train configuration could significantly reduce the energetic penalty as a result of the reduction in the amount of steam extracted using the energy generated by the organic Rankine cycle. Additionally, reducing the capture level affected the economic and design aspects of the compressors, absorption and stripping towers, and all the equipment required for the organic Rankine cycle, as well as for the capture process.
350
400
450
500
550
0 200 400 600 800
Net
pow
er o
utpu
t (M
W)
GWP (eCO2 g/kWh)
Fig. 11 Net power versus GWP for CTCs with various capture levels
Table 6 Economic results
Result CFPP CFPP + PCC + SSWC CFPP + PCC + CC-4 CFPP + PCC + CC-6 CFPP + PCC + CC-8
TOC ($) × 1000 1,113,445 1,522,778 1,515,271 1,519,078 1,529,272Total operating cost ($/year) 53,267,785 81,295,885 81,453,485 81,121,885 80,535,485Fuel cost ($/year) 58,217,892 58,217,892 58,217,892 58,217,892 58,217,892COE ($/MWh) 58.9 115.08 114.89 115.46 116.09

1653Thermal integration of different compression‑train configurations for coal‑fired power…
1 3
Acknowledgements The authors acknowledge the financial support provided by CONACYT and the Scientific Research Council (CIC_UMSNH) for the development of this project, as well as the support from the faculty of Chemical Engineering at the Universidad Michoa-cana de San Nicolás de Hidalgo.
Authors’ contributions Gerardo Esquivel-Patiño was involved in methodology, writing—original draft, and software. Fabricio Nápoles-Rivera was involved in conceptualization, resources, funding acquisi-tion, and writing—review and editing.
Funding The authors acknowledge the financial support of CONACYT and CIC_UMSNH.
Declarations
Conflict of interest The authors declare they have no conflicts of inter-est that might influence the work reported in this paper.
References
Araujo O, De Medeiros JL (2017) Carbon capture and storage tech-nologies: present scenario and drivers of innovation. Curr Opin Chem Eng 17:22–34. https ://doi.org/10.1016/j.coche .2017.05.004
Boucif N, Favre E, Roizard D (2008) CO2 capture in HFMM contac-tor with typical amine solutions: a numerical analysis. Chem Eng Sci 63(22):5375–5385. https ://doi.org/10.1016/j.ces.2008.07.015
Choi WJ, Seo JB, Jang SY, Jung JH, Oh KJ (2009) Removal character-istics of CO2 using aqueous MEA/AMP solutions in the absorp-tion and regeneration process. J Environ Sci 21:907–913. https ://doi.org/10.1016/S1001 -0742(08)62360 -8
Cormos A, Dinca C, Cormos C (2018) Energy efficiency improve-ments of post-combustion CO2 capture based on reactive gas–liquid absorption applied for super-critical circulating fluidized bed combustion (CFBC) power plants. Clean Technol Environ Policy 20:1311–1321. https ://doi.org/10.1007/s1009 8-018-1560-0
Desideri U, Antonelli M (2014) A simplified method for the evalu-ation of the performance of coal-fired power plant with carbon capture. Appl Therm Eng 64:263–272. https ://doi.org/10.1016/j.applt herma leng.2013.12.012
DOE/NETL (2013) Cost and performance baseline for fossil energy plants volume 1: bituminous coal and natural gas to electricity, revision 2a. U.S. Department of Energy, National Energy Tech-nology Laboratory
El-Hadri N, Viet-Quang D, Goetheer ELV, Abu-Zahra MRM (2017) Aqueous amine solution characterization for post-combustion CO2 capture process. Appl Energy 185:1433–1449. https ://doi.org/10.1016/j.apene rgy.2016.03.043
Ecoinvent (2019) https ://www.ecoin vent.org/. Accessed 4 Oct 2019Farahipour R, Karunanithi AT (2014) Life cycle environmental
implications of CO2 capture and sequestration with ionic liquid 1-butyl-3-methylimidazolium acetate. ACS Sustain Chem Eng 2(11):2495–2500. https ://doi.org/10.1021/sc400 274b
Farajollahi H, Hossainpour S (2017) Application of organic Rankine cycle in integration of thermal power plant with post-combustion CO2 capture and compression. Energy 118:927–936. https ://doi.org/10.1016/j.energ y.2016.10.124
Filiz-Ozdil-Tumen N, Ridvan-Segmen M (2016) Investigation of the effect of the wáter phase in the evaporator inlet on economic per-formance for an Organic Rankine Cycle (ORC) based on industrial
data. Appl Therm Eng 100:1042–1051. https ://doi.org/10.1016/j.applt herma leng.2016.02.117
Flowers BS, Mittenthal MS, Jenkins AH et al (2017) 1,2,3-Trimethoxy-propane: a glycerol-derived physical solvent for CO2 absorption. ACS Sustain Chem Eng 5(1):911–921. https ://doi.org/10.1021/acssu schem eng.6b022 31
Gallagher KS, Bhandary R, Narassimhan E, Nguyen QT (2021) Bank-ing on coal? Drivers of demand for Chinese overseas investments in coal in Bangladesh, India, Indonesia and Vietnam. Energy Res Soc Sci 71:101827. https ://doi.org/10.1016/j.erss.2020.10182 7
Ghosh UK, Kentish SE, Stevens GW (2009) Absorption of carbon dioxide into aqueous potassium carbonate promoted by boric acid. Energy Procedia 1:1075–1081. https ://doi.org/10.1016/j.egypr o.2009.01.142
Gingerich DB, Mauter MS (2018) Retrofitting the regulated power plant: optimizing energy allocation to electricity generation, water treatment, and carbon capture processes at coal-fired generating facilities. ACS Sustain Chem Eng 6(2):2694–2703. https ://doi.org/10.1021/acssu schem eng.7b043 16
Gong X, Wang Y, Kuang T (2017) ZIF-8-based membranes for carbon dioxide capture and separation. ACS Sustain Chem Eng 5(12):11204–11214. https ://doi.org/10.1021/acssu schem eng.7b036 13
Gonzalez-Bravo R, Elsayed AE, Ponce-Ortega JM, Napoles-Rivera F, El-Halwagi MM (2015) Optimal design of thermal membrane distillation systems with heat integration with process plants. Appl Therm Eng 75:154–166. https ://doi.org/10.1016/j.applt herma leng.2014.09.009
Goto K, Yogo K, Higashii T (2013) A review of efficiency penalty in a coal-fired power plant with post-combustion CO2 capture. Appl Energy 111:710–720. https ://doi.org/10.1016/j.apene rgy.2013.05.020
Global CCS Institute (2020) Global status of CCS report. https ://www.globa lccsi nstit ute.com/resou rces/globa l-statu s-repor t/
Hanak DP, Biliyok C, Yeung H, Białecki R (2014) Heat integration and exergy analysis for a supercritical high-ash coal-fired power plant integrated with a post-combustion carbon capture process. Fuel 134:126–139. https ://doi.org/10.1016/j.fuel.2014.05.036
Hanak DP, Kolios AJ, Biliyok C, Manovic V (2015) Probabilistic per-formance assessment of a coal-fired power plant. Appl Energy 139:350–364. https ://doi.org/10.1016/j.apene rgy.2014.10.079
IEA (2020a) Coal-fired power. IEA, Paris. https ://www.iea.org/repor ts/coal-fired -power
IEA (2020b) Energy technology perspectives 2020. IEA, Paris. https ://www.iea.org/repor ts/energ y-techn ology -persp ectiv es-2020
IEA (2021) A rebound in global coal demand in 2021 is set to be short-lived, but no immediate decline in sight. IEA, Paris. https ://www.iea.org/news/a-rebou nd-in-globa l-coal-deman d-in-2021-is-set-to-be-short -lived -but-no-immed iate-decli ne-in-sight
IPCC (2018) Changes in atmospheric constituents and in radiative forc-ing. https ://www.ipcc.ch/publi catio ns_and_data/ar4/wg1/en/ch2s2 -10-2.html. Accessed 17 Oct 2019
IPCC (2019) Calentamiento global de 1,5°C. https ://www.ipcc.ch/site/asset s/uploa ds/sites /2/2019/09/IPCC-Speci al-Repor t-1.5-SPM_es.pdf
Khalilpour R, Abbas A (2011) HEN optimization for efficient retro-fitting of coal-fired power plants with post-combustion carbon capture. Int J Greenh Gas Control 5(2):189–199. https ://doi.org/10.1016/j.ijggc .2010.10.006
Li H, Zhang Y, Yang Y, Han W, Yao M, Bai W, Zhang L (2019) Prelim-inary design assessment of supercritical CO2 cycle for commercial scale coal-fired power plants. Appl Therm Eng 158:113785. https ://doi.org/10.1016/j.applt herma leng.2019.11378 5
Linnenberg S, Darde V, Oexmann J, Kather A, van Well WJM, Thomsen K (2012) Evaluating the impact of an ammonia-based

1654 G. G. Esquivel-Patiño, F. Nápoles-Rivera
1 3
post-combustion CO2, capture process on a steam power plant with different cooling water temperatures. Int J Greenh Gas Con-trol 10(463):1–14. https ://doi.org/10.1016/j.ijggc .2012.05.003
Luo X, Wang M, Chen J (2015) Heat integration of natural gas combined cycle power plant integrated with post-combustion CO2 capture and compression. Fuel 151:110–117. https ://doi.org/10.1016/j.fuel.2015.01.030
Nuchitprasittichai A, Cremaschi S (2013) Optimization of CO2 capture process with aqueous amines—a comparison of two simulation-optimization approaches. Ind Eng Chem Res 52(30):10236–10243. https ://doi.org/10.1021/ie302 9366
Oh S-Y, Yun S, Kim J-K (2018) Process integration and design for maximizing energy efficiency of a coal-fired power plant inte-grated with amine-based CO2 capture process. Appl Energy 216:311–322. https ://doi.org/10.1016/j.apene rgy.2018.02.100
Ouyang T, Xu J, Su Z, Zhao Z, Huang G, Mo C (2021) A novel design of low-grade waste heat utilization for coal-fired power plants with sulfuric acid recovery. Energy Convers Manag 227:113640. https ://doi.org/10.1016/j.encon man.2020.11364 0
Pacala SW, Socolow R (2004) Stabilization wedges: solving the climate problem for the next 50 years with current technologies. Science 305(5686):968–972. https ://doi.org/10.1126/scien ce.11001 03
Parvareh F, Sharma M, Qadir A, Milani D, Khalilpour R, Chiesa M, Abbas A (2014) Integration of solar energy in coal-fired power plants retrofitted with carbon capture: a review. Renew Sustain Energy Rev 38:1029–1044
Sanchez del Rio M, Gibbins J, Lucquiaud M (2017) On the retrofit-ting and repowering of coal power plants with post-combustion carbon capture: an advanced integration option with a gas tur-bine windbox. Int J Greenh Gas Control 58:299–311. https ://doi.org/10.1016/j.ijggc .2016.09.015
Sarat-Chandra T, Maneesh-Kumar M, Mukherji S, Chauhan VS, Sarada R, Mudliar SN (2018) Comparative life cycle assessment of microalgae-mediated CO2 capture in open raceway pond and airlift photobioreactor system. Clean Technol Environ Policy 20:2357–2364. https ://doi.org/10.1007/s1009 8-018-1612-5
Suleiman B, Abdulkareem AS, Abdulsalam YO, Musa U, Kovo AS, Mohammed IA (2016) Thermo-economic analysis of natural gas treatment process using triethanolamine (TEA) and diethanola-mine (DEA) as gas sweeteners. J Nat Gas Sci Eng 36:184–201. https ://doi.org/10.1016/j.jngse .2016.10.023
Tchanche BF, Lambrinos G, Frangoudakis A, Papadakis G (2011) Low-grade heat conversion into power using organic Rankine cycles: a review of various applications. Renew Sustain Energy Rev 15(8):3963–3979. https ://doi.org/10.1016/j.rser.2011.07.024
Wang D, Li H, Wang C, Zhou C, Li X, Yang M (2021) Thermodynamic analysis of coal-fired power plant based on the feedwater heater drainage-air preheating system. Appl Therm Eng 185:116420. https ://doi.org/10.1016/j.applt herma leng.2020.11642 0
Wang M, Lawal A, Stephenson P, Sidders J, Ramshaw C (2011) Post-combustion CO2 capture with chemical absorption: a state-of-the-art review. Chem Eng Res Des 89:1609–1624. https ://doi.org/10.1016/j.cherd .2010.11.005
Wang Y, Chao Z, Jakobsen HA (2011) Numerical study of hydrogen production by the sorption-enhanced steam methane reforming process with online CO2 capture as operated in fluidized bed reactors. Clean Technol Environ Policy 13:559–565. https ://doi.org/10.1007/s1009 8-011-0368-y
Witkowski AS, Majkut M (2012) The impact of CO2 compression sys-tems on the compressor power required for a pulverized coal-fired power plant in post-combustion carbon dioxide sequestration. Arch Mech Eng 59(3):343–360. https ://doi.org/10.2478/v1018 0-012-0018-x
Xiong J, Zhao H, Zheng C (2011) Exergy analysis of a 600 MWe oxy-combustion pulverized-coal-fired power plant. Energy Fuels 35:3854–3864. https ://doi.org/10.1021/ef200 702k
Yee TF, Grossmann IE (1990) Simultaneous optimization models for heat integration-II. Heat exchanger network synthesis. Comput Chem Eng 14(10):1165–1185. https ://doi.org/10.1016/0098-1354(90)85010 -8
Zhai R, Qi J, Zhu Y, Zhao M, Yang Y (2017) Novel system integrations of 1000 MW coal-fired power plant retrofitted with solar energy and CO2 capture system. Appl Therm Eng 125:1133–1145. https ://doi.org/10.1016/j.applt herma leng.2017.07.093
Zhang W, Jin X, Tu W, Ma Q, Mao M, Cui C (2017) Development of MEA-based CO2 phase change absorbent. Appl Energy 195:316–323. https ://doi.org/10.1016/j.apene rgy.2017.03.050
Zhang X, Zhang CF, Liu Y (2002) Kinetics of absorption of CO2 into aqueous solution of MDEA blended with DEA. Ind Eng Chem Res 41:1135–1141. https ://doi.org/10.1021/ie010 605j
Zhang Y, Chen H, Chen C-C, Plaza JM, Dugas R, Rochelle GT (2009) Rate-based process modeling study of CO2 capture with aqueous monoethanolamine solution. Ind Eng Chem Res 48(20):9233–9246. https ://doi.org/10.1021/ie900 068k
Publisher’s Note Springer Nature remains neutral with regard to jurisdictional claims in published maps and institutional affiliations.