thermal infrared imaging spectroscopy of shoemaker-levy 9
TRANSCRIPT

ICARUS 125, 94–120 (1997)ARTICLE NO. IS965610
Thermal Infrared Imaging Spectroscopy of Shoemaker–Levy 9Impact Sites: Temperature and HCN Retrievals
BRUNO BEZARD1
Departement de Recherche Spatiale, Observatoire de Paris (Section de Meudon), 92195 Meudon Principal Cedex, France
CAITLIN A. GRIFFITH1
Department of Physics and Astronomy, Northern Arizona University, Flagstaff, Arizona 86011-6010
DOUGLAS M. KELLY1,2 AND JOHN H. LACY1
Department of Astronomy, University of Texas, Austin, Texas 78712-1083
THOMAS GREATHOUSE
Department of Physics and Astronomy, Northern Arizona University, Flagstaff, Arizona 86011-6010
AND
GLENN ORTON1
Jet Propulsion Laboratory, M.S. 169–237, 4800 Oak Grove Drive, Pasadena, California 91109
Received February 22, 1996; revised July 16, 1996
area p18,000 km wide centered on the E site 2.6 days afterimpact. Radiative transfer models of this emission indicateWe present high-resolution 8–14 mm observations of Shoe-temperatures 37 6 7 K higher than nominal around 3 mbar.maker–Levy 9 sites conducted on July 20, 30, and 31 1994No such enhancement was seen in CH4 spectral images,UT at the NASA Infrared Telescope Facility. Stratosphericimplying that the temperature perturbation did not signifi-heating was detected from strong enhancements of methanecantly extend below the p20-mbar level. The H site observedemission near 8.1 mm over areas at least 15,000 km widesimultaneously was 12 6 5 K warmer than the surroundingsaround the K site observed 23 hr after impact and around 1.4 day after impact. C2H2 lines were still slightly more
the L site 11 hr after impact. The intensity distribution intense over the K 1 W and Q1 sites on July 30 and 31,between strong and weaker CH4 lines implies that the strato- 8 to 10 days after impact. These observations can be interpre-spheric heating was primarily confined to pressures less than ted either by temperature differences of about 13 and 10 K
respectively in the 3-mbar region, or by an increase in the500 mbar. The L site temperature increased by 80 6 10 KC2H2 column density of 2.5–5 3 1017 molecule cm22. Emissionat 5 mbar, but did not exceed 20 K around 1 mbar or 10from hydrogen cyanide lines around 13.4 mm was detectedK around 10 mbar. The older K site was still 30 6 5 Kover all sites observed. The mass of HCN is about 2 3 1012
warmer than the surroundings at the 10-mbar level. Theg for the biggest plumes (K, L, G), 0.95 6 0.5 3 1012 g overexcess thermal energy stored in the upper jovian stratosphere the E site, and 0.45 6 0.2 3 1012 g over the H site. The
was 31321.5 3 1026 erg over the L site, and 212
21 3 1026 erg over total mass of HCN produced by all fragments is estimatedthe K site at the time of the observations. Comparison with to be 1.1 6 0.4 3 1013 g. A consistent interpretation of thenumerical simulations indicates that a large fraction (.20%) different pieces of information available suggests that the H
plume was richer in dust than the E or A plume. 1997of the kinetic energy of the L plume was transferred toAcademic Pressthe jovian atmosphere and not immediately radiated away.
Acetylene line emission near 13.4 mm was enhanced over an
1. INTRODUCTION1 Visiting astronomer at the Infrared Telescope Facility which is oper-
ated by the University of Hawaii under contract with the National Aero-The collision of Comet Shoemaker–Levy 9 (SL9) withnautics and Space Administration.
Jupiter caused major atmospheric disturbances over large2 Current address: Department of Physics and Astronomy, Universityof Wyoming, Laramie, WY 82071-3905. areas centered on the impact sites. Besides the most visible
940019-1035/97 $25.00Copyright 1997 by Academic PressAll rights of reproduction in any form reserved.

TEMPERATURE AND HCN IN JUPITER AFTER SL9 IMPACT 95
presence of long-lived impact debris particles, many new 2. DATA ACQUISITION AND REDUCTIONatmospheric species were injected in the high stratosphere
The Irshell spectrometer was mounted at the Cassegrain(e.g., Lellouch et al. 1995, Noll et al. 1995) and persistedfocus of the IRTF on the nights of 1994 July 20, 25, 30,from weeks to months. Stratospheric temperatures locallyand 31 UT. A new 20 spatial 3 64 spectral element Si:Asunderwent dramatic elevations, still detectable a few daysIBC array, provided by Hughes Aircraft, was used duringafter the impacts (Orton et al. 1995).this run. The 17-arcsec long slit was oriented along theWe report here on high-resolution 10-em observationseast–west planetocentric direction allowing for simultane-of the SL9 impact sites conducted in July 1994 with theous observations of 20 different positions separated by 0.83Irshell instrument at the NASA Infrared Telescope Facilityarcsec (except for a gap in the center between Rows 10(IRTF) atop Mauna Kea. Irshell, an array spectrometerand 11). Spectral maps of the impact regions were obtaineddeveloped at the University of Texas (Lacy et al. 1989),by scanning the telescope in Jupiter’s north–south direc-was one of the four Cassegrain focus instruments selectedtion with steps of 1 arcsec. The slit width was set to 1.8by the IRTF Science team3 for the observing campaign.pixel, yielding a resolving power of p15,000 and a spatialHigh-resolution spectroscopy in the 8–13 em atmosphericresolution of 1.5 arcsec, corresponding to 5600 km at Jupi-window clearly appeared as a powerful means of investigat-ter’s distance.ing the expected thermal and chemical changes induced by
The observations presented and analyzed in this paperthe SL9 impacts. This broad window contains rovibrationalare summarized in Table I. For the CH4 observations, thebands from various molecules of atmospheric interest andgrating was set to cover the interval 1233- to 1235.5-cm21was thus considered as a primary target. Its location inor 1232.5- to 1235-cm21 that includes a relatively strongthe thermal infrared allied with the high sensitivity of themethane line at 1233.455 cm21 and weaker lines at 1233.006,Irshell spectrometer allows the detection of thermal emis-1233.147, 1234.226, 1234.979, and 1235.061 cm21 (Fig. 1).sion from the cold jovian stratosphere (110–180 K). InThe intrinsic intensity of the weaker lines is typically aaddition, the high spectral resolution available with Irshellhundred times weaker than that of the strong line aroundpermits the observation of individual molecular lines. The180 K, allowing us to probe simultaneously different pres-various gaseous and particulate contributions to the ther-sure levels in the stratosphere as discussed later. The inter-mal emission can then be disentangled and molecular sig-val 743–745 cm21 observed on July 20 and 30 includes thenatures unambiguously identified. Our goals were (i) toR(5) C2H2 line at 743.265 cm21 and the R(10) HCN linemeasure stratospheric temperatures by imaging spectralat 744.458 cm21 (Fig. 2). The interval 746.5–748.5 cm21emission lines from known constituents (CH4 and C2H2);observed on July 31 includes both the R(7) C2H2 line atand (ii) to search for molecular lines from various mole-747.963 cm21 and the R(11) HCN line at 747.405 cm21cules which could have been produced or injected in Jupi-(Fig. 2).ter’s high atmosphere where they are normally absent
The ‘‘nod’’ observing mode (Lacy et al. 1989) was used,(mainly NH3 , H2S, and HCN).the telescope being nodded with an amplitude of 40 arcsecThe Irshell observations on July 20, 25, 30, and 31 1994and a period of a few seconds. We applied the proceduresUT led to the detection of NH3 , HCN, and C2H4 in thefor flat fielding, correction of atmospheric absorption, andstratosphere of the planet over various impact sites. Anintensity calibration described in Lacy et al. (1989) andadditional continuum emission, presumably from silicateBezard et al. (1995). The uncertainty on the absolute inten-grains, was furthermore present in these regions. CH4 andsity calibration is p10% in regions of high telluric transmis-C2H2 line observations on July 20 showed large perturba-sion. Unfortunately, the new array used in July 1994 hap-tions in the stratospheric temperatures of the fresh impactpened to exhibit many ‘‘bad’’ pixels (dead or hot) for whichsites. In this paper, we present the available set of CH4the signal was afterward interpolated between the pixelsand C2H2 spectral observations and derive quantitativespectrally adjacent. The whole 14th row was not useableinformation on the temperature perturbations induced byand was interpolated between adjacent rows. In addition,the impacts. We also report the detection of HCN emissionthe gap between the 10th and 11th rows was filled in byover all sites observed and present resolved maps of thisinterpolation, creating 21 rows of data in the images pre-emission. These data are analyzed to infer column densitiessented hereafter.and total masses of HCN produced by the impact pro-
cesses. Observations of NH3 , C2H4 , and the silicate dustemission features are presented in a companion paper 3. OBSERVATIONS(Griffith et al. 1996).
Typical spectra of the CH4 , C2H2 , and HCN lines re-corded during our run are shown in Figs. 1 and 2. Jovian3 M. A’Hearn, K. Baines, D. Deming, T. Dowling, J. Goguen, C. Grif-lines in these spectra are Doppler-shifted by 20.095 cm21
fith, H. Hammel, W. Hoffmann, D. Hunten, D. Jewitt, T. Kostiuk,S. Miller, K. Noll, G. Orton, and K. Zahnle. (CH4) and 20.065 cm21 (C2H2 and HCN) because of the

96 BEZARD ET AL.
TABLE IIrshell Observations of CH4 , C2H2 and HCN Lines
SpectralDate Scan range Resolution Integration(UT) numbera Molecule (cm21) (cm21) timeb (sec) Site
July 20, 08:11–08:58 31, 32 CH4 1232.5–1235 0.07 68 K, L04:42–04:59 14, 15 CH4 1233–1235.5 0.07 68 A, E05:59–06:28 19, 20 C2H2 , HCN 743–745 0.06 34 A, E, H
July 30, 07:47–08:04 14, 15 C2H2 , HCN 743–745 0.07 32 G, K, L, WJuly 31, 03:37–04:07 12 CH4 1233–1235.5 0.07 32 K, L, W
06:42–07:13 21, 22 C2H2 , HCN 746.5–748.5 0.06 32 B, D, G, H, N,Q1, Q2, R, S
a In the text and the figures, scans are identified by the date (20, 30, or 31) followed by the scan number (for example, 20-31).b ON source integration time per position on the disk.
Jupiter–Earth motion and the rotation of the planet. We corresponds to an emitting size of 16,000 6 2,000 km,similar to that observed in dust images of the same sitegenerated images of these molecular emission lines and of
the nearby continuum. Continuum and line intensities were (Griffith et al. 1996) and to 10-em images of the L site, 2hr after collision (Lagage et al. 1995). This similarity arguesderived for the spectrum of each spatial pixel by fitting
the relevant spectral region with an analytical function that Col. 3 is probably close enough to the impact latitudeso that the observed temperature perturbations are not farconsisting of a Gaussian line superimposed on a quadratic
background. The set of free parameters was derived from the maximum ones present on the sites. The L siteis seen close to the west limb at a jovian airmass of 5.3. Asthrough an algorithm minimizing the value x2 of the fit
between model and observations. Bad or noisy array pixels a consequence, the longitudinal extension of the perturbedregion as observed by the instrument is less than the 1.5-were not considered in the fitting procedure. Continuum
and line maps are shown in Figs. 3–10. Rows are labeled arcsec spatial resolution. Assuming an emitting area of16,000 6 2,000 km, we calculate that for the pixel showingin 0.830 pixels, and columns in 1.00 scan steps.
In addition to these maps, a sketch of Jupiter’s mapped maximum intensity (Col. 3, Row 3), the L hot spot fills50 6 10% of a resolution element. It is noteworthy thatregion is displayed with the center of the visible impacts
placed on a grid having a step of 108 in latitude and 308 no similar enhancements are seen in the ‘‘CH4 weak’’ im-age; this has strong implications on the altitude of thein longitude and coordinates in arcsec from the disk center.
The locations of the impacts were taken from Hammel et atmospheric levels perturbed by the impacts as discussedin Section 5.al. (1995). The absolute pointing accuracy of these observa-
tions is intrinsically no better than 2 arcsec. However, re- In addition, the impact sites are not visible in thecontinuum map which only shows the expected limb-constructing the limb from the continuum maps whenever
possible allowed us to improve the accuracy to about 1 darkening behavior. The nondetection of enhanced con-tinuum emission around 8 em contrasts with our observa-arcsec.
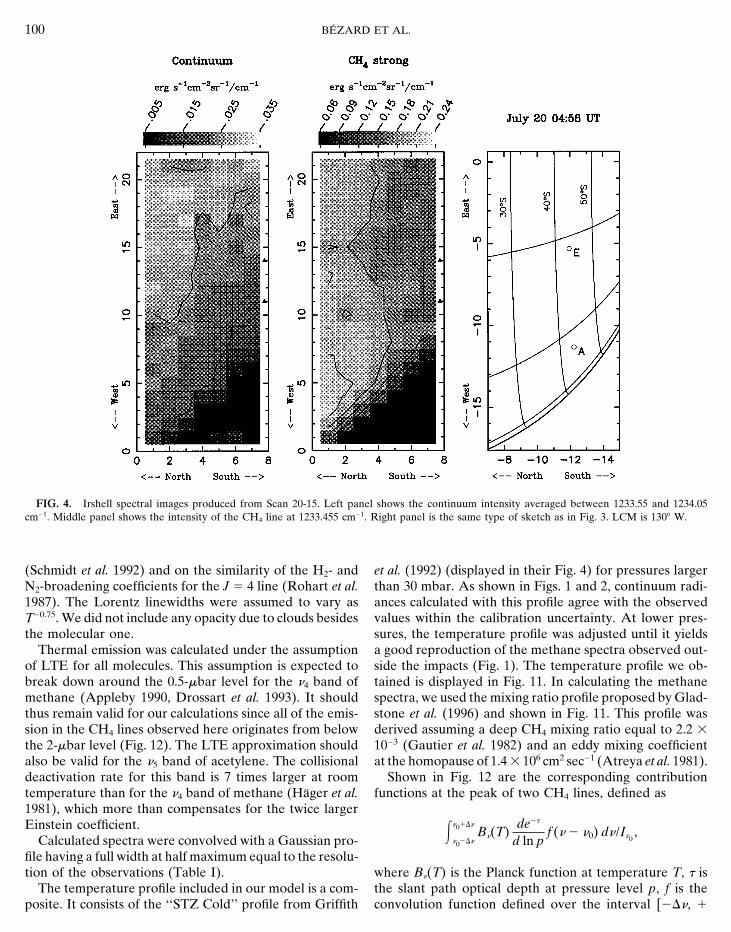
Figure 3 shows images of the CH4 emissions centered tions at 10.5 and 11.0 em which show a strong continuumemission over the K site on the same date (Griffith eton July 20, 08:57 UT (Scan 20–32). The prominent bright
feature present at the west limb of the planet (Col. 3, Rows al. 1996). As discussed by Griffith et al., this behavioris consistent with silicate dust being responsible for the2–3) is the L site. This image was recorded 11 hr after
impact. Also noticeable in the same image is the K site 10.5-em emission.Figure 4 shows images of the continuum and ‘‘CH4(centered on Row 17) observed 23 hr after impact. This
strong CH4 line at a rest frequency of 1233.455 cm21 is 3.5 strong’’ line intensity on July 20, 04:58 UT at longitudeswhere the A and E sites are visible (Scan 20-15). Site Atimes more intense than nominal over the L site, and 1.6
times more intense over the K site. The maximum intensity was observed 3.3 days after impact, and Site E 2.6 daysafter impact. The CH4 line shows no enhancement ex-is observed for the last column of the scan; considering
the pointing uncertainties, it is possible that the maximum ceeding 10% over either site when compared to unper-turbed regions at the same latitude. Similar maps wereperturbation takes place further south and was not re-
corded during this scan. The longitudinal extent of the obtained on July 31, 03:41 UT (Scan 31-12) (Fig. 5). TheK 1 W site, observed 11.7 days after impact K (8.8 daysbright feature observed over the K site in Col. 3 is 4.5 6
0.5 arcsec at half intensity, for a 1.5-arcsec resolution. This after W), no longer shows any detectable enhancement of

TEMPERATURE AND HCN IN JUPITER AFTER SL9 IMPACT 97
FIG. 1. Irshell spectra of Jupiter including a strong CH4 line at a rest frequency of 1233.455 cm21 and several weaker CH4 lines at a resolutionof 0.07 cm21 (lines with squares). These spectra extracted from Scans 20-15 and 20-32 were recorded outside of the impact sites but at the samelatitude. The telluric transmission for each observation is shown on the upper panel. The terrestrial atmospheric absorption line is at the restfrequency. The jovian lines are Doppler-shifted due to the Jupiter–Earth motion (20.11 cm21) and the rotation of the planet. 1-s random noiseerror bars are indicated at the peak of the 1233.455-cm21 line and away from this line. The thicker solid lines are synthetic spectra calculated withthe nominal temperature and CH4 vertical profiles shown in Fig. 11.
the CH4 line. An upper limit of 10% can be set on any p1.5 pixel west of Row 1. This row appears slightly brighterthan Rows 2 and 3, suggesting that we may be seeingpossible remaining enhancement.
Images of the C2H2 and HCN emission intensities are temperature perturbations at the eastern edge of the Asite. The observed intensity enhancement very likely re-displayed in Figs. 6–10. On July 20, 06:04 UT (Scan 20-
19), the E site, observed 2.6 days after impact, was visible sults from warmer stratospheric temperatures over the im-pact sites (see Section 6). As discussed above, no enhance-as well as, near the East limb, the H site observed 1.4 day
after impact (Fig. 6). The brightest spot in the C2H2 image ment in excess of 10% was seen in the methane lines overthe A and E sites, which constrains the maximum depthis at the location of the E site (Rows 8 and 9). Here, the
acetylene line is 70% more intense than in regions outside of the temperature perturbations. HCN emission is promi-nent on the E site, and covers a 18,000–km broad area (atthe impacts observed at similar airmasses (Col. 1, Row
17). The H site is also distinguishable at the East limb, half maximum). It is also detected on the H site, and onthe eastern edge of the A site at the lower end of thealthough with less contrast. Finally, the A fragment im-
pacted Jupiter 3.4 days before these observations, only infrared array. The analysis of the HCN observations in

98 BEZARD ET AL.
FIG. 2. Irshell spectra of the K and Q1 impact sites on Jupiter in the ranges 743–745 and 746.5–748.5 cm21, extracted from Scans 30-14 and31-22 respectively (lines with squares). The spectral regions include C2H2 lines at rest frequencies of 743.265 and 747.963 cm21 and HCN lines at744.458 and 747.405 cm21. Other weaker emission features are due to weak C2H2 lines. The spectral resolution is 0.07 and 0.06 cm21 respectively.Data corresponding to regions where the telluric transmission, shown in the upper panel, is less than 20% are not plotted. The jovian lines areDoppler-shifted due to the Jupiter–Earth motion (20.07 cm21) and the rotation of the planet. 1-s random noise error bars are indicated at thepeaks of the C2H2 and HCN lines. The thicker solid lines are synthetic spectra calculated with the nominal C2H2 vertical profile shown in Fig. 11and a temperature profile slightly warmer than nominal above the 15-ebar level; the HCN mole fraction in the upper stratosphere was adjusted tobest reproduce the observed lines (see text).
terms of column density and mass are presented in Sec- and W impacts. It may reveal the remnant of the strato-spheric heating from the W impact which occurred 8 daystion 7.
Figures 7 and 8 show images of emission intensities for before the observations, or a true C2H2 concentration en-richment over the site. No enhancement exceeding 10% isC2H2 and HCN observed on July 30. HCN emission is
clearly visible over the K 1 W site (Rows 8–21) and at observed in the C2H2 line intensity over the G 1 L complex(Fig. 8), possibly because the impacts are older as discussedthe eastern edge of the L site (Rows 1–5) (Scan 30-14, Fig.
7). It is maximum near latitude 241 6 48 and longitude in Section 8a.Finally, Figs. 9 and 10 show maps of the C2H2 and HCN285 6 58 (System III) and corresponds to the K impact
location within uncertainties. The HCN emission extends emissions observed on July 31 between longitudes 208 and1108 (Scans 31-21 and 31-22). HCN is detected over theover longitudes 250 to 3058. The HCN map in Fig. 8 (Scan
30-15) exhibits an extended bright region extending from whole longitude range observed between latitudes 2358and 2558. The emission is maximum near longitude 658,the western limb to a longitude of 325 6 58. This region
corresponds to the L and G impact sites which can no which corresponds to the location of the Q1 impact. Thelargest clump extends between longitudes 358 and 908 andlonger be distinguished. We also note that the C2H2 map
in Fig. 7 shows a spot p20% brighter than its surroundings. includes the R, Q2, Q1, B, and N sites. The eastern edgeof the H site is visible at longitudes larger than 908 (RowsThis spot is centered near (Cols. 3–4, Rows 10–11) p1.5
arcsec west of the peak of the HCN emission due to the K 1–3 in Fig. 10). The HCN emission observed at longitudes

TEMPERATURE AND HCN IN JUPITER AFTER SL9 IMPACT 99
FIG. 3. Irshell spectral images produced from Scan 20-32. The horizontal and vertical scales indicate respectively the column and the rownumbers in the array (1–21). The step is 1 arcsec between columns and 0.83 arcsec between rows. Panels show, from left to right, the continuumintensity averaged between 1234.3 and 1234.8 cm21; the intensity of the CH4 strongest line at 1233.455 cm21, with the continuum deducted; theintensity of the weak CH4 line located at 1233.147 cm21, with the continuum deducted; and a sketch showing the location of the visible impacts. Inthis sketch, the horizontal and vertical axes represent the angular distance (arcsec) from the center of the jovian disk as seen from the Earth, inthe jovian north and east directions respectively. The longitude of the Central Meridian (LCM) is 2758 W (System III). Triangles (m) mark rowsfor which intensities had to be interpolated from adjacent rows because of bad pixels.
lower than 358 (Rows 19–21 in Fig. 10) most likely origi- H2–H2 and H2–He collision–induced opacity was mod-eled through the formulation of Birnbaum and Cohennates from the G impact. The weak D and S sites which
fall between the G site and the R–Q2–Q1–B–N complex (1976) and Cohen et al. (1982), using laboratory measure-ments by Dore et al. (1983) and Bachet (1988). A heliumcannot be distinguished. The C2H2 map in Fig. 9 shows a
brighter region (Cols. 5–7, Rows 7–15) that corresponds mole fraction of 0.10 was used in the calculations. Weincluded molecular absorption from CH4 , CH3D, C2H2 ,approximately to the R–Q2–Q1–B–N complex seen in the
HCN map. This bright spot is also visible in Fig. 10. The and HCN. Line parameters (positions, intensities, energylevels) were extracted from the GEISA 1991 line compila-increase in the C2H2 intensity amounts to p15%. In Fig.
10, the brightest feature in the last column of the C2H2 tion (Husson et al. 1991). A Voigt profile was used for themolecular lineshape up to 10 cm21 from line center. Themap is enhanced emission from the Southern auroral zone.Lorentz halfwidths of the CH4 (and CH3D) lines weretaken as 0.075 cm21 atm21 at room temperature with a4. RADIATIVE TRANSFER MODELtemperature dependence as T20.55 (Varanasi and Tejwani
We have compared our observations to synthetic spectra 1972). Helium and hydrogen broadening coefficients forgenerated from a line-by-line radiative transfer program C2H2 were taken from Varanasi (1992). For the two ob-to derive the HCN abundance over the observed impact served HCN lines (R(10) and R(11)), we used a value of
0.13 cm21 atm21 for room temperature, based on measure-sites, and to constrain stratospheric temperatures usingCH4 and C2H2 observations. ments of N2-broadened lines in the n2 band of HCN
100 BEZARD ET AL.
FIG. 4. Irshell spectral images produced from Scan 20-15. Left panel shows the continuum intensity averaged between 1233.55 and 1234.05cm21. Middle panel shows the intensity of the CH4 line at 1233.455 cm21. Right panel is the same type of sketch as in Fig. 3. LCM is 1308 W.
(Schmidt et al. 1992) and on the similarity of the H2- and et al. (1992) (displayed in their Fig. 4) for pressures largerthan 30 mbar. As shown in Figs. 1 and 2, continuum radi-N2-broadening coefficients for the J 5 4 line (Rohart et al.
1987). The Lorentz linewidths were assumed to vary as ances calculated with this profile agree with the observedvalues within the calibration uncertainty. At lower pres-T20.75. We did not include any opacity due to clouds besides
the molecular one. sures, the temperature profile was adjusted until it yieldsa good reproduction of the methane spectra observed out-Thermal emission was calculated under the assumption
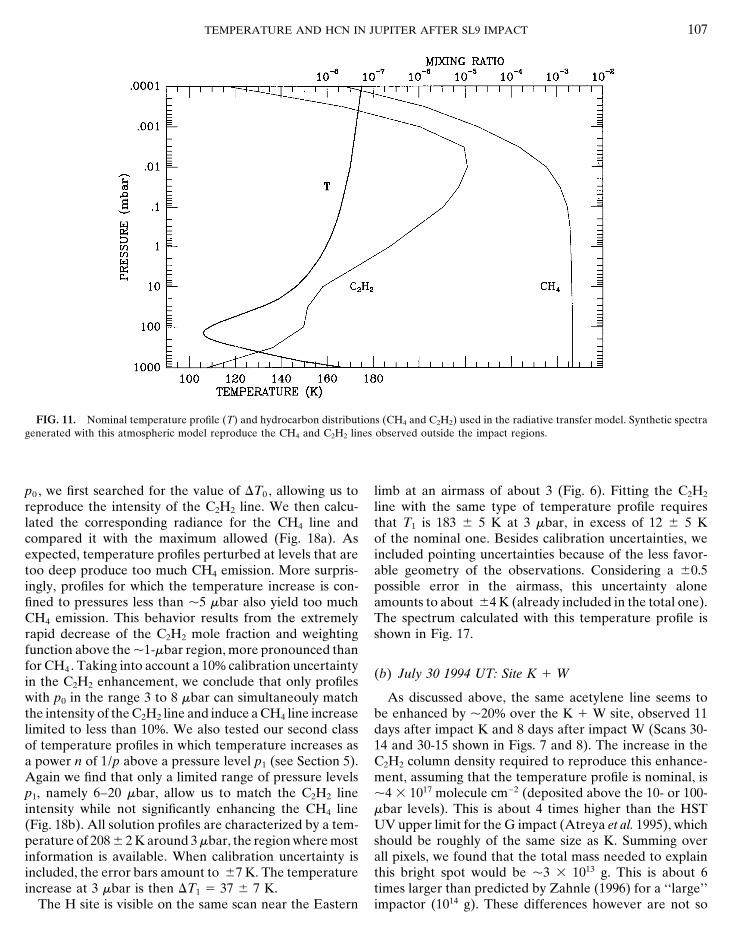
of LTE for all molecules. This assumption is expected to side the impacts (Fig. 1). The temperature profile we ob-tained is displayed in Fig. 11. In calculating the methanebreak down around the 0.5-ebar level for the n4 band of
methane (Appleby 1990, Drossart et al. 1993). It should spectra, we used the mixing ratio profile proposed by Glad-stone et al. (1996) and shown in Fig. 11. This profile wasthus remain valid for our calculations since all of the emis-
sion in the CH4 lines observed here originates from below derived assuming a deep CH4 mixing ratio equal to 2.2 31023 (Gautier et al. 1982) and an eddy mixing coefficientthe 2-ebar level (Fig. 12). The LTE approximation should
also be valid for the n5 band of acetylene. The collisional at the homopause of 1.4 3 106 cm2 sec21 (Atreya et al. 1981).Shown in Fig. 12 are the corresponding contributiondeactivation rate for this band is 7 times larger at room
temperature than for the n4 band of methane (Hager et al. functions at the peak of two CH4 lines, defined as1981), which more than compensates for the twice largerEinstein coefficient. En01Dn
n02DnBn(T)
de2t
d ln pf (n 2 n0) dn/In0
,Calculated spectra were convolved with a Gaussian pro-
file having a full width at half maximum equal to the resolu-tion of the observations (Table I). where Bn(T) is the Planck function at temperature T, t is
the slant path optical depth at pressure level p, f is theThe temperature profile included in our model is a com-posite. It consists of the ‘‘STZ Cold’’ profile from Griffith convolution function defined over the interval [2Dn, 1

TEMPERATURE AND HCN IN JUPITER AFTER SL9 IMPACT 101
FIG. 5. Same as described in the legend to Fig. 4 for Scan 31-12. LCM is 2988 W.
Dn], and In0is the convolved radiance at wavenumber n0 . the impact sites. For the July 20 observations (Scan 20-19
in Fig. 6), our ‘‘reference’’ spectrum is that of (Col. 1, RowAn airmass of 1.50 was used in these calculations. Emissionfrom the strong CH4 line at 1233.455 cm21 originates mostly 17) recorded at an airmass similar to that of Site E but at
lower latitudes as mentioned in Section 3. For the July 30from the region 1.5 to 20 mbar with a maximum contributionaround 6 mbar. A small fraction of the emission however and 31 data, we used spectra at the latitude of the impacts
and outside of the brighter spots described in Section 3.originates from a region centered at 30 ebar (10–100 ebarat half maximum). The contribution function for the weaker Calculated spectra yield C2H2 line intensities which are
much too large compared to these reference spectra. Weline at 1233.147 cm21 peaks around 12 mbar (0.5–30 mbarat half maximum) and is essentially confined to pressures then chose to deplete Gladstone et al. ’s profile by a con-
stant factor, and found that a factor of 3.6 was needed tolarger than 0.1 mbar in contrast to the stronger CH4 line.Synthetic spectra significantly underestimate the ob- reproduce the reference lines. The corresponding C2H2
profile is displayed in Fig. 11.served continua in the wings of the CH4 lines, especiallyin the region 1234.4–1234.8 cm21 (Figs. 1 and 13). The The contribution function at the peak of the acetylene
line (743.265 cm21) is shown in Fig. 12. About 40% of thediscrepancy may arise from improper modeling of the tro-pospheric opacity, such as an overestimation of the far stratospheric emission is confined above the 0.1-mbar level,
with a maximum contribution near the 3-ebar level (2–6wing opacity of methane lines. It does not however affectthe present analysis as we are only interested in the line ebar at half maximum). A broader contribution originates
from the pressure range 0.3 to 40 mbar. This behavioremission intensities.To model the C2H2 observations, we first used the base- results from the shape of the C2H2 mixing ratio profile,
strongly increasing with height in the stratosphere, withline photochemical profile proposed by Gladstone et al.(1996) and shown in their Fig. 3. We compared synthetic a maximum near 7 ebar. The tropospheric peak in the
contribution function near 400 mbar reflects the opacityspectra based on this C2H2 profile and on our nominaltemperature profile with observations recorded outside of from the H2–He continuum.

102 BEZARD ET AL.
FIG. 6. Irshell spectral images observed on July 20, 06:04 UT (Scan 20-19). Panels show, from left to right, the continuum intensity around theC2H2 line; the intensity of the C2H2 line at 743.265 cm21; the intensity of the HCN line at 744.458 cm21; and a sketch of the jovian disk with thelocations of the visible impact sites. See the legend to Fig. 3 for additional details on the horizontal and vertical scales. In the HCN map, anythingbelow the 2.5-s level appears black. LCM is 1708 W.
5. ANALYSIS OF CH4 OBSERVATIONS mass of a fireball created by a 1014 g fragment. Methanecould be present in the plume after the reentry shock if
(a) July 20 1994 UT: Sites K and L the O/C ratio is less than 1 (Zahnle 1996), but only at the1013-g level. Therefore, the mixing of the plume with jovianFigure 13 shows a comparison between CH4 spectra ob-air at pressures less than 0.1 mbar should not significantlyserved over the L and K sites and outside the impacts onalter the methane mixing ratio in this region. Also, theJuly 20, 08:57 UT. As discussed in Section 3, the strongatmospheric mass above p 5 0.1 mbar is p100 times largermethane line at 1233.455 cm21 is strongly enhanced overthan the mass of dry jovian air shocked at T . 2000 Kthe K and L sites. This enhancement most likely resultsduring the plume reentry, a temperature above whichfrom a temperature increase in the upper stratospheremethane may be processed into more complex hydrocar-rather than a modification of the CH4 abundance profile.bons (Zahnle 1996). Therefore, composition changes in-The first argument in favor of a temperature increase isduced by shock chemistry should not have altered signifi-that it was not observed over sites older than 4 days eithercantly the methane abundance profile in the stratosphere.with Irshell (Figs. 4–6) or in MIRAC2 7.85-em imagesThird, we note that the total mass of cooler jovian air(Orton et al. 1995). The 2-day time scale observed (Ortonlifted from the troposphere is probably in excess of 1016 get al. 1995) is much shorter than the lifetime of methane(Griffith et al. 1996), resulting in a local contaminationor the vertical mixing time at the altitudes affected by theof the stratosphere with tropospheric air. However, thisplume fallback [p , 0.1 mbar] (Gladstone et al. 1996). The‘‘pollution’’ is ineffective even at pressure levels less thansecond argument deals with mass considerations. The massp10 ebar, where the nominal CH4 mixing ratio becomesof the atmosphere above p 5 0.1 mbar over an area 15–significantly lower than the tropospheric value. Test calcu-20,000 km broad is on the order of 1017 g, 1% of which is
methane. This is p1000 times larger than the predicted lations with a constant mixing ratio in the whole atmo-

TEMPERATURE AND HCN IN JUPITER AFTER SL9 IMPACT 103
FIG. 7. Same as described in the legend to Fig. 6 for Scan 30-14. LCM is 2988 W.
sphere instead of Gladstone et al. ’s (1996) photochemical ‘‘nominal’’ background seen at an airmass of 3.3 (25 610%) and an area off the planet with a null flux (25%).profile yield a modest 5% increase in the line emission.
Consequently, we assume hereafter that the increase in The K site was observed at an airmass of 1.4, near thecentral meridian.CH4 emission is entirely due to perturbations in the ther-
mal structure, and we use our nominal CH4 mixing ratio In a first class of models, we perturbed the nominaltemperature profile by a fixed amount (DT0) above a cutoffprofile in all synthetic calculations.
The major characteristic of the CH4 emission enhance- level (p0) which could represent the mean pressure of thereentry shock. This is the type of model employed byment is that it affects almost exclusively the strong line
and not the weaker lines. This can be understood only if Lellouch et al. (1995) and Marten et al. (1995) in theiranalysis of millimeter lines of CO, CS, and HCN detectedthe temperature increase is confined to the high strato-
sphere, in a region where the contribution function of the over the impact sites. In Fig. 14, the spectrum of the L siteis compared with synthetic spectra for p0 5 1, 0.1, andweak lines is negligible, roughly above the 0.1-mbar region
(Fig. 12). Such a perturbation can still affect the emission 0.01 mbar. In all cases, DT0 was adjusted to reproduce theintensity of the strong CH4 line at 1233.455 cm21. Clearly,in the strong CH4 line because its contribution function
exhibits a significant secondary peak in the region 0.01 to profiles with p0 5 1 or 0.1 mbar produce too much intensityin the weak CH4 lines. Dashed lines in Fig. 15 indicate the0.1 mbar. On the other hand, all CH4 lines are largely
insensitive to any temperature perturbation above the maximum temperature increase allowed by the weak CH4
lines (1233.147 and 1234.375 cm21) as a function of pressurep0.01-mbar region because of the rapid falloff of the meth-ane mixing ratio above this level. Our models of the CH4 level p0 . The criterion for acceptability is that DT0 should
not yield intensities for these weak lines exceeding thosespectra for the L and K sites are presented below.As discussed in Section 3, we assumed that the L site observed by more than 50%. Only limited temperature
changes can be tolerated in the lower stratosphere for bothfills in 50 6 10% of the field of view at a jovian airmassof 5.3. The rest of the field of view divides into the jovian sites: less than p20 K for p0 $ 1 mbar, less than p10 K

104 BEZARD ET AL.
FIG. 8. Same as described in the legend to Fig. 6 for Scan 30-15. LCM is 3068 W.
for p0 $ 10 mbar. For the L site, only profiles with p0 less (Zahnle 1996) which suggest that temperature increasesupward within the plume after the reentry shock (see Sec-than 40 ebar can reproduce the intensity of the strong CH4
line while not significantly enhancing the intensity of the tion 8). For this smoother type of profiles, the pressurelevel p1 can be deeper than p0 as defined in the previousweak lines. On the other hand, values of p0 that are too
low lead to unacceptably high temperatures. An analysis models because the perturbation is still zero at p1 andincreases with height above it. For a given pressure levelof CO emission lines observed at 4.7 em over the L site 4.5
hr after impact (Maillard et al. 1995) provides an additional p1, the power n was adjusted to reproduce the intensity ofthe strong CH4 line (1233.455 cm21). We found that fittingconstraint. These observations indicate a temperature of
274 6 10 K where the CO column density is p1016 molecule simultaneously the weak and strong lines in the spectrumof the L site requires p1 to be less than 500 ebar. A lowercm22, probably around 2 ebar. We regarded this tempera-
ture as an upper limit to the thermal profile of the L site limit on p1 is more difficult to estimate. If the temperatureat 2 ebar is constrained to be less than 274 6 10 K, p111 hr after impact. This condition is fulfilled when p0 is
larger than 8 ebar (Fig. 15). The spectrum of the K site must be larger than 100 ebar. However, the pressure levelwhere the CO temperature was actually 274 6 10 K 4.5provides less stringent constraints than for the L site be-
cause it was observed at lower airmass and later when it hr after impact L (Maillard et al. 1995) is poorly definedand depends on the CO vertical distribution in the plume.was cooler. Following the same criteria, we find that p0
must lie between 800 and 5 ebar for this class of models. The uncertainty on this pressure level could be as high asan order of magnitude on each side. We thus regard 100–In a second step, we considered thermal profiles with
no discontinuity and in which the temperature perturbation 500 ebar as the most likely range for p1 but cannot excludevalues as low as 5 ebar. The K site spectrum does notincreases with height above a certain level p1 . We assumed
that T then varies as the inverse of the pressure raised to provide strong constraints since a solution temperatureprofile can be found for any value of p1 smaller than 10some power n. This type of profile is supported both by
observational constraints (Maillard et al. 1995) and models mbar: the lapse rate is then sufficient to ensure that the

TEMPERATURE AND HCN IN JUPITER AFTER SL9 IMPACT 105
FIG. 9. Same as described in the legend to Fig. 6 for Scan 31-21. The C2H2 line imaged here is located at 747.963 cm21, and the HCN line at747.465 cm21. LCM is 508 W.
weak lines are almost not enhanced while the strong line p1 (20–500 ebar) indicate that this upper limit imposes amaximum temperature increase of 10 K around the 10-is fitted. Figure 16 presents the solution profiles for p1 5
20, 100, and 500 ebar, the maximum allowed pressure. All ebar level.profiles with 20 , p1 , 500 ebar meet around the 5-ebarlevel for the L site and the 10–ebar level for the K site, (c) July 31 1994 UT: Sites K and Wwith temperature respectively reaching 250 and 200 K
On July 31, the K 1 W site observed in Scan 31-12 nowithin 63 K (compared to a ‘‘quiescent’’ value of 170 K).longer exhibits a larger intensity of the 1233.455-cm21 CH4These pressure levels appear to be those for which theline (Fig. 5). As above, the maximum temperature en-temperature perturbation is best determined from ourhancement consistent with these observations is on thedata. Taking into account calibration uncertainties and, inorder of 10 K near 10 ebar.the case of L, an additional uncertainty from the filling
factor, we conclude that the temperature perturbationsamount to 80 6 10 K near 5 ebar for the L site, and 6. ANALYSIS OF C2H2 OBSERVATIONS30 6 5 K near 10 ebar for the K site. The temperature
(a) July 20 1994 UT: Sites E and Hsteps, T0 , in our first class of models are similar to thesevalues if they occur at about a scale height deeper. C2H2 emission is strongly enhanced (p70%) over the E
site observed 2.6 days after impact, and less markedly over(b) July 20 1994 UT: Sites A and E
the H site observed 1.4 day after impact (Fig. 17). Mostof this enhancement very likely results from an increaseAs discussed in Section 3, the A and E sites observed
in Scan 20-15 do not exhibit any intensity enhancement in the temperature rather than in the mixing ratio. A mixingratio as high as 3 3 1024 above the 0.1-mbar level would bein the CH4 lines larger than 10% (Fig. 4). Calculations
performed with temperature models for various values of required to reproduce the enhancement using our nominal

106 BEZARD ET AL.
FIG. 10. Same as described in the legend to Fig. 9 for Scan 31-22. LCM is 588 W.
temperature profile (1 3 1022 if restricted to p , 0.01 by Atreya et al. (1995) and again much lower than whatwould be needed to reproduce the C2H2 observations. Fi-mbar). The corresponding column density would then be
on the order of 3 3 1018 molecule cm22. This is about 30 nally, we note that no intensity increase as large as thatdetected for Site E on July 20 was observed for largertimes larger than the upper limit derived from HST UV
observations of the G site (Atreya et al. 1995). We note impact sites on July 30 and 31. This would not be expectedif the enhancement resulted from an increase in the C2H2however that comparison of our observations with the HST
UV results might be inappropriate since the HST/FOS had abundance, since the lifetime of this compound is on theorder of a year in the region 10 to 100 ebar (Gladstonean aperture diameter half of ours and only observed the
core of the impact site. If acetylene production predomi- et al. 1996). We will therefore hereafter assume that thestronger C2H2 line intensities result from a warmer temper-nantly occurred in the outskirts of the perturbed sites,
several thousands of kilometers away from the entry loca- ature profile.In contrast to the C2H2 line, only an upper limit of 10%tion (as in Zahnle’s (1996) chemical–dynamical model),
our observations may have detected more C2H2 than HST/ can be set on the enhancement in the CH4 emission at1233.455 cm21 over the E site observed an hour beforeFOS spectra did.
Chemistry at work in dry jovian air shocked at T . 3000 (Figs. 4 and 6). This behavior can again be explainedthrough the difference in the weighting functions of theK is expected to produce acetylene with a maximum mass
mixing ratio of 0.01 (Zahnle 1996). According to Zahnle’s two lines, the contribution to the emission extending higherfor C2H2 (Fig. 12). Temperature profiles primarily per-model, 6 3 1014 g of jovian air are shocked at these temper-
atures for the biggest impactors. Assuming a plume exten- turbed above the p10-ebar region can then produce amuch stronger increase in the C2H2 radiance than for CH4 .sion of p18,000 km (as visible on our images), the C2H2
column density thus produced would be at most 5 3 1016 We first modeled these observations using temperatureprofiles warmed up by a constant amount (DT0) above amolecule cm22, and probably much less for the smaller E
fragment. This quantity is similar to the upper limit derived pressure level p0 (see Section 5). For a given value of
TEMPERATURE AND HCN IN JUPITER AFTER SL9 IMPACT 107
FIG. 11. Nominal temperature profile (T) and hydrocarbon distributions (CH4 and C2H2) used in the radiative transfer model. Synthetic spectragenerated with this atmospheric model reproduce the CH4 and C2H2 lines observed outside the impact regions.
p0 , we first searched for the value of DT0 , allowing us to limb at an airmass of about 3 (Fig. 6). Fitting the C2H2
line with the same type of temperature profile requiresreproduce the intensity of the C2H2 line. We then calcu-lated the corresponding radiance for the CH4 line and that T1 is 183 6 5 K at 3 ebar, in excess of 12 6 5 K
of the nominal one. Besides calibration uncertainties, wecompared it with the maximum allowed (Fig. 18a). Asexpected, temperature profiles perturbed at levels that are included pointing uncertainties because of the less favor-
able geometry of the observations. Considering a 60.5too deep produce too much CH4 emission. More surpris-ingly, profiles for which the temperature increase is con- possible error in the airmass, this uncertainty alone
amounts to about 64 K (already included in the total one).fined to pressures less than p5 ebar also yield too muchCH4 emission. This behavior results from the extremely The spectrum calculated with this temperature profile is
shown in Fig. 17.rapid decrease of the C2H2 mole fraction and weightingfunction above the p1-ebar region, more pronounced thanfor CH4 . Taking into account a 10% calibration uncertainty
(b) July 30 1994 UT: Site K 1 Win the C2H2 enhancement, we conclude that only profileswith p0 in the range 3 to 8 ebar can simultaneouly match As discussed above, the same acetylene line seems to
be enhanced by p20% over the K 1 W site, observed 11the intensity of the C2H2 line and induce a CH4 line increaselimited to less than 10%. We also tested our second class days after impact K and 8 days after impact W (Scans 30-
14 and 30-15 shown in Figs. 7 and 8). The increase in theof temperature profiles in which temperature increases asa power n of 1/p above a pressure level p1 (see Section 5). C2H2 column density required to reproduce this enhance-
ment, assuming that the temperature profile is nominal, isAgain we find that only a limited range of pressure levelsp1, namely 6–20 ebar, allow us to match the C2H2 line p4 3 1017 molecule cm22 (deposited above the 10- or 100-
ebar levels). This is about 4 times higher than the HSTintensity while not significantly enhancing the CH4 line(Fig. 18b). All solution profiles are characterized by a tem- UV upper limit for the G impact (Atreya et al. 1995), which
should be roughly of the same size as K. Summing overperature of 208 6 2 K around 3 ebar, the region where mostinformation is available. When calibration uncertainty is all pixels, we found that the total mass needed to explain
this bright spot would be p3 3 1013 g. This is about 6included, the error bars amount to 67 K. The temperatureincrease at 3 ebar is then DT1 5 37 6 7 K. times larger than predicted by Zahnle (1996) for a ‘‘large’’
impactor (1014 g). These differences however are not soThe H site is visible on the same scan near the Eastern

108 BEZARD ET AL.
FIG. 12. Contribution functions (see text for definition) at the center of the CH4 lines at 1233.455 and 1233.147 cm21, and of the C2H2 line at743.265 cm21. Calculations are based on the atmospheric model depicted in Fig. 11 and use an airmass of 1.5.
overwhelming that an interpretation through a C2H2 abun- ted as an increase in the C2H2 column density by p2.5 31017 molecule cm22 above the 10–ebar level, yielding adance increase should be readily ruled out. On the other
hand, this interpretation would not explain why no en- total mass of p2 3 1013 g over the complex. Alternatively,it can be explained with a temperature increase of 10.5 6hancement in the C2H2 radiance is detected over the L
and G sites (Fig. 8). The corresponding upper limit on the 1 K around 3 ebar, using a profile perturbed above p1 510 ebar (8 6 1 K if p1 5 100 ebar).column abundance deposited by G or L above the 100-
ebar level is 2 3 1017 molecule cm22. A summary of the temperature perturbations inferredfrom the CH4 and the C2H2 observations is given in Ta-The C2H2 bright spot can alternatively be interpreted
by slightly larger temperatures over the K 1 W site. Using ble II.a profile altered above p1 5 100 ebar, a temperature of181 6 1 K at 3 ebar, i.e., an increase by 10 6 1 K over
7. ANALYSIS OF HCN OBSERVATIONSnominal, is implied by the observations. This temperaturegoes up to 184 6 1 K for a model with p1 5 10 ebar. Such HCN emission was detected on all sites observed (Figs.a small modification of the temperature profile is consistent 6–10). HCN, which was absent from Jupiter’s stratospherewith methane images recorded one day later, showing no prior to the impacts (Bezard et al. 1995), is a product ofcontrast exceeding 10% (Scan 31-12 in Fig. 5). shock chemistry. It is expected to form in the dry jovian
air shocked to temperatures higher than 1500 K, ejected(c) July 31 1994 UT: Complex R–Q2–Q1–B–N
with the plume above the atmosphere, and falling back10–15 min after the explosions (Zahnle 1996). It is thusAcetylene emission is higher by p15% in the region of
the R, Q2, Q1, B, and N impacts observed in Scans 31-21 deposited in this reentry shock region where we also ob-served modifications of the thermal structure. In this regionand 31-22 (Figs. 9, 10). This enhancement may be interpre-

TEMPERATURE AND HCN IN JUPITER AFTER SL9 IMPACT 109
FIG. 13. Spectra recorded on July 20, 08:57 UT (Scan 20-32) over the L site, the K site, and outside the impact sites (lines with squares) arecompared with best fit synthetic spectra (thick solid lines). The observed spectra have been corrected for Doppler shift.
(10–100 ebar), the eddy mixing time is on the order of 1 observed HCN lines. First, we fixed the HCN mole fractionto zero below the level where the temperature model isor 2 years (Gladstone et al. 1996), i.e., much longer than
our observation period at the IRTF. perturbed. For models where we considered a constanttemperature increase above a level p0 , we adopted a con-We used these arguments as guidelines for modeling the

110 BEZARD ET AL.
FIG. 14. A comparison of the CH4 spectrum observed over the L site (Scan 20-32; Col. 3, Row 3) with synthetic spectra calculated for temperatureprofiles perturbed above pressure levels of 0.01 (a), 0.1 (b), and 1 (c) mbar (see text). In all three cases, the constant perturbation is adjusted toreproduce the CH4 line at 1233.455 cm21.
stant HCN mole fraction above p0. For models where tem- perature departure required to reproduce the C2H2 lineintensity, and then the HCN column density from the HCNperature regularly increases upward above level p1 , we
chose an HCN mole fraction increasing with height as p20.5. line intensity. The total mass of HCN is derived by sum-ming the column density times the area sustained byThe latter case may be a more physical representation of
reality because both temperature and mass mixing ratio each pixel.are predicted to increase upward in the plume fallbackregion (Zahnle 1996). Also, Lellouch (1996) estimated that
(a) July 20 1994 UT: Sites E and Ha better reproduction of millimeter CO lines observed onthe G site (Lellouch et al. 1995) is achieved with a mixing Our nominal model yields a maximum HCN column
density of 4.5 6 0.5 3 1015 molecule cm22 for the E siteratio varying as p20.5 above 0.1 mbar. Based on our analysesof the CH4 and C2H2 lines, our nominal cases incorporate (averaged over the four brightest pixels). The error bars
account for the noise level and uncertainties in the contin-p1 5 100 ebar for large impacts (G, K, L) and p1 5 15ebar for smaller impacts such as E, H, Q1, R, and W. The uum placement around the HCN line. The corresponding
HCN mole fraction at 15 ebar is 1.4 3 1026 and in-first group is cataloged as Class 1 by Hammel et al. (1995),and the second group as Class 2 (a or b). We also tested creases with height as p20.5. The model that best fits the
spectrum at the center of the impact site is shown in Fig.the other set of models (a constant temperature increaseabove level p0) with p0 5 15 ebar for large impacts and 5 17. Contributions from all pixels between Rows 3 and 15
were summed to derive a value of 0.95 6 0.1 3 1012 gramsebar for smaller impacts.In each case, the temperature departure (DT0 above p0 , for the E site. Emission from Rows 1 and 2 most likely
originates from Impact A.or DT1 at 3 ebar) is constrained by the simultaneous C2H2
observations. For each pixel, we first determined the tem- The same analysis for the H site (Rows 16 to 21) provides

TEMPERATURE AND HCN IN JUPITER AFTER SL9 IMPACT 111
FIG. 15. Dashed lines: Maximum temperature increase (DT0) above pressure level p0 consistent with the intensity of the weak CH4 lines observedover the L site (triangles) and the K site (squares). Solid lines: Temperature increase above pressure level p0 needed to reproduce the strong CH4
line at 1233.455 cm21 observed over the L and K sites. Only models with p0 , 40 ebar for the L site and p0 , 800 ebar for the K site satisfy thetwo constraints. The error bars on DT0 account for a 20% uncertainty on the flux calibration and, for the L impact, an additional uncertainty in thearea coverage of the site within the field of view (see text).
a maximum HCN column density of 2.7 6 0.3 3 1015 to 100 ebar. Attributing the C2H2 intensity enhancementmolecule cm22, about 40% lower than for Site E. Summing to a temperature increase from the more recent and smallerthe contributions over all relevant pixels yields a mass of W impactor, we used a temperature model perturbed0.45 6 0.05 3 1012 grams. above p1 5 15 ebar as we did for the E and H sites. Solving
Larger systematic errors arise from assumptions in the simultaneously for the temperature departure and themodel. Varying the HCN vertical distribution from a p20.5 HCN vertical profile, we inferred a column densityto a p20.25 or a p20.75 height dependence yields a 620% P1.4 3 1016 molecule cm22 at the impact center, corre-variation on the HCN mass for E (616% for H). Varying sponding to a mixing ratio of 0.6 3 1026 at 100 ebar. Usingp1 between 7 and 20 ebar has a dramatic 115/250% effect the nominal temperature profile in the atmospheric modelon the mass for E (110/245% for H). Alternative models would yield a maximum column density 20% higher. Modelwith a constant temperature increase and uniform HCN uncertainties were estimated by considering different verti-mole fraction above p0 lead to HCN mass departures of cal distributions for HCN: varying as p20.25 or p20.75 above125/245% from the nominal model when p0 is varied 100 ebar, having cutoff pressure levels between 20 andbetween 3 and 7 ebar. Finally a 10% uncertainty in the 500 ebar, or constant above pressure levels in the rangeflux calibration induces an additional 610% uncertainty in 8–40 ebar. In the error analysis, we also considered thethe HCN mass for each site. Combining all error bars nominal temperature profile, accordingly assuming that thequadratically leads to masses of 0.95 6 0.5 3 1012 g on the C2H2 enhancement was due to a real abundance increase.E site, and 0.45 6 0.2 3 1012 g for the H site. Summing the contributions from all pixels over the K 1
W site, a total mass of 2.111.020.6 3 1012 g was derived.
(b) July 30 1994 UT: Sites K 1 W and G 1 LHCN emission was also present over the L and G sites
(Fig. 8, Rows 1–16). Because C2H2 emission appears to beHCN emission on the K 1 W site was mapped in Scan30-14 (Rows 7–21) (Fig. 7). Our nominal model for the nominal over this area, we adopted the nominal tempera-
ture profile to model the HCN lines. We used a mixing ratiobig impact K assumes a HCN distribution extending down
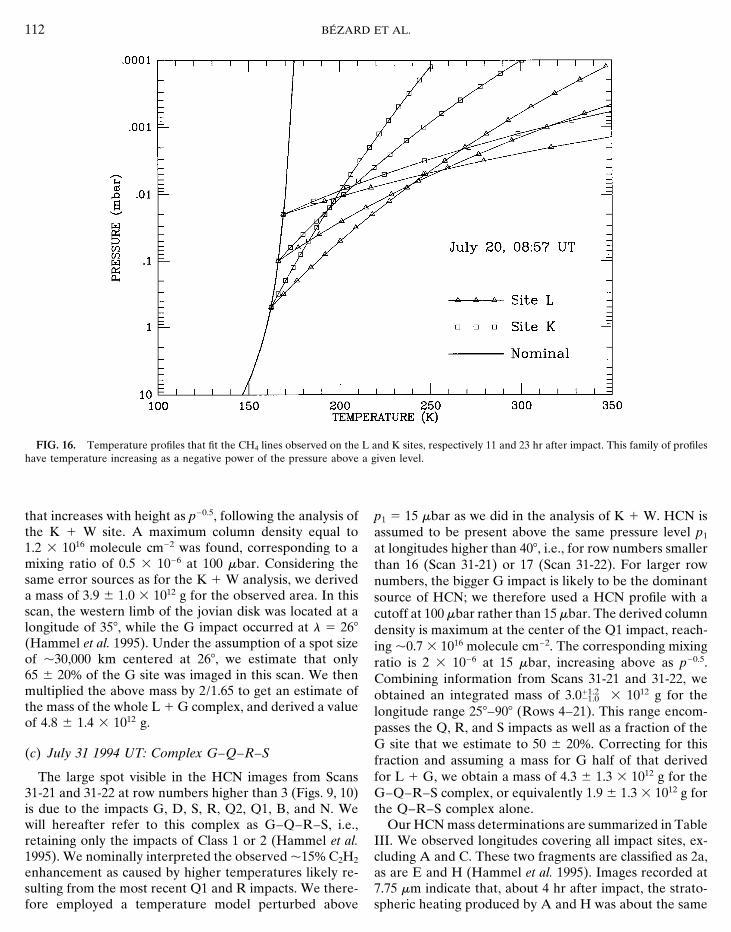
112 BEZARD ET AL.
FIG. 16. Temperature profiles that fit the CH4 lines observed on the L and K sites, respectively 11 and 23 hr after impact. This family of profileshave temperature increasing as a negative power of the pressure above a given level.
that increases with height as p20.5, following the analysis of p1 5 15 ebar as we did in the analysis of K 1 W. HCN isthe K 1 W site. A maximum column density equal to assumed to be present above the same pressure level p1
1.2 3 1016 molecule cm22 was found, corresponding to a at longitudes higher than 408, i.e., for row numbers smallermixing ratio of 0.5 3 1026 at 100 ebar. Considering the than 16 (Scan 31-21) or 17 (Scan 31-22). For larger rowsame error sources as for the K 1 W analysis, we derived numbers, the bigger G impact is likely to be the dominanta mass of 3.9 6 1.0 3 1012 g for the observed area. In this source of HCN; we therefore used a HCN profile with ascan, the western limb of the jovian disk was located at a cutoff at 100 ebar rather than 15 ebar. The derived columnlongitude of 358, while the G impact occurred at l 5 268 density is maximum at the center of the Q1 impact, reach-(Hammel et al. 1995). Under the assumption of a spot size ing p0.7 3 1016 molecule cm22. The corresponding mixingof p30,000 km centered at 268, we estimate that only ratio is 2 3 1026 at 15 ebar, increasing above as p20.5.65 6 20% of the G site was imaged in this scan. We then Combining information from Scans 31-21 and 31-22, wemultiplied the above mass by 2/1.65 to get an estimate of obtained an integrated mass of 3.011.2
21.0 3 1012 g for thethe mass of the whole L 1 G complex, and derived a value longitude range 258–908 (Rows 4–21). This range encom-of 4.8 6 1.4 3 1012 g. passes the Q, R, and S impacts as well as a fraction of the
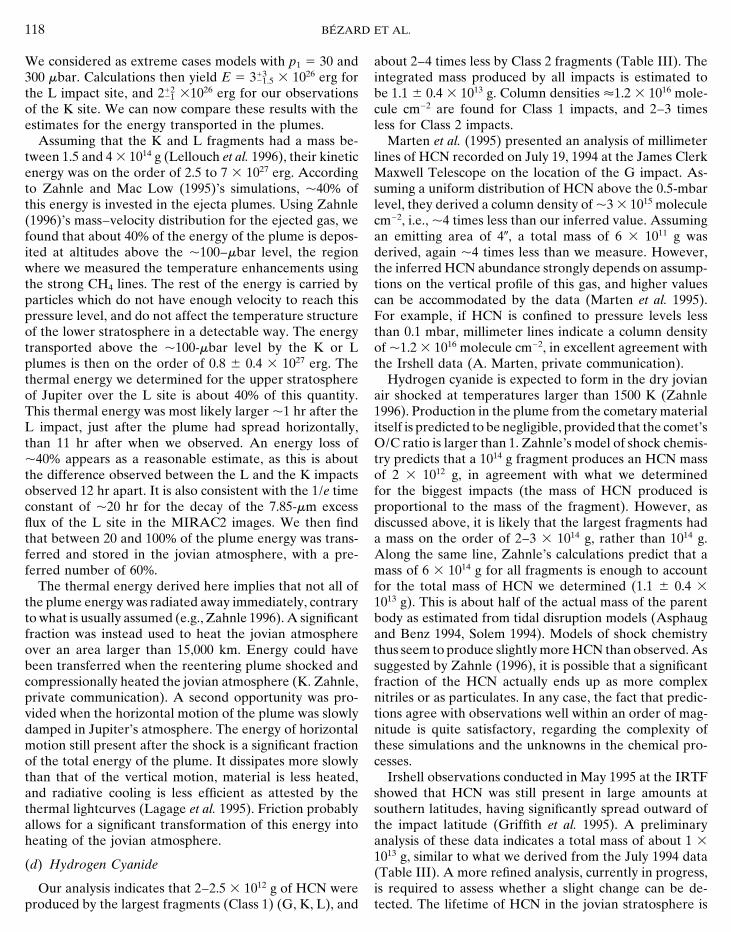
G site that we estimate to 50 6 20%. Correcting for this(c) July 31 1994 UT: Complex G–Q–R–S fraction and assuming a mass for G half of that derived
for L 1 G, we obtain a mass of 4.3 6 1.3 3 1012 g for theThe large spot visible in the HCN images from Scans31-21 and 31-22 at row numbers higher than 3 (Figs. 9, 10) G–Q–R–S complex, or equivalently 1.9 6 1.3 3 1012 g for
the Q–R–S complex alone.is due to the impacts G, D, S, R, Q2, Q1, B, and N. Wewill hereafter refer to this complex as G–Q–R–S, i.e., Our HCN mass determinations are summarized in Table
III. We observed longitudes covering all impact sites, ex-retaining only the impacts of Class 1 or 2 (Hammel et al.1995). We nominally interpreted the observed p15% C2H2 cluding A and C. These two fragments are classified as 2a,
as are E and H (Hammel et al. 1995). Images recorded atenhancement as caused by higher temperatures likely re-sulting from the most recent Q1 and R impacts. We there- 7.75 em indicate that, about 4 hr after impact, the strato-
spheric heating produced by A and H was about the samefore employed a temperature model perturbed above

TEMPERATURE AND HCN IN JUPITER AFTER SL9 IMPACT 113
FIG. 17. Spectra recorded on July 20, 06:14 UT over the E site, the H site, and outside the impact sites (lines with squares) are compared withbest fit synthetic spectra (thick solid lines). The nominal temperature profile (Fig. 11) was used in the calculations outside the impacts. On theimpact sites, the temperature model departs from the nominal profile above the 15-ebar level, reaching a temperature of 182 K for H, and 208 Kfor E at 3 ebar. An HCN mole fraction of 1.4 3 1026 at 15 ebar, increasing with height as 1/Ïp, was used for the E and H spectra. The observedspectra have been corrected for Doppler shift.

114 BEZARD ET AL.
FIG. 18. (a) Solid line: Plot of the temperature increase DT0 as a function of the cutoff pressure level p0 needed to reproduce the C2H2 lineenhancement for Site E (July 20, 06:04 UT). The perturbation DT0 is assumed to be constant above p0. Dashed line: Ratio of the CH4 line intensityfor the perturbed temperature profile to that for the nominal profile as a function of p0. The horizontal long-dashed line sets the upper limitconsistent with the CH4 spectral image from Scan 20-15. Models with p0 between 3 and 8 ebar are consistent with the observations. (b) Same as(a) for a second class of smoother temperature models in which temperature departs from the nominal profile at a pressure level p1 , varying aboveas p2n. DT1 denotes the temperature increase at the 3-ebar level with respect to the nominal value of 171 K. Models with p1 lying between 6 and20 ebar are consistent with the observations.

TEMPERATURE AND HCN IN JUPITER AFTER SL9 IMPACT 115
TABLE II Heterodyne observations of rotational HCN and COTemperature Retrievals lines at the G impact site show that these species were
only present above the 300- (CO: Lellouch et al. 1995,Time elapsed Temperature Pressure level
Lellouch 1996), or 500-ebar levels (HCN: Marten et al.Site since impact (days) increase (K) (ebar)1995). On the other hand, their vertical distribution must
K 10.9 30 6 5 10 extend down to at least the region 50–100 ebar to repro-L 10.4 80 6 10 5 duce the width of the lines, larger than that expected solelyE 12.6 ,10 10 from Doppler broadening and velocity smearing. Upwelled
12.6 37 6 7 3parcels of jovian and cometary air are expected to depositH 11.4 12 6 5 3both their energy and the compounds formed by shockW 18.8 ,10 10
18.0 p13a 3 chemistry in the region of the reentry shock. NumericalQ1 110.4 p10b 3 simulations indicate that the lower boundary of the fallen
plume (where the ejecta are deposited) is mostly in thea Observations can alternatively be interpreted by an increase in the
range 10–100 ebar for a big impact (Zahnle and Mac LowC2H2 column density of p4 3 1017 molecule cm22.1995, Zahnle 1996). Our finding that temperature perturba-b Observations can alternatively be interpreted by an increase in the
C2H2 column density of p2.5 3 1017 molecule cm22. tions were confined above the 500-ebar level is thus consis-tent with models of the ejecta plume reentry and withheterodyne observations of molecules formed by shockchemistry.
(Livengood et al. 1995), suggesting that they had similarMethane band observations of the L and K sites were
masses. A reasonable guess of the HCN mass produced inalso performed with the MIRAC2 camera at the IRTF
A and C may be 1.0 6 0.4 3 1012 g, i.e., about twice thatusing a narrow filter (2%) centered at 7.85 em (Orton et
produced by H. This number is also about half of the massal. 1995). A reanalysis of the MIRAC2 images shows that
found in Q–R–S. We then estimated the total mass ofthe radiance over the L site was 2–3 times higher than the
HCN produced by all impacts (A–W) and found 1.1 6surroundings 4 hr after impact, and about 40% higher 31
0.4 3 1013 g. Here we added the errors from our differenthr after impact. The K site showed a 35% excess emission
observations, because most of these are systematic and do43 hr after impact. We attempted to compare Irshell results
not add quadratically.with MIRAC2 observations by calculating the excess radi-ance expected in the MIRAC2 filter using the temperature
8. DISCUSSION models we inferred. We found 7.85-em radiancesamounting to 2.2 times the nominal one for L observed
(a) Temperature11 hr after impact, and to 1.3 times nominal for K observed23 hr after impact. We conclude that the two data sets doSimultaneous analysis of strong and weak CH4 lines
clearly shows that the stratospheric heating induced by the not show any major inconsistency, considering the uncer-tainties in the flux calibrations.impacts over areas 15,000 km wide or larger was confined
to upper atmospheric levels. For the L site observed 11 hr Observations of CO emission lines at 4.7 em over theL site 4.5 hr after impact indicate temperatures aroundafter impact, the temperature increase did not exceed 20
K below 1 mbar (less than 10 K below 10 mbar) (Fig. 15), 275 K in the plume (Maillard et al. 1995, Brooke et al. 1996).This temperature pertains to the p 1016 CO molecule cm22whereas it reached p80 K in the 5-ebar region. Models in
which temperature is uniformly increased above a given level. The corresponding atmospheric level obviously de-pends on the actual vertical profile of CO in the plume ofpressure level require that this level is no deeper than 40
ebar. Smoother temperature models with a constant lapserate set above a pressure level p1 can also reproduce theCH4 observations, provided that p1 is less than 500 ebar. TABLE III
HCN RetrievalsFigure 19 shows profiles of this type (with p1 5 100 ebar)inferred for the L and K sites.
Column density MassIt should be noted that similarly the brightening seenSite (molecule cm22) (g)
over the impact sites in thermal images around 7.7 em(Billebaud et al. 1995, Livengood et al. 1995, Orton et al. E 0.45 6 0.2 3 1016 0.95 6 0.5 3 1012
H 0.27 6 0.1 3 1016 0.45 6 0.2 3 10121995) results from enhanced CH4 emission originatingK 1 W 1.410.7
20.4 3 1016 2.111.020.6 3 1012higher than the 500-ebar level. It is thus incorrect to ascribe
L 1 G 1.2 6 0.3 3 1016 4.85 6 1.4 3 1012the corresponding temperature enhancement to the region
G–Q–R–S 0.7 6 0.3 3 1016 4.3 6 1.3 3 1012
around 10 mbar, despite the fact that weighting functions All (A–W) 1.1 6 0.4 3 1013
peak there (Fig. 12).

116 BEZARD ET AL.
FIG. 19. Temperature profiles derived from the analysis of CH4 lines (K and L sites) and C2H2 lines (E and H sites) recorded on July 20 1994UT. Error bars at the probed levels are indicated. The thick solid line is the nominal temperature profile outside of the impacts. Also indicated isthe temperature determined from observations of CO lines at the L site, 4.5 hr after impact (Maillard et al. 1995).
which little is known. Lellouch et al.’s (1995) profile leads that p1 is located between 6 and 20 ebar. Figure 19 showsthe profiles we inferred for the E and H sites with p1 5to a pressure level of 2 ebar. At this level, the temperature
in our model of the L site lies between 270 and 320 K, 15 ebar as observed on July 20 1994 UT. The E site isdetected in the C2H2 image and not in the CH4 becauseincluding all uncertainties. This is consistent with the tem-
perature derived from the CO lines. However, the large the C2H2 profile extends higher in the stratosphere thanthe CH4 profile. Our results are thus sensitive to the verticaluncertainty on the CO vertical profile precludes any strin-
gent constraints: temperature perturbations half or twice distributions we assumed for these two compounds, basedon the photochemical model by Gladstone et al. (1996).those derived probably could be accommodated with the
CO data (Fig. 19). One would further expect temperatures On the other hand, it should be noted that if the acetyleneand methane profiles had similar vertical distributions, itto be higher 4.5 hr after impact than when we observed,
11 hr after impact. Maillard et al.’s analysis also concluded would be impossible to reproduce the enhancement ob-served for the C2H2 line without producing a similar en-that a strong positive lapse rate, at least 30 K over two
CO pressure decades, probably exists within the plume. hancement in the CH4 strong line.E was a smaller fragment than L or K. This is attested byTemperatures lower than 245 K near the base of the plume
(100 ebar) are quite consistent with our model profiles in the smaller amount of HCN produced and by the weakerlightcurve generated by the reentry shock (e.g., Lagage etwhich temperature rapidly increases upward above a given
p1 (p1 , 500 ebar). al. 1995). Models of the dynamics of the ejecta plumespredict that the pressure of the reentry shock is propor-The E site was imaged with Irshell 2.6 days after impact.
The fact that E is very bright in the C2H2 image and not tional to the mass of the fragment (Zahnle and Mac Low1995). The temperature increase due to this shock is thusvisible in the CH4 image carries valuable information on
the location of the atmospheric heating. Models in which expected to take place at higher levels for E than for L,in agreement with the present analysis.temperature is uniformly increased above a pressure level
p0 require that this level is in the range 3–8 ebar. Smoother Observations of the E site with the MIRAC2 cameraequipped with the 7.85-em filter indicate a p45% increasetemperature models with a constant lapse rate set above a
pressure level p1 also reproduce the observations, provided in the brightness with respect to its surroundings 12.5 hr

TEMPERATURE AND HCN IN JUPITER AFTER SL9 IMPACT 117
after impact. The site was indistinguishable from the sur- calculations by Lyons and Kansal (1995) indicate that es-sentially all of the methane is converted to acetylene inroundings 3.5 days after impact, with a maximum allowable
excess radiance of p5%. We calculated that Irshell obser- the Jovian air that is shocked at T $ 1700 K during theexplosion phase. According to Zahnle’s simulations, aboutvations of the C2H2 line 2.6 days after impact would yield
a 10% increase in the 7.85-em flux, which fits into the two 10 times the mass of the fragment is shocked above thistemperature; the mass of C2H2 produced by a 1014 g frag-MIRAC2 data points.
We found that the temperature increase needed to re- ment would then be p4 times lower than we would needfor K 1 W. It is in fact possible that the largest fragmentsproduce the C2H2 line intensity over the H site was p3
times smaller than for the E site, despite the fact that it were heavier than 1014 g. A recent analysis of the COmillimeter observations at the K site yields a CO masswas observed sooner after the impact (1.4 vs 2.6 day). This
finding suggests that the E plume was more massive and P1.5 3 1014 g (Lellouch et al. 1996). Chemical modelspredict that this amount is produced by a fragment havinghad accordingly more energy than the H plume, as dis-
cussed later in this section. a mass in the range 2–3 3 1014 g, depending on the O/Cratio in the comet (Zahnle 1996). Such fragments wouldSmall enhancements of the C2H2 line intensity are still
found over the K 1 W and Q1 sites on July 30 and 31, generate quantities of acetylene that are close to thatneeded to reproduce the enhancement of the C2H2 linei.e., 8 to 10 days after impact. If they are interpreted as
resulting from temperature perturbations, they imply en- over the K 1 W and Q1 sites using a nominal tempera-ture profile.hancements of about 113 and 110 K respectively at the
3-ebar level. Such enhancements are not seen on the L However, we note that there was no detectable enhance-ment of the same C2H2 line over the G and L sites, whichand G sites on July 30. It should be noted that 7.93-em
images of Jupiter taken by Billebaud et al. (1995) at the is consistent with the upper limit derived from UV spec-troscopy (Atreya et al. 1995). We thus tend to regard aCFHT also indicate that stratospheric temperatures were
enhanced over the K 1 W and G–Q–R–S complexes on true C2H2 enrichment as a less likely possibility becauseit would imply that detectable amounts of C2H2 were pro-July 25–27 1994, but not over the L and G sites. It may
be not so surprising that the temperature over smaller duced over K 1 W and Q1 and not over L and G. Becausethe mass of C2H2 produced is proportional to the mass ofimpact sites, such as Q1 and W, takes more time to relax
to the nominal state than it does for large impacts such as the impactor, one expects similar amounts over the L, G,and K sites, contrarily to observations.L or G. As mentioned above, the plume energy for the
small impacts is deposited at higher levels than for large(c) Thermal Energyimpacts (Zahnle and Mac Low 1995). It is likely that the
dominant mechanism for cooling the area heated by the The temperature enhancements observed over largeplume fallback is infrared emission from the impact debris areas several hours after the impacts show that the energyparticles (Zahnle 1996). The residence time of these parti- of the plumes was partly transferred to the jovian atmo-cles is however limited by sedimentation. The sedimenta- sphere, and not immediately radiated away. Our resultstion time for 0.1-em particles is on the order of 2 days can be used to estimate the amount of thermal energynear 100 ebar (West et al. 1995), which may be sufficient stored in the jovian atmosphere. This energy E is given by:to efficiently cool the areas perturbed by Class 1 impactors.This time goes down to about 10 hr around 20 ebar, apressure level probably representative of the Class 2 im- E 5 Cp S H0
n0
p0Ep1
pmin
DT(p) dp,pacts. It is then possible that particles do not stay longenough in the reentry shock regions of small impacts tocompletely cool the areas perturbed. These impact sites where Cp (5 Js k) is the molecular specific heat of the
atmosphere, S is the area over which the thermal perturba-would then tend to stay warm longer.tion takes place, H0 is the atmospheric scale height atstandard temperature T0 , n0 is the atmospheric number
(b) Acetylene?density at pressure p0 and temperature T0 , and DT(p) isthe temperature increase extending between pressure lev-These limited C2H2 line enhancements may alternatively
be explained by a C2H2 column density exceeding the nom- els pmin and p1 .We estimated this energy for impact sites L and K ob-inal values by 2–4 3 1017 molecule cm22 over the two sites.
The C2H2 mass required exceeds the production expected served 11 and 23 hr after collision respectively. As a base-line, we used temperature models perturbed above p1 5from chemical kinetics models of the plumes, but not by
an overwhelming amount. Zahnle’s (1996) calculations 100 ebar because, as discussed above, millimeter observa-tions of CO for large impacts indicate a cutoff pressure atpredict that a 1014 g fragment produces a mass of C2H2
p6 times lower than we would need for K 1 W. Recent this level (within about a factor of 2) (Lellouch et al. 1996).
118 BEZARD ET AL.
We considered as extreme cases models with p1 5 30 and about 2–4 times less by Class 2 fragments (Table III). Theintegrated mass produced by all impacts is estimated to300 ebar. Calculations then yield E 5 313
21.5 3 1026 erg forthe L impact site, and 212
21 31026 erg for our observations be 1.1 6 0.4 3 1013 g. Column densities P1.2 3 1016 mole-cule cm22 are found for Class 1 impacts, and 2–3 timesof the K site. We can now compare these results with the
estimates for the energy transported in the plumes. less for Class 2 impacts.Marten et al. (1995) presented an analysis of millimeterAssuming that the K and L fragments had a mass be-
tween 1.5 and 4 3 1014 g (Lellouch et al. 1996), their kinetic lines of HCN recorded on July 19, 1994 at the James ClerkMaxwell Telescope on the location of the G impact. As-energy was on the order of 2.5 to 7 3 1027 erg. According
to Zahnle and Mac Low (1995)’s simulations, p40% of suming a uniform distribution of HCN above the 0.5-mbarlevel, they derived a column density of p3 3 1015 moleculethis energy is invested in the ejecta plumes. Using Zahnle
(1996)’s mass–velocity distribution for the ejected gas, we cm22, i.e., p4 times less than our inferred value. Assumingan emitting area of 40, a total mass of 6 3 1011 g wasfound that about 40% of the energy of the plume is depos-
ited at altitudes above the p100–ebar level, the region derived, again p4 times less than we measure. However,the inferred HCN abundance strongly depends on assump-where we measured the temperature enhancements using
the strong CH4 lines. The rest of the energy is carried by tions on the vertical profile of this gas, and higher valuescan be accommodated by the data (Marten et al. 1995).particles which do not have enough velocity to reach this
pressure level, and do not affect the temperature structure For example, if HCN is confined to pressure levels lessthan 0.1 mbar, millimeter lines indicate a column densityof the lower stratosphere in a detectable way. The energy
transported above the p100-ebar level by the K or L of p1.2 3 1016 molecule cm22, in excellent agreement withthe Irshell data (A. Marten, private communication).plumes is then on the order of 0.8 6 0.4 3 1027 erg. The
thermal energy we determined for the upper stratosphere Hydrogen cyanide is expected to form in the dry jovianair shocked at temperatures larger than 1500 K (Zahnleof Jupiter over the L site is about 40% of this quantity.
This thermal energy was most likely larger p1 hr after the 1996). Production in the plume from the cometary materialitself is predicted to be negligible, provided that the comet’sL impact, just after the plume had spread horizontally,
than 11 hr after when we observed. An energy loss of O/C ratio is larger than 1. Zahnle’s model of shock chemis-try predicts that a 1014 g fragment produces an HCN massp40% appears as a reasonable estimate, as this is about
the difference observed between the L and the K impacts of 2 3 1012 g, in agreement with what we determinedfor the biggest impacts (the mass of HCN produced isobserved 12 hr apart. It is also consistent with the 1/e time
constant of p20 hr for the decay of the 7.85-em excess proportional to the mass of the fragment). However, asdiscussed above, it is likely that the largest fragments hadflux of the L site in the MIRAC2 images. We then find
that between 20 and 100% of the plume energy was trans- a mass on the order of 2–3 3 1014 g, rather than 1014 g.Along the same line, Zahnle’s calculations predict that aferred and stored in the jovian atmosphere, with a pre-
ferred number of 60%. mass of 6 3 1014 g for all fragments is enough to accountfor the total mass of HCN we determined (1.1 6 0.4 3The thermal energy derived here implies that not all of
the plume energy was radiated away immediately, contrary 1013 g). This is about half of the actual mass of the parentbody as estimated from tidal disruption models (Asphaugto what is usually assumed (e.g., Zahnle 1996). A significant
fraction was instead used to heat the jovian atmosphere and Benz 1994, Solem 1994). Models of shock chemistrythus seem to produce slightly more HCN than observed. Asover an area larger than 15,000 km. Energy could have
been transferred when the reentering plume shocked and suggested by Zahnle (1996), it is possible that a significantfraction of the HCN actually ends up as more complexcompressionally heated the jovian atmosphere (K. Zahnle,
private communication). A second opportunity was pro- nitriles or as particulates. In any case, the fact that predic-tions agree with observations well within an order of mag-vided when the horizontal motion of the plume was slowly
damped in Jupiter’s atmosphere. The energy of horizontal nitude is quite satisfactory, regarding the complexity ofthese simulations and the unknowns in the chemical pro-motion still present after the shock is a significant fraction
of the total energy of the plume. It dissipates more slowly cesses.Irshell observations conducted in May 1995 at the IRTFthan that of the vertical motion, material is less heated,
and radiative cooling is less efficient as attested by the showed that HCN was still present in large amounts atsouthern latitudes, having significantly spread outward ofthermal lightcurves (Lagage et al. 1995). Friction probably
allows for a significant transformation of this energy into the impact latitude (Griffith et al. 1995). A preliminaryanalysis of these data indicates a total mass of about 1 3heating of the jovian atmosphere.1013 g, similar to what we derived from the July 1994 data
(d) Hydrogen Cyanide(Table III). A more refined analysis, currently in progress,is required to assess whether a slight change can be de-Our analysis indicates that 2–2.5 3 1012 g of HCN were
produced by the largest fragments (Class 1) (G, K, L), and tected. The lifetime of HCN in the jovian stratosphere is

TEMPERATURE AND HCN IN JUPITER AFTER SL9 IMPACT 119
likely to be governed by vertical mixing and should there- (which exhibit a similar ratio between luminosity and HCNmass) were dustier than E and A (considering Livengoodfore exceed a year (Marten et al. 1995). Its abundance is
then expected to be about the same 10 months after the et al.’s observations). This variability could originate eitherfrom a real heterogeneity of the comet fragments, or fromcollision, except if some is produced from photochemistry
of N-compounds over the impact sites as suggested by a difference in the way the ejecta plumes were formedduring the explosions in the jovian troposphere.some recent modeling (Moses et al. 1995).
ACKNOWLEDGMENTS(e) Variability of the Impact Plumes
D.M.K. and J.H.L. were supported by NSF Grant AST-9020292 andModels of the dynamics and chemistry of the impactUSAF Contract F19628-93-K-0011. C.G. was supported in part from theplumes (Zahnle and Mac Low 1994, Zahnle 1996) predictNSF Young Investigator Award and from the NSF/NASA/SL9 Program.
that the pressure levels of the reentry shocks, the G.S.O. acknowledges support from the NASA office of Space Science,lightcurves then produced, and the mass of compounds Planetary Astronomy and Planetary Atmospheres programs. We are
grateful to the staff and management of the NASA/Infrared Telescopeformed by shock chemistry should all be proportional toFacility for their support. We thank E. Lellouch, A. Marten, andthe mass of the fragment. Although our data indicate thatK. Zahnle for enlightening discussions.Class 1 fragments did produce deeper temperature en-
hancements and more HCN than Class 2 fragments, a moreREFERENCESdetailed intercomparison of our results shows a more sub-
tle behavior. APPLEBY, J. F. 1990. CH4 non-LTE in the atmospheres of the giantThe infrared luminosity of the so-called main event for planets. Icarus 85, 355–379.
the L plume was about 4 times larger than that of the H ASPHAUG, E., AND W. BENZ 1994. Density of Comet Shoemaker–Levy9 deduced by modelling breakup of the parent ‘rubble pile’. Natureevent (Lagage et al. 1995). We accordingly found that the370, 120–124.amount of HCN present over the L site was about 4 times
ATREYA, S. K., T. M. DONAHUE, AND M. C. FESTOU 1981. Jupiter: Struc-that over the H site (Table III). In contrast, the H plumeture and composition of the upper atmosphere. Astrophys. J. 247,radiated about twice as much energy as the E plume duringL43–L47.
the atmospheric reentry (Lagage et al. 1995), while theATREYA, S. K., S. G. EDGINGTON, L. M. TRAFTON, J. J. CALDWELL,
mass of HCN produced by H is about half that produced K. S. NOLL, AND H. A. WEAVER 1995. Abundances of ammonia andby E. We also found that the E site was hotter than the carbon disulfide in the jovian stratosphere following the impact of
Comet Shoemaker–Levy 9. Geophys. Res. Lett. 22, 1625–1628.H site around 3 ebar on July 20 UT, albeit older (2.6 vs1.4 day). This would suggest that either E was more ener- BACHET, G. 1988. Collision-induced spectra for H2–He interactions from
79 to 248 K between 200 and 700 cm21. J. Quant. Spectrosc. Radiat.getic than H or that it lost its energy less efficiently. InTransfer 39, 327–331.the same vein, Livengood et al. (1995) noticed that the
BEZARD, B., C. GRIFFITH, J. LACY, AND T. OWEN 1995. Non-detectiontemperature perturbations were similar over the A and Hof hydrogen cyanide on Jupiter. Icarus 118, 384–391.
sites, which seems to imply that the two fragments hadBILLEBAUD, F., P. DROSSART, I. VAUGLIN, P. MERLIN, F. SIBILLE, P.
about the same energy, while the infrared luminosity of LOGNONNE, E. LELLOUCH, AND B. MOSSER 1995. Ten-micron mappingthe H event was twice that of A. It thus appears that of Jupiter at the CFHT after the impacts of Comet P/Shoemaker–Levy
9. Geophys. Res. Lett. 22, 1777–1780.the H plume was surprisingly luminous with regard to itsenergy, reflected in the HCN produced and in the heating BIRNBAUM, G., AND E. R. COHEN 1976. Theory of line shape in pressure-
induced absorption. J. Can. Phys. 54, 593–602.of the jovian stratosphere.BROOKE, T. Y., G. S. ORTON, D. CRISP, A. J. FRIEDSON, AND G. BJORAKERWe suggest here that this behavior may reveal some
1996. Near-infrared spectroscopy of the Shoemaker–Levy 9 impactvariability in the plume composition among the varioussites with UKIRT: CO emission from the L site and additional 5-em
impacts. The luminosity of the plume is not strictly speak- spectra. Icarus 121, 422–430.ing proportional to its mass, but rather to the mass of the COHEN, E. R., L. FROMMHOLD, AND G. BIRNBAUM 1982. Analysis of theradiating material, likely to be predominantly dust parti- far-infrared H2–He spectrum. J. Chem. Phys. 77, 4933–4941.cles. This is supported by the good correlation between DORE, P., L. NENCINI, AND G. BIRNBAUM 1983. Far infrared absorption
in normal H2 from 77 to 298 K. J. Quant. Spectrosc. Radiat. Transferthe relative luminosity of the plume fallbacks (Lagage et30, 245–253.al. 1995, Meadows et al. 1995) and the optical depth of
DROSSART, P., B. BEZARD, S. K. ATREYA, J. BISHOP, J. H. WAITE JR.,the dust left over the impact sites (West et al. 1995). TheAND D. BOICE 1993. Thermal profiles in the auroral regions of Jupiter.differences in the luminosity, the amount of HCN pro-J. Geophys. Res. 98, 18,803–18,811.
duced, the stratospheric heating, and its evolution withGAUTIER, D., B. BEZARD, A. MARTEN, J. P. BALUTEAU, N. SCOTT,
time can then be understood if the E plume was more A. CHEDIN, V. KUNDE, AND R. HANEL 1982. The C/H ratio in Jupitermassive than H but had a lower dust content, i.e., a lower from the Voyager infrared investigation. Astrophys. J. 257, 901–912.dust/gas ratio. From the limited set of observations we GLADSTONE, G. R., M. ALLEN, AND Y. L. YUNG 1996. Hydrocarbon
photochemistry in the upper atmosphere of Jupiter. Icarus 119, 1–52.have, we would then conclude that the H and L plumes

120 BEZARD ET AL.
Canada–France–Hawaii Telescope during the collision of Comet SL-GRIFFITH, C. A., B. BEZARD, T. OWEN, AND D. GAUTIER 1992. Thetropospheric abundances of NH3 and PH3 in Jupiter’s Great Red Spot, 9 with Jupiter. Geophys. Res. Lett. 22, 1573–1576.from Voyager IRIS observations. Icarus 98, 82–93. MARTEN, A., D. GAUTIER, M. J. GRIFFIN, H. E. MATTHEWS, D. A.
NAYLOR, G. R. DAVIS, T. OWEN, G. ORTON, D. BOCKELEE-MORVAN,GRIFFITH, C. A., B. BEZARD, T. GREATHOUSE, D. KELLY, J. LACY, AND
G. ORTON 1995. Jupiter ten months after the collision of Comet SL9: P. COLOM, J. CROVISIER, E. LELLOUCH, I. DE PATER, S. ATREYA,D. STROBEL, B. HAN, AND D. B. SANDERS 1995. The collision of CometSpectral maps of HCN and ammonia. Bull. Am. Astron. Soc. 27, 1126.Shoemaker–Levy 9 with Jupiter: Detection and evolution of HCN inGRIFFITH, C. A., B. BEZARD, T. GREATHOUSE, D. M. KELLY, J. H. LACY,the stratosphere of the planet. Geophys. Res. Lett. 22, 1589–1592.AND K. S. NOLL 1996. Thermal infrared imaging spectroscopy of Shoe-
MEADOWS, V., D. CRISP, G. ORTON, T. BROOKE, AND J. SPENCER 1995.maker–Levy 9 impact sites: Spatial and vertical distributions of NH3 ,AAT IRIS observations of the SL-9 impacts and initial fireball evolu-C2H4, AND 10 em dust emission. Submitted to Icarus.tion. In Proceedings: European SL-9/Jupiter Workshop (R. West andHAGER, J., W. KRIEGER, AND J. PFAB 1981. Collisional deactivation ofH. Bohnhardt, Eds.), pp. 129–134.
laser-excited acetylene by H2 , HBr, N2 and CO. J. Chem. Soc. FaradayMOSES, J. I., M. ALLEN, B. FEGLEY JR., AND G. R. GLADSTONE 1995.Trans. 2 77, 469–476.
Photochemical evolution of the post-SL9 jovian stratosphere. Bull. Am.HAMMEL, H. B., R. F. BEEBE, A. P. INGERSOLL, G. S. ORTON, J. R. MILLS,
Astron. Soc. 27, 1119.A. A. SIMON, P. CHODAS, J. T. CLARKE, E. DE JONG, T. E. DOWLING,
NOLL, K. S., M. A. MCGRATH, L. M. TRAFTON, S. K. ATREYA, J. J.J. HARRINGTON, L. F. HUBER, E. KARKOSCHKA, C. M. SANTORI,CALDWELL, H. A. WEAVER, R. V. YELLE, C. BARNET, AND S. EDGING-A. TOIGO, D. YEOMANS, AND R. A. WEST 1995. HST imaging of atmo-TON 1995. HST spectroscopic observations of Jupiter after the collisionspheric phenomena created by the impact of Comet Shoemaker–Levyof Comet Shoemaker–Levy 9. Science 267, 1307–1313.9. Science 267, 1288–1296.
ORTON, G., M. A’HEARN, K. BAINES, D. DEMING, T. DOWLING,HUSSON, N., B. BONNET, N. A. SCOTT, AND A. CHEDIN 1991. The ‘‘GEISA’’J. GOGUEN, C. GRIFFITH, H. HAMMEL, W. HOFFMANN, D. HUNTEN,data bank 1991 version. Internal note L.M.D. 163, Laboratoire deD. JEWITT, T. KOSTIUK, S. MILLER, K. NOLL, K. ZAHNLE, N. ACHILLEOS,
Meteorologie Dynamique, Palaiseau, France.A. DAYAL, L. DEUTSCH, F. ESPENAK, P. ESTERLE, J. FRIEDSON,
LACY, J. H., J. M. ACHTERMANN, D. E. BRUCE, D. F. LESTER, J. F. ARENS, K. FAST, J. HARRINGTON, J. HORA, R. JOSEPH, D. KELLY, R. KNACKE,M. C. PECK, AND S. D. GAALEMA 1989. IRSHELL: A mid–infrared J. LACY, C. LISSE, J. RAYNER, A. SPRAGUE, M. SHURE, K. WELLS,cryogenic echelle spectrograph. Publ. Astron. Soc. Pac. 101, 1166– P. YANAMANDRA-FISHER, D. ZIPOY, G. BJORAKER, D. BUHL, W. GOL-1175. ISCH, D. GRIEP, C. KAMINSKI, C. ARDEN, A. CHAIKIN, J. GOLDSTEIN,
LAGAGE, P. O., PH. GALDEMARD, E. PANTIN, R. JOUAN, P. MASSE, D. GILMORE, G. FAZIO, T. KANAMORI, H. LAM, T. LIVENGOOD,M.-M. MACLOW, M. MARLEY, T. MOMARY, D. ROBERTSON, P. ROMANI,G. OLOFSSON, M. HULDTGREN, L. NORDH, J. A. BELMONTE, C. REGULO,J. SPITALE, M. SYKES, J. TENNYSON, D. WELLNITZ, AND S.-W. YINGJ. M. RODRIGUEZ ESPINOSA, L. VIDAL, B. MOSSER, A. ULLA, AND
1995. Collision of Comet Shoemaker–Levy 9 with Jupiter observed atD. GAUTIER 1995. Collision of Shoemaker–Levy 9 fragments A, E,the NASA Infrared Telescope Facility. Science 267, 1277–1282.H, L, Q1 with Jupiter: Mid-infrared light curves. Geophys. Res. Lett.
13, 1773–1776. ROHART, F., D. DEROZIER, AND J. LEGRAND 1987. Foreign gas relaxationof the J 5 0 R 1 transition of HC15N. A study of the temperatureLELLOUCH, E. 1996. Chemistry induced by the impacts: Observations. Independence by coherent transients. J. Chem. Phys. 87, 5794–5803.The Collision of Comet Shoemaker–Levy 9 and Jupiter, IAU Collo-
quium No. 156 (K. S. Noll, H. A. Weaver, and P. D. Feldman Eds.), SCHMIDT, C., D. LAMBOT, J. WALRAND, AND G. BLANQUET 1992. Diode–pp. 213–242. Cambridge Univ. Press, Cambridge. laser measurements of N2-broadening coefficients in the n2 band of
HCN. J. Mol. Spectrosc. 151, 292–302.LELLOUCH, E., B. BEZARD, R. MORENO, G. PAUBERT, D. BOCKELEE-MORVAN, P. COLOM, J. CROVISIER, M. FESTOU, AND D. GAUTIER 1996. SOLEM, J. C. 1994. Density and size of Comet Shoemaker–Levy 9 deduced
from a tidal breakup model. Nature 270, 349–351.Carbon monoxide in Jupiter after the impact of Comet Shoemaker Levy9. Presented at International Conference on the SL9–Jupiter Collision, VARANASI, P. 1992. Intensity and linewidth measurements in the 13.7 emMeudon, France, July 3–5, 1996. fundamental bands of 12C2H2 and 12C13CH2 at planetary atmospheric
temperatures. J. Quant. Spectrosc. Radiat. Transfer 47, 263–274.LELLOUCH, E., G. PAUBERT, R. MORENO, M. C. FESTOU, B. BEZARD, D.BOCKELEE-MORVAN, P. COLOM, J. CROVISIER, T. ENCRENAZ, VARANASI, P., AND G. D. T. TEJWANI 1972. Experimental and theoreticalD. GAUTIER, A. MARTEN, D. DESPOIS, D. F. STROBEL, AND A. SIEVERS studies on collision-induced lines in the n4-fundamental of methane. J.1995. Chemical and thermal response of Jupiter’s atmosphere following Quant. Spectrosc. Radiat. Transfer 12, 849–855.the impact of Comet Shoemaker–Levy 9. Nature 373, 592–595. WEST, R. A., E. KARKOSCHKA, A. J. FRIEDSON, M. SEYMOUR, K. H.
LIVENGOOD, T. A., H. U. KAUFL, T. KOSTIUK, G. L. BJORAKER, P. N. BAINES, AND H. B. HAMMEL 1995. Impact debris particles in Jupiter’sstratosphere. Science 267, 1296–1301.ROMANI, G. WIEDEMANN, B. MOSSER, AND M. SAUVAGE 1995. Multi-
wavelength thermal-infrared imaging of SL9 impact phenomena. In ZAHNLE, K. 1996. Dynamics and chemistry of SL9 plumes. In The Colli-Proceedings: European SL-9/Jupiter Workshop (R. West and H. Boh- sion of Comet Shoemaker–Levy 9 and Jupiter, IAU Colloquium No.nhardt, Eds.), pp. 137–145. 156 (K. S. Noll, H. A. Weaver, and P. D. Feldman, Eds.), pp. 183–212.
Cambridge Univ. Press, Cambridge.LYONS, J. R., AND A. KANSAL 1996. A chemical kinetics model for analysisof the Comet Shoemaker–Levy 9 impacts with Jupiter. Submitted to ZAHNLE, K., AND M.-M. MAC LOW 1994. The collision of Jupiter andIcarus. Comet Shoemaker–Levy 9. Icarus 108, 1–17.
MAILLARD, J.-P., P. DROSSART, B. BEZARD, C. DE BERGH, E. LELLOUCH, ZAHNLE, K., AND M.-M. MAC LOW 1995. A simple model for the lightA. MARTEN, J. CALDWELL, J.-C. HILICO, AND S. K. ATREYA 1995. curve generated by a Shoemaker–Levy 9 impact. J. Geophys. Res.Methane and carbon monoxide infrared emissions observed at the 100, 16,885–16,894.