thermal guidelines and temperature measurements in data ......2020/09/15 · figure 4 shows all...
TRANSCRIPT

1
Thermal Guidelines and Temperature Measurements in Data Centers
September 15, 2020
This work sponsored by FEMP
Magnus Herrlin, Ph.D. Lawrence Berkeley National Laboratory One Cyclotron Road Berkeley, CA 94720

2
Copyright
This manuscript has been written by an author at Lawrence Berkeley National Laboratory under Contract No. DE-AC02-05CH11231 with the U.S. Department of Energy. The U.S. Government retains, and the publisher, by accepting the article for publication, acknowledges, that the U.S. Government retains a non-exclusive, paid-up, irrevocable, world-wide license to publish or reproduce the published form of this manuscript, or allow others to do so, for U.S. Government purposes.
Disclaimer
This document was prepared as an account of work sponsored by the United States Government. While this document is believed to contain correct information, neither the United States Government nor any agency thereof, nor The Regents of the University of California, nor any of their employees, makes any warranty, express or implied, or assumes any legal responsibility for the accuracy, completeness, or usefulness of any information, apparatus, product, or process disclosed, or represents that its use would not infringe privately owned rights. Reference herein to any specific commercial product, process, or service by its trade name, trademark, manufacturer, or otherwise, does not necessarily constitute or imply its endorsement, recommendation, or favoring by the United States Government or any agency thereof, or The Regents of the University of California. The views and opinions of authors expressed herein do not necessarily state or reflect those of the United States Government or any agency thereof, or The Regents of the University of California.
Ernest Orlando Lawrence Berkeley National Laboratory is an equal opportunity employer.
Federal Energy Management Program (FEMP)
This work was supported by the Assistant Secretary for Energy Efficiency and Renewable Energy, Federal Energy Management Program, of the U.S. Department of Energy under Contract No. DE-AC02-05CH11231.
Acknowledgements
Chris Payne, LBNL Steve Greenberg, LBNL Dale Sartor, LBNL

3
Table of Contents Page Abstract 4 1. Introduction 5
2. Industry Thermal Guidelines 6 3. Air Management 10 4. Generalized Thermal Best Practices 12 5. Compliance with ASHRAE/NEBS Thermal Guidelines 13 6. Reduced Temperature Sensor Count Schemes 14
7. Measuring Equipment 17
8. Impact of Different Sensor Density and Location 21
Summary 25 References 26

4
Abstract
This document initially develops a list of generalized thermal best-practice recommendations as a first step towards temperature management and measurements in data centers, ultimately saving infrastructure energy as well as protecting the electronic equipment. The next step is to carry out temperature measurements with reduced-count portable or permanent sensor installations. Cost savings with less sensor density could be quite significant in sensor hardware and labor costs. Without a sensible sensor reduction, especially smaller data centers may forego temperature measurements all together due to cost concerns. Consequently, a proven reduced-count sensor configuration is needed. It is demonstrated that a low-density configuration of IT equipment intake air temperature sensors can be remarkably accurate even when reducing the sensor count by 90%. Such level of reduction could provide significant cost savings. In addition, the results show that a seemingly small change in the placement of the temperature sensors along the face of the IT equipment racks could have a significant impact on the accuracy of the measurements.

5
1. Introduction
It can be a challenge to effectively cool data centers, and accurate temperature measurements of the information technology (IT) equipment intake air conditions are key to addressing this challenge. Each individual data center needs to set its own standard for intake temperatures. Key industry guidelines provide valuable guidance, and metrics are often used to make sense of vast amounts of temperature data to determine the compliance with the selected temperature standard. For accurate temperature measurements, it is necessary to have a good understanding of typical temperature profiles along the front of the IT equipment racks. The goal is to capture these temperature profiles with the measurements, often with a very limited number of sensors. Since the vast majority of data centers use cooling from a raised floor plenum, it makes sense to focus on those environments. However, the temperature measurement concepts presented here are applicable to most data centers.
Air management is important for achieving proper intake air temperatures, and accurate temperature measurements are necessary for the success of air management. The goal of air management is to provide an adequate flow of cooling air through the equipment room with minimal mixing of hot and cold air. Air management has the capacity to improve the cooling energy performance and the IT equipment thermal environment.
Inadequate control of the intake air temperatures may not only lead to reduced reliability and longevity for exposed IT equipment but also difficulties operating the data center facility cost effectively. A few local areas with high temperatures (“hotspots”) may drive the entire cooling strategy of the data center. The IT staff is interested in ensuring adequate thermal conditions in the data center to ensure IT equipment uptime and reliability. The facility staff, on the other hand, is interested in curbing the energy consumption of the infrastructure support systems, such as cooling systems. Both of these key data center teams need to have access to accurate temperature data for enhancing the overall operation. Generalized thermal best-practice recommendations provide the first step towards accurate temperature management and measurements. The next step is to carry out actual temperature measurements. Measurement equipment includes external temperature sensors (temporary or permanent) or network data exchange with IT equipment on-board sensors. In either case, the extent of instrumentation in data centers can easily get out of hand and become expensive. If the overall endeavor is viewed as too costly, the effort to operate with improved temperature conditions may never be explored. Therefore, this document looks into the possibility of reducing the temperature sensor count without sacrificing accuracy.

6
2. Industry Thermal Guidelines
The American Society of Heating, Refrigerating, and Air-Conditioning Engineers (ASHRAE) Thermal Guidelines (Figure 1) and Network Equipment-Building System (NEBS) GR-63/3028 (Figure 2) provide guidance on temperature and humidity in IT equipment spaces. These key industry documents are briefly reviewed to provide the necessary background for temperature management and measurements.
One of the purposes of the ASHRAE Thermal Guidelines for Data Processing Environments (ASHRAE, 2015) is to provide standardized operating environments for IT equipment. The ASHRAE guidelines are primarily for data-center equipment and facilities and the NEBS de-facto standard is usually preferred in environments for telecommunications equipment (Telcordia 2001, 2012). The NEBS thermal guidelines have a two-part documentation (Figure 2). The first part provides guidelines for facility operation whereas the second provides guidelines for IT equipment robustness.
Figure 1. ASHRAE Thermal Guidelines (ASHRAE, 2015)
Figure 2. NEBS Thermal Guidelines (Telcordia, 2001 and 2012)

7
Key nomenclature for understanding these industry environmental guidelines includes “recommended” and “allowable” IT equipment intake air temperatures. Figure 3 defines those temperatures with minimum and maximum values. The important concept of “over-temperature” and “under-temperature” is also defined. Note that the recommended range is always fully within the allowable range. The thermal equipment environment is defined by the temperature of the air drawn into the air-cooled equipment, the temperature the electronics depend on for reliable cooling and operation. Those are the temperatures to monitor for managing the thermal environment. The return temperature or the temperature in the middle of the aisle, for example, has little to do with equipment cooling. In the historically mixed environments with poor separation of hot and cold air, the “ambient” temperature made sense but not in modern data centers. Thus, both environmental guidelines and the sensor placement should reflect the IT equipment intake air conditions. To reiterate, air-cooled electronic IT equipment depends exclusively on the intake air temperatures for effective cooling. All environmental specifications refer to these conditions.
Figure 3. Recommended and Allowable definitions (DCEP, 2020)
The purpose of the allowable and recommended ranges is to give guidance to data center operators on maintaining high reliability but yet operate their data centers in an energy-efficient manner.
• The Recommended range, which is a statement of reliability, is the preferred facility operation; most intake air temperatures should be within this range. The IT manufacturers recommend that data centers maintain their environment within these boundaries.
• The Allowable range, which is a statement of functionality, is a measure of the robustness of the
IT equipment; no values should be outside this range. These are the boundaries where IT manufacturers test their equipment to verify that the equipment will function.
For data centers, ASHRAE defines four environmental Classes with different Allowable ranges. The Recommended range (roughly 65°-80°F) is the same for all of those Classes. The “default” Class A1 is typically a data center with tightly controlled environmental parameters (dry-bulb temperature, dew-point temperature, and relative humidity) and mission critical operations.

8
Over the years, convergence has occurred between ASHRAE and NEBS in some areas whereas large discrepancies remain in others (temperature rate-of-change, for example). Table 1 shows that both guidelines have the same recommended range but different “default” allowable ranges.
Table 1. Comparison between ASHRAE and NEBS.
ASHRAE (2015), Telcordia (2001), and Telcordia (2012) environmental guidelines.
Figure 4 shows all ASHRAE environmental envelopes in the standard psychrometric chart, where both temperature (x-axis) and absolute humidity (y-axis) are included. This representation provides a concise way of presenting the environmental envelopes. As can be seen, Class A4 has a much larger envelope and a higher maximum temperature compared to Class A1. There is data center equipment “certified” for ASHRAE Class A3 and even for Class A4. Environmental guidelines more in line with such IT equipment specifications would drastically reduce the need for mechanical cooling.
Figure 4. ASHRAE environmental envelopes.

9
Adopting the ASHRAE or NEBS environmental criteria provides opportunities for reduced cooling energy use. With proper air management, the supply temperature can often be raised well above 70°F without affecting the thermal equipment environment. Whatever temperature Class you decide to operate to, make sure you also conform with that Class during operation. Thermal guidelines become truly useful when there is an objective way of showing the compliance. A performance metric for this purpose is described later in this document.
Finally, humidity is addressed in Table 1 as well. However, humidity is of less concern today than in the past. Nonetheless, there are two main failure mechanisms in electronic equipment caused be humidity conditions in data centers: Electrostatic Discharge (ESD) Failures and Hygroscopic Dust Failures. In the past, increasing space humidity was often used to prevent ESD failures. However, industry practices have changed partly because IT equipment has become more resistant to ESD failures. The recommended procedure is now thorough grounding of equipment, cables, flooring, and personal (wrist straps). Telecom has no lower humidity limit and the Electrostatic Discharge Association has removed humidity control as a primary ESD control measure in ESD/ANSI S20.20. ASHRAE has lowered its minimum recommended humidity level to around 16°F dewpoint or 8% relative humidity.
Some contaminants (hydroscopic salts) in combination with high humidity can cause current leakage or shorts on the IT equipment circuit boards. Operating with high humidity (>60% RH) in a contaminated (soiled) equipment environment could therefore lead to Hygroscopic Dust Failures. If the electronic equipment is refreshed every 3-4 years (common) and adequate building filtration is in place (MERV 13 or higher) equipment soiling rarely reaches critical levels. Although there are exceptions, humidity is generally considered secondary to temperature in today’s data centers. Most of the humidity concerns of past days have been alleviated. As a result, (de)humidification is not recommended in data centers. Therefore, humidity will not be further addressed in this document. More information can be found in Humidity Control in Data Centers (Sorell and Herrlin, 2017).

10
3. Air Management
Air management is a prerequisite for improving equipment reliability and saving energy. Accurate temperature measurements are imperative for the success of air management. A typical intake temperature profile with traditional raised-floor cooling includes under-temperatures at the bottom of the equipment racks and over-temperatures at the top, especially towards the end of the equipment rows. In this section and in section 6, we will look into this pattern in more detail and its significance for temperature measurements. For correct temperature measurements, it is important to capture the temperature profile in front of the information technology (IT) equipment.
The goal of air management is to minimize mixing of hot and cold air streams by minimizing air recirculation of hot IT equipment exhaust air and minimizing by-pass of cold supply air in the data center room. Successfully implemented, both measures result in energy savings and better thermal conditions. Effective air management allows higher supply air temperatures and/or less supply air. One significant difference compared to most other energy-efficiency measures is that air management may impact the thermal IT equipment environment. Air management has the capacity to improve both the system energy performance and the thermal equipment environment. An organized flow of cooling air through the equipment room with minimum mixing often leads to this win-win situation. To be able to avoid sub-optimizations, however, the practitioner needs to understand not only the energy implications but also the electronic equipment reliability and longevity implications of air-management measures. To balance the thermal environment and the energy savings is not trivial.
Again, a typical intake temperature profile in the cold aisles with raised-floor cooling includes under-temperatures (dark blue) at the bottom of the equipment racks and over-temperature (red) at the top, especially towards the end of the equipment lineups (see Figure 5). If the cold (or hot) aisles are fully enclosed, on the other hand, very favorable thermal conditions can be realized.
Figure 5. Typical temperature distribution in front of IT equipment rows (intake air temperatures)
in an open (non-enclosed) data center (Herrlin and Khankari, 2008).

11
Recirculation of hot exhaust air (red arrows in Figure 5) leads to less control of the equipment intake conditions; the implications may be reduced IT equipment reliability and longevity. Resulting “hotspots” or localized overheating may lead to a perceived need to increase the overall supply airflow (higher fan energy) and/or reduce the supply temperature (lower chiller efficiency and less opportunity for air-side and water-side economization). Less control of the intake temperatures may not only lead to reduced reliability and longevity for exposed IT equipment but also difficulty operating cost effectively. A few local hotspots may drive the entire cooling strategy of the data center. Over-head air distribution with diffusers generally has a more favorable temperature profile (not shown). The cold supply air mixes with the warmer surrounding room air through entrainment before reaching the equipment racks. Because of the greater uniformity of intake temperatures, it may be possible to achieve better thermal performance with less airflow compared with a traditional raised-floor environment.
Finally, air-management controls not only include temperature (IT equipment intake/exhaust, cooling unit supply/return) but also airflow. An important element of air management is to control the airflow balance in the data center. Too much supply air leads to by-pass air, which does not contribute to equipment cooling. To little supply air leads to recirculation of hot IT equipment exhaust air to the front of the equipment, which creates hot spots with elevated temperatures. Most data centers have a combination of bypass and recirculation.

12
4. Generalized Thermal Best Practices
The thermal best practices provided in the Data Center Energy Practitioner (DCEP, 2020) training program are summarized below. Included are practices from ASHRAE Thermal Guidelines, NEBS, and other industry documents. These best-practice recommendations are a first step towards temperature management and measurements in data centers, ultimately saving infrastructure energy as well as protecting the electronic equipment.
• Use environmental specifications per ASHRAE or NEBS. Select the default Recommended temperature
range of 65°-80°F [18°-27°C]. The temperature should be controlled to be within the Recommended range at the IT equipment air intakes. Warmer intake temperature and supply air temperature require less cooling energy.
• Select Allowable temperature range A2 or higher. Realize that IT equipment is often rated for wider
temperatures than the A1 range. ASHRAE’s allowable range is 59°-90°F [15°-32°C] for Class A1 and 50°-95°F [10°-35°C] for ASHRAE Class A2. Manufacturers are offering extended Recommended and Allowable temperature range equipment.
• The maximum Recommended temperature can be increased beyond 80°F (27°C) if the user is aware
of the potential drawbacks and benefits. This could be especially useful if Class A2 or higher were selected for the Allowable temperature. The ASHRAE Thermal Guidelines outlines a procedure for analyzing such a scenario.
• Intake temperatures above around 77°F [25°C] for IT equipment with variable-speed fans may speed
up the fans and increase their energy usage. The increase in fan energy may sometimes be larger than the reduction in cooling energy. IT vendors are adjusting their designs and soon higher temperatures may be used without impacting the fan energy.
• Reset supply air temperature upward to keep the most demanding intake air temperature as close to
80°F [27°C] as possible or whatever maximum Recommended temperature is selected. Leaving room for error, a setpoint of 77°- 79°F [25°-26°C] may be the most practical approach for the default Recommended range. See also the previous bullet.
• Control supply temperature (and airflow) based on IT equipment intake air temperatures and not on
the return temperature back to the cooling equipment. Use wired or wireless external-to-rack temperature sensors or, even better, network data exchange with IT equipment on-board temperature sensors. All ENERGY STAR servers have the latter capability.
• Showing compliance with equipment intake air temperature specifications (such as ASHRAE) is the
ultimate cooling performance metric in data centers. The Department of Energy’s Air Management Tool (LBNL, 2014) uses the Rack Cooling Index (RCI) for that purpose. Metrics like RCI allow big data sets of temperatures to be analyzed and understood.

13
5. Compliance with ASHRAE/NEBS Thermal Guidelines As mentioned above, a high-level compliance metric is used in the DOE Air Management Tool (LBNL, 2014): The Rack Cooling Index (RCI). This metric provides a measure of the thermal conformance at the high (HI) end and at the low (LO) end of the IT equipment intake air temperature range, respectively. By using this metric, a large amount of measured and/or Computational Fluid Dynamics (CFD) generated data can be processed and presented in a standardized way. Figure 6 shows a screen shot of the Air Management Tool. The intake air temperatures are entered in the yellow cells and the RCI results are shown in the two orange cells. The RCI metric assumes that each intake air temperature has the same weight. The Tool also plots the intake temperature data.
Figure 6. Calculation of RCI with the DOE Air Management Tool (LBNL, 2014).
More specifically, the RCI is a measure of how effectively the equipment is maintained within an air intake temperature specification, such as ASHRAE or NEBS (Herrlin, 2008). RCI is always ≤ 100%. A well-designed data center should have an RCI of 90% or higher. RCIHI=100% mean that no intake temperature is above the maximum Recommended, RCILO=100% mean that no intake temperature is below the minimum Recommended, and RCIHI and/or RCILO<90% indicate poor thermal conditions. See Figure 3 for definitions of Recommended and Allowable temperatures.
Metrics in general provide a great opportunity for the data center industry at large. Metrics can form the foundation for a standardized way of specifying and reporting various cooling solutions. Although most stakeholders benefit from relevant metrics, the data center owner and/or operator maybe benefit the most. There is an opportunity to specify in a standardized way a certain level of performance of the thermal support system.
# Intake Temp [F] or [C] By inserting the IT equipment intake temperatures (yellow cells), this spreadsheet 1 58 0 7 will calculate the Rack Cooling Index (RCI) and insert RCI(HI) and RCI(LO) on the 2 72 0 0 Main Input (Step 4) sheet.3 68 0 04 62 0 3 This index plays an important role in understanding whether the data center is 5 81 1 0 complying with the recommended and allowable intake temperature ranges 6 65 0 0 as specified in Table B on the next spreadsheet (Step 4 Main Input).7 56 0 98 71 0 0 Note: Max 999 IT equipment intake temperatures, insert from top down.9 65 0 010 68 0 0 Tip: If no data are available, leave all yellow input cells blank.11 60 0 512 69 0 0 Note: Grayed out data for internal use only.13 62 0 3 14 73 0 015 64 0 116 65 0 017 58 0 7 Rack Cooling Index (RCI): Ideal=100%, Poor (often considered) <90%18 67 0 019 58 0 7 RCIHI
20 69 0 0 99.5 % ("*" means at least one intake > max allowable)21 0 022 0 023 0 0 RCILO
24 0 0 65.0 * % ("*" means at least one intake < min allowable)25 0 026 0 0 RCI is based on the following recommended and allowable ranges27 0 0 (specified in Step 4 under "Current" for Questions 1 and 2 in Table B):28 0 029 0 0 Min Max30 0 0 Recommended 65.00 80.0031 0 0 Allowable 59.00 90.0032 0 033 0 0
0102030405060708090
100
1 2 3 4 5 6 7 8 9 10 11 12 13 14 15 16 17 18 19 20 21Intake #
Intake Temperature [F] or [C]

14
6. Reduced Temperature Sensor Count Schemes The ASHRAE Thermal Guidelines recommends as a minimum measurement scheme for “Facility Health and Audit Tests” to determine the “ambient” conditions in the cold equipment aisle. However, when inexpensive tools (such as that shown in Figure 10) are available, there is little reason to try to determine an ambient temperature when on-rack measurements can be done swiftly. Most ambient temperatures have very little to do with the actual IT equipment intake air temperatures. Better is to move on to the “Equipment Installation Verification Tests” in the ASHRAE Thermal Guidelines to perform your audit or assessment. This test much better reflects the temperatures that the electronic equipment actually is exposed to. ASHRAE states that these tests are designed “to ensure that the bulk temperature in front of the rack is acceptable.” However, ASHRAE suggests that the sensor locations should be determined by analyzing how many pieces of equipment are installed in the rack. That is not a practical recommendation, especially for stationary measurement installations. We recommend using a sensor configuration that works most of the time with no changes required when the content of the racks is reconfigured (which happens often in data centers). ASHRAE recommends that the sensors should be placed 2 inches in front of the equipment. We instead recommend to place the sensors on the front perforated door or as close as practically possible to the door. The sensors then move with the door when it is opened. Lastly, the ASHRAE Guidelines has “Equipment Troubleshooting Tests”, which include a more elaborate sensor scheme than the previous two tests. We believe that very few people will ever use the recommendations for the Equipment Troubleshooting Test for audits and assessments. Therefore, we will not discuss these tests further. Figure 7 shows ASHRAE’s recommendation for temperature sensor placement on an individual rack in the cold aisle. Assuming nine pieces of IT equipment in each rack, the sensors should be placed at the geometric center of the air intake of the top, middle, and bottom racked equipment. However, ASHRAE is not specific about how many racks they recommend to monitor. However, a pragmatic option is to put sensors on every other or every third rack. Although the resulting Scheme 1 will most likely capture the maximum intake temperatures along the aisle, this placement does not provide much information about the overall temperature distribution along the face of the equipment racks. It may also over emphasize the area with high temperatures.
Again, the quantity and location of the temperature sensors should depend on the content of each rack – strictly speaking. The sensor placement should accurately represent the actual equipment intake conditions. However, from a practical perspective, the configurations shown in Figures 7 and 8 are recommended on every other or every third rack in the equipment row. It is also important that the sensors are placed flush with the perforated IT equipment rack door. Still, this rack-face temperature can differ from the actual IT inlet temperature due to internal recirculation in the rack. In other words, it is not necessary to collect data for every IT equipment rack and piece of IT equipment. Instead, the goal of the sensor count and location is to produce a good estimate of the conditions had every rack and every piece of equipment been measured (or modeled). Taking into consideration the typical temperature profiles discussed in Section 3 helps in this endeavor.

15
Figure 7. Scheme 1 with 18 sensors (frontal view).
Figure 8 shows another commonly used placement scheme for the sensors, Scheme 2. Here, the sensors are placed at the bottom (knee), middle (hip), and top (head) of the racks with one group of three sensors for every other or every third rack, including the end-of-row racks. Or, more precisely, the front of the racks is divided into three equally-sized rectangular areas and one sensor is placed in the center of each rectangle. This scheme may underestimate the maximum temperatures since they may occur higher up on the rack than the top sensor location. On the other hand, it has the potential to give a better picture of the overall temperature distribution.
Figure 8. Scheme 2 with 18 sensors (frontal view).
Could such a seemingly small change in the sensor placement (Figure 7 vs. Figure 8) have a significant impact on the accuracy of the temperature measurements? We will look at that in Section 8.
Fully contained cold aisles need fewer sensors since the temperature distribution is much more uniform throughout the cold aisle. This is one of the benefits of enclosed cold aisles. When the intake air temperature is uniform, the supply temperature can be raised higher than for an open, non-contained cold aisle and save additional cooling energy. Although humidity is not a major concern in today’s data centers, a few words about measuring humidity may be appropriate. Keep in mind that the absolute humidity in a data center is generally constant across the space since there are no sources or sinks for humidity. Thus, there is generally no need to measure the humidity in multiple points. Measuring the absolute humidity in one point is fine; then one can calculate the relative humidity in each temperature sensor location based on its temperature reading and the absolute humidity. The equations in ASHRAE Handbook – Fundamentals (2017), Chapter 1, can be used to calculate the relative humidity.
IT equipment exhaust temperatures can be measured in a similar way to the IT equipment intake air temperatures as discussed above. A principal purpose of measuring the exhaust temperatures is to be able to determine whether the data center is over-ventilated (net by-pass air) or under-ventilated (net recirculation air). The DOE Air Management Tool (2014) uses the Return Temperature Index (RTI) for that purpose.
16
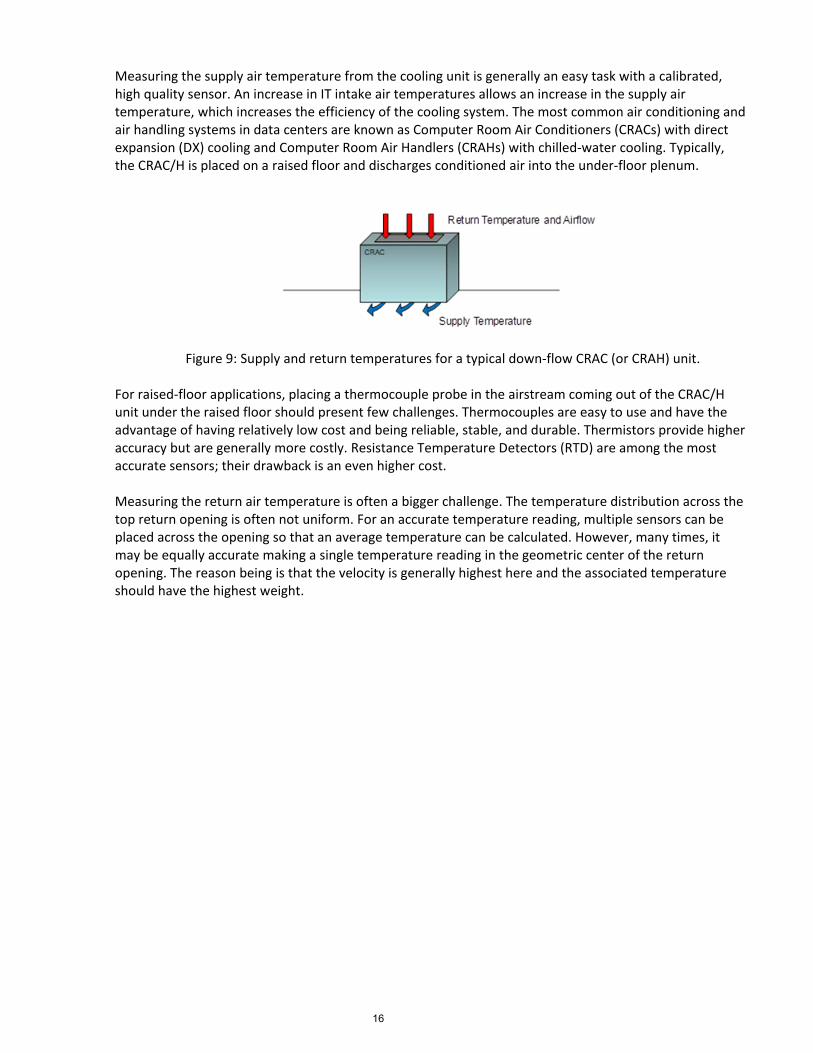
Measuring the supply air temperature from the cooling unit is generally an easy task with a calibrated, high quality sensor. An increase in IT intake air temperatures allows an increase in the supply air temperature, which increases the efficiency of the cooling system. The most common air conditioning and air handling systems in data centers are known as Computer Room Air Conditioners (CRACs) with direct expansion (DX) cooling and Computer Room Air Handlers (CRAHs) with chilled-water cooling. Typically, the CRAC/H is placed on a raised floor and discharges conditioned air into the under-floor plenum.
Figure 9: Supply and return temperatures for a typical down-flow CRAC (or CRAH) unit.
For raised-floor applications, placing a thermocouple probe in the airstream coming out of the CRAC/H unit under the raised floor should present few challenges. Thermocouples are easy to use and have the advantage of having relatively low cost and being reliable, stable, and durable. Thermistors provide higher accuracy but are generally more costly. Resistance Temperature Detectors (RTD) are among the most accurate sensors; their drawback is an even higher cost. Measuring the return air temperature is often a bigger challenge. The temperature distribution across the top return opening is often not uniform. For an accurate temperature reading, multiple sensors can be placed across the opening so that an average temperature can be calculated. However, many times, it may be equally accurate making a single temperature reading in the geometric center of the return opening. The reason being is that the velocity is generally highest here and the associated temperature should have the highest weight.

17
7. Measurement Equipment
Temporary external temperature sensors, permanent external sensors, and internal sensors are reviewed in this section. Manual measurements with hand-held devices are only practical for small data centers or spot measurements. Such tools will not be discussed in this document. For a temporary installation, a portable measurement system might be considered. Such systems were tested at LBNL (2018). For a permanent installation, a temperature sensor network is often used. Such networks can be wireless or wired. Finally, we discuss a relatively new promising protocol: Network data exchange with IT equipment on-board sensors. In this case, the built-in temperature sensors in the electronic IT equipment are probed through the backbone of the equipment.
A Data Center Infrastructure Management (DCIM) system can help in the process of collecting and displaying the data as well as monitoring the data with alarms and alerts for threshold violations. The visualization can be in the form of temperature maps across the data center. A. Temporary External Sensors For a temporary installation, a portable system might be considered, see Figure 10 for an example. This particular system was recently demonstrated at LBNL (2018).
Figure 10. Inexpensive, portable audit system (www.packetpower.com)
The environmental sensors (probes) were positioned on the equipment rack fronts per the scheme shown in Figure 11. Each “string” of the system includes two small temperature sensors (blue circles in Figure 11) wired to a monitoring unit (blue square in Figure 11), which wirelessly communicates with an Ethernet gateway. The Gateway, in turn, communicates via an Ethernet cable either directly with a laptop or with a Network Router.

18
Figure 11: Setup for an 11-rack lineup with three probes on every other rack (frontal view).
The monitoring unit (with a built-in temperature sensor) was attached with a magnet to the front perforated IT equipment rack door at the top (head) probe location. The other two sensors simply hang down from the monitoring unit for measuring at the middle (hip) and bottom (knee) probe locations. For a single-string system, the string of three sensors (thermocouples) needs to be moved from equipment rack to equipment rack to collect temperature readings for an equipment lineup. Once in front of a rack, the user attaches the monitoring unit magnetically to the perforated front door and waits until the temperature readings have settled or converged. At that point, the user logs the readings and moves to the next selected rack by simply pulling off the monitoring unit from the first rack and snapping it onto the second rack. This process is repeated for every rack, every other rack, or every third rack, depending on the coverage and accuracy desired.
The purpose of this demo was to test the user experience (ease of use) with the system when moving down an aisle from rack to rack. The system was found to be easy to use in quickly gathering accurate data on intake temperatures. It is an inexpensive, pocket-sized system that does not need extra equipment besides a laptop to be functional. The simplicity of use is especially advantageous for small data centers with limited resources and expertise. In addition, the probes can readily be used for measuring IT equipment exhaust, CRAC supply, and CRAC return temperatures. The tested tool may be viewed as “representative” of a family of tools with similar characteristics from different vendors.
B. Permanent External Sensors For a permanent installation, a temperature sensor network might be considered. Such a network can be wireless, as shown in Figure 12, or wired. The permanent sensor network consists of a suite of sensors for temperature sensing connected to a monitoring unit and a gateway. The sensors are often placed as shown in Figure 7 or Figure 8. The sensor network may or may not have its own collection, analysis, and visualization software. Figure 12 shows an early implementation by SynapSense, a pioneer in the field of external sensor networks in data centers. The wireless monitoring unit is placed on top of the equipment rack and uses a wireless mesh network to transmit the data to the gateway.

19
Figure 12. Temperature Sensor Network (SynapSense now part of Panduit)
A Data Center Infrastructure Management (DCIM) system is primarily focused on monitoring and managing critical data center systems, such as IT, cooling, and power. A DCIM system can help in the process of collecting, analyzing, and displaying the data from a Temperature Sensor Network as well as monitoring the data with alarms and alerts for threshold violations. The visualization can be in the form of temperature maps across the data center. Gaps between actual sensor readings are interpolated.
C. Network Data Exchange with IT equipment On-board Sensors
Many IT vendors offer the ability to view intake air temperatures (among other parameters) in real time using on-board sensors and automation software. Indeed, the ENERGY STAR Computer Server Specification Version 3.0 (2018) shown in Figure 13 requires this data availability for servers marketed and sold as ENERGY STAR
products. This type of network data exchange is typically the best option for
collecting accurate data. Note also that the temperature sensor schemes discussed in Section 6 do not come into play here since every single IT equipment intake temperature can be monitored.
Section 5.1 (Measurement and Output) in ENERGY STAR specifies that a server must provide data on intake air temperature, input power consumption, and average utilization of all logical CPUs. These data must be made available in a published or user accessible format that is readable by third-party, non-proprietary management software over a standard network. The fact that intake air temperature is part of these requirements is a testament of the importance of such data.
IT equipment may use either embedded components or add-in devices that are packaged with the computer server to make the data available to end users (e.g., a service processor, embedded power or thermal meter (or other out-of-band technology), or pre-installed operating system (OS)). Servers that include a pre-installed OS must include all necessary drivers and software for end users to access standardized data as specified in the ENERGY STAR document. Products that do not include a pre-installed OS must be packaged with printed documentation of how to access registers that contain relevant sensor information. This requirement may be met via either printed materials, electronic documentation provided with the server, or information publicly available on the Partner’s website where information about the computer server is found.

20
And, it is even getting better, when an open and universally available data collection and reporting standard becomes available, manufacturers need to incorporate that standard into their ENERGY STAR compliant products. Per ENERGY STAR, intake air temperature measurements must have an accuracy of at least ±2°C, which corresponds to ±3.6°F. This loose requirement is a bit surprising. Clearly, the emphasis should be on “at least” to make this useful for our purposes.
Figure 13: The ENERGY STAR Specification document (ENERGY STAR, 2018).
Although Network Data Exchange is a superior technology compared with using external sensors, there are currently a number of implementation barriers. For small data centers, the expertise needed to tap into this technology can be limited and/or poorly understood, especially on the facilities side of the data center. In any data center, security concerns may also surface when tapping information from servers. Therefore, for the time being, many data centers may choose to use external sensors.

21
8. Impact of Different Sensor Density and Location
If Network Data Exchange with IT equipment on-board sensors is not used, a common question is how many intake air temperature sensors are needed and how to arrange them across the rack faces. The quantity of instrumentation in data centers can easily get out of hand and become expensive. And, we don’t want to change the sensor locations when the content of the racks change, which they often do. We will now quantify the performance with the two sensor schemes discussed earlier (Figures 7 and 8).
This should not be considered an optimization exercise but rather an example how using the same number of sensors but rearranging them can provide more information and increase the measurement accuracy. We will especially focus on two characteristics of each scheme: How well it captures the maximum temperature and how well it captures the overall temperature distribution at the IT equipment air intakes.
This section will analyze the impact on sensor placement in a small data center. For this exercise, we will use the data center shown in Figure 5, which has a fairly typical temperature distribution in front of the equipment racks. The figure demonstrates that the hot layer can be both shallow and deep in the same equipment aisle. We will use both layers for the analysis. The air is cold up to a shallow transitional layer before it turns hot. The transitional and hot layers are generally located in the upper third of the cold aisle in an open (no enclosures) raised-floor data center with underfloor cooling, which represents a vast majority of all data centers. Furthermore, the temperature gradient along the equipment aisle is generally small compared to the vertical gradient.
Figure 14 shows the case with one sensor per piece of IT equipment, 144 sensors in total. We simply measure all intake temperatures, nine per rack. This scheme provides the most accurate picture of the intake temperatures using external sensors. Internal rack recirculation of hot exhaust air may still create deviations from the “true” intake temperatures. This scheme will serve as our Reference with which we will evaluate the two more economical schemes discussed in Section 6.
Figure 14. Reference scheme with 144 sensors (frontal view of equipment row).
We will use the DOE Air Management Tool (LBNL, 2018) to analyze how well the different sensor schemes capture the overall temperature distribution since it has a suitable built-in metric called the Rack Cooling Index (RCI). As outlined in Section 5, this metric allows us to judge the overall compliance with the ASHRAE temperature guidelines (or any temperature guideline for that matter). We will first calculate RCI for the Reference Scheme (Figure 14) and then for Scheme 1 (Figure 7) and Scheme 2 (Figure 8). The scheme with the smallest deviation in RCI from the Reference Scheme will be deemed the better of the two. It simply provides a convenient way of scoring the two sensor schemes.
The graph in Figure 15 shows the temperature distribution in Figure 5 along the equipment row with the deep hot layer using the sensor scheme in Figure 14 (Reference Scheme). The intake temperatures are

22
shown from the top-down of the leftmost equipment rack (nine sensors) in Figure 14 followed by the next rack, and so on. Only half of the equipment aisle, or 8 racks, is shown in the graph. Note how the intake temperature changes quickly in the transitional layer, meaning that the layer is indeed shallow. As noted earlier, this is typical for raised-floor cooling.
Figure 15. Typical IT equipment intake temperature profile for raised-floor cooling with a deep layer of hot air.
The graph in Figure 16 shows the temperature distribution in Figure 5 along the equipment row with the shallow hot layer using the sensor scheme in Figure 14 (Reference Scheme). The intake temperatures are shown from the top-down of the leftmost equipment rack (nine sensors) followed by the next rack, and so on. Once again, note how the intake temperature changes very quickly in the transitional layer. Not surprisingly, there are fewer hot temperatures for a shallow hot layer than for a deep one.
Figure 16. Typical IT equipment intake temperature profile for raised-floor cooling
with a shallow layer of hot air.

23
Temperature conformance with IT equipment intake air temperature specifications (e.g., ASHRAE or NEBS) is the ultimate cooling performance metric in data centers. As discussed in section 5, the Rack Cooling Index (RCI) is such a performance metric. The goal with reduced sensor schemes (Figure 7 or Figure 8) is to capture a temperature distribution that mimics the “true” distribution resulting from using a complete sensor scheme (Figure 14) where every individual intake temperature was measured. The more similar the temperature distributions are, the more similar the temperature conformance and the RCI values will be. We will use this approach when analyzing the reduced sensor Schemes 1 and 2.
Table 2 below shows the computer simulation results for the Reference Scheme (complete sensor scheme), Scheme 1 (reduced sensor scheme), and Scheme 2 (reduced sensor scheme). Each scheme is calculated for both a shallow and deep hot layer in the cold aisle per Figure 5. Note that for this particular exercise we are comparing RCI values, and the absolute RCI values are not especially important. In section 6 we asked whether the seemingly small change in sensor placement between Scheme 1 and Scheme 2 could have a significant impact on the resulting temperature distribution. Recall that we used the same number of sensors in both of these schemes. The results in Table 2 show that Scheme 2 (highlighted in the table in faint blue) has RCI values closer to the values for the Reference Scheme. Scheme 1, on the other hand, over-emphasizes the hot temperatures and thereby distorts the captured temperature distribution, leading to worse (i.e., lower) RCIHI values. Although less pronounced, this result holds true for RCILO as well. Clearly, if we are interested in the overall temperature distribution and conformance at the IT equipment air intakes, Scheme 2 is the better choice.
The conformance difference as measured by RCI between Scheme 2 and the Reference Scheme is remarkably small considering the fact that we have reduced the sensor count from 144 to 18, a reduction of nearly 90%. The cost savings could be quite significant in sensor hardware and labor costs. If the overall measurement endeavor is viewed as too costly, the effort to operate with improved temperature conditions may never be explored. Therefore, these results suggest a real opportunity to reduce the temperature sensor count without sacrificing accuracy.
Table 2. RCI values for three sensor schemes using the ASHRAE environmental Classes A1 and A2.
ASHRAE Allowable A1 ASHRAE Allowable A2 Sensor Scheme Max T
F RCIHI
% RCILO
% RCIHI
% RCILO
% Ref. Scheme Shallow 89 95.1 51.0 97.0 81.6 Scheme 2 Shallow 86 93.3 56.8 95.8 83.8 Scheme 1 Shallow 89 84.9 56.8 90.6 83.8 Ref. Scheme Deep 91 67.4 64.7 79.6 86.7 Scheme 2 Deep 91 65.2 65.0 78.2 86.9 Scheme 1 Deep 91 61.5 63.0 75.9 86.1
For the shallow hot layer, the maximum temperature (Max T in Table 2) in Scheme 1 is a better representation of the temperature in the Reference Scheme than that in Scheme 2. This particular hot layer is shallow enough to result in different temperature readings for the top sensor positions in the three Schemes. However, this can easily be rectified in Scheme 2 by adding a few sensors per equipment row near the top of the IT equipment racks.

24
For the deep hot layer, on the other hand, there is no temperature difference between the three Schemes since the hot layer is deep enough to engulf the top sensor positions in all three Schemes. Since there is no assurance that a hot layer will be deep (rather than shallow), a prudent approach is to always add a few sensors per equipment row near the top of the IT equipment racks to capture the maximum temperature. Please also note that the absolute RCI numbers in Table 2 always improve (higher values) with a wider Allowable temperature range (A2 rather than A1) simply because the temperature “buffer” between the Recommended and the Allowable ranges is larger. RCI depends on both the Recommended range and the Allowable range as outlined in the Engineering Reference document to the DOE Air Management Tool (LBNL, 2014).

25
Summary
Each individual data center needs to set its own standard for information technology (IT) equipment intake air temperatures to ensure reliable and economical operation. The ASHRAE Thermal Guidelines and NEBS GR-63/3028 provide important guidance on temperature and humidity in equipment spaces. These industry documents are briefly reviewed to provide the necessary background for temperature management and measurements. Air management is a prerequisite for improving equipment reliability and saving infrastructure (cooling) energy, and accurate temperature measurements are imperative for the success of air management. A typical air intake temperature profile with under-floor cooling includes under-temperatures near the bottom of the equipment racks and over-temperature areas near the top. For accurate measurements, it is important to understand this temperature profile. This document provides concise generalized temperature and airflow best-practice recommendations based on those given in the DCEP (2020) training program. It includes recommended practices from ASHRAE, NEBS, and other industry documents. The focus is on temperature measurements since the absolute humidity in a data center is generally constant across the space.
Measuring equipment is reviewed including external sensors (temporary and permanent) and Network Data Exchange with IT equipment on-board sensors. For larger installations, a Data Center Infrastructure Management (DCIM) system can help in the process of collecting, analyzing, and displaying the temperature data. Since the scale of measurement instrumentation in data centers can easily get out of hand and become expensive, we analyzed a reduced sensor arrangement with two different sensor placement layouts. It is demonstrated that a reduced sensor arrangement can be remarkably accurate even when reducing the sensor count by 90%. Such a level of reduction would provide significant cost savings in sensor hardware and labor costs. These results suggest a real opportunity to reduce the sensor count (and cost) without sacrificing accuracy. In addition, the results show that a seemingly small change in sensor placement layout could have a significant impact on the accuracy of the measured temperature distribution.

26
References
ASHRAE 2015. Special Publication, Thermal Guidelines for Data Processing Environments, American Society of Heating, Refrigerating and Air-Conditioning Engineers, Inc., Atlanta, GA. www.ashrae.com ASHRAE 2017. ASHRAE Handbook – Fundamentals, American Society of Heating, Refrigerating and Air-Conditioning Engineers, Inc., Atlanta, GA. www.ashrae.com DCEP (Data Center Energy Practitioner), 2020. http://datacenters.lbl.gov/dcep ENERGY STAR Computer Server Specification Version 3.0 (2018) https://www.energystar.gov/products/spec/enterprise_servers_specification_version_3_0_pd
Herrlin, M. K. 2008. Airflow and Cooling Performance of Data Centers: Two Performance Metrics. ASHRAE Transactions, Volume 114, Part 2. http://www.ancis.us/publications.html Herrlin and Khankari, 2008. “Method for Optimizing Equipment Cooling Effectiveness and HVAC Cooling Costs in Telecom and Data Centers,” ASHRAE Transactions, Volume 114, Part 1
LBNL, 2018. “Demonstration: Portable Air Management Measurement Tools” https://datacenters.lbl.gov/resources/demonstration-portable-air-management LBNL, 2014, DOE Air Management Tool https://datacenters.lbl.gov/tools
Sorell and Herrlin, 2017. Humidity Control in Data Centers. https://datacenters.lbl.gov/resources/humidity-control-data-centers
Telcordia. 2012. (Kluge, R.) Generic Requirements NEBS GR-63-CORE, NEBS Requirements: Physical Protection, Issue 4, April 2012, Telcordia Technologies, Inc., Piscataway, NJ. www.telcordia.com Telcordia. 2001. (Herrlin, M.) Generic Requirements GR-3028-CORE, Thermal Management in Telecommunications Central Offices, Issue 1, December 2001, Telcordia Technologies, Inc., Piscataway, NJ. www.telcordia.com

27