thermal energy storage and leed...
TRANSCRIPT

Thermal Energy Storage and
LEED GOLD
Mark M. MacCracken, PE, LEEDAP, PteCALMAC Mfg. Corp.Englewood, NJ USA
Calmac.com
ECOSTOCK 5-31-06

Storage is Natural
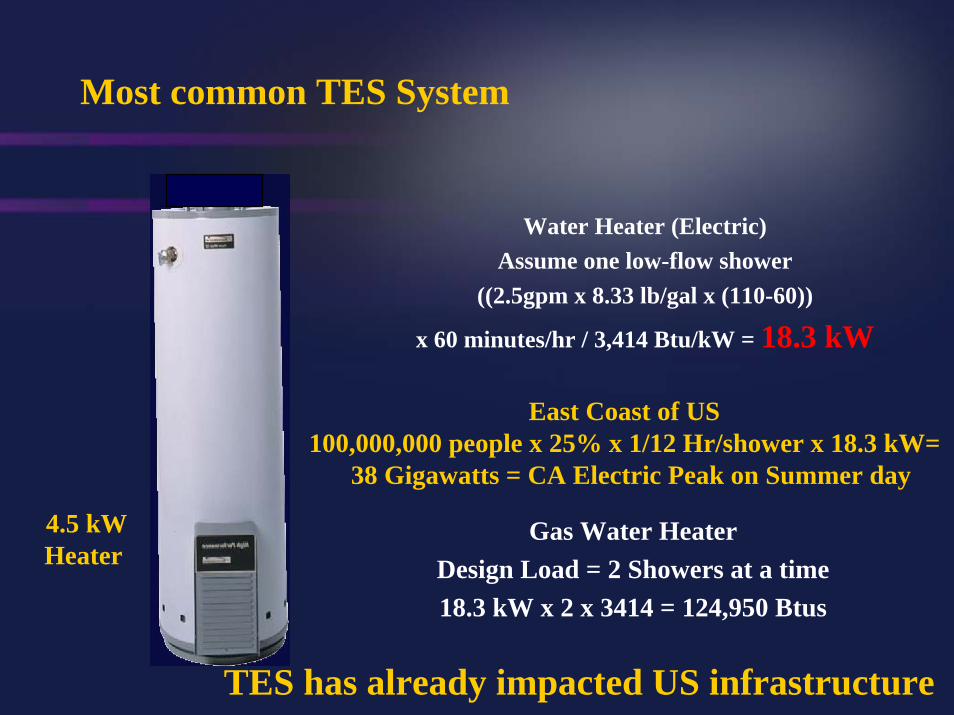
Most common TES System
Water Heater (Electric) Assume one low-flow shower
((2.5gpm x 8.33 lb/gal x (110-60))
x 60 minutes/hr / 3,414 Btu/kW = 18.3 kW
Gas Water HeaterDesign Load = 2 Showers at a time18.3 kW x 2 x 3414 = 124,950 Btus
East Coast of US 100,000,000 people x 25% x 1/12 Hr/shower x 18.3 kW=
38 Gigawatts = CA Electric Peak on Summer day
TES has already impacted US infrastructure
4.5 kWHeater
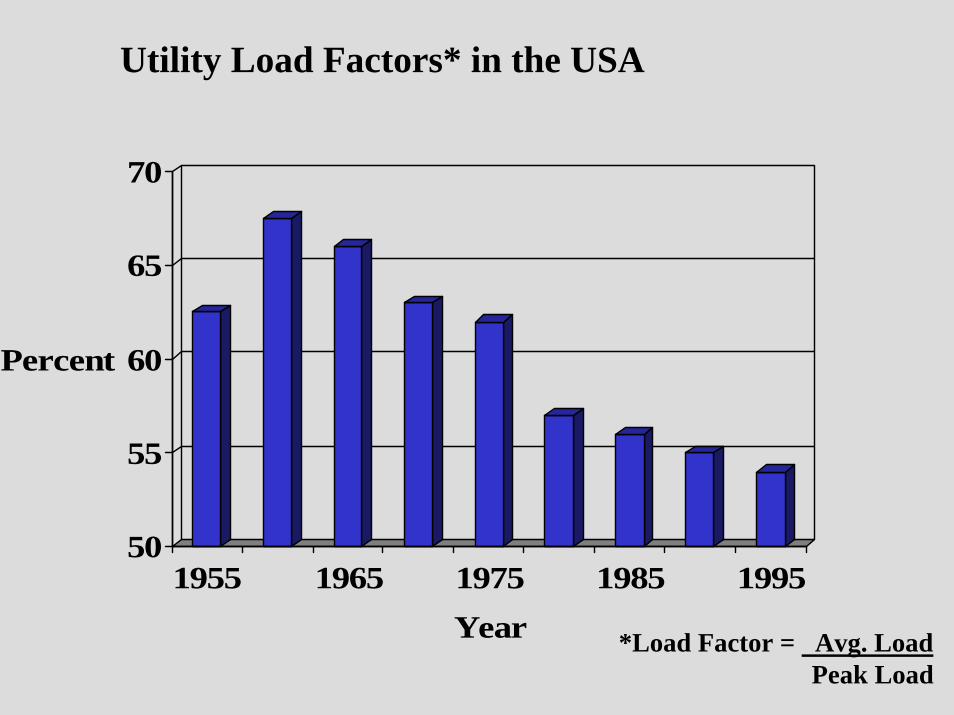
Utility Load Factors* in the USA
50
55
60
65
70
Percent
1955 1965 1975 1985 1995Year *Load Factor = Avg. Load
Peak Load

ASHRAE 90.1 Base BuildingNon-Storage Electrical Profile
LightingFans
Pumps
Base Load
Cooling
0200400600800
100012001400160018002000
k W
Total kWh = 28,000/day
Peak Load2000 kW
Avg. Load
1050 kW
(Load Factor = 53%)
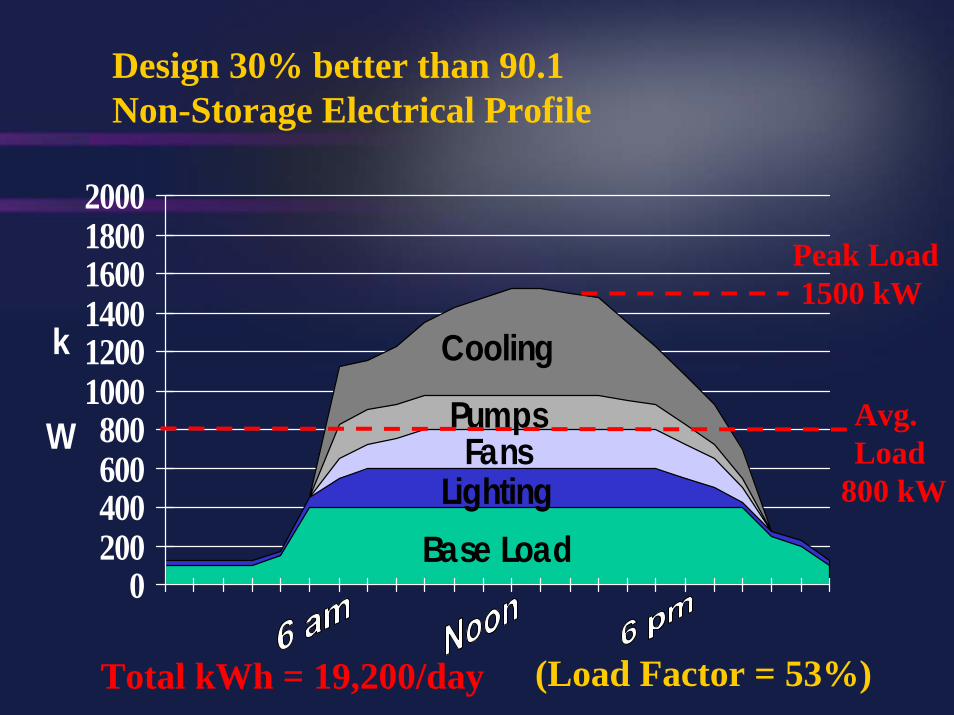
Design 30% better than 90.1 Non-Storage Electrical Profile
LightingFans
Pumps
Cooling
Base Load0
200400600800
100012001400160018002000
k
W Avg. Load
800 kW
Total kWh = 19,200/day
Peak Load1500 kW
(Load Factor = 53%)

Off Peak Cooling (OPC) Electrical Profile
Base LoadLighting
FansPumps
0200400600800
100012001400160018002000
k
W
Total kWh = 19,200/day (Load Factor = 88%)
Charging Storage
600 kW Shed
Avg. Load
800kW
40% Peak Load Reduction
Peak Load 900kW

Power continue to be less expensive at Night because of Generation Load Factor
4 Buildings x 1 Megawatt4 Buildings x 1 Megawatt= 4 Megawatts= 4 Megawatts
8,000 mW8,000 mW--h Soldh Sold
5 Buildings with TES @ 0.8 mW 5 Buildings with TES @ 0.8 mW = 4 Megawatts = 4 Megawatts
10,000 mW10,000 mW--h Sold!h Sold!
The same generator produces The same generator produces 25% more sellable kW25% more sellable kW--h!h!

3-D Electric Load Profile -- Full Year
4200 ton-hr of StorageInstalled 1990
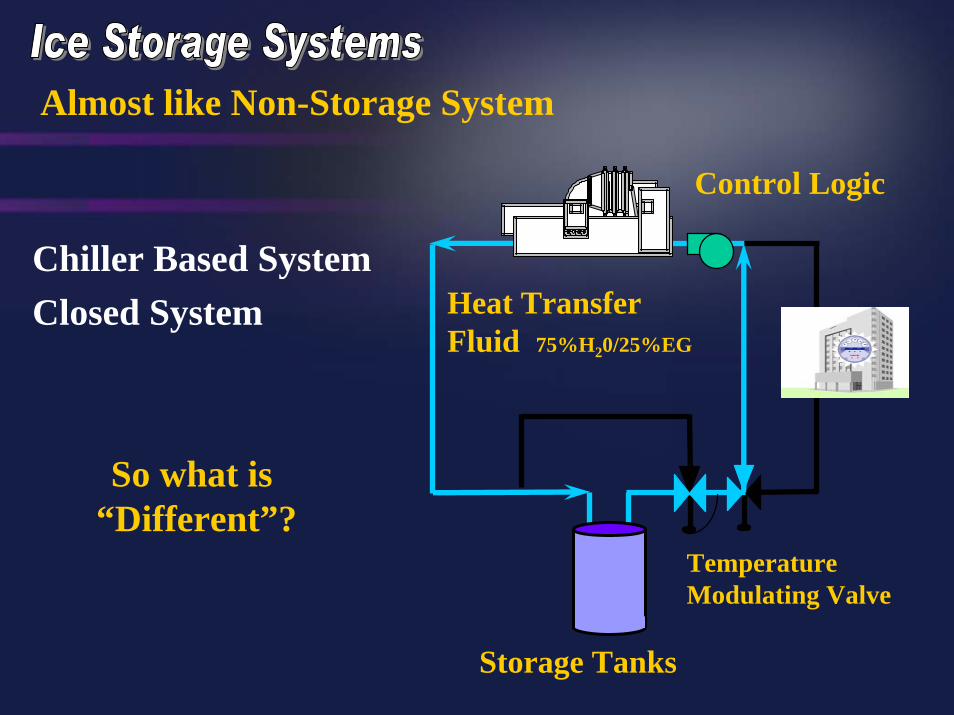
Almost like Non-Storage System
TemperatureModulating Valve
Storage Tanks
Control Logic
Heat Transfer Fluid 75%H20/25%EG
Chiller Based SystemClosed System
So what is “Different”?
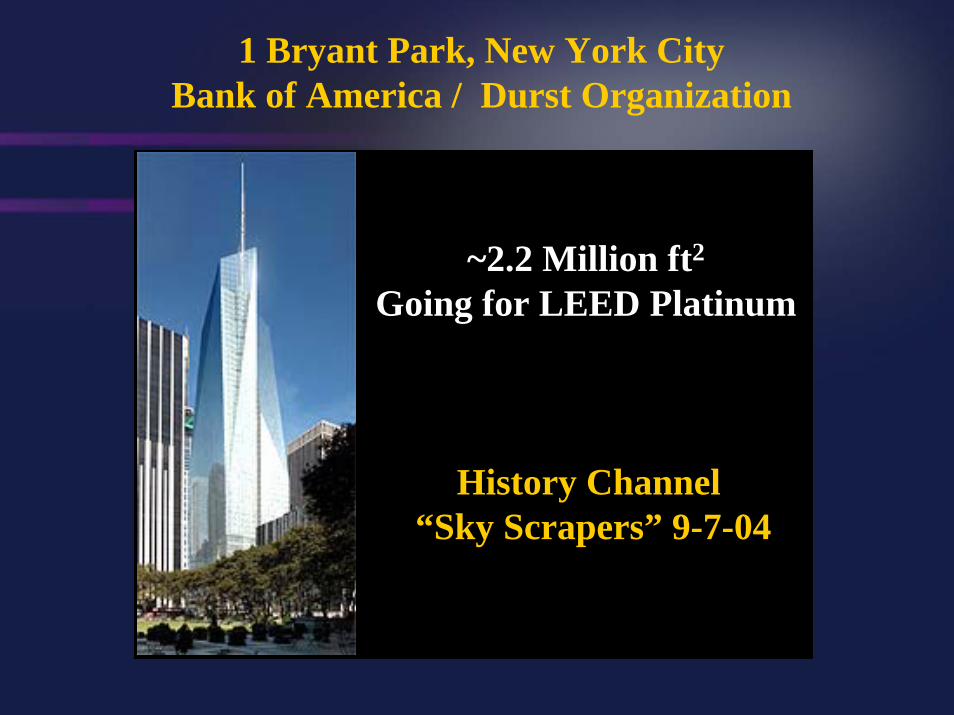
1 Bryant Park, New York CityBank of America / Durst Organization
History Channel “Sky Scrapers” 9-7-04
~2.2 Million ft2
Going for LEED Platinum

Thermal Storage Tank Ice-on-Coil Internal Melt
Expansion ChamberTank
Insulation Heat Exchanger
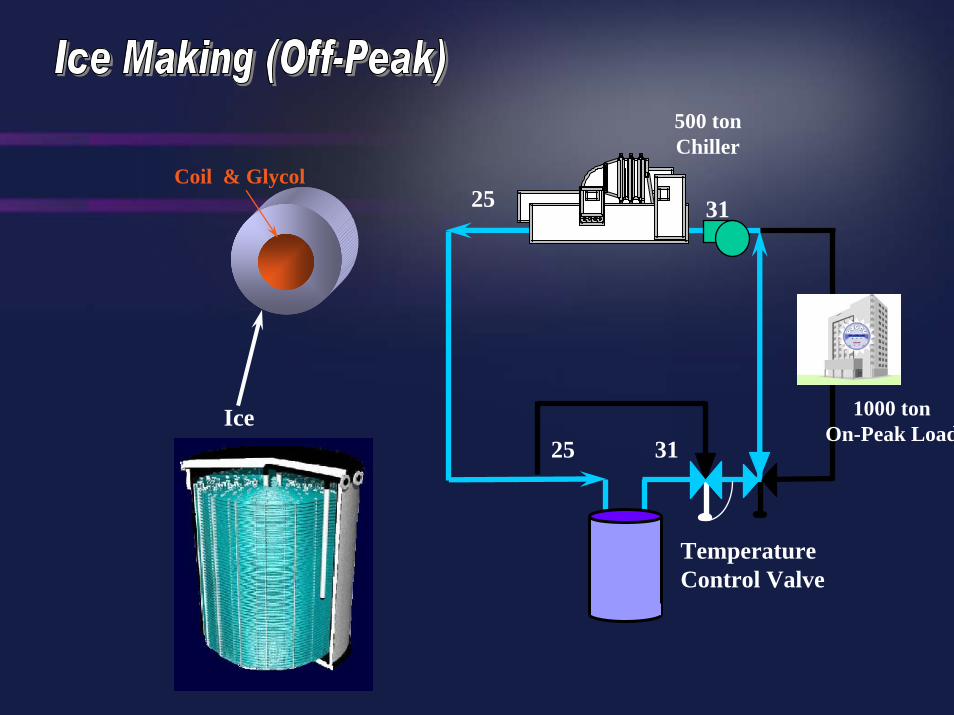
Coil & Glycol25
TemperatureControl Valve
31
1000 tonOn-Peak Load
500 tonChiller
25 31Ice

44
TemperatureControl Valve
54
500 tonChiller
44
Coil & Glycol
Ice500 tonLoad
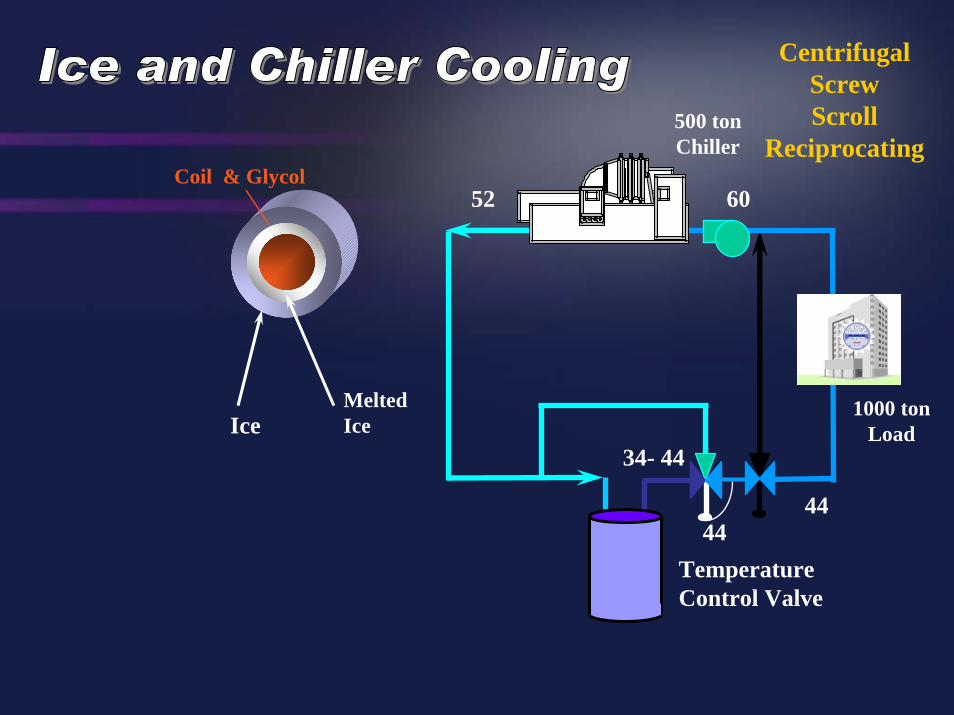
52
TemperatureControl Valve
60
44
IceMeltedIce
Coil & Glycol
1000 tonLoad
500 tonChiller
44
34- 44
CentrifugalScrew Scroll
Reciprocating

How do you measure “Green”?
One Metric is….
LEED™ Green Building Rating System

Materials & Resources
Energy & Atmosphere
Water Efficiency
Sustainable Sites
Indoor Environmental Quality
LEEDTM Credits
Sustainable Sites: 14 pointsWater Efficiency: 5 pointsEnergy* & Atmosphere: 17 pointsMaterials & Resources: 13 pointsIndoor Environment Quality: 15 pointsInnovation & Design: 5 points
69 points
*10 Energy Credit are based on ASHRAE 90.1 which is based on Energy COST Reduction
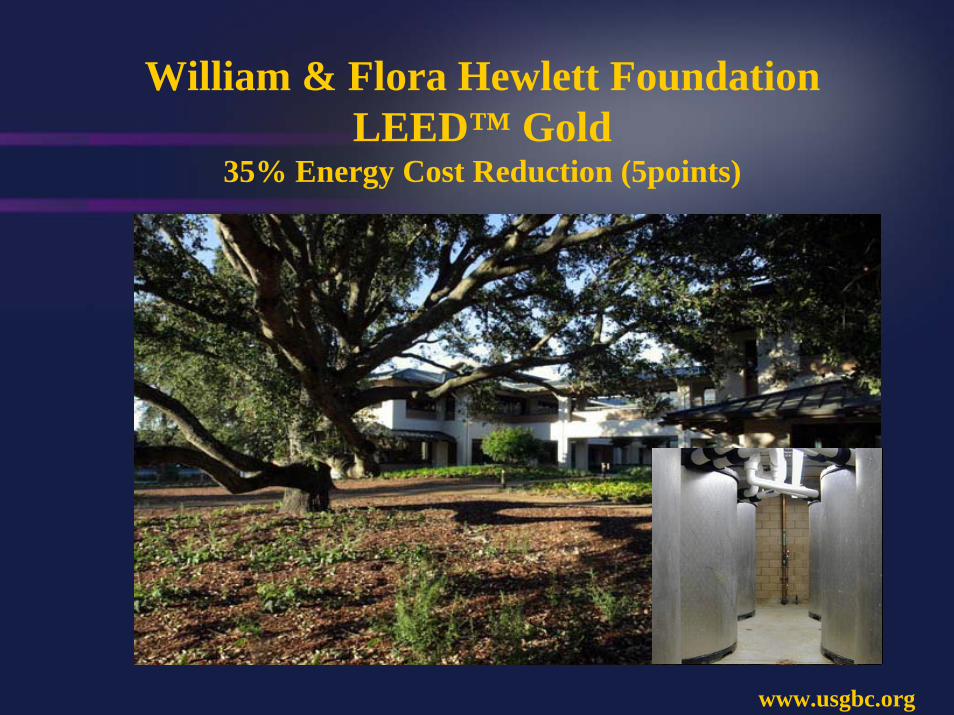
William & Flora Hewlett FoundationLEED™ Gold
35% Energy Cost Reduction (5points)
www.usgbc.org

Project Overview

Project Overview
Lighting System•Indirect Natural Lightening •Operable Windows with Natural Ventilation•PV for 24 hour lights•Off –Peak Cooling system
Section
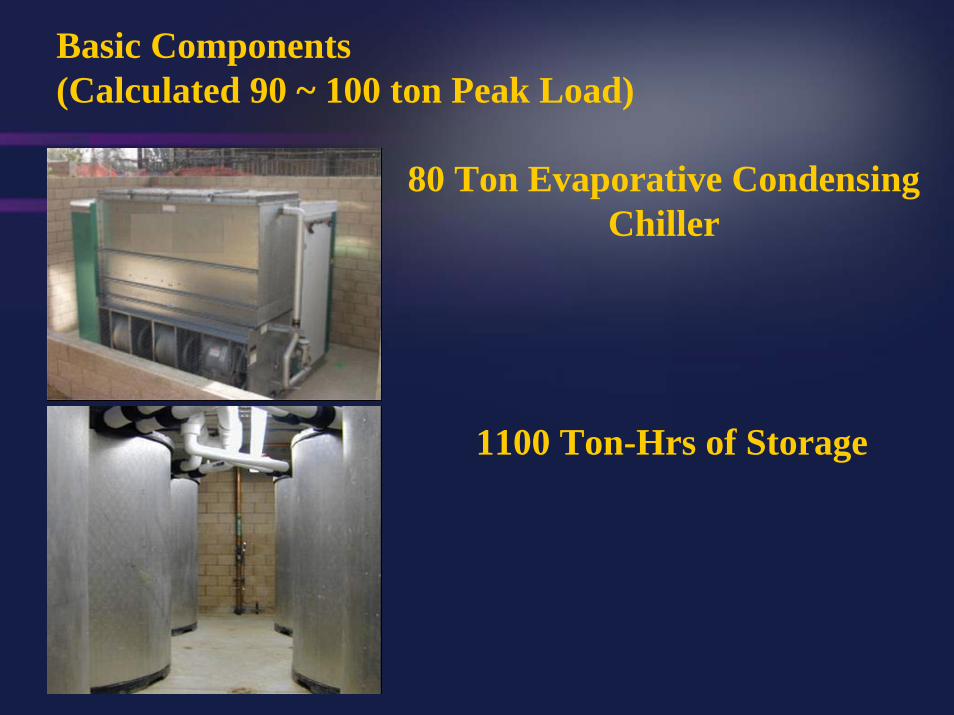
Basic Components (Calculated 90 ~ 100 ton Peak Load)
80 Ton Evaporative Condensing Chiller
1100 Ton-Hrs of Storage

Back Pressure
ICESTORAGE
CHILLER
Air Handlers
Regulating Valve
V1V2
P1
P2
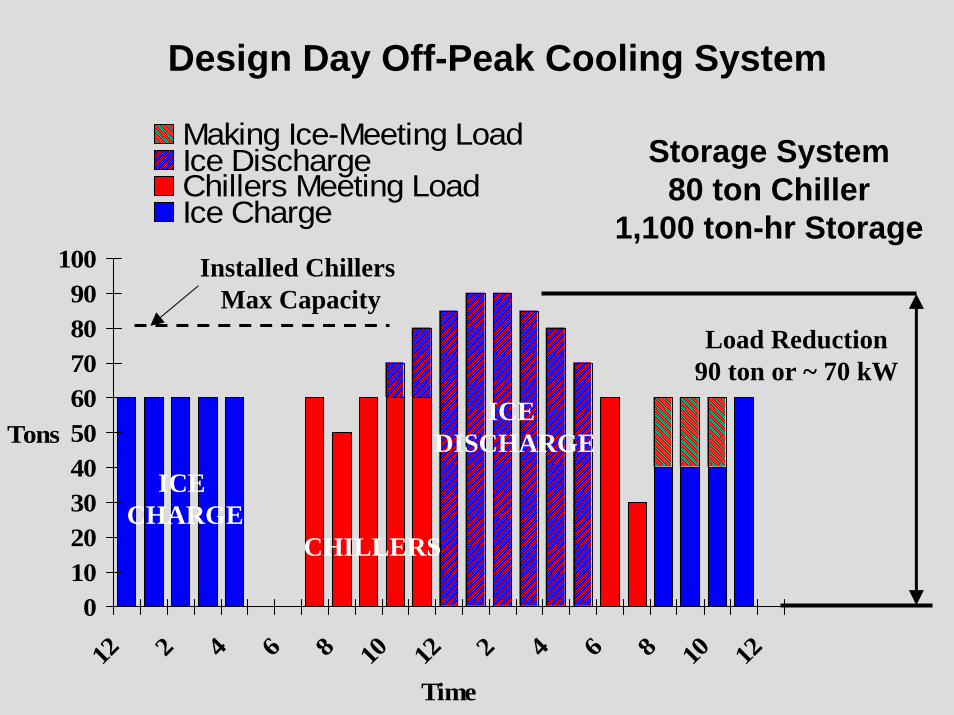
Design Day Off-Peak Cooling System
0102030405060708090
100
12 2 4 6 8 10 12 2 4 6 8 10 12
Time
Tons
Making Ice-Meeting LoadIce DischargeChillers Meeting LoadIce Charge
Storage System80 ton Chiller
1,100 ton-hr Storage
Load Reduction90 ton or ~ 70 kW
ICEDISCHARGE
CHILLERS
Installed Chillers Max Capacity
ICECHARGE

Teamwork
• OwnerThe Hewlett Foundation
• Owner’s RepresentativeBennington/Conover & Associates
• Shell ArchitectB.H. Bocook Architects
• Interior Architecture and DesignHawley Peterson & Snyder Architects
• Landscape ArchitectThe Office of Cheryl Barton
• ContractorVance Brown, Inc.
• Environmental Building ConsultantSimon & Associates
Building for Sustainability
William & Flora Hewlett Foundation

The LEED™ Bandwagon
Air ForceEPAUS ArmyGSAUS NavyState Dept.ArizonaCaliforniaMaineMarylandMichigan
MissouriNew JerseyOregonNew YorkPennsylvaniaWashingtonWisconsinAlameda Cty, CAArlington Cty, VACook Cty., ILDane Cty., WI
King Cty., WASan Mateo Cty, CAArlington, MAAtlanta, GAAustin, TXBerkeley, CABoulder, CO.Bowie, MD.Chula Vista, CADallas, TXEugene, OR
Houston, TXKansas City, MOLos Angeles, CAOmaha, NEPhoenix, AZPleasanton, CASan Diego, CASan Francisco, CASan Jose, CASanta Monica, CASeattle, WA
Incomplete list of groups that mandate, encourage or reward LEED Certification or designs to LEED Criteria
Vancouver, BC, Portland, OR and Scottsdale, AZ require LEED Gold on municipal projects

Real reasons Off-Peak Cooling is Green:
1. It is much more Energy Efficient to create and deliver a kWh of Electricity at night then during the hot of the day.• Research from the California Energy Commission on 2 Cal. Utilities
Reports 8 to 34% savings in raw fuel when comparing On and Off Peak Operation!
• Heat Rates for Base Load Plants ~7,800 Btu/kWh vs. Peaking Plants ~9,400 to 14,00 Btu/kWh
2. The last power plants to come on during peak hours are normally the dirtiest per kW• Ashok Gupta (Director of Energy, NRDC) in NYTimes article “Peak
Shifting results in lower emissions because some of the plants used to meet demand peaks are among the dirtiest in the city”
• New CA Report by Greg Kats The Costs and Financial Benefits of Green Buildings states Peak power in CA is twice as dirty as Off Peak Power.

Other “Green” Issues
1. Safety Factors/Redundancy (Oversizing)• Well documented that oversizing chiller plants
creates less efficient real world operation.• Engineers have to protect their license
Storage is the Natural solution
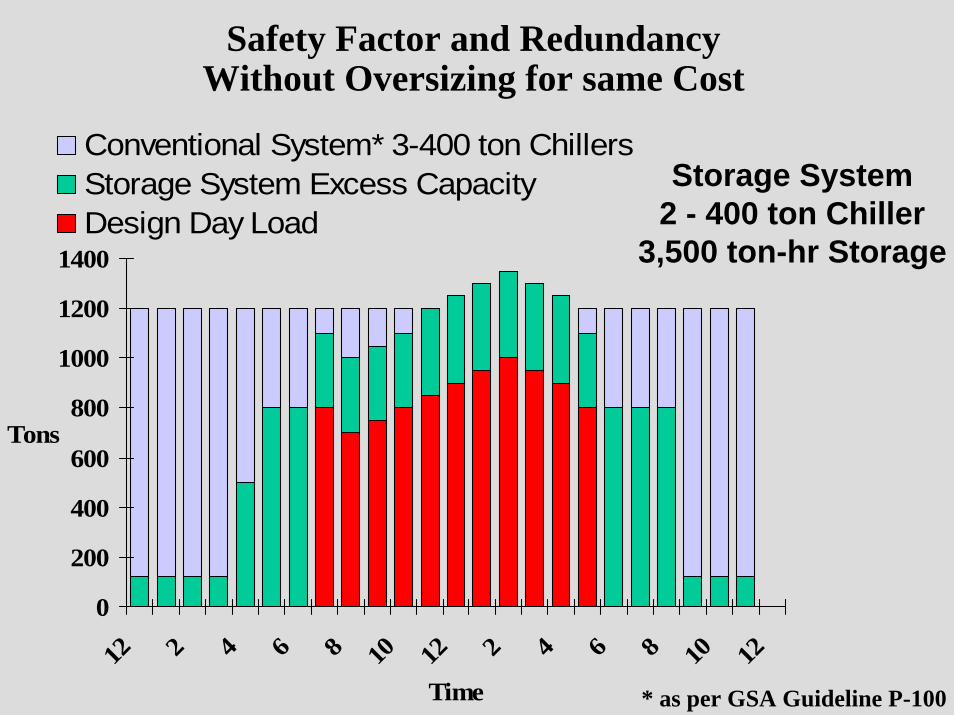
Safety Factor and Redundancy Without Oversizing for same Cost
0
200
400
600
800
1000
1200
1400
12 2 4 6 8 10 12 2 4 6 8 10 12
Time
Tons
Conventional System* 3-400 ton ChillersStorage System Excess CapacityDesign Day Load
Storage System2 - 400 ton Chiller
3,500 ton-hr Storage
* as per GSA Guideline P-100

Design Day Off-Peak Cooling System
0
200
400
600
800
1000
1200
1400
12 2 4 6 8 10 12 2 4 6 8 10 12
Time
Tons
Discharge StorageChillers Meeting LoadCharge Storage
Storage System2- 400 ton Chillers
3,500 ton-hr Storage
500 ton Load Reductionor ~ 375 kWSTORAGE
DISCHARGE
CHILLERS(ONLY 500 TONS)
Installed Chillers Max Capacity
STORAGECHARGE

Capacity on Design Day with One Chiller Failure
0
200
400
600
800
1000
1200
1400
12 2 4 6 8 10 12 2 4 6 8 10 12
Time
Tons
Storage System ShortfallStorageStorage Chiller
Conventional2- 400 ton Chillers
Storage System1- 400 ton Chiller
3,500 ton-hr Storage
Costs of Storage
What’s the Installed Cost of a ton of Chiller Plant?$1000/ton , $1200/ton, $1400/ton $1600/ton, $1800/ton
Storage Costs installed ~ $100 to $150 per ton-hrDepending on location, application and design
For each 1 ton of chiller you reduce you need about 8 to 9 ton-hrs of storage.
Costs are about the same
Other “Green” Issues
1. Safety Factors (Oversizing)• Well documented that oversizing chiller plants
creates less efficient real world operation.• Engineers have to protect their license
2. Efficiency and Water Use• Electric Chillers • Absorption Chillers

Chiller Energy and Water Efficiency Comparison
ChillerType
"Site"COP
EER KW/Ton SourceEnergyCOP*
Site HeatRejection
Factor
WaterUse
Increase
ElectricCentrifugal
6.0 20.5 0.58 2.00 1.1714,000 Btu/ton
---
Electric Screw or Centrifugal
Making Ice
5.0 17.1 0.70 1.66 1.2014,400 Btu/ton
3%
Electric Scroll 4.0 13.6 0.88 1.33 1.2515,000 Btu/ton
7%
Absorption(Double Effect)
1.2 1.20 1.8322,000 Btu/ton
57%
Absorption(Single Effect)
1.0 1.00 2.0024,000 Btu/ton
71%
*Assumes 33% National Electric Grid Efficiency

Thermal Energy Storage and Sustainable Buildings
(Ashrae Journal Sept 04)
Topics:LEEDWhy GreenSafety FactoryRedundancyBack-up Generation

16.6/kWh
8.2/kWh4.7/kWh4.7/kWh

Time Dependent Values August 20th
Units = k-Btu/kWh
18.1738976119.1439356324.1899984539.7929361246.2061036459.1503903453.8518701840.4994828134.9130579328.1761538623.6380170823.0608297
19.260322217.4933851716.9702282516.7382060815.6831227315.6831227315.2515129
15.0582488215.3188811
15.9428243517.0611877217.46917416
10am11am12pm1pm2pm3pm4pm5pm6pm7pm8pm9pm
10pm11pm
12am1am2am3am4am5am6am7am8am9am
4 x
2.4 x

The Plaza At PPL CenterAllentown, PA
Commercial Office, Retail New construction 280,000 sq. feetProject scope: 8-story Urban setting Completed July 2003 Ice Storage 2800 ton-hrRating: LEED Gold

Fossil Ridge HS – Poudre School DistrictFt. Collins, CO
LEED Gold290,000 ft2
Peak Load – 243 TonsActual Chiller – 125 Tons1280 Ton Hrs Ice Storage

Off-Peak Cooling… in over 6000 installations in 35 countries, many installed over 20 years ago
SummaryStorage is Nature’s way to Balance Supply and Demand
Engineer’s Paradigm must change. Instead of adding 20-30% to estimated Load, reduce by 20-30% and add Storage for Safety at no extra Cost.
Cool Storage reduces Operating CostsLoad on GridImpact on Environment
Questions?