thermal comfort in architecture
TRANSCRIPT

8/2/2019 Thermal Comfort in Architecture
http://slidepdf.com/reader/full/thermal-comfort-in-architecture 1/11
1
Thermal Comfort in Architecture
Ommid Saberi [1], Parisa Saneei [2] Amir Javanbakht [3] 1. Ph.D. Student (Architecture & Energy) in Shahid Beheshti Uni. Tehran Iran
e: [email protected] 2. Architect and Researcher Tehran Iran e:[email protected]
3. Architect and Researcher (Iranian Fuel Conservation Org.) Tehran Iran
e:[email protected] Abstract
One of the main goals of building design is to provide a comfortable space for living.
This was the reason of creation a new field in science called “Thermal Comfort”. So
thermal comfort Models should be able to best, help the architects and other building
engineers in design process. The question is: How much comfort models up to now
could do this responsibility? Different models like Fanger and Adaptive are mostly fordefining the comfort zone; either it is static or dynamic. But how an architect could
adjust his building to these zones? Is it possible to make a new model with definition
of comfort zone in different climates simultaneously to give well advises for climatic
design process?
This paper is trying to discuss the above questions.
Key words:
Thermal comfort, Architecture, Climatic design,
1. Why Thermal Comfort?
Comfort has been defined as 'the condition of mind which expresses satisfaction with
the... environment’. The indoor environment should be designed and controlled so that
occupants' comfort and health are assured. [1] Most of the time of people now is spent in
buildings or urban spaces. Although comfort models mostly talks about indoor climate
but both indoor and outdoor climate should be taken into consideration not only in urban
design but also in buildings. So both indoor and outdoor comfort is a matter of attention
for architects and urbanists.
Looking back to the History of thermal comfort and climatic design shows that there
is a definite relation between them, because scientists need to know answers to these
two questions:
1. What are comfort conditions?2. How buildings could adjust themselves to these conditions?
2. Architectural Design Process
Architectural design process itself is very complicated. Still in many schools there is
not a clear method which could lead tutors to teach architectural design trough it.
Even experienced architects could not easily clarify what exactly happens in creating
a new building. But in few words table (1) shows some steps in design process:

8/2/2019 Thermal Comfort in Architecture
http://slidepdf.com/reader/full/thermal-comfort-in-architecture 2/11
2
Table (1) shows the steps in architectural design process
Architectural Design Process
1. Study 2. Sketch Design
(giving Alternatives)
3. Design
Scale: 1:100
4. Detail design
Scale: 1:50-1:1Concepts and Ideas
Site
Concepts and Ideas Choosing one of alternatives and giving
exact plans on different
levels
Climate and comfort Functional 2d and 3d
diagrams
Facades
Function Orientation Sections
Detail design of:Architectural
Mechanical
Electrical
And structural systems
Circulation Volume Perspectives Cost estimation
Culture Plans Model Perspectives
Structure Facades exact models
Mechanical systems Site layout
Electrical systems Simple models
Primary decisions
about mechanical,
structural and electrical
systems
The drawings should be
ready to built without
any more description
In this process climate studies are on the first step, in which architect needs to study
climate of the area using mostly metrological stations data outside or in the
boundaries of the city. Almost the information is average monthly data. Usually daily
or hourly data is not used because of very much time they need to be processed. Then
climate responsive architects analyze this data using some approximate comfort data
(winter and summer comfort zones). At the same time looking at passive
heating/cooling strategies, they combine these strategies to design in sketch and other
steps, if other issues such as economical and/or aesthetical considerations allow them.
To simplify architectural design process, after this, all other considerations rather than
comfort and climate omitted to show how they could be utilized in building design.
3. Architects’ needs/problems in climatic design
In comfort and climate study there are some problems that architect face and for
designing a successful model it is best to know them:
3.1. Undefined conditions of buildings
3.1.1. Human factorsIn many cases architects could not exactly find a real definition of building occupants
during design. He or she could only come to an approximate assumption of clothing,
activities, behaviors, cultures and other human factors. For instance in a residential
complex of 1000 residents, practically it is not possible to exactly get all humanfactors, knowing that even first occupants may alter during time. Or even the same
could happen for a small office building. So architects could not get exact human
factors.
3.1.2. Climatic factorsStill in many countries getting correct climatic data of a region is not easy. As an
example unless Iran is a developing country but there are many cities without
metrological station, in such condition one might use nearer station data, sometime
100 km away.
Even if there is a station most of the time the station is in different microclimate fromthe design site (Open space vs. urban dense space). As Givoni in his book “climatic
considerations in building and urban design” mentioned there are many factors

8/2/2019 Thermal Comfort in Architecture
http://slidepdf.com/reader/full/thermal-comfort-in-architecture 3/11
3
effecting urban climate such as urban density, streets, parks, traffic and… which are
not countable yet.
Also surrounding elements of a building such as materials, colors, water surfaces,
green spaces etc. could have considerable effect, creating small special microclimates,
hard to define. So it is not easy to obtain climatic conditions near the building.
3.1.3. Building factors:Although maybe in developed countries architects could have access to building
materials characteristics easily or the producers give this information, but in many
cases there is not exact data about materials properties such as U-value. So these
properties gained from some reference books like ASHREA or CIBSE. But is the U-
value for brick mentioned in these books is the same with brick produced in other
countries?
Above points shows a story about the approximate data available for architects and
building designers. So if a comfort or climatic model wants to be useful for architects
then it might consider these facts.
Some points help a comfort models to fit architects’ needs are mentioned below:A. Easy process (comfort zone + climate analyses)
B. No long calculation
C. giving direct design guidelines for different steps of design instead of numbers
D. giving knowledge instead of just data
Understanding above points and simplifying design process together with looking to
most known comfort models, it is tried, in following parts, to find a solution.
4. Simplified design procedure (climate/comfort)
To define climatic design process according to comfort zone, it could be divided to
four main parts:
A. Study of the design subject (climate-activities-clothing-etc.)
B. Defining the comfort zone (monthly-daily)
C. Gathering the climatic design advices (shading-thermal mass-evaporative
cooling-thermal insulation-suitable orientation-…)
D. Designing the project (a climatic building)
In part (A) designer should be able to fully understand the climate and comfort needs
as well as all architectural main issues related to the project. Secondly (B) according
to information of 1st
part the monthly or daily comfort zone should be defined and
then (C) some clear design advices could be derived from previous studies to give
directions for each issue in building such as site design, form, ventilation, solar gains,
window sizing, thermal mass, passive heating and cooling, materials and etc.. Finally(D) architect can be able to form a climatic building. The figure (1) shows the
process:
Figure (1) Climatic design process
Parts A and D would be done by architect, but B and C can be covered with a good climatic design model .
A B C D
Definition of
design
subject
Definition of
comfort zone
Climatic
design
advices
Final
design

8/2/2019 Thermal Comfort in Architecture
http://slidepdf.com/reader/full/thermal-comfort-in-architecture 4/11
4
Up to now many scientists worked on different models such as Fanger, Humphreys,
Nicol, Olgyay, Givoni and…. Some of them mostly aim part B (defining comfort
zone) such as Fanger, Humphreys and Nicol, while others tried to cover parts B
(defining comfort zone) and C (climatic design advices) such as Olgyay, Givoni and
Mahoney (Architectural Association Model). This paper aims to find out the positive
points of each model for architects (in design process) and trying to propose a reproduced model. Now the question is:
“Is it possible to create a climatic design model with better coverage of parts B and C?
To answer this question the pervious models are reconsidered:
5. Defining Comfort conditions:
5.1. Fanger thermal equationMacpherson identified six factors that affect thermal sensation. These factors are air
temperature, humidity, air speed, mean radiant temperature (MRT), metabolic rate
and clothing levels. The Fanger comfort equation is the most commonly adopted. It isbased on experiments with American college age persons exposed to a uniform
environment under steady state conditions. The comfort equation establishes the
relationship among the environment variables, clothing type and activity levels. It
represents the heat balance of the human body in terms of the net heat exchange
arising from the effects of the six factors identified by Macpherson. Finally with these
variables Fanger could establish the general comfort equation (1). [2,3]
( )( ) ( )( )[ ]a Du Du P A M A M −−−−− η η 1 / 061.04335.01 / ( )[ ] ( ) ( )( )a Dua DU Du
T A M P A M A M −−−−−−− 34 / 0014.044) / (0023.0501) / (42.0 η ( ) ( ) ( )aclcclmrt clcl t t h f t t f −++−+×= − 448 273273104.3 (1)
It is clear from eqn.(1) that the human thermal comfort is a function of:
(i) The type of clothing tcl, f cl
(ii) The type of activity, η , V and M/aDu
(iii) Environmental variables V, ta, tmrt and Pa
The thermal comfort equation is only applicable to a person in thermal equilibrium
with the environment. However, the equation only gives information on how to reach
optimal thermal comfort by combining the variables involved. Therefore, it is not
directly suitable to ascertain the thermal sensation of a person in an arbitrary climate
where these variables may not satisfy the equation. Fanger used the heat balance
equation to predict a value for the degree of sensation using his own experimental
data and other published data for any combination of activity level, clothing value and
the four thermal environmental parameters. As a measure for the thermal sensation
index the commonly used seven point psycho-physical ASHRAE scale was employed.
Table (2) summarizes the commonly used scales.[2,3]
Table (2) Thermal sensation scales
HotWarmSlightly
warmNeutral
Slightly
coolCoolColdExpression
7654321ASHRAE
3210-1-2-3Fanger

8/2/2019 Thermal Comfort in Architecture
http://slidepdf.com/reader/full/thermal-comfort-in-architecture 5/11
5
The term Predicted Mean Vote (PMV) is the mean vote expected to arise from
averaging the thermal sensation vote of a large group of people in a given
environment. The PMV is a complex mathematical expression involving activity,
clothing and the four environmental parameters. It is expressed by eqn. (2).
( ) LePMV M ×+×=×−
028.0303.0 036.0 (2) In which M is metabolic rate (W/m
2) and L is thermal load on the body that calculated
as (3):
( ) ( )[ ]aPW M W M L −−×−××−−=
− 99.657331005.3 3
( )[ ] ( ) ( )a
3
a
5 t34M104.1P5867M107.115.58WM42.0 −×××−−×××−−−×−−−
( ) ( ) ( )aclccl
4
r4
clcl
8 tthf 273t273tf 1096.3 −××−+−+×××−− (3)
With software it is easily possible to find out the thermal sensation or PMV, although
this is a complicated equation. PMV between -1 to 1 is the comfort zone. [2,3]
5.2. Results form Fanger Model:Following table summaries the results from Fanger model:
Table (3) Fanger model results
Fanger model results
Entry Data Comfort zone (B) Design advices (C)
1 Air temp. PMV or
comfort zone
No advices
2 MRT
3 RH
4 Air speed
5 Clothing insulation
6 Met. Rate
Sum 6 1 0
Fanger model employs 6 entry data and gives comfort zone regarding to them. The
entry data for this model must be exact human and environmental factors. His model
is not created to give design advices.
5.3. Adaptive model Humphreys [6] and Auliciemes investigated the thermal neutrality of the human body.
It was defined as the temperature at which the person feels thermally neutral
"comfortable". Their studies were based on laboratory and field works in whichpeople were thermally investigated under different conditions. The results of their
experiments were statistically analyzed by using regression analysis. Figure (2) shows
that thermal neutrality as a function of the prevailing climatic conditions. Humphreys
showed that 95% of the neutral temperature is associated with the variation of outdoor
mean temperature. For free running buildings, the regression equation is
approximated by (Tn=neutral temp.oc Tm= Mean outdoor temp.
oc): [7]
mn T T 534.09.11 += (4)
A different empirical correlation function was carried out by Auliciemes is: [7]
mn T T 314.06.17 += (5)

8/2/2019 Thermal Comfort in Architecture
http://slidepdf.com/reader/full/thermal-comfort-in-architecture 6/11
6
Figure (2) Relationship between outdoor temperature with neutral temp.[6]
Based on the above equations, the predicted neutral temperature for different months
of the year could be calculated.
5.4. Results form Adaptive Model:Following table summaries the results from adaptive model:
Table (4) Adaptive model results
Adaptive model results
Entry Data Comfort zone (B) Design advices (C)
1 Mean outdoor Air
temp.
Neutral temp. or
comfort zone
No advices
(for free running
buildings)
Sum 1 1 0
Adaptive model employs 1 entry data and gives comfort zone or neutral temperature
for free running buildings. It is easy to calculate but is not designed to give design
advices. It is very easy to use and gives very simply idea of comfort temperature.
6. Design strategy ModelsThere are some models designed to give advises for climate responsive buildings.
They mostly have very simple comfort zone and some advices.
6.1. Building bioclimatic charts
Bioclimatic charts facilitate the analysis of the climate characteristics of a givenlocation from the viewpoint of human comfort, as they present, on a psychrometric
chart, the concurrent combination of temperature and humidity at any given time.
They can also specify building design guidelines to maximize indoor comfort
conditions when the building’s interior is not mechanically conditioned. All such
charts are structured around, and refer to, the comfort zone.[7]
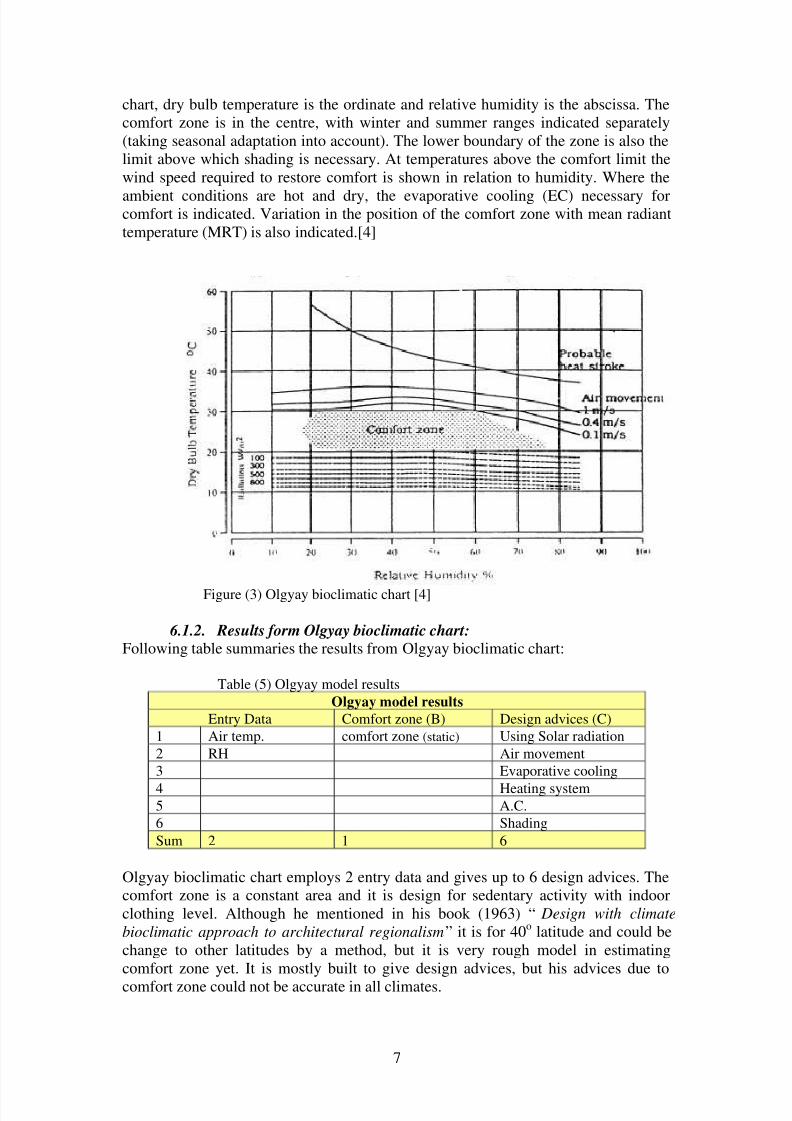
6.1.1. Olgyay bioclimatic chartOlgyays bioclimatic chart, figure (3), was one of the first attempts at an
environmentally conscious building design. It was developed in the 1950s to
incorporate the outdoor climate into building design. The chart indicates the zones of
human comfort in relation to ambient temperature and humidity, mean radianttemperature (MRT), wind speed, solar radiation and evaporative cooling. On the
8/2/2019 Thermal Comfort in Architecture
http://slidepdf.com/reader/full/thermal-comfort-in-architecture 7/11
7
chart, dry bulb temperature is the ordinate and relative humidity is the abscissa. The
comfort zone is in the centre, with winter and summer ranges indicated separately
(taking seasonal adaptation into account). The lower boundary of the zone is also the
limit above which shading is necessary. At temperatures above the comfort limit the
wind speed required to restore comfort is shown in relation to humidity. Where the
ambient conditions are hot and dry, the evaporative cooling (EC) necessary forcomfort is indicated. Variation in the position of the comfort zone with mean radiant
temperature (MRT) is also indicated.[4]
Figure (3) Olgyay bioclimatic chart [4]
6.1.2. Results form Olgyay bioclimatic chart:Following table summaries the results from Olgyay bioclimatic chart:
Table (5) Olgyay model results
Olgyay model results
Entry Data Comfort zone (B) Design advices (C)
1 Air temp. comfort zone (static) Using Solar radiation
2 RH Air movement
3 Evaporative cooling
4 Heating system5 A.C.
6 Shading
Sum 2 1 6
Olgyay bioclimatic chart employs 2 entry data and gives up to 6 design advices. The
comfort zone is a constant area and it is design for sedentary activity with indoor
clothing level. Although he mentioned in his book (1963) “ Design with climate
bioclimatic approach to architectural regionalism” it is for 40o
latitude and could be
change to other latitudes by a method, but it is very rough model in estimating
comfort zone yet. It is mostly built to give design advices, but his advices due to
comfort zone could not be accurate in all climates.

8/2/2019 Thermal Comfort in Architecture
http://slidepdf.com/reader/full/thermal-comfort-in-architecture 8/11
8
6.1.3. Givoni bioclimatic chartGivoni’s bioclimatic chart, figure (4), aimed at predicting the indoor conditions of the
building according to the outdoor prevailing conditions. He based his study on the
linear relationship between the temperature amplitude and vapour pressure of the
outdoor air in various regions. In his chart and according to the relationship betweenthe average monthly vapour pressure and temperature amplitude of the outdoor air,
the proper passive strategies are defined according to the climatic conditions
prevailing outside the building envelope. The chart combines different temperature
amplitude and vapour pressure of the ambient air plotted on the psychrometric chart
and correlated with specific boundaries of the passive cooling techniques overlaid on
the chart. These techniques include evaporative cooling, thermal mass, natural
ventilation cooling and passive heating.[5]
Figure (4) Givoni bioclimatic chart [5]
6.1.4. Results form Givoni bioclimatic chart:Following table summaries the results from Givoni bioclimatic chart:
Table (6) Givoni model results
Givoni Model results
Entry Data Comfort zone (B) Design advices (C)
1 Air temp. comfort zone(static)
Using Solar radiation
2 RH Air movement
3 Evaporative cooling
4 Heating system
5 A.C.
6 Shading
7 Thermal Mass
8 DehumidificationSum 2 1 8

8/2/2019 Thermal Comfort in Architecture
http://slidepdf.com/reader/full/thermal-comfort-in-architecture 9/11
9
Givoni bioclimatic chart employs 2 entry data and gives up to 8 design advices. In his
model the same thing happens as olgyays comfort zone, he published new comfort
zone in his recent book [8] taking developed and developing hot countries conditions
into account, but still it is a common condition for different climatic regions and has a
rough comfort zone. It is mostly built to give climatic design advices. He also
enhance his advises in his recent book adding new strategies such as nocturnalcooling.
6.2. Mahoney model The Department of Development and Tropical Studies of the Architectural
Association in London developed a methodology for building design in accordance to
climate. The proposed methodology is based on three stages of design, the sketch
design stage, the plan development stage and the element design stage. For the
purpose of systematic analysis during the three stages, they introduced the Mahoney
Tables. The tables are used to analyze the climate characteristics, from which design
indicators are obtained. From these indicators a preliminary picture of the layout,
orientation, shape and structure of the climatic responsive design can be obtained. Theclimatic data such as dry bulb temperature, relative humidity, precipitation and wind
are used as entry data.[7] In this paper the tables’ description omitted to be brief.
6.3. Results form Mahoney model:Following table summaries the results from Mahoney model:
Table (7) Mahoney model results
Mahoney Model results
Entry Data Comfort zone (B) Design advices (C)
1 Air temp. comfort zone
(gives 24 options for climate butnot for clothing and activity)
Using Solar radiation
2 RH Air movement
3 Rainfall Rain protection
4 Wind Outdoor sleeping
5 Thermal insulation
6 Shading
7 Thermal Mass
8 Dehumidification
9 Orientation and location
10 Vegetation
11 OpeningsSum 4 1 11
Mahoney model employs 4 climatic entry data and gives more than 11 design advices.
Comfort conditions (24 types) define by different annual mean range of temperatures
and also relative humidity. The comfort zones look more adaptive to different
climates, although human factors could not be changed. Also its climatic design
advices is more architectural, for example orientation or opening size are directly
could be used in design process. This model as a climatic design model more suited to
building design because it gives recommendations for different architectural design
stages (sketch-design-detail design).
7. Conclusion

8/2/2019 Thermal Comfort in Architecture
http://slidepdf.com/reader/full/thermal-comfort-in-architecture 10/11
10
Figure (5) summarize the paper showing that Fanger and adaptive models, as they
design for, are very good for defining comfort zone, also Mahoney model is the best
for design advices, in regard to its not very complete comfort zone definition. Givoni
and Olgyay models are working with pictures rather than charts so more easily could
be used by architects although they have very rough comfort zone.
Figure (5) Results from all comfort models
FangerAdaptive
OlgyayGivoni
Mahony
Entry data
Comfort zone
design advices
00
6
8
11
1010
33
5
6
1
22
4
0
2
4
6
8
10
12
Comfort Models
Entry data Comfort zone design advices
8. The way forward
Looking to the models together indicates that there may be a combination of comfort
zone definition models, like Fanger or adaptive with design advise models like
Mahoney for architects considering all mentioned points. The new climatic design
model will need more flexible comfort conditions with different clothing and activity
level together with improved number of design advices to cover more parts of
architectural design process.
Also the model needs to have look to outdoor comfort as well, to allow architects
think about open and semi-open spaces in their buildings. Because in many examples
before industrial revolution not only indoor climate, but also outdoor climate withshading, vegetation and water surfaces has been controlled, see figure (6). But now
there is an assumption for designers, that life is happening only indoor!!!

8/2/2019 Thermal Comfort in Architecture
http://slidepdf.com/reader/full/thermal-comfort-in-architecture 11/11
11
Figure (6) Left: an old courtyard house in Kashan–
Iran shows that outdoor is not a abandoned space
but it is a place conditioned with water surface,
shading, vegetation and ground cooling to host
occupants to live out side. Right: a today building
in Tehran everything happens inside outside is for
cars.
9. References:
[1] CIBSE, Guide A, (1999) the Chartered Institution of Building Services Engineers,
Yale Press, London
[2] ASHRAE, Fundamentals, (2001) American Society of Heating, Refrigerating and
Air-Conditioning Engineers, Inc. Atlanta
[3] Fanger, PO. (1982) Thermal comfort, analysis and applications in environmental
engineering. Florida: Robert E. Kreiger Publishing Co.
[4] Olgyay V. (1963) Design with climate, bioclimatic approach and architecturalregionalism. Princeton (NJ): Princeton University Press,
[5] Givoni B. (1967) Man, climate and architecture. 1st
ed. London, Applied Science
Publishers Ltd.,
[6] Humphreys, M.A. and Nicol, J.F. (1998) Understanding the Adaptive Approach to
Thermal Comfort, ASHRAE Transactions 104 (1) pp 991-1004
[7] Sayigh, A., Marafia, H. (1998) “Thermal comfort and the development of
bioclimatic concept in building design”, Renewable and Sustainable Energy Reviews,
2,1998, 3-24, Published by Elsevier Science Ltd, pp 8-15
[8] Givoni B. (1998) Climate considerations in building and urban design. 1st
ed. New
York, Van Nostrand Reinhold Publishers Ltd.,