thermal behavior of double arc groove friction...
TRANSCRIPT
1
THERMAL BEHAVIOR OF DOUBLE ARC GROOVE FRICTION PAIRS IN HYDRO-
VISCOUS DRIVE UNDER SOFT START-UP CONDITION
Qiliang WANG1,, Hongwei CUI1,2*, Zisheng LIAN1,2, Long LI1,
1 College of Mechanical Engineering, Taiyuan University of Technology, Taiyuan, China
2 Shanxi Key Laboratory of Fully Mechanized Coal Mining Equipment, Taiyuan University of
Technology, Taiyuan, China
* Corresponding author; E-mail: [email protected]
Three-dimensional transient heat conduction equations with boundary-value
problems were established for numerical simulation to explore the thermal
behavior of double arc groove friction pairs. The heat flux of the contact
face decelerated with time, and its distributions were formulated with
intensity proportional to the thermal parameters of the materials.
Additionally, the theoretical expression of the friction disc’s speed was
deduced. Subsequently, a numerical solution was obtained using the finite
difference method to predict the temperature field distributions of the
friction pairs and to determine the location of the maximum temperature
under different start-up times. The results indicate that the friction disc and
steel disc are approximately similar regarding the temperature field
distributions. However, the temperature and radial temperature gradient of
the latter are several times those of the former. The central region
temperatures for each rhombus at the surface of the friction disc are higher
than those of the surrounding area. The longer the time to soft start-up is,
the higher is the generated temperature, and the greater is the radial
temperature gradient. The analysis results provide theoretical reference and
technical support for the selection of the start-up time by considering the
actual working conditions of scraper conveyor.
Key words: hydro-viscous drive, double arc groove, thermal behavior,
transient temperature field, soft start-up process
Introduction
The hydro-viscous drive (HVD) uses viscous fluid as its working medium to transfer power, and
relies on the fluid shear force and frictional force between the driving and driven discs, which is a new
type of power transmission device. HVD is mainly used for fans, water pumps, belt conveyors, scraper
conveyors and other mechanical equipment, and has the advantages of step-less speed regulation, soft
start-up, overload protection, small start-up impact, high efficiency, and high reliability. Thereby, it
realizes energy saving by reducing the energy consumption of the equipment [1].
In the process of soft start-up, a large amount of frictional heat is produced by the relative
sliding between the driving and driven discs. This results in a sharp increase in the temperature of the
discs. On the one hand, there is a strong thermal convection between the friction pairs and oil film, and
2
a constant change in boundary conditions, which cause the non-uniform distribution of the temperature
field. On the other hand, large thermal stresses generated by high temperature may cause the
deformation of friction pairs. Moreover, it has also been found that high thermal stresses occur in the
friction pairs owing to the considerable temperature difference during the start-up process. Therefore,
the distribution characteristics of the friction pairs’ temperature field have been widely discussed.
There is an abundance of archival research publications dealing with thermal problems. A
literature review was carried out regarding the numerical analysis of thermal stresses in disc brakes
and clutches [2]. The analysis, of uncoupled and coupled thermoelasticity problem for frictional heat
generation in disc brakes and clutches was carried using the finite element method. Zagrodzkiet and
Truncone [3] found that severe hot spots can be produced during short-term clutch operation with a
high initial sliding speed. Marklund, et al. [4, 5] investigated the friction of a small wet clutch friction
disc sample and obtained results that were in good agreement with the friction behaviors of different
measurement methods. Hu, et al. [6] developed a uniform cross-speed model covering the average
flow model and cavitation model, and studied the cross-speed characteristics of an end-face seal ring
with spiral grooves for wet clutch. Addressed to serious heat degradation problem of the braking
continuously performed in the drag brake application for a long time, finite element analysis for
bidirectional thermal-structure coupling was performed to investigate the temperature and stress in the
case where the material properties depend on temperature [7]. A series of finite element method
investigations were carried out on the non-axisymmetric heating of the disc by the heat flux moving
with the intensity proportional to the specific power of friction within a contact area, at a constant
coefficient of friction [8-10].
Cui, et al. [11, 12] analyzed the influence of double arc oil groove parameters on shear torque
by means of theory and experiment. Xie, et al. [13] studied the influence of the different cross-
sectional shapes and layout forms of oil grooves on thermal behavior, and determined the optimal
section shape and layout form of the oil grooves on the temperature field. Cui, et al. [14] established a
three-dimensional transient temperature model to research the thermal behavior of multidisc friction
pairs in HVD. An analysis was performed on the three-dimensional transient temperature field of a
disc brake generated during a single and multiple braking processes with temperature-dependent and
constant coefficients of friction [15]. The thermal effects in the structure and contact behavior of a
disc-pad assembly were identified by a finite element approach [16, 17]. Moreover, the structural and
thermomechanical behavior of the dry contact between the brake disc and the pads during the braking
phase were analyzed using the ANSYS simulation software [18, 19]. A FE model was proposed to
determine the corresponding quasi-static stresses in the brake disc tribosystem [20].
In conclusion, the extant investigation only analyzed the thermal properties of the friction pairs
under certain conditions. Additionally, the effect of the double arc groove on the distribution
characteristics of the temperature field of the friction pairs has not been considered. In this study, the
investigated friction pairs are used in a scraper conveyor, which has a long start-up time. The speed of
the friction pairs is relatively low, however their radius is large. Since the actual working condition is
very harsh, it is difficult to measure the temperature at various points when the friction pairs are at
work. Therefore, the finite element method is a more desirable approach.
This study focused on the thermal characteristics of the double arc groove and obtained the
temperature distribution for the friction pairs. Moreover, the location of the maximum temperature
under different start-up times was predicted by establishing the three-dimensional transient heat
3
conduction equations, deriving the theoretical expression of the friction disc’s speed, and determining
the boundary conditions. These will be helpful in selecting of start-up time for the scraper conveyor.
Statement of the problem
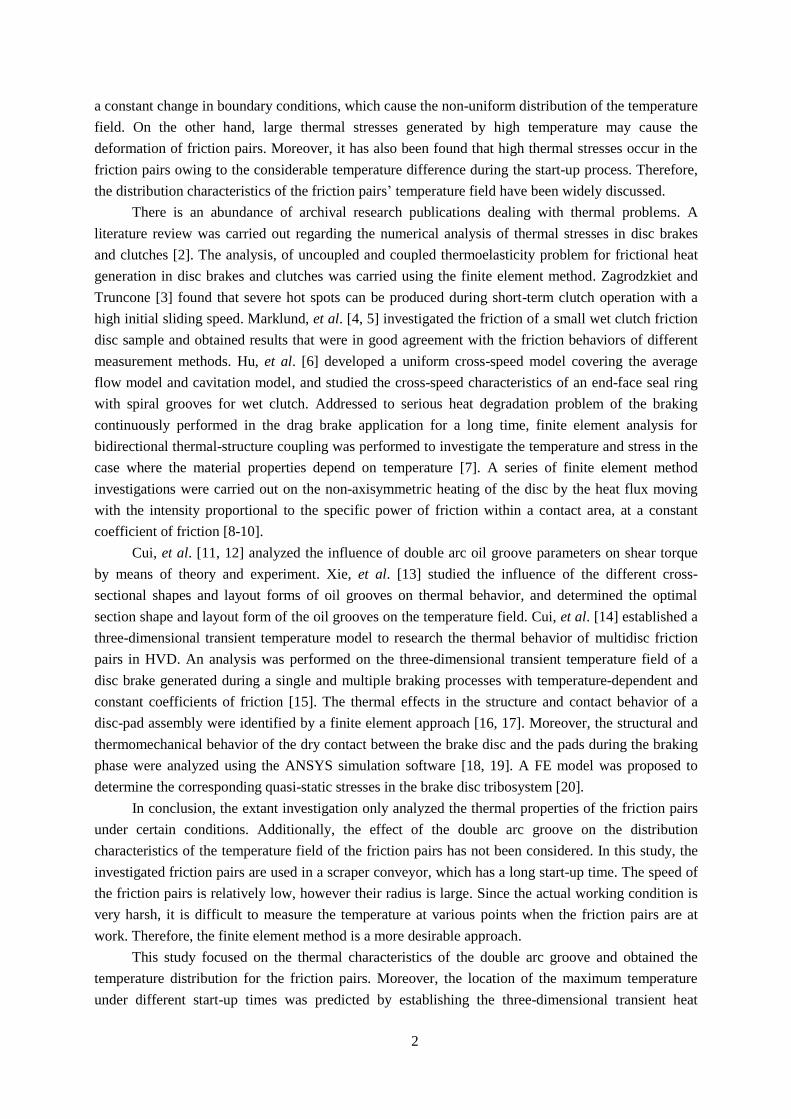
Figure 1 illustrates the schematic of the HVD device, which uses a planet gear transmission
mechanism. The internal ring gear is floating, the planet carrier is connected to the output shaft and the
sun gear rotates as the input shaft. The friction discs are attached to the internal ring gear by the
external spline. The steel discs are attached to the fixed plate by the inner spline, and the fixed plate is
attached to the shell steadily. The friction discs and steel discs shown in Fig. 2 are arranged alternately
along the axial direction, and lubricating oil is filled in the clearance between them. By controlling the
pressure of the annular oil cylinder, the clearance between the friction pairs is adjusted. This realizes
their bonding and separating for the speed and torque of the output shaft to be changed. Thereby, a soft
start-up function is achieved. Owing to the constant static state of the steel discs, the bonding of the
friction pairs are realized by reducing the speed of the friction discs with planetary gear transmission
during the entire soft start-up process.
sun gear
fixed plate
lubricant oil circuit
planet carrier
planet gear
internal ring gear
support platefriction discshaft couplingsteel disc
control oil circuit
annular oil cylinder
return spring
Steel disc Friction disc
Figure 1. The schematic of the HVD device Figure 2. The picture of friction pairs
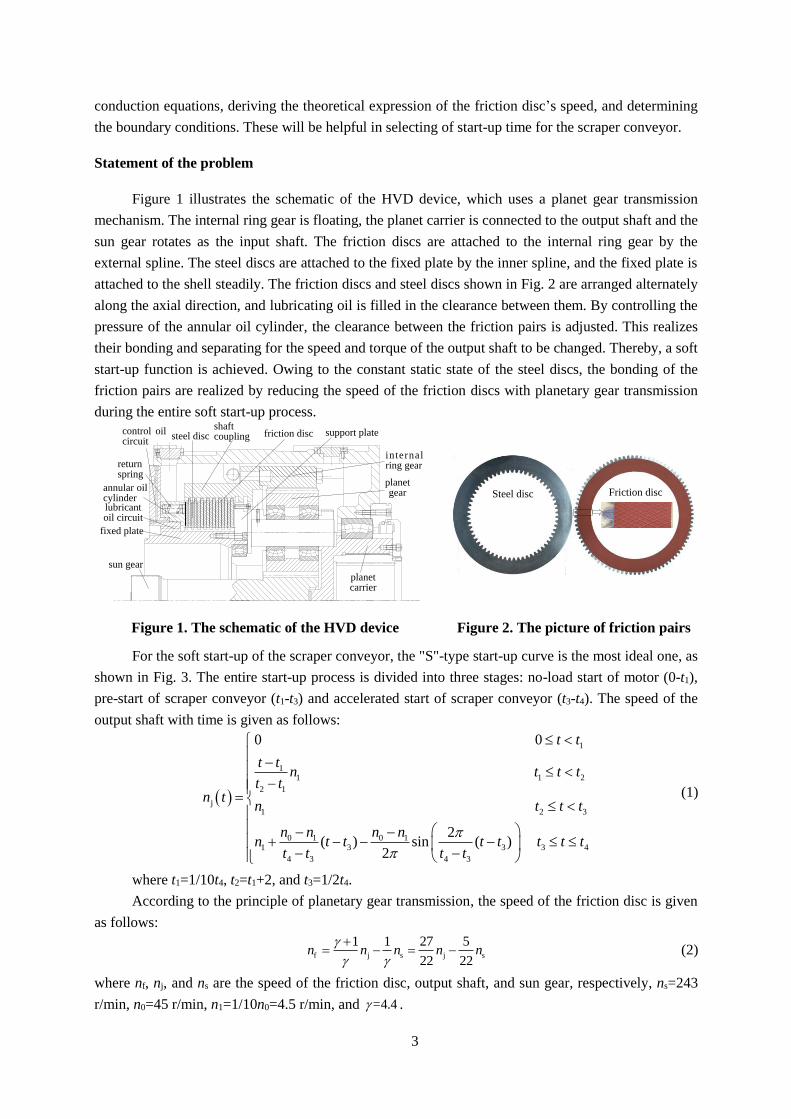
For the soft start-up of the scraper conveyor, the "S"-type start-up curve is the most ideal one, as
shown in Fig. 3. The entire start-up process is divided into three stages: no-load start of motor (0-t1),
pre-start of scraper conveyor (t1-t3) and accelerated start of scraper conveyor (t3-t4). The speed of the
output shaft with time is given as follows:
1
11 1 2
2 1
j1 2 3
0 1 0 11 3 3 3 4
4 3 4 3
0 0
2( ) sin ( )
2
t t
t tn t t t
t tn t
n t t t
n n n nn t t t t t t t
t t t t
(1)
where t1=1/10t4, t2=t1+2, and t3=1/2t4.
According to the principle of planetary gear transmission, the speed of the friction disc is given
as follows:
f j s j s
1 1 27 5
22 22n n n n n
(2)
where nf, nj, and ns are the speed of the friction disc, output shaft, and sun gear, respectively, ns=243
r/min, n0=45 r/min, n1=1/10n0=4.5 r/min, and =4.4 .
4
By substituting Eq. (1) into (2), the speed of the friction disc can be obtained as follows:
s 1
1
s 1 1 2
2 1
f
s 1 2 3
0 1 0 1
s 1 3 3 3 4
4 3 4 3
50
22
5 27
22 22
5 27
22 22
5 27 2( ) sin ( )
22 22 2
n t t
t tn n t t t
t tn
n n t t t
n n n nn n t t t t t t t
t t t t
(3)
Therefore, in the entire start-up process, the speed of the friction disc follows an anti-"S" curve.
Fig. 4 shows the speed variation of the friction disc over time when the soft start-up time is 10 s, 20 s,
30 s and 40 s, respectively.
t3
n0
n1
t4
t2
t1
Time [s]
Ou
tput
spee
d [
r/m
in]
0 5 10 15 20 25 30 35 400
10
20
30
40
50
60
Fri
ctio
n d
isks
spee
d [
r/m
in]
Time [s]
Figure 3. The start-up curve of the scraper
conveyor
Figure 4. The speed of the friction disc under
different start-up times
Transient finite element analysis
The geometry and load of the friction disc and steel disc are symmetric about the mid-plane.
During the start-up process, the gaps between the discs and oil flow are very small. Hence, the small
part of the heat absorbed by the oil film is negligible. Moreover, the thermal property of isotropic
materials does not vary with temperature. According to the above analysis, some essential assumptions
are made as follows:
(1) The materials of the friction disc and steel disc are isotropic.
(2) The heat generated by friction is absorbed by the friction pairs entirely, and the radiative
heat transfer from the disc is small enough to be negligible [8].
(3)The computational region is restricted to half of their thickness.
By considering the axisymmetric structure of the friction pairs, the transient heat conduction
differential equations for the friction pairs in cylindrical coordinates are given as follows:
2 2
2 2
1i i i i
i i i
i
T T T Tc k
t r rr z
(4)
where the subscript i represents s, f, and c, which are the steel disc, friction lining, and core disc,
respectively. Ti, i , ik , and
ic are the temperature, density, thermal conductivity, and specific heat of
the material i, respectively.
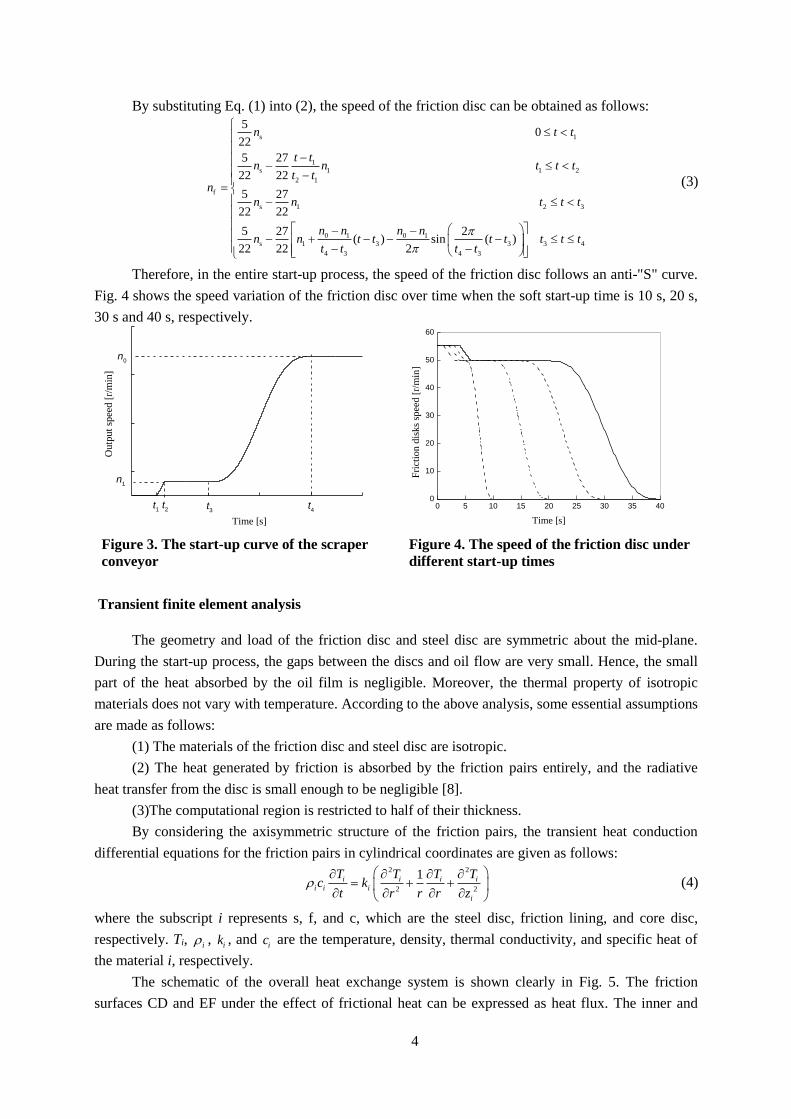
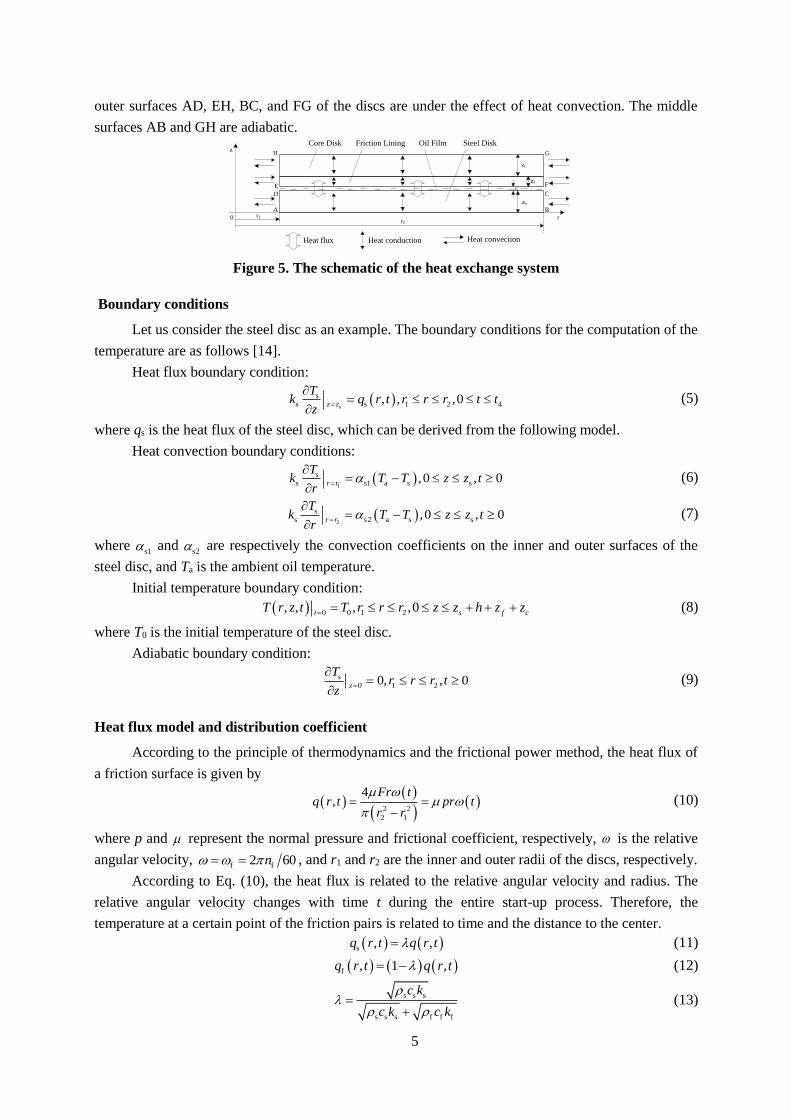
The schematic of the overall heat exchange system is shown clearly in Fig. 5. The friction
surfaces CD and EF under the effect of frictional heat can be expressed as heat flux. The inner and
5
outer surfaces AD, EH, BC, and FG of the discs are under the effect of heat convection. The middle
surfaces AB and GH are adiabatic.
A B
CD
E F
GH
zs
zc
zf
r1r2
r
z
0
h
Heat flux Heat conduction Heat convection
Steel DiskFriction LiningCore Disk Oil Film
Figure 5. The schematic of the heat exchange system
Boundary conditions
Let us consider the steel disc as an example. The boundary conditions for the computation of the
temperature are as follows [14].
Heat flux boundary condition:
s
s
s s 1 2 4, , ,0z z
Tk q r t r r r t t
z
(5)
where qs is the heat flux of the steel disc, which can be derived from the following model.
Heat convection boundary conditions:
1
s
s s1 a s s,0 , 0r r
Tk T T z z t
r
(6)
2
s
s s2 a s s,0 , 0r r
Tk T T z z t
r
(7)
where s1 and
s2 are respectively the convection coefficients on the inner and outer surfaces of the
steel disc, and Ta is the ambient oil temperature.
Initial temperature boundary condition:
0 0 1 2, , , ,0t s f cT r z t T r r r z z h z z (8)
where T0 is the initial temperature of the steel disc.
Adiabatic boundary condition:
s
0 1 20, , 0z
Tr r r t
z
(9)
Heat flux model and distribution coefficient
According to the principle of thermodynamics and the frictional power method, the heat flux of
a friction surface is given by
2 2
2 1
4,
Fr tq r t pr t
r r
(10)
where p and represent the normal pressure and frictional coefficient, respectively, is the relative
angular velocity, f f2 60n , and r1 and r2 are the inner and outer radii of the discs, respectively.
According to Eq. (10), the heat flux is related to the relative angular velocity and radius. The
relative angular velocity changes with time t during the entire start-up process. Therefore, the
temperature at a certain point of the friction pairs is related to time and the distance to the center.
s , ,q r t q r t (11)
f , 1 ,q r t q r t (12)
s s s
s s s f f f
c k
c k c k
(13)
6
where is the distribution coefficient of the heat flux.
Solving the finite element model
The solution of the heat conduction problem is the numerical integration of Eq. (4). The
transient heat conduction differential equations were discretized using the Galerkin method to obtain
the transient temperature field matrix as follows:
C T K T Q (14)
where [C] is the heat capacity matrix, [K] is the heat conductivity matrix, {T}is the nodal temperature
vector, T is the time derivative of the node temperature vector, and {Q} is the generalized node
heat flux vector. The detailed derivation of Eq. (20) can be found in the literature [21].
The Newmark direct transient integral method is the most commonly used method for solving
Eq. (14). The assumed relationship between temperature nT at time
nt t and temperature 1nT at time
1n nt t t t is as follows:
1 11n n n nT T T T t (15)
where is a parameter that can be determined to obtain integration accuracy and stability. Stable
schemes are usually obtained when is in the range of 0.5 1.0 .
By substituting Eq. (15) into (14), we can obtain an implicit algebraic equation:
1 11 1n n n
C t K T C K t T t Q t Q (16)
Equation (16) is a formula for solving the equation of the transient temperature field and can be
used to obtain the temperature at any time. Therefore, this method can be regarded as an implicit finite
difference method. In this study, the backward difference method was used to solve the transient
temperature field, namely, 1 . Hence, Eq. (16) can be written as
1 1n n nC t K T C T t Q
(17)
Results and discussions
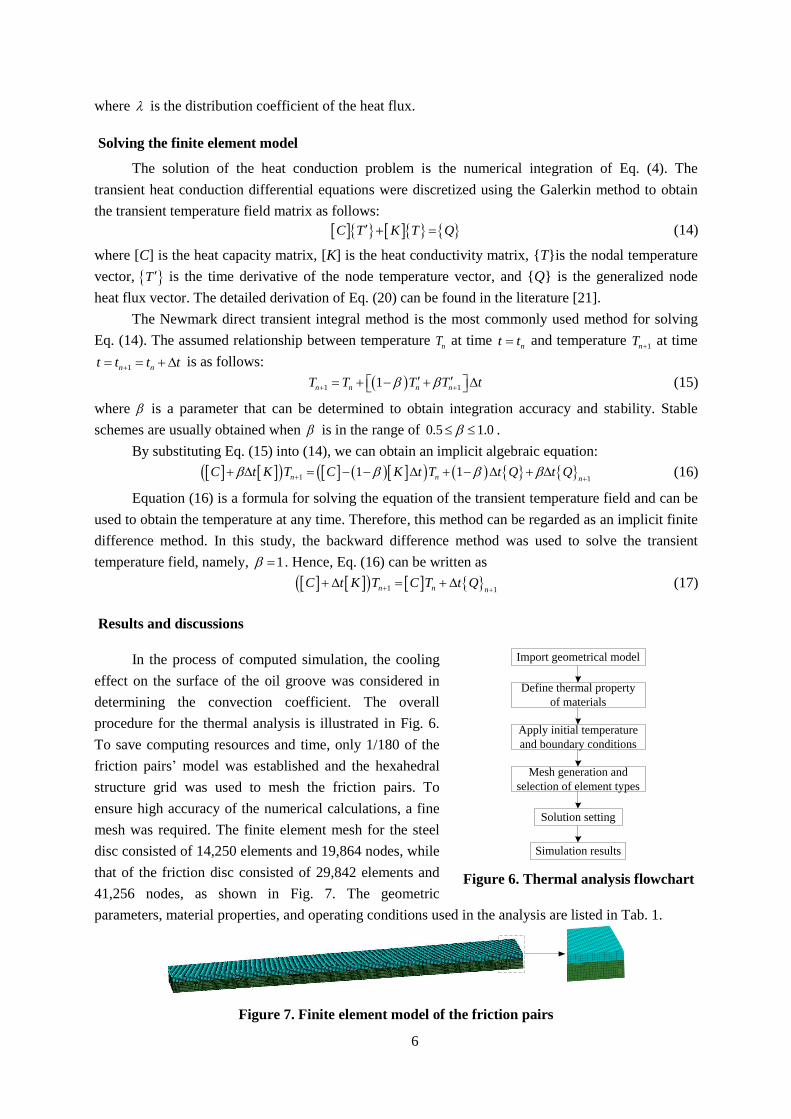
In the process of computed simulation, the cooling
effect on the surface of the oil groove was considered in
determining the convection coefficient. The overall
procedure for the thermal analysis is illustrated in Fig. 6.
To save computing resources and time, only 1/180 of the
friction pairs’ model was established and the hexahedral
structure grid was used to mesh the friction pairs. To
ensure high accuracy of the numerical calculations, a fine
mesh was required. The finite element mesh for the steel
disc consisted of 14,250 elements and 19,864 nodes, while
that of the friction disc consisted of 29,842 elements and
41,256 nodes, as shown in Fig. 7. The geometric
parameters, material properties, and operating conditions used in the analysis are listed in Tab. 1.
Figure 7. Finite element model of the friction pairs
Import geometrical model
Define thermal property
of materials
Apply initial temperature
and boundary conditions
Mesh generation and
selection of element types
Solution setting
Simulation results
Figure 6. Thermal analysis flowchart
7
Table 1. The geometric parameters, material properties, and operation conditions
Input data Value Input data Value
Inner diameter of friction pairs [mm] 512 Outer diameter of friction pairs [mm] 664
Thickness of friction lining [mm] 1 Thickness of steel disc and core disc [mm] 1.2
Groove depth [mm] 0.5 Groove width [mm] 1.4
Density of steel disc and core disc
[kgm-3]
7800 Specific heat of steel disc and core disc
[Jkg-1°C -1]
460
Density of friction lining [kgm-3] 1450 Specific heat of friction lining [Jkg-1°C -1] 1580
Thermal conductivity of steel disc and
core disc [Wm-1°C -1]
45 Thermal conductivity of friction lining
[Wm-1°C -1]
2.2
Convection coefficient on the inner edge
of steel disc [Wm-2°C -1]
2680 Convection coefficient on the inner edge of
friction disc [Wm-2°C -1]
510
Convection coefficient on the outer edge
of steel disc [Wm-2°C -1]
890 Convection coefficient on the outer edge of
friction disc [Wm-2°C -1]
170
Initial temperature [°C] 30 Ambient oil temperature [°C] 30
Normal pressure [MPa] 1 Frictional coefficient 0.09
Transient temperature of the friction pairs
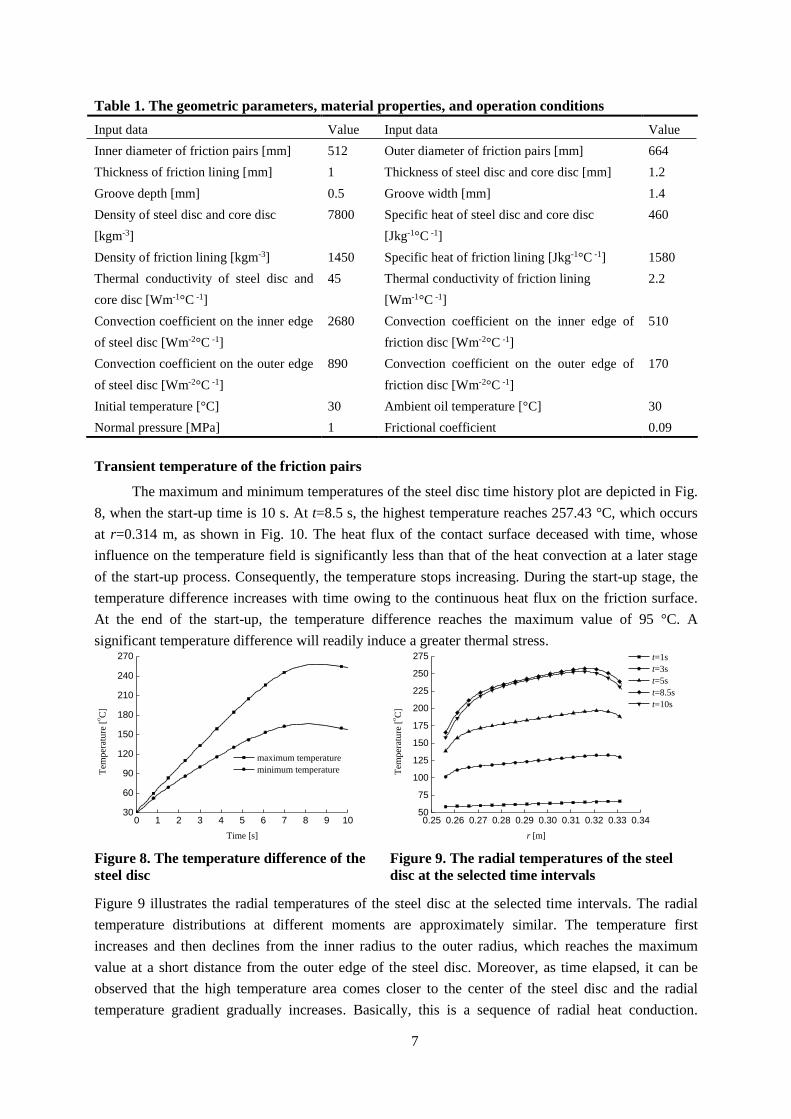
The maximum and minimum temperatures of the steel disc time history plot are depicted in Fig.
8, when the start-up time is 10 s. At t=8.5 s, the highest temperature reaches 257.43 °C, which occurs
at r=0.314 m, as shown in Fig. 10. The heat flux of the contact surface deceased with time, whose
influence on the temperature field is significantly less than that of the heat convection at a later stage
of the start-up process. Consequently, the temperature stops increasing. During the start-up stage, the
temperature difference increases with time owing to the continuous heat flux on the friction surface.
At the end of the start-up, the temperature difference reaches the maximum value of 95 °C. A
significant temperature difference will readily induce a greater thermal stress.
0 1 2 3 4 5 6 7 8 9 1030
60
90
120
150
180
210
240
270
Tem
per
ature
[oC
]
Time [s]
maximum temperature
minimum temperature
0.25 0.26 0.27 0.28 0.29 0.30 0.31 0.32 0.33 0.3450
75
100
125
150
175
200
225
250
275
Tem
per
ature
[oC
]
r [m]
t=1s
t=3s
t=5s
t=8.5s
t=10s
Figure 8. The temperature difference of the
steel disc
Figure 9. The radial temperatures of the steel
disc at the selected time intervals
Figure 9 illustrates the radial temperatures of the steel disc at the selected time intervals. The radial
temperature distributions at different moments are approximately similar. The temperature first
increases and then declines from the inner radius to the outer radius, which reaches the maximum
value at a short distance from the outer edge of the steel disc. Moreover, as time elapsed, it can be
observed that the high temperature area comes closer to the center of the steel disc and the radial
temperature gradient gradually increases. Basically, this is a sequence of radial heat conduction.
8
Therefore, thermal stress is more likely to be generated. There is intense convection heat transfer with
lubricating oil at the two edges of the steel disc. As a result, the temperature at the two edges of the
steel disc is lower than that of the middle region. Furthermore, the temperature is lower at the inner
radius, in comparison with the temperature at the outer radius, as the heat dissipation at the inner
radius is better.
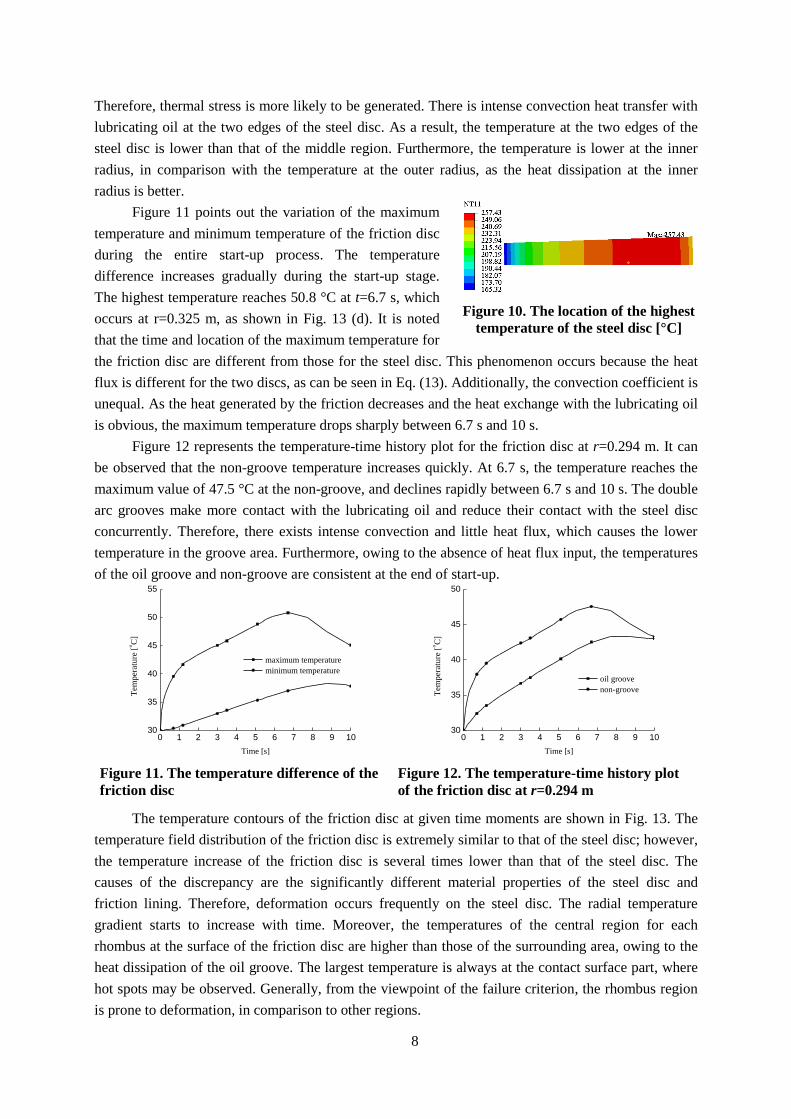
Figure 11 points out the variation of the maximum
temperature and minimum temperature of the friction disc
during the entire start-up process. The temperature
difference increases gradually during the start-up stage.
The highest temperature reaches 50.8 °C at t=6.7 s, which
occurs at r=0.325 m, as shown in Fig. 13 (d). It is noted
that the time and location of the maximum temperature for
the friction disc are different from those for the steel disc. This phenomenon occurs because the heat
flux is different for the two discs, as can be seen in Eq. (13). Additionally, the convection coefficient is
unequal. As the heat generated by the friction decreases and the heat exchange with the lubricating oil
is obvious, the maximum temperature drops sharply between 6.7 s and 10 s.
Figure 12 represents the temperature-time history plot for the friction disc at r=0.294 m. It can
be observed that the non-groove temperature increases quickly. At 6.7 s, the temperature reaches the
maximum value of 47.5 °C at the non-groove, and declines rapidly between 6.7 s and 10 s. The double
arc grooves make more contact with the lubricating oil and reduce their contact with the steel disc
concurrently. Therefore, there exists intense convection and little heat flux, which causes the lower
temperature in the groove area. Furthermore, owing to the absence of heat flux input, the temperatures
of the oil groove and non-groove are consistent at the end of start-up.
0 1 2 3 4 5 6 7 8 9 1030
35
40
45
50
55
Tem
per
atu
re [
oC
]
Time [s]
maximum temperature
minimum temperature
0 1 2 3 4 5 6 7 8 9 10
30
35
40
45
50
Tem
per
atu
re [
oC
]
Time [s]
oil groove
non-groove
Figure 11. The temperature difference of the
friction disc
Figure 12. The temperature-time history plot
of the friction disc at r=0.294 m
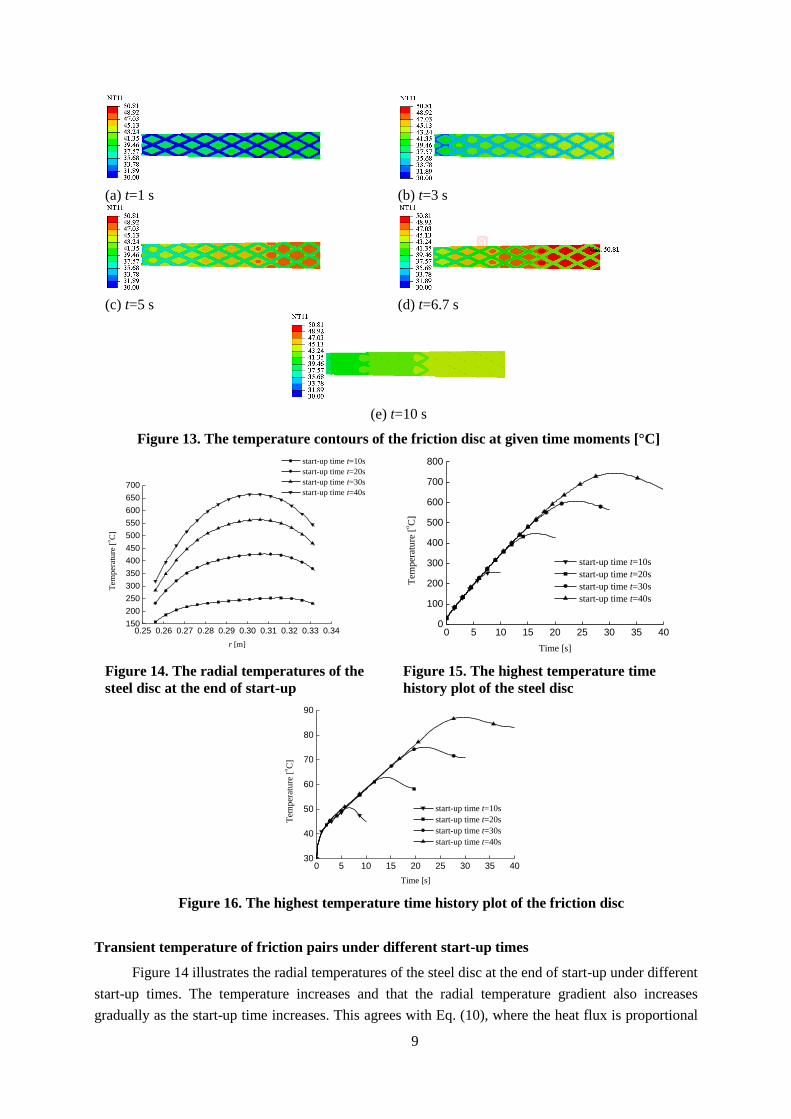
The temperature contours of the friction disc at given time moments are shown in Fig. 13. The
temperature field distribution of the friction disc is extremely similar to that of the steel disc; however,
the temperature increase of the friction disc is several times lower than that of the steel disc. The
causes of the discrepancy are the significantly different material properties of the steel disc and
friction lining. Therefore, deformation occurs frequently on the steel disc. The radial temperature
gradient starts to increase with time. Moreover, the temperatures of the central region for each
rhombus at the surface of the friction disc are higher than those of the surrounding area, owing to the
heat dissipation of the oil groove. The largest temperature is always at the contact surface part, where
hot spots may be observed. Generally, from the viewpoint of the failure criterion, the rhombus region
is prone to deformation, in comparison to other regions.
Figure 10. The location of the highest
temperature of the steel disc [°C]
9
(a) t=1 s (b) t=3 s
(c) t=5 s (d) t=6.7 s
(e) t=10 s
Figure 13. The temperature contours of the friction disc at given time moments [°C]
0.25 0.26 0.27 0.28 0.29 0.30 0.31 0.32 0.33 0.34150
200
250
300
350
400
450
500
550
600
650
700
Tem
per
atu
re [
oC
]
r [m]
start-up time t=10s
start-up time t=20s
start-up time t=30s
start-up time t=40s
0 5 10 15 20 25 30 35 40
0
100
200
300
400
500
600
700
800
Tem
per
ature
[oC
]
Time [s]
start-up time t=10s
start-up time t=20s
start-up time t=30s
start-up time t=40s
Figure 14. The radial temperatures of the
steel disc at the end of start-up
Figure 15. The highest temperature time
history plot of the steel disc
0 5 10 15 20 25 30 35 4030
40
50
60
70
80
90
Tem
per
ature
[oC
]
Time [s]
start-up time t=10s
start-up time t=20s
start-up time t=30s
start-up time t=40s
Figure 16. The highest temperature time history plot of the friction disc
Transient temperature of friction pairs under different start-up times
Figure 14 illustrates the radial temperatures of the steel disc at the end of start-up under different
start-up times. The temperature increases and that the radial temperature gradient also increases
gradually as the start-up time increases. This agrees with Eq. (10), where the heat flux is proportional
10
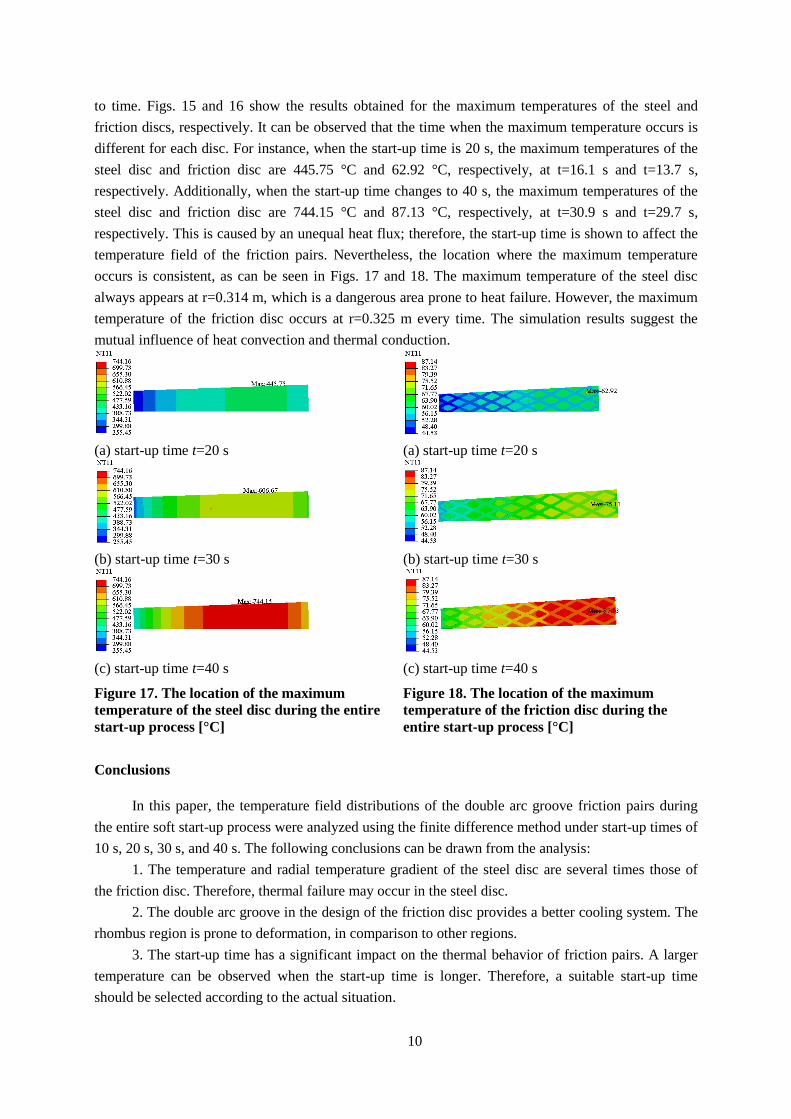
to time. Figs. 15 and 16 show the results obtained for the maximum temperatures of the steel and
friction discs, respectively. It can be observed that the time when the maximum temperature occurs is
different for each disc. For instance, when the start-up time is 20 s, the maximum temperatures of the
steel disc and friction disc are 445.75 °C and 62.92 °C, respectively, at t=16.1 s and t=13.7 s,
respectively. Additionally, when the start-up time changes to 40 s, the maximum temperatures of the
steel disc and friction disc are 744.15 °C and 87.13 °C, respectively, at t=30.9 s and t=29.7 s,
respectively. This is caused by an unequal heat flux; therefore, the start-up time is shown to affect the
temperature field of the friction pairs. Nevertheless, the location where the maximum temperature
occurs is consistent, as can be seen in Figs. 17 and 18. The maximum temperature of the steel disc
always appears at r=0.314 m, which is a dangerous area prone to heat failure. However, the maximum
temperature of the friction disc occurs at r=0.325 m every time. The simulation results suggest the
mutual influence of heat convection and thermal conduction.
(a) start-up time t=20 s (a) start-up time t=20 s
(b) start-up time t=30 s (b) start-up time t=30 s
(c) start-up time t=40 s (c) start-up time t=40 s
Figure 17. The location of the maximum
temperature of the steel disc during the entire
start-up process [°C]
Figure 18. The location of the maximum
temperature of the friction disc during the
entire start-up process [°C]
Conclusions
In this paper, the temperature field distributions of the double arc groove friction pairs during
the entire soft start-up process were analyzed using the finite difference method under start-up times of
10 s, 20 s, 30 s, and 40 s. The following conclusions can be drawn from the analysis:
1. The temperature and radial temperature gradient of the steel disc are several times those of
the friction disc. Therefore, thermal failure may occur in the steel disc.
2. The double arc groove in the design of the friction disc provides a better cooling system. The
rhombus region is prone to deformation, in comparison to other regions.
3. The start-up time has a significant impact on the thermal behavior of friction pairs. A larger
temperature can be observed when the start-up time is longer. Therefore, a suitable start-up time
should be selected according to the actual situation.
11
4. Regardless of how long the start-up time is, the location of the maximum temperature
remains unchanged for the steel disc and friction disc, respectively. More attention should be given to
these areas.
The calculation results were in good agreement with previous results reported in the literature.
This provides a reference and theoretical basis for subsequent thermal stress analysis. Furthermore, it
would be interesting to validate the numerical results experimentally.
Acknowledgements
The authors would like to acknowledge the support of the Young Science Research Foundation
of Shanxi Province (201601D021066).
Nomenclature
A – thermal conductivity area, [m2] Ta – ambient oil temperature, [°C]
c – specific heat capacity, [Jkg-1°C -1] {T} – nodal temperature vector, [–]
[C] – heat capacity matrix, [–] {T’} – time derivative of node temperature
vector, [–]
F – normal pressure, [N] z – thickness, [m]
h – oil film thickness, [m] Greek symbols
k – thermal conductivity, [Wm-1°C -1] – convection coefficient [Wm-2°C -1]
[K] – heat conductivity matrix, [–] – feature parameter of planetary array, [–]
nj – speed of output shaft, [rmin-1] – distribution coefficient of heat flux, [–]
nf – speed of friction disc, [rmin-1] – friction coefficient, [–]
q – heat flux, [Wm-2] – density, [kgm-3]
{Q} – node heat flux vector, [–] – relative angular velocity, [rads-1]
r – radius, [m] Subscripts
t – time, [s] c – core disc
T – temperature, [°C] f – friction lining
T0 – initial temperature, [°C] s – steel disc
References
[1] Wei, C. G., Zhao, J. X., Technology of Hydro-Viscous Drive (in Chinese), National Defence
Industry Press, Beijing, China, 1996
[2] Yevtushenko, A. A., et al., Numerical Analysis of Thermal Stresses in Disk Brakes and Clutches
(a Review), Numerical Heat Transfer, Part A, Applications, 67 (2015), 2, pp. 170-188
[3] Zagrodzki, P., Truncone, S. A., Generation of Hot Spots in a Wet Multidisk Clutch During Short-
term Engagement, Wear, 254 (2003), 3, pp. 474-491
[4] Marklund, P., Larsson, R., Wet Clutch Friction Characteristics Obtained from Simplified Pin on
Disk Test, Tribology International, 41 (2008), 9-10, pp. 824-830
[5] Marklund, P., et al., Thermal Influence on Torque Transfer of Wet Clutches in Limited Slip
Differential Applications, Tribology International, 40 (2007), 5, pp. 876-884
12
[6] Hu, J. B., et al., A Uniform Cross-Speed Model of End-face Seal Ring with Spiral Grooves for
Wet Clutch, Tribology International, 62 (2013), 6, pp. 8-17
[7] Ji, Z. L., et al., Elastoplastic Finite Element Analysis for Wet Multidisc Brake During Lasting
Braking, Thermal Science, 19 (2015), 6, pp. 2205-2217
[8] Adamowicz, A., Grzes, P., Analysis of Disc Brake Temperature Distribution During Single
Braking under Non-Axisymmetric Load, Applied Thermal Engineering, 31 (2011), 6-7, pp. 1003-
1012
[9] Adamowicz, A., Grzes, P., Influence of Convective Cooling on a Disc Brake Temperature
Distribution During Repetitive Braking, Applied Thermal Engineering, 31 (2011), 14-15, pp.
2177-2185
[10] Adamowicz, A., Grzes, P., Three-Dimensional FE Model for Calculation of Temperature of a
Thermosensitive Disc, Applied Thermal Engineering, 50 (2013), 1, pp. 572-581
[11] Cui, H. W., Research on the Torque Characteristic of Friction Pairs in Hydro-Viscous Clutch (in
Chinese), Ph. D. thesis, Beijing Institute of Technology, Beijing, China, 2014
[12] Cui, H. W., et al., Study on Fluid Torque by Shear Stress of Double Arc Oil Groove Friction
Pairs in Hydro-Viscous Drive (in Chinese), Journal of Chongqing University, 39 (2016), 5, pp. 1-9
[13] Xie, F. W., et al., Numerical Simulation Research on Effect of Oil Groove Forms on Thermal
Behavior of Friction Pair in Hydro-Viscous Clutch, Industrial Lubrication and Tribology, 68
(2016), 2, pp. 287-298
[14] Cui, J. Z., et al., Numerical Investigation on Transient Thermal Behavior of Multidisk Friction
Pairs in Hydro-Viscous Drive, Applied Thermal Engineering, 67 (2014), 1, pp. 409-422
[15] Yevtushenko, A. A., et al., Three-Dimensional FE Model for the Calculation of Temperature of a
Disc Brake at Temperature-Dependent Coefficients of Friction, International Communications in
Heat and Mass Transfer, 42 (2013), pp. 18-24
[16] Belhocine, A., Numerical Investigation of a Three-Dimensional Disc-Pad Model with and
without Thermal Effects, Thermal Science, 19 (2015), 6, pp. 2195-2204
[17] Belhocine, A., FE Prediction of Thermal Performance and Stresses in an Automotive Disc Brake
System, International Journal of Advanced Manufacturing Technology, 89 (2016), 9, pp. 3563-
3578
[18] Belhocine, A., Wan Omar, W.Z., Three-Dimensional Finite Element Modeling and Analysis of
the Mechanical Behavior of Dry Contact Slipping Between the Disc and the Brake Pads,
International Journal of Advanced Manufacturing Technology, 88 (2016), 1, pp. 1035-1051
[19] Belhocine, A., Bouchetara, M., Thermo-Mechanical Behavior of Dry Contacts in Disc Brake
Rotor with a Grey Cast Iron Composition, Thermal Science, 17 (2013), 2, pp. 599-609
[20] Adamowicz, A., Axisymmetric FE Model to Analysis of Thermal Stresses in a Brake Disk,
Journal of Theoretical and Applied Mechanics, 53 (2015), 2, pp. 357-370
[21] Hsu, T., The Finite Element Method in Thermomechanics, Allen & Unwin, Boston, 1986