thermal audit of power plant
TRANSCRIPT
Available online at www.worldscientificnews.com
WSN 21 (2015) 68-82 EISSN 2392-2192
Thermal Audit of Power Plant
Sourabh Das1,*, Mainak Mukherjee1, Surajit Mondal2, Amit Kumar Chowdhury3 1M.Tech Energy Systems, University of Petroleum & Energy Studies, Dehradun, India
2Research Scholar, University of Petroleum & Energy Studies, Dehradun, India
3M.E. Electrical Engineering Dept., IIEST, Shibpur, India
*E-mail address: [email protected]
ABSTRACT
Energy audit is a technique developed to reduce unnecessary usage of energy, control and also
streamline processes leading to energy efficiency. Energy audit and its impact on a daily basis is high
and hence is of good significance. Energy Conservation over the years has been a key in terms of
saving excessive bills and building up unnecessary usage both domestically and industrially. The
world is not completely energy efficient yet, it should be a made sure that the process to ensure
optimum usage and saving wherever possible. In this paper we shall discuss in brief about energy
audit in a thermal power plant, techniques and ways data are obtained. India’s strive for complete
energizing is yet on the verge of completion, need for saving unused energy and also recovering waste
energy can be beneficial in developing an energy content environment. The energy audit carried out in
thermal power plant gives a presentation of the data and corners of collecting data.
Keyword: Energy Audit; Thermal Power Plant; Boiler Efficiency; Energy Conservation; Economizer;
Turbine and auxiliaries; Cooling Tower

World Scientific News 21 (2015) 68-82
-69-
INTRODUCTION
An energy audit is a study of a plant or facility to determine how and where energy is
used and to identify methods for energy savings. There is now a universal recognition of the
fact that new technologies and much greater use of some that already exist provide the most
hopeful prospects for the future. The opportunities lie in the use of existing renewable energy
technologies, greater efforts at energy efficiency and the dissemination of these technologies
and options. This energy audit of 2 X 25MW Power Plant was carried out. This report is just
one step, a mere mile marker towards our destination of achieving energy efficiency and I
would like to emphasis that an energy audit is a continuous process. We have compiled a list
of possible actions to conserve and efficiently utilize our scarce resources and identified their
savings potential. The next step would be to prioritize their implementation. I look forward
with optimism that the institute authorities, staff shall ensure the maximum execution of the
recommendations and the success of this work.
Objectives and purpose of Audit
Considering the vast potential of energy savings and issue of energy efficiency in
various sectors of industries, the government of India enacted the Energy Conservation Act,
2001. The Act provides for a legal framework, institutional arrangement and a regulatory
mechanism at the central and state level to embark upon energy efficiency drive in country.
Having been declared designated customers under the EC Act, it is obligatory on the part of
power station to get energy audit carried out periodically.
Methodology and Approach
The field measurements were carried out with calibrated instruments. The required
parameter for analysis of different utility was measured and the power consumption was
measured. For analysis of the collected data the standard formulas as per PTC standards and
CEA guidelines for Energy Auditing of power plants were used. The formulas used for the
calculation are given below.
Description of the Plant
Jindal Steel and Power limited (JSPL) is one of India’s major steel producer with a
significant presence in sectors like Mining, power generation and Infrastructure. JSPL has a
state-of-the-art steel making plant at Raigarh, Chhattisgarh which can produce up to 3 Million
TPA. Equipped with modern machinery, the plant boasts of world-class production facilities.
The facility has installed 4 numbers of WHRB (waste heat recovery boiler) of capacity
57 TPH & 75 Kg/ 495+/- °C for recovery of sensible heat from the waste gas from 4nos of
TDP (.72 million TPA) DRI sponge iron kiln. Steam produced from the waste heat boilers is
used to run the two steam turbine generators sets of capacity 25 MW each for self-generation.
The temperature of the flue gas from kiln before WHRB inlet is increased by supplying
Forced Draught air which burns the CO in the gas. Each kiln is connected to WHRB which
produces steam by recovering heat from the flue gas coming out of ABC from each DRI
sponge iron kiln.

World Scientific News 21 (2015) 68-82
-70-
Process flow Diagram
Figure 1. Process Flow Diagram.
Power plant (2 X 25 MW TG)
There are four sponge iron kilns of capacity 500 TPD each. Each kiln is connected to
WHRB which produces steam by recovering heat from the flue gases coming out of ABC of
each DRI sponge iron kiln and this steam from each WHRB is combined in a header. Some
quantity of the steam is sent to SMS and plate mill the remaining steam is used to generate
electricity in two 25 MW Turbine Generator. The facility has installed 4 numbers of WHRB
of capacity 57 TPH and 75 Kg/ 495 +/- °C for recovery of sensible heat from the waste gas
from DRI sponge iron kiln. All the 4 WHRB supply steam to power plant unit -2 phase #3.
Steam produced from the waste heat boilers is used to run the two steam turbine generator
sets of capacity 25MW each for self-generation.
Waste Heat Recovery Boiler (WHRB)
Figure 2. Flue gas path of WHRB.
World Scientific News 21 (2015) 68-82
-71-
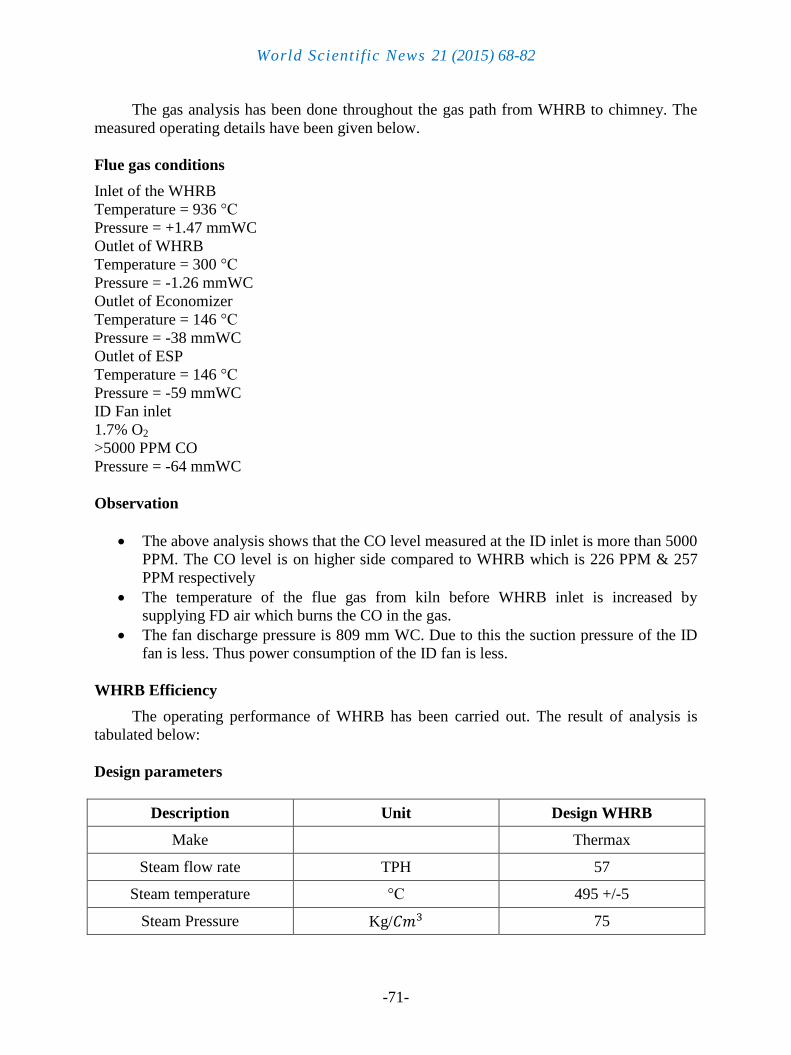
The gas analysis has been done throughout the gas path from WHRB to chimney. The
measured operating details have been given below.
Flue gas conditions
Inlet of the WHRB
Temperature = 936 °C
Pressure = +1.47 mmWC
Outlet of WHRB
Temperature = 300 °C
Pressure = -1.26 mmWC
Outlet of Economizer
Temperature = 146 °C
Pressure = -38 mmWC
Outlet of ESP
Temperature = 146 °C
Pressure = -59 mmWC
ID Fan inlet
1.7% O2
>5000 PPM CO
Pressure = -64 mmWC
Observation
The above analysis shows that the CO level measured at the ID inlet is more than 5000
PPM. The CO level is on higher side compared to WHRB which is 226 PPM & 257
PPM respectively
The temperature of the flue gas from kiln before WHRB inlet is increased by
supplying FD air which burns the CO in the gas.
The fan discharge pressure is 809 mm WC. Due to this the suction pressure of the ID
fan is less. Thus power consumption of the ID fan is less.
WHRB Efficiency
The operating performance of WHRB has been carried out. The result of analysis is
tabulated below:
Design parameters
Description Unit Design WHRB
Make Thermax
Steam flow rate TPH 57
Steam temperature °C 495 +/-5
Steam Pressure Kg/ 75
World Scientific News 21 (2015) 68-82
-72-
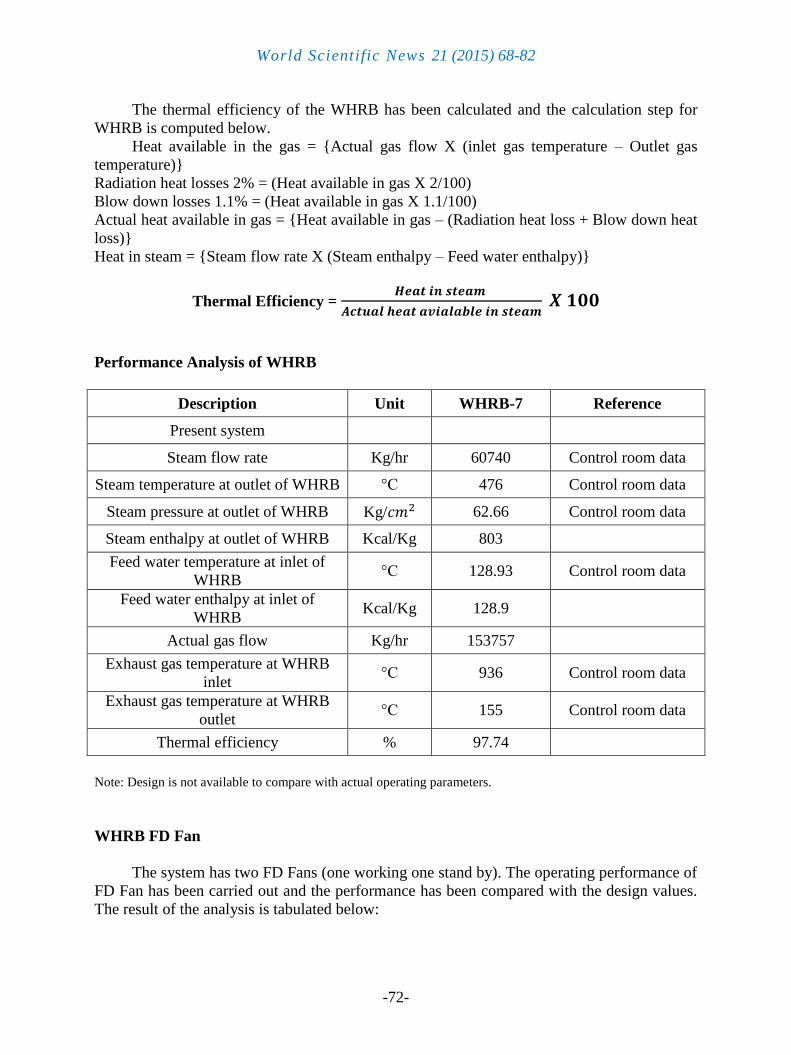
The thermal efficiency of the WHRB has been calculated and the calculation step for
WHRB is computed below.
Heat available in the gas = {Actual gas flow X (inlet gas temperature – Outlet gas
temperature)}
Radiation heat losses 2% = (Heat available in gas X 2/100)
Blow down losses 1.1% = (Heat available in gas X 1.1/100)
Actual heat available in gas = {Heat available in gas – (Radiation heat loss + Blow down heat
loss)}
Heat in steam = {Steam flow rate X (Steam enthalpy – Feed water enthalpy)}
Thermal Efficiency =
Performance Analysis of WHRB
Description Unit WHRB-7 Reference
Present system
Steam flow rate Kg/hr 60740 Control room data
Steam temperature at outlet of WHRB °C 476 Control room data
Steam pressure at outlet of WHRB Kg/ 62.66 Control room data
Steam enthalpy at outlet of WHRB Kcal/Kg 803
Feed water temperature at inlet of
WHRB °C 128.93 Control room data
Feed water enthalpy at inlet of
WHRB Kcal/Kg 128.9
Actual gas flow Kg/hr 153757
Exhaust gas temperature at WHRB
inlet °C 936 Control room data
Exhaust gas temperature at WHRB
outlet °C 155 Control room data
Thermal efficiency % 97.74
Note: Design is not available to compare with actual operating parameters.
WHRB FD Fan
The system has two FD Fans (one working one stand by). The operating performance of
FD Fan has been carried out and the performance has been compared with the design values.
The result of the analysis is tabulated below:

World Scientific News 21 (2015) 68-82
-73-
FD Fan design details
Description Unit FD fan design
Fan
Make Flakewoods-Flakt (India)
No of Fans No’s 2
Rated flow N /hr 25000
Rated static pressure mmWC 903
Motor
Motor voltage V 415
Motor reading kW 90
FD Fan Performance Analysis
Description Units Design FD Fan-7A Reference
Suction side
Static pressure ( Before IGV) mmWC -114 Measured
Discharge side
Static Pressure mmWC 809 Measured
Temperature °C 28
Total Static Pressure head mmWC 903 923
Area 0.196 Measured
Density of air 1.173
Velocity m/s 31.68 Measured
Air flow rate 6.22
22382
25000 20077
TPH 26.2
Air kW kW 56.3
Input Motor Power 80.8 Measured
Rated motor power kW 90
Combined overall efficiency % 69.63

World Scientific News 21 (2015) 68-82
-74-
Motor Efficiency % 90
Shaft power kW 72.72
Fan static efficiency % 77.36
% loading of motor % 81
Specific energy consumption kW/TPH 3.078
Observation
The fan efficiency is 77.36%. Thus the performance fan is satisfactory.
The suction pressure of the FD fan is -114mmWC which is in higher side due to the
silencer. Increasing the size of the duct will provide a smooth profile for gas flow and
thus the pressure drop in the system will reduce.
This will reduce the head loss and power consumption. The cost benefit analysis has
been given in the energy conservation measures.
WHRB ID Fan
The system has two ID fans (One HT motor & other LT motor supply). VFD has been
installed in the LT motor and this fan is in operation and the other fan is kept as standby. The
operating parameters of ID fans were measured and the performance has been compared with
the design values. The result of analysis are tabulated below.
ID Fan design details
Description Unit ID fan Design ID fan Design
Fan
Make Flaktwoods-Flakt
(India)
Flaktwoods-Flakt
(India)
No. of fans No’s 1 1
Rated flow 180000 180000
Rated static pressure mmWC 260 260
Fan speed Rpm 980 980
Motor
Motor voltage V 6600 415
Motor rating kW 300 275

World Scientific News 21 (2015) 68-82
-75-
ID fan performance analysis
Description Units Design ID Fan-1B Reference
Suction side
Static pressure mmWC 260 -63 Measured
Dynamic pressure mmWC 8.6 Measured
Discharge side
Static Pressure mmWC 10
Temperature °C 146
Total Static Pressure head mmWC 73
Area 3.799
Velocity m/s 14.01
Air flow rate 53.23
191636
Air kW kW 38.1
Input Motor Power 75.9 Measured
Input power (considering VFD
loss 5%) kW 72.105
Rated motor power kW 275
Combined overall efficiency % 52.84
Motor Efficiency % 90
Shaft power kW 64.89
Fan static efficiency % 58.71
% loading of motor % 24
Specific energy consumption kW/TPH 0.447
Observation
The fan efficiency is 58.71% which is on lower side. Impeller of ID fan has to be
checked and possibility of more clearance between fan housing and impeller.
Economizer
During the study, the operating temperature along the flue gas path has been taken from
DCS. The effectiveness of economizer has been accessed by collecting the inlet and outlet
temperature of both feed water and flue gas from the control room.

World Scientific News 21 (2015) 68-82
-76-
The effectiveness (gas side efficiency) of the economizer is calculated by the following
equation.
Effectiveness (gas side) =
where,
= Temperature of the flue gas at the inlet of the Economizer (°C)
= Temperature of the flue gas at the outlet of the Economiser (°C)
= Temperature of the feed water at the inlet of the Economiser (°C)
Effectiveness of economizer
Description Units
500 TPD
DRI
KILN #7
500 TPD
DRI
KILN #8
500 TPD
DRI
KILN #9
500 TPD
DRI
KILN #10
Flue gas inlet temperature °C 300 303 306 302
Flue gas outlet temperature °C 155 151 159 161
Feed water inlet temperature °C 128.93 128 128.85 128.4
Feed water outlet
temperature °C 218.72 216.64 221.69 219.09
Temperature difference of
water °C 89.8 89 93 91
Effectiveness % 84.8 86.9 83 81.2
Observation
The design parameters are not available.
The effectiveness of the economizer is above 80% which is satisfactory.
Power plant Energy consumption
The gross generation of TG#1 & TG#2 are 25.5 MW & 25.56 MW respectively. The
power consumption of the equipment has been measured and the breakup is computed.
Auxiliary energy consumption
Description Power Breakup
kW %
Boiler feed pump 1189.10 27.61
Cooling water pump 1189.20 27.61
Induced draught 307.70 7.14

World Scientific News 21 (2015) 68-82
-77-
Forced draught 346.40 8.04
Condensate extraction pump 127.00 2.95
ACW 128.70 2.99
AHP 524.80 12.19
Others 493.70 11.46
Total 4306.60 100
Description Power Breakup
MW %
Net Generation 46.75 91.57
Auxiliary consumption 4.31 8.43
Total 51.06 100
28%
28% 11%
12%
3% 3%
8% 7%
Auxillary consumption break up PP-2
CWP BFP OTHERS AHP ACW CEP FD ID

World Scientific News 21 (2015) 68-82
-78-
Turbine and Auxiliaries
Cylinder Turbine Efficiency
A detailed analysis of enthalpy drop efficiency and overall turbine heat rate has been
computed with the following details
Flow, pressure and temperature of main steam
Feed water flow, pressure and temperature
Power output of the generator
A comprehensive analysis has been carried out to derive the operating cylinder
efficiencies (Enthalpy drop efficiency) with the measured parameters
=
where:
= Enthalpy drop efficiency, %
= Steam enthalpy at throttle pressure and temperature, Kcal/Kg
= Steam enthalpy at turbine exhust pressure and temperature, Kcal/Kg
= Steam enthalpy at throttle pressure and throttle enthalpy, Kcal/Kg
92%
8%
Net generation Vs Auxillary power consumption
Net generation Auxillary consumption

World Scientific News 21 (2015) 68-82
-79-
Turbine cylinder efficiency
TG
Cylinder
#1
TG
Cylinder
#2
Description Units Inlet Exhaust Inlet Exhaust
Steam pressure Kg/ (a) 66.29 0.110 66.06 0.090
Bar(a) 65.01 0.108 64.78 0.088
Steam temperature °C 485.66 50.24 482.00 50.40
Actual enthalpy drop kJ/kg 3382.72 2592.2 3374.15 2593.07
Isentropic enthalpy kJ/kg 2159.73 2133.3
Used enthalpy kJ/kg 790.52 781.08
Available energy kJ/kg 1222.99 1240.85
Enthalpy drop efficiency % 64.64 62.95
Entropy 6.79 6.784
Observation
Design data is not available to compare with the actual.
However the cylinder efficiency of this turbine is on lower side. The common cause of
cylinder efficiency deterioration includes
1. Damage to tip seals and inter stage glands.
2. Deposition on blades.
3. Increased roughness on the blade surface.
4. This is due to high seal clearance and silica deposition.
Heat Rate Analysis
A comprehensive study has been carried out to estimate the turbine heat rate as given
below. A detailed analysis of turbine heat rate has been carried out by measuring the
following parameters.
Flow, pressure and temperature of the main steam
Feed water flow, pressure and temperature
Power output of generator
Turbine heat rate
Description Unit TG 1 TG 2 Reference
Avg. Unit load MW 25.56 25.5 Control room data
Main steam

World Scientific News 21 (2015) 68-82
-80-
flow
Flow TPH 101 100.4
Temperature °C 485.66 482 Control room data
Pressure Bar 65.01 66.1 Control room data
Enthalpy kJ/kg 3382.72 3374.15
Feed water
Temperature °C 125.7 128 Control room data
Flow TPH 101 100.4 Measured
Enthalpy kJ/kg 528 537.85
Turbine heat
rate (At 0%
make)
kCal/kWh 2694.3 2667.2
Observation
The heat rate of TG2 is lower than TG1. According to the PG test report of PP-
2 Phase#3, the heat rate is 2602kCal/kWh.
Design heat rate at 0% make up is 2619.27 kCal/kWh.
Design heat rate at 3% make up is 2619.94 kCal/kWh.
COOLING TOWER
The heat in condenser cooling water of TG-1(25 MW) & TG-2(25 MW) is rejected to
the atmosphere by the cooling tower. Cooling tower operating parameters have been
measured on 13.11.13 at 11:00 am to analyze the performance of cooling tower. The result are
as follows
Overall performance analysis of cooling water
Cell
Number Design Cell1 Cell1 Cell1 Cell1
Performanc
e
AMBIENT
DBT °C 25.1 Measured
Measured
WBT °C 16.1
Enthalpy KJ/Kg 44.89
Enthalpy KCal/g 10.72
DBT °C 33.1 33.40 35.10 33.80 Measured

World Scientific News 21 (2015) 68-82
-81-
CT OUTLET
WBT °C 33 33.20 35.00 33.60 Measured
Enthalpy KJ/Kg 116.43 117.60 128.97 120.07
Enthalpy KCal/
Kg 27.80 28.08 30.80 28.67
Enthalpy Difference KCal/
Kg 17.08 17.36 20.08 17.95
Average Enthalpy
difference
KCal/k
g 18.12
Inlet water temp. °C 37.35 Measured
Outlet water temp. °C 30.97 Measured
Air Velocity m/s 5 3.60 3.20 3.50 Measured
Area M2
69.94 69.94 69.94 69.94
Air flow rate M3/hr 1258920 906422 805709 881244
Air flow rate Kg/hr 1490724 1172004 1041781 1139448
Water flow rate M3/hr 3875 3110 3254 3210
Fan Power kW 36.00 33.10 19.90 35.20 Measured
Range °C 6.38
Approach °C 14.87
Effectiveness %
30.02%
L/G ratio 2.60 2.65 3.12 2.82
L/G ratio 2.8
Sp. Power consumption
KW/La
kh
M3/hr
2.86 3.65 2.47 3.99
Evaporation loss M
3/hr 127.12
% 0.95%
OBSERVATION
The L/G ratio is in higher side.
Effectiveness of cooling tower is on lower side.
The range of cooling tower is less and approach is in higher in compare to design.
So,
Clean the fills and increase the air flow by adjusting flan blade angle which can
Improve
The cooling tower effectiveness.

World Scientific News 21 (2015) 68-82
-82-
CONCLUSIONS
Energy audit being a part of effective energy conservation technique is a methodical
method and is technologically advanced procedure. The various instruments used for auditing
and measurement devices are technically enhanced and is portable in various uses. The prior
intention for usage is easiness in use and mobility as an auditor has to travel all around in
pursuit of data collection. Summary of energy conservation measures Modify the WHRB FD
fan suction duct and then install VFD to reduce the head loss. Reduce the pressure drop in the
condensate line (TG1 & TG2), Reduce the pressure drop across FCS in feed water circuit,
Install VFD to reduce the discharge pressure of side stream Filter pump, Reduce the
temperature setting of thermostatic control of hopper heater , Adjust the lighting transformer
tap position for reduce the light voltage to save the lighting energy.
References
[1] “Energy-and exergy-based comparison of coal-fired and nuclear steam power plants”,
MA Rosen Exergy, An International Journal, 2001 – Elsevier.
[2] “Theory of the exergetic cost”, M.A. Lozano, A. Valero, Energy, 1993 – Elsevier.
[3] “Low-grade heat conversion into power using organic Rankine cycles–a review of
various applications” Bertrand F. Tchanche, Gr. Lambrinos, A. Frangoudakis, G.
Papadakis, Renewable and Sustainable Energy Reviews 15 (2011) 3963-3979.
[4] “Energy audit case studies steam systems”, MS Bhatt - Applied Thermal Engineering,
2000 – Elsevier.
[5] “Research on the environmental cost of power plants “, T. Fang, C. Li, L. Zhang,
Electric Power, 2005.
[6] Dong-Xiao Gu, Chang-Yong Liang, Isabelle Bichindaritz, Chun-Rong Zuo, Jun Wang,
“A case-based knowledge system for safety evaluation decision making of thermal
power plants”, Knowledge-Based Systems 26 (2012) 185-195.
[7] “Study on Energy Audit Methodology for Thermal Power Plant”, Shi Qi-Guang -
Energy Technology and Economics, 2010 - en.cnki.com.cn
[8] Bureau of Energy Efficiency (BEE), India,: http://www.bee-india.nic.in
( Received 30 August 2015; accepted 17 September 2015 )