thermal and flow analysis of friction surface cladding ... · temperature of approximately 330 ℃...
TRANSCRIPT

Thermal and Flow Analysis of Friction Surface Cladding with Varying Clad Layer
Thickness
S. Liu, T.C. Bor, H.J.M. Geijselaers, R. Akkerman
University of Twente
Tel: (+31)534892569; Email: [email protected]
Abstract
Friction Surfacing Cladding (FSC) is a recently developed, solid-state process to
deposit thin metallic clad layers on a substrate. The process employs a hollow
rotating tool containing the clad material. The tool is moved along a predefined
trajectory at a given distance above the substrate surface while the clad material is
pressed out and deposited on the substrate surface beneath the tool.
In this study the deposition of a thin layer of AA1050 on an AA2024-T351 substrate
was investigated. The study concentrated on the effect of the clad layer thickness
on the clad layer profile, the thermal distributions in the FSC tool and the substrate
and the generated pressure below the tool. Four cladding experiments were
carried out with the nominal layer thickness increasing from 0.2 𝑚𝑚𝑚𝑚 to 0.8 𝑚𝑚𝑚𝑚 with
an increment of 0.2 𝑚𝑚𝑚𝑚. In each experiment the associated supply rate of the clad
material and the tool rotation rate were adjusted to obtain a relatively low process

temperature of approximately 330 ℃ that was high enough to manufacture defect
free clad layers.
The experimental results showed that the manufacturing of thicker clad layers
required higher tool rotation rates: from 300 𝑟𝑟𝑟𝑟𝑚𝑚 at 0.2 𝑚𝑚𝑚𝑚 to 450 𝑟𝑟𝑟𝑟𝑚𝑚 at 0.6 𝑚𝑚𝑚𝑚
and 0.8 𝑚𝑚𝑚𝑚, but the resulting process induced normal pressure on the substrate
decreased from 16.4 𝑀𝑀𝑀𝑀𝑀𝑀 to 9.1 𝑀𝑀𝑀𝑀𝑀𝑀. The substrate hardness after the cladding
process was hardly affected for all cases.
The effect of the clad layer thickness and the tool rotation rate was studied
numerically employing a 2D axisymmetric thermal and flow coupled finite element
model. The simulation results confirmed the observed trends in the tool rotation
rate and the process induced pressure as a function of the nominal layer thickness.
Keywords: friction stir welding, extrusion, thermal analysis, heat generation,
precipitation
1. Introduction
Friction surfacing cladding (FSC) is a recently developed solid-state cladding
process[1]. It can be used for modification of the mechanical and/or corrosive
properties of structural materials at the surface. It uses a cylindrical, rotating
cladding tool with a central opening containing a clad rod. The tool is held at a
predefined distance above the substrate to control the layer thickness. Like friction
surfacing[2], the clad material is supplied downwards by a speed-controlled

hydraulic system and it is deposited on the substrate beneath the tool, as shown in
Figure 1. The strong plastic deformation of the clad material and the occurring
friction of the clad material with the FSC tool and the substrate contribute to the
heat generation which softens the clad material and enables the deposition
process.
The FSC process comprises two phases: a preheating phase and a cladding
phase. In the preheating phase, the clad material is pressed outwards from the
rotating tool and frictional heating occurs when it contacts the substrate. When the
tool temperature is sufficiently high, the cladding phase starts where the rotating
tool translates over the substrate surface while the clad layer is continuously being
deposited. In this way clad layers with a fairly uniform thickness can be deposited
on a substrate. The presence of the stiff tool enhances the lateral spreading of the
clad material and supports the bonding of the clad layer to the substrate[1].
The heat generation plays a significant role in friction surface cladding. The heat
origin in the cladding process is analogous to that in friction stir welding where this
topic has been well studied[3]. For instance, an analytical model has been
developed by Schmidt[4] and that has been employed widely. Based on an
introduction of a contact state variable, the model describes that the frictional heat
generation rate at the contact interface is proportional to the normal pressure and
the coefficient of friction in the case of slipping condition. When sticking occurs, the
heat generation rate is linearly related to the shear strength of the material being

welded. This analytical heat generation model can in principle also be applied to
friction surface cladding.
In this study, the influence of the nominal layer thickness on the cladding process
has been studied for the case of the deposition of relatively soft AA1050 onto an
AA2024-T351 aerospace alloy. The deposition appearance, the temperature fields,
the generated normal forces and the substrate hardness distributions have been
analyzed. Assuming a full sticking contact condition, a 2D thermal and flow coupled
finite element model provides further understanding of the influence of the
deposition process variables.
2. Experimental procedure and materials
The experimental FSC configuration is depicted schematically in Figure 1. The
FSC tool contains a central opening (Ø 10 mm, length 40 mm), a slightly profiled
bottom (Ø 30 mm) and a speed-controlled hydraulic system that presses the clad
rod outwards[1]. It is fixed at a certain height above the substrate (300 𝑚𝑚𝑚𝑚 ×
141 𝑚𝑚𝑚𝑚 × 4 𝑚𝑚𝑚𝑚) to control the clad layer thickness. A backing plate provides
support to the substrate.
During the cladding process both the temperature in the substrate and the FSC
tool were measured, along with the forces and material supply rates. Five K-type
thermocouples (𝑇𝑇𝑇𝑇𝑇𝑇, 𝑇𝑇 = 1, 2, 3, 4, 5) were placed in the middle thickness of the
substrate exactly beneath the cladding center line, as shown in Figure 1(b). An
additional thermocouple (𝑇𝑇𝑇𝑇𝑇𝑇) was placed in the tool 2 𝑚𝑚𝑚𝑚 above the tool bottom

and 7 𝑚𝑚𝑚𝑚 from the tool center line. The normal force (𝐹𝐹𝑛𝑛) generated during the
FSC process was recorded by load cells. In addition, the supply rates of the
cladding material (𝑣𝑣𝑓𝑓) were collected in all experiments.
Figure 1 a) Principle of the FSC process, b) FSC experimental configuration with
locations of substrate thermocouples.
Four experiments were carried out with the nominal clad layer thickness equal to
0.2, 0.4, 0.6 and 0.8 𝑚𝑚𝑚𝑚. The process parameters are listed in Table 1. In all cases
the tool translation speed 𝑣𝑣𝑡𝑡𝑡𝑡 was 60 𝑚𝑚𝑚𝑚/𝑚𝑚𝑇𝑇𝑚𝑚 in the cladding phase, and the tool
tilt angle 𝜃𝜃 was equal to −1°. In each experiment, the tool rotation rate and the
supply rate of the clad material were adjusted to build up defect-free clad layers
with similar widths, but different thicknesses. In experiment 1, 2 and 3, the supply
rate remained constant during the cladding phase. In case of experiment 4, the
supply rate was gradually increased to provide enough material and to obtain a
sufficiently high tool temperature of approximately 330 ℃. Preliminary experiments
indicated that at this temperature the FSC process performs well with the current
materials and setup. In addition, Table 1 provides the dimensions of the produced
layers. The local width and thickness of the analyzed samples near 𝑇𝑇𝑇𝑇3 are
indicated by 𝑊𝑊3 and 𝐻𝐻3, respectively; 𝐹𝐹𝑛𝑛3 is the local average normal force near
this thermocouple, and 𝑀𝑀3 the local average pressure, 𝑀𝑀3 = 4𝐹𝐹𝑛𝑛𝜋𝜋𝑊𝑊3
2; 𝑊𝑊𝑎𝑎𝑎𝑎𝑎𝑎 is the
average layer width along the entire clad layer.
The substrates and the consumable clad rods used in these experiments were
rolled aluminum alloy plates AA2024-T351 and commercially pure aluminum
AA1050, respectively.
3. Numerical model description
3.1 Flow model
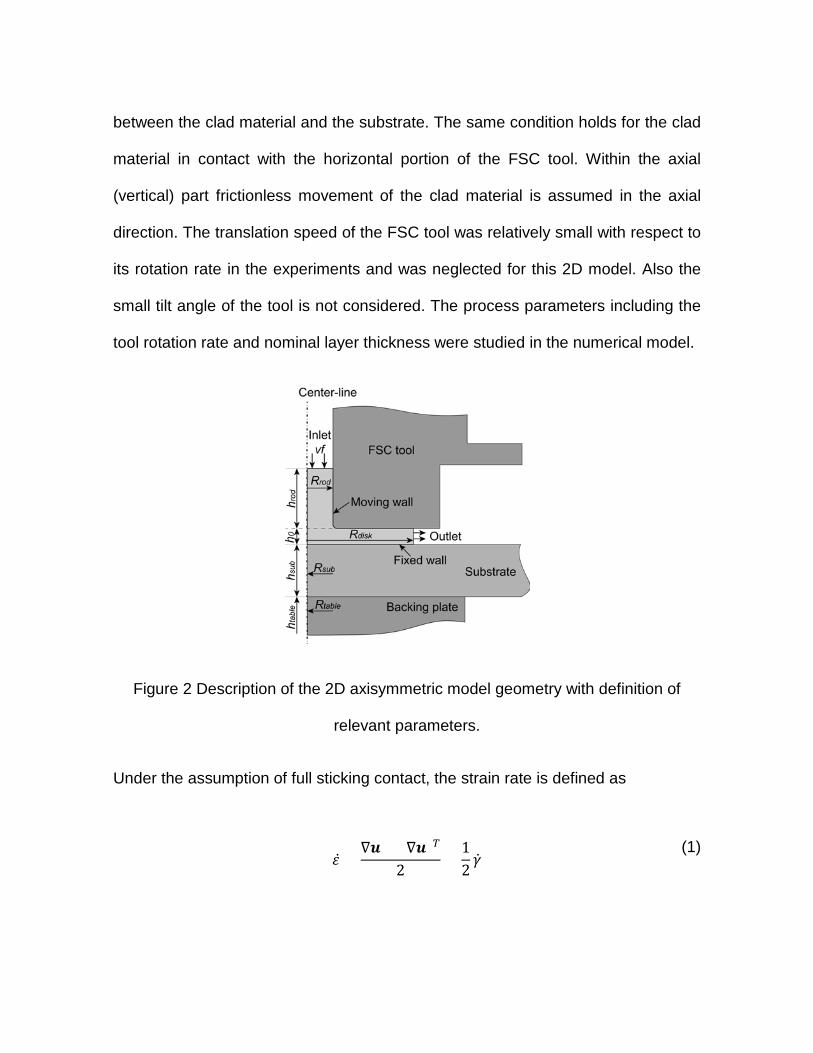
A 2D axisymmetric thermal and flow coupled finite element model was established
in COMSOL employing the Eulerian framework. The clad material flows into the
tool opening at the top surface with a speed 𝑣𝑣𝑓𝑓 and flows out of the narrow space
between the tool bottom and the substrate at a distance 𝑟𝑟 = 𝑅𝑅𝑑𝑑𝑑𝑑𝑑𝑑𝑑𝑑, with 𝑅𝑅𝑑𝑑𝑑𝑑𝑑𝑑𝑑𝑑 the
radius of the clad disk. Here, the pressure drops to zero. The thickness and width
of the clad layer near 𝑇𝑇𝑇𝑇3 determine the tool-substrate distance and the outlet
position of the clad material in the 2D model. The clad rod length used in the model
is equal to 10 𝑚𝑚𝑚𝑚, which is approximately the rod length at the location of 𝑇𝑇𝑇𝑇3
during the experiment. A fixed wall condition (no slip) was applied at the interface
between the clad material and the substrate. The same condition holds for the clad
material in contact with the horizontal portion of the FSC tool. Within the axial
(vertical) part frictionless movement of the clad material is assumed in the axial
direction. The translation speed of the FSC tool was relatively small with respect to
its rotation rate in the experiments and was neglected for this 2D model. Also the
small tilt angle of the tool is not considered. The process parameters including the
tool rotation rate and nominal layer thickness were studied in the numerical model.
Figure 2 Description of the 2D axisymmetric model geometry with definition of
relevant parameters.
Under the assumption of full sticking contact, the strain rate is defined as
𝜀𝜀̇ =
∇𝒖𝒖 + (∇𝒖𝒖)𝑇𝑇
2=
12�̇�𝛾
(1)

and the equivalent strain rate is
∅̇𝑒𝑒𝑒𝑒𝑎𝑎 = �2
3𝜀𝜀̇: 𝜀𝜀̇ .
(2)
Therefore, the relation between the equivalent strain rate and the shear rate equals
∅̇𝑒𝑒𝑒𝑒𝑎𝑎 = 1√3�̇�𝛾 . (3)
The clad material viscosity is defined as
𝜇𝜇 = 𝜎𝜎𝑒𝑒𝑒𝑒𝑒𝑒3∅̇𝑒𝑒𝑒𝑒𝑒𝑒
. (4)
According to the flow rule, plastic yielding occurs when the equivalent stress
reaches the flow stress, 𝜎𝜎𝑒𝑒𝑒𝑒𝑎𝑎 = 𝜎𝜎𝑓𝑓. Thus, the viscosity can also be described as
𝜇𝜇 = 𝜎𝜎𝑓𝑓 3∅̇𝑒𝑒𝑒𝑒𝑒𝑒
= 𝜎𝜎𝑒𝑒𝑒𝑒𝑒𝑒/√3�̇�𝛾
= 𝜏𝜏𝑚𝑚�̇�𝛾
, (5)
where 𝜏𝜏𝑚𝑚 is the shear strength of the clad material.
The flow stress of the clad material used in this study is an equation developed
based on the experimental results measured by Prasad[5]:

𝜎𝜎𝑓𝑓 = �𝜎𝜎0 + 𝑘𝑘𝑘𝑘𝑚𝑚
𝜀𝜀̇𝜀𝜀0̇� �exp (
𝑇𝑇𝑚𝑚 − 𝑇𝑇𝑇𝑇𝑚𝑚 − 𝑇𝑇𝑡𝑡
)�𝑛𝑛
sinh−1(�𝑍𝑍𝐴𝐴�𝑚𝑚
) (6)
with 𝑍𝑍 = 𝜀𝜀̇ exp �𝑄𝑄𝑅𝑅𝑇𝑇
� (7)
where 𝑄𝑄 and 𝑅𝑅 are the activation energy and the gas constant, respectively; 𝜎𝜎0 is
the flow stress at 𝜀𝜀̇ = 𝜀𝜀0̇, and 𝜀𝜀0̇ = 1𝑒𝑒 − 3 𝑠𝑠−1 is the initial strain rate. The melting
temperature of the clad material is 𝑇𝑇𝑚𝑚 and 𝑇𝑇𝑡𝑡 is the ambient temperature. Here, 𝐴𝐴,
𝑚𝑚, 𝑚𝑚 and 𝑘𝑘 are constants. The values of the relevant variables are listed in Table 2.
With these flow boundary conditions and material properties, the flow model
calculates the pressure in the clad material and the material flow velocity by solving
the continuity equation and the momentum equation[6,7].
3.2 Thermal model
Under the full sticking condition, only the viscous heat, 𝑄𝑄𝑎𝑎ℎ, dissipated in the
strongly deforming clad material contributes to the heat generation, i.e., 𝑄𝑄𝑎𝑎ℎ = 𝝉𝝉: �̇�𝝐.
Besides this heat source, both the heat conduction in the experimental setup and
the convective heat transfer to the surroundings were considered. The heat
conservation equation used was:
𝜌𝜌𝑇𝑇𝑝𝑝
𝜕𝜕𝑇𝑇𝜕𝜕𝑇𝑇
+ 𝜌𝜌𝑇𝑇𝑝𝑝𝒖𝒖 ⋅ ∇𝑇𝑇 = ∇ ⋅ (𝑘𝑘∇𝑇𝑇) + 𝑄𝑄𝑎𝑎ℎ (8)

where 𝑇𝑇𝑝𝑝, 𝑘𝑘 and 𝒖𝒖 were the specific heat capacity, the thermal conductivity and the
material flow speed vector, respectively. Both 𝑇𝑇𝑝𝑝 and 𝑘𝑘 of the substrate material
were temperature dependent and the values cited from Li[8] were used. The
thermal conductivity and heat capacity of the clad material were assumed constant
with values equal to 190 𝑊𝑊/(𝑚𝑚 ∗ 𝐾𝐾) and 900 𝐽𝐽/(𝑘𝑘𝑘𝑘 ∗ 𝐾𝐾), respectively.
The thermal boundary of the thermal and flow coupled model consists of contacting
interfaces between the cladding tool, the clad material, the substrate and the
backing plate and all exposed surfaces to the ambient. Perfect thermal contact
between the substrate and the backing plate was assumed to occur near the FSC
tool where high compressive stresses are present. Further away from the tool the
(less effective) heat transfer was described by an effective heat transfer coefficient
of 200 𝑊𝑊/(𝑚𝑚2 ∗ 𝐾𝐾), which was also applied to the upper surfaces of the tool, as
shown in Figure 2. A value of 10 𝑊𝑊/(𝑚𝑚2 ∗ 𝐾𝐾) was used at the top surface of the
substrate in contact with air.
4. Results and discussion
4.1 The appearance of the FSC samples
Defect free clad layers were successfully deposited in all experiments. The top
view of each clad specimen near 𝑇𝑇𝑇𝑇3 is shown in Figure 3(a) – (d). The red vertical
line in each image shows the positions where the specimens for hardness
measurement and microstructural observation were extracted. A clad layer with a
rather smooth top surface, a straight edge on the advancing side and a slightly

wavy edge on the retreating side was produced in experiment 1. The clad layer
fabricated in experiment 2 turned out to be similar to that in experiment 1, except
for two small notches on the advancing side. Compared with experiment 1 and 2,
experiment 3 also produced a relatively smooth layer, but with notable notches and
cladding burrs observed on the advancing and retreating side, respectively. The
sample with the largest nominal layer thickness also showed these less desirable
features and the surface roughness was also larger than for the other clad layers.
These types of dimensional variations are probably related to stick/slip phenomena
taking place during the lateral spreading of the clad material. This is a subject of
future study.

Figure 3 The left column: top view of the clad layers from 0.2 𝑚𝑚𝑚𝑚 to 0.8 𝑚𝑚𝑚𝑚. The vertical lines indicating the location of thermocouple TC3. The right column: the
corresponding transverse cross sections. (AS: advancing side; RS: retreating side).
The transverse cross sections of the extracted specimens along the red lines
depict not only the local cladding performance, but also the local dimensions of the
clad layers. Straight bonding interfaces between the clad layers and the substrates
were observed in all the specimens as shown in Figure 3. Clearly, no substrate
deformation or intermixing between both materials occurred. The average
thickness along the width direction increased with the nominal layer thickness, from
285 𝜇𝜇𝑚𝑚 in experiment 1 to 783 𝜇𝜇𝑚𝑚 in experiment 4. The clad layer thickness
deviated somewhat from the intended values due to the finite stiffness of the

experimental setup in the axial direction and a limited accuracy in the
measurement system for the distance between the FSC tool and the substrate.
The layer thickness near the advancing side was slightly larger than that near the
retreating side. Along the cladding center lines, the clad layers tended to be thinner
than those near the edges due to the slightly inclined orientation of the FSC tool
axis with respect to the substrate normal.
4.2 Experimental temperature and force distributions
The evolution of the FSC tool temperature as recorded by 𝑇𝑇𝑇𝑇𝑇𝑇 for all experiments
is shown in Figure 4. The tool temperature of experiments 1 – 3 was just below
300 ℃ for the first part of the cladding phase and then increased somewhat. This is
related to the finite dimensions of the cladded substrate and the cooling conditions
at the substrate-backing plate interface. In case of experiment 4 the supply rate
was increased after about 125 𝑠𝑠 leading eventually to a similar tool temperature as
for experiments 1 – 3 for the remaining part of the cladding phase.
Despite the variation occurring in the measured tool temperature of the four
experiments, the local substrate temperatures recorded by 𝑇𝑇𝑇𝑇3 tended to be
similar. The peak value from 𝑇𝑇𝑇𝑇3 was approximately 320 ℃ for all experiments,
which was 30 − 40 ℃ higher than the measured tool temperature at the moment
the tool passed this position.
The recorded normal force is also shown in Figure 4. At the start of the cladding
phase the normal force had a peak value, but after some distance, it reduced and

remained fluctuating about an approximately constant or slightly increasing
average value. The local average force 𝐹𝐹𝑛𝑛3, is shown in Figure 5(a). This force
decreased with the nominal clad layer thickness, indicating that the clad material
can be distributed over the substate more easily at larger FSC tool-substrate
distances. The local average pressure, 𝑀𝑀3 = 4𝐹𝐹𝑛𝑛3𝜋𝜋𝑊𝑊3
2, reduced nearly linearly with the
nominal thickness, as illustrated in Figure 5(b).
Figure 4 Temperature recorded from the FSC tool (𝑇𝑇𝑇𝑇𝑡𝑡), the third thermocouple
(𝑇𝑇𝑇𝑇3) and the normal forces (𝐹𝐹𝑛𝑛) in all experiments.

The relatively low temperatures and normal forces measured during the FSC
experiments help to explain the presence of a straight bonding interface between
the clad layer and the substrate. The observed temperatures and forces were low
enough for the yield strength of the substrate material (45-115 𝑀𝑀𝑀𝑀𝑀𝑀 at 340 ℃) to
remain substantially higher than that of the clad material (8-11 𝑀𝑀𝑀𝑀𝑀𝑀)[9]. This
strongly prevented large scale plastic deformation of the substrate and/or mixing of
both materials.

Figure 5 Process induced normal force on the substrate and related pressure as a
function of the nominal layer thickness.

4.3 Hardness distributions
Hardness measurements performed at the cross sections indicated a value of
about 30-40 𝐻𝐻𝐻𝐻 in the deposited clad layers. Within the substrates beneath the
clad layers a fairly uniform hardness distribution of about 130 𝐻𝐻𝐻𝐻 was observed.
This value represented a small decrease with respect to the value of 140 𝐻𝐻𝐻𝐻
measured in the as-received substrate, which was in line with the temperature
development in the substrate during the experiments[10,11].
5. Numerical results
The temperature distribution and the normal force exerted on the substrate were
computed in the 2D model by varying the clad layer thickness and the tool rotation
rate. The supply rate and the clad layer width values used reflect the average
values of the experiments: 𝑣𝑣𝑓𝑓,𝑑𝑑𝑑𝑑𝑚𝑚 = 3 𝑚𝑚𝑚𝑚/𝑚𝑚𝑇𝑇𝑚𝑚 and 𝑊𝑊𝑑𝑑𝑑𝑑𝑚𝑚 = 2𝑅𝑅𝑑𝑑𝑑𝑑𝑑𝑑𝑑𝑑 = 16 𝑚𝑚𝑚𝑚,
respectively.
In the first simulation series the tool rotation rate was varied between 250 𝑟𝑟𝑟𝑟𝑚𝑚 and
500 𝑟𝑟𝑟𝑟𝑚𝑚 at a constant nominal thickness of ℎ0 = 0.2 𝑚𝑚𝑚𝑚. An example of the
resulting thermal fields for Ω = 300 𝑟𝑟𝑟𝑟𝑚𝑚 and ℎ0 = 0.2 𝑚𝑚𝑚𝑚 after simulating 30 𝑠𝑠 of
cladding, corresponding approximately to the thermal conditions near 𝑇𝑇𝑇𝑇3, is
shown in Figure 6. As illustrated, the highest temperature occurred near the clad-
material/tool interface due to the generated viscous heat; the temperature reached
around 310 ℃ in the mid-thickness substrate region, which is in agreement with the

experimental result. The calculations with other rotation rates provided similar
thermal trends, but with different magnitudes as shown in Figure 7.
Figure 6 Simulated temperature distribution for Ω = 300 𝑟𝑟𝑟𝑟𝑚𝑚 and ℎ0 = 0.2 𝑚𝑚𝑚𝑚 after
30 𝑠𝑠.
The effect of the varying tool rotation rates on the mid-thickness substrate
temperature and the pressure near the clad disk bottom is clearly visible. At higher
tool rotation rates the resulting temperatures are higher due to the higher heat
generation rate, but at the same time the normal pressures at the clad layer-
substrate interface are lower. The temperature is highest just beneath the tool in
the clad layer and decreases with increasing distance due to heat conduction and
heat loss to the environment. The pressure distribution is rather uniform just below
the clad rod opening (𝑅𝑅𝑡𝑡𝑟𝑟𝑑𝑑 = 5 𝑚𝑚𝑚𝑚) and decreases to zero towards the edge of the
supplied clad material at Rdisk = 8 mm. The total viscous heat generated per unit of
time as a function of the rotation rate, along with the total normal force exerted on
the substrate is shown in Figure 8. Clearly, these figures reflect the same trends as
observed in Figure 7.
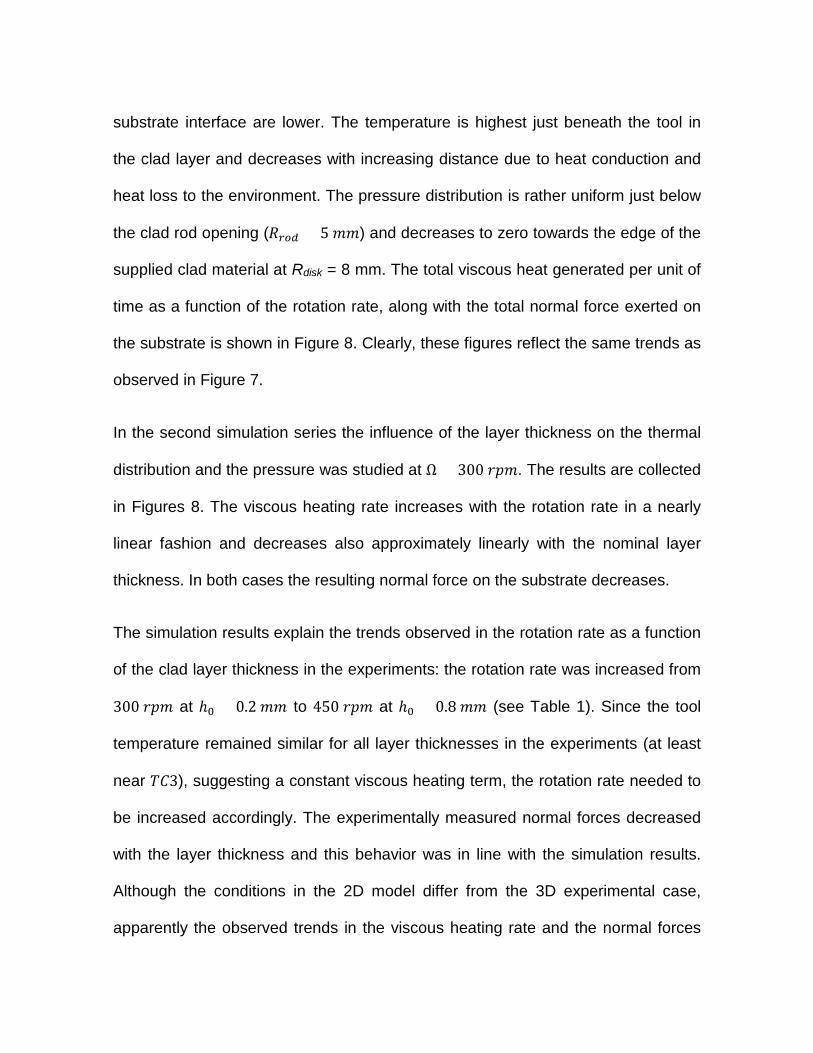
In the second simulation series the influence of the layer thickness on the thermal
distribution and the pressure was studied at Ω = 300 𝑟𝑟𝑟𝑟𝑚𝑚. The results are collected
in Figures 8. The viscous heating rate increases with the rotation rate in a nearly
linear fashion and decreases also approximately linearly with the nominal layer
thickness. In both cases the resulting normal force on the substrate decreases.
The simulation results explain the trends observed in the rotation rate as a function
of the clad layer thickness in the experiments: the rotation rate was increased from
300 𝑟𝑟𝑟𝑟𝑚𝑚 at ℎ0 = 0.2 𝑚𝑚𝑚𝑚 to 450 𝑟𝑟𝑟𝑟𝑚𝑚 at ℎ0 = 0.8 𝑚𝑚𝑚𝑚 (see Table 1). Since the tool
temperature remained similar for all layer thicknesses in the experiments (at least
near 𝑇𝑇𝑇𝑇3), suggesting a constant viscous heating term, the rotation rate needed to
be increased accordingly. The experimentally measured normal forces decreased
with the layer thickness and this behavior was in line with the simulation results.
Although the conditions in the 2D model differ from the 3D experimental case,
apparently the observed trends in the viscous heating rate and the normal forces

can be explained well. Further work will concentrate on a more accurate
description of the stick/slip phenomena taking place at the various material
interfaces to better understand the processes determining the clad layer deposition
process and quality.

Figure 7 Temperature distribution in the middle thickness of the substrate and the
pressure distribution at the clad layer-substrate interface for different rotation rates.
Figure 8 Total viscous heat dissipated per unit of time and the total normal force on the substrate as a function of the rotation rate at ℎ0 = 0.2 𝑚𝑚𝑚𝑚 and the nominal
layer thickness at Ω = 300 𝑟𝑟𝑟𝑟𝑚𝑚.
6. Conclusions
The experimental results revealed the feasibility of depositing soft AA1050 layers
with various layer thicknesses on a relatively hard AA2024-T351 substrate. In all
cases homogeneous, void free clad layers were deposited. The clad layer-
substrate interface remained straight and no significant plastic deformation of the
substrate and/or mixing occurred. The substrate hardness was hardly affected.
These results can be explained by the relatively low maximum temperatures and
process induced forces occurring during the FSC process.
The tool rotation rate needed to be adjusted when the clad layer thickness was
modified at constant clad layer width. For thicker clad layers the FSC tool rotation
rate had to be increased to maintain the same process temperature; the process
induced normal forces decreased. The observed behavior was confirmed by a 2D
axisymmetric thermal and flow coupled model.
References
[1] A.van de Stelt, Friction Surface Cladding development of a solid state cladding
process (2014).
[2] Gandra, J., H. Krohn, et al. (2014). "Friction surfacing—A review." Journal of
Materials Processing Technology 214(5): 1062-1093.
[3] Rajiu S. Mishra and Murray W. Mahoney. Friction Stir Welding and Processing.
2007.

[4] Schmidt, H., J. Hattel, et al. (2004). "An analytical model for the heat generation
in friction stir welding." Modelling and Simulation in Materials Science and
Engineering 12(1): 143-157.
[5] Y. V. R. K. Prasad and S. Sasidhara. Hot Working Guide: A Compendium of
Processing Maps. 1997.
[6] R. Nandan, G. G. Roy, T. J. Lienert, and T. DebRoy. Numerical modelling of 3D
plastic flow and heat transfer during friction stir welding of stainless steel. Science
and Technology of Welding and Joining, 11(5):526?537, September 2006.
[7] R. Nandan, G.G. Roy, T.J. Lienert, and T. Debroy. Three-dimensional heat and
material flow during friction stir welding of mild steel. Acta Materialia,
55(3):883?895, February 2007.
[8] Li, W., Z. Zhang, et al. (2011). "Numerical Analysis of Joint Temperature
Evolution During Friction Stir Welding Based on Sticking Contact." Journal of
Materials Engineering and Performance 21(9): 1849-1856.
[9] J Gilbert Kaufman. Properties of aluminum alloys : tensile, creep, and fatigue
data at high and low temperatures, 1999.
[10] M Jones, P Heurtier, C Desrayaud, F Montheillet, D Allehaux, and J Driver.
Correlation between microstructure and microhardness in a friction stir welded
2024 aluminium alloy. Scripta Materialia, 52(8):693-697, April 2005.

[11] Saad Ahmed Khodir, Toshiya Shibayanagi, and Masaaki Naka. Control of
Hardness Distribution in Friction Stir Welded AA2024-T3 Aluminum Alloy. Materials
Transactions,47(6):1560-1567, 2006.
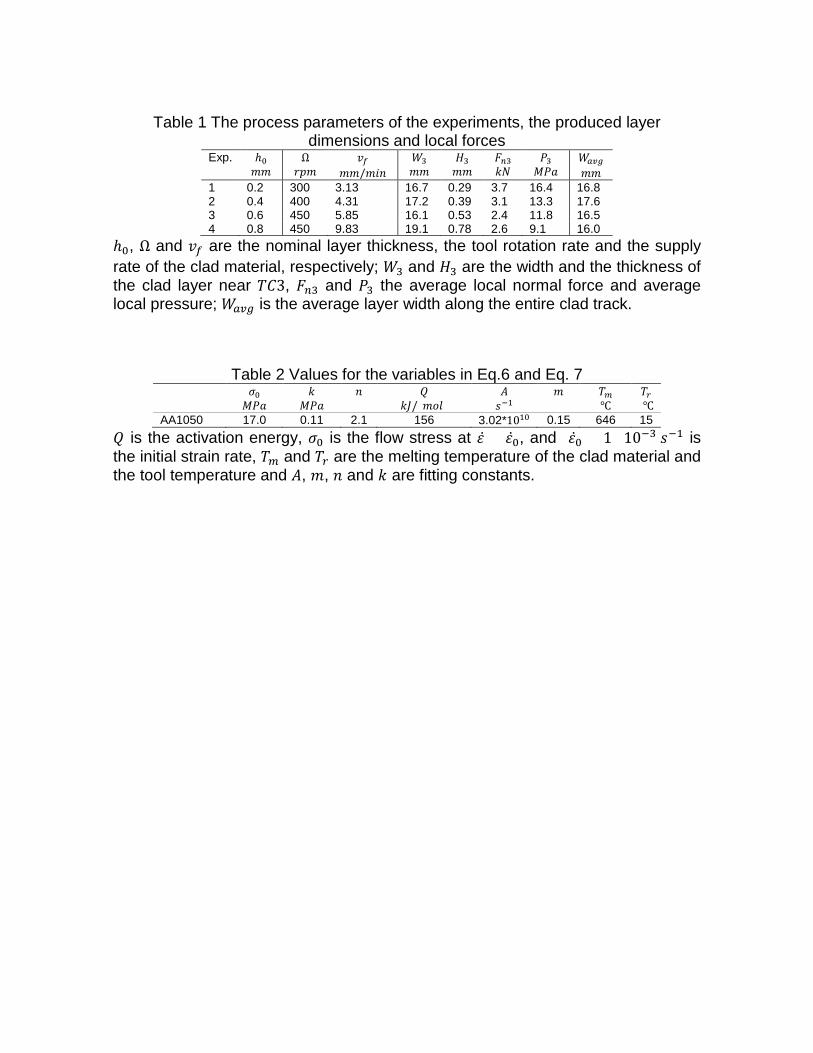
Table 1 The process parameters of the experiments, the produced layer dimensions and local forces
Exp. ℎ0 [𝑚𝑚𝑚𝑚]
Ω [𝑟𝑟𝑟𝑟𝑚𝑚]
𝑣𝑣𝑓𝑓 [𝑚𝑚𝑚𝑚/𝑚𝑚𝑇𝑇𝑚𝑚]
𝑊𝑊3 [𝑚𝑚𝑚𝑚]
𝐻𝐻3 [𝑚𝑚𝑚𝑚]
𝐹𝐹𝑛𝑛3 [𝑘𝑘𝑘𝑘]
𝑀𝑀3 [𝑀𝑀𝑀𝑀𝑀𝑀]
𝑊𝑊𝑎𝑎𝑎𝑎𝑎𝑎 [𝑚𝑚𝑚𝑚]
1 0.2 300 3.13 16.7 0.29 3.7 16.4 16.8 2 0.4 400 4.31 17.2 0.39 3.1 13.3 17.6 3 0.6 450 5.85 16.1 0.53 2.4 11.8 16.5 4 0.8 450 9.83 19.1 0.78 2.6 9.1 16.0
ℎ0, Ω and 𝑣𝑣𝑓𝑓 are the nominal layer thickness, the tool rotation rate and the supply rate of the clad material, respectively; 𝑊𝑊3 and 𝐻𝐻3 are the width and the thickness of the clad layer near 𝑇𝑇𝑇𝑇3, 𝐹𝐹𝑛𝑛3 and 𝑀𝑀3 the average local normal force and average local pressure; 𝑊𝑊𝑎𝑎𝑎𝑎𝑎𝑎 is the average layer width along the entire clad track.
Table 2 Values for the variables in Eq.6 and Eq. 7 𝜎𝜎0
[𝑀𝑀𝑀𝑀𝑀𝑀] 𝑘𝑘
[𝑀𝑀𝑀𝑀𝑀𝑀] 𝑚𝑚 𝑄𝑄
[𝑘𝑘𝐽𝐽/(𝑚𝑚𝑚𝑚𝑘𝑘)] 𝐴𝐴
[𝑠𝑠−1] 𝑚𝑚 𝑇𝑇𝑚𝑚
[℃] 𝑇𝑇𝑡𝑡 [℃]
AA1050 17.0 0.11 2.1 156 3.02*1010 0.15 646 15 𝑄𝑄 is the activation energy, 𝜎𝜎0 is the flow stress at 𝜀𝜀̇ = 𝜀𝜀0̇, and 𝜀𝜀0̇ = 1 · 10−3 𝑠𝑠−1 is the initial strain rate, 𝑇𝑇𝑚𝑚 and 𝑇𝑇𝑡𝑡 are the melting temperature of the clad material and the tool temperature and 𝐴𝐴, 𝑚𝑚, 𝑚𝑚 and 𝑘𝑘 are fitting constants.