thermal analysis of polyamide 6 composites filled by natural … · (2016). “fiber-polyamide...
TRANSCRIPT
PEER-REVIEWED ARTICLE bioresources.com
Erbas Kiziltas et al. (2016). “Fiber-polyamide composites,” BioResources 11(2), 4758-4769. 4758
Thermal Analysis of Polyamide 6 Composites Filled by Natural Fiber Blend
Esra Erbas Kiziltas,a,b,* Han-Seung Yang,c Alper Kiziltas,a,d Sevda Boran,a,e
Ertan Ozen,a,f and Douglas J. Gardner a
This study describes changes in the viscoelastic and thermal properties of composites made with various percentages (up to 20 wt.%) of a natural fiber blend (a mixture of flax, kenaf, and hemp fibers) and polyamide 6 (PA 6). According to the differential scanning calorimetry (DSC) analyses, the incorporation of natural fibers produced minor changes in the glass transition (Tg), melting (Tm), and crystallization temperature (Tc) of the PA 6 composites. Because of the reinforcing effect of natural fibers, the storage modulus (E’) from dynamic mechanical thermal analysis (DMTA) increased as the natural fiber content increased. The E’ values at room temperature and Tg were 3960 MPa and 1800 MPa, respectively, with the incorporation 20 wt.% fiber, which were 68% and 193% higher than the E’ value of neat PA 6. As the natural fiber content increased, the thermal stability of the composites decreased, and thermogravimetric analysis (TGA) showed that the onset temperature of rapid thermal degradation decreased from around 440 (neat PA 6) to 420 °C (20 wt.% natural fiber blend). The addition of 20 wt.% single type fibers showed comparable DSC and TG results to the incorporation of 20 wt.% natural fiber blends.
Keywords: Engineering thermoplastic composite; Melt compounding; Dynamic mechanical thermal
analysis (DMTA); Differential scanning calorimetry (DSC); Thermogravimetric analysis (TG);
Thermal stability
Contact information: a: Advanced Structures and Composite Center, University of Maine, Orono, ME
04469-5793 USA; b: The Scientific and Technological Research Council of Turkey (TUBITAK), Tunus
Cad, Kavaklıdere 06100, Ankara, Turkey; c: Monticello Mushroom Inc., Monticello, MN 55362-6221 USA;
d: Department of Forest Industry Engineering, Faculty of Forestry, University of Bartin, 74100 Bartin,
Turkey; e: Karadeniz Technical University, Faculty of Technology, Woodworking Industry Engineering,
61830, Trabzon, Turkey; f: Department of Woodworking Industrial Engineering, Faculty of Technology,
Mugla Sıtkı Koçman University, 48000 Mugla, Turkey; *Corresponding author: [email protected]
INTRODUCTION
Lightweight composites from sustainable sources, including renewable,
biodegradable, and recycled materials are promising new materials. In automotive
applications, lightweight sustainable composites lessen the dependence on petroleum
resources and replacing dense (talc fillers) as well as man-made fillers (glass and carbon
fibers) with more environmentally friendly materials (Leao et al. 1998; Zhao and Zhou
2014). Recently in Europe and North America, the use of natural fibers as fillers in plastic
composites has received considerable attention in the automotive industry because of their
low cost compared to carbon fibers, low density versus other fillers (2.5 g/cm3 for glass
fibers and 2.75 g/cm3 for talc fillers), good mechanical properties, ease of fiber surface
modification via functional groups, relative non-abrasiveness to compounding and
processing tools, renewability, biodegradability, and world-wide availability (Joshi et al.
2004; Santos et al. 2008; Njuguna et al. 2011; Ozen et al. 2012). The future of the natural
PEER-REVIEWED ARTICLE bioresources.com
Erbas Kiziltas et al. (2016). “Fiber-polyamide composites,” BioResources 11(2), 4758-4769. 4759
fiber composites (NFCs) market looks attractive, and the global NFCs market is forecast
to grow at a compound annual growth rate (CAGR) of 8.2% from 2015 to 2020 (Lucintel
2015). The automotive industry is expected to remain the largest application of NFCs
because of the increasing concern for passenger safety, government mandates for better
fuel economy (corporate average fuel economy (CAFÉ) regulations), and end-of-life
vehicle directives (Lucintel 2015).
Polyamides (6, 6/6, 11, and 12) are the most widely used engineering
thermoplastics in a number of critical areas in automotives, such as the engine, transmission,
cooling systems, and fuel system components, where mechanical and thermal stability are
required at temperatures of 90 to 150 °C or above; thermoplastics also provide higher oil
and corrosive chemical resistance, good mechanical properties, and attractive surface
qualities (MacDermont and Shenoy 1997; Graff 2005). However, their high melting points
(over 220 °C for nylon 6 and 6/6) are usually problematic in producing NFCs, and thermal
degradation is the primary cause of problems when working with natural fibers because it
leads to reduced mechanical properties (Graff 2005; Vedoy 2012; Birch et al. 2015).
Combined with their better mechanical properties than polyolefins (polypropylene (PP),
polyethylene (PE), etc.) and easier recyclability, which is important for end-of-life vehicles
directives, compared to thermoset polymers (epoxy, polyester, polyurethane, etc.),
polyamides show great interaction with natural fibers. These interactions are attributed to
their hydrophilic nature, making it possible to eliminate the use of coupling agents and
surface modification of natural fibers, which are time consuming and increase the cost of
the final composite materials (Graff 2005; Tajvidi and Feizmand 2009). Although there is
considerable interest in nylon-based composites, there have been only a few studies of
nylon-based NFCs, and the available literature focuses on mechanical and morphological
properties (Santos et al. 2007; de Arcaya et al. 2009; Arsad et al. 2013; Ozen et al. 2013).
There is a lack of information about the rheological and thermal properties of PA-based
NFCs. The studied PA-based NFCs are generally single fiber feedstocks, and but the
optimal material properties may be achieved using blends of natural fibers (Sherman 1999).
In a previous paper, the effects of a natural fiber blend on the mechanical and
morphological properties of PA 6-based NFCs were investigated (Ozen et al. 2013). The
aim of this study is to investigate the effect of a natural fiber blend (a mixture of flax, kenaf,
and hemp) on the rheological and thermal properties of PA 6-based NFCs. Using thermal
tests including differential scanning calorimetry (DSC), dynamic mechanical thermal
analysis (DMTA), and thermogravimetric analysis (TGA), the thermal stability, DTG max
temperature, viscoelastic behavior (storage modulus and tan δ), Tg, Tm, and Tc of the neat
PA 6 and PA 6-based NFCs were compared.
EXPERIMENTAL
PA 6 with a density of 1.13 g/cm3 was kindly supplied by Entec Polymers LLC,
Orlando, FL, USA. The lubricant used as processing aid was supplied by Struktol Company
(Stow, OH, USA). Natural fibers (flax, hemp, and kenaf) were kindly supplied by Bast
Fibers LLC (Cresskill, NJ, USA) and were milled into small particles using a lab scale
grinder; the uniform particle size distribution facilitated mixing during melt compounding.
Natural fibers were milled into small particles using a lab-scale grinder and passed through
a 5-mm screen to obtain particles of uniform size. The same amount of natural fiber
particles (most of the natural fiber particles 86 wt.% were less than 850 µm. based on sieve
PEER-REVIEWED ARTICLE bioresources.com
Erbas Kiziltas et al. (2016). “Fiber-polyamide composites,” BioResources 11(2), 4758-4769. 4760
analysis) from different fibers was packed in an air-tight container and mixed in a high-
speed mixer (2000 rpm, 2 min) to obtain a uniform mixture. A Brabender Prepmixer®
(South Hackensack, NJ, USA) was used to compound the PA 6 with the natural fiber blend
or individual fiber types. Mixing was performed for 15 min at 250 °C and a rotor speed of
60 rpm. Melt compounding was followed by grinding and injection molding for all
composite materials. The materials and sample preparation methods used in this study are
described in more detail elsewhere (Ozen et al. 2013). The NFCs nomenclature and
compositions are shown in Table 1. A DMTA IV rheometer from Rheometric Scientific®
(Patel Scientific Corporation, Piscataway, NJ, USA) was used to determine the viscoelastic
properties of the composites. The experiments were conducted in three point bending mode
at a frequency of 1 Hz from -50 to 150 °C at a scanning rate of 5 °C/min. DSC
measurements were performed using a PerkinElmer Pyris DSC (Waltham, MA, USA), and
each 10 mg sample was scanned from -10 °C to 250 °C at a heating rate of 5 °C/min under
nitrogen flow (20 mL/min) to prevent sample oxidation. The specimens` Xc was calculated
according to the following equation,
Xc= (∆Hf x 100) / (∆Hf ̊ x ω) (1)
where ∆Hf is the heat of fusion of the PA 6 and PA 6-based NFCs, ∆Hf ̊ the heat of fusion
for 100% crystalline PA 6 (∆H100=190 J/g), and ω is the mass fraction for PA 6 in the
composites (Wu et al. 2001).
TGA measurements were performed using a Mettler Toledo analyzer (Columbus,
OH, USA), and each 10 mg sample was scanned from room temperature to 600 °C at a
heating rate of 10 °C/min under nitrogen flow (20 mL/min) to prevent sample oxidation.
At least three specimens were tested for each composition for DSC, DMTA, and TGA tests,
and the results are presented as an average of tested samples. More details on DSC, DMTA,
and TGA can be found elsewhere (Kiziltas et al. 2010; Kiziltas et al. 2011).
Table 1. Nomenclature and Compositions of PA 6-NFCs
Sample Name PA 6
(wt.%) Flax
(wt.%) Hemp (wt.%)
Kenaf (wt.%)
NFB (wt.%)
Lubricant (wt.%)
PA 6 97 - - - - 3 5% M 92 - - - 5 3 10% M 87 - - - 10 3 20% M 77 - - - 20 3 20% F 77 20 - - - 3 20% H 77 - 20 - - 3 20% K 77 - - 20 - 3
NFB = natural fiber blend, mixture of flax, hemp, and kenaf fibers M = mixture, F = flax, H = hemp, K = kenaf
RESULTS AND DISCUSSION
Figure 1 shows the DSC curves of the neat PA 6 and PA 6-based NFCs. The Tg of
the neat PA 6 was approximately 38 °C, and the Tg values of composites changed, but only
marginally in Fig. 1. PA composites containing glass fibers, microcrystalline cellulose,
montmorillonite, and organoclay exhibit similar Tg behavior, and previous reports showed
that the Tg values of PA-based NFCs are strongly affected by the matrix polymer but not
the fillers (Cho and Paul 2001; Kiziltas et al. 2011).

PEER-REVIEWED ARTICLE bioresources.com
Erbas Kiziltas et al. (2016). “Fiber-polyamide composites,” BioResources 11(2), 4758-4769. 4761
Temperature (°C)
30 35 40 45 50
He
at
Flo
w E
xo
Up
(m
W)
-3.4
-3.2
-3.0
-2.8
-2.6
-2.4
-2.2
-2.0
-1.8PA 65% M10% M20% M20% F20% H20% K
Fig. 1. Glass transition temperatures (Tg) from DSC for neat PA and PA 6-based NFCs
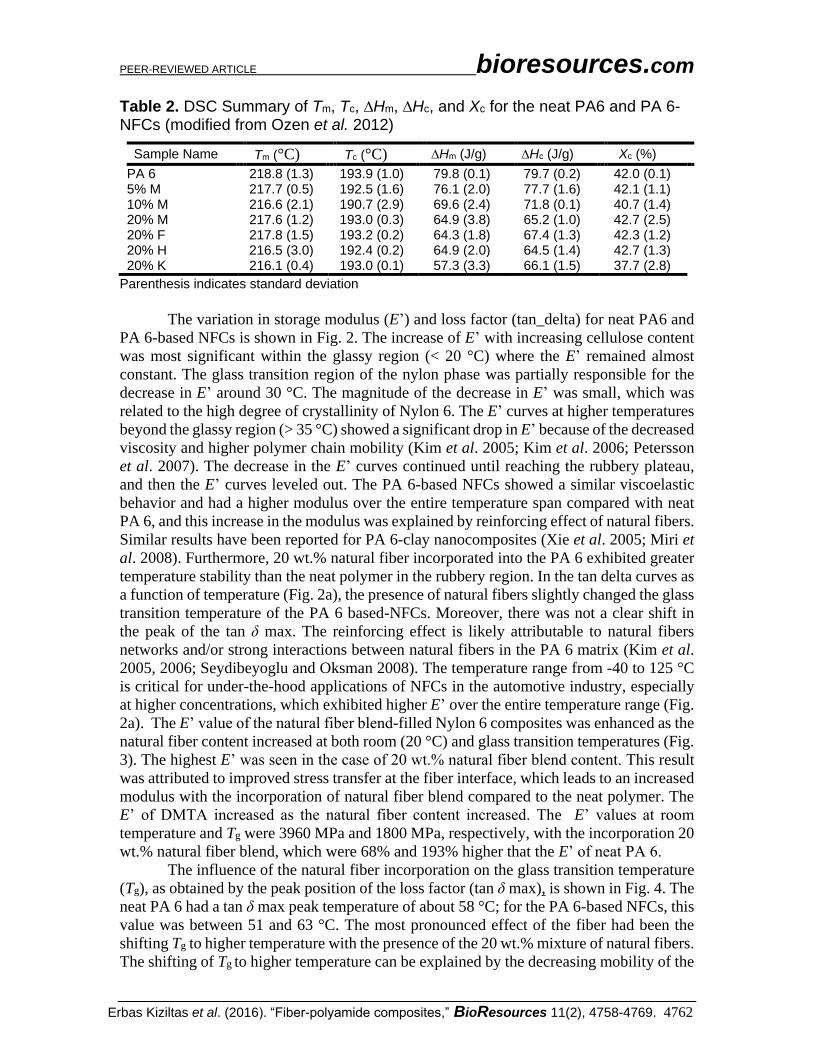
The crystallization temperatures of neat PA 6 and PA 6-based NFCs are shown in
Table 2. The Tc values of neat PA 194 °C and the PA 6-based NFCs were between 191 and
193 °C. Thus, the presence of natural fibers had little or no effect on the Tc of the PA 6-
based NFCs. Table 2 also shows the Tm of neat PA6 and PA 6-based NFCs. The melting
temperature of neat PA 6 was around 219 °C. For PA 6-based NFCs, the melting
temperatures were between 216 and 218 °C, showing that the natural fibers had little effect
on the Tm of the NFCs. The minor effect on the Tm can be explained with a small change
in crystallite size in the presence of natural fibers (Cho and Paul 2001). Correlation among
different natural fiber blend contents was not possible, and from a practical standpoint, this
result suggests that the incorporation of natural fiber does not affect the Tm of the PA 6.
Similar results were also reported by Kiziltas et al. (2011), Goitisolo et al. (2008), and Cho
and Paul (2001) for PA6/filler composites. In addition, the enthalpies of crystallization,
∆Hc, of natural fiber blend-Nylon 6 composites decreased as the natural fiber content
increased (Table 2). The addition of non-treated silica to PA 6 composites showed similar
crystallization behavior, and this behavior is explained by the reduction in the molecular
chain movement of the PA 6 through physical bonding or through confinement with the
addition of natural fibers (Racz et al. 2004).
The crystallinity index (%) (Xc) of the neat PA 6 and PA 6-based NFCs is shown in
Table 2. Increasing the natural fiber content slightly increased the crystallinity index at low
loading levels of natural fiber blend from 5 to 20 wt.%. The incorporation of 20 wt.% kenaf
fiber alone resulted in a considerable decrease in percent crystallinity, and the lower
percent crystallinity was partially explained by the restriction of polymer chains (Fornes
and Paul 2003). A similar effect was reported in clay-Nylon 6 composites (Wu et al. 2001;
Fornes and Paul 2003).
Glass Transition Temp.
PEER-REVIEWED ARTICLE bioresources.com
Erbas Kiziltas et al. (2016). “Fiber-polyamide composites,” BioResources 11(2), 4758-4769. 4762
Table 2. DSC Summary of Tm, Tc, ∆Hm, ∆Hc, and Xc for the neat PA6 and PA 6-NFCs (modified from Ozen et al. 2012)
Sample Name Tm (°C) Tc (°C) ∆Hm (J/g) ∆Hc (J/g) Xc (%)
PA 6 218.8 (1.3) 193.9 (1.0) 79.8 (0.1) 79.7 (0.2) 42.0 (0.1) 5% M 217.7 (0.5) 192.5 (1.6) 76.1 (2.0) 77.7 (1.6) 42.1 (1.1) 10% M 216.6 (2.1) 190.7 (2.9) 69.6 (2.4) 71.8 (0.1) 40.7 (1.4) 20% M 217.6 (1.2) 193.0 (0.3) 64.9 (3.8) 65.2 (1.0) 42.7 (2.5) 20% F 217.8 (1.5) 193.2 (0.2) 64.3 (1.8) 67.4 (1.3) 42.3 (1.2) 20% H 216.5 (3.0) 192.4 (0.2) 64.9 (2.0) 64.5 (1.4) 42.7 (1.3) 20% K 216.1 (0.4) 193.0 (0.1) 57.3 (3.3) 66.1 (1.5) 37.7 (2.8)
Parenthesis indicates standard deviation
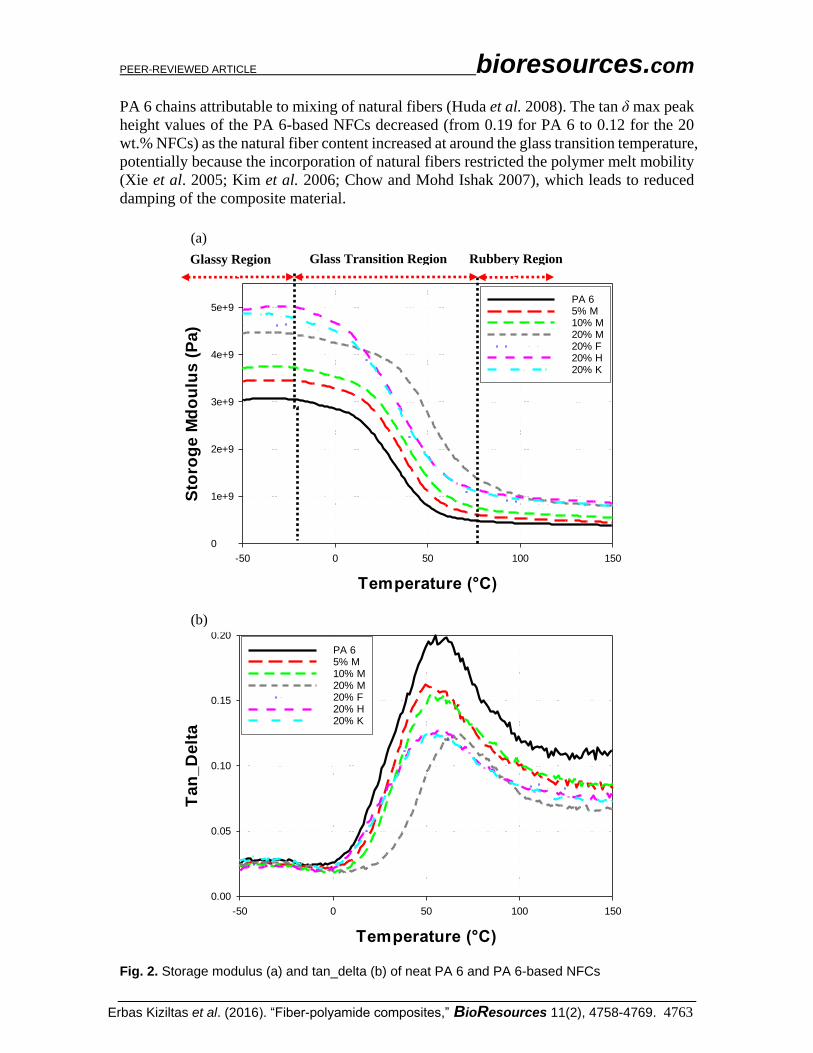
The variation in storage modulus (E’) and loss factor (tan_delta) for neat PA6 and
PA 6-based NFCs is shown in Fig. 2. The increase of E’ with increasing cellulose content
was most significant within the glassy region (< 20 °C) where the E’ remained almost
constant. The glass transition region of the nylon phase was partially responsible for the
decrease in E’ around 30 °C. The magnitude of the decrease in E’ was small, which was
related to the high degree of crystallinity of Nylon 6. The E’ curves at higher temperatures
beyond the glassy region (> 35 °C) showed a significant drop in E’ because of the decreased
viscosity and higher polymer chain mobility (Kim et al. 2005; Kim et al. 2006; Petersson
et al. 2007). The decrease in the E’ curves continued until reaching the rubbery plateau,
and then the E’ curves leveled out. The PA 6-based NFCs showed a similar viscoelastic
behavior and had a higher modulus over the entire temperature span compared with neat
PA 6, and this increase in the modulus was explained by reinforcing effect of natural fibers.
Similar results have been reported for PA 6-clay nanocomposites (Xie et al. 2005; Miri et
al. 2008). Furthermore, 20 wt.% natural fiber incorporated into the PA 6 exhibited greater
temperature stability than the neat polymer in the rubbery region. In the tan delta curves as
a function of temperature (Fig. 2a), the presence of natural fibers slightly changed the glass
transition temperature of the PA 6 based-NFCs. Moreover, there was not a clear shift in
the peak of the tan δ max. The reinforcing effect is likely attributable to natural fibers
networks and/or strong interactions between natural fibers in the PA 6 matrix (Kim et al.
2005, 2006; Seydibeyoglu and Oksman 2008). The temperature range from -40 to 125 °C
is critical for under-the-hood applications of NFCs in the automotive industry, especially
at higher concentrations, which exhibited higher E’ over the entire temperature range (Fig.
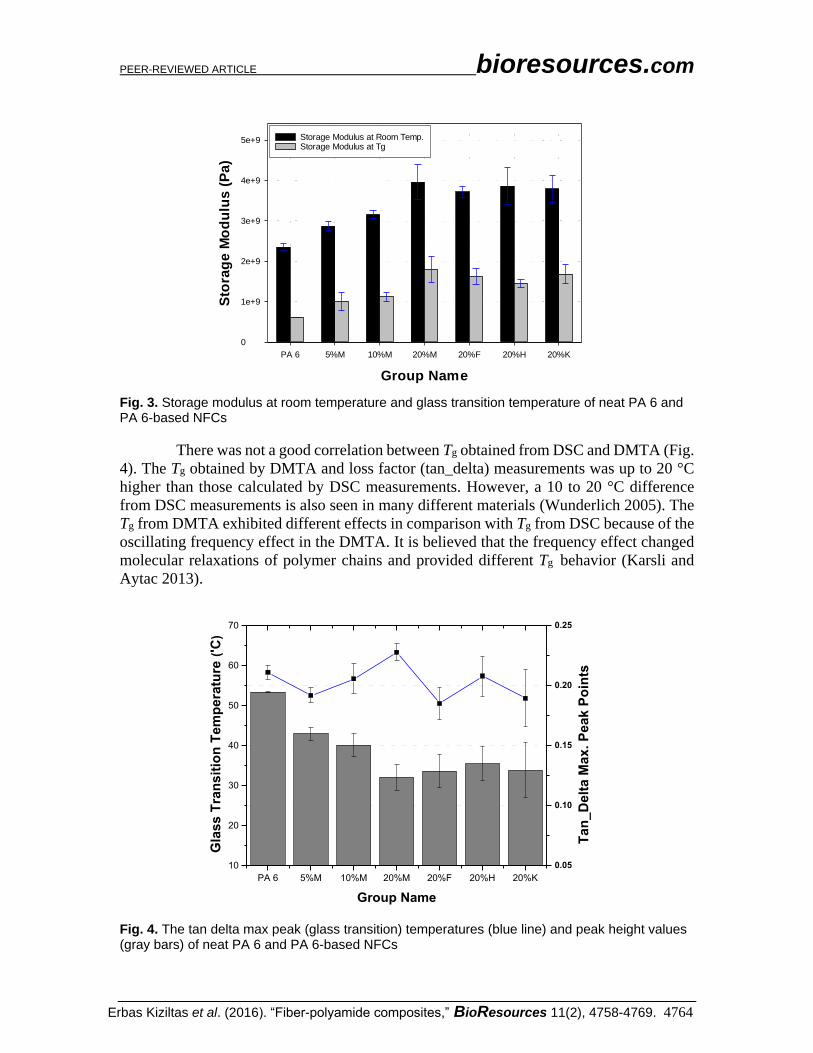
2a). The E’ value of the natural fiber blend-filled Nylon 6 composites was enhanced as the
natural fiber content increased at both room (20 °C) and glass transition temperatures (Fig.
3). The highest E’ was seen in the case of 20 wt.% natural fiber blend content. This result
was attributed to improved stress transfer at the fiber interface, which leads to an increased
modulus with the incorporation of natural fiber blend compared to the neat polymer. The
E’ of DMTA increased as the natural fiber content increased. The E’ values at room
temperature and Tg were 3960 MPa and 1800 MPa, respectively, with the incorporation 20
wt.% natural fiber blend, which were 68% and 193% higher that the E’ of neat PA 6.
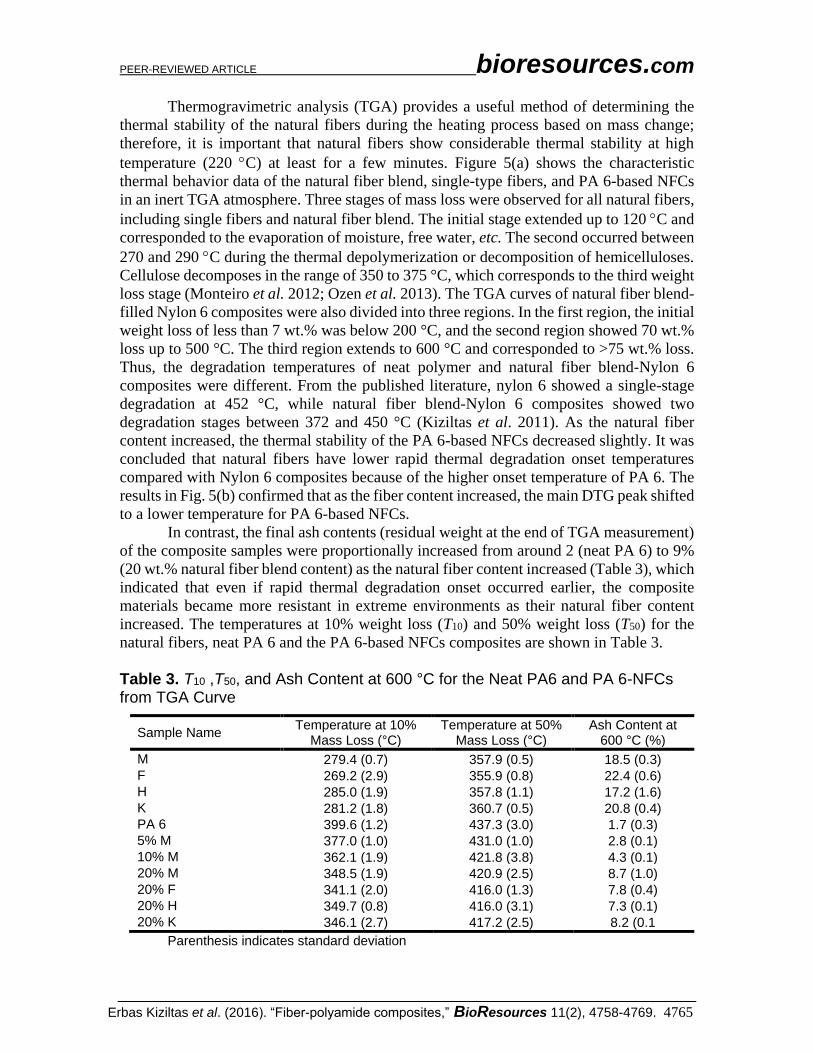
The influence of the natural fiber incorporation on the glass transition temperature
(Tg), as obtained by the peak position of the loss factor (tan δ max), is shown in Fig. 4. The
neat PA 6 had a tan δ max peak temperature of about 58 °C; for the PA 6-based NFCs, this
value was between 51 and 63 °C. The most pronounced effect of the fiber had been the
shifting Tg to higher temperature with the presence of the 20 wt.% mixture of natural fibers.
The shifting of Tg to higher temperature can be explained by the decreasing mobility of the
PEER-REVIEWED ARTICLE bioresources.com
Erbas Kiziltas et al. (2016). “Fiber-polyamide composites,” BioResources 11(2), 4758-4769. 4763
PA 6 chains attributable to mixing of natural fibers (Huda et al. 2008). The tan δ max peak
height values of the PA 6-based NFCs decreased (from 0.19 for PA 6 to 0.12 for the 20
wt.% NFCs) as the natural fiber content increased at around the glass transition temperature,
potentially because the incorporation of natural fibers restricted the polymer melt mobility
(Xie et al. 2005; Kim et al. 2006; Chow and Mohd Ishak 2007), which leads to reduced
damping of the composite material.
Temperature (°C)
-50 0 50 100 150
Sto
rog
e M
do
ulu
s (
Pa
)
0
1e+9
2e+9
3e+9
4e+9
5e+9PA 65% M10% M20% M20% F20% H20% K
Temperature (°C)
-50 0 50 100 150
Ta
n_
De
lta
0.00
0.05
0.10
0.15
0.20
PA 65% M10% M20% M20% F20% H20% K
Fig. 2. Storage modulus (a) and tan_delta (b) of neat PA 6 and PA 6-based NFCs
Glass Transition Region Glassy Region Rubbery Region
(a)
(b)
PEER-REVIEWED ARTICLE bioresources.com
Erbas Kiziltas et al. (2016). “Fiber-polyamide composites,” BioResources 11(2), 4758-4769. 4764
Group Name
PA 6 5%M 10%M 20%M 20%F 20%H 20%K
Sto
rag
e M
od
ulu
s (
Pa
)
0
1e+9
2e+9
3e+9
4e+9
5e+9 Storage Modulus at Room Temp.Storage Modulus at Tg
Fig. 3. Storage modulus at room temperature and glass transition temperature of neat PA 6 and PA 6-based NFCs
There was not a good correlation between Tg obtained from DSC and DMTA (Fig.
4). The Tg obtained by DMTA and loss factor (tan_delta) measurements was up to 20 °C
higher than those calculated by DSC measurements. However, a 10 to 20 °C difference
from DSC measurements is also seen in many different materials (Wunderlich 2005). The
Tg from DMTA exhibited different effects in comparison with Tg from DSC because of the
oscillating frequency effect in the DMTA. It is believed that the frequency effect changed
molecular relaxations of polymer chains and provided different Tg behavior (Karsli and
Aytac 2013).
PA 6 5%M 10%M 20%M 20%F 20%H 20%K
10
20
30
40
50
60
70
Group Name
Gla
ss
Tra
ns
itio
n T
em
pe
ratu
re (
'C)
0.05
0.10
0.15
0.20
0.25
Ta
n_
De
lta
Ma
x.
Pe
ak
Po
ints
Fig. 4. The tan delta max peak (glass transition) temperatures (blue line) and peak height values (gray bars) of neat PA 6 and PA 6-based NFCs
PEER-REVIEWED ARTICLE bioresources.com
Erbas Kiziltas et al. (2016). “Fiber-polyamide composites,” BioResources 11(2), 4758-4769. 4765
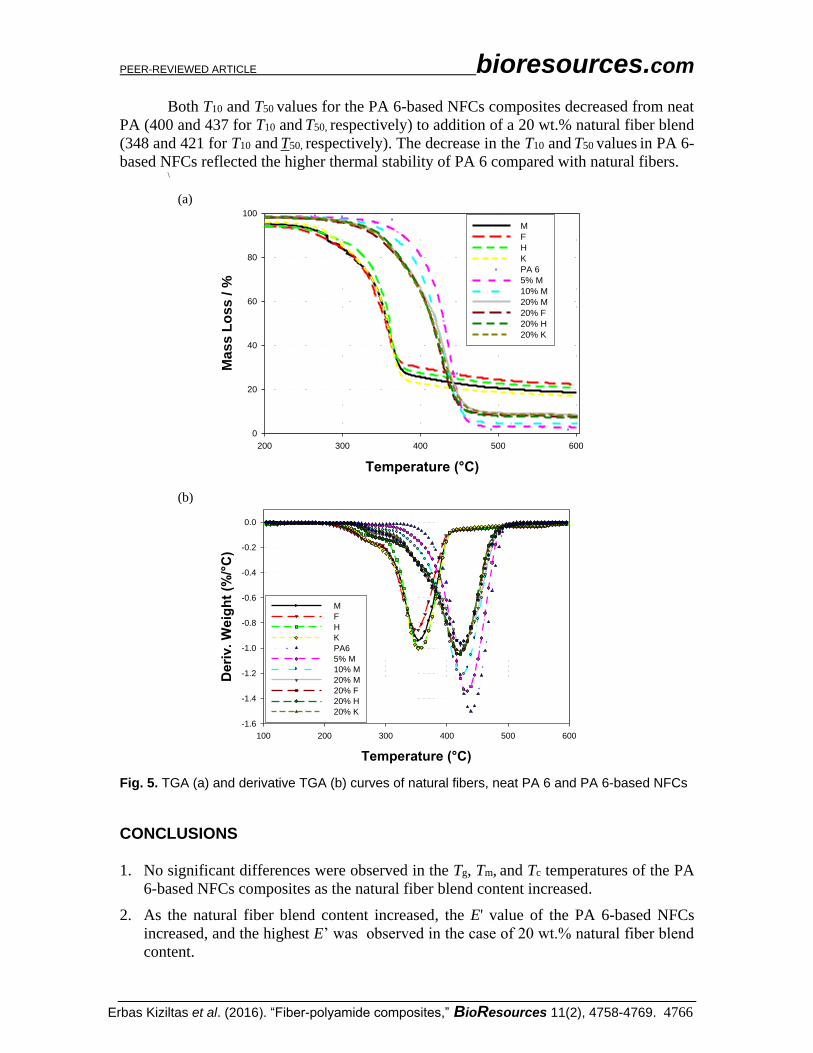
Thermogravimetric analysis (TGA) provides a useful method of determining the
thermal stability of the natural fibers during the heating process based on mass change;
therefore, it is important that natural fibers show considerable thermal stability at high
temperature (220 C) at least for a few minutes. Figure 5(a) shows the characteristic
thermal behavior data of the natural fiber blend, single-type fibers, and PA 6-based NFCs
in an inert TGA atmosphere. Three stages of mass loss were observed for all natural fibers,
including single fibers and natural fiber blend. The initial stage extended up to 120 C and
corresponded to the evaporation of moisture, free water, etc. The second occurred between
270 and 290 C during the thermal depolymerization or decomposition of hemicelluloses.
Cellulose decomposes in the range of 350 to 375 °C, which corresponds to the third weight
loss stage (Monteiro et al. 2012; Ozen et al. 2013). The TGA curves of natural fiber blend-
filled Nylon 6 composites were also divided into three regions. In the first region, the initial
weight loss of less than 7 wt.% was below 200 °C, and the second region showed 70 wt.%
loss up to 500 °C. The third region extends to 600 °C and corresponded to >75 wt.% loss.
Thus, the degradation temperatures of neat polymer and natural fiber blend-Nylon 6
composites were different. From the published literature, nylon 6 showed a single-stage
degradation at 452 °C, while natural fiber blend-Nylon 6 composites showed two
degradation stages between 372 and 450 °C (Kiziltas et al. 2011). As the natural fiber
content increased, the thermal stability of the PA 6-based NFCs decreased slightly. It was
concluded that natural fibers have lower rapid thermal degradation onset temperatures
compared with Nylon 6 composites because of the higher onset temperature of PA 6. The
results in Fig. 5(b) confirmed that as the fiber content increased, the main DTG peak shifted
to a lower temperature for PA 6-based NFCs.
In contrast, the final ash contents (residual weight at the end of TGA measurement)
of the composite samples were proportionally increased from around 2 (neat PA 6) to 9%
(20 wt.% natural fiber blend content) as the natural fiber content increased (Table 3), which
indicated that even if rapid thermal degradation onset occurred earlier, the composite
materials became more resistant in extreme environments as their natural fiber content
increased. The temperatures at 10% weight loss (T10) and 50% weight loss (T50) for the
natural fibers, neat PA 6 and the PA 6-based NFCs composites are shown in Table 3.
Table 3. T10 ,T50, and Ash Content at 600 °C for the Neat PA6 and PA 6-NFCs from TGA Curve
Sample Name Temperature at 10%
Mass Loss (°C) Temperature at 50%
Mass Loss (°C) Ash Content at
600 °C (%)
M 279.4 (0.7) 357.9 (0.5) 18.5 (0.3)
F 269.2 (2.9) 355.9 (0.8) 22.4 (0.6)
H 285.0 (1.9) 357.8 (1.1) 17.2 (1.6)
K 281.2 (1.8) 360.7 (0.5) 20.8 (0.4)
PA 6 399.6 (1.2) 437.3 (3.0) 1.7 (0.3)
5% M 377.0 (1.0) 431.0 (1.0) 2.8 (0.1)
10% M 362.1 (1.9) 421.8 (3.8) 4.3 (0.1)
20% M 348.5 (1.9) 420.9 (2.5) 8.7 (1.0)
20% F 341.1 (2.0) 416.0 (1.3) 7.8 (0.4)
20% H 349.7 (0.8) 416.0 (3.1) 7.3 (0.1)
20% K 346.1 (2.7) 417.2 (2.5) 8.2 (0.1
Parenthesis indicates standard deviation
PEER-REVIEWED ARTICLE bioresources.com
Erbas Kiziltas et al. (2016). “Fiber-polyamide composites,” BioResources 11(2), 4758-4769. 4766
Both T10 and T50 values for the PA 6-based NFCs composites decreased from neat
PA (400 and 437 for T10 and T50, respectively) to addition of a 20 wt.% natural fiber blend
(348 and 421 for T10 and T50, respectively). The decrease in the T10 and T50 values in PA 6-
based NFCs reflected the higher thermal stability of PA 6 compared with natural fibers. \
Temperature (°C)
200 300 400 500 600
Ma
ss L
os
s /
%
0
20
40
60
80
100
M
F
H
K
PA 6
5% M
10% M
20% M
20% F
20% H
20% K
Temperature (°C)
100 200 300 400 500 600
Deri
v. W
eig
ht
(%/°
C)
-1.6
-1.4
-1.2
-1.0
-0.8
-0.6
-0.4
-0.2
0.0
M
F
H
K
PA6
5% M
10% M
20% M
20% F
20% H
20% K
Fig. 5. TGA (a) and derivative TGA (b) curves of natural fibers, neat PA 6 and PA 6-based NFCs
CONCLUSIONS
1. No significant differences were observed in the Tg, Tm, and Tc temperatures of the PA
6-based NFCs composites as the natural fiber blend content increased.
2. As the natural fiber blend content increased, the E' value of the PA 6-based NFCs
increased, and the highest E’ was observed in the case of 20 wt.% natural fiber blend
content.
(a)
(b)

PEER-REVIEWED ARTICLE bioresources.com
Erbas Kiziltas et al. (2016). “Fiber-polyamide composites,” BioResources 11(2), 4758-4769. 4767
3. The tan δmax peak temperatures from DMTA were not significantly shifted as the natural
fiber blend content increased, while tan δmax peak values decreased from 0.19 for PA 6
to and 0.12 for 20 wt.% natural fiber blend-filled PA 6 composites.
4. As the natural fiber blend content increased, the thermal stability of the PA 6-based
NFCs decreased; however, the residual weight increased from ~ 2% for the neat
polymer to 9% for addition of 20 wt.% natural fiber.
5. Incorporation of a 20 wt.% natural fiber blend showed comparable DSC and TGA
results to the addition of 20 wt.% single type fibers.
6. Higher E’ from sub-ambient temperatures to 125 °C and thermal stability until 275 °C
from TGA curves suggested that PA 6-based NFCs are superior for critical under-the-
hood applications in the automotive industry.
ACKNOWLEDGMENTS
Funding was provided by the Maine Agricultural and Forest Experiment Station
(MAFES) project ME09615-08MS. Part of this manuscript was presented at the 2012 SPE
Automotive Composites Conference & Exhibition (ACCE), Troy, MI, USA. This is 3470th
paper of the Maine Agricultural and Forest Experiment Station.
REFERENCES CITED
de Arcaya, P. A., Retegi, A., Arbelaiz, A., Kenny, J. M., and Mondragon, I. (2009).
“Mechanical properties of natural fibers/polyamides composites,” Polym. Composite.
30(3), 257-264. DOI: 10.1002/pc.20558
Arsad, A., Suradi, N. L., Rahmat, A. R., and Danlami, J. M. (2013). “The influence of
kenaf fiber as reinforcement on recycled polypropylene/recycled polyamide-6
composites,” IJPT 17(2), 149-162. DOI: 10.1007/s12588-013-9055-7
Birch, A., Dal Castel C., Kiziltas, A., Mielewski, D., and Simon, L. (2015).
“Development of cost effective and sustainable polyamide blends for automotive
applications,” in: SPE Automotive Composites Conference & Exhibition, Troy, MI,
USA, pp. 1-10.
Cho, J. W., and Paul, D. R. (2001). “Nylon 6 nanocomposites by melt compounding,”
Polymer 42(3), 1083-1094. DOI: 10.1016/S0032-3861(00)00380-3
Chow, W. S., and Mohd Ishak, Z. A. (2007). “Mechanical, morphological and rheological
properties of polyamide 6/organo-montmorillonite nanocomposites,” Express.
Polym. Lett. 1(2), 77-83. DOI: 10.3144/expresspolymlett.com
Fornes, T. D., and Paul, D. R. (2003). “Crystallization behavior of Nylon 6
nanocomposites,” Polymer 44(14), 3945-3961. DOI: 10.1016/S0032-
3861(03)00344-6
Goitisolo, I., Eguiazabal, J. I., and Nazabal, J. (2008). “Effects of reprocessing on the
structure and properties of polyamide 6 nanocomposites,” Polym. Degrad. Stabil.
93(10), 1747–1752. DOI:10.1016/j.polymdegradstab.2008.07.030

PEER-REVIEWED ARTICLE bioresources.com
Erbas Kiziltas et al. (2016). “Fiber-polyamide composites,” BioResources 11(2), 4758-4769. 4768
Graff, G. (2005). “Under-hood applications of nylon accelerate,”
(http://www.omnexus.com/resources/articles/article.aspx?id=9660), Accessed 22
February 2016.
Huda, M. S., Drzal, L. T., Ray, D., Mohanty, A. K., and Mishra, M. (2008). “Natural-
fiber composites in the automotive sector,” in: Proporties and Performance of
Natural-Fibre Composites , K.L. Pickering (Ed.), CRC Press LLC, Boca Raton, FL,
USA, pp. 221-261.
Joshi, S. V., Drzal, L. T., Mohanty, A. K., and Arora, S. (2004). “Are natural fiber
composites environmentally superior to glass fiber reinforced composites?” Compos.
Part. A-Appl. S. 35(3), 371-376. DOI: 10.1016/j.compositesa.2003.09.016
Karsli, N. G., and Aytac, A. (2013). “Tensile and thermomechanical properties of short
carbon fiber reinforced polyamide 6 composites,” Compos. Part. B. Eng. 51, 270-
275. DOI:10.1016/j.compositesb.2013.03.023
Kim, H. S., Yang, H. S., Kim, H. J., Lee, B. J., and Hwang, T. S. (2005). “Thermal
properties of agro-flour-filled biodegradable polymer bio-composites,” J. Therm.
Anal. Calorim. 81(2), 299-306. DOI: 1388-6150/S20.00
Kim, H. S., Kim, S., Kim, H. J., and Yang, H. S. (2006). “Thermal properties of bio-flour-
filled polyolefin composites with different compatibilizing agent type and content,”
Thermochim. Acta 451(2), 181-188. DOI: 10.1016/j.tca.2006.009.013
Kiziltas, A., Gardner, D. J., Han, Y., and Yang, H. S. (2010). “Thermal properties of
microcrystalline cellulose-filled PET–PTT blend polymer composites,” J. Therm.
Anal. Calorim. 103(1), 163-170. DOI: 10.1007/s10973-010-0894-6
Kiziltas, A., Gardner, D. J., Han, Y., and Yang, H. S. (2011). “Dynamic mechanical
behavior and thermal properties of microcrystalline cellulose (MCC)-filled nylon 6
composites,” Thermochim. Acta 519(1-2), 38-43. DOI: 10.1016/j.tca.2011.02.26
Leao, A. L., Rowell, R., and Tavares, N. (1998). “Applications of natural fibers in
automotive industry in Brazil-thermoforming process,” in: Science and Technology
of Polymers and Advanced Materials: Emerging Technologies and Business
Opportunities, Prasad, P. N., Mark, J. E., Kandil, S. H., and Kafafi, Z. H. (eds.),
Plenum Press, New York, NY, USA, pp. 763-781.
Lucintel. (2015). Global Natural Fiber Composite Market 2015-2020: Trends, Forecast,
and Opportunity Analysis, Lucintel LLC, Irving, TX, USA,
(http://www.lucintel.com/reports/chemical_composites/global_natural_fiber_compos
ite_market_2015_2020_trends_forecast_and_opportunity_analysis_december_2015.
aspx).
MacDermont, C. P., and Shenoy, A. V. (1997). Selecting Thermoplastics for Engineering
Applications (2nd Ed.), CRC Press, Boca Raton, FL, USA.
Miri, V., Elkoun, S., Peurton, F., Vanmansart, C., Lefebvre, J. M., Krawczak, P., and
Seguel, R. (2008). “Crystallization kinetics and crystal structure of nylon6-clay
nanocomposites: Combined effects of thermomechanical history, clay content, and
cooling conditions,” Macromolecules 41(23), 9234-9244. DOI: 10.1021/ma801804y
Monteiro, S. N., Calado, V., Rodriguez, R. J. S., and Margem, F. M. (2012).
“Thermogravimetric behavior of natural fibers reinforced polymer composites – An
overview,” Mater. Sci. Eng: A 557, 17-28. DOI: 10.1016/j.msea.2012.05.109
Njuguna, J., Wambua, P., Pielichowski, K., and Kayvantash, K. (2011). “Natural fibre-
reinforced polymer composites and nanocomposites for automotive applications,” in:
Cellulose Fibers: Bio- and Nano-Polymer Composites, Kalia, S., Kaith, B. S., and
Kaur, I. (eds.), Springer, New York, NY, USA, pp. 661-700.
PEER-REVIEWED ARTICLE bioresources.com
Erbas Kiziltas et al. (2016). “Fiber-polyamide composites,” BioResources 11(2), 4758-4769. 4769
Ozen, E., Kiziltas, A., Erbas Kiziltas, E., and Gardner, D. J. (2012). “Natural fiber
blends-filled engineering thermoplastic composites for the automobile industry,” in:
SPE Automotive Composites Conference & Exhibition, Troy, MI, USA, pp. 1-12.
Ozen, E., Kiziltas, A., Erbas Kiziltas, E., and Gardner, D. J. (2013). “Natural fiber
blend—nylon 6 composites,” Polym. Composite. 34(4), 544-553. DOI:
10.1002/pc.22463
Petersson, L., Kvien, I., and Oksman, K. (2007). “Structure and thermal properties of
poly(lactic acid)/cellulose whiskers nanocomposite materials,” Compos. Sci. Technol.
67(11-12), 2535-2544. DOI: 10.1016/j.compscitech.2006.12.012
Racz, L., Jr, B. P., Pozsgay, A., and Pukanszky, B. (2004). “Polyamide 6/montmorillonite
nanocomposites: Effect of interaction on structure and properties,” Prog. Coll. Pol.
Sci. 125, 96-102. DOI: 10.1007/b13929
Santos, P. A., Spinace, M. A. S., Fermoselli, K. K. G., and De Paoli, M. A. (2007)
“Polyamide-6/vegetal fiber composite prepared by extrusion and injection molding,”
Compos. Part. A-Appl. S. 38(12), 2404-2411. DOI:
10.1016/j.compositesa.2007.08.011
Santos, P. A., Giriolli, J. C., Amarasekera, J., and Moraes, G. (2008). “Natural fibers
plastic composites in automotive applications,” in: SPE Automotive Composites
Conference & Exhibition, Troy, MI, USA, pp. 1-9.
Seydibeyoglu, M. O., and Oksman, K. (2008). “Novel nanocomposites based on
polyurethane and micro fibrillated cellulose,” Compos. Sci. Technol. 68(3-4), 908-
914. DOI: 10.1016/j.compscitech.2007.08.008
Sherman, L. (1999). “Natural fibers: The new fashion in automotive plastics,” Plastics
Technology (October 1999), (http://www.ptonline.com/articles/natural-fibers-the-
new-fashion-in-automotive-plastics).
Tajvidi, M., and Feizmand, M. (2009). “Effect of cellulose fiber reinforcement on the
temperature dependent mechanical performance of nylon 6,” J. Reinf. Plast. Comp.
28(22), 2781-2790. DOI: 10.1177/0731684408093875
Vedoy, D. R. L. (2012). Development of Methodologies for Improving Thermal Stability
of Plant Fibers for Application in Thermoplastic Composites, Ph.D. Dissertation,
University of Waterloo, Waterloo, ON, Canada.
Wu, Q., Liu, X., and Berglund, L. A. (2001). “An unusual crystallization behavior in
polyamide 6/montmorillonite nanocomposites,” Macromol. Rapid Comm. 22(17),
1438-1440. DOI: 10.1002/1521-3927(20011101)22:17<1438::AID-
MARC1438>3.0.CO;2-U
Wunderlich, B. (2005). Thermal Analysis of Polymeric Materials, Springer, New York,
NY, USA, pp. 609-610.
Xie, S., Zhang, S., Wang, F., Liu, H., and Yang, M. (2005). “Influence of annealing
treatment on the heat distortion temperature of nylon-6/montmorillonite
nanocomposites,” Polym. Eng. Sci. 45(9), 1247-1253. DOI: 10.1002/pen.20359
Zhao, D., and Zhou, Z. (2014). “Applications of lightweight composites in automotive
industries,” in: Lightweight Materials from Biopolymers and Biofibers, H. Xu, X.
Yu, and Y. Yang, (Eds.), American Chemical Society, Washington, D. C., USA.
Article submitted: January 22, 2016; Peer review completed: March 17, 2016; Revised
version received: March 22, 2016; Accepted: April 3, 2016; Published: April 13, 2016.
DOI: 10.15376/biores.11.2.4758-4769