thermal aging effect on the mechanical properties of ... · thermal aging effect on the mechanical...
TRANSCRIPT

J. Mater. Environ. Sci. 6 (10) (2015) 2795-2803 Belaid et al.
ISSN : 2028-2508
CODEN: JMESCN
2795
Thermal aging effect on the mechanical properties of polyester fiberglass
composites
S. Belaid
*1, S.F. Chabira
1, P. Balland
2, M. Sebaa
1, S. Belhouideg
2
1Mechanics laboratory , UniversityAmar Telidji, 3000 Laghouat, Algéria.
2SYMME
laboratory ,Univ. Savoie, , F-74944 Annecy, France.
Received 29 Jan 2015, Revised 15 Sept 2015, Accepted 16 Sept 2015 *Corresponding Author. E-mail: [email protected]
Abstract In this work, the mechanical properties of polyester fiberglass , which is subjected to accelerated thermal aging, have been
evaluated for different periods (30, 60, 90 and 120 days). The aging temperature was fixed to 80 °C. It has been observed
that the mechanical properties of this material are strongly affected by thermal aging. As the aging time increases, the
elastic modulus decreases of about 50% and the stress at break decreases of approximately 22%. This can be explained by
the changes undergone by the microstructure of the matrix and by the fiber-matrix debonding and fiber degradation.
The experimental results obtained by tensile test performed on test samples for the studied material are then compared with
those got by numerical simulations.
Keywords: Thermal aging, mechanical properties, tensile test, polyester fiberglass composite
1. Introduction Current knowledge concerning the aging effect on the mechanical behavior of polyester fiberglass composites
leads to oversized nesign and therefore expensive.Composite materials are often presented as the materials of
the future in reason of their potential for innovation that offer. reinforced polyester glass fiber composites are
increasingly used in several areas such as aerospace, automotive, shipbuilding and offshore oil [1].These
materials present many advantages; low weight, high stiffness-to-weight and strength-to-weight ratios.
Unsaturated polyester resins reinforced with glass fibers are widely used for the construction of large structures
(i.e. Pools, tanks, pipes, containers, car bodies, roofs....) in aggressive environments (chemical, humidity,
thermal) . Properties of fiber reinforced polymer are relatively well known by scientists and engineers, but there
are still many concerns about their durability and their performance under severe environmental conditions
[2].Several environmental factors can cause the ageing that occurs within fibers reinforced polymers, such as
moisture [3–5], water absorption [6–8] and elevated temperature [9, 10].The environmental effect on two
different epoxy resins with woven glass reinforcement was studied by Sookay et al. [11].The mechanical
behavior of fiber reinforced polymer composites can be strongly influenced by the temperature and material
microstructure [12]. Fiber reinforced polymer composites are sensitive to temperature variations as a result of
induced thermal stresses between the fibers and polymer matrix [13] which arises due to their distinct thermal
expansion coefficients. At elevated temperatures, differential thermal expansion of fiber and matrix may lead to
the formation of micro cracks at the fiber/polymer interface [14]. The fiber–matrix interface also becomes
sensitive to aggressive reactions under the exposure of high temperature environment, which can lead to the
degradation of both of the fibers and the matrix [15]. The polyester fiber glass composite studied in this paper will be used in the manufacture of bath tubs and tanks.
To perform this study the material has been aged in oven at temperature about 80 °C, for an overall duration of
120 days. The change of the mechanical properties has been checked every 30 days (monthly interval). The
elastic modulus and the Failure stress have been measured and compared. Then, the experimental results have
been compared with those obtained with numerical simulations.

J. Mater. Environ. Sci. 6 (10) (2015) 2795-2803 Belaid et al.
ISSN : 2028-2508
CODEN: JMESCN
2796
2. Experimental procedures 2.1. Materials
The studied composite material is an orthotropic laminate. It is protected from the surrounding environment by a
pigmented resin layer: the gelcoat EUROGEL GCP. This laminate consists of 6 plies stacked fiberglass-
polyester. The used resin is unsaturated orthophthalic polyester SIRESTER FS 0993LP. It is diluted to styrene,
moderately reactive and has a low viscosity. Its properties are given in Table 1. The role of the resin is to tie the
fibers (cohesion role), and to ensure the transmission of the stresses. Furthermore, the matrix ensures the
strength of the material in the transverse direction of the reinforcement. The woven fibers provide a mechanical
strength to the material (traction, compression, fatigue ....) as shown in figure 1. The reinforcement is a planar
fabric of fiber glasses (woven fiber glasses of “E” type) as cross taffeta of basis weight 500g/m2, those
properties are given in Table 2. The catalyst is a peroxide solution, called PMEC50 (solution with 50% by
weight of methyl ethyl ketone peroxide). Two types of specimens were prepared: samples with 2% of catalyst
and samples with 3% of catalyst. With the addition of the catalyst, hardening at room temperature takes only a
few hours. Table 3 shows the properties of the resin after the addition of catalyst.
Figure 1:Schematic representation of woven fabric architecture [17]
Table 1:Mechanical properties of polyester resin
Elasticity modulus
[GPa]
Shear modulus
[GPa]
Poisson ratio
[-]
Density
[g/cm3]
3.4 1.2 0.4 1.10
Table 2:Mechanical properties of fiberglass
Elasticity modulus
[GPa]
Shear modulus
[GPa]
Poisson ratio
[-]
Density
[g/cm3]
72 29 0.25 2600
Table 3: Mechanical properties of polyester resin after the addition of catalyst
Flexural modulus
[GPa]
Barcol hardness
Flexural strength
[MPa]
Temperature of deflection
under load (LDT) [°C]
3.4 40 105 75
2.2. Elastic behavior of the material
The advantage of the polyester fiberglass composites and composite materials in general is that they are
designed and dimensioned such that the mechanical stresses are applied in the fiber direction. It follows that the
propertie are different according to the loading direction, thus the material is anisotropic. The studied material is
orthototropic. For an orthotropic laminate material, only six independent elastic constants are needed to describe
the elastic behavior. If the isotropic axis is in the direction 3, the independent elastic parameters are: three
Young modulus (E1, E2 and E3), two Poisson’s coefficients (ν12 and ν13) and a shear modulus ( G13).
The following relationships must be satisfied:

J. Mater. Environ. Sci. 6 (10) (2015) 2795-2803 Belaid et al.
ISSN : 2028-2508
CODEN: JMESCN
2797
j
ji
i
ij
EE
νν= i ,j =1,2,3
(1)
3
31
1
13
EE
νν=
(2)
The compliance matrix can be written as follows (formula (3)) (Voigt’s notation):
−−
−−
−−
=
12
13
23
33
32
3
31
2
21
22
23
1
13
1
12
1
100000
01
0000
001
000
0001
0001
0001
G
G
G
EEE
EEE
EEE
S
νν
νν
νν
(3)
Figure 2 defines the principal axes for a typical woven fiber reinforced lamina. Axis 1 is along the fiber length
and represents the longitudinal direction of the lamina; axes 2 and 3 represent the transverse in-plane direction
and the thickness direction respectively.
Figure 2: Laminate reference axes.
2.3. Preparations of the composites
The unidirectional composites with crossed plies were prepared by contact molding. The volume fraction of
fiberglass is 40% and the volume fraction of resin is 60%. The aluminum mold surfaces are 500x 500 mm²; they
are coated with an unmoldingMOLD WIZ-F57 CN. Six fiber sheets of dimension 380 x 250 mm² are pre-cut in
a roll for each test tube to develop. The molding method consists in sequentially depositing on one face of the
mold a resin layer, then a reinforcing layer(See figure 3).The surface of the mould is thoroughly cleaned to be
ready for the use, by removing any dust and dirt from it.The impregnation is made of the reinforcement by a
manual operation using a roller or brush (doubling and rolling) to remove the larger bubbles. This operation is
repeated several times to obtain the desired thickness of the test tube. So, in our case 6 plies (0 ° and 90 ° to the
fibers directions) were superposed.The against mold is put in place without any clamping. The hardening is
done at room temperature. A Plates with thickness of 3.2 mm are obtained. 2.4. Aging conditions
The studied material is placed directly after post-hardening in an oven at 80°C to accelerate the aging
phenomenon. The overall duration of aging time is 120 days. The sampling is done every 30 days to control the
change of the mechanical properties. The mechanical tests are run after the sample is removed from the oven,
once the sample has reached an equilibrium temperature, but not too long after to avoid uncontrolled structural
evolution.

J. Mater. Environ. Sci. 6 (10) (2015) 2795-2803 Belaid et al.
ISSN : 2028-2508
CODEN: JMESCN
2798
Figure 3:Preparation of polyester fiberglass composites.
2.5. Tensile testing
The tensile tests were performed on an INSTRON 5569 machine at a fixed crosshead speed of 2mm.min-1
. The
specimens are cut into rectangular shapes, according to the standard ISO574-4 for composite materials, with the
following dimensions: Width = 25 mm, length = 250 mm and thickness = 3.2 mm (See figure 4). The Modulus
is calculated from the slope of the stress–strain curve.
Figure 4: Tensile test pieces of glassfiber polyester.
3. Results and discussion 3.1. Young modulus determination
The mechanical properties of the unaged laminates made in the laboratory are determined, this is required to
characterize the initial properties of the material.
Figure 5 and Figure 6 show a representative stress–strain curve of the studied material for samples with 2% and
3% of catalyst, respectively.It is found that the aging time (at 80 °C) affects the mechanical properties.There is
no plastic domain.
Figure 5: Experimental curve of the tensile test for polyester fiber glass composites with 2% of catalyst.
Young’s modulus (E) is measured during the tensile test according to the direction 1 (see Figure 2). It is
determined from the slope of the linear part of the stress–strain curve. The Young’s modulus for the composites
0.0
20.0
40.0
60.0
80.0
100.0
120.0
140.0
0.0% 0.5% 1.0% 1.5% 2.0%
Str
ess
[MP
a]
Strain [%]
2% - unaged
2% - 30 days
2% - 60 days
2% - 90 days
2% - 120 days

J. Mater. Environ. Sci. 6 (10) (2015) 2795-2803 Belaid et al.
ISSN : 2028-2508
CODEN: JMESCN
2799
with 2% and 3% of catalyst decrease progressively with aging time as shown in Figure 7. These curves show the
influence of the catalyst concentration and the aging time on the elastic modulus. Aging time tends to decrease
the Young’s modulus while the catalyst concentration improves it. Above 55 days of heat treatment, an abrupt
decrease of the slope is observable for both catalyst concentrations.The initial Young’s modulus is E= 8.15 GPa
for the composite with 2% of catalyst and E=8.3 GPa for the one with 3%.
When the sample moves from the unaged stage to aged one (i.e. 120 days at 80 °C), the Young’s modulus
decreases by 55% for the composite with 2% of catalyst and 47% for the composite with 3% of catalyst. In fact,
at the end of the aging protocol the Young’s modulus becomes E= 3.7 GPa for sample with 2% and E=4.4 GPa
for the sample with 3% of catalyst. It can be thus considered that the catalyst tends substantially to improves the
Young’s modulus of the material.
Figure 6 : Experimental curve of the tensile test for polyester fiber glass composites with 3% of catalyst.
Figure 7: Young’s modulus variation according to aging time at 80 °C for polyester fiberglass composites with
2% of catalyst and 3% of catalyst.
3.2 Evolution of the failure stress
Figure 8 shows the variation of the failure stress versus aging time for polyester fiberglass composites with 2%
and 3% of catalyst. In both cases the failure stress decreases with aging time. In general, the failure stress of the
matrix is lower than that of the fibers. Indeed, the breaking by cracking occurs earlier for the resin than for the
glass fibers. In machine direction, the tensile failure stress cannot be calculated from the mixtures law, because the
deformation of the matrix at break is greater than that of the fibers. However in the elastic domain of the fibers,
the material remains homogenous.When the breaking of a fiber occurs, the load is transmitted by the interface
by shearing to the matrix, broken fibers retain partially their ability to carry the load for a short distance (20 to
100 times the fiber diameter, critical length).When the average length of the broken fibers is below the critical
0.0
20.0
40.0
60.0
80.0
100.0
120.0
140.0
0.0% 0.5% 1.0% 1.5% 2.0%
Str
ess
[MP
a]
Strain [%]
3% - unaged
3% - 30 days
3% - 60 days
3% - 90 days
3% - 120 days
0
2
4
6
8
10
0 30 60 90 120
You
ng’s
mod
ulu
s E
[G
Pa]
Aging time [Day]
2% of catalyst
3% of catalyst

J. Mater. Environ. Sci. 6 (10) (2015)
ISSN : 2028-2508
CODEN: JMESCN
length, the breaking of the material occurs, with a
failure stress decreases by 31% for
catalyst.
Before aging the failure stress is of about
samples with 3% of catalyst. For the last stage of aging, the
with 2% of catalyst and 110 MPa for those of 3%. As
tends to slightly improve the failure
Figure 8 : Failure stress variation according to to aging time at 80 °C for polyester fiber glass composites with
3.2 SEM micrographs
The scanning electron micrographs (SEM) of fiberglass composite polyester are shown in Figure 9.
temperature causes a degradation of the glass fiber polyester c
degradation. The effects of the thermal aging
temperatures, and it can be considered as the main cause of the matrix failure at long
Figure 9 : SEM microg
4. Numerical modeling and numerical simulations
4.1 Material Characterization
The material elastic properties of the lamina
These properties are Young’s moduli (E
ratios (ν12, ν13, and ν23), inplane shear modulus (G
Figure 2. The elastic constants of the unidirectional composite
relations of equation (4) [16].
0
20
40
60
80
100
120
140
160
0
Fa
ilu
rest
ress
[M
Pa
]
) 2795-2803
2800
of the material occurs, with a loosening of the fibers. With ageing (120 days, 80 °C) the
stress decreases by 31% for the samples with 2% of catalyst and by 21% for
stress is of about 130 MPaforthe samples with 2% of catalyst
For the last stage of aging, the failure stress decreases till 90 MPa for the samples
with 2% of catalyst and 110 MPa for those of 3%. As for the modulus, it can be considered that the catalyst
failure stress of the material.
stress variation according to to aging time at 80 °C for polyester fiber glass composites with
2% of catalyst and 3% of catalyst.
The scanning electron micrographs (SEM) of fiberglass composite polyester are shown in Figure 9.
degradation of the glass fiber polyester composite, by fiber-matrix debonding and fiber
degradation. The effects of the thermal aging will be well observable if the material is exposed to relatively high
temperatures, and it can be considered as the main cause of the matrix failure at long-
SEM micrograph of a sample aged during 90 days at 80 °C
Numerical modeling and numerical simulations
The material elastic properties of the laminate of test specimens are determined through the law of
These properties are Young’s moduli (E1 – in direction 1, E2 – in direction 2, E3 –
nplane shear modulus (G12) and transverse shear moduli (G
of the unidirectional composite are calculated using the law of
30 60 90 120
Aging time [Days]
Belaid et al.
With ageing (120 days, 80 °C) the
21% for the samples with 3% of
samples with 2% of catalyst and 140MPa for the
stress decreases till 90 MPa for the samples
for the modulus, it can be considered that the catalyst
stress variation according to to aging time at 80 °C for polyester fiber glass composites with
The scanning electron micrographs (SEM) of fiberglass composite polyester are shown in Figure 9. The
matrix debonding and fiber
observable if the material is exposed to relatively high
-term.
days at 80 °C
ermined through the law of mixtures.
– in direction 3), Poisson’s
) and transverse shear moduli (G13 and G23) as referred in
alculated using the law of mixtures by the
2% of catalyst
3% of catalyst
J. Mater. Environ. Sci. 6 (10) (2015) 2795-2803 Belaid et al.
ISSN : 2028-2508
CODEN: JMESCN
2801
( )( )
( )( )
( )23
223
12
1
12
2
1
12
23
12
2
1
12
1
1
υ
υυυ
υυ
υυυ
υυυ
+=
−−+
−++=
+−
−+
+=
+=
−−+
−++=
+=
EG
VGGGG
VGGGGGG
E
E
E
E
VV
VV
VEEEE
VEEEEEE
VEVEE
fmfmf
fmfmf
m
m
mm
m
m
mmff
mmff
fmfmf
fmfmf
m
mmff
(4)
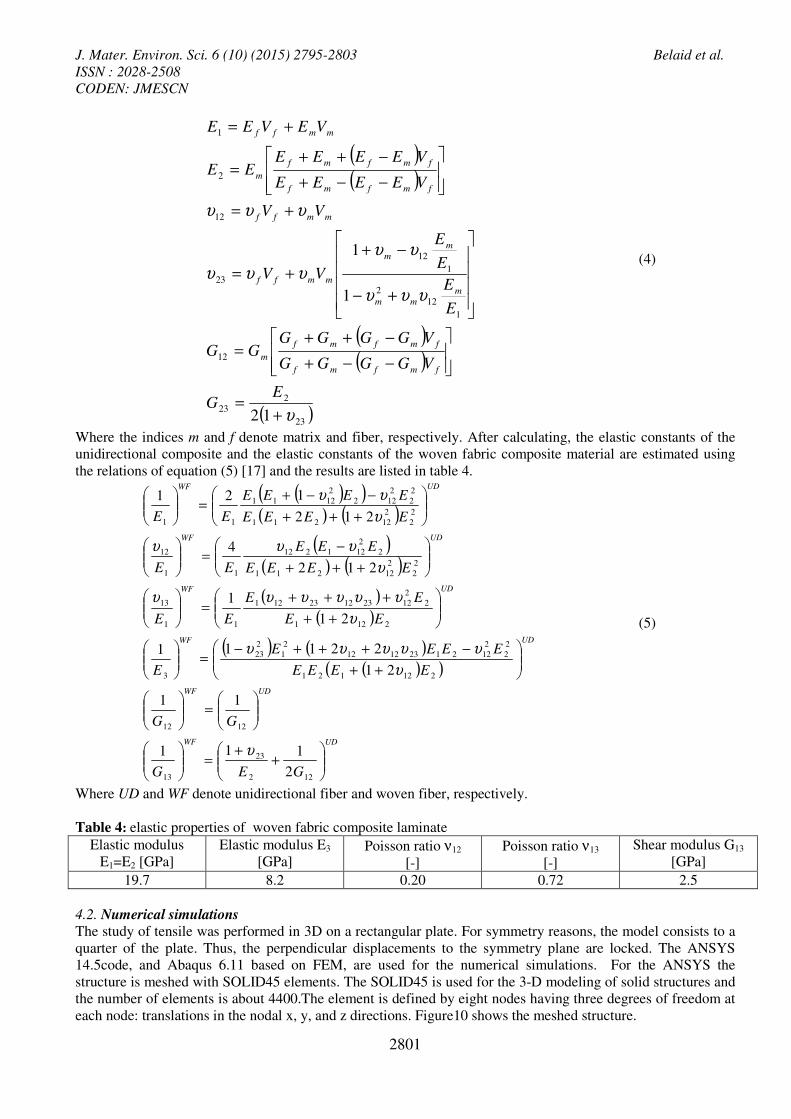
Where the indices m and f denote matrix and fiber, respectively. After calculating, the elastic constants of the
unidirectional composite and the elastic constants of the woven fabric composite material are estimated using
the relations of equation (5) [17] and the results are listed in table 4.
( )( )( ) ( )
( )( ) ( )
( )
( )
( ) ( )
( )( )
UDWF
UDWF
UDWF
UDWF
UDWF
UDWF
GEG
GG
EEEE
EEEE
E
EE
EE
EE
EEEE
EEE
EE
EEEE
EEEE
EE
+
+=
=
++
−+++−=
++
+++=
+++
−=
+++
−−+=
122
23
13
1212
212121
2
2
2
1221231212
2
1
2
23
3
2121
2
2
12231223121
11
13
2
2
2
12211
2
2
121212
11
12
2
2
2
12211
2
2
2
122
2
1211
11
2
111
11
21
22111
21
1
212
4
212
121
υ
υ
υυυυυ
υ
υυυυυυ
υ
υυυ
υ
υυ
(5)
Where UD and WF denote unidirectional fiber and woven fiber, respectively.
Table 4: elastic properties of woven fabric composite laminate
Elastic modulus
E1=E2 [GPa]
Elastic modulus E3
[GPa] Poisson ratio ν12
[-]
Poisson ratio ν13
[-]
Shear modulus G13
[GPa]
19.7 8.2 0.20 0.72 2.5
4.2. Numerical simulations
The study of tensile was performed in 3D on a rectangular plate. For symmetry reasons, the model consists to a
quarter of the plate. Thus, the perpendicular displacements to the symmetry plane are locked. The ANSYS
14.5code, and Abaqus 6.11 based on FEM, are used for the numerical simulations. For the ANSYS the
structure is meshed with SOLID45 elements. The SOLID45 is used for the 3-D modeling of solid structures and
the number of elements is about 4400.The element is defined by eight nodes having three degrees of freedom at
each node: translations in the nodal x, y, and z directions. Figure10 shows the meshed structure.

J. Mater. Environ. Sci. 6 (10) (2015)
ISSN : 2028-2508
CODEN: JMESCN
(a)
Figure 10:(a) The meshed structure with SOLID45
Figure 11 shows the comparison between experimental results and those obtained by numerical simulation.
depicts the stress according to the strain
between the numerical simulation and experime
simulation with ANSYS and Abaqus.
following table, seem reasonable, despite the defects acquired by the composite during t
process, particularly air bubbles and uncertainties experimental devices used
Table 5: Comparison of the ultimate properties obtained by simulation (ABAQUS and ANSYS) and
experimentally
ANSYS simulation 3%
strain stress
0,00%
0,13% 9,99375
0,25% 19,9875
0,63% 49,9687
0,95% 74,9531
1,27% 99,9375
1,59% 124,922
Figure 11 : numerical and experimental comparison for unaged
0
20
40
60
80
100
120
0.0%
Str
ess
[MP
a]
) 2795-2803
2802
(b)
The meshed structure with SOLID45 element, (b)Traction simulation results by
shows the comparison between experimental results and those obtained by numerical simulation.
depicts the stress according to the strain for an unaged polyester fiber glass with 3% of catalyst
between the numerical simulation and experiment was observed. This difference is
us. The results obtained by the two numerical models that are presented in the
following table, seem reasonable, despite the defects acquired by the composite during t
process, particularly air bubbles and uncertainties experimental devices used.
Comparison of the ultimate properties obtained by simulation (ABAQUS and ANSYS) and
ANSYS simulation 3% ABAQUS Simulation 3% Experimental 3% unaged
strain stress Strain
0 0,05% 4,20469 0,1%
9,99375 0,10% 8,41153 0,3%
19,9875 0,17% 14,7258 0,5%
49,9687 0,28% 24,2064 0,7%
74,9531 0,45% 38,4477 0,9%
99,9375 0,72% 59,8557 1,1%
124,922 1,09% 92,071 1,3%
1,67% 140,627 1,5%
numerical and experimental comparison for unaged samples with 3% of catalyst
0.5% 1.0% 1.5%Strain [%]
Experimental 3%
unaged
Numerical Ansys
Belaid et al.
element, (b)Traction simulation results by abaqus.
shows the comparison between experimental results and those obtained by numerical simulation. It
an unaged polyester fiber glass with 3% of catalyst.A difference
nt was observed. This difference is relatively low for the
The results obtained by the two numerical models that are presented in the
following table, seem reasonable, despite the defects acquired by the composite during the manufacturing
Comparison of the ultimate properties obtained by simulation (ABAQUS and ANSYS) and
Experimental 3% unaged
Stress
8,1
24,3
40,5
56,7
72,9
89,1
105,3
121,5
samples with 3% of catalyst
Experimental 3% -
Numerical Ansys

J. Mater. Environ. Sci. 6 (10) (2015) 2795-2803 Belaid et al.
ISSN : 2028-2508
CODEN: JMESCN
2803
Conclusion This paper presents a mechanical characterization of polyester fiberglass composites thermally aged at a temperature of
80 °C well above the Tg (53.17°c ) of the matrix. A sampling has been performed every 30 days and for each aging stage a
tensile test has been carried out.
The variations of the elastic modulus and the failure stress have been investigated on two types of samples, the first with a
catalyst concentration of 2% and the second with 3%. It has been found that the mechanical properties of the polyester
fiberglass composite are strongly affected by the thermal aging. The young's modulus and the stress sensibly decreased due
to the effect of temperature. The Young’s modulus decreased significantly with aging time (it goes from 6% after 30 days
to 55% after 120 days for the sample with 2% of catalyst and from 5% after 30 days to 47% after 120 days with 3% of
catalyst). This, leave us consider that it is of prime importance to protect polyester fiberglass composite structures against
exposure to high temperatures to avoid undesirable loss of performances in their environment of use. In the present work a
comparison between stress-strain curves obtained experimentally with those simulated by numerical models for enlarged
samples have shown a good result. In the forthcoming communications it will be presented the same type of work, but this
time for aged samples and physico-chemical characterizations will be carried out to make possible to link the changes of
the mechanical properties to that of the microstructure. Creep experiment can be regarded as a good approach to
characterize mechanically the material. It will bring additional information thanks to other mechanical greatnesses, which
will show the progressive material degradation. This technique is already developed in our laboratory by one of our
colleagues working on polyethylene film degradation.
Acknowledgements-The authors would like to acknowledge the assistance rendered by Pr Laurent TABOUROT (Univ.Savoie,
SYMME, F-74944 Annecy, France.) during the bench work of this research.
References 1. Blau P. J., ASM Hand book, Materials Park, ASM International, 18 (1992) 45.
2. Bakis C.E., Bank L.C., Brown V.L., Cosenza E., Davalos J.F., Lesko J.J., Machida A., Rizkalla S.H.,
Triantafillou T.C., J. Compos.Construct.6 (2002) 73.
3. Zafar A., Bertocco F., Schjødt-Thomsen J., Rauhe JC.,J.Compos .Sci.Technol.,72 (2012) 656.
4. Aniskevich K., Aniskevich A., Arnautov A., Jansons J., J. Compos. Struct., 94 (2012) 2914.
5. Jiang X., Kolstein H., Bijlaard FSK., J.Composites .Part B, 45 (2013) 407.
6. Oufqir S. A., Bloom P. R., Toner B. M., EL Azzouzi M., J. Mater. Environ. Sci., 6 (8) (2015) 2179.
7. J. Marzbanrad, A. Paykani, A. Afkar, M. Ghajar J. Mater. Environ. Sci., 4 (1) (2013) 63-74.
8. V. K. Singh J. Mater. Environ. Sci.,4 (1) (2013) 113-116. 9. Engindeniz M., Zureick A., J. Compos. Construct, 12 (2008) 355.
10. Wang Y., Meng J., Zhao Q., Qi S., J. Mater. Sci.Technol., 26 (2010) 572–6.
11. Sookay N.K., Klemperer C.J., Verijenko V.E., J.Compos. Struct., 62 (2003) 429.
12. Ray BC.,J .Colloid Interface Sci, 298, (2006) 111.
13. Etches J., Potter K., Weaver P., Bond I., J. Compos A: Appl. Manuf. Sci., 40 (2009) 1240.
14. Dorsal L.T., Rich M.J., Lloyd P.F., J. Adhesion, 16 (1982) 1.
15. Bockenheimer C., Fata D., Possart W.,J .Appl. Polym. Sci., 91 (2004) 369.
16. Vinson J.R., Sierakowski R.L., The behavior of structures composed of composite materials, (2008) 39.
17. Akkerman R., J.Composites.Part B, 37 (2006) 108.
(2015) ; http://www.jmaterenvironsci.com