thepro sperityof!europe'smno!industry ! at!thedawnof!5g
TRANSCRIPT

Department of Technology Management and EconomicsDivision of Science, Technology and Society CHALMERS UNIVERSITY OF TECHNOLOGYReport No. E2017:058Gothenburg, Sweden 2017
The prosperity of Europe's MNO industry at the dawn of 5G An empirical study on the performance and regulatory environment of mobile network operators in Europe
Master of Science Thesis in the Management and Economics of Innovation Program
Ármann Óskarsson Magnús Már Guðjónsson

REPORT NO. E2017:058
The Prosperity of Europe’s MNO Industry at the Dawn of 5G
An Empirical Study on the Performance and Regulatory Environment of Mobile Network Operators in Europe
Ármann Óskarsson Magnús Már Guðjónsson
Tutor, Chalmers: Erik Bohlin
Department of Technology Management and Economics CHALMERS UNIVERSITY OF TECHNOLOGY
Göteborg, Sweden 2017

The Prosperity of Europe’s MNO Industry at the Dawn of 5G An Empirical Study on the Performance and Regulatory Environment of Mobile Network Operators in Europe
Ármann Óskarsson & Magnús Már Guðjónsson
© ÁRMANN ÓSKARSSON & MAGNÚS MÁR GUÐJÓNSSON, 2017.
Master’s Thesis E2017:058 Department of Technology Management and Economics Division of Science, Technology and Society Chalmers University of Technology SE-412 96 Gothenburg, Sweden Telephone: + 46 (0)31-772 1000
Reproservice Göteborg, 2017

Acknowledgements The writing of this thesis would not have been possible without the help of several people. From
our department at Chalmers we thank our supervisor Erik Bohlin for valuable guidance
throughout the process, Ibrahim Kholilul Rohman for his insights and help with statistics work
and Sven Lindmark for helping in the initiation phase of the research. We also want to thank
Lars Egeland from Ericsson for his valuable expert´s insights into the field of the study.
To our friends and families, thank you for showing us patience throughout the process.

Abstract The purpose of writing this paper was to analyze, empirically and from a regulatory perspective,
the performance of European mobile operators to determine the critical factors influencing the
industry's future prosperity. European operators have been faced with strict competition
regulations and have seen diminishing revenues and margins, especially compared to other
developed regions in the world. Relevant literature regarding market maturity and competition
strategy was reviewed, as well as two contradicting theories on the effects of competition
intensity on investment incentives. Relevant topics and concepts were briefly described, before
the regulatory framework was reviewed both from the regulatory body and industry perspective.
The regulatory review in the paper showed polarizing opinions on regulatory objectives
between Europe's regulatory body and the mobile industry. The regulatory body perspective is
that competition is the main driver of effective investment and end-user benefits. While the
industry perspective is that the competitive environment is deterring investment because
MNO´s are not only faced with internal competition but also from Over-the-top (OTT) players.
The studies empirical findings on the comparison of Europe to other developed regions revealed
that one of the main discrepancies between the regions was Europe's static investment intensity.
The findings also showed that the state of the European markets seem to have reached market
saturation. The empirical findings on the competition and investment relations show no
indication that competition through increased market concentration results in increased
investment intensity. On the contrary, the countries that had less competitive market structures
showed to be more profitable and invested more into their networks. The paper concludes that
if the EU is to achieve its ambitious goals for a timely deployment of 5G networks, regulation
must conform objectives towards incentivizing investment. This can entail a switch from ex-
ante to ex-post regulatory approaches and a more favorable stance towards market
consolidation.
Key words: Mobile Network Operators, Telecommunications Policy, 5G, Competition &
Investment, Wireless Industry, ICT, EU Regulation.

1
Table of Contents 1. Introduction ........................................................................................................................................ 4
1.1 Background .................................................................................................................................... 4
1.2 Purpose and research questions ................................................................................................... 5
1.3 Scope and delimitations ................................................................................................................ 5
1.3.1 Scope ...................................................................................................................................... 5
1.3.2 Delimitations .......................................................................................................................... 6
1.4 Report outline ............................................................................................................................... 7
2. Literature review and related concepts .............................................................................................. 8
2.1 Market saturation ......................................................................................................................... 8
2.1.1 Effects of diffusion on profitability ......................................................................................... 8
2.1.2 Effects of maturity on competitive environment ................................................................... 8
2.1.3 Diminishing value of network effects in a high market penetration ...................................... 9
2.3 Strategies in the competitive environment ................................................................................... 9
2.3.1 Porter’s generic strategies ..................................................................................................... 9
2.3.2 Blue and red ocean market space ........................................................................................ 10
2.3.3 Red ocean ............................................................................................................................. 10
2.3.4 Blue ocean ............................................................................................................................ 11
2.4 Literature on competition and investment ................................................................................. 11
2.5 Empirical studies on competition and investment linkage ......................................................... 14
2.5.1 The effects on unit prices ..................................................................................................... 14
2.6 Regulation in telecommunications .............................................................................................. 15
2.7 The new ICT ecosystem ............................................................................................................... 16
2.7.1 The four layers of the new ICT ecosystem ........................................................................... 17
2.7.2 Boundaries between layers and transactions within them .................................................. 18
2.7.3 Relationships within the system ........................................................................................... 18
2.7.4 Role of investment and innovation ...................................................................................... 20
3. Methodology ..................................................................................................................................... 21
3.1 Research design and method ...................................................................................................... 21
3.2 Narrative description of how the research evolved .................................................................... 21
3.2.1 Desk research on the industry .............................................................................................. 21
3.2.2 Interviews and meetings with Ericsson representatives ...................................................... 22
3.2.3 Data gathering and processing ............................................................................................. 22
3.2.4 Literature review .................................................................................................................. 22
3.2.5 Research questions formulation .......................................................................................... 22

2
3.2.6 Data analysis and report writing .......................................................................................... 23
3.3 Data collection and processing .................................................................................................... 23
3.3.1 Quantitative data ................................................................................................................. 23
3.3.2 Qualitative data .................................................................................................................... 24
3.4 Data analysis ................................................................................................................................ 25
3.4.1 Causality ............................................................................................................................... 25
3.4.2 Variables ............................................................................................................................... 25
3.5 Methods of data analysis ............................................................................................................ 27
3.6 Research quality and validity ....................................................................................................... 27
3.6.1 Triangulation ........................................................................................................................ 27
3.6.2 Stakeholders ......................................................................................................................... 28
4 Regulatory review .............................................................................................................................. 29
4.1 Background .................................................................................................................................. 29
4.1.1 5G action plan ...................................................................................................................... 31
4.2 Regulatory body perspective ....................................................................................................... 32
4.2.1 BEREC publications ............................................................................................................... 32
4.3. Industry perspective ................................................................................................................... 37
4.3.1 GSMA .................................................................................................................................... 37
4.3.2 Boston Consulting Group report .......................................................................................... 40
4.3.3 5G manifesto ........................................................................................................................ 40
4.4 Net neutrality .............................................................................................................................. 41
4.4.1 What is net neutrality? ......................................................................................................... 41
4.4.2 Arguments for net neutrality ................................................................................................ 42
4.4.3 Arguments against net neutrality ......................................................................................... 42
5. The state of the MNO industry and Europe’s position amongst developed regions ........................ 43
5.1 Empirical findings and descriptive analysis ................................................................................. 43
5.1.1 Region categorization used in the chapter ........................................................................... 43
5.1.2 MNO market size .................................................................................................................. 43
5.1.3 Launch of LTE networks ........................................................................................................ 46
5.1.4 Revenue and margins ........................................................................................................... 46
5.1.5 Investment ........................................................................................................................... 50
5.1.6 Competitive Environment .................................................................................................... 54
5.2 Discussion .................................................................................................................................... 59
5.2.1 Challenges facing MNOs -‐ Negative trends in performance indicators ................................ 59
5.2.2 Is Europe reaching maturity? ............................................................................................... 59
5.2.3 Competitive environment and strategy ............................................................................... 60

3
5.2.4 European investment ........................................................................................................... 60
5.2.5 Conclusion ............................................................................................................................ 61
6. Competition and investment in Europe -‐ Regulatory implications ................................................... 62
6.1 Country data ................................................................................................................................ 62
6.1.1 Competition and profitability ............................................................................................... 62
6.1.2 Competition and investment .................................................................................................... 63
6.1.3 Investment and profitability linkage .................................................................................... 65
6.2 Operator data .............................................................................................................................. 66
6.2.1 Market share analysis ........................................................................................................... 66
6.2.2 Incumbent-‐ vs. neck & neck markets ................................................................................... 68
6.3 Discussion .................................................................................................................................... 72
6.3.1 Industry ................................................................................................................................ 72
6.3.2 Firms: Market share ............................................................................................................. 72
6.3.3 Firms: Incumbent vs neck & neck ......................................................................................... 72
6.4 Regulatory analysis ...................................................................................................................... 73
6.4.1 Regulatory objectives ........................................................................................................... 73
6.4.2 Regulatory fit ........................................................................................................................ 73
7. Conclusions ....................................................................................................................................... 76
7.1 Research question 1 .................................................................................................................... 76
7.2 Research question 2 .................................................................................................................... 77
7.3 Research question 3 .................................................................................................................... 78
7.4 Further research .......................................................................................................................... 79
List of figures ......................................................................................................................................... 80
List of tables .......................................................................................................................................... 81
References ............................................................................................................................................. 82

4
1. Introduction The aim of this introductory chapter is to provide context to the research paper by giving a
background and purpose of the study. It will shed light on the empirical context, identification
of a research gap and propose three research questions aimed to guide the way to fulfil its
purpose. The scope and delimitations of the study will be discussed, and finally the report
outline will be presented.
1.1 Background The widespread adoption of the smartphone in the mid 2000’s has changed the way internet
users in the developed world behave significantly. The need for being connected wherever we
go has created a demand for mobile data, which has expanded enormously over the past decade
(GSMA, 2017c). Traditionally, mobile operators are required to invest heavily in infrastructure
to meet the increasing demand, especially when a new technology standard is being
implemented (such as 3G and LTE). The consumers, however, don’t seem to be willing to spend
any more on their mobile bill even though the service they are getting is getting better every
year.
Thus, the mobile communications industry has in recent years seen diminishing revenue and
decreased profits (GSMA, 2017c) even though data consumption is increasing on a near
exponential level and more and more societies are becoming digitally connected. So, what is
the reason for the sub-optimal state of the industry? One reason is that subscriber growth is
slowing down and the industries are becoming increasingly more internally competitive in
saturated markets (Merrill Lynch - Bank of America, 2017). Another impairing factor to the
industry is the recent prevalence of over-the-top (OTT) providers competing in the same market
as mobile operators undercutting the latter’s revenues significantly in voice and text messages,
without having to abide by industry specific regulations like mobile operators must do (GSMA,
2017c). The industry has been calling for improvements and clarification of the regulations,
with GSMA, the largest trade body representing mobile operators stating “regulation should be
flexible and technology-agnostic, and applicable to all competitors providing the same service”
(GSMA, 2017b).

5
The European sector is by most measures in worse condition than their counterparts in other
developed regions around the world. European operators are seeing steeper declines in revenues
and stagnating subscriber growth, or even a decline. These factors seem to be having a
substantial influence on investment incentives and it is evident in Europe's lower capital
expenditure compared to North America and Asia-Pacific (Merrill Lynch - Bank of America,
2017).
This report will investigate data on telecom operators in developed countries over the period of
2006-2015. This year span is particularly interesting because it covers the initial dispersion of
3G and 4G/LTE mobile networks in these regions.
1.2 Purpose and research questions The purpose of this study is to empirically analyze the performance of European mobile
operators to determine the critical factors influencing the industry's future prosperity. The goal
of the research is to analyze mobile operator data by a theoretical framework and assess if there
is alignment between findings and the EU's strategic policy objectives. The following research
questions will be answered in order to fulfill the study's purpose.
RQ1: Since the deployment of 3G networks, how has the mobile operator industry in Europe
performed compared to other developed regions?
RQ2: What do the empirical findings indicate about the competitive dynamics in the European
telecommunications ecosystem?
RQ3: What are the regulatory implications of the study’s findings in regards to future policy
objectives in the EU?
1.3 Scope and delimitations
1.3.1 Scope
The scope of the research will be limited to analysis on developed regions that include countries
listed in table 1.

6
Europe North America Asia-‐Pacific Austria Netherlands Canada USA Australia New Zealand Belgium Norway Hong Kong Singapore Denmark Portugal Japan Finland Spain France Sweden Germany Switzerland Italy UK
Table 1 -‐ Regions used in the study
The study’s quantitative empirical data is also limited to data from Merrill Lynch's “Global
Wireless Matrix” reports from 2012 to 2016, which include data for the period of 2006-2015.
Classification of which countries are counted as a developed market are also taken directly from
the GWM reports. The database will be described in more detail in the methodology chapter.
1.3.2 Delimitations
The main limitations of this study lie in the usage of a large chunk of numerical data to represent
the state of the real world. Mark Twain, amongst others, is believed to have said that “there are
three kinds of lies: lies, damned lies, and statistics.” In a research like this, the researcher has
to be completely aware of what the data is telling him and what it does not tell. The results of a
regression analysis like conducted for this paper can and will indicate whether variables are
correlated, but it cannot tell anything about causation (Easterby-Smith et.al, 2015). The data
can only act as a further support of an existing theory, or as a basis for the creation of a new
one.
It is not only the analysis of the data that limits this research, it is also the data itself. It is up to
the authors to choose which variables are used as a proxy for certain performance indicators,
based on the data on hand. Much of the analysis is based on the assumption that capital
expenditure is a measurement of infrastructure investment, and that market share distribution
is an indication of whether a market is highly concentrated or not. This is merely based on the
authors' best judgement and knowledge in the field. Some of the variables in the database are
estimates made by the report writers, notably service revenue, which is an estimated number
based on the total revenue of the mobile operators. Most often, annual reports of firms do not
specify where their revenue comes from, since many of them have multiple revenue sources.
Another factor that might affect the quality of the data analysis is different purchasing power
amongst developed countries. A decision was made not to adjust the monetary data to

7
purchasing power, since that is outside the scope of the author’s expertise, and due to the fact
that the actual numbers (in US$) are quite interesting as they are.
The choice of variables as proxies for performance indicators will be further explained in the
methodology chapter later in the report.
1.4 Report outline The research report is divided into seven chapters. After the introductory chapter (1) you are
reading now comes a review of the related theories and literature on the subject, joined with
brief descriptions of a few important concepts (2). After that, the methodology used while
conducting this research will be described (3), followed by a chapter that reviews the strategic
outlines of the European regulatory authorities in the field (4). The next chapter includes
empirical data and analysis that relates to the first research question, i.e. the state of the mobile
operator industry and how Europe is performing compared to the other developed markets (5).
In the following chapter, firstly effects of competition on investment in Europe will be
presented empirically and analyzed, and secondly the strategy and regulations of governing
bodies in Europe will be compared to the empirical findings of the report (6). Lastly, a
concluding chapter wraps up the researches findings and discusses possible further research (7).

8
2. Literature review and related concepts This chapter aims to shed light on to existing theory of the subjects of this study. Furthermore,
it will explain related concepts that we feel are essential for the reader to familiarize with
before reading the following chapters.
2.1 Market saturation
2.1.1 Effects of diffusion on profitability
Everett Rogers put forward a model for diffusion of innovation to the market which Sahin
(2006) reviewed. In his paper, Rogers defines innovation as “an idea, practice or a project that
is perceived as new by an…unit of adoption” (Sahin, 2006). He goes on to categorize adopters
of innovation into five groups, innovators, early adopters, early maturity, late maturity and
laggards. Lindmark (2006) points out that the further into the diffusion process you go, the less
resources the adopters have to spend on the innovation, late maturity and laggards aren’t willing
to spend as much on the novelty as the earlier ones and they are “the most cautious when it
comes to risking their limited resources on a new technology.”
As Wood (1990) points out, the diffusion model is often linked with the Product Life Cycle
model, which originated at least before 1934 when Schumpeter wrote about it. It describes the
life cycle of a product or a technology, dividing it’s life into four stages, introduction, growth,
maturity/saturation and decline. According to Wood, a mature/saturated market faces a
declining rate of sales growth as the number of customers unaware of the product/technology
lowers with each sale. She goes on to say that “according to the classical theory, profits peak
in the growth stage, level off, and then begin declining during the maturity stage” (Wood,
1990).
2.1.2 Effects of maturity on competitive environment
What happens when the market penetration gets close to its peak is that companies can’t just
expand the market to up their sales numbers anymore. To increase their market share or sales
number, they must win it over from other companies. According to e.g. Parrish et.al. (2006),
the way to win over market share from existing firms is a niche strategy, in other words, product
differentiation. Competing on price will eventually lead to diminishing returns (Schumpeter,
1942), whereas investing in innovative solutions is the way forward (Parrish et. al, 2006).
9
2.1.3 Diminishing value of network effects in a high market penetration
Network Effect is a term used when a technology’s value relies greatly on the size of the
customer base (Katz, Shapiro, 1994). This was definitely the case for wireline phones in the
past, as well as first and second generation cell phones as the more people connected to the
network, the higher the value was for new and potential customers. In a saturated marketplace
where penetration is close to it’s peak, the network effects for the whole system are not as big
of a selling point as they used to be. Almost everyone that will ever own a cell phone already
owns one. In the MNO industry, the network effects are shifting towards the operator level
rather than technology level, with the operators offering e.g. free calls and SMS within their
network.
In network effect literature, a special emphasis is put on the phenomena of critical mass, i.e. the
minimum number of users of a system for it to be financially viable for its facilitators.
Economides and Himmelberg (1995) say that for most markets, that number is high and go on
to say that either the markets “do not exist” or they have significant coverage (have reached the
critical mass). That should also apply to MNOs, either they have a significant customer base or
they cannot be operated. The higher the critical mass is, the lower the competition level can be
and fewer operators on the market.
2.3 Strategies in the competitive environment
2.3.1 Porter’s generic strategies
The traditional view of competition strategy consists of a two-dimensional matrix. Firms choose
between trying to obtain leadership in terms of quality or price, and furthermore they face a
decision whether to target the whole customer base or try a segmented strategy with focus on
specific customer types (Grant, 2014). Michael Porter described these dynamics in the 1980s
which resulted in this framework being called “Porter’s generic strategies”.
According to Porter, firms that don’t make a decision on which strategy to pursue get “stuck in
the middle,” due to the inevitable trade-off between the two measurements (price and
differentiation). The third alternative is targeting a specific group of customers, who have
specific needs, which don't follow the general price-quality trade-off (Porter, 1980).

10
Figure 1 -‐ Porter´s generic strategies (Porter, 1980)
2.3.2 Blue and red ocean market space
According to Kim and Mauborgne (2004), the business universe can be divided into two
different sections, red ocean and blue ocean. They created those concepts from the metaphor of
an ocean, initially clear and blue that turns red when a bloody fight for demand has taken place.
Their theory aims to explain how to find an uncontested market space, or the “blue ocean” of
a particular market. Blue ocean strategy is the pursuit of this market space, opposed to a red
ocean strategy where a firm fights over existing demand/customer base. Corporate strategy can
be seen as a war, either you compete for a limited territory or you try to explore new land (Kim,
Mauborgne, 2004).
2.3.3 Red ocean
Kim and Mauborgne (2004) argue that the red ocean section is, by their definition, the existing
market space where firms have competed for some time for existing demand. This is similar to
what 18th and 19th century economists described as the world of diminishing returns, i.e. that
in a perfect competition, each player in the market has to settle for less and less contribution
margin of his sales/product as the market grows (Arthur, 1996). However, those theories were
written at a time when access to resources was the main competitive advantage that firms
pursued. Kim and Mauborgne (2004) say that in this world of red oceans, supply is overtaking

11
demand which leads to a harsher competitive environment, resulting in low return on
investment for the firms involved. In that world, competitive advantage either comes from
lower cost or product differentiation. There seems to be a consensus in the competitive
environment that there is a straight trade-off between those two factors. However, according to
the blue ocean theory, there is a way to bypass this trade-off.
2.3.4 Blue ocean
Kim and Mauborgne (2004) use the term blue ocean over an uncontested market space where
there is untapped demand. That is done either by breaking the boundaries of an existing market,
or by creating a completely new one. According to them, blue oceans are the engine of growth
of industries and economies. The common theme, according to their analysis, is that companies
pursuing a blue ocean strategy brake the trade-off between product differentiation (quality) and
cost leadership (low cost). According to Kim and Mauborgne, it is possible to catch the benefits
of both those factors, reducing cost while increasing the buyer's value. That is what they call
“value innovation,” spotting the things in a firm’s offering that’s highly costly, but adds little
or even negative value for the customer. By eliminating those costs, while increasing the
customer’s value of the product, firms are pursuing the blue ocean strategy. This value
innovation is rarely a technological one, rather it is a different offering of an already existing
technology or service, i.e. business model innovation. Their findings also include that it is often
incumbent firms that create those blue oceans (Kim, Kim, Yang, 2008).
In their book on the blue ocean strategy, Kim and Mauborgne (2004) take Circ du Soleil as an
example of a very successful execution of the strategy. By eliminating factors such as multiple
stages and animal acts, the circus could cut down cost dramatically while enriching the
spectators' experience, while they also added valuable aspects from the theatre industry such as
storytelling. With that, they created a new demand from people who before that would never
have attended a circus show.
2.4 Literature on competition and investment The linkage between competition and investment has long been an important focus point of
examination in economics. One of the first theoretical discussions on the subject dates to Adam
Smith's book, “The theory of moral sentiments” (Smith, 1756). In his work, Smith proposed the
idea that free markets would self-regulate under the conditions of competition, supply and

12
demand, and inherent self-interests. Smith’s ideology has since been the basis of a large number
of prominent economic theories on the dynamics of competition in economics. One in particular
is the SCP (structure-conduct-performance) paradigm, developed by Joe S. Bain (Bain, 1959),
widely considered one of the pillars of industrial organization theory. The essence of the SCP
paradigm is that an industry's performance is dependent on the conduct of firms within the
industry, which in turn are dependent on the structure of the market.
Since its introduction, the SCP paradigm has had two competing hypotheses: the “structure
performance hypothesis” and the “efficient structure hypothesis” (Edwards, Allen & Shaik
2005). The structure hypothesis states that there is a positive relationship between market
concentration and performance (measured by profits). The essential argument here is that firms
in concentrated markets will earn higher profits than those in less concentrated industries
because market concentration incentivizes firms to collude. This differs from the efficient
hypothesis as it does not take firm efficiency (measured by market share) into account. The
efficiency hypothesis states that there is a positive relationship between firm’s profits and
market structure. The reasoning here is that firms will reap increased profits due to their
efficiency activities rather than collusive activities such as the structure hypothesis suggests.
Both hypotheses however agree that competition through increased market concentration
contribute to increased industry performance.
Joseph Schumpeter holds a more cynical view on the benefits of competitive markets. In
arguably his most prominent work, “Capitalism, socialism and democracy”, he argues that
firms in less concentrated markets have greater incentives to invest then firms in competitive
markets. The core of the Schumpeterian argument is that firms seek to obtain a monopoly
position, and do so by heavily investing to improve their production capabilities. This results
in scale economy development that consequently leads to markets with a small number of firms
(Schumpeter, 1942).
Gilbert & Newbery (1982) concur with Schumpeter on the view that incumbents in less
competitive markets have more incentive to invest, but due to a term coined “the efficiency
effect”. Their reasoning is that incumbents are at more risk at losing market power to entrants
by not innovating and thus invest more. The argument here is that potential entrants seek to
invest in innovations in order to obtain technological advantage that enables them to overtake
13
the incumbent on the market. However, the incumbent is aware of this and invests heavily in
innovation to obtain the technological advantage itself.
Arrow (1962) takes an opposing position to Gilbert and Newbery (1982), and Schumpeter
(1942), in that monopolies are less likely to invest than firms in competitive markets. Arrow
focuses on the notion of “the replacement effect”, that corresponds to markets where
incumbents are technology leaders. He argues that a monopolistic firm has less incentive to
invest in process innovation because the more value the firm can contract from its current
technology the less it seeks to implement a new technology. Thus, if a monopoly invests to
improve its position it is only replacing itself when innovating. Arrow also focuses on the notion
of “escape-competition effect” in competitive markets. In this case firms are equally
competitive and investment objectives are aimed at obtaining optimal technology. The value
from obtaining the optimal technology is cost-reduction and provision of competitive
advantage. By this reasoning, Arrow argues that investment incentives in competitive
environments are inherently higher.
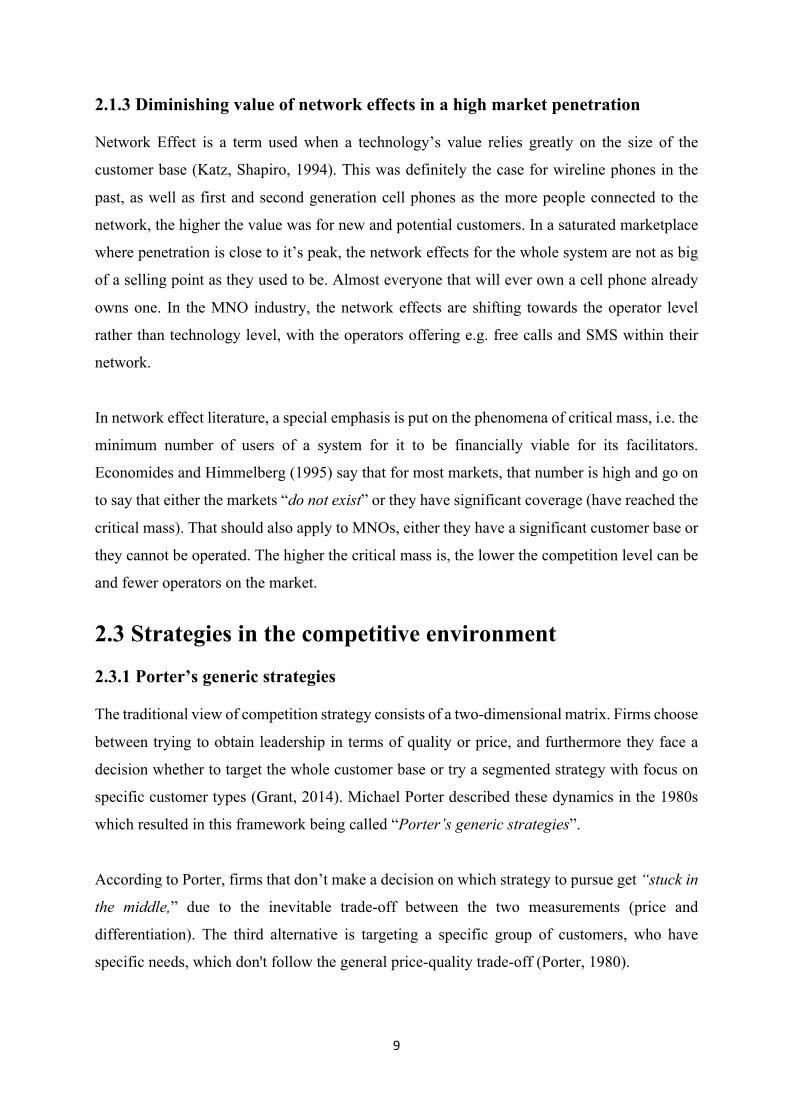
Empirical studies on the subject have revealed that there is an inverted-U relationship between
competition and investment in infrastructure (Aghion et. al (2005); Tingvall and Poldahl
(2006)). Aghion et. al (2005) build the framework for their reasoning upon the findings in
Aghion and Howitt (1992). In Aghion and Howitt (1992) their findings suggest that a by a
Schumpeterian economics framework a negative correlation exists between competition and
R&D growth. However, they also found a reverse effect, particularly in neck-and-neck
competitive industries where firms have similar technologies. The reason relates to Arrow's
(1962) escape-competition effect as they found a positive correlation between investment and
competition due to firms seeking to increase investment to obtain technology leadership for
competitive advantage. Aghion et. al (2005) integrate both the positive and negative
interrelationship between competition and investment into a single model that yielded their
previously mentioned inverted-U relationship findings.
Tingvall and Poldahl (2006) study aimed to test the legitimacy of Aghion et. al (2005) findings
on firm level data. Their results indicated that the inverted-U relationship was indeed supported
when competition was represented by the Herfindahl index but not when represented by price
cost margin. They argue that the reason for this is that the Herfindahl index results suggest that
14
breaking up monopolies tend to increases investment whereas the price cost margin results
show that the higher levels of competition reduce this incentive.
Figure 2 -‐ A schematic representation of different theories on the relationship between competition and investment.
2.5 Empirical studies on competition and investment linkage The literature on the relationship between competition and investment in wireless industries
have shown varying results. Garrone & Zaccagnino (2015) investigated this relationship within
telecommunications industries in OECD countries. Their results indicated that competition does
not have any significant effect on investments at firm or country level. Kim et. al (2011) found
that mandated provision of mobile virtual network operators (MVNO) market access related to
lowered investment incentives for MNOs thus indicating that competition by pro-entry
regulation has a negative effect on investment. Houngbonon and Jeanjean (2016) found an
inverted-U shape relationship between competition and investment by examining firms in the
wireless industry from a dynamic perspective. They suggest that a EBITA margin threshold of
about 40% is the optimal margin for investment intensity maximization of competition and
below this margin there must be a tradeoff between investment and competition.
2.5.1 The effects on unit prices
Jeanjean (2013) investigated what factors effecting in the telecommunications industry reduced
unit prices the most. In his research, he proposed a model that divided the effects of unit price
reduction into static and dynamic effects. Static effects of the model are competition and
operating costs. They are considered static because they are limited, that is you can only

15
increase or decrease competition to a certain extent and operating cost have a bare minimum.
The dynamic effects are time and investment; they are dynamic because investment is
cumulative and time only goes in one direction.
Jeanjean then tested the model on annual financial information from 20 countries between 2006
and 2012 (Jeanjean, 2015). The results on the static and dynamic effects contributing to unit
price reduction are presented in figure 3:
Figure 3 -‐ Comparison of static and dynamic effects on megabyte price reduction (Jeanjean, 2015)
His results show indication that investment is the main driver in reducing megabyte unit prices.
2.6 Regulation in telecommunications Telecommunications development has shown to have a considerable positive effect on
economic prosperity and social welfare on a national level (Röller & Waverman, 2001) These
findings underline the importance of policy measures that aim to support and foster adequate
business environments in telecom industries to prosper.
To comprehend the fundamental structure of present telecommunication regulation it is
important to understand the introduction of competition to the industry. Historically, telecom
service markets have been governed by monopoly, mainly because that type of system was the
most efficient solution. The pioneers of eroding the telecom monopoly system were Japan, the
US, and UK. They laid the groundwork for the dominant regulatory paradigm in telecoms

16
(DRPT) which has been the conventional approach to introducing healthy competition to a
telecom market with a dominant incumbent. In its simplicity, the DRPT aims to foster
competition by compelling the incumbent to grant a new entrant access to their network for a
reasonable price through suitable regulation. Despite being one the paradigms pioneers, the US
has disenchanted more and more from the conventional paradigm compared to Europe. This is
as a result of the Federal Communications Commission (FFC) abandoning some of its key
policies in network element unbundling in 2005 (Fransman, 2007).
Fransman (2007) points out that the DRPT is however not without its flaws and addresses three
main problems with the paradigm. The first and arguably most prominent problem is that the
paradigm lacks investment incentives for both the incumbent and entrant. The incumbent is
disincentivized to invest in its network due to it being mutually beneficial to its competitors that
have access to the network. Conversely, new entrants have little incentive to invest in their own
network because that would engage them in a facility based competition with a superior
incumbent in that area. The second problem Fransman points out is that the regulation is based
on a static theoretical framework and therefore does not adequately deal with the dynamic
nature of innovation and change. The third and last problem he mentions is that the paradigm
does not weigh the costs of regulatory failure against the benefits of regulation. He argues that
inherent problems in regulations like policy uncertainties and politicization of issues hamper
the process speed making it increasingly harder to keep up with the speed of technological
change.
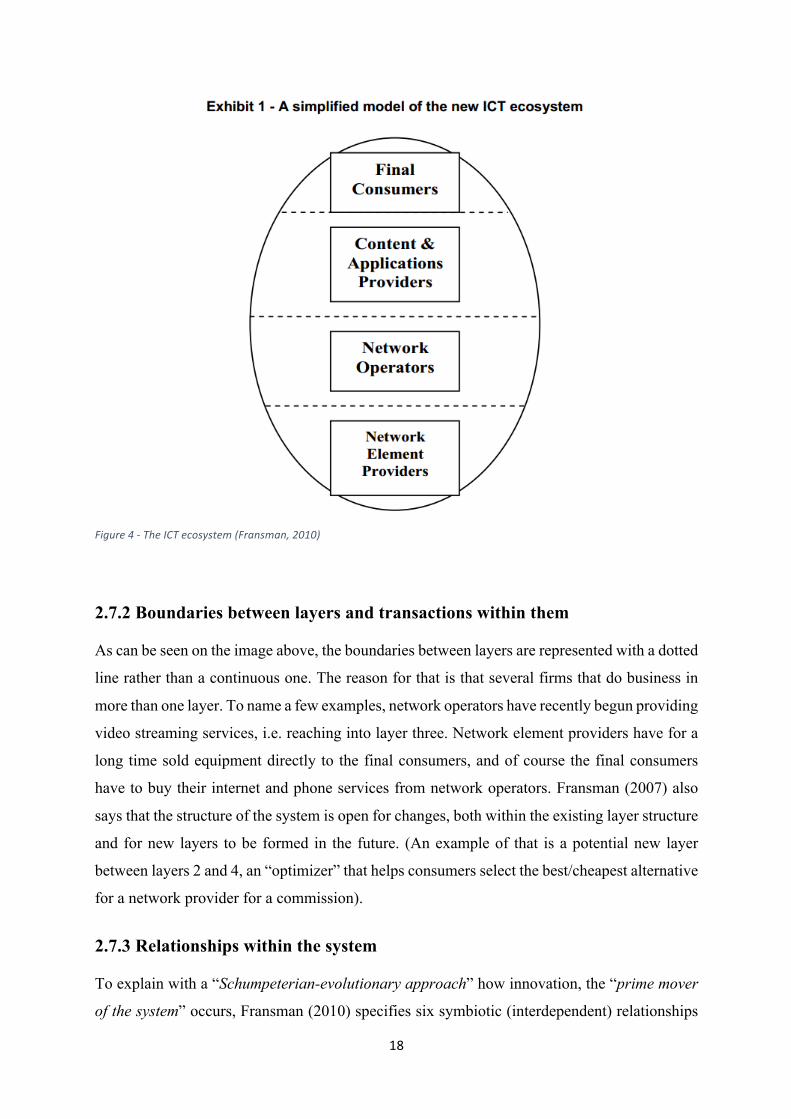
2.7 The new ICT ecosystem The new ICT (information and communication technology) ecosystem is a framework used to
better understand the structure and the dynamics between various players within the
telecommunication industry. The system is divided into four layers, network element providers,
network operators, content and application providers, and final consumers. The novelty in this
framework compared to previous one is the introduction of the third layer, and the relationships
it gave birth to. The framework gained recognition in the early- to mid-00’s when it was
becoming clearer what effects the increased internet access would have on the existing system.
According to Fransman (2010), with the birth of the “Web 2.0” it is the users that play a central
role in content creation and driving innovation (Fransman, 2010).

17
2.7.1 The four layers of the new ICT ecosystem
According to Fransman (2010), the first layer are the network element providers, or original
equipment manufacturers. They include equipment manufacturing firms such as Ericsson,
Microsoft and Nokia, as well as component manufacturers such as Intel that supply the OEMs
with e.g. microchips. Their cost structure is mostly R&D related cost and their revenue comes
from investments by layer two.
The second layer are the network operators, which aim to create value for their customers by
bundling together the equipment manufactured by layer one. When successful, the revenue from
their customers outweighs their investment, generating profit for the firms. They are the ones
with the biggest investment needs. This layer also includes the so-called (Mobile) virtual
network operator. Those are the firms that buy capacity from a first-tier operator and sell access
to it through their own sales means (Folger, 2016). This partially eliminates the huge need for
investment in infrastructure and allows smaller players to access the market.
The novelty in the new ICT ecosystem is layer three, the content and application providers or
over-the-top content providers (OTTs). They utilize on layer’s one and two investments and
equipment to provide content and generate value for the final consumers. Their revenue comes
from 1) their subscription fees and 2) selling access to their customers’ eyes, i.e. their attention
(commercials, surveys and such) and information about them (Fransman, 2010).
Layer four is the final consumer, the customers. They can be individuals, households, firms or
institutions. They purchase products, service or content from all three other layers and are the
root of revenue for the whole ecosystem.
Below is an image from Fransman’s article (2010) explaining the layering of players in the
ecosystem.
18
Figure 4 -‐ The ICT ecosystem (Fransman, 2010)
2.7.2 Boundaries between layers and transactions within them
As can be seen on the image above, the boundaries between layers are represented with a dotted
line rather than a continuous one. The reason for that is that several firms that do business in
more than one layer. To name a few examples, network operators have recently begun providing
video streaming services, i.e. reaching into layer three. Network element providers have for a
long time sold equipment directly to the final consumers, and of course the final consumers
have to buy their internet and phone services from network operators. Fransman (2007) also
says that the structure of the system is open for changes, both within the existing layer structure
and for new layers to be formed in the future. (An example of that is a potential new layer
between layers 2 and 4, an “optimizer” that helps consumers select the best/cheapest alternative
for a network provider for a commission).
2.7.3 Relationships within the system
To explain with a “Schumpeterian-evolutionary approach” how innovation, the “prime mover
of the system” occurs, Fransman (2010) specifies six symbiotic (interdependent) relationships

19
between the four layers. Each layer has a relationship with all the other three layers, and those
relationships are further categorized into four dimensions.
Figure 5 -‐ Relationships in the ICT ecosystem (Fransman, 2010)
Table 2 -‐ Dimensions of relationships (Fransman, 2010)
According to Fransman (2010), layer two engages in relationships of all dimensions. To begin
with, they purchase network elements from layer one, making that a financial flow (dimension
A) as well as a material flow (B). Their relationship with the customers is at once a financial
flow, information flow and an input flow into the innovation process. The customers pay with
their money for access to the network (A), providing information for the network operator about
their behavior and preferences (C), while learning about their operator’s offerings and price
structure (C). Layer one and two use the best bits of the first three dimensions to generate input
into their innovation process (D), using e.g. information about their customers’ preferences to
20
better fit their network to their needs. The relationship between layer two and three is of a highly
symbiotic nature. Not a lot of revenue goes from one to another, but neither of the layers would
exist without the other one as the dynamics are today. Layer three creates the demand for layer
two’s product, data, and layer two creates the mean through which the final customers access
layer three’s products. This relationship is the root of the net neutrality conflict. In a pro-net
neutrality environment, layer two is forbidden from selling a faster route in their network to
certain content providers. Zero rating policies, where it is essentially the content provider that
pays the network operator for the consumer’s data consumption for their services, is forbidden.
2.7.4 Role of investment and innovation
Fransman (2010) argues that there is “essentially a complementary relationship between
investment and innovation” in the ecosystem (Fransman, 2010). The biggest need for
investment in infrastructure falls on the network operators, with them having to purchase an
enormous amount of equipment to be able to provide services that at once fulfil rules,
regulations and coverage obligations and can still generate profit when access is sold to the
customers (Fransman). Here, competition is one of the main drivers of investment, and in effect
innovation. When faced with competition, network operators want to provide the best solutions
possible, engaging them in purchasing of a more expensive equipment. The equipment
providers are incentivized to spend more of their revenue on R&D to be able to offer the best
possible equipment (Fransman, 2010).

21
3. Methodology This chapter aims to cast light on the methods used in this research. Firstly, it will explain the
motivation for the research design and strategy, which will be followed by a brief description
of the research work process. After that, the data collection and processing will be described
along with the motivation for the choice of variables to measure various performance indicators
crucial for the analysis, which will be described in the following subchapter. Lastly, we include
a few words on research quality and validity.
3.1 Research design and method This research has several common features with what has been dubbed by academia as an
inductive research. An inductive research is described by e.g. Saunders et al. (2016) as a data
driven research approach, where theories are built upon gathered data. The conclusions of such
research is therefore not entirely certain, but they are probable based on the evidence of the
given data. However, since the purpose of this research evolved into seeing which theory the
data on hand supports, and whether and how it aligns with regulatory framework, this approach
can be seen as a hybrid of inductive and deductive research. The later stages of the research has
the characteristics of deduction, i.e. a formulation of a hypothesis and comparison to the data.
For an examination of the relationships of multiple variables, Saunders et al. (2016) suggests
that a quantitative is most appropriate. The data used in the research is mostly quantitative
secondary data collected from third party reports on the mobile network industry. To further
validate observational analysis of the quantitative data, a few interviews were conducted with
an expert in the field which also further deepened the authors’ knowledge in the field. The
interviews were semi-constructed, aimed to gain insight into an expert's point of view, guided
with a few questions but open for conversations.
3.2 Narrative description of how the research evolved
3.2.1 Desk research on the industry
The first few weeks of the research process were characterized with a broad desk research on
the ICT ecosystem, it’s layers and players and the dynamics within and between layers. Due to
an earlier project proposal, the authors dug deep into studying some of the most controversial

22
topics of the industry, such as quality of service, quality of experience and net neutrality.
Frequent meetings were held with potential supervisors, and the research field was decided.
3.2.2 Interviews and meetings with Ericsson representatives
Early in the research process, the authors met with a representative from Ericsson, who went
on to arrange a meeting with other Ericsson employees with high knowledge in the research
field. In that meeting, the authors' attention was somewhat redirected into the field of product
and service differentiation amongst mobile network operators. The attendees found the project
proposal interesting but very ambitious, and therefore were rather skeptical of whether it would
be viable given the limited time frame.
3.2.3 Data gathering and processing
With that in mind, the aim was now gathering empirical data as fast as possible to be able to
analyse it properly in time. The authors’ supervisor arranged for them to collaborate with one
of his PhD. student in Portugal. He had access to a huge set of data on mobile operators from
all over the world, and needed help to get it on the right format. That took the authors a few
weeks, after which they could use the data as they wanted for their analyses.
3.2.4 Literature review
The database included data on country as well as operator level. The authors now had access to
excessive data on operator’s capital expenditure, EBITDA margins, subscription numbers and
average revenue per user, to name a few variables. That opened a door to the field of
competition theory and effects on investment. The authors directed their attention to existing
literature on competition, both old and new and with different conclusions. Schumpeter had his
say on the subject as early as in the 1940’s, and since then at least three other theories on that
relationship have seen daylight. To add to that, in the earlier desk research done by the authors
they had stumbled upon reports and documents from European regulatory authorities that were
quite decisive in the conclusion that competition should be promoted in order to increase
investment in the field.
3.2.5 Research questions formulation
The research questions were quite easily formed with in mind that, a) the theories on the subject
were contradicting and b) regulatory authorities taking a strong stance on it, somewhat

23
contradicting the industry’s representatives’ opinions. The questions should ask which of the
theories the data on hand supports, and how it aligns with regulatory authority’s strategy for the
subject.
3.2.6 Data analysis and report writing
After consultation with their supervisor, the authors started conducting their data analysis and
report writing simultaneously.
3.3 Data collection and processing
3.3.1 Quantitative data
The core of this research is built upon a database from Bank of America - Merrill Lynch. Every
quarter, they give out a report called Global Wireless Matrix (GWM), a thorough report on the
mobile network industry. In each of these reports, information is gathered about the 50 largest
MNOs in the world, as well as the 50 biggest markets/countries and operators within them with
a market share of 5% or more. BofA-ML has experts in each region or country collect this data
for them and combine it in the previously mentioned GWM reports. The reports are available
for sale on BofA-ML’s business intranet, but hard to reach by the general public. A lot of work
is put into compiling the data from various sources so the reports are quite expensive, but due
to some earlier research work, Chalmers had access to it with permission to use the data for
academic purposes.
The database used for this research was mostly made by combining the data from GWM reports
from 3rd quarter of 2016, and 1st quarter of 2013, which cover the period spanning from 2006
to 2015. When required, on a few occasions, data from other reports was used to bridge gaps.
The main work put in by the authors was the formation of a single database with input from the
reports mentioned above. The reports come as PDF files, which had to be converted to MS
Excel files at first, before the data could be formatted to a long format database. This was no
easy thing, and it took quite a while to do. The raw data came with different prefixes between
countries and reports, and in different currencies where that was applicable. The authors put
many hours into cleaning the data and converting it all to the same currency. In the following
weeks, countless hours went into familiarizing with the data to be able to visualize it in an
efficient way.

24
The data includes number of subscribers of each operator, amount of capital expenditure,
EBITDA, EBITDA ratio of revenue, service revenue and average revenue per user, to name a
few variables. It is therefore very convenient for a quantitative analysis of relationships between
various variables, according to Sanders et al. (2016). The selection and motivation of variables
used as specific performance indicators will be further described below.
The database includes operator and country level data for most of its variables. By that we mean
that there are values for each variable for each operator, as well as an average or a sum of values
presented as a country level value. It is a little bit flawed since country totals of e.g. service
revenue is just the sum of revenue generated by the operators being examined. Minor players
are not included, which skews the data a little bit in favor of the bigger ones. This might also
be a slight issue when e.g. market share of firms is calculated, the number used in this research
is in fact the percentage of a firm's subscriptions of the total number of subscriptions of the
firms being analyzed. This has some effect on e.g. competition index calculations, but it should
not be big enough to cast doubt on the results of the research. This is one of the delimitation of
this research. When required, the authors themselves calculated country level data to bridge
gaps in the database, e.g. for CAPEX where country level data was only available in the GWM
reports from 2010 and onwards.
3.3.2 Qualitative data
As is described in the chapter on the research evolution above, one thing let to another until the
authors found an expert in the field with high interest in this research area. It could be described
as a snowball sampling, where the authors start by talking to an acquaintance of theirs, which
gives them contact with one of their acquaintance and so on (Saunders et al. 2016). It has it’s
benefits, with the researchers being able to reach further into a specific field than they would
have without it. However, it must be dealt with with great care, since this sampling method is
non-random and there is a risk of community bias (Saunders et al. 2016).
The interviews conducted were quite open and semi-structured, with a few questions aimed to
guide the dialogue into relative topics. The data gathered from the interviews was 1) used as a
direction for where to aim the research purpose and questions and 2) as a third viewpoint of a
data triangulation, the other two being the quantitative database and previous researches.

25
3.4 Data analysis
3.4.1 Causality
According to Easterby-Smith et al. (2012), multivariate statistical analysis is a very powerful
method to test causal models. However, these methods cannot prove the causal relationship
being analyzed, they can only give indication on whether a given dataset supports previous
theories about causality. In other words, the quantitative evidence is used to test the validity of
a conceptual model. The authors of this research paper are very aware of this, but since the
purpose of it is to test whether a given dataset supports existing theories this method is deemed
fitting.
3.4.2 Variables
In a correlation analysis, it is important to include the right variables to be better able to estimate
which values contribute to a change in others. The results are constrained to the variables used
to generate them, and they do not take into account other potential contributing aspects
(Easterby-Smith et al., 2012). In this case, the authors are constrained by the dataset on hand
but it includes the required variables to test the theories on hand. The variables used in the
statistical analysis are listed and motivated below:
3.4.2.1 Revenue
To present the yearly revenue generated by the MNOs, estimated service revenue was used. It
is like the name suggests, what the GWM experts estimate to be revenues generated from selling
mobile network service. It came in various currencies but was converted to US$ to be used in
comparison between countries. The reports include average revenue per user (ARPU) for each
of the operators. It represents how much, on average, an operator’s customer pays for his service
each month. This is a value that varies greatly between countries, and further research could
include adjusting this number to purchasing power parity.
3.4.2.2 Margins
EBITDA is a short for earnings before interest, tax, depreciation and amortizations. It is
therefore a useful proxy for what can be called a margin, what is left of a firm’s revenue when
operational cost has been deducted. It has its drawbacks as it varies from firm to firm what is
26
included or deducted when the EBITDA is calculated. It is deemed a sufficient proxy for margin
for the purpose of this study.
3.4.2.3 Investment
Capital expenditure, or CAPEX, is considered by many a good proxy for investment in
infrastructure by firms in the telecommunication industry (Friederiszick et al., 2008). It is
available for most firms in the database, and on a country level for the years 2010-2015. For
the years prior to that, capital expenditure of the mentioned firms in the database was summed
up to create a country level value.
3.4.2.4 Competition
Previous researches have typically used two ways to present the competitive environment or
concentration within a market. The Herfindahl-Hirschman index, HHI, is based on market share
of firms. To calculate it, you square each firm’s market share (in percentages) and add them all
together, generating a number in the range of close to zero (fully concentrated market) to 10.000
(total monopoly). Note that the higher the HHI is, the less concentration there is on the market.
The second method used in this report is a version of the Lerner index, a method attributed to
the British economist Abba Lerner. It measures concentration in a competitive market, by
measuring a firm’s market power relating its revenue to marginal cost. In this research,
EBITDA ratio (EBITDA divided by revenue) is subtracted from 1, resulting in a value between
0 and 1. A value of 1 represents perfect competition, where the firm generates no profit (Lerner,
1934). As can be seen in chapter 5, we deemed HHI to be a more suitable measurement of
competition for the mobile network operator industry. HHI was used in all other analyses in
later chapters.
3.4.2.5 Classification of firms
No theory was used when market players were defined as incumbents, rather, if their market
share was significantly larger than any others’ in their market then they were counted as such.
The authors used their instincts to identify both the incumbents, and markets where two or more
players were so even in size that they could be called a “neck-and-neck market.” When
categorizing firms by size, the same method was used, visual inspection. After scrutinizing the
data, a decision was reached on categorizing firms with market share under 20% as small, 20-
30% as medium sized and 30%+ as large firms (incumbents).

27
3.5 Methods of data analysis The visualization of the quantitative data was done in Microsoft Excel. Depending on the type
of data and the goal of the visualization, line charts, bar charts and scatter graphs were used.
MS Excel’s trendline function, which uses regression analysis, was used for correlation
calculations. When the goal was to see if there was a linear relationship between two variables,
linear trendline was used. In this research, where much of the previous conceptual theory
revolves around an inverted-U relationship between competition and investment, a second
power polynomial trendline was used to analyze the nature of such relationships.
The analysis mostly relied on an instinctive approach, i.e. it was somewhat up to the authors'
perception of relationships of variables whether they appeared to be correlated or not. This was
addressed in the analysis and discussion chapters when required. The data covers ten years of
operations of mobile operators, and in some cases a new player emerges or an old one shuts
down his operations. That generates the problem of outliers, data points that in no way represent
normal running of an operator. This is especially apparent in variables such as EBITDA per
subscriber, or CAPEX per subscriber, when e.g. a new player might take a huge loss in his first
year when spending heavily on CAPEX. There is no real consensus amongst academia on which
outliers should be eliminated from the data and who should not, so in this paper the authors
have had to rely on their instincts for that matter. This is not a perfect solution to the outlier
problem and jeopardizes the validity and replicability of the research, but it was deemed the
best way forward for the purpose of this research.
3.6 Research quality and validity
3.6.1 Triangulation
According to Easterby-Smith et al. (2012), from a constructionist perspective one should
assume that there are many different realities. A researcher should therefore gather data from
multiple sources, preferably quantitative and qualitative, to gather views and experiences of
more than one stakeholder. This is called triangulation, a name borrowed from an old maritime
term used for the method of locating ships before the emergence of GPS technology.
This research, as is described above, is built mostly on a quantitative database from a third party
(secondary data). To triangulate around this perspective, documents published by regulatory
committees (BEREC, EU) were reviewed and their stance on the subject taken into account.

28
The industry's representatives’ opinion has also been reviewed, with GSMA’s policy
summarized as a part of the practical framework. Lastly, an expert was contacted to express his
opinion, both on the subject as a whole and as well on the preliminary results of the data
analyses.
3.6.2 Stakeholders
This research has been done relatively independent from third party stakeholders, it has not
been conducted for a single firm as is the case for many theses. The authors themselves have
generated the research purpose and questions with little or no bias towards a possible outcome.
They have however had help and guidance by their supervisor and one of his PhD students, as
well as valuable insights from employees of Ericsson. The authors have not received any
payment for their work.

29
4 Regulatory review This chapter aims to portray the regulatory environment in Europe. A summary of relevant
policy issues will be outlined, both from the regulatory body perspective and the industry
perspective.
4.1 Background In May of 2015 the European Commission communicated to the European Parliament their
purpose for the Digital Single Market (DSM). They emphasize that digital technological
development is happening at a scale and speed that opens immense opportunities for Europe in
innovation, growth and jobs. They also raised concerns that policy issues for public authorities
would need coordinated EU action. This coordination is the cornerstone of the DSM strategy
and achieving it would ensure that Europe maintained a strong position in the global digital
economy (European Commission, 2015). They revealed in the communication three pillars that
the DSM was going to build on, they are stated as: “(i) Better access for consumers and
businesses to online goods and services across Europe; (ii) Creating the right conditions for
digital networks and services to flourish; and (iii) Maximizing the growth potential of the
European Digital Economy” (European Commission, 2016a).
The EC further underlined that the goals of the DSM will only be achieved if very high capacity
networks are deployed in the EU. Therefore, the DSM strategy focuses on trying to create the
right environment for their deployment. On 14 September 2016, the EC proposed a collection
of legislative initiatives as well as a communication to the European Parliament, aimed towards
overhauling existing regulatory frameworks in telecommunications markets (Szczepanski,
2016). The purpose is to facilitate adherence of regulations to electronic communications
networks and services that have been subject to vast structural changes since the previous 2009
revision of telecom legislation. The EC emphasized that “the review needs to be seen in the
light of the DSM strategy for Europe” (European Commission, 2016c). The Commission also
revealed their new connectivity targets for 2025, stating that the current pace of telecom
development would be insufficient to meet future demand. The new targets put forth by the
Commission will require €500 billion of investment til 2025 (Szczepanski, 2016). To address
these above mentioned challenges the EC has proposed to remodel current EU telecom rules

30
with a new regulatory framework defined as the European electronic communications code
(EECC).
The EECC proposal aims to amend the previous frameworks four directives and integrate them
into a single legal text. These four directives are; The Framework Directive, The Access
Directive, The Authorisation Directive, and The Universal Service Directive. The Framework
Directive is the main overarching directive, its purpose is to harmonize the framework of
regulation in electronic communications networks and services. In doing so it sets general
principles, objectives and procedures that govern the area of policy. The Framework Directive
works closely with BEREC Regulation in laying down institutional organization by establishing
independent NRA´s that are responsible for regulation at a national level (European
Commission, 2016a). The Access Directive oversees the access and interconnection of
electronic communications. Its purpose is to shape the regulatory framework to the relationship
between network suppliers and network service suppliers with the purpose of promoting
sustainable competition. The Authorisation Directive aims to promote the freedom to provide
electronic communications networks and services within the EU. The Universal Service
Directive purpose is to ensure that the availability of good quality electronic communications
services is maintained over a minimum set threshold (Szczepanski, 2016).
The EECC proposals stem from evaluation work done by the EC over the period from May
2011 to May 2016. The evaluation showed that the objectives of the framework in place then;
promoting competition, creating the single market, and protecting end consumer rights remain
as valid in the EECC. However, the role of spectrum management and connectivity are issues
that are deemed more critical than before. The code therefore adds new regulatory objectives
which reside in incentivizing the promotion and take-up of high capacity connectivity. It also
tackles the issue of spectrum management by proposing to make access rules more focused and
legally certain. That is, the code seeks to limit the conditions under which obligations to market
access can be enforced. In order to safeguard the consistency of spectrum management
provisions, the code proposes a peer-review process of spectrum assignment that requires
national authorities to inform the EC, BEREC, and other NRA´s of planned radio spectrum
measures. This gives more power to the EC in terms of controlling the harmonization of
spectrum measures, coordinating selection processes, and controlling spectrum auction design
(Szczepanski, 2016).

31
4.1.1 5G action plan
In September 2016, the European Commission (EC) published what they call an action plan
regarding the deployment of 5G technology in Europe, with the aim to call upon endorsement
from the European Parliament and Council (European Commission, 2016). As they say
themselves in the action plan, Europe suffered from a lack of a coordinated approach when
implementing the 4G/LTE technology, resulting in only 28% coverage over the EU area
compared to 75% coverage in the USA. According to EC, Europe must learn from their
mistakes from last time if they want to become world leaders in 5G technology. Previous
strategic publications, such as the Digital single market strategy and Connectivity for a
competitive digital single market: towards a European gigabit society have already pointed out
that if Europe wants to have an advantage over other regions in telecommunications, high
capacity networks like 5G have to be implemented quickly and smoothly. According to this
report, initial launch of the platform should be in 2018 whereas it should be publicly available
on a large scale in 2020 the latest.
The EC sees the difference in technology advancement between member states of the EU as a
major threat to achieving this goal, and therefore they put forward a plan “as a means of
fostering the adequate coordination.” (European Commission, 2016, p2)
EC puts forwards in their report six key elements that they believe to be critical for Europe if it
wants to achieve it’s goals. They are:
• Alignment of priorities for a coordinated 5G induction all across the EU, aiming for the
previously mentioned dates.
• Make high frequency spectrum bands available for 5G firms before the 2019 World
Radio Communication Conference.
• Promoting deployment in densely inhabited areas as well as major transport paths.
• Support entrepreneurial and innovative efforts in Europe so they can be turned into a
viable business solution quickly.
• Promote industry-led venture funds that support and invest in 5G-based innovation.
• Work to unite leading institutions to working towards a consensus on global standards
for the technology.

32
4.2 Regulatory body perspective BEREC is an abbreviation for The body of European regulators for electronic communications,
an institution formed in 2009 on the grounds of the older European regulators group for
electronic communications networks and services (BEREC, 2017e). Since 2011, it has been a
fully functioning regulating agency of the telecommunication market in the European Union.
BEREC consists of an active member from each EU member state, as well as observers from
the other European countries. On top of that, the European Commission appoints a member of
it’s own and EFTA has it’s own observer.
The role of BEREC is to develop the internal market for electronic communications networks
and services in the European Union. In their own words, they do so by “aiming to ensure a
consistent application of the EU regulatory framework and by aiming to promote an effective
internal market in telecoms sector” (BEREC, 2017e). They assist national regulatory authorities
in implementing and executing EU’s regulations on the sector. Furthermore, they aid in the
harmonization between member states of best practice in the implementation of the EU
regulations. According to BEREC, the NRAs and the European Commission have to take full
account of any publications from BEREC, be it recommendations, guidelines or other
consultations. BEREC’s main mission is to protect and benefit the customers, including
businesses in the field.
4.2.1 BEREC publications
This subchapter is intended to provide the reader with a summary of BERECs publications
that are relevant to the regulatory analysis of the thesis.
4.2.1.1 BEREC’s strategic outline 2015-17
Late in 2014, BEREC published their strategic outline for the years 2015-2017. In this
document, they outlined three strategic pillars that would shape their activities in that period
(BEREC, 2014). They are:
1. Promoting competition and investment
2. Contributing to the development of the internal market
3. Promoting the interests of EU citizens

33
The first strategic pillar is of a particular interest for this report. BEREC elaborates on it in
their publication, saying that the NRAs “must promote effective competition, and in so doing
promote efficient investment and innovation in new and enhanced infrastructures and
services” (BEREC, 2014). To further argue for this statement, they say that competition
should be in the best interest of EU citizens, which is in line with their central mission that
competition “helps to fuel innovation and provides for maximum benefit in terms of choice,
price and quality.” (BEREC, 2014)
BEREC mentions that they view oligopolic networks and service markets as a risk to the
interests of EU citizens, and speak of mergers in a skeptic way. Cross-sectional mergers,
where network operators and content providers are merging, are due a special attention in the
period since they are seen as a great challenge for regulatory authorities. Reading into their
strategic outline, it is apparent that their main argument for promoting competition is that it
will foster a desirable climate for investment. They claim that investment incentives will
accelerate innovation, and therefore provide a higher quality of service in the networks
resulting in a better product for the end consumers. This will furthermore smoothen the way
for technology transformations of the near future (BEREC, 2014).
4.2.1.2 Public consultation mid-term strategy 2018-2020
In February 2017, BEREC published a stakeholder consultation document for their next mid-
term strategy for the period 2018-2020 (BEREC, 2017d). Their aim here to gain insights from
stakeholders as early as possible to better understand how their strategy over the last two years
has been seen from the outside, as well as what should be taken into consideration before they
publish their new mid-term strategy.
Concerning competition, BEREC claims that there are several trends in the European markets
that need to be addressed in the next strategic outline. As mentioned as a risk in 2014, they
claim that there is a tendency towards oligopolistic markets. They furthermore claim that there
has been an increase in mergers across sectors and the market is becoming more consolidated.
The competitive environment within the EU is also viewed to be becoming less homogenous,
i.e. more difference between countries within it.
The theme is therefore the same as in their previous outline, they want to promote competition
to incentivize investment that will lead to more innovation. They seem however to be becoming

34
more aware of the dynamics of other factors that affect investments. This is evident in their
statement that they have “been studying the evolution of the digital ecosystem to gain a better
understanding of the challenges and opportunities developing for competition and innovation”
(BEREC, 2017d).
4.2.1.3 Technical papers
In May 2017, BEREC published a series of short technical papers aimed at providing legislators
with technical expertise and proposals for amendments to the European Electronic
Communications Code (EECC) (BEREC 2017a). In the press release on the papers, BEREC
emphasized their position on competition by stating that “BEREC would highlight, that
empirically as well as theoretically, competition is a key driver for investment and [that]
proportionate regulation and sustainable investment should therefore not been seen as opposed
to one another” (BEREC 2017a). The technical papers relevant to this thesis were “Non-
competitive oligopolies” and “The forced stepping-back of regulation”.
4.2.1.3.1 Non-competitive oligopolies
BERECs aim in this paper is to propose amendments to the EECC to ensure that regulatory
bodies can address consumer harm arising from non-competitive oligopolies. In the paper it is
mentioned that non-competitive oligopolies are either characterized by joint dominance where
tacit collusion takes places or in environments where the market structure does not provide the
means for effective competition. BEREC views markets that have firms in the position of
unilateral market power (UMP) to be at risk of reduction in competition that in turn prevents of
the development of competitive outcomes. They state that the risks are “likely to be detrimental
to consumers in the long term, through higher prices, restricted choice, low quality and lower
innovation” (BEREC 2017b).
BERECs proposes two amendments to the EECC in regards to the harms associated with non-
competitive oligopolies. The first option they present is to address UMP under the same
regulations as a significant market power (SMP). This means that the regulations that adhere to
regulating incumbents with SMP should also be applicable to the firms competing in a UMP
environment. The second option they present is to introduce a new definition of UMP alongside
SMP and regulate according to the characteristics of harm based on inefficient outcomes of
UMP.
35
4.2.1.3.2 The forced stepping-back of regulation
BERECs goal in this technical paper is to propose amendments to the EECC that promote
investment, protect competition, and preserve the integrity of the SMP framework. Their brief
conclusion is that competition and investment are equally important objectives that should not
be pursued at each other’s expense (BEREC 2017c).
In the paper BEREC expresses high-level concerns on NRA's restrictions in “the ability to
promote competition, in the name of incentivizing investment, which creates a risk that
connectivity is pursued to the detriment of both competition, and ultimately, investment”
(BEREC 2017c). The main restriction BEREC is concerned about is the EECCs “3 criteria test”
(European Commission, 2016) that NRAs must follow to determine if ax-ante regulation in a
market is applicable. The test's purpose is to justify imposition of regulatory obligations set out
in the EECC directive (European Commission, 2016). Imposition is justified under the
condition that the following three criteria’s are cumulatively met:
A. high and non-transitory structural, legal or regulatory barriers to entry are present;
B. there is a market structure which does not tend towards effective competition within the
relevant time horizon, having regard to the state of infrastructure-based competition and
other sources of competition behind the barriers to entry;
C. competition law alone is insufficient to adequately address the identified market
failure(s). (European Commission, 2016)
BEREC is of the view that the 3 criteria test is overly restrictive as they feel it significantly
raises the evidentiary bar for ex ante regulation and increases the regulatory burden on NRAs.
The paper also addresses BEREC’s concerns towards the EECC position on relaxation of ex
ante regulation in competitive markets and the deregulation of SMPs in very high-capacity
networks (VHC). In regards to the relaxation of ex ante regulation, BEREC argues that this
could reinforce market power and make it more difficult for NRAs to pursue regulatory
objectives. The EECC reasoning for deregulating SMP in VHCs is to incentivize the
deployment of 5G networks. BEREC states their opposition to this by stating that it
“undermines the principle of technology neutrality and introduces substantial regulatory
uncertainty by anchoring legal provisions to a vague and aspirational definition of “VHC”
networks” (BEREC, 2017c).

36
The last issue in the paper that is relevant to this study, is BEREC’s favorable view on the
EECCs proposal to extend market review periods from 3 years to 5 years. Both parties argue
that this will increase regulatory stability that they deem key to incentivizing investment. The
incentive derives from their view that less frequent market review periods will increase the
confidence of long term investment.
4.2.1.4 Report on OTT services
In January of 2016, BEREC released a report that focuses on the relationship between OTT
services and electronic communication services (ECS) (BEREC, 2016). The report aims to
analyzes the services of OTT players and their impacts on the electronic communications sector.
BEREC in this report recognizes that the term OTT is not clearly defined and provide a
definition and classification of OTT services. The classifications are following;
• OTT-0: services that qualify as ECS
• OTT-1: services that do not qualify as ECS but do potentially compete with them.
• OTT-2: services that are not ECS and do not potentially compete with them. (BEREC,
2016)
BEREC also states that due to the evolution of services taken over the internet, the boundary
between OTT´s and ECS becomes more and more blurred. In this context, BEREC recognizes
that the lack of clarity in definitions leads to uncertainty to service providers in the market due
to unproportionate regulations. To combat this problem, BEREC has suggested a reviewing of
the EU regulatory framework for electronic communications (ECN/S Framework) to
implement clarifications in service definitions.
The theme of the report builds up to the main issue that is, the differences in regulatory
treatment of ECS and OTT services. BEREC notes that they do agree that services of the same
type should preferably be under the same broad regulations, however they also note that in some
cases there is a need for different regulatory treatments. This relates to their reasoning that
regulations should be considered in light of the goals of obligations and the proportionality of
the obligations relevant to specific services. The conditions BEREC proposes for this is that
proportionality of obligations should be viewed by the social benefits they provide and the
economic costs encompassing each provider. Thus, the argument for a level playing field is in
37
BERECs view more complex than just applying the same regulations for the same services as
it is just one of many elements in the assessment of proportionality (BEREC, 2016).
4.2.1.5 Conclusion
To sum up the publications, it is clear that BEREC views promotion of competition to be the
main driving factor towards investment and consumer benefits. They reveal BEREC’s strong
stance towards incentivizing competitive markets and their high-level concerns towards
excessive market powers. It is also evident that BEREC views an ex-ante approach to be the
best way of regulating markets and wish to extend the review periods as well.
4.3. Industry perspective
4.3.1 GSMA
GSMA, or GSM Association, is an industry trade body representing the interests of over 1200
mobile operators from all over the world. It replaced its predecessor, Groupe Speciale Mobile
(GSM) in 1995. On their website they describe their purpose as continuing their leadership in
“creating a world where we can all benefit from the opportunities enabled by the mobile
internet, and contribute to the evolution of a sustainable planet” (GSMA, 2017a).
4.3.1.1 Position on competition and regulations
In a statement on their website, GSMA explains and motivates their policy on competition
initiative. They begin with outlining their mission, “to promote a competition framework that
can deal effectively with new and emerging challenges” in the digital marketplace (GSMA,
2017b). But to understand what they mean by that, one must understand what they see as those
emerging challenges in the industry. The biggest factor that promotes a need for a change in
competition policy, in their opinion, is the increasing cooperation and mergers between firms
in the second and third layers of the ICT ecosystem. According to them, this evolution has
increased competition in the field.
They seem to see it as an issue that current competition regulations are not up to date when it
comes to the boundaries between layers, they want future regulations to cover all competitors
on the new market, not only the traditional mobile operators. They don’t want sector-specific
regulations, rather a “flexible and technology-agnostic” regulatory invention only when
required. Furthermore, they want it to take into account the investment and innovation benefits

38
arising when mergers are assessed, not just the predetermined competition indexes (GSMA,
2017b). It is therefore apparent that there is a pull from the industry on the regulatory institutions
and the industry requires updated regulations, to be able to achieve their future goals.
4.3.1.2 GSMA-NERA report
According to a report commissioned to NERA Economic Consulting by GSMA, on the
regulatory environment in the digital ecosystem, telecom regulations of the present are to a
large extent the same as those in 20th Century technologies and markets (GSMA, 2016a). The
report findings show that these outdated regulatory policies impose detrimental effects to the
digital ecosystem in two specific ways. On the one hand in the form of discriminatory regulation
and on the other hand due to static regulation of dynamic markets. The discriminatory
regulation effects stem from increased fluidity of market boundaries in recent years. The most
significant example of this is the expansion OTT providers into business opportunities that were
traditionally exclusive to telecommunication carriers. The problem with this is that the rules are
different for either of them even though they compete on the same market. That is,
telecommunication carriers are subject to rules designed for telephone companies and OTT
providers subject to rules designed for broadcasters with the former having a more stricter
environment (GSMA, 2016a).
The report specifies that the traditional ex ante regulatory approach is the main inhibitor that
characterises the problem of static regulation on dynamic markets. This traditional approach
not only seeks to specify the objectives being sought but also the manner in which they are to
be achieved. It is not hard to see the shortcomings of this approach, first of all, it constraints the
approach to meet objectives to a predetermined set of rules resulting in inflexibility. Second of
all, it lacks adaptability to technological change that could spur a more optimal approach to
achieving desired outcomes (GSMA, 2016a).
4.3.1.3 Comments on BERECs OTT services draft
GSMA published a document commenting on BERECs draft of the OTT services report
(GSMA, 2015a). They begin with addressing their concerns that the classifications of OTT
services are still blurred in practice. The concern is that OTT-1 services are perceived by
customers as functional substitutes to current voice and text services and the classification of
them as OTT-1 undermines the underlying purpose of providing clearer classifications.

39
In regards to proportionate regulations, GSMA agrees with BEREC that there are a number of
requirements that should be considered in assessment of appropriate regulations of ECS.
However, they argue that a levelled playing field should be high on the priority list in the
assessment of regulatory symmetry in similar services. The report provides suggestions to
BEREC in that justification of specific rules in selected areas should only be accepted when the
benefits for society exceed the regulations entailed economic costs. Furthermore, they mention
that ex-ante regulations are one of the main causes of the unleveled playing field because they
are insufficient in predicting the future of the market and are difficult to adjust to changes in
the market. GSMA there suggests that ex-ante regulatory obligations should only be imposed
where there is no effective and sustainable competition (GSMA, 2015a).
4.3.1.4 GSMA-Frontier Economics report
The GSMA asked Frontier Economics to construct a report that aimed to investigate mergers
in mobile markets from a theoretical and economical perspective. The report starts by focusing
on the method that competition authorities use to assess mergers and from there suggests
improvements that aim to benefit the market and end-consumers. The report finds that the
European Commission centralizes their assessment around if a merger will lead to possible
short-term increases in prices. The Commission's second priority is then to assess if a merger
will lead to efficiency gains and higher investment. However, in the report they show that the
major contributor to unit prices decreases in recent years is to due to investment in new
technologies. It is therefore their suggestion that the priorities be switched as the latter,
investment benefits from mergers, contributes more to consumer benefits than the former
(GSMA, 2015b).
Frontier Economics also suggest that the tools used by competition authorities to assess the
impacts of mergers are not reliable in mobile industries. The main tool used is the GUPPI
(General Upwards Pricing Pressure Index) framework, this framework is generally used by
competition authorities in Europe for various industries. Frontier Economics argument is that
mobile markets have technology cycles of 7-8 years compared to 30-50 years in many other
industries and therefore should have different merger assessments. The GUPPI framework also
tends to only focus on the short term impacts of mergers rather than a more holistic view. The
report supports its arguments by providing empirical data showing that there is no higher
investment in markets with low HHIs or in markets with four players rather than three (GSMA,
2015b).

40
4.3.2 Boston Consulting Group report
Boston Consulting Group (BCG) (Boston Consulting Group, 2013) examined the regulatory
reasons why Europe has been falling behind in network investments. They mention that there
are several drivers influencing lower investments but the main inhibitor is regulation. They
identify three areas where regulatory distortion of competition disincentivizes investment. First
is the inability of operators to make fair returns to fund investments. The inability is impacted
in two ways, one is the inconsistency in regulation of competitive markets and the second is the
prevalence of an uneven playing field in the digital-services ecosystem. BCG states that the
uneven playing field results from asymmetrical regulation between telcos and OTT players
providing the same services. OTT players are not subject to the same strict regulations that
telecoms are in terms of privacy protection, data protection, and e-communications service
rules.
The second area is the mandated inefficiencies in the mobile sector. The report states that the
root cause of inefficiency is the barriers to consolidation in the industry, resulting in too many
unsustainable players in the European market. The third area identified is the lack of
harmonization between member states that hinders pan-European operators to reap synergies
between countries (Boston Consulting Group, 2013).
4.3.3 5G manifesto
The 5G manifesto is a statement endorsed by many of the large telecommunication companies
in Europe. The manifestos intention is to be a collective statement on the European industries
concern regarding the timely deployment of 5G in Europe. The majority of the document is
centered around the contributions of industry players that are detrimental to the development
and deployment of 5G. The report emphasizes that in order for the EU to reach 5G deployment
goals, there will need to be significant investments over time. They go on to state that these
investment will only take place in the right regulatory environments, which they deem not
sufficient at this time (5G Alliance, 2016).

41
The manifesto encouraged the European Commission to reform regulation, with the primary
objective to incentivize investment and promote innovation. Their proposition to improve
regulations consists of the following:
• Fewer and simpler rules focused on cases where regulated access to key infrastructure
still needs to be safeguarded, based on an assessment of market competition at the retail
level;
• The right investment environment that encourages commercial flexibility through co-
investment and risk-sharing models allowing for a fair long-term return on investments;
• A withdrawal of ex-ante regulation when appropriate is consistent with greater
investment incentives for all players;
• Where access regulation remains, long-term commercial agreements that enable
competitive outcomes should be encouraged wherever possible as an alternative to
regulation. (5G Alliance, 2016)
The 5G manifesto is a clear indication that regulations in the European telecommunications
market are inhibiting the ability of firms to invest.
4.4 Net neutrality
4.4.1 What is net neutrality?
Traditional landline phones are in effect “dumb” machines, opposed to the smartphones more
common these days. What made landline phones valuable was the network they are connected
to. When the phone user called a friend, he was therein contacting his operator and relying on
him to be connected to his friend’s landline phone. It was the network that was the “smart” part
of the mechanism, the phones were just a means through which you used it. With the emergence
smartphones, the tables have turned. Now the phone is the part of the system that is smart, and
the network is “dumb” (Berners-Lee, n.d.). The user can choose who he contacts, which
websites he visits and which news he decides to read without the interference of his operator.
That is what’s called net neutrality, you decide how you allocate your mobile data without any
censorship (Choi, Kim, 2010). Operators are also required to charge the customer the same
amount for his data usage regardless of what it’s being used on, with a few exceptions. There
is a consensus on a few exceptions of this, most of them concern public safety or if law
enforcement should get prioritized before the public.

42
4.4.2 Arguments for net neutrality
It is argued by many that net neutrality preserves the public’s right to uncensored online
communication, i.e. what is generally called The Open Internet. It prevents operators from
choosing which information their customers can access. It also prevents content providers from
paying network operators to prioritize their content over their competitors’. It’s not only
important for individuals, as businesses of all sizes would be in danger of having their products,
advertisements or job openings filtered out by a competitor willing to pay the network operators
enough.
4.4.3 Arguments against net neutrality
It is hard to find strong arguments against net neutrality that aren’t from the operator’s or
content providers’ perspective. There are however some concerns over how could constrain
future innovations and technologies. One term frequently mentioned in that instant is network
slicing, the ability to create different lanes of internet access for different types of services (5G
Manifesto, 2016). Questions have risen on whether under current regulations network slicing
would be allowed.

43
5. The state of the MNO industry and Europe’s position amongst developed regions 5.1 Empirical findings and descriptive analysis
5.1.1 Region categorization used in the chapter
The following chapter presents selected data from a big database from Merrill Lynch - Bank of
America. In their database, the countries were divided into categories based on their
development status and geographical locations. In this paper, the categorization will be slightly
different to fit the purpose of the paper. The region groups will be three, Developed Europe,
North America and Developed Asia-Pacific. The decision on which countries should be
considered “developed” will be based on the Merrill Lynch - Bank of America database.
Although the focus of the paper is on the developed markets within the European Union, the
data for Norway and Switzerland will be included in the European region. The regions will
hereafter just be called Europe, North America and Asia-Pacific. In the part where regions are
being compared, the blue line/column represents Europe, the orange one represents North
America and the gray one represents Asia-Pacific. The countries chosen as part of the empirical
data are listed here below:
Europe North America Asia-‐Pacific Austria Netherlands Canada USA Australia New Zealand Belgium Norway Hong Kong Singapore Denmark Portugal Japan Finland Spain France Sweden Germany Switzerland Italy UK
Table 3 -‐ Regions used in this part of the study
5.1.2 MNO market size
This subchapter aims to present the evolution of the MNO market size in the three regions.
5.1.2.1 Population and density

44
Below is a table presenting the geographical size of the regions, as well as their population and
density. The density number is the total population of the region divided to the total size of the
countries within the region.
Region Size (km^2) Population Density (ppl/km^2) Europe 3430540 403661517 117,7 North America 19818187 361392819 18,2 Asia-‐Pacific 8342259 169039166 20,3
Table 4 -‐ Population and density of the regions
Europe is by far the most densely inhabited region of the three being analyzed. However, it has
to be noted that Australia’s giant size relative to the number of inhabitants skews the data for
Asia-Pacific, the other countries there are much denser. The same is the case for North America,
where Canada’s size notably skews the average.
5.1.2.2 Subscriptions
The graph below presents the number of individual subscriptions in the three regions as well as
the total number for all the regions, from the year 2006 to 2015. The axis on the right refers to
the yellow line, the sum of all subscriptions in the regions.
Figure 6 -‐ Mobile subscriptions
0
200000
400000
600000
800000
1000000
1200000
0
100000
200000
300000
400000
500000
600000
2006 2007 2008 2009 2010 2011 2012 2013 2014 2015
Subscriptio
ns (000s)
Year
Mobile subscriptions
Europe North America Asia-‐Pacific Total (right axis)

45
The table below shows the number of subscriptions for all the regions on a year to year basis.
The column furthest to the right show the compound annual growth rate of subscriptions over
the period.
Table 5 -‐ Subscriptions numbers and rate of change
Although subscription numbers have grown in Europe since 2006, they seem to have reached a
peak around 2012 and have been declining slowly since then. The subscription rates have gone
up quite steadily in the other two regions, with the year 2013 in North America being an
exception.
5.1.2.3 Penetration
Below is a graph displaying the average wireless penetration of the three regions. Note that in
some cases, the penetration is above 100%. That means that on average, there are more
individual subscriptions in the region than there are inhabitants.
Figure 7 -‐ Wireless penetration in the regions being analyzed
Penetration tells us more about the state of the market than pure subscription numbers, as it
takes into account changes in population. The average European penetration rate has apparently
0%
20%
40%
60%
80%
100%
120%
140%
160%
2006 2007 2008 2009 2010 2011 2012 2013 2014 2015
Pene
tration
Year
Wireless penetration
Europe North America Asia Pacific

46
reached its peak, or at least stagnated since the year 2012. The penetration of Asia-Pacific has
also been quite steady since around 2011, around the 140% mark. It could very well be that
penetration has its upper limit, and Europe and Asia-Pacific have reached it already whereas
North America can still grow for a while.
5.1.3 Launch of LTE networks
Below is a timeline showing when the developed markets of the world first launched the LTE
technology, which took over from the 3G technology.
Figure 8 -‐ TImeline showing when LTE was launched in the developed markets
The northern European countries were among the first to adopt LTE technology, along with
USA and Japan. By third quarter of 2011, all of North America had launched it, but it wasn’t
until late 2012 and early 2013 when Europe and Asia-Pacific successfully implemented it.
5.1.4 Revenue and margins
This subchapter aims to shed light on the trends in revenue and margins of MNOs in the three
regions being analyzed.

47
5.1.4.1 Service revenues of MNOs
The graph here below shows the trend in total service revenue of the countries’ MNOs in each
of the regions over the period 2006-2015. The yellow line represents the total for all the regions
and uses the right axis.
Figure 9 -‐ Total service revenue of MNOs in the regions
Europe’s service revenue has been declining since around 2010, when the LTE technology was
deployed. The case is very similar for Asia-Pacific, although just like with penetration, the
numbers peak a few years later. Although less populous and with fever subscriptions than
Europe, North America leads the pack in service revenue with quite some margin.
5.1.4.2 Average revenue per user
Below is a bar chart showing the development of average ARPU in the regions for the same
period.
0
50
100
150
200
250
300
350
400
450
500
0
50
100
150
200
250
2006 2007 2008 2009 2010 2011 2012 2013 2014 2015
Service revenu
e (BN$
)
Year
Europe North America Asia-‐Pacific Total (right axis)
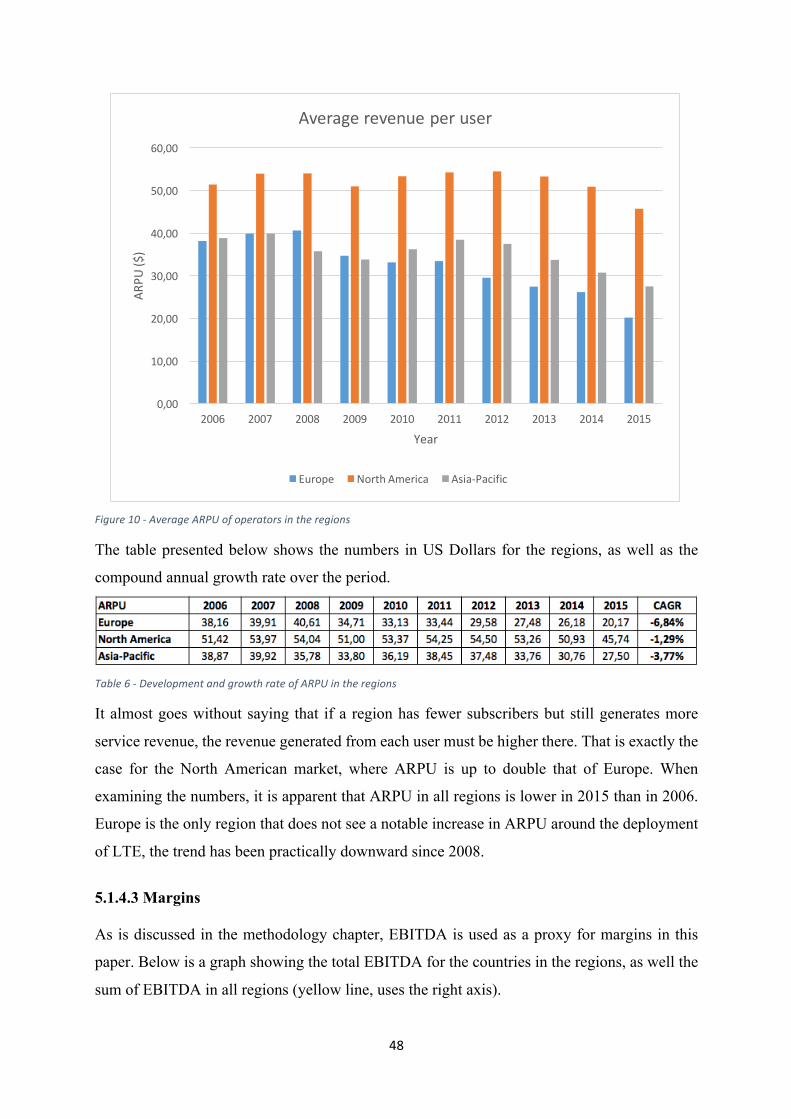
48
Figure 10 -‐ Average ARPU of operators in the regions
The table presented below shows the numbers in US Dollars for the regions, as well as the
compound annual growth rate over the period.
Table 6 -‐ Development and growth rate of ARPU in the regions
It almost goes without saying that if a region has fewer subscribers but still generates more
service revenue, the revenue generated from each user must be higher there. That is exactly the
case for the North American market, where ARPU is up to double that of Europe. When
examining the numbers, it is apparent that ARPU in all regions is lower in 2015 than in 2006.
Europe is the only region that does not see a notable increase in ARPU around the deployment
of LTE, the trend has been practically downward since 2008.
5.1.4.3 Margins
As is discussed in the methodology chapter, EBITDA is used as a proxy for margins in this
paper. Below is a graph showing the total EBITDA for the countries in the regions, as well the
sum of EBITDA in all regions (yellow line, uses the right axis).
0,00
10,00
20,00
30,00
40,00
50,00
60,00
2006 2007 2008 2009 2010 2011 2012 2013 2014 2015
ARPU
($)
Year
Average revenue per user
Europe North America Asia-‐Pacific
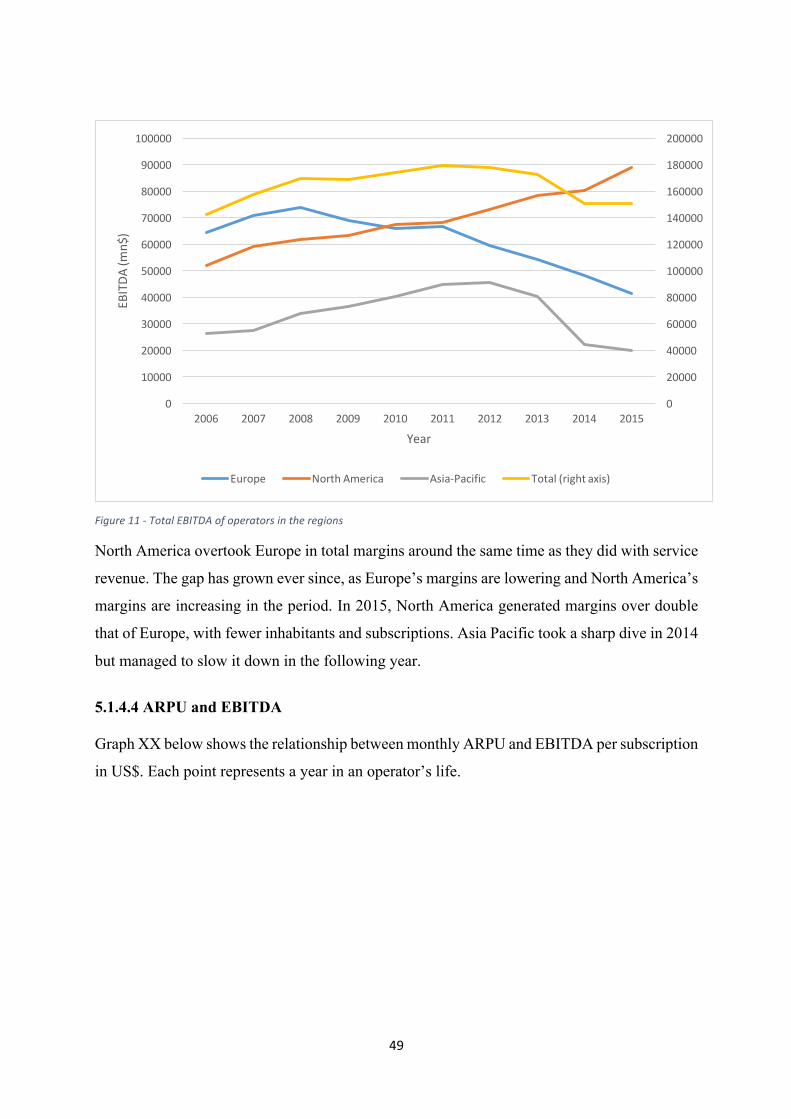
49
Figure 11 -‐ Total EBITDA of operators in the regions
North America overtook Europe in total margins around the same time as they did with service
revenue. The gap has grown ever since, as Europe’s margins are lowering and North America’s
margins are increasing in the period. In 2015, North America generated margins over double
that of Europe, with fewer inhabitants and subscriptions. Asia Pacific took a sharp dive in 2014
but managed to slow it down in the following year.
5.1.4.4 ARPU and EBITDA
Graph XX below shows the relationship between monthly ARPU and EBITDA per subscription
in US$. Each point represents a year in an operator’s life.
0
20000
40000
60000
80000
100000
120000
140000
160000
180000
200000
0
10000
20000
30000
40000
50000
60000
70000
80000
90000
100000
2006 2007 2008 2009 2010 2011 2012 2013 2014 2015
EBITDA
(mn$
)
Year
Europe North America Asia-‐Pacific Total (right axis)

50
Figure 12 -‐ Relationship between EBITDA/subscription and ARPU in the regions
There is no surprise that there is a strong correlation between margins per subscription and
average revenue per user. What can be read from this graph however, is that the North American
operators seem to be better at turning a higher ARPU into higher margins, since the slope of
the trendline is notably higher for the North American data than for the other two regions.
Europe and Asia-Pacific appear to have a similar rate of growing margins with growing ARPU.
5.1.5 Investment
This subchapter aims to show how investment in the MNO industry has been developing over
the last 10 years.
5.1.5.1 Capital expenditure (CAPEX)
As described in the methodology chapter, CAPEX will be used as a proxy for investment (in
infrastructure) in this paper. The graph below shows the total investment in the regions over the
last year.

51
Figure 13 -‐ Total CAPEX of operators in the regions
5.1.5.2 CAPEX per subscription
To see how (ambitious) the MNOs of each region are, the capital expenditure for each
subscription is displayed in the graph below. The numbers are average for the countries in the
regions.
0
10000
20000
30000
40000
50000
60000
70000
80000
90000
0
5000
10000
15000
20000
25000
30000
35000
40000
2006 2007 2008 2009 2010 2011 2012 2013 2014 2015
CAPE
X (m
n$)
CAPE
X (m
n$)
Year
Europe North America Asia-‐Pacific Total (Right axis)

52
Figure 14 -‐ Average CAPEX per subscription in the regions
As has been the case in many of the measurements, Europe is visibly lagging behind the other
developed regions when it comes to investment per subscription. Since 2009, European
operators have spent the least amount of money on investment in infrastructure per subscriber.
Adding to that, even the much less populous Asia-Pacific is not far behind Europe in total
infrastructure investment. The other two regions raised their investment levels quite clearly
around the deployment of LTE, whereas no such trend can be seen in the data for Europe.
5.1.5.3 CAPEX and ARPU
The graph below shows the relationship between average revenue per user and CAPEX per
subscription. The data is on operator level, i.e. each dot represents a year in an operator’s life.
0
10
20
30
40
50
60
70
80
90
100
2006 2007 2008 2009 2010 2011 2012 2013 2014 2015
Cape
x/Subscribers ($)
Year
Europe North America Asia-‐Pacific
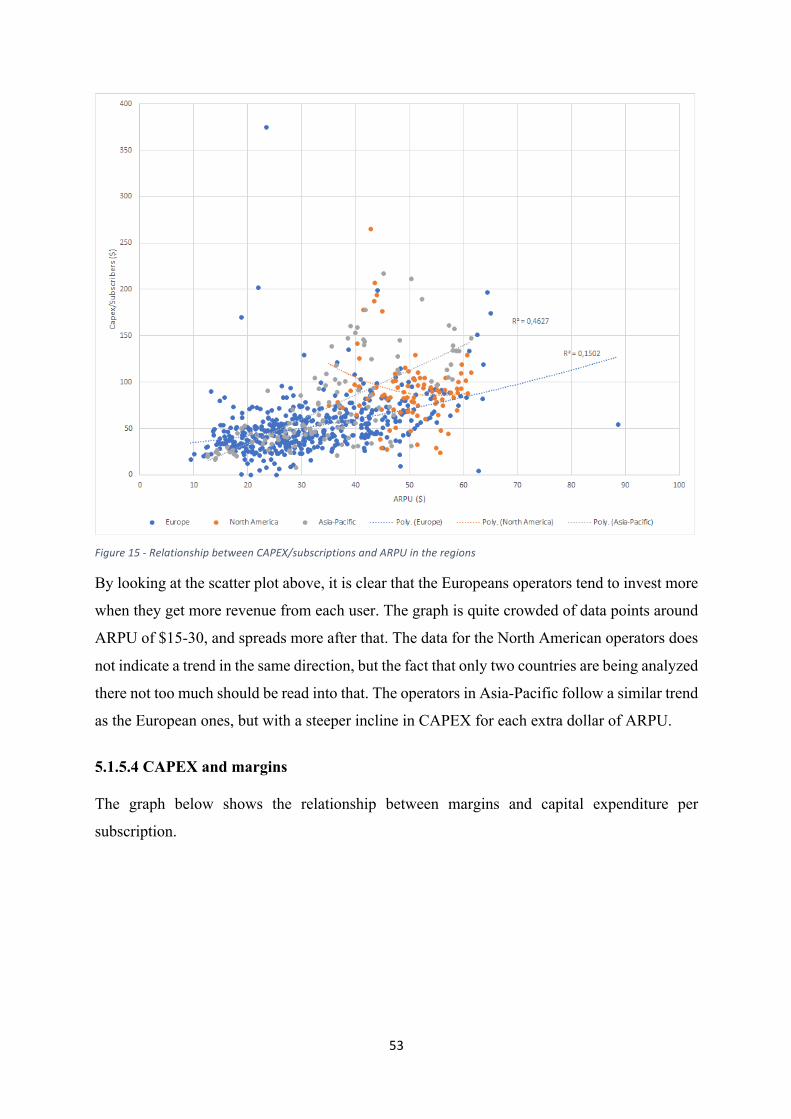
53
Figure 15 -‐ Relationship between CAPEX/subscriptions and ARPU in the regions
By looking at the scatter plot above, it is clear that the Europeans operators tend to invest more
when they get more revenue from each user. The graph is quite crowded of data points around
ARPU of $15-30, and spreads more after that. The data for the North American operators does
not indicate a trend in the same direction, but the fact that only two countries are being analyzed
there not too much should be read into that. The operators in Asia-Pacific follow a similar trend
as the European ones, but with a steeper incline in CAPEX for each extra dollar of ARPU.
5.1.5.4 CAPEX and margins
The graph below shows the relationship between margins and capital expenditure per
subscription.

54
Figure 16 -‐ Relationship between CAPEX-‐ and EBITDA per subscription
Unsurprisingly, a similar story is apparent when margins are compared to CAPEX, since the
relationship between margins and ARPU has already been shown to be positively correlated.
5.1.6 Competitive Environment
This segment includes graphs and other data concerning indexes and proxies for competition
within the regions.
5.1.6.1 Herfindahl-Hirschman Index (HHI)
This line chart shows how the competitive environment in the regions has evolved over time.
The numbers are averages the HHI in each country each year. Observe that the higher the HHI
number is, the less concentrated the market is (see: methodology chapter).

55
Figure 17 -‐ Average HHI in the regions
On the graph below, average HHI for Europe is represented by the orange line and the standard
deviation of the values for the countries is represented by the blue line.
Figure 18 -‐ The development of Europe's HHI
0
500
1000
1500
2000
2500
3000
3500
4000
4500
2006 2007 2008 2009 2010 2011 2012 2013 2014 2015
HHI ind
ex
Year
Average HHI index by regions
Europe North America Asia Pacific

56
The changes in the countries’ HHI are relatively small over the 10 year period. Europe’s
numbers are especially steady, whereas the other two regions have seen a decrease in market
concentration over the last four years or so. What is interesting is that even though the average
HHI of European countries has declined, the standard deviation from the average has risen quite
clearly. It went from under 500 in 2007 to almost 800 in 2015, indicating less homogeneous
market environments in the region.
5.1.6.2 Competition proxy (1-EBITDA Margin)
As is described in the methodology chapter, the EBITDA margin is used as a proxy to measure
competition. The graph below shows the average 1-EBITDA% proxy for all MNOs with
sufficient data in Europe. Note that the axis does not start from zero, it only covers around 4%
change.
Figure 19 -‐ Average Lerner index in Europe
The fact that the average 1-EBITDA% index only fluctuates from around 0,627 to 0,652 (under
4% change) when the HHI fluctuates from 3350-3650 (around 8,5% change) indicates that this
is a very static measurement of competition. Opposite to the HHI, a high 1-EBITDA% means
that there is a high concentration in the market. The two indexes don’t seem to resemble each
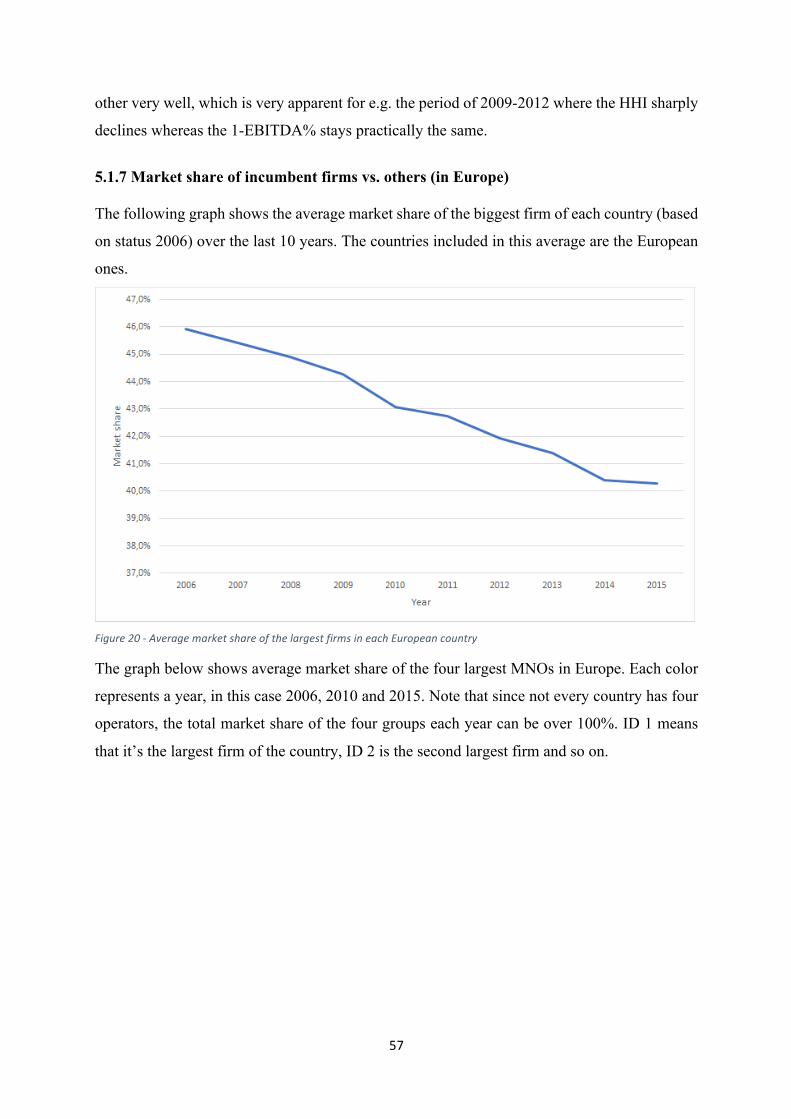
57
other very well, which is very apparent for e.g. the period of 2009-2012 where the HHI sharply
declines whereas the 1-EBITDA% stays practically the same.
5.1.7 Market share of incumbent firms vs. others (in Europe)
The following graph shows the average market share of the biggest firm of each country (based
on status 2006) over the last 10 years. The countries included in this average are the European
ones.
Figure 20 -‐ Average market share of the largest firms in each European country
The graph below shows average market share of the four largest MNOs in Europe. Each color
represents a year, in this case 2006, 2010 and 2015. Note that since not every country has four
operators, the total market share of the four groups each year can be over 100%. ID 1 means
that it’s the largest firm of the country, ID 2 is the second largest firm and so on.

58
Figure 21 -‐ Development of market share distribution in Europe
The image below shows the evolution more visually, with the years 2006 and 2015 being looked
at.
Figure 22 – Comparison between market share distribution in 2006 and 2015
Here it is very apparent that on average, the smaller market players are closing in on the big
ones. The third and fourth largest players have grown when meanwhile the two largest have
shrunk significantly. Note that the fourth largest operators have on average doubled in size,
whereas the third largest only grows by 3 percentage points (pps). Incumbent firms appear to
be losing their stronghold on the market, the average gap to the second biggest player has shrunk
from 14 pps to 9 pps.
0,0%
5,0%
10,0%
15,0%
20,0%
25,0%
30,0%
35,0%
40,0%
45,0%
50,0%
ID 1 ID 2 ID 3 ID 4
Market share
2006 2010 2015

59
5.2 Discussion This chapter aims to summarize the empirical findings and it’s analysis, and compare it with
existing literature and practical framework on the subjects.
The aim of almost every firm in the public sector must be to generate the best possible financial
outcome to satisfy their owners and shareholders. To do that, they must sustain their competitive
advantages and grow at a desired rate (Grant, Strategy book). What we have seen in the
empirical analysis of the mobile network operator industry is that there are several negative
trends in critical performance indicators, which make it harder for firms in the industry to meet
their aims. Subscription numbers are stagnating; service revenue is on the decline and each user
wants more and more service for a lower price. Firstly, we shall look at all the developed
markets being analyzed before we answer the question of how Europe has fared in comparison.
5.2.1 Challenges facing MNOs - Negative trends in performance indicators
The data shows that there are several negative trends in the industry’s performance indicators.
The outlook is particularly bad for the developed markets in Europe, where subscription rates
have almost certainly stagnated, while the North American market seems to still be growing at
a steady rate. As is evident for all the markets, service revenue, average revenue per user and
EBITDA margins are on a downward slope. Below, we will discuss the factors believed to be
affecting the firms' prosperity in the markets.
5.2.2 Is Europe reaching maturity?
As is evident on the graphs in the empirical analysis chapter, service revenue in the regions are
either stagnating or already on their way towards a decline. Average revenue per user is also on
the way down in every region, although mobile data usage has multiplied in the same period.
Margins in Europe and Asia-Pacific are declining contrary to what has happened in North-
America.
The mobile penetration of the regions might be the key to an explanation for these trends.
Europe and Asia-Pacific have incurred a rather clear stagnation in mobile penetration around
the 130-145% mark, whereas North America is still seeing a rather steady growth with a lower
penetration rate (under 100%). It is possible that the mobile market has its upper limits of
penetration, a saturation point, and that Europe has already reached it. As Rogers (Sahin, 2006)
and Lindmark (2006) point out, the further into the technology life-cycle you get, the less
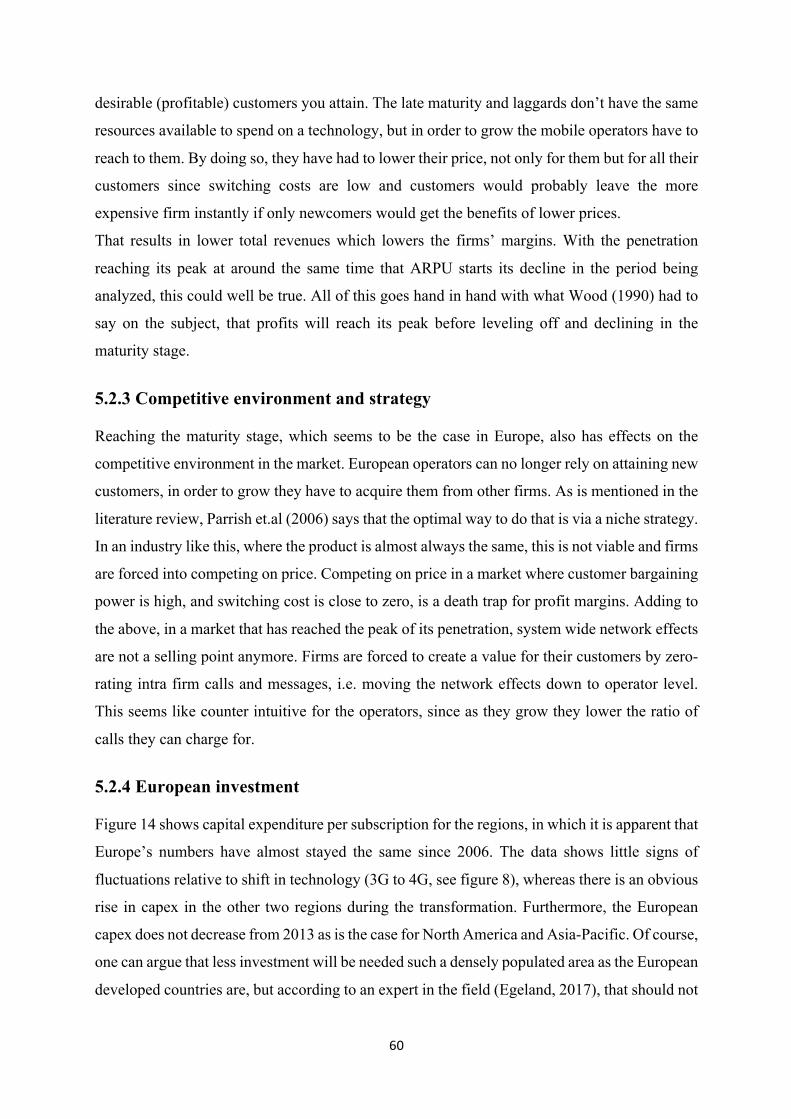
60
desirable (profitable) customers you attain. The late maturity and laggards don’t have the same
resources available to spend on a technology, but in order to grow the mobile operators have to
reach to them. By doing so, they have had to lower their price, not only for them but for all their
customers since switching costs are low and customers would probably leave the more
expensive firm instantly if only newcomers would get the benefits of lower prices.
That results in lower total revenues which lowers the firms’ margins. With the penetration
reaching its peak at around the same time that ARPU starts its decline in the period being
analyzed, this could well be true. All of this goes hand in hand with what Wood (1990) had to
say on the subject, that profits will reach its peak before leveling off and declining in the
maturity stage.
5.2.3 Competitive environment and strategy
Reaching the maturity stage, which seems to be the case in Europe, also has effects on the
competitive environment in the market. European operators can no longer rely on attaining new
customers, in order to grow they have to acquire them from other firms. As is mentioned in the
literature review, Parrish et.al (2006) says that the optimal way to do that is via a niche strategy.
In an industry like this, where the product is almost always the same, this is not viable and firms
are forced into competing on price. Competing on price in a market where customer bargaining
power is high, and switching cost is close to zero, is a death trap for profit margins. Adding to
the above, in a market that has reached the peak of its penetration, system wide network effects
are not a selling point anymore. Firms are forced to create a value for their customers by zero-
rating intra firm calls and messages, i.e. moving the network effects down to operator level.
This seems like counter intuitive for the operators, since as they grow they lower the ratio of
calls they can charge for.
5.2.4 European investment
Figure 14 shows capital expenditure per subscription for the regions, in which it is apparent that
Europe’s numbers have almost stayed the same since 2006. The data shows little signs of
fluctuations relative to shift in technology (3G to 4G, see figure 8), whereas there is an obvious
rise in capex in the other two regions during the transformation. Furthermore, the European
capex does not decrease from 2013 as is the case for North America and Asia-Pacific. Of course,
one can argue that less investment will be needed such a densely populated area as the European
developed countries are, but according to an expert in the field (Egeland, 2017), that should not

61
be such a big factor. Base stations have a certain capacity which is a much more accurate
determinant of the cost of covering an area. European mobile operators have simply been
lagging noticeably behind their counterparts in the other two regions when it comes to
investment. On figure 16, a positive correlation between margins and investment, but no
conclusion can be drawn on whether there is a causative relationship between the factors. There
is however no indication that more investment lowers the margins, so perhaps the lack of it
amongst European operators is partially to blame for their lowering margins.
5.2.5 Conclusion
To conclude this section, we can say that the outlook for European operators is worse than for
at least their North American counterparts. Europe has been seeing steeper declines in service
revenues and margins than the other two regions, the operators are fighting each other for the
same customers since there is little room for enhancement of mobile penetration in the region.
Europe is a clear laggard when it comes to investment in infrastructure and their profit margins
might be suffering because of that. Competing on price in a saturated market is killing the
margins, and a different competition strategy will be needed to prosper on the market.
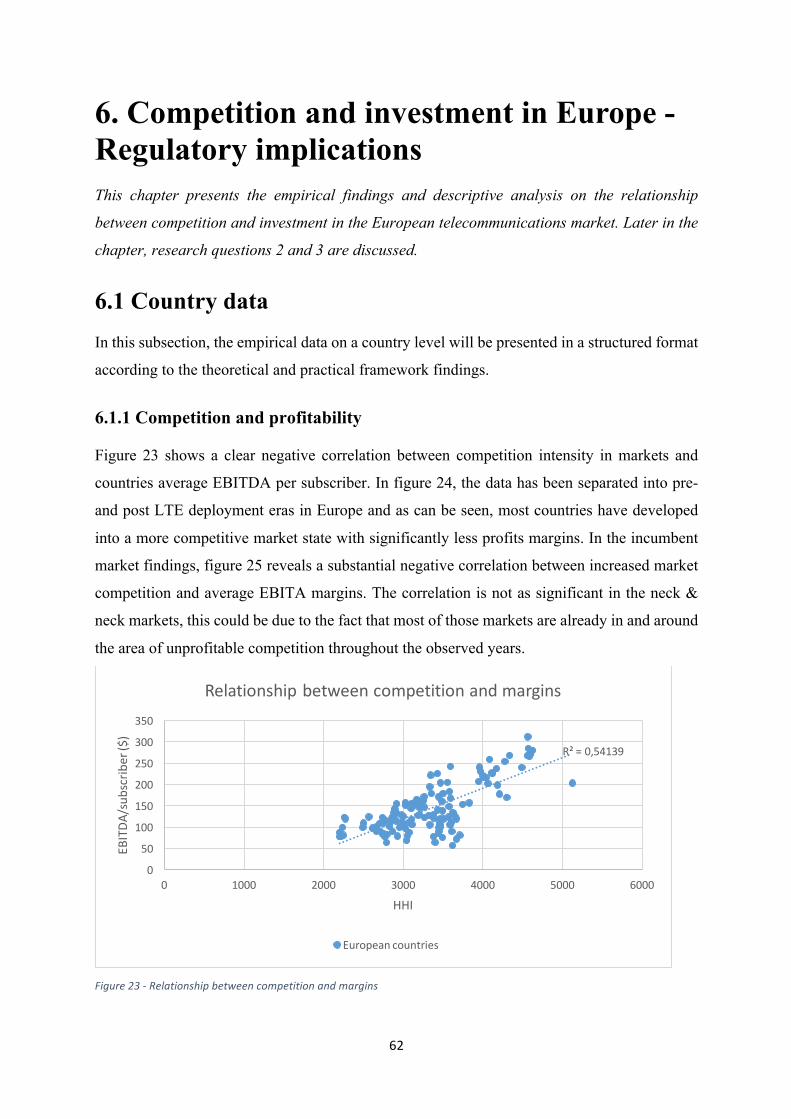
62
6. Competition and investment in Europe - Regulatory implications This chapter presents the empirical findings and descriptive analysis on the relationship
between competition and investment in the European telecommunications market. Later in the
chapter, research questions 2 and 3 are discussed.
6.1 Country data In this subsection, the empirical data on a country level will be presented in a structured format
according to the theoretical and practical framework findings.
6.1.1 Competition and profitability
Figure 23 shows a clear negative correlation between competition intensity in markets and
countries average EBITDA per subscriber. In figure 24, the data has been separated into pre-
and post LTE deployment eras in Europe and as can be seen, most countries have developed
into a more competitive market state with significantly less profits margins. In the incumbent
market findings, figure 25 reveals a substantial negative correlation between increased market
competition and average EBITA margins. The correlation is not as significant in the neck &
neck markets, this could be due to the fact that most of those markets are already in and around
the area of unprofitable competition throughout the observed years.
Figure 23 -‐ Relationship between competition and margins
R² = 0,54139
0
50
100
150
200
250
300
350
0 1000 2000 3000 4000 5000 6000
EBITDA
/sub
scrib
er ($)
HHI
Relationship between competition and margins
European countries

63
Figure 24 -‐ Relationship between competition and margins split by era
Figure 25 -‐ Relationship between competition and margins split by market type
6.1.2 Competition and investment The data on the relations between competition on investment is presented in figure 26 and the
results seem to indicate a slight correlation. However, when the data is split up into pre- and
post LTE deployment, the data points show polarizing trends. As figure 27 exhibits, very little
correlation can be seen in the pre-LTE era but the correlation in the post LTE era is more
significant. This indicates that in the post LTE era, increased competition in markets is
associated with a negative trend in investment intensity. This is further highlighted in figure 28
where neck & neck markets have a minuscule relationship between investment and increased
competition but the countries with a clear incumbent in the market indicate a dependable

64
relationship. The data also reveals that the Incumbent dominated markets tend to invest more
on average the other markets.
Figure 26 -‐ Relationship between investment intensity and competition
Figure 27 -‐ Relationship between investment intensity and competition, divided by eras
Figure 28 -‐ Relationship between investment intensity and competition, divided by market type
R² = 0,16978
0
20
40
60
80
100
120
0 1000 2000 3000 4000 5000 6000
Cape
x/subscriber ($)
HHI
Relationship between competition and investment
European countries
65
6.1.3 Investment and profitability linkage
The aim of this analysis is to show the link between the prosperity of markets and investment
intensity. When the data is broken into pre- and post LTE deployment, EBITDA and capex are
significantly more correlated in the post era. This indicates that on average, investment is more
dependent on market prosperity in the post LTE era when compared to before. Figure 31 reveals
an interesting indication that neck & neck markets are considerably worse off than incumbent
driven markets. In terms of EBITDA, 32% of the neck & neck Industry data points are below
the 100 $US mark compared to only 6% in the Incumbent markets. It can also be seen that the
capital expenditure in these markets tends to be lower.
. Figure 29 -‐ Relationship between margins and investment intensity

66
Figure 30 -‐ Relationship between margins and investment intensity, divided by era
Figure 31 -‐ Relationship between margins and investment intensity, divided by market type
6.2 Operator data In this subsection, the empirical data on operators will be presented in a structured format
according to the theoretical and practical framework findings.
6.2.1 Market share analysis
The purpose of the market share analysis is to investigate the impacts of competition intensity
on operators of different sizes in terms of market share. Figure 32 indicates that the large and
small sized operators show a strong negative correlation between profitability and increased

67
market competition. The data on medium sized operators however, indicates that the influence
of competition on profitability is not as significant.
Figure 32 -‐ Relationship between competition and margins, divided by market share
The data on operators in figure 33 presents the relationship between competition and
investment. As can be seen, the small sized operators are the ones that show the most reliable
correlation factor. This indicates that smaller firms in markets with more uniformly distributed
market power tend to invest less than similar sized firms in unbalanced markets. The correlation
factor is not too convincing for the large and medium size firms to make any assumptions on
the influence of competition on investment. Figure 34 shows a modest linear relationship
between profitability and investment of all operator sizes. On that account, according to
findings in figure 35, it is reasonable to assume that investment intensity from large sized
operators in Europe is lower in more balanced market environments.
R² = 0,31609
R² = 0,15771
R² = 0,44321
0
50
100
150
200
250
300
350
400
2000 2500 3000 3500 4000 4500 5000 5500
EBITDA
/sub
scrib
er ($)
HHI
Relationship between competition and margins
>30% 20-‐30% 5-‐20%

68
Figure 33 -‐ Relationship between competition and investment intensity, divided by market share
Figure 34 -‐ Relationship between margins and investment intensity, divided by market share
6.2.2 Incumbent- vs. neck & neck markets
The purpose of this analysis is to investigate the dynamic effects of competition intensity in
different market environments. The approach here is to compare incumbent driven markets with
neck & neck market environments.
R² = 0,11932R² = 0,1308
R² = 0,45745
0
20
40
60
80
100
120
140
160
2000 2500 3000 3500 4000 4500 5000 5500
Cape
x/subscriber ($)
HHI
Relationship between competition and investment
>30% 20-‐30% 5-‐20%
R² = 0,20453
R² = 0,21599
R² = 0,29509
0
20
40
60
80
100
120
140
160
0 50 100 150 200 250 300 350 400
Cape
x/subscriber ($)
EBITDA/subscriber ($)
Profitability and investment linkage
>30% 20-‐30% 5-‐20%

69
6.2.2.1 Competition and profitability
Figures 35 and 36 show contrasting results on the relationship between competition intensity
and operator profitability. The data on incumbent markets reveals a clear linear relationship for
all three classifications of operators compared to unsubstantial evidence on the relationship in
neck & neck environments. Furthermore, the trend lines indicate that small and medium sized
operators in neck & neck environments generate lower profits on average than incumbent
market peers in similar competitive environments.
Figure 35 -‐ Relationship between competition and margins, in markets with an incumbent
Figure 36 -‐ Relationship between competition and margins, in neck & neck markets
R² = 0,60944
R² = 0,51588
R² = 0,37836
050
100150200250300350400
2000 2500 3000 3500 4000 4500 5000 5500
EBITDA
/sub
scrib
er ($)
HHI
Incumbent markets
Incumbents >20% <20%
R² = 0,00786
R² = 0,00937
R² = 0,110820
50
100
150
200
250
300
350
2000 2500 3000 3500 4000
EBITDA
/sub
scrib
er ($)
HHI
Neck & neck markets
>30% 20-‐30% 5-‐20%

70
6.2.2.2 Competition and investment
The comparison of figures 37 and 38 indicate that that smaller firms in Incumbent markets are
the only data set that show a significant correlation between competition intensity and
investment. It can also be seen that there is not a substantial difference in investment intensity
between the compared markets.
Figure 37 -‐ Relationship between competition and investment intensity in markets with an incumbent
Figure 38 -‐ Relationship between competition and investment intensity in neck & neck markets
R² = 0,05869
R² = 0,15972
R² = 0,55039
020406080
100120140160
2000 2500 3000 3500 4000 4500 5000 5500
Cape
x/subscriber ($)
HHI
Incumbent markets
Incumbents >20% <20%
R² = 0,03137
R² = 0,11157R² = 0,0801
0
20
40
60
80
100
120
140
2000 2500 3000 3500 4000
Cape
x/subscriber ($)
HHI
Neck & neck markets
>30% 20-‐30% 5-‐20%

71
6.2.2.3 Investment and profitability linkage
The comparison analysis here reveals differing results on the linkage between profitability and
investment intensity. Figures 39 and 40 show that all operator classifications in incumbent
markets display a linear interrelationship contrary to insignificant correlations in neck & neck
markets. However, the medium size operators in neck & neck markets do have a considerably
higher linear relationship compared to the large and small size operators. This does seem to
indicate that medium sized operators in neck & neck markets tend to increase investment
intensity with higher profit margins compared to other operator classifications.
Figure 39 -‐ Relationship between margins and investment intensity in markets with an incumbent
Figure 40 -‐ Relationship between margins and investment intensity in neck & neck markets
R² = 0,31438
R² = 0,29647R² = 0,37442
020406080100120140160
0 50 100 150 200 250 300 350 400
Cape
x/subscriber ($)
EBITDA/subscriber ($)
Incumbent markets
Incumbents >20% <20%
R² = 0,0817
R² = 0,15045R² = 0,00027
0
20
40
60
80
100
120
140
0 50 100 150 200 250 300 350
Cape
x/subscriber ($)
EBITDA/subscriber ($)
Neck & neck markets
>30% 20-‐30% 5-‐20%

72
6.3 Discussion This chapter aims to summarize the empirical findings and its analysis in discussion.
6.3.1 Industry
The empirical findings on a country level show that the majority of the investigated countries
in Europe are migrating towards more concentrated markets with significantly decreased
profits. When the country data is split into markets with incumbents and neck & neck
environments the results show that the countries with incumbent market power tended to have
on average higher investment intensity and market profitability. The incumbent markets also
show significant correlation of competition to both investment and profitability, contrast to the
neck and neck markets. This correlation implies that increased competition by market structure
on incumbent dominated markets will have considerably more impact than in neck & neck
environments. These findings indicate adherence to the Schumpeterian argument that states that
large firms in less competitive markets investment more to gain the benefits of economies of
scale
6.3.2 Firms: Market share
By splitting the operator data up by market share power we are better able to understand the
dynamic effects of competition on firms in terms of relative scale. The possible influence of
competition on investment intensity in this regard, shows that operators categorized as small
show a negative correlation with increased competition. The data therefore seems to indicate
that smaller operators invest more in in less competitive market structures. An assumption can
be made from this finding in that when there is more dispersity of market power, smaller firms
in those environments are compelled to compete on investments to withhold their market shares.
This assumption is in line with the data on the profitability and. investment linkage. The data
on the linkage is telling of the role of economies of scale and their diminishing effect in lower
profits. That is, the rate of CAPEX increase with increased profits is highest in small operators
and lowest in the large operators, but in the low profitability area (which seems to be the most
condensed) the difference between the operator categories becomes seemingly less.
6.3.3 Firms: Incumbent vs neck & neck
We dug deeper into the firm analysis by splitting the market share data into market structures
that are incumbent dominated or neck & neck. When investigating the possible influence of

73
increased competition by market structure the comparison showed polarizing results. We can
see that all operators in incumbent markets are significantly correlated with competition, both
in profits and investment. Again, this shows a tendency of incumbent markets adhering to the
Schumpeterian argument. Neck & neck markets show minuscule correlation on both fronts.
6.4 Regulatory analysis This chapter aims to compare findings from the empirical data and theoretical framework to
the EU's regulatory policies related to competition and investment.
6.4.1 Regulatory objectives
The essence of the regulatory objectives in Europe are portrayed in BEREC’s three strategic
pillars. The strategic pillar relevant to this study is the first strategic pillar, Promoting
Competition and Investment. The basis of this strategic pillar is centered around BEREC’s view
that effective competition drives efficient investment and benefits end-user in terms of choice,
price, and quality. In the pillars outline it is deemed vital that ex-ante economic regulation
should be present until markets are effectively competitive. The ways in which BEREC has
gone about facilitating this effective competition have mainly been in the form of promoting
new entrants, safeguarding against consolidation and strict regulations of SMPs.
6.4.2 Regulatory fit
6.4.2.1 Competition driving investment
The empirical data in figure 27 shows that markets in Europe have condensed towards
concentrated market structures in the post LTE era. Interestingly, the data shows a significant
negative correlation between market concentration and investment, with the less competitive
markets showing considerably higher investments. This does not however completely
contradict BEREC’s view, as their opinion is that competition drives efficient investment. It
can therefore be assumed that BEREC views the benefits from effective competition to be in
line with the “efficiency structure hypothesis” in the SMP framework. As mentioned in the
theoretical framework, the efficiency hypothesis states that competitive market structures will
increase industry profitability by incentivizing firms to invest more efficiently. Figure 24 on
the other hand shows that the profitability of markets in the post LTE era have drastically
declined, thus there is no indication of the hypothesis validity.
74
However, as we have mentioned, the profitability decline of the European market can be
contributed to a number of factors, so it cannot entirely be associated with regulatory induced
competitive structure. Therefore, in line with the hypothesis, the market dynamics must be
investigated on the operator level by market shares. Figures 32 and 33 show that regardless of
operator size, competition by increased market concentration does not lead to increased
investment nor profitability, rather the contrary. BERECs argument should also imply that neck
& neck markets should spur more efficient investment than incumbent markets. Figure 28
shows that increase in competition in these markets has insignificant correlation with
investment.
In terms of the researches empirical findings, none of the data indicates that the increase of
competitive market structures will increase operator investments.
6.4.2.2 Benefits to end-users
BERECs view that effective competition is the driver of increased benefits to end-users is also
skeptical. Research has shown that the effects of investment on price reduction vastly outweigh
the effects of competition (Jeanjean, 2013). This, when coupled with the empirical findings on
competitions effect on investment indicate that BEREC’s perception of competition being
mutually beneficial to investment and end-user is in our opinion ill founded. By Jeanjean’s
(2013) empirical results, the biggest benefit to end-users is promoting investment and therefore
that should be the priority of BEREC in this regard.
6.4.2.3 Ex-ante regulations
In the strategic pillar, also echoed in BEREC’s technical paper “the forced stepping-back of
regulation” (BEREC, 2017), BEREC proposes amendments that intend to facilitate increased
ex-ante regulation approaches. On top of this, they underline the importance of extending
market review periods from 3 years to 5 years, stating that extended periods incentivize
investment.
Ex-ante regulations have however been shown to be one of the main contributing factors to the
industry's profit decline (GSMA-NERA, 2016; BCG, 2013; Fransman 2007). The critique of
ex-ante regulation resides in the fact that it is proactive rather than reactive, which means that
they are intended to regulate future situations. This approach is especially harmful in industries
characterized by rapid change like the mobile industry because the regulations applied can be

75
irrelevant to the market in a short time span. One of the prominent examples of this harm is the
migration of OTT competing with mobile services. In this case, OTT players are competing
with mobile operators for voice and SMS services, but the OTT players are not subject the same
strict regulations that operators are in the conduct of services (GSMA-NERA, 2016; BCG,
2013)
BEREC has been slow to react to the dynamic effects that OTT players bring to the market.
Although they have published a report on OTT services, the report has only helped clarify
definitions of OTT players and gives suggestions to deal with them. However, after some years’
presence in voice and messaging, they are still not under the same rules as mobile operators
even though competing on the same services (GSMA-NERA, 2016). BEREC’s opinion a
favoring extended review periods also increases the harmful effects of ex-ante regulation as it
makes the reaction abilities of NRAs increasingly slower.
6.4.2.4 Safeguarding against consolidation
It is evident that the European Commission is primarily concerned with the anti-competitive
effects of consolidation and largely underestimates the gains that mergers can contribute to
consumer welfare. The GSMA-Frontier Economics reports findings show that the European
Commission seems to be assessing mergers in the mobile market the same as it would any other
industry. This is problematic because the mobile market is in itself unique due to its rapid
technological evolution. The GUPPI framework, which is mentioned as the main tool of
assessment, only considers short term impacts of mergers which can indicate unit price increase.
However, this approach does not consider the longer-term benefits to end consumers from
merging firms. In a longer-term view, mergers can incite economies of scale that increases the
ability of operators to invest substantially more which in turn has shown to drive down unit
prices. Mergers can also help in firms’ efficiency resulting from combining complementary
assets such as spectrum assignments.

76
7. Conclusions The purpose of the research was to empirically analyze the performance of European mobile
operators to determine the critical factors influencing the industry's future prosperity. To do
that, three research questions were formed to aid with the fulfilment of that purpose, and in this
chapter those three research questions will be answered. Following that, concluding remarks
on possibilities for future research will be discussed.
7.1 Research question 1 Since the deployment of 3G networks, how has the mobile operator industry in Europe
performed compared to other developed regions?
The MNOs of the developed world are on average seeing worse results with time, which is
displayed by stagnating subscription numbers and declining service revenues. In comparison
with the other regions, Europe is facing steeper declines in service revenue and average revenue
per user. Margins are plummeting at a rate which should threaten any firm’s operating
environment, opposed to an increase of margins in North America. It is apparent that European
operators have not increased their investment intensity in the years following the
implementation of LTE, a trend that is apparent for the other two regions.
According to some empirical research on the subject, it is investment that is the main driver of
unit price reduction in telecommunication services. European operators have been lagging
behind their counterparts from North America and Asia-Pacific in investment intensity, as well
as charging the least for their services. When those two factors are combined, it is obvious that
such a situation will shrink profit margins. Furthermore, European MNOs do not have the
ability to expand the market as penetration is appearing to be around its upper limits. In order
for firms to grow they need to acquire customers from other firms, with associated costs of such
maneuvers that will further shrink their margins. This coupled with the fact that European
MNOs are forced to compete under stricter regulations compared to OTT firms, has positioned
them in an unfavorable situation.

77
According to our study’s findings, this trend will continue, pushing Europe’s MNO markets
towards less profitable states. With operation cost and revenue structure out of sync, European
operators must increase their investment intensity to lower their operating costs.
7.2 Research question 2 What do the empirical findings indicate about the competitive dynamics in the European
telecommunications ecosystem?
Our empirical findings show no indication that competition through increased market
concentration results in increased investment intensity. On the contrary, countries with market
structures of higher HHI values seem to be the most profitable. This was also further indicated
in the empirical analysis between incumbent markets and neck & neck markets. In those
analyses the markets that were characterized by neck & neck competition showed considerably
worse performances in all comparisons.
The data on the operator level made us able to comprehend the impacts of competition relative
to scale. The data showed the prevalence of economies of scale to the market and interestingly
revealed the sharp decrease in investment intensity of the small sized operators. This indicates
that increased competition in the market disincentivizes smaller operators in investment. One
can assume that this can be contributed to motives of smaller operators to invest when they
know the regulatory bodies of the industry have the objective of increasing market uniformity,
beneficial to them.
When we divided the operator data into incumbent and neck & neck markets we saw that the
neck & neck markets showed no relationship with decreased competition and investment. On
the other hand, the incumbent markets showed a negative linear relationship both in investment
intensity and profitability, further indicating their superior performance compared to firms in
neck & neck industries.

78
7.3 Research question 3 What are the regulatory implications of the study’s findings in regards to future policy
objectives in the EU?
The European Commission is adamant on learning its lesson from the substandard deployment
of 4G in Europe and has therefore devised an ambitious action plan for the roll out of 5G
networks. The action plan however relies on initiatives from member states and the industry to
achieve its goals. This is evidently problematic as industry leaders have declared in a collective
statement that the regulatory environment needs to be reformed to enable the investment needed
to reach the action plan objectives. It is therefore important for the Commission to weigh out
the benefits of the industries regulation against its objectives in the 5G action plan.
It is apparent from BERECs published policy proposals that their position on regulatory aims
to achieve digital single market objectives are still steadfast on safekeeping competitive market
structures. Our analysis has shown that the arguments put forth by BEREC in justifying this
approach do not hold up to our empirical findings nor other research on the subject. The mobile
operator market is not only being subject to increased market competition by BEREC’s
regulation but also in recent years from OTT players. As can be seen from published documents
on the matter, the prevalence of OTT competition in mobile operator markets is not adequately
integrated in the assessment of competitive markets. BEREC must acknowledge this threat from
OTT players and either start regulating them in line with the industry they compete in or relax
the regulatory hold on mobile operators. If neither of these measures are taken then the mobile
industry's investment abilities will undoubtedly decrease at a higher rate, which put the 5G
deployments at more risk.
Due to the dynamic nature of the mobile operator industry, it is also increasingly important that
the European Commission changes its stance on ex ante regulations. The ex-ante approach to
this dynamically changing industry not only hinders the investment incentives of operators but
it also inherently restricts innovative approaches to achieve the regulatory objectives it seeks.
We have seen in the case of OTT competition to the mobile market, that regulatory
responsiveness to these issues is slow and has harmful effects. We therefore suggest that ex
post regulatory assessment should be encouraged in most cases.

79
We also suggest that the EC reevaluate their position on market consolidation. Too many firms
in the European market are under the threshold of profitability that is required to sustain
effective network investments. Consolidation will enable larger firms to reap the benefits of
economies of scale and complementary assets.
7.4 Further research This research is limited in scope as it only studies countries defined as developed by
international standards. This is useful since the markets being analyzed are therefore more
homogeneous than if developing and emerging markets were taken into the equation. Further
research on the subjects of this paper could be to widen the scope e.g. look at the whole
European Union, or the European Economic Area. As discussed earlier in the paper, purchasing
power parity (PPP) is not taken into account in the research. With less homogeneous markets
being analyzed, we would recommend that PPP should be considered, which could further
enhance the validity of the research results.
Another possible direction is to examine more thoroughly is the efficiency of investment. This
research did not investigate whether the investments were efficient, only the total aggregate of
investment relative to subscribers was considered. Lastly, with such an valuable and thorough
database, there are countless possibilities for a comprehensive multivariate regression analysis.
If done with the right knowledge and methods, such analyses should be able to see trends and
correlations beyond the scope of this research.
80
List of figures Figure 1 -‐ Porter´s generic strategies (Porter, 1980) ............................................................................. 10 Figure 2 -‐ A schematic representation of different theories on the relationship between competition and investment. .................................................................................................................................... 14 Figure 3 -‐ Comparison of static and dynamic effects on megabyte price reduction (Jeanjean, 2015) . 15 Figure 4 -‐ The ICT ecosystem (Fransman, 2010) .................................................................................... 18 Figure 5 -‐ Relationships in the ICT ecosystem (Fransman, 2010) .......................................................... 19 Figure 6 -‐ Mobile subscriptions ............................................................................................................. 44 Figure 7 -‐ Wireless penetration in the regions being analyzed ............................................................. 45 Figure 8 -‐ TImeline showing when LTE was launched in the developed markets ................................. 46 Figure 9 -‐ Total service revenue of MNOs in the regions ...................................................................... 47 Figure 10 -‐ Average ARPU of operators in the regions .......................................................................... 48 Figure 11 -‐ Total EBITDA of operators in the regions ............................................................................ 49 Figure 12 -‐ Relationship between EBITDA/subscription and ARPU in the regions ................................ 50 Figure 13 -‐ Total CAPEX of operators in the regions ............................................................................. 51 Figure 14 -‐ Average CAPEX per subscription in the regions .................................................................. 52 Figure 15 -‐ Relationship between CAPEX/subscriptions and ARPU in the regions ................................ 53 Figure 16 -‐ Relationship between CAPEX-‐ and EBITDA per subscription .............................................. 54 Figure 17 -‐ Average HHI in the regions .................................................................................................. 55 Figure 18 -‐ The development of Europe's HHI ...................................................................................... 55 Figure 19 -‐ Averge Lerner index in Europe ............................................................................................ 56 Figure 20 -‐ Average market share of the largest firms in each European country ................................ 57 Figure 21 -‐ Development of market share distribution in Europe ........................................................ 58 Figure 22 – Comparison between market share distribution in 2006 and 2015 ................................... 58 Figure 23 -‐ Relationship between competition and margins ................................................................ 62 Figure 24 -‐ Relationship between competition and margins split by era .............................................. 63 Figure 25 -‐ Relationship between competition and margins split by market type ............................... 63 Figure 26 -‐ Relationship between investment intensity and competition ............................................ 64 Figure 27 -‐ Relationship between investment intensity and competition, divided by eras .................. 64 Figure 28 -‐ Relationship between investment intensity and competition, divided by market type ..... 64 Figure 29 -‐ Relationship between margins and investment intensity ................................................... 65 Figure 30 -‐ Relationship between margins and investment intensity, divided by era .......................... 66 Figure 31 -‐ Relationship between margins and investment intensity, divided by market type ............ 66 Figure 32 -‐ Relationship between competition and margins, divided by market share ........................ 67 Figure 33 -‐ Relationship between competition and investment intensity, divided by market share ... 68 Figure 34 -‐ Relationship between margins and investment intensity, divided by market share .......... 68 Figure 35 -‐ Relationship between competition and margins, in markets with an incumbent .............. 69 Figure 36 -‐ Relationship between competition and margins, in neck & neck markets ......................... 69 Figure 37 -‐ Relationship between competition and investment intensity in markets with an incumbent ............................................................................................................................................. 70 Figure 38 -‐ Relationship between competition and investment intensity in neck & neck markets ...... 70 Figure 39 -‐ Relationship between margins and investment intensity in markets with an incumbent .. 71 Figure 40 -‐ Relationship between margins and investment intensity in neck & neck markets ............. 71

81
List of tables Table 1 -‐ Regions used in the study ......................................................................................................... 6 Table 2 -‐ Dimensions of relationships (Fransman, 2010) ...................................................................... 19 Table 3 -‐ Regions used in this part of the study .................................................................................... 43 Table 4 -‐ Population and density of the regions .................................................................................... 44 Table 5 -‐ Subscriptions numbers and rate of change ............................................................................ 45 Table 6 -‐ Development and growth rate of ARPU in the regions .......................................................... 48

82
References Aghion, P., Bloom, N.,Blundell, R., Griffith, R., & Howitt, P. (2005). Competition and
innovation: An inverted-u relationship. Quarterly journal of economics, 120(2), 701-
728. https://doi.org/10.1093/qje/120.2.701
Aghion-Howitt (1992). A model for growth through creative destruction. Econometrica,
60, 323-351. Retrieved from
http://www.jstor.org/stable/2951599?seq=1#page_scan_tab_contents
Arrow, K. (1962). Economic welfare and the allocation of resources for invention. In The
rate and direction of inventive activity: Economic and social factors, 609-626.
National Beuro of Economic Research, Inc. Retrieved from
http://www.nber.org/chapters/c2144.pdf
Arthur, W.B., (1996). Increasing return and the two worlds of business. Harvard Business
Review, Jul-Aug 1996. Retrieved from
https://hbr.org/1996/07/increasing-returns-and-the-new-world-of-business
Bain (1959). Industrial organization: A treatise. New York: John Wiley & Sons.
BEREC (2014). BEREC strategy 2015-2017. Retrieved from
http://berec.europa.eu/eng/document_register/subject_matter/berec/annual_work_prog
rammes/4785-berec-strategy-2015-2017
BEREC (2016). Report on OTT services. Retrieved from
http://berec.europa.eu/eng/document_register/subject_matter/berec/reports/5751-
berec-report-on-ott-services
BEREC (2017a). Press release on BEREC Papers on the review. Retrieved from
http://www.berec.europa.eu/eng/document_register/subject_matter/berec/press_release
s/7041-press-release-on-berec-papers-on-the-review
BEREC (2017b). BEREC views on non-competitive oligopolies in the Electronic

83
Communications Code. Retrieved from
http://www.berec.europa.eu/eng/document_register/subject_matter/berec/press_release
s/7041-press-release-on-berec-papers-on-the-review
BEREC (2017c). Promoting investment, protecting competition, and preserving the integrity
of the SMP framework. Retrieved from
http://www.berec.europa.eu/eng/document_register/subject_matter/berec/press_release
s/7041-press-release-on-berec-papers-on-the-review
BEREC (2017d). Stakeholder consultation on the review of the BEREC medium-term
strategy for 2018-2020. Retrieved from
http://berec.europa.eu/eng/document_register/subject_matter/berec/public_consultatio
ns/6974-stakeholder-consultation-on-the-review-of-the-berec-medium-term-strategy-
for-2018-2020
BEREC (2017e). What is BEREC. Retrieved on 05.06.2017 from
http://berec.europa.eu/eng/about_berec/what_is_berec/
Berners-Lee, T. History of the Web. Retrieved on 06.05.2017 from
http://webfoundation.org/about/vision/history-of-the-web/
Choi, J.B., Kim, P. (2010). Net neutrality and investment incentives. The RAND journal of
economics, Volume 41, Issue 3, 446–471. Retrieved from
https://www.jstor.org/stable/25746037?seq=1#page_scan_tab_contents
Easterby-Smith M., Thorpe R., Jackson P. R. (2015). Management & business research. 5th
edition. London: SAGE edge.
Economides, N., Himmelberg, C. (1995). Critical mass and network evolution in
telecommunications. Toward a competitive telecommunications industry: Selected
papers from the 1994 Telecommunications Policy Research Conference, Gerard
Brock (ed.) Retrieved from
http://www.stern.nyu.edu/networks/tprc.pdf

84
Edwards, E., Allen, A.J., Shaik, S. (2005). Market structure conduct performance (SCP)
hypothesis revisited using stochastic frontier efficiency analysis. Selected paper
prepared for presentation at the American Agricultural Economics Association
annual meeting, July 23-26, 2006. Retrieved from
http://ageconsearch.umn.edu/bitstream/21350/1/sp06ed01.pdf
Egeland, L. (2017, May 8). Business analysist at Ericsson (M. Guðjónsson & Á. Óskarsson
Interviewers).
European Commission (2015). A digital single market strategy for Europe. Retrieved from
http://eur-lex.europa.eu/legal-
content/EN/TXT/?qid=1447773803386&uri=CELEX%3A52015DC0192
European Commission (2016a). Evaluation of the regulatory framework for electronic
communications. Retrieved from
http://eur-lex.europa.eu/legal-content/SK/ALL/?uri=CELEX:52016SC0313
European Commission (2016b). 5G for Europe: An action plan. Retrieved from
https://ec.europa.eu/digital-single-market/en/news/communication-5g-europe-action-
plan-and-accompanying-staff-working-document
European Commission (2016c). Proposal for a directive of the European Parliament and of
the Council establishing the European Electronic Communications Code. Retrieved
from https://ec.europa.eu/digital-single-market/en/news/proposed-directive-
establishing-european-electronic-communications-code
Fransman, M. (2007). The new ICT Ecosystem: Implications for Europe. Kokoro.
Fransman M. (2010). The new ICT ecosystem: Implications for policy and regulations.
Cambridge: Cambridge University Press.
Folger, J. (2016). What is a virtual mobile network? Retrieved on 06.05.2017 from
http://www.investopedia.com/articles/personal-finance/030116/what-virtual-mobile-
network.asp

85
Friederiszick, H., Grajek, M., Roller, L.-H. (2008). Analyzing the relationship between
regulation and investment in the telecom sector. ESMI White Paper No. WP-108-01.
Retrieved from https://www.esmt.org/analyzing-relationship-between-regulation-and-
investment-telecom-sector
Garrone, P., Zaccagnino, M. (2015). Seeking the links between competition and
telecommunication investments. Telecommunications Policy, 39, 388-405.
https://doi.org/10.1016/j.telpol.2015.03.002
Gilbert, R., Newbery, D. (1982). Preemptive patentive and the persistence of monopoly.
American Economic Review, 72, 514-526. Retrieved from
https://www.jstor.org/stable/1831552?seq=1#page_scan_tab_contents
Grant, R.M. (2014). Contemporary strategy analysis. 8th edition. New Jersey: Wiley
Publishing.
GSMA (2015). GSMA comments on the draft BEREC report on OTT services (BoR (15)
142). Retrieved from
https://www.gsma.com/gsmaeurope/wp-content/uploads/2015/11/GSMA-Response-
to-BEREC-consultation-on-draft-report-on-OTT-services.pdf
GSMA (2016a). A new regulatory framework for the digital ecosystem. Retrieved from
https://www.gsma.com/publicpolicy/wp-
content/uploads/2016/09/GSMA2016_Report_NewRegulatoryFrameworkForTheDigit
alEcosystem_English.pdf
GSMA (2017a). Our purpose. Retrieved on 14.05.2017 from
http://www.gsma.com/betterfuture/ourpurpose/
GSMA (2017b). Competition policy. Retrieved on 12.05.2017 from
http://www.gsma.com/publicpolicy/regulatory-environment/competition-policy
GSMA (2017c). The mobile economy 2017. Retrieved from
https://www.gsma.com/mobileeconomy/#
86
Houngbonon, G., Jeanjean, F. (2016). What level of competition intensity maximises
investment in the wireless industry? Telecommunication Policy, 40, 774-790.
https://doi.org/10.1016/j.telpol.2016.04.001
Jeanjean, F. (2013) Static and dynamic causes of the decline in the price of mobile
telecommunication services. 24th European regional conference of the international
telecommunication society, Florence, Italy, 20-23 October 2013. Retrieved from
https://www.econstor.eu/bitstream/10419/88490/1/773976299.pdf
Jeanjean, F. (2015) What causes the megabyte price drop in the mobile industry? Econ Polit
Ind, 42, 277-296. Retrieved from
https://link.springer.com/article/10.1007/s40812-015-0013-6
Katz, M.L, Shapiro, C. (1994). Systems competition and network effects. The journal of
economic perspectives, Vol. 8, No. 2 (Spring, 1994), pp. 93-115. Retrieved from
https://www.jstor.org/stable/2138538?seq=1#page_scan_tab_contents
Kim, C., Kim, J. Yang, K.H. (2008) A strategy for third-party logistics systems: A case
analysis using the blue ocean strategy. Omega, Vol. 36, Issue 4, August 2008,
522–534. https://doi.org/10.1016/j.omega.2006.11.011
Kim, J., Kim, Y., Gaston, N., Lestage, R., Kim, Y., Flacher, D. (2011). Access regulation and
infrastructure investment in the mobile telecommunications industry.
Telecommunications Policy, 35, 907-919. https://doi.org/10.1016/j.telpol.2011.08.004
Kim, W.C., Mauborgne, R. (2005). Blue Ocean strategy. Boston MA, Harvard Business
School Publishing Corporation.
Lindmark, S. (2006). Techno-economic analysis - an introduction. Gothenburg, Chalmers
University.
Merrill Lynch - Bank of America (2017). Global Wireless Matrix 1Q13 & 3Q16 data.

87
Parrish, E.D. et. al. (2006). Niche market strategy for a mature marketplace. Marketing
intelligence & planning, Vol. 24 Issue: 7, 694-707.
https://doi.org/10.1108/02634500610711860
Porter, M.E. (1979). How competitive forces shape strategy. Harvard Business Review 57, no. 2 (March–April 1979): 137–145. Retrieved from https://hbr.org/1979/03/how-competitive-forces-shape-strategy
Porter M. E. (1980). Competitive strategy: Techniques for analyzing industries and
competitors. New York: Free Press.
Rogers E. (2003). Diffusion of innovations. 5th ed. New York: Free Press, pp. 2-37.
Sahin, I. (2006). Detailed review of Rogers diffusion of innovations theory and educational
technology-related studies based on Rogers theory. The Turkish online journal of
educational technology, April 2006 vol. 5 Issue 2 Article 3. Retrieved from
https://www.researchgate.net/publication/284675572_Detailed_review_of_Rogers'_dif
fusion_of_innovations_theory_and_educational_technology-
related_studies_based_on_Rogers'_theory
Röller, L.H & Waverman, L. (2001). Telecommunications infrastructure and economic
development: A simultaneous approach. The American Economic Review, 91(4), 909-
923. Retrieved from
https://www.jstor.org/stable/2677818?seq=1#page_scan_tab_contents
Saunders M., Lewis P., Thornhill A. (2016). Research methods for business students. 7th
edition. London: Pearson Education Limited.
Schumpeter (1942). Capitalism, socialism and democracy. New York; London: Harper &
Brothers
Smith (1756). The theory of moral sentiments. 6th edition. London: A. Miller

88
Szczepanski, M. (2016). The new European electronic communications code.
European Parliamentary research service. Retrieved from
http://www.europarl.europa.eu/RegData/etudes/BRIE/2016/593562/EPRS_BRI%2820
16%29593562_EN.pdf
Tingvall, P.G., Poldahl, A. (2006). Is there really an inverted U-shape relation between
competition and R&D? Economics of innovation and new technology, 15:2, 101-118.
http://dx.doi.org/10.1162/0033553053970214
The Boston Consulting Group (2013). Reforming Europe´s telecoms regulation to enable
the digital single market. Retrieved from
https://etno.eu/datas/publications/studies/BCG_ETNO_REPORT_2013.pdf
Wood, L. (1990). The end of the product life cycle? Education says goodbye to an old friend.
Journal of Market Management, Volume 6, 1990. Issue 2. Retrieved from
https://www.researchgate.net/publication/247494708_The_End_of_the_Product_Life_
Cycle_Education_Says_Goodbye_to_an_Old_Friend
5G Alliance (2016). 5G Manifesto for timely deployment of 5G in Europe. Brussels:
Telecom Industry. Retrieved from
http://telecoms.com/wpcontent/blogs.dir/1/files/2016/07/5GManifestofortimelydeploy
mentof5GinEurope.pdf