theory and application of linear programming
TRANSCRIPT

%,sw#è*@§
Valuation of Tr Coastal Resources:
Theory and Application of Linear Programming
J I I Li United Nations
Economic Commissionfor Latin America and the Caribbean
International Center for Living Aquatic Resources Management

y t P i . Q> H / c *1 5 T
CA Ç SB!BU0‘fCS '■
17 OCT 1997■v ............... J A
N A C O iB iifcaOAS A & ,, s m m - c m ^ y
Valuation of Tropical Coastal Resoui0 * ^ Theory and Application of Linear Programming
Edited by Annabelle Cruz-Trinidad
1996
yw v¿ b z/b - BIBLIOTECA"CËPÂL
United NationsEconomic Commissionfor Latin America and the Caribbean
International Center for Living Aquatic Resources Management
fe (o H (o 3
900026276

Valuation of Tropical Coastal Resources: Theory and Application of Linear Programming
Edited byA n n a b e l l e C r u z - T r in id a d
1996
Printed in Manila, Philippines
Published by the United Nations Economic Commission for Latin America and the Caribbean (ECLAC),Casilla 179-D, Santiago, Chile; and the International Center for Living Aquatic Resources Management (ICLARM), MCPO Box 2631, 0718 Makati City, Philippines.
ICLARM's technical services were developed in response to the lack of existing publishing outlets for longer papers on tropical fisheries research.
The ICLARM Studies and Reviews series consist of concise documents providing thorough coverage o f topics of interest to the Center, which are undertaken by staff or by external specialists on commission.
Essentially, all documents in the series are carefully peer reviewed externally and internally. A number have been rejected. Those published are thus primary literature. Between 600 and 1,000 copies of each title are disseminated - sold or provided in exchange or free of charge.
Cruz-Trinidad. A., Editor. 1996. Valuation o f tropical coastal resources: theory and application o f linear programming. ICLARM Stud. Rev. 25, 108 p.
Copyediting and indexing: Leticia B. Dizon Graphs and artwork: Albeit B. Contemprate Layout: Ariel C. Aquisap and Ma. Graciela R. Balleras
Cover: An abstraction o f the multiactivity feature o f the coastal zone. Lines represent the diverse resource use constraints and the hatched (shaded) area, the optimal allocation of resources. Illustration by Chris Bunao.
ISSN 0115-4389 ISBN 9 7 1-8709-72-X
ICLARM Contribution No. 1223
XCr -y \^ B?R! IO-tetoa A
/ ¡ p " '
| 1 7 OCT 1997C on tents Y q NACiONEb UNiüÁS
SANTIAGO-CHILE JV
F o rew o rd • M.J. W illiams, IC LAR M an d A. D ourojeanni, E C L A C ................................................................... v
F o rew o rd • D. P a u ly ............................................................................................................................................................. vi
P re face • A. C ru z-T rin id a d ............................................................................................................................................... viii
T h e In teg ra ted F u n c tio n a l C o effic ien ts M eth o d fo r C oasta l R eso u rces V aluation• M. A güero, A. C ruz-Trinidad, E. G on zalez and F. B e ll 1 L--
V alua tion C o n cep ts and T echn iques w ith A pp lica tions to C oasta l R esources• M. A güero and X. F lo re s .................................................................................................................................................... 9
O p tio n s fo r M an g ro v e M an ag em en t in the G u lf o f G uayaqu il, E cu ad o r• F. B ell an d A. C ru z-T rin idad ........................................................................................................................................ 17
O p tim iza tio n o f E conom ic B en e fits from F ishery , F o restry and T ourism in B io -B io , C h ile• E. A raneda, A. Cruz-Trinidad, F. M ora les an d A. A r e l la n o ............................................................................. 32
O ptions fo r L an d U se M an ag em en t in L in g ay en G ulf, P h ilipp ines• A. C ruz-Trin idad, Z. A lo ja d o and A. C a rg a m en to 64 ¿
O ptim al F lee t C o n fig u ra tio n in S an M iguel Bay, Philipp ines:A S im p le L in ea r P ro g ram m in g A p p ro ach• A. C ruz-T rin idad and L.R. G a r c e s ...............................................................................................................................78 £ ■
O PU S: In te rac tiv e S o ftw are fo r S o lv ing L in ea r P rog ram m ing M odels U singthe S im p lex A lg o rith m • M. A güero and S ta ff o f IC LAR M -E C LA C P r o je c t ................................................ 87
A p p en d ix 1 - D o cu m en ta tio n o f L P T a b le a u s ........................................................................................................... 97
A p p en d ix 2 - G lo ssa ry o f T echn ical T e r m s .................................................................................................................97
A u th o r/N am e I n d e x ............................................................................................................................................................ 100
G eo g rap h ic In d e x ................................................................................................................................................................. 102
S p ecies I n d e x ........................................................................................................................................................................ 104
iii


Foreword
T h is v o lu m e m arks the cu lm in a tio n o f IC L A R M and E C L A C 's co llab o ra tio n w h ich s ta rted in 1990 v ia the p ro jec t en titled "S oc ioeconom ic V aluation o f C oasta l R eso u rces in S o u th w est L a tin A m erica." T h e w o rld w id e tren d in en v iro n m en ta l deg rad atio n has n o t spared L atin A m erica , p articu la rly that in v o lv in g la rg e -sca le m angrove co n v ersio n in to sh rim p ponds, and co n flic tin g use o f aqua tic resou rces such as b y fisheries and by o th er industries. T h e p ro jec t aim s to derive app ro p ria te socia l and econom ic va lues fo r se lec ted coasta l resou rces in o rd e r to help ra tiona lize th e ir p re sen t use and m anagem en t. T he p ro jec t's im p o rtan t ach iev em en ts inc lude a lin ea r p rog ram m in g so ftw are package , O P U S ; app lica tions o f lin ea r p ro g ram m in g m odels to fo u r se lec ted sites in L a tin A m erica and the P h ilipp ines; and a rev iew o f ex is tin g v a lu a tio n m ethods fo r en v iro n m en ta l and na tu ra l resou rces. T h e esssen ce o f th e w o rk done by IC L A R M and E C L A C is fu lly cap tu red in th is volum e.
W e w o u ld lik e re search ers and m anagers to use and rev iew o u r w o rk in o rd e r to b e tte r und erstan d the d y n am ics o f co asta l m an ag em en t p rob lem s and to ap p recia te d ec is io n too ls such as O PU S . W e co m m en d all the au tho rs in c lu d in g IC L A R M and E C L A C s ta ff w h o co n trib u ted th e ir effo rts to this book.
M e r y l J . W il l ia m s
D irec to r G eneral ICLARM
A x e l D o u r o je a n n i
Chief, D ivision o f N atu ral R esources an d E nergy
E C L A C -U n ited N ations
Foreword
T h is b o o k co n c lu d es a jo in t p ro jec t on “S ocioeconom ic V aluation o f C oasta l R esources in S ou thw est L atin A m erica” b e tw een the U nited N ations E conom ic C om m ission fo r L atin A m erica and the C aribbean (E C L A C ), S an tiag o , C h ile , and the In tern a tio n al C en ter fo r L iv in g A qua tic R esources M an ag em en t (IC L A R M ), M an ila , P h ilip p in es , in itia ted in 1990, b u t w hose an teceden ts reach m u ch deeper. O ne key sta rtin g p o in t w as th e do cto ra l thesis o f the lead e r o f th a t p ro jec t, Dr. M ax A güero , on C h ilean fisheries, w h ich u sed L in ea r P ro g ram m in g (L P) as its m ajo r tool. Dr. M ax A güero jo in e d IC L A R M in M arch 1986 and h ad so o n co n v in ced his co lleag u es th a t L P cou ld serve as fram ew o rk fo r stud ies o f co m p lex b io so cio eco n o m ic system s such as the pelag ic fisheries o f Peru, or the floodplain fisheries o f B ang ladesh , s tu d ied in th e co n tex t o f a Ph .D . thesis that he superv ised .
It w as lo g ica l th u s to assum e th a t L P w o u ld also be app licab le to the study o f co asta l areas, w hose ap p a ren t co m p lex ity th en seem ed to defy fo rm al analysis, a llow ing on ly co n cep tu a l desc rip tio n . A p ro jec t to te s t th e su itab ility o f L P -b ased app roaches fo r the ana lysis o f in te rsec to ra l in te rac tio n and the v a lu a tio n o f co a s ta l reso u rces w as thus conceived , and E C L A C id en tified as the b es t p o ssib le p artn e r fo r such ven tu re .
Dr. M . A g ü e ro re lo ca ted from M an ila to S an tiago in A pril 1990, and im m ed ia te ly b u ilt a team co n sis tin g o f y o u n g re search ers and a p ro g ram m er to d eve lop and tes t su itab le L P softw are , and to app ly the L P ap p ro ach to various sites in C h ile and the E cu ad o rian coast.
F o r the p ro jec t to have developed its ow n L P softw are (“O P U S ” , see below ) m ay appear unnecessary , as co m m erc ia l p ack ag es ex ist - as s tand a lone app lica tions, o r as part o f sp read sh ee t p ro g ram s (e .g ., M ic ro so ft E x ce l, Q u a ttro P ro) - w h ich can h and le such p rob lem s. H ow ever, sp read sh eets w ith L P ap p lica tio n s d id n o t ex is t w hen the p ro jec t s tarted , and w ere no t an ticipated .
O ne p a rtic u la r p ro b lem w h ich the p ro jec t had to tack le w as the co stin g o f n o n m ark e t goods and serv ices, i.e ., th e “ in te rn a liza tio n ” o f (or: exp lic itly accoun ting for) w ha t econom ists call “ex te rn a litie s” . T he co n trib u tio n s in this book p rovide som e practical approaches fo r do ing this. Still, this vex ing p rob lem is g o in g to co n tin u e to b e w ith us and con tin u e to be a m ajo r cause fo r en v iro n m en ta l d eg rad a tio n and po llu tion .
T h e IC L A R M -E C L A C C oasta l V aluation P ro jec t w as fo reseen to have tw o phases, P h ase I fo r co n cep t an d so ftw a re d ev e lo p m en t and P hase II, fo r th e ir app lica tion to various sites in C h ile and e lsew here in S o u th A m erica. In June 1992, an ex ternal rev iew panel led by Dr. L. F allo n -S cu ra concluded th a t the p ro jec t w as “tech n ica lly sound, the m ethods d eve lo p ed p o ten tia lly useful, is com patib le with the fu tu re IC L A R M a n d therefore, should continue w ith P h ase I I ”. U nfortunate ly , IC L A R M did no t h av e the co re fu n d s req u ired fo r P hase II o f the pro ject.
M s. A b b ie C ruz-T rin idad , an IC L A R M researcher w ho had p rev iously co llabo ra ted w ith Dr. A güero, to o k o v er th e ta sk o f com ple ting and ed iting the p ub lica tion from the n um erous in terna l repo rts p rep ared d u rin g P h ase I o f th e p ro jec t, and thus docu m en tin g the app lica tion o f O PU S to various sites in C h ile and E cuador. M o reo v er, she team ed up w ith s ta ff from tw o o th er IC L A R M research p ro jec ts - one co v e rin g S an M ig u e l B ay, the other, L ingayen G ulf, bo th in the Ph ilipp ines, to show that the L P approach d ev e lo p ed b y the IC L A R M -E C L A C team also w o u ld w ork in the S o u th east A sian con tex t.
W e tak e th e su ccess o f th is tran sfe r from S outh A m erica to S o u th east A sia as im p ly ing tha t the ap p ro ach d o cu m en te d in this b o o k can be app lied to any coastline . H ow ever, w e do no t suggest th a t this ap p ro ach sh o u ld ev e r b e used alone: the com plex ities w ith in and am ong sec to ral in te rac tio n s o ccu rring along the co as tlin es o f the w orld can n o t be described , le t a lone p red ic ted by the v ariab les - h o w ev er n u m ero u s th ey m ay b e - o f any sing le m odel. T h is im p lies that w h e rev er possib le , a w id e varie ty o f
vi
m eth o d o lo g ica l app roaches shou ld be used w ith the one p resen ted in th is b o o k b e in g one am o n g others.I co n g ra tu la te the au tho rs o f the co n trib u tio n s inc lu d ed in this book , esp ec ia lly Dr. M ax A giiero , fo r
th e ir d a rin g to q uan tify and thus ren d er av a ilab le fo r ana lysis coasta l in te rac tio n s w h ich o th ers w ou ld have on ly ta lk ed abou t, and M s. A bb ie C ruz-T rin idad , fo r ris ing to the ch a llen g e o f ed itin g th is vo lum e.
F inally , I th an k the E conom ic C o m m issio n fo r L atin A m erica and the C arib b ean (E C L A C ) fo r b e in g a g rac io u s h o s t to the p ro jec t th a t led to th is b ook , and fo r its help in m ain ta in in g co m m u n ica tio n s b e tw een the ed ito rs and the now sca tte red con tribu to rs .
D a n i e l P a u l y P rin cipa l Science A dvisor, IC LA R M

Preface
T h is v o lu m e co n ta in s sev en p ap e rs , tw o o f w h ich ta ck le th e c o n c ep tu a l e lem e n ts o f L in ea r P ro g ram m in g and resou rces v aluation ; fo u r are app lica tion papers w h ile the las t is the u se rs ’ m anual in su pport o f O P U S , the L P softw are d ev e lo p ed by th is p ro ject. Tw o ap p lica tio n papers are from L atin A m erica: one fro m the B io -B io reg io n in C h ile and the o th er from the G u lf o f G uayaqu il, E cuador. T he o th er tw o are from the P h ilipp ines: S an M iguel Bay, in B ico l p ro v in ce , fo r w h ich IC L A R M co n d u c ted m u ltid isc ip lin a ry stud ies in 1980 and 1992; and L in g ay en G ulf, a lso the site o f IC L A R M ’s co asta l area m an ag em en t p ro jec t (1986-1991) and later, G eograph ic In fo rm atio n S ystem s (G IS) app lica tio n s. T he L P tab leau s u sed fo r these app lica tion pap ers are availab le in sp read sh ee t fo rm and are d esc rib ed in A giiero e t al. (th is vo l.)
I ex am in e in m any w ays the lim ita tio n s p osed by L P and the im p o rtan ce one m ust m ust g iv e to the d a ta u sed by the m odel. B u t then , every m odel, no m atter how elabora te , has its lim ita tions. It is how w e in terp re t the m o d els and th e ir ou tpu ts th a t m atters. A s fo r the u sefu ln ess o f th is exercise , I inv ite the read ers to decide.
I leav e fo r last th a t w h ich I re lish m ost— to g ive c red it to those w ho m ad e th is v o lum e possib le . I th an k M r. A lex is F ab u n an w ho p ain stak in g ly reconstructed the L P tab leau s u nder the m o st co nstra in ing c ircu m stan ces (a 286 co m p u te r w ith som e 4 m egabytes o f R A M to h an d le a 78 0 x 560 m atrix !); Mr. A lv in C ata lan w ho h e lp ed m e co m p le te the b ib lio g rap h ic en tries, d ev e lo p ed the g lo ssary o f techn ical term s, and fin a lized the ind ices; M r. F .S.B . Torres, Jr. fo r help in g m e w ith the spec ies in d ex and the A p p en d ix to th e p ap e r by A ran ed a et al.; Dr. W illiam S underlin , fo rm er IC L A R M staff, no w w ith the C en ter fo r In te rn a tio n a l F o restry R esearch (C IF O R ) w ho helped m e reco n stru c t the spec ies append ix fo r the fo restry sec to r o f B ío-B ío ; M r. F.C. G ay an d o , Jr. and M r. E li G arn ace fo r rev iew in g the so ftw are and fo r rev is in g the user's m anual; M s. M erly M ed in a fo r her ass is tan ce in the ty p in g and p rin tin g o f m an u scrip ts and tab les; D rs. R obert P om eroy and M ahfuz A hm ed , fo r tak in g tim e o u t to read the co n cep t p ap e rs and fo r freely p ro v id in g som e construc tive com m ents; and Dr. M ery l W illiam s, fo r her su pport o f the w hole project.
T h is w o rk w ou ld no t have been po ssib le w ithou t the fo resigh t, in d u stry and ta len t o f Dr. M ax A güero and his team o f experts from the IC L A R M -E C L A C pro jec t, sp ec ifica lly M s. F ab io la B ell, M s. A n g e lica A re llan o , M r. E dgardo A raneda , Mr. F ranc isco M ora les, all au thors o f the pap ers in th is vo lum e. I th an k m y co -au tho rs, specifically , M s. Z o ra id a A lo jado and M r. L en G arces o f IC L A R M and M s. A gnes G race C argam en to o f the N atio n al E conom ic and D ev elo p m en t A u thority o f the P h ilipp ines (N E D A -R eg io n I) fo r th e ir co o p era tio n desp ite the short no tice and ex trem ely tig h t schedu les.
I th an k Dr. D an ie l P au ly w hose u n fa iling support and en co u rag em en t I b eg an to ex p e rien ce in 1986 w hen he w as then D irec to r o f the R eso u rce A ssessm en t and M an ag em en t P rog ram , la te r to b eco m e the C ap tu re F isheries M an ag em en t P rogram . I thank h im m ost especially because as a sc ien tist fro m ano ther d isc ip line , he d id n o t ham p er m y p ro fessio n al and in te llec tua l in terests in the ‘o th e r ’ sc ien ces (i.e., eco n o m ics) and had in fact en co u rag ed m e to p roduce w o rk that I am very p roud o f today.
A n n a b e l l e C r u z - T r in id a d
R esearch A ssocia te , ICLARM
The Integrated Functional Coefficients Method for Coastal Resources Valuation*
M a x A g ü e r o ' , IC LA RM -EC LAC Project on the Socioeconomic Valuation of Coastal Resources in Southwest Latin America, Casilla 179-D, Santiago, Chile
A n n a b e l l e C r u z - T r i n i d a d , International Center for Living Aquatic Resources Management (ICLARM), MCPO Box 2631, 0718 Makati City, Philippines
E x e q u e l G o n z a l e z 1, ICLARM-ECLAC Project on the Socioeconomic Valuation of Coastal Resources in Southwest Latin America, Casilla 179-D, Santiago, Chile
F a b i o l a B e l l 2, IC LA RM -EC LAC Project on the Socioeconomic Valuation of Coastal Resources in Southwest Latin America, Casilla 179-D, Santiago, Chile
AGÜERO, M„ A. CRUZ-TRINIDAD, E. GONZALEZand F. BELL. 1996. The integrated functional coefficients method for coastal resources valuation, p. 1-8. In A. Cruz-Trinidad (ed.) Valuation o f tropical coastal resources', theory and application o f linear programming. ICLARM Stud. Rev. 25, 108 p.
Abstract
The integrated functional coefficients method is described as a linear programming algorithm that perm its analysis o f coastal systems with diverse and conflicting economic uses. A simple guide to the application o f the technique is provided.
Introduction
T he In tegrated Functional C oefficients (IFC) method is a tool based on linear program m ing theory that was enhanced and tested by a project jo in tly im plem ented by the In ternational C enter for L iving Aquatic R esources M anagem ent (ICLARM ) and the Econom ic C om m ission fo r Latin A m erica and the C aribbean (EC LA C ) on Socioeconom ic Valuation o f C oastal R esources in Latin A m erica from M ay 1990 to January 1993. C om plem entarily , linear programming software3 was developed and applied in various sites and problem s o f varying complexity,
* ICLARM Contribution No. 1217.'Present address: International Center for Sustainable Ecological
Development (ICSED), Casilla 27004, Santiago, Chile.2Present address: Calle Edinburgo 520, Depto. 102, Las Condes,
Santiago, Chile.‘OPUS is linear programming software developed by the ICLARM-
ECLAC Project on Socioeconomic Valuation of Coastal Resources in Latin America. The user's manual is on p. 89.
in c lu d in g : o p tim a l d ev e lo p m e n t s tra te g ie s fo r mangroves in the G ulf of Guayaquil, Ecuador (Bell and C ruz-Trinidad, this vol.) and land use in the Lingayen G ulf area, Philippines (Cruz-Trinidad et al., this vol.); optimal fleet allocation in San M iguel Bay, Philippines (Cruz-Trinidad and Garces, this vol.); and optim al p roduction and m arketing stra teg ies fo r fisheries and forestry in Bio-Bio, Chile (Araneda et al., this vol.).
The IFC method was designed to consolidate all negative (costs) and positive (revenues) flows resulting from different levels of resource exploitation activities into a single numeraire, i.e., economic value. The IFC method derived its name from its features, namely: (i) the highly integrated approach to m anagem ent o f re so u rce system s and (ii) the u se o f fu n c tio n a l coefficients to represent input-output efficiency.
Framework for Analyzing Coastal Resource Systems
A coastal resource system can be conceptualized as encompassing the interactions between and among the biophysical, terrestrial and marine environments and hum an a c tiv itie s , in c lu d in g th e g o v ern in g institutional and organizational arrangements (Scura et al. 1992). The coastal area is characterized by multiple resources and by multiple users and uses of resources leading to potential conflict, m ismanagement, and ultimately, economic loss.
Two basic paradigm s w ere used: i) the Total Econom ic Value (TEV ) which is used to identify different sources of value em anating from various coastal resources, and ii) the system s approach, to ana lyze the w hole sysjgiji, its com p o n en ts, and interactions. ‘
Several sources of value can be attributed to coastal resources including its use and nonuse values. A resource, such as a fish stock or charcoal, can either be directly valued as an economic good, or indirectly valued for its potential or ecological functions. The valuation o f indirect goods and services is not as straightforward as those o f the marketable kind but potentially applicable m ethods are availab le (see Agiiero et al., this vol.). A useful exercise in valuation is the identification o f in terrelationships betw een resources and their components.
In te rre la tio n sh ip s betw een a re so u rce or its com ponent is marked by a (+) if it is used as an input
1

to another activity and a (-) if use of a resource impinges on the current and potential use of another (Table 1). A quaculture and urban expansion often necessitate mangrove conversion (see Bell and Cruz-Trinidad, this vol.) and are thus marked as (-). M angroves and, to a certain extent, seagrass beds, provide critical habitats for the juveniles of coral reef fish and crustaceans as well; these are marked (+) in the matrix. The negative im pact o f aq u acu ltu re , ag ricu ltu re , and m ineral extraction on capture fisheries and coral reef and seagrass ecosystems is via pollutants emanating from productive processes. For each resource category, there are market and nonm arket goods and services that add to the economic value. The matrix is particularly helpful in identifying indirect values or externalities imposed on certain resources.
After relevant valuation work has been made, the mode of analysis conforms to the “systems approach” which M attessich (1984) described as having strong em phasis on inpu t-ou tpu t features and a purpose orientation. In addition, Laszlo (1972) noted that it is a “way o f thinking about phenomenon in terms o f wholes, including all o f the parts, components or subsystems and their interrelationships.”
The coasta l zone can be view ed as an entity com prised o f several interacting sources of value. The magnitude and direction of interrelationships between these sources should then be identified and, if possible,
2
quantified, such that the effect on TEV o f changes in resource endowment or linkages can be anticipated. The TEV for the coasta l system is not a sim ple summation of the value of different sectors. Instead, the TEV accounts for dynamic functions within the system. This dynamism is embedded in the constraints posed by the use and dependency on a single resource base (natural, human and technological), the functional relationships between and among production inputs and output, and by the sequence of activities leading to an economic good. Thus, negative externalities caused by mismanagement o f a particular resource would lead to the detriment of those marked (-) in the matrix and would ultimately cause a reduction in the TEV.
Perhaps the most common conflicts occur at the level of goal-setting. In the paper by Araneda et al. (this vol.) the choice as to whether fishery, forestry or tourism should be developed is of importance because the priority given to one activity implies that fewer resources are made available for other possible uses. Bell and Cruz-Trinidad (this vol.) also posed a crucial question as to the conversion vis-à-vis conservation of mangroves, which involves foregoing present shortterm gains from shrimp aquaculture for longer-term benefits. Such is also the problem recognized by CruzTrinidad et al. (this vol.) in the conversion o f low- yielding rice farms to shrimp and/or milkfish culture. Within the San M iguel Bay fishery (Cruz-Trinidad and
Table 1. Example o f some coastal resources/activities and related influences and impacts.
Resources/activities1
Influences and impacts2
MG AQ CF CR SG AG MN OG SP SM HB UD CV
Mangrove/nipa swamp (MG) XXX _ + + + _ _ . . _ 4* _ .
Aquaculture (AQ) - XXX o o - - - - - - O - -Capture fishery (CF) 0 0 XXX - - 0 - - 0 0 0 - 0Coral reefs (CR) + + + XXX + - - - - - + - +Seagrass beds (SG) + - + + XXX - - - - - + ■ - -Agriculture (AG) - - - - - XXX - - 0 0 0 - -Mineral extraction (MN) - - - - - - XXX 0 0 0 - + -Oil and gas (OG) - - - - - - - XXX - - - + -Salt production (SP) - - 0 0 0 0 0 - XXX 0 0 - -Sand mining (SM) - - - - - 0 0 0 0 XXX - + -Habitat nesting (HB) + - + + + - - - - - XXX - +Urban development (UD) - - - - - - + + + + - XXX -Coastal vegetation (CV) + - 0 + + - - - - - + - XXX
'Adapted from Dixon (1989)."Prepared by Mr. Keene Haywood, Reefbase volunteer, February-June 1995. + = input.- = negative impact, o = minimal impact, may be (+) or (-).

Garces, this vol.) conflicts arise from the choice of particular gear types.
a ,x, + a ,x .+m i l m2 2 + a xnin n <= b •4)
Linear Programming
The preceding section indicates that for a particular resource system, several decisions are to be made. This section presents a range of possible tools to enable the dec isionm aker to arrive at a decision and further an ticipate im pacts caused by changes in resource endow m ents or in the in terre lationsh ips betw een activities on the decision variable.
Features
Linear programming (LP) is an operations research m ethod developed in the 1940s for use in m ilitary applications, and now widely used in business and agriculture. Early applications of the method assumed profit m aximizing behavior, a single-period planning horizon, and no consideration for risk and uncertainty. S ub seq u en t developm ents, how ever, proved that programming models can be more realistic and flexible. Advanced m odeling techniques include multiperiod lin e a r p ro g a m m in g , m u lti-o b je c tiv e m o d elin g , non linear program m ing, game theory m odels and stochastic program ming (Hazell and Norton 1986).
LP m odels address a sing le, linear objective function that is optimized subject to a set of rigid linear constraints (Ignizio 1985). Assumptions implicit in the productive processes, resources and activities in the linear program m ing m odel include: optim ization, fixedness, fin iteness, determ inism , hom ogeneity , additiv ity and proportionality (H azell and Norton1986).
The general formation of a linear program is as follows:
x., x,,..., x > = 0 ...5)
M axim ize
P . x , + P2x2 + ...... + Pnxn
subject to
a iix ] + a |2x2 + + a ]nxn < = b ,
a2|x , + a 22x2 + + a2nxn<= b2
...1)
...2)
...3)
Equation (1) is the objective function, here, a maximization problem. The X ’s are the unknowns or decision variab les w hile the P ’s are the re la tive contribu tion o f each variable to the value o f the objective function. The a ’s represent the amount ofJ inn -r
resource b needed by activity or sector, X. The b ’s are the upper or lower limit of a resource use and in an LP tableau are usually referred to as the right-hand side (RHS) limits. Equations (2) to (4) are the constraints; Equation (5) is the nonnegativity clause. The above formulation is also called the primal problem.
The dual, which is the converse o f the primal, is formulated as follows:
M inimize
b.w, + b .w .+ .... + b wI ] 2 2 m m
subject to
a nw, + a .,w . + + a ,w >= p,111 12 2 m I m r Ia.,w . + a,,w . + + a _w >= p,12 I 22 2 m2 m r 2
a, w. + a, w , + + a w >= pIn I 2n 2 inn in r n
w., w,,..., w >= 0.I’ 2 ’ ’ in
Note that the dual formulation is actually equivalent to the primal, i.e., the maximization problem (primal) and the inverse of the minimum (dual) are one and the same. The solution to the primal problem provides the optimizing values of the variables and the resulting value of the objective function.
T h e e x is te n c e o f the du al so lu tio n in any conven tional LP fo rm ulation is one o f the m ore important reasons for its popularity. The dual can be interpreted as shadow price or opportunity cost of a particular resource. As such, it is also a measure of the marginal increase in the objective function given an

increase in the availability of the resource. Sensitivity analysis permits further analysis by varying coefficients in both the objective and input-output matrices, right- hand side limits, and the inclusion of a new goal or constraint. This was done for the San M iguel Bay study, i.e., level of fishery net revenues as affected by changes in total allowable catch rates and minimum wage rates (Cruz-Trinidad and Garces, this vol.).
Applications
Linear programming was first applied to fisheries by Rothschild and Balsiger (1971) to allocate the catch of sockeye salmon during a run in Bristol Bay. Siegel et al. (1979) used LP to maximize catches of the New England otter trawl fishery subject to total allowable catch, processing and harvesting capacity, based on an earlier work by M ueller (1976). Agiiero (1987) used LP to model the Peruvian fishery and utilized six sequential activity blocks beginning from harvesting to processing, storage, transport, marketing and sales to arrive at, am ong other things, optim al rates of resource exploitation, plant rated capacities and prices.
Subsequent developments permit the incorporation of multiple-planning periods, risk and uncertainty into the model. M cCarl and Spreen (1980) have suggested that price need not be an exogenous variable in LP form ulations w hile Shepherd and G arrod (1980) developed a method of cautious nonlinear optimization which reso lves the tendency o f L P resu lts to be “extreme, sparse and ruthless” and which “considers the in itia l s tate o f the system w hen seek ing the optimum” . These improvements are incorporated via a com posite objective function w hich consists o f penalties for (i) failing to conform to one or more constraints, i.e., quota allocations and (ii) a penalty for departing from the status quo, i.e. historical average catch rates, and (iii) one or more objectives to be minimized. Huppert and Squires (1986) applied this technique to the Pacific coast groundfish trawl fishery and estimated maximum economic surplus and optimal fleet configuration.
Further development in the area of mathematical programming has resulted in dynamic optimization as used by Dow (1993) in the regulation of bowhead whales and Kennedy and Watkins (1986) in the southern bluefin tuna fishery. Wallace and Brekke (1986) used stochastic optimization in the Norwegian purse seiner and summer capelin fishery in the Barents Sea.
4
T he app lica tions o f p rog ram m ing m odels to economic-environmental systems are diverse, ranging from fo rest m anagem ent, env ironm en ta l quality m odels, p e tro leu m re fin in g and e le c tr ic p ow er generation, to complex regional and national models for optimal utilization o f water resources (Hufschmidt et al. 1983).
D espite the fast-paced developm ent in m athematical program ming techniques, LP applications in developing countries in both fisheries and coastal environments are few. Two have been identified in the l i te ra tu re , th e w o rk s o f P a d il la (1 9 9 1 ) , u sin g m ultiobjective program m ing to determ ine optim al effort in the small pelagics fishery in the Guimaras S trait, W estern V isayas, P h ilipp ines, and A hm ed (1991), using price endogenous linear program ming to estim ate net social benefits o f different types of fisheries, i.e., hilsa, prawn, catfish and carp in the floodplains of Bangladesh. The latter also involved segmentation o f both objective function and constraints into harvesting, postharvest and marketing blocks. The apparent underutilization of mathem atical program ming and its enormous potential for use in fisheries and coastal systems in developing economies, show that the applications in this volume, and the use of OPUS, the LP software developed for this purpose, can be a significant contribution to the literature.
Potentially Applicable Techniques
H u fs c h m id t e t a l. (1 9 8 3 ) s u g g e s te d tw o analytical fram ew orks fo r m ultiactiv ity econom ic- en v ironm en ta l m odels: lin ear p ro g ram m in g and input-output (I-O ) m odels. The latter was developed by L eontief (1936) [thus, the alternate term , Leontief m atrix ] and em p h a s iz e s th e in te rre la tio n s h ip s b etw een p ro d u c tio n ac tiv itie s . E ach p ro d u c tiv e activity assum es dual roles: first, as a supplier of o u tp u t to o th e r a c tiv itie s and fin a l b u y ers and second, as a buyer o f inputs including land, labor, cap ita l and the outputs o f o ther activ ities . As in standard econom ic system s, the final dem and for goods and services determ ines the 1-0 coefficients o f econom ic-environm ental m odels. 1 -0 analysis perm its the decisionm aker to sim ulate changes in eco n o m ic and en v iro n m e n ta l q u a lity v a riab le s related to d ifferent econom ic developm ent scenarios an d /o r ch an g es in fin a l d em an d fo r goods and services (H ufschm idt e t al. 1983).

The following analytical techniques are extracted from a list provided by Hyman and Stiftel (1988) for Environmental Impact Assessment (EIA), which we have identified to be relevant to coastal resources as well. Sorenson (1971) devised a network or stepped matrix for which the primary focus is the environmental cost of coastal land uses. Fifty-five coastal zone uses are entered in the matrix rows. The columns represent i) causal factors, i.e., specific activities associated with particular land uses;ii) initial conditions; iii) secondary impacts; iv) ultimate environmental effects and v) management interventions. The Sorenson network has been applied to commercial, residentia l and transportation developm ent in the Californian coastal zone.
Hill (1968) developed the multiple objective analysis or goals achievement matrix. This procedure involves the definition o f important objectives and the subsequent assignment of weights. The crucial step is the anticipation of impacts of each objective. Hill and Alterman (1974) used multiple objective analysis to assess alternative sites for power plants. A related procedure is decision analysis (Keeney and Raffia 1976) although this technique places greater emphasis on systems modeling and evaluation under risk and uncerta in ty . T he firs t step is the identification of objectives and assignment of “attributes” per objective. The next steps involve prediction o f future values fo r each a lternative p lan and selection o f p re fe ren ces am ong the various a lte rn a tiv es . Decisionmakers base their final decision on the alternative which maximizes utility. Decision analysis was used to predict the impact of a nuclear power plant on salmonid stocks (Keeney and Robilliard 1977).
The United States Fish and Wildlife Service (1980) developed a H abitat E valuation Procedure (HEP), which evaluates the effects o f development on a single aspect o f the environment — fish and wildlife habitats. The H EP enables decisionm akers to select am ong different project alternatives and to design mitigation and com pensation measures. First, the habitat types in the area are mapped out and indicator species identified on the basis o f eco n o m ic o r socia l im portance , sensitivity to proposed actions, role in nutrient cycling and energy flows, and representativeness in various ecological niches. The decision rule is then based on po ten tial changes in “hab ita t u n its” (habita t area multiplied by habitat sustainability index).
The IFC Method and Its Implementation
The integrated functional coefficients method was designed to determ ine the social and economic value o f coastal resources within an integrated concept of the coastal ecosystem and its functions. The elements are the same as that o f standard LP form ulation except that the definitions are largely expansive. The objective function (Net Social Benefit Function) is structured in terms o f the Total Econom ic Value concept (Randall1987) allowing externalities and nonm arket goods, services and functions to be considered. U nit cost coefficients and prices are exogenous to the model and d e te rm in e d u s in g s ta tis tic a l te c h n iq u e s a n d /o r econometrics, whichever is applicable. The resulting measure of net revenue is a m easure o f Net Social Benefit valued at the best alternative use given the constraints imposed on the system.
E ach a c tiv ity is c o n s tra in e d by re so u rc e s availability, technological efficiency, cost structures, input and output market conditions and institutional fa c to rs . T he m e th o d o lo g y is d e r iv e d from the integration of several sources of value under several restraining conditions.
The elements of an IFC linear program as applied in a coastal resource system are as follows:
(i) O b jec tiv e F u n ctio n
M axim ize n
11 — ^-(P ijk lm nop ' ^ i jk lm n o p )~ ^-'(C jjk lm nop ' ^ ijk lm n o p )
where
n
X ,.i jk lm nop
1
= net social benefit function
= good or service corresponding to
= spatial location o f the resource, i.e., country, region, zone, subzone;
= economic sector, i.e., fisheries, tourism, forestry, mining, aquaculture;
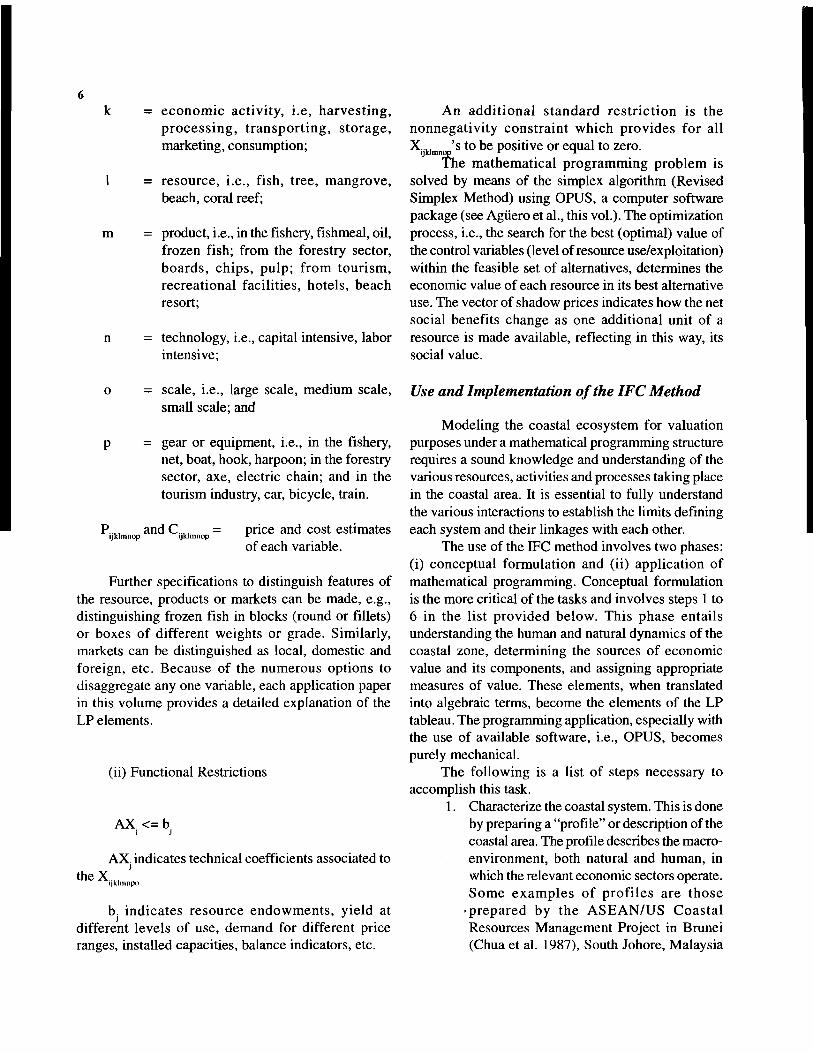
k = eco n o m ic ac tiv ity , i.e , h a rv e s tin g ,p ro c e s s in g , tra n s p o r tin g , s to rag e , marketing, consumption;
1 = reso u rce , i.e ., fish , tree , m angrove,beach, coral reef;
m = product, i.e., in the fishery, fishmeal, oil,frozen fish; from the forestry sector, b o a rd s , ch ip s, pu lp ; fro m to u rism , recrea tio n a l fac ilities , ho tels, beach resort;
n = technology, i.e., capital intensive, laborintensive;
A n a d d itio n a l s ta n d a rd re s tr ic t io n is the n o n n eg a tiv ity co n s tra in t w hich p ro v id es fo r all X.... ’s to be positive or equal to zero.
ijk lm n o p r *
T he m athem atica l p rogram m ing p rob lem is solved by means o f the simplex algorithm (Revised Simplex Method) using OPUS, a com puter software package (see Agtiero et al., this vol.). The optimization process, i.e., the search for the best (optimal) value of the control variables (level of resource use/exploitation) within the feasible set of alternatives, determines the economic value o f each resource in its best alternative use. The vector of shadow prices indicates how the net social benefits change as one additional un it o f a resource is made available, reflecting in this way, its social value.
o = scale, i.e., large scale, m edium scale,small scale; and
p = gear or equipment, i.e., in the fishery,net, boat, hook, harpoon; in the forestry sector, axe, electric chain; and in the tourism industry, car, bicycle, train.
P..,, an d C ,, = price and cost estimatesijk lm n o p ijk lm n o p r
of each variable.
Further specifications to distinguish features of the resource, products or markets can be made, e.g., distinguishing frozen fish in blocks (round or fillets) or boxes o f d ifferen t w eights or grade. Sim ilarly, markets can be distinguished as local, domestic and foreign, etc. B ecause o f the num erous options to disaggregate any one variable, each application paper in this volume provides a detailed explanation of the LP elements.
(ii) Functional Restrictions
AX <= bj j
AX indicates technical coefficients associated to th e X ,, '
ijk lm npo
b. in d ica te s re so u rce endow m en ts, y ie ld at different levels o f use, dem and for d ifferent price ranges, installed capacities, balance indicators, etc.
Use and Implementation of the IFC Method
M odeling the coastal ecosystem for valuation purposes under a mathematical programming structure requires a sound knowledge and understanding o f the various resources, activities and processes taking place in the coastal area. It is essential to fully understand the various interactions to establish the limits defining each system and their linkages with each other.
The use of the IFC method involves two phases: (i) conceptual form ulation and (ii) application o f mathematical programming. Conceptual formulation is the more critical of the tasks and involves steps 1 to 6 in the list p rov ided below . T his p hase en ta ils understanding the human and natural dynamics o f the coastal zone, determ ining the sources o f economic value and its components, and assigning appropriate measures of value. These elements, when translated into algebraic terms, become the elements o f the LP tableau. The programming application, especially with the use o f available software, i.e., OPUS, becomes purely mechanical.
The follow ing is a list o f steps necessary to accomplish this task.
1. Characterize the coastal system. This is done by preparing a “profile” or description o f the coastal area. The profile describes the macroenvironm ent, both natural and hum an, in which the relevant economic sectors operate. S om e ex a m p le s o f p ro f ile s a re th o se
•p rep a red by th e A S E A N /U S C o as ta l Resources M anagem ent Project in Brunei (Chua et al. 1987), South Johore, M alaysia

(ASEAN/US CRM P 1991), Lingayen Gulf, Philippines (McManus and Chua 1990), Ban Don Bay and Phangnga Bay, Thailand (Paw e t al. 1988), S eg a ra A n a k an -C ila cap , Indonesia (W hite et al. 1989).
2. D eterm ine relevant sectors and activities. Econom ic activities should be based on the fo llow ing factors: ou tput (production in physical and m onetary term s); yield (net n a tu ra l g row th per u n it o f inpu t); em ploym ent (per category of skills required); incom e (p e r lo ca tio n , ca teg o ry o f em ploym ent; local/foreign); spatial location, and impact on other sectors.
3. Identify variables that either contribute to or m inim ize econom ic value and determ ine th e re a f te r , th e a c tiv it ie s o r e lem e n ts influencing such. For example, if the relevant sectors are aquaculture and forestry, the variables that add to economic value may include shrimps and logs, respectively. The export o f shrimp would require the following activities: clearing of mangroves, stocking o f ponds, harvesting , processing , transporting, and m arketing, each o f which is characterized by different price vectors as well as constraints.
4. Collect data required, including market and n o n m a rk e t p r ic e s , p ro d u c tio n lev e ls , technological capacities and magnitude of externalities.
5. Establish functional relationships among the components, determining production, yield and demand functions.
6. C onstruct the mathem atical program ming tableau structure including the objective function, input-output matrix, and restriction vector (right-hand side).
7. Feed the tableau and conduct preliminary co n s is te n c y te s ts , i .e ., d eg en e racy , unboundness, etc.
8. R un O PU S and d e te rm in e n ec e ssa ry improvements in data quality.
9. A nalyze and validate results. Verify that results obtained in actual application are consistent with theory and the control factors pre-established for this purpose
10. Interpret final results and conduct sensitivity analysis. The final results provide estimates
o f economic (primal) as well as social (dualshadow vector) values. Sensitivity analysis m easures the effect of exogenous changes in prices and resources availability on the net social benefit (Value o f the Objective Function) and those of the variables.
Discussion
There are no hard and fast rules in the use of IFC methods especially when applied to diverse environments such as coastal zones. The list shown above, though unco m fo rtab ly loose, p ro v id es the basic e lem ents fo r the ana lysis and app lica tion o f the technique. This is borne by the four application papers in this volume which may have varied applications but which, nevertheless, manifest all these elements.
A critica l, though exogenous, aspect o f this exercise is the use o f appropriate price coefficients, especially when imperfect market conditions exist or when nonmarket transactions occur. The whole area o f valuation and applicable techniques are discussed in Agiiero and Flores (this vol.).
This volum e does not attem pt to break new ground in m ethodological developm ent; rather, the em phasis is on using tested techniques on broader applications. Thus, the development o f the conceptual issues is of greater weight than the application of the technique itself. Complementarily, we invoke Holling’s (1978) caveat on the use of mathematical programming techniques: while we should not be slaves of the model, it offers a sensible start for analytical and predictive purposes.
References
Agiiero, M. 1987. A bioeconomic model o f the Peruvian pelagic fishery, p. 307-324. In D. Pauly and I. Tsukayam a (eds.) The Peruvian anchoveta and its upwelling ecosystem: three decades o f change. ICLARM Stud. Rev. 15, 351 p.
Ahmed, M. 1991. A model to determ ine benefits obtainable from the management o f riverine fisheries o f Bangladesh. ICLARM Tech. Rep. 28, 133 p.
ASEAN/US CRMP. 1991. The coastal environmental profile o f South Johore, Malaysia. ICLARM Tech. Rep. 24, 65 p.
Chua, T.E., L.M. Chou and M.S.M Sadorra, Editors. 1987. The coastal environm ental profile o f Brunei Darussalam: resource assessment and m anagem ent issues. ICLARM Tech. Rep. 18, 193 p.
Dixon, J.A. 1989. Coastal resources: assessing alternatives, p. 153-162. In T.-E. Chua and D. Pauly (eds.) Coastal area m anagem ent in Southeast Asia: policies, management strategies and case studies. ICLARM Conf. Proc. 19, 254 p.
7

Dow, J.P., Jr. 1993. Dynam ic regulation o f fisheries: the case o f the bowhead whale. Mar. Res. Econ. 8:145-154.
Hazell, B.R. and R.D. Norton. 1986. M athematical program m ing for econom ic analysis in agriculture. M acmillan, New York.
Hill, M. 1968. A goal achievem ent m atrix for evaluating alternative plans.” J. Am. Inst. Planners 34:19-28.
Hill, M. and R. Alterman. 1974. Power plant site evaluation: the case o f the Sharon plant in Israel.” J. Env. Econ. M anage. 2:179-196.
H olling, C „ Editor. 1978. A daptive environm ental assessm ent and management. W iley-Interscience, New York.
H ufschm idt, M .M ., D.E. Jam es, A.D. M eister, B.T. B ow er and J.A . D ixon. 1983. E nvironm ent, natural system s, and developm ent: an econom ic valuation guide. John H opkins Press L td., London.
H uppert D.D. and D. Squires. 1986. Potential econom ic benefits o f l im ite d a c c e ss in th e P a c if ic co a s t traw l f ish e ry : a l in e a r program m ing approach . A dm in istrative R eport LJ-86-01. US Southw est F isheries Center, NOAA, C alifornia . 59 p.
H ym an, E.L. and B. S tifte l. 1988. C om bin ing fac ts and values in e n v iro n m en ta l im p ac t assessm en t: th eo rie s and tech n iq u es . W estview Press, London.
ign izio , J.P. 1985. In troduction to linear goal program m ing . Sage Publications, California.
Keeney, R. and H. R affia. 1976. D ecision w ith m ultiple objectives: preferences and value tradeoffs. Wiley, New York.
K eeney , R. and G . R o b illia rd . 1977. A sse ss in g an d e v a lu a tin g environm ental im pacts at proposed nuclear pow er plant sites. J. Env. Econ. M anage. 4:153-166.
Kennedy, J. O. S. and J. W. Watkins. 1986. Time-dependent quotas for the southern bluefm tuna fishery. Mar. Res. Econ. 2 (4):293-313.
Laszlo, E. 1972. Introduction to systems philosophy - towards a new paradigm o f contem porary thought. Gordon and Breach Science Publishers, New York.
Leontief, W. W. 1936. Quantitative input and output relations in the economic system o f the United States. Rev. Econ. Stat. 28(3): 105-125.
Mattessich, R„ 1984. The systems approach: its variety o f aspects. General Systems 18:3-12.
McCarl, B.A. and T.H. Spreen. 1980. Price endogenous m athematical program m ing as a too l fo r secto r analysis. Am. J. Ag. Econ. 62( 1 ):8 7 -102.
8M c M a n u s , L .T . an d T .-E . C h u a , E d ito r s . 1990 . T h e c o a s ta l
environm ental profile o f L ingayen G ulf, P hilippines. ICLARM Tech. Rep. 22, 69 p.
M uelle r, J .J . 1976. A lin e a r p rog ram m in g d isc u ss io n m odel fo r m axim izing the net revenues from a m ultispecies fishery. US N ational M arine F isheries Service. 13 p.
P ad illa , J.E . 1991. M anaging tro p ic a l m u ltispecies fish eries w ith m u ltip le o b jec tiv es . S im on F ra se r U niversity , C anada. PhD dissertation .
Paw, J.N ., S. B unpapong, A.T. W hite and M .S.M . Sadorra, Editors. 1988. T he coastal environm ental profile o f B an D on Bay and P hangnga Bay, Thailand. ICLARM Tech. Rep. 20, 78 p.
Randall, A. 1987. Total econom ic value as a basis fo r policy. Trans. Am. Fish. Soc. 116:325.
R o thsch ild , B .J. and J.W . B alsiger. 1971. A lin ea r p rog ram m ing solution to salm on m anagem ent. U .S. Fish. B ull. 69:117-139.
Scura, L.F., T.-E. C hua, M .D . Pido and J.N . Paw. 1992. Lessons for in tegrated coastal zone m anagem ent: the A SEA N experience, p. 1-70. in T.-E. C hua and L.F. Scura (eds.) In tegrative fram ew ork and m ethods fo r coastal area m anagem ent. ICLA RM Conf. Proc. 37, 169 p.
Sheperd, J.G . and D .J. G arrod . 1980. M odeling the response o f a fishing fleet to changing circum stances, using cautious non-linear optim ization. J. Cons. C IEM 39:231-238.
S ie g e l, R .A ., J .J . M u e lle r and B .J . R o th sc h ild . 1979. A lin ea r program m ing approach to determ in in g harvestin g capacity : a m ultiple species fishery. U .S. F ish. Bull. 77:425-433.
Sorenson, J. 1971. A fram ew ork fo r iden tifica tio n and con tro l o f resource d eg radation and co n flic t in th e m u ltip le use o f the coastal zone. U niversity o f C alifornia , D epartm ent o f Landscape A rchitecture, Berkeley.
U nited S tates Fish and W ild life Serv ice. 1980. H abita t evaluation p ro c e d u re s . R e v is e d e d . D o c u m e n ts E S M 101 to 104. G overnm ent P rin ting O ffice, W ashington, DC.
W allace, S.W. and K. Brekke. 1986. O ptim al fleet size w hen national quotas can be traded. Mar. Res. Econ. 2:315-330.
W hite, A.T., P. M artosubroto and M .S.M . Sadorra, Editors. 1989. The coastal environm ental profile o f Segara A nakan-C ilacap, South Java, Indonesia. IC LA R M Tech. Rep. 25, 82 p.

Valuation Concepts and Techniques with Applications to Coastal Resources*
M a x A g u e r o 1 a n d X im e n a F l o r e s 1, ICLARM-ECLAC Collaborative Project on the Socioeconomic Valuation of Coastal Resources in Southwest Latin America, Casilla 179- D, Santiago, Chile
AGUERO, M. and X. FLORES. 1996. Valuation concepts and techniques with applications to coastal resources, p. 9-16. In A. Cruz-Trinidad (ed.) Valuation of tropical coastal resources: theory and application of linear programming. ICLARM Stud. Rev, 25, 108 p.
Abstract
Overexploitation of natural resources is linked to the use of valuation techniques that do not consider nonm arket environm ental goods and services. The Total Economic Value (TEV) concept is discussed and its relevance to natural resources valuation is highlighted. Lastly, techniques for resources valuation are presented, along with an example referring to the mangroves around the Gulf of Guayaquil, Ecuador.
Introduction
Coastal ecosystems and their resources throughout the developing w orld are being increasingly m ism anaged and exploited beyond the limits o f their sustainability. Furthermore, destructive techniques for resource exploitation are proliferating in many poor coastal areas where both resources and the functional integrity of the ecosystem are being seriously threatened by illegal or uncontrolled human activities (Chua and Fallon-Scura 1992).
In recent times, research efforts and policy analysis emphasize the need to properly manage and preserve natural resources and the environm ent. A bundant lite ra tu re from all d iscip lines has been produced describing, quantifying and denouncing undesirable human interventions in the ecosystem, namely, those related to pollution, waste disposal and other global environmental damage (Panayotou 1993; Pearce and Moran 1994).
M oreover, population growth and higher incomes, especially in developed nations, have increased trade opportunities for developing coastal nations with rich re n e w a b le re so u rc e s . In c rea se d te c h n o lo g ic a l efficiency, on the other hand, has improved the cost
* ICLARM Contribution No. 1218.'Present address: International Center for Sustainable Ecological
Development (1CSED), Casilla 27004, Santiago, Chile.
9
effectiveness of resource exploitation activities. As a consequence, developing nations are increasingly viewing the exploitation o f their coastal renewable resources as a source of foreign exchange, employment and food supply. In fact, most government policies of developing countries, in one way or another, promote coastal exploitation to solve pressing social needs.
T he lim its to w hich th ese re so u rces can be exploited on sustained basis, however, are not yet well known or understood, but decreasing yields in many renewable resources such as fish stocks, indicate that very probably, they are already being overexploited (Garcia and Newton 1995).
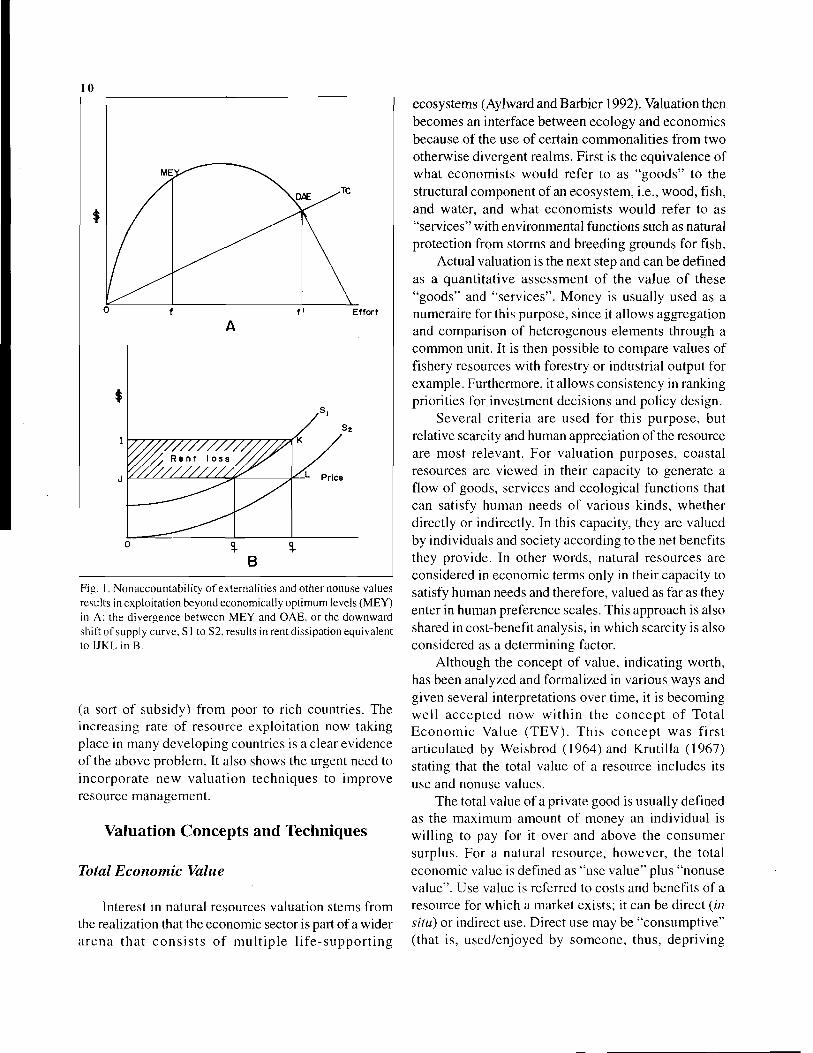
One of the causes of the abovementioned problem is the absence of well developed markets for many goods, services and functions performed by coastal resources like mangroves and coral reefs. The failure of existing methods to properly account for them results in undervaluation of total benefits and consequently, a b ias to w ard s o v e rex p lo ita tio n or co n v ers io n o f resources to alternative options. Exam ples of this p rocess are the in c reas in g ten d en cy to co n v ert m angrove areas into shrim p ponds, the increasing d eg ra d a tio n o f th e e n v iro n m e n t (p o llu tio n , sedimentation, etc.) and discharge of urban waste into the ocean without prior treatment. The overall result is rent dissipation and resource degradation (Fig. 1).
Moreover, coastal resources exploitation does not take place in isolation. The allocation of inputs to a specific process prevents its use in others, changing their relative availability to alternative activities. Also, exploitation activities generate several residuals and spill-over effects affecting the performance of others. These effects, better known as “externalities” , are generally not accounted for by their generating source, but borne by society without due com pensation. A divergence between social and private costs is thus created with misleading signals for an efficient resource allocation process. These signals, namely, unrealistic high profit m argins and larger expected long-term yields, by default do not account for resource users’ costs (value of fish in the water, clean air, etc.) nor for negative externalities imposed on society (like water pollution from fishmeal plants, siltation/sedimentation from logging, and solid wastes from tourism). When the outputs of these resource exploitation activities are exported to markets with very high price elasticities, e.g., fishmeal, considerable rents are transferred to the importing country, creating a paradoxical flow o f value
10
Fig. 1. Nonaccountability o f externalities and other nonuse values results in exploitation beyond economically optimum levels (M EY) in A: the divergence between M EY and OAE, or the downward shift o f supply curve, SI to S2, results in rent dissipation equivalent to IJKL in B.
(a sort o f subsidy) from poor to rich countries. The increasing rate of resource exploitation now taking place in many developing countries is a clear evidence of the above problem. It also shows the urgent need to incorporate new valuation techniques to im prove resource management.
Valuation Concepts and Techniques
Total Economic Value
Interest in natural resources valuation stems from the realization that the economic sector is part of a wider a ren a th a t c o n s is ts o f m u ltip le life -su p p o rtin g
ecosystems (Aylward and Barbier 1992). Valuation then becomes an interface between ecology and economics because of the use of certain commonalities from two otherwise divergent realms. First is the equivalence of what econom ists would refer to as “goods” to the structural component of an ecosystem, i.e., wood, fish, and water, and what econom ists would refer to as “services” with environmental functions such as natural protection from storms and breeding grounds for fish.
Actual valuation is the next step and can be defined as a quantitative assessm ent o f the value o f these “goods” and “services” . M oney is usually used as a numeraire for this purpose, since it allows aggregation and comparison of heterogenous elements through a common unit. It is then possible to compare values of fishery resources with forestry or industrial output for example. Furthermore, it allows consistency in ranking priorities for investment decisions and policy design.
Several criteria are used for this purpose, but relative scarcity and human appreciation of the resource are most relevant. For valuation purposes, coastal resources are viewed in their capacity to generate a flow of goods, services and ecological functions that can satisfy human needs of various kinds, whether directly or indirectly. In this capacity, they are valued by individuals and society according to the net benefits they provide. In other words, natural resources are considered in economic terms only in their capacity to satisfy human needs and therefore, valued as far as they enter in human preference scales. This approach is also shared in cost-benefit analysis, in which scarcity is also considered as a determining factor.
Although the concept of value, indicating worth, has been analyzed and formalized in various ways and given several interpretations over time, it is becoming w ell accep ted now w ith in the co n cep t o f Total E conom ic Value (T E V ). T his co n cep t w as firs t articulated by W eisbrod (1964) and Krutilla (1967) stating that the total value of a resource includes its use and nonuse values.
The total value of a private good is usually defined as the maximum amount of money an individual is w illing to pay for it over and above the consum er surplus. For a natural resource, however, the total economic value is defined as “use value” plus “nonuse value” . Use value is referred to costs and benefits of a resource for which a market exists; it can be direct (in situ) or indirect use. Direct use may be “consum ptive” (that is, used/enjoyed by som eone, thus, depriving

others o f its u se ) o r n o n c o n s u m p tiv e , m e a n in g that
o thers m a y a lso e n jo y its b en efits.
T h e co n c e p t o f n o n u se v a lu e h a s re c e iv e d s p e c ia l
attention in re ce n t y e a rs d u e to the g ro w in g co n ce rn
fo r the e n v iro n m e n t an d su sta in a b le use o f re so u rce s,
as it a p p lie s to the v a lu e in d iv id u a ls p la c e on re so u rces,
r e g a r d le s s o f th e ir p re s e n t/fu tu re o r c o n s u m p t iv e /
n o n c o n s u m p tiv e u se . S e v e r a l ca te g o rie s are in c lu d e d ,
n a m e ly , existence value (v a lu e o f a re so u rce fo r ju s t
k n o w in g it e x ists or w ill be p re se rve d ); option value (w illin g n e s s to p a y fo r the o p tion o f u s in g /c o n s u m in g
the re so u rce in the fu tu re); quasi-option (w illin g n e s s
to p a y to h a v e the o p tio n o f d e c id in g in the future abo ut
its u s e ); an d bequest/heritage and preservation value ( v a lu e to k n o w fu tu r e g e n e r a t io n s w i l l h a v e th e
o p p o rtu n ity to u se the re so u rce ).
H y m a n a n d S t i f t e l ( 1 9 8 8 ) p o in t e d o u t f iv e
a lte rn a tiv e uses o f o p tio n v a lu e : risk aversion ; quasioption demand', existence value', vicarious use value', a n d b eq u e s t va lue w h ic h a lto g e th e r p o s s e s s so m e
in te rc h a n g e a b le features.
S t i l l a n o th e r ca te g o ry o f re so u rce u se , the indirect use fo r w h ic h the v a lu a tio n d ep end s on the “p ro ce sse s”
that u lt im a te ly p ro v id e e c o n o m ic v a lu e , w a s p ro p o sed
b y A y lw a r d an d B a r b ie r ( 1 9 9 2 ) . S o m e in d ire c t uses o f
w e tla n d s in c lu d e g ro u n d w ate r rech arg e o r d isch a rg e ,
flo o d an d f lo w co n tro l, sh o re lin e or b a n k s ta b iliz a tio n ,
s e d im e n t re te n tio n a n d n u trie n t re te n tio n (B a r b ie r
19 8 9 ). T h e s e e n viro n m e n ta l fu n ctio n s m ust be a n a ly ze d
w ith in the b ro ad er fra m e w o rk o f b io lo g ic a l d iv e r s ity
as th is im p lie s a co rre sp o n d in g a n a ly s is o f the lin k a g e s
in the e c o lo g ic a l c h a in an d h o w ch a n g e s w ith in the
sy ste m affect the e n v iro n m e n ta l fu n c tio n s su pp orted
b y it.
M e a su re s o f in d ire c t uses are b ased on w hether
su ch fu n c tio n s su pp ort e c o n o m ic p ro d u ctio n o r protect
the co n d u c t o f e c o n o m ic a c tiv ity . A m e a su re o f the
c o n s u m e r ’s w illin g n e s s to p a y ( W T P ) o r w illin g n e s s
to a c c e p t ( W T A ) m a y ta k e the fo rm o f c h a n g e s in
p r o d u c t iv it y , a lte rn a t iv e /s u b s t itu te c o s ts , o r a c tu a l
e x p e n d itu re s. V a lu a t io n te ch n iq u e s u se d to estim a te
W T A in c lu d e p re v e n tiv e e x p e n d itu re , d a m a g e co sts
a v o id e d , a lte rn a tiv e or su bstitu te co st and re lo ca tio n
co sts. In both c a se s , an im m e n se a m o u n t o f d a ta is
re q u ire d e s p e c ia lly in d e v e lo p in g -c o u n try s itu a tio n s.
M o re o v e r, so m e m e a su re s m a y p ro ve irre le v a n t du e to
the a b se n c e o f te c h n o lo g y that w o u ld , fo r in sta n ce ,
restore the nutrient retention c a p a b ilit ie s o f m a n g ro v e s.
G r e g o r y ( 1 9 8 7 ) f o u n d it u s e f u l to a s s e s s the
nonm o netary benefits o f extram ark ets o f e n v iro n m e n ta l
s e r v ic e s , a lb e it t h e ir in c l u s i o n in T E V w a s n o t
co n sid e re d .
A lth o u g h these p re se rv a tio n a n d n o n u se v a lu e s are
not c le a r ly attached to a n y p a r t ic u la r co m p o n e n t o f a
g iv e n re so u rce , they tend to be a sso c ia te d w ith it as a
w h o le . T h u s , the ro le o f a re so u rce ( l ik e m a n g ro v e s ) in
p re se rv in g b io d iv e r s ity o r the ro le in d e te rm in in g the
u n iq u en e ss to cu ltu re and heritag e (the c o n d o r in C h i le ,
the b a ld e a g le in the U S A , the P ir in e o s in E u r o p e , etc.)
co n trib u te to the e x iste n c e , b e q u e st a n d o p tio n v a lu e
that in d iv id u a ls attach to p re se rv a tio n .
T h e T E V co n ce p t w as a p p lie d b y S p u rg e o n ( 1 9 9 2 )
on c o ra l reefs. U s e v a lu e s w ere c la s s if ie d as e x tra ctiv e
or non ex tractive. A m o n g the e x tra ctiv e v a lu e s are those
o f f is h in g , p h a rm a c e u tic a l, a n d c o n stru c tio n a n d the
n o n e x tra ctiv e are to u rism , e d u c a tio n an d s o c ia l v a lu e .
A m o n g the te ch n iq u e s listed that u se m a rk e t o r p se u d o
m a rk e t p r ic e s are c o s t -b e n e f it a n a ly s is , c h a n g e in
p r o d u c t iv it y a n d m e a s u r e s o f c o n s u m e r s u r p lu s .
S im u la te d m a rk ets are u s e d in c o n tin g e n t v a lu a tio n
m e th o d s ( C V M ) a n d tra v e l c o s t ( T C ) t e c h n iq u e to
e v a lu a te v a lu e o f to u rism sp o ts, fo r e x a m p le . A s for
the in d ire c t u se s o f c o ra l reefs, l ik e b io lo g ic a l supp ort,
the au th o r su ggested the u se o f c h a n g e in p ro d u c tiv ity
in “w ith or w ith o u t the r e e f ’ s itu a tio n s a n d a percentage
d ep end ence te ch n iq u e for w h ic h the b io lo g ic a l support
v a lu e is the v a lu e o f the su p p o rte d a c t iv it y m u lt ip lie d
b y an estim ated p ercen ta g e d e p e n d e n c e o f that a c t iv ity
o n the r e e f’s p re se n ce . F o r n o n u s e v a lu e s , s u c h as
e x iste n c e and o p tio n v a lu e , an e x te n s iv e C V M su rv e y
is su ggested as w as im p le m e n te d b y H u n d lo e ( 1 9 8 9 )
in the estim a tio n o f the v ic a r io u s v a lu e (o p tio n p lu s
e x is te n c e v a lu e ) o f the G r e a t B a r r ie r R e e f w h ic h
am o u n ted to A U S $ 4 5 m illio n /y e a r .
T h e a p p lic a tio n o f T E V in th is v o lu m e h a s been
s lig h tly m o d ifie d in the net s o c ia l b e n e fit fu n c tio n o f
the “ in te g ra te d f u n c t io n a l c o e f f ic ie n t m e t h o d ” to
c a p t u r e th e n e t v a lu e ( p o s it iv e o r n e g a t iv e ) o f
ex te rn a litie s (F ig . 2).
A y lw a r d an d B a r b ie r ( 1 9 9 2 ) p o in te d o u t so m e
ca v e a ts in the use o f the T E V e s p e c ia lly w ith re sp ect
to d o u b le a cco u n tin g o f goods a n d se rv ic e s . T h is o ccu rs
w hen the d irect u se o f the re so u rce is v a lu e d in a d d itio n
to th e 'in d ire ct fu n c tio n s that su p p o rt th ese d ire c t uses.
F o r e x a m p le , m a n g ro v e fo rest litter that p ro v id e s fo o d
for f is h and sh rim p la rv a e is an e n v ir o n m e n ta l fu n c tio n
11
12
w here
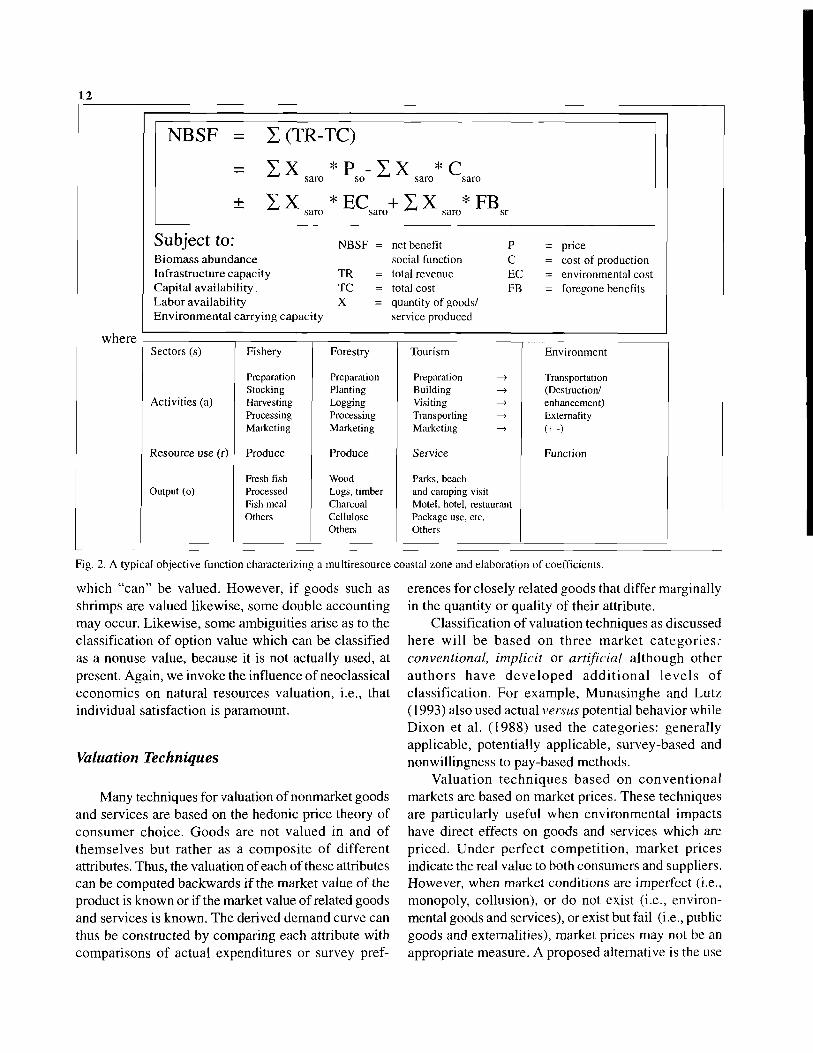
NBSF = I (TR-TC)
X X
X X
* p - X Xsaro so
C
EC + X X * FBsaro sr
Subject to: NBSF = net benefit P = priceB io m a ss abundance social function C = cost o f productionInfrastructure capacity TR = total revenue EC = environmental costCapital availab ility TC = total cost FB = foregone benefitsLabor availab ility X = quantity o f goods/E nvironm ental carrying capacity service produced
Sectors (s) Fishery Forestry Tourism Environment
Activities (a)
PreparationStockingHarvestingProcessingMarketing
PreparationPlantingLoggingProcessingMarketing
Preparation —> Building —> Visiting —> Transporting —> Marketing —>
Transportation(Destruction/enhancement)Externality(+ -)
Resource use (r) Produce Produce Service Function
Output (o)Fresh fish Processed Fish meal Others
WoodLogs, timber Charcoal Cellulose Others
Parks, beach and camping visit Motel, hotel, restaurant Package use, etc.Others
Fig. 2. A typical objective function characterizing a multiresource coastal zone and elaboration o f coefficients.
w h ic h “c a n ” be v a lu e d . H o w e v e r , i f g o o d s su c h as
sh rim p s are v a lu e d lik e w is e , so m e d o u b le a c c o u n tin g
m a y o c cu r. L ik e w is e , so m e a m b ig u itie s a rise as to the
c la s s if ic a t io n o f o p tio n v a lu e w h ic h ca n be c la s s if ie d
as a n o n u se v a lu e , b e ca u se it is not a c tu a lly u se d , at
present. A g a in , w e in v o k e the in flu e n c e o f n e o c la s s ic a l
e c o n o m ic s o n n a tu ra l re so u rc e s v a lu a t io n , i .e ., that
in d iv id u a l sa tisfa c tio n is p aram o u n t.
Valuation Techniques
M a n y te ch n iq u e s fo r v a lu a tio n o f n o n m a rk e t g o ods
a n d s e r v ic e s are b a se d on the h e d o n ic p ric e th eo ry o f
c o n s u m e r c h o ic e . G o o d s a re n o t v a lu e d in a n d o f
th e m s e lv e s b u t r a th e r a s a c o m p o s it e o f d iffe re n t
attributes. T h u s , the v a lu a tio n o f e a ch o f these attributes
ca n be co m p u te d b a c k w a rd s i f the m a rk et v a lu e o f the
p ro d u ct is k n o w n or i f the m ark et v a lu e o f related goods
an d s e r v ic e s is k n o w n . T h e d e riv e d d e m a n d c u rv e ca n
thus be co n stru cte d b y c o m p a r in g e a ch attribute w ith
c o m p a r is o n s o f a c tu a l e x p e n d itu re s o r s u rv e y p re f
ere n ce s fo r c lo s e ly re lated g o o d s that d iffe r m a rg in a lly
in the q u a n tity o r q u a lity o f th e ir attribute.
C la s s if ic a t io n o f v a lu a tio n te ch n iq u e s as d isc u sse d
h e r e w i l l b e b a s e d o n th r e e m a r k e t c a t e g o r ie s :
conventional, implicit o r artificial a lth o u g h o th e r
a u t h o r s h a v e d e v e lo p e d a d d i t io n a l l e v e l s o f
c la s s if ic a t io n . F o r e x a m p le , M u n a s in g h e a n d L u t z
( 1 9 9 3 ) a lso u se d a c tu a l versus p otential b e h a v io r w h ile
D ix o n et a l. ( 1 9 8 8 ) u s e d th e c a te g o r ie s : g e n e r a lly
a p p lic a b le , p o te n tia lly a p p lic a b le , s u r v e y -b a s e d and
n on w illin g n e s s to p a y -b a s e d m eth o d s.
V a lu a t io n t e c h n iq u e s b a s e d o n c o n v e n t io n a l
m a rk e ts are b ased on m a rk e t p ric e s . T h e s e te ch n iq u e s
are p a r t ic u la r ly u s e fu l w h e n e n v iro n m e n ta l im p a c ts
h a v e d ire c t e ffects on g o o d s an d se r v ic e s w h ic h are
p r ic e d . U n d e r p e r fe c t c o m p e t it io n , m a r k e t p r ic e s
in d ica te the real v a lu e to both c o n su m e rs an d su p p lie rs.
H o w e v e r, w hen m a rk e t c o n d it io n s are im p e rfe ct (i.e .,
m o n o p o ly , c o llu s io n ) , o r do not e x ist ( i.e ., e n v ir o n
m en tal g o ods an d se rv ic e s), or e x ist but fa il ( i.e ., p u b lic
g o o d s an d e x te rn a litie s), m ark et p ric e s m a y not be an
a p p ro p riate m e a su re . A p ro p o sed a lte rn a tiv e is the use

o f s h a d o w p r ic in g w h ic h c a n b e u s e d in im p a c t
a s s e s s m e n t o f e n v ir o n m e n ta l s e r v ic e s ( H y m a n a n d
S tifte l 1 9 8 8 ) a n d w h e n co m p e n sa tin g fo r d isto rtio n s
in the co sts o f c a p ita l, fo re ig n e x c h a n g e , la n d a n d labor.
A l l te c h n iq u e s, w h eth er th ey be su rv e y b ase d or
o th e rw ise , attem pt to ca p tu re the w illin g n e s s to p a y
( W T P ) [in so m e ca se s , w illin g n e s s to a cce p t ( W T A )
< c o m p e n s a t io n > ] c r it e r ia d is c u s s e d a b o v e as th e
u ltim a te m e a su re o f u t ility . A so c ie ta l d e m a n d c u rv e is
th e n c o n s t r u c t e d b y h o r iz o n t a l ly s u m m in g u p the
in d iv id u a l d e m a n d c u rv e s as d is c u s s e d b elo w . R a n d a ll
( 1 9 8 7 ) su g g e sts that a cro ss -c o rro b o ra tio n te ch n iq u e
is d e s ira b le in n o n m a rk e t v a lu a tio n .
A ta x o n o m y o f v a lu a t io n te c h n iq u e s b a se d on
m a rk e t ca te g o ry is p resented in T a b le 1 .
Table 1. Techniques currently used for natural resources valuation according to market category.
Conventional Implicit Constructed
Change of productivity Travel cost Artificial market
Loss o f earnings Wage differences n.a.Defensive expenditures Property values n.a.
Replacement cost n.a. ContingentShadow project n.a. valuation
CONVENTIONAL MARKETS
W h e n e n v iro n m e n ta l fu n ctio n s result in m easurable
c h a n g e s in the p ro d u ctio n or p ro d u c tiv e c a p a c ity o f a
certain g o o d o r se rv ice , co n v e n tio n a l m arket tech n iq ues
c a n be u se d , i.e ., the W T P is taken to be e q u a l to the
m a rk e t p ric e . In c a se s w here n o n c o m p e titiv e m arkets
e x ist, the sh a d o w p ric e o r o p p o rtu n ity co st is taken in
lie u o f cu rre n t p rice .
C h a n g e in p r o d u c tiv ity e s t im a te s c h a n g e s in
p ro d u c tio n a r is in g fro m a p a r t ic u la r in te rv e n tio n or
n a tu ral re so u rce state. T h is a p p ro ach is b y far the m o st
c o m m o n m eth o d u s e d in co a sta l re so u rce s ( B e ll 1 9 8 9 ;
H o d g s o n an d D ix o n 1 9 9 2 ; R u ite n b e e k 1 9 9 2 ; S a w y e r
1 9 9 2 ) . A c a se w as m ad e b y H o d g s o n and D ix o n (1 9 8 8 )
in th e ir e stim a te s o f the effects o f se d im e n ta tio n on
c o ra l d iv e r s it y a n d u lt im a te ly on f is h p ro d u ctio n in
P a la w a n , P h ilip p in e s . T h e loss o f earnings te ch n iq u e
e stim a te s fo re g o n e e a rn in g s a r is in g w h e n a n u m b e r o f
p eo ple are affected b y ch a n g es in en viro n m e n ta l q u ality,
e .g ., d e c lin in g c a tch rates fo r s m a ll-s c a le f ish e rs due
to tr a w lin g . D efen sive exp en d itu res are a p p lie d to
m it ig a t e e n v ir o n m e n t a l im p a c t s , e .g . , w a s te w a te r
treatm en t f a c ilit ie s . In th is c a s e , the v a lu e o f w ater
p o llu tio n is taken to be the e q u iv a le n t o f p re v e n tin g it
b y w a y o f te c h n o lo g ic a l co sts. R eplacem ent cost is the
c o st o f su b stitu tin g p a rtic u la r featu res o f a re so u rce to
a p p ro x im a te its n a tu ral c h a ra c te r is t ic . F o r e x a m p le ,
F o lk e an d K a r b e r g e r ( 1 9 9 1 ) e stim a te d re p la c e m e n t
co sts fo r lo ss o f w e tla n d p ro d u c tiv ity w h ile A ra n e d a
et a l. (th is v o l.) u sed the v a lu e o f fresh w a te r n eeded to
d ilu te p o llu te d b a y w aters to a cce p ta b le le v e ls .
IMPLICIT MARKETS
V a lu a tio n te ch n iq u e s fa llin g u n d e r th is ca te g o ry
are b ase d on the p re m ise that so m e m a rk e t g o o d s ca n
be related to p a rtic u la r e n v iro n m e n ta l attributes that
a re n o t p r ic e d . T h u s , p r o p e r ty v a lu e s a n d w age differences, b oth h e d o n ic m eth o d s, are a p p ro x im a tio n s
o f the o v e ra ll e n v iro n m e n ta l q u a lity . P ro p e rty v a lu e s ,
fo r e x a m p le , are d e p e n d e n t on th e e n v ir o n m e n t a l
q u a lity o f a p a r tic u la r h o u sin g site, e .g ., a p o llu te d site
c a u se s a drop in a sse ssm e n t rate; fo r the sa m e reaso n ,
th is sam e p o llu ted site w o u ld h a v e to offer h ig h e r w ages
to a ttra c t la b o r . B e l l ( 1 9 8 9 ) u s e d th e la n d v a lu e
a p p ro a c h in the v a lu a t io n o f F lo r id a f is h e r ie s . T h e
travel cost m eth o d is c o m m o n ly u sed fo r d e te rm in in g
the v a lu e o f a re cre a tio n a l site. T r a v e l e x p e n se s, fees
p a id on site, a n d the o p p o rtu n ity co st o f tra v e l tim e are
ta ken to represent “e n tran ce fe e s” . T h is in fo rm a tio n
w il l a llo w th e r e s e a r c h e r to c o n s t r u c t a d e m a n d
sc h e d u le b ased on the n u m b e r o f p o te n tia l v a c a tio n ists
as a fu n c tio n o f trav el co st; th u s, c o n s u m e r su rp lu s ca n
be estim a te d . T h e tra v e l co st m eth o d w a s a p p lie d b y
C o s t a n z a et a l. ( 1 9 8 9 ) in the v a lu a tio n o f w e tla n d s and
b y H u n d lo e ( 1 9 8 9 ) in the G r e a t B a r r ie r R e e f.
CONSTRUCTED MARKETS
A ls o c a lle d “h y p o th e tica l v a lu a tio n ” (H y m a n and
S tifte l 19 8 8 ), the b a s ic p re m ise is to create a “m a rk e t”
fo r a s p e c if ic e n v iro n m e n ta l attribute b y s im u la tin g
d e m a n d an d s u p p ly c o n d it io n s . S o m e s u r v e y -b a s e d
te c h n iq u e s su g g e ste d b y H y m a n a n d S t ift e l ( 1 9 8 8 )
in c lu d e : d ir e c t q u e s t io n in g , b id d in g g a m e s , u s e
estim a tio n g am es a n d tra d e -o ff a n a ly s is . In the first tw o
te ch n iq u e s, the resp o n d en t is m a d e to a sse ss e ith er the
W T P o r W T A o f a stated q u a n tity o r q u a lit y o f a
p a r t ic u la r e n v ir o n m e n ta l g o o d . In b id d in g g a m e s,
13
h o w ever, the d e te rm in a tio n o f the v a lu e is m o re o f an
itera tive p ro ce ss w ith the re search er p o sin g an in it ia l
b id w ith su b se q u e n t in cre m e n ts. T h e W T P or W T A is
then the m a x im u m (m in im u m ) v a lu e to the user.
T h e v a lid it y o f these te ch n iq u e s ca n be e v a lu a te d
by co m p a riso n w ith results o f elaborate m arket research
s u rv e y s fo r c o n s u m e r p ro d u cts. S e v e r a l stu d ies show
that resp o n d en ts d id not a c tu a lly b e h a v e as th ey had
r e f le c te d in th e m a r k e t s u r v e y s a n d th a t s e v e r a l
c o n su m e r p ro d u cts m is e r a b ly fa ile d (S p in d le r 1 9 7 5 ;
S c h u m a n an d Jo h n so n 1 9 7 6 ) . It is th u s ex p e cte d that
su rv ey s o f e n v iro n m e n ta l goods, w h ich are less ta ngible
than c o n s u m e r p ro d u cts, w o u ld resu lt in in a c c u ra c y .
T h e use o f su ch te ch n iq u e s in L D C co u n trie s w here
e d u c a tio n an d in c o m e s are lo w are lik e w is e ca u tio n e d
by H u fs c h m id t an d H y m a n ( 1 9 8 2 ) .
C o n tin g e n t v a lu a tio n ( C V ) is so c a lle d b ecause
“ c o n t in g e n t ” c o n d it io n s a re s im u la t e d a n d th e
re sp o n d e n ts’ b e h a v io r su b je c t to these c o n d it io n s is
m e a s u r e d . In c o n t in g e n t v a lu a t io n , e s t im a t e s o f
c o n s u m e r ’s su rp lu s are b ased on the d ire c t q u e stio n in g
o f p a rtic ip a n ts. M o st q u e stio n s are d e sig n e d to e lic it
in fo rm a tio n on the m o n e ta ry v a lu e that an in d iv id u a l
p la ce s on p a rtic ip a tio n in a g iv e n a c t iv ity - sp o rtfish in g
for instance (G la s s and M u th 19 8 7 ) . B is h o p et a l. ( 1 9 8 7 )
a p p lie d C V te c h n iq u e s to estim a te the p re se rv a tio n
v a lu e o f striped sh in e rs ; N otropis chrysocephalus, an
e n d a n g e re d c y p r in id in L a k e M ic h ig a n . W h ite h e a d
( 1 9 9 3 ) u sed C V to e stim a te p re se rv a tio n v a lu e s o f
co a sta l m a rin e w ild lif e in N o rth C a r o lin a .
C V m e t h o d s h a v e c o m e u n d e r a t t a c k a s
inap propriate for m e a su rin g nonuse v a lu e s. W h ile being
re lia b le fo r m e a su rin g u se v a lu e s, i.e ., respo n d en ts had
a ctu a l e x p e rie n c e an d ca n thus id e n tify v a lu e s to them ,
v a lu e s re su ltin g fro m C V m ethod s w ere u n b e lie v a b ly
huge. F ir s t a p p lic a tio n s o f C V to n o n u se v a lu e s show ed
that the m ethod m ig h t not be re lia b le w h en m e a su rin g
u n fa m ilia r c o m m o d itie s . T h is p ro b le m w as re a liz e d b y
L a z o et a l. ( 1 9 9 2 ) and b y P e a rce et a l. ( 1 9 8 9 ) and had
prom pted the group to d e v ise su rv ey q u estio n n aires that
p r o v id e d “ p e r f e c t in f o r m a t io n ” a n d “ c o m p le t e
p s y c h o lo g ic a l c o n te x t o f the e c o n o m ic d e c is io n ”
( F is c h h o f f an d F u r b y 19 8 8 ). C o n c e rn re g a rd in g the
v a lid it y o f C V m eth o d s w as e a rlie r su m m a riz e d b y
S co tt ( 1 9 6 5 ) as “ask a hypothetical question and you get a hypothetica l a n sw e r”. N e v e rth e le ss , C V re m ain s
p o p u la r a n d s t u d ie s f a i l to in d ic a t e e v id e n c e o f
su b sta n tia l b ias.
1 4
Nonmonetary Measures
G r e g o r y ( 1 9 8 7 ) f o c u s e d o n n o n m o n e t a r y
m e a su re s to v a lu e n o n m a rk e t a ttrib u tes o f e n v ir o n
m e n ta l re so u rce s b ut d id not d is c u s s w h e th e r these
m ea su res, w hen m o n e tize d , c o u ld be integrated into
o n e o r a n o th e r o f the c o m p o n e n ts o f T E V . T h e s e
in c lu d e m ea su res o f socia l w ell-being, psychophysica l m e a su re s , a t t i tu d e m e a su re s a n d m u lt ia t tr ib u te m easures. T h e f irst m ea su re ca n be s im p ly stated by
a s k in g the respo ndents i f a sc e n a rio w o u ld affe ct th eir
h a p p in e ss. S o m e in d ica to rs ca n be d e v e lo p e d su ch as
e q u ity , p eo p le e m p o w e rm e n t, p a rtic ip a tio n o f w o m en
a n d the a v a ila b ilit y o f so c ia l se rv ic e s .
In p sy ch o p h y sic a l e valu atio n s, a p articu lar aspect
o f the p h y s ic a l e n v iro n m e n t is used as a st im u lu s to
p o t e n t ia l r e s o u r c e u s e r s . T h e s t im u lu s -r e s p o n s e
relatio nship then ca n be m o deled statistically, b y m eans
o f ran k orders, ratin g sca le s, p aired c o m p a riso n s, or
m agnitude estim ates. P sy c h o p h y sica l m easures have been
used to v a lu e so m e la n d sca p e features ( B u h y o f f and
W e llm a n 19 8 0 ) but a p p lica tio n s in the fish e ry are rare.
M ultiattribute m o dels p ro vid e a rig orous m eans o f
a n a ly zin g preferences and q u an tifyin g d e cisio n outcom es
between alternatives that v a ry in m u ltip le d im e n sio n s.
F o r e xam p le, K e e n e y ( 1 9 7 7 ) e m p lo y e d m ultiattribute
p r o c e d u r e s to s tu d y f is h e r ie s m a n a g e m e n t p o lic y
alternatives on a river, and W a lk e r et al. ( 1 9 8 3 ) used the
tech n iq u e to a n a ly z e trade-o ffs betw een m an ag em en t
plans for different sto cks o f co ho salm on.
A m u ltiattrib u te a p p ro ach has a lso been a p p lie d ,
both p a s s iv e ly , in id e n t if y in g ra n g e o f s ta k e h o ld e r
co n ce rn s (E d w a rd s 1 9 7 7 ) an d a c t iv e ly , in b a rg a in in g
and n eg o tia tio n ( U lv i la and S n y d e r 1 9 8 0 ; R a f f ia 19 8 2 )
to assess the v a lu e s that sta k e h o ld e r g ro u p s (p eo p le
w ith re la tiv e ly co h e re n t v ie w s abo ut a p ro b le m ) attach
to e n v iro n m e n ta l im p a c ts o f r is k y te c h n o lo g ie s (v o n
W in te rfe ld t an d E d w a r d s 19 8 6 ) .
F o r interested readers, B a rto n ( 1 9 9 4 ) p ro v id e s an
indepth a n a ly s is o f p o p u la r v a lu a tio n te ch n iq u e s w ith
a n n o t a t io n s o n s u p p o r t in g e c o n o m ic t h e o r ie s , a
d e s c r ip t io n o f the m e th o d , a s s u m p tio n s a n d oth er
lim ita tio n s, an d a p p lic a tio n s to co a sta l stu d ies.
B y w a y o f e x a m p le , a ty p o lo g y o f d iffe re n t use
a n d n o n u s e v a lu e s fo r m a n g r o v e s in the G u l f o f
G u a y a q u i l , E c u a d o r , a n d a p p l ic a t io n v a lu a t io n
te c h n iq u e s is sh o w n in F ig . 3 . T h e s e v a lu e s w ere
d e riv e d fro m the p ro file and a p p lic a tio n p ap ers o f L P

Definition
Goods
Level of tangibility
Valuationtechniques
Output/services that can be
directly consumed
Forest products: firewood alcohol tannin timber pulp forage fertilizer fibers
Functionalbenefits
Habitat for flora and fauna
Substrate for bivalves
Nursery grounds
Primary production from forest litter
Future use
AU direct and indirect uses
Value to future generations
All direct and indirect uses
- biodiversity- flora and fauna- habitat
Value from continued knowledge of
existence
Fishery products: fmfish molluscs crustaceans
Natural barrier against wind and tides
High
Change in productivity Loss of earnings Defense expenditure Replacement cost
Medium
Property values Wage differentials Travel cost Contingent valuation Nonmonetary measures
Low
Contingent valuation Nonmonetary measures
Low
Contingent valuation Nonmonetary measures
Low
Contingent valuation Nonmonetary measures
Fig. 3. Use and nonuse values o f mangroves in the Gulf o f Guayaquil, Ecuador; associated levels o f tangibility and potentially useful valuation techniques.

on the sa m e site . T h e g o o d s a n d se r v ic e s liste d are the
d o m in a n t u s e s o f m a n g ro v e r e s o u rc e s in the a re a .
O p tio n , b e q u e st a n d e x iste n c e v a lu e s are d is t in c t b ut
are a l l b a se d on the d eferm en t o f d ire c t a n d in d ire c t
u se s fo r v a r y in g re aso n s (a n d thus v a lu e s ).
A n arg u m en t ha s been m ade that, to a large extent,
w o rld w id e tren d s in re so u rce s o v e re x p lo ita tio n is an
e ffect o f fla w e d te ch n iq u e s fo r reso u rces v a lu a tio n . T h e
im p e r f e c t io n s s te m f r o m r ig id it ie s in t r a d it io n a l
v a lu a t io n t e c h n iq u e s to a c c o u n t fo r th e f o llo w in g
featu res: m a rk e t fa ilu r e s c a u se d b y e x te rn a litie s an d
p u b lic g o o d s; n o n m a rke t g o o d s an d se rv ic e s ; in te r- and
in tra -g e n e ra tio n a l e q u ity ; a n d d is c o u n tin g to n a m e a
few . H o w e v e r, the strong lin k a g e s fostered betw een the
fie ld s o f e c o n o m ic s , the b io lo g ic a l s c ie n c e s , an d p u b lic
p o lic y h a v e le d to the d e v e lo p m e n t o f te ch n iq u e s as
d is c u s s e d . T h e w o rk that h a s led to these te ch n iq u e s
im p lie s a n e w c o n s c io u s n e s s . T h e n ext step is u s in g
th e se m e a s u r e s p r o p e r ly , a n d c o m m u n ic a t in g the
im p lic a t io n s o f the r e su lt in g stu d ies to p o lic y m a k e rs .
References
Aylward, B. and E.B. Barbier. 1992. Valuing environmental functions in developing countries. Biodivers. Conserv. 1:34-50.
Barbier, E.B. 1989. The econom ic value o f ecosystem s: 1 - tropical wetlands, LEEC Gatekeeper Series No. GK89-02,1IED/UCL London Environmental Economic Centre, London.
Barton, D.N. 1994. Economic factors and valuation o f tropical coastal resources. SMR Report 14/94. Universitetet I Bergen Senter for Miljo- Og Ressursstudier, Norway.
Bell, F. W. 1989. Application of wetland valuation theory to Florida fisheries. Florida Sea Grant College and Department o f Economics, Florida State University, Florida. 95 p.
Bishop, R.C., K.J. Boyle and M.P. Welsh. 1987. Toward total economic valuation of Great Lakes fishery resources. Trans. Am. Fish. Soc. 116:339-345.
Buhyoff, G. and J. W ellman. 1980. The specification o f a nonlinear psychophysical function for usual landscape dimensions. J. Leisure Res. 12:257-272.
Chua, T.-E. and L. Fallon-Scura, Editors. 1992. Integrative framework and methods for coastal area management. ICLARM Conf. Proc. 37, 169 p.
Costanza, R., S.C. Farberand J. Maxwell. 1989. Valuation and management o f wetland ecosystems. Ecol. Econ. 1:335-361.
Dixon, J.A., R.A. Carpenter, L.A. Fallon, P.B. Sherman and S. Manopimoke. 1988. E co n o m ic a n a ly s is o f the en v iro n m en ta l im p ac ts o f development projects. Earthscan Publications, London.
Edwards, W. 1977. How to use multiattribute utility measurement for social decision valuing. IEEE (Institute o f E lectrical and E lectronics Engineers) Transactions, Systems, Man and Cybernetics 7: 326-340.
Fischhoff, B. andL. Furby. 1988. Measuring values: a conceptual framework for interpreting transactions with special reference to contingent valuation o f visibility. J. Risk and Uncertainty 1:147-184.
Folke, C. and T. Karberger, Editors. 1991. Linking the natural environment and the economy: essays from the Eco-Eco Group. 2nd ed. Kluwer Academic Publishers, Dordrecht.
Garcia, S.M. and C. Newton. 1995. Current situation, trends and prospects in world capture fisheries. Conference on Fisheries Management:
1 6Global Trends, 14-16 June 1994. Seattle, USA. 63 p.
Glass, R.J. and R.M. Muth. 1987. Pitfalls and limitations in the use o f fishery valuation techniques. Trans. Am. Fish. Soc. 116:381-389.
Gregory, R. 1987. Nonmonetary measures o f nonmarket fishery resource benefits. Trans. Am. Fish. Soc. 116 (3):374-380.
Hodgson, G. and J. Dixon 1988. Measuring economic losses due to sediment pollution: logging versus tourism and fisheries. Trop. Coast. Area Manage. 3(l):5-8.
H odgson, G. and J. D ixon. 1992. Sedim entation dam age to m arine resources: environmental and economic analysis, p. 421-446. In J.B. Marsh (ed.) Resources and environment in Asia’s marine sector. Taylor and Francis, Washington.
Hufschmidt, M. and E. Hyman, Editors. 1982. Economic approaches to natural resource and environmental quality analysis. Tycooly Press, Dublin.
Hundloe, T. 1989. Measuring the value o f the great barrier reef. Australian Parks and Recreation 3:11-15.
H ym an, E .L. and B. S tifte l. 1988. C om bin ing facts and value in environmental impact assessment. Westview Press, London.
Keeney, R. 1977. A utility function for examining policy affecting the salmon in the Skeena River. J. Fish. Res. Board Can. 34:49-63.
Krutilla, J.V. 1967. Conservation reconsidered. Am. Econ. Rev. 57:777786.
Lazo, J.K., W.D. Schulze, G.H. McClelland and J.K. Doyle. 1992. Can contingent valuation measure nonuse values? Am. J. Agric. Econ. 74:1126-1132.
Munasinghe, M. and E. Lutz. 1992. Environmental-economic valuation o f projects and policies for sustainable development. Environment Working Paper 42. World Bank, Washington, DC.
Panayotou, T. 1993. The environment in Southeast Asia: problems and policies. Environ. Sci. Technol. 27:2270-2274.
Pearce, D. and D. Moran. 1994. The economic value o f biodiversity. IUCN, The World Conservation Union. Earthscan Publications, London.
Pearce, D.W., D. M arkandya and E.B. Barbier. 1989. Blueprint for a green economy. Earthscan Publications, London.
Raffia, H. 1982. The art and science o f negotiation. Harvard University Press, Cambridge, Massachusetts.
Randall, A. 1987. Total economic value as a basis for policy. Trans. Am. Fish. Soc. 116:325-335.
Ruitenbeek, H.J. 1992. M angrove management: an economic analysis of m anagem ent options w ith a focus on B intuni Bay, Irian Jaya. Environm ental M anagem ent D evelopm ent in Indonesia Project (EMDI). EMDI Environmental Reports No. 8.
Sawyer, D. A. 1992. Taka bone rate: management, development, and resource valuation of an Indonesian Atoll. Dalhousie University, Canada. Master’s thesis.
Schuman, H. and M. Johnson. 1976. Attitudes and behavior. Ann. Rev. Sociol. 2:161-207.
Scott, A. 1965. The valuation of game resources: some theoretical aspects. Can. Fish. Rep. 4.
Spindler, J. 1975. The accuracy o f consumer surveys in describing markets for hypothetical goods. Rand Corporation, Santa Cruz, California.
Spurgeon, J.P.G. 1992. The economic valuation of coral reefs. Mar. Pollut. Bull. 24:529-536.
Ulvila, J. and W. Snyder. 1980. Negotiations on international timber standards: an application of multiattribute value theory. Operations Res. 28:8196.
von Winterfeldt, D. and W. Edwards. 1986. Decision analysis and behavioral research. Cambridge University Press, Cambridge.
Walker, K„ B. Rettig, and R. Hilbom. 1983. Analysis of multiple objectives in Oregon coho salmon policy. Can. J. Fish. Aquat. Sci. 40:580-587.
W eisbrod, B.A. 1964. C ollective-consum ptive services o f individual- consumption goods. Q. J. Econ. 78:471-477.
Whitehead, J.C. 1993. Total economic values for coastal and marine wildlife: specification, validity, and valuation issues. Mar. Res. Econ. 8:119132.

Options for Mangrove Management in the Gulf of Guayaquil, Ecuador*
F a b io l a B e l l 1, ICLARM-ECLAC Collaborative Project on the Socioeconomic Valuation o f Coastal Resources in Southwest Latin America, Casilla 179-D, Santiago, Chile
A n n a b e l l e C r u z - T r in id a d , International Center fo r Living Aquatic Resources Management (ICLARM), MCPO Box 2631, 0718 Makati City, Philippines
BELL, F. and A. CR U Z-TR IN ID A D . 1996. O ptions for m angrove management in the Gulf of Guayaquil, Ecuador, p. 17-31. In A. CruzTrinidad (ed.) Valuation of tropical coastal resources: theory and application o f linear programming. ICLARM Stud Rev. 25, 108 p.
A b s t r a c t
The economic and ecological costs and benefits o f two management strategies: (1) mangrove conversion and (2) sustainable exploitation are identified and set up as a linear programming problem. The maximization objective is to increase Total Economic Value (TEV) from these strategies satisfying constraints pertaining to land, labor, availability of penaeid shrimp fry, rated capacity of processing plants and product demand.
Aggregate benefits resulting from a combination of both strategies is US$ 174-106 of which 60% is contributed by sustainable exploitation of mangroves (US$ 18.410'’ from forestry and US$ 87.610*’ from fishery); the remaining amount is accounted for by conversion to shrimp farms. These benefits correspond to the sustainable exploitation of 120-106 ha of mangroves and conversion of 5 .510 '’ ha.
G eneral D escription o f Study Site
The Coast o f Guayas
G u a y a s P r o v in c e is o n e o f fo u r p o lit ic o -a d m in is
tra tiv e re g io n s o f E c u a d o r and c o n sists o f 2 0 ,9 0 0 k m 2
o r 3 4 % o f the n a tio n a l su rfa ce area. T h e p ro v in c e is
b o u n d e d b y the G u l f o f G u a y a q u il an d is the site o f
v a r io u s s o c ia l a n d e c o n o m ic a c t iv it ie s ( F i g . 1 ) .
M a n g r o v e s an d sh r im p fa rm s are fo u n d in the co a sta l
a rea w ith the latter c o m p r is in g 3 0 ,0 0 0 ha.
A n im p o rtan t feature o f the r e g io n ’s o ce a n o g ra p h y
is the e q u a to ria l front, n o r m a lly lo cated betw een 0 °
an d 3 ° , an d w h ic h sep arates the c o ld an d n u trien t r ic h
w aters o f the H u m b o ld t cu rre n t an d the e x te n sio n o f
the E q u a t o r ia l su b c u rre n t fro m w a rm n u trie n t p o o r
* ICLARM Contribution No. 1222.'Present address: Calle Edinburgo 520, Depto. 102, Las Condes,
Santiago, Chile.
su rfa ce w ater. T h e s e o c e a n o g ra p h ic c h a ra c te r is t ic s are
se a so n a l in nature an d d e p en d en t on the in te n sity and
p erm a n e n ce o f the front. T h e co a sta l a reas o f E c u a d o r
l ik e w is e e x p e rie n c e the E l N iñ o p h e n o m e n o n , an event
g e n e ra lly o c c u r r in g e v e ry 3 - 7 y e a rs , c h a ra c te r iz e d b y
h ig h w ater tem p eratures fo r p e rio d s ra n g in g fro m 6 to
18 m o nths, an d h e a v y ra in s.
A c c o r d in g to the K o p p e n c la s s if ic a t io n , G u a y a s
h a s three c lim a te typ e s w h ic h d ist in g u ish the north fro m
the south: se m i a rid o r steppe c lim a te , w ith r a in fa ll
lo w e r than 2 5 0 m m a n n u a lly ; a rid , w ith r a in fa ll lo w e r
than 5 0 0 m m fro m the m o nths o f Ja n u a ry to A p r il . In
the z o n e o f the G u a y a s R iv e r , the c lim a te is tro p ica l
h u m id and sa v a n n a h .
Characteristics o f the Mangroves o f Guayas, Ecuador
E n v ir o n m e n ta l c o n d it io n s in E c u a d o r , as in m o st
tr o p ic a l c o u n tr ie s , are c o n d u c iv e to the gro w th and
d e v e lo p m e n t o f m a n g ro v e fo rests. T o ta l m a n g o v e area
in G u a y a s is 1 1 6 ,0 0 0 h a, re p re se n tin g 6 6 % o f total
m a n g o v e area in E c u a d o r ( C L I R S E N 1 9 8 7 ) .
M a n g ro v e s and sa lt fla ts are fo u n d in the in te rtid a l
z o n e ; furth er in w a rd s are the h ig h e r g ro u n d s, w h ic h
are n e v e r flo o d e d . T h e m a n g ro v e s are fo u n d in areas
c lo s e r to the sea and as su ch are fre q u e n tly in u n d a te d ,
w h ereas the salt flats are p e r io d ic a lly in u n d a te d and,
in m o st ca se s, o c c u r b e h in d m a n g ro v e s. In m o st ca se s,
c la y e y or m u d d y so ils are rather im p erm e a b le and e a sily
get flo o d e d d u rin g h ig h tid e s. A r e a s w h ic h do not h a v e
a n y fo rm o f veg etatio n h a v e h ig h co n ce n tra tio n s o f salt
w h ile those in the h ig h e r areas are m o re c o n d u c iv e to
a g ricu ltu re (F ig . 2 ).
T h e m a n g ro v e forests o f G u a y a s are c h a ra c te r iz e d
b y tw o zo n e s: 1 ) the r iv e r fr in g e s , w h ere Rhiz.ophora spp. (red m a n g ro v e ) o c c u r an d 2 ) the in n e rm o st to rear
a reas, w here a m ix o f Avicennia spp. (b la c k m a n g ro v e )
an d Laguncularia spp. o c cu rs (T e rc h u n ia n et a l . 19 8 6 ).
T h e R hizophora strip ó c c u r s in the zo n e in u n d a te d 4 4 5
to 7 0 0 tim e s p e r y e a r (C in t r o n an d S c h a e fe r 1 9 8 3 )
w h e re as the other z o n e is in u n d a te d 1 8 4 to 4 4 5 tim e s
p er year. M a n g r o v e forests m a y a lso c o n ta in zo n e s o f
salt d e p o sits (salitrales) an d m u d d e p o sits (lodo or
pantone) both o f w h ic h are in u n d a te d le ss than 1 84
tim e s p er year. D u e to the h ig h s a lin ity in th is z o n e , the
m a n g r o v e fo r e s ts a re c o l le c t iv e l y c a l le d sa lin a s (T e rc h u n ia n et a l. 19 8 6 ).
17

18
Legend:Maritime transport
Catchment of agri 8 industrial waste
. Town and trade ' centers
I*' Mangrove and shrimp farm 4
Coffee [1
Pasture ^ Cacao
‘ Fishery | , Rice
Fig. 1. The coastal zone bordering the Gulf of Guayaquil, Ecuador, as the site of multiple economic and resource-based activities.
T h e Rhizophora, Avicennia and Laguncularia attain
heights o f > 1 5 m , 6 - 1 5 m an d < 5 m , respectively. S o m e
m a n g r o v e tr e e s a re k n o w n to r e a c h h e ig h t s o f
3 5 m and a d e n sity o f 3 6 5 trees per hectare co m pared to
an o p tim u m o f 8 0 0 trees p er hectare ( F P V M 1 9 8 7 ) . In
G u a y a s , standing d en sity is o n ly 1 8 5 t h a ‘, an in d ica to r
o f o v e re x p lo itatio n ( T w ille y 19 8 9 ) . C h a ra c te r ist ic s o f
m a n g ro v e s are sh o w n in T a b le 1 . T h e s e sp e cie s are
u tiliz a b le as tim b er an d other w oo d p ro ducts.
Alternative Uses for Mangroves: Fishery, Forestry and Aquaculture
V e la s c d ( 1 9 8 7 ) sy n th e siz e s the ro le o f m a n g ro v e s
a s : 1 ) e c o n o m ic a n d th e re fo re e x p lo it a b le a n d 2 )
e c o lo g ic a l a n d therefo re c o n se rv a b le . T h e e c o n o m ic
im p o rta n ce o f the m a n g ro v e e co sy ste m a rise s fro m the
p r o d u c t s a n d s e r v ic e s d e r iv e d
fro m it. T h e e c o lo g ic a l fu n c tio n s
o f th e m a n g r o v e i n c l u d e th e
e x p o r t o f o r g a n ic m a t e r ia l to
e stu a rie s w h ic h se rv e s as fo o d for
ju v e n ile s h r im p s a n d f is h a n d /o r
t h e ir p r e y ; th e ro o t s y s t e m o f
m a n g r o v e t r e e s e n a b l e s th e
retention o f sed im en ts, p reven tin g
e r o s io n a n d a ls o f o r s h o r e lin e
p ro te ctio n ; an d la stly , p ro v id in g a
h a b ita t fo r m a n y a q u a tic sp e cie s
in the m u d fla ts a n d roots.
T h re e a lte rn a tiv e u s e s o f the
m a n g ro v e s in G u a y a s , E c u a d o r ,
in c lu d e : 1 ) c a p t u r e f is h e r ie s ,
indirect use v ia the p ro tectio n an d
n o u r is h m e n t p r o v id e d to target
s p e c ie s a n d direct use v ia th e
e x p l o it a t io n o f f i s h a n d
c r u s t a c e a n s ; 2 ) fo re s tr y , direct exploitation o f m a rk e ta b le g o o d s;
a n d 3 ) a q u a c u lt u r e , c o m p le t e
conversion of the p h y s ic a l an d
e c o l o g i c a l d y n a m i c s o f th e
e co sy ste m . T h e three u se s o c c u r
s im u lt a n e o u s ly a n d r e s u lt in a
m e a su ra b le q u a n tity o f e c o n o m ic
b e n e f it s . H o w e v e r , m a n g r o v e
c o n v e rs io n to sh r im p a q u a c u ltu re
h a s b een th e ir m a in u se in the last
tw o d e ca d e s b e ca u se o f a ttra ctiv e returns in the export
m arket.
O f the three a lte rn a tive u se s, m a n g ro v e co n v e rs io n
resu lts in the g rav e st d a m a g e to the e n v iro n m e n t (P a w
a n d C h u a 1 9 9 1 ) . M a n g r o v e c o n v e r s io n to s h r im p
m a ric u ltu re re su lts in a v ic io u s c y c le b e c a u se o f the
lo ss o f b re e d in g g ro u n d s fo r la rv a e w h ic h are c r it ic a l
in p u ts to the sh rim p in d u stry . O th e r im p a c ts o b se rv e d
in G u a y a s in c lu d e ch a n g e in w ater q u a lity in the co asta l
zo n e d u e to d isch a rg e s o f sh r im p p o n d s b ro u g h t abo ut
b y w ater e x c h a n g e w h ic h T w ille y ( 1 9 8 9 ) e stim a te s to
re a ch 2 0 m illio n t d a y '.
B o t h a q u a c u lt u r e a n d fo r e s tr y a c t iv it ie s w ere
o b se rv e d to h a v e a d v e rse effects on the e n v iro n m e n t
in c lu d in g a d e c lin e in the p ro d u ctio n o f m u sse ls , oysters
an d c o c k le s . T h e fe llin g o f trees c a u se s th in n in g o f
fo rest c o v e r w h ic h re su lts in d ir e c t p en etratio n o f so lar
r a y s , in c r e a s in g la n d te m p e ra tu re a n d s a l in it y a n d

Coastal zone
Fig. 2. Zonation, uses and products/goods derived from coastal areas in the G ulf o f Guayaquil, Ecuador.
d e c l in e in o x y g e n l e v e l s c o n t r ib u t in g to th e
d isa p p e a ra n ce o f sp e cie s that e x ist in m u d d y substrates.
It lik e w is e c a u se s a d e cre ase in n a tu ra l b a rrie rs that
p ro te ct a g a in s t su rf, a n d w ith w in d a c t io n c a u s in g
e ro sio n a n d in c re a se d s a lin ity o f in te rio r la n d s.
Fishery
C o m m e r c ia l ly im p o rtan t sp e c ie s a sso c ia te d w ith
m a n g ro v e in c lu d e s h r im p o f the g e n u s Penaeus: P. vannamei, P. stylirostris, P. occidentalis a n d P. californiensis. T h e s e s p e c ie s h a v e a p a r t ic u l a r
m ig ra to ry c y c le a n d a p p e ar stro n g ly d e p en d en t on the
m a n g ro v e s . O t h e r c r u s ta c e a n s fo u n d in m a n g ro v e s
in c lu d e cra b s ( L o c a l : jaiba) (Ucides spp., Uca sp p .,
Callinectes toxotes). C o m m e r c ia lly im p o rtan t m o llu s c s
in c lu d e Anadara tuberculosa, Anadara similis, Anadara grandis, Mytella guayanensis, Ostrea columbiensis an d Chione subrugosa.
O n ly o n e f is h s p e c ie s ap p e ars to b e c o m p le te ly
d e p en d en t o n m a n g ro v e s, Mugil curema m u lle t (lisa), a detritu s feeder.
THE COM MERCIAL AND ARTISANAL SECTOR
T h e c o m m e r c ia lly im p o rta n t sp e c ie s are e x p lo ite d
b y b o th th e a r t is a n a l a n d c o m m e r c ia l f le e t . T h e
c o m m e rc ia l f le e t e x p lo its the sh r im p f is h e ry w h ic h is
a p ro m in e n t featu re in the G u l f o f G u a y a q u il ( C u n an d
M a r in 1 9 8 2 ) . S h r im p f is h in g is co n d u c te d th ro u g h o u t
the en tire co a st in d ep th s o f 6 0 m . M a in g ea rs u sed are
p a ir traw lers w ith le n g th s o f 1 0 to 2 5 m a n d 1 9 0 to
5 0 0 h p o r greater.
T h e sh r im p fis h e ry c o n trib u te d 1 0 to 1 2 % o f total
p ro d u ctio n o f s h r im p s in E c u a d o r in re ce n t y e a rs w ith
1 9
Table 1. Commercially important mangrove species in Guayas, Ecuador.
RhizophoraFamily and species
Avicennia Laguncularia Conocarpusmangle harrisonii racemosa nitida erectus
Common name(s) m. cholo m. gateado m. gatucho
m. rojo caballero
m. de pava m. iguaner
m. salado m. blanco m. hembra m. bobo
Jell prieto m. macho
Average height, Ecuador (m) 12 51 30 30 18 13
Average height, general (m) 7-8 ; 10-12 15-35 ; 50-60 8-25
Source: H om a (1983); Rollet (1986).

the r e m a in in g c o n trib u te d b y cu ltu re . C a t c h o f f u l ly -
g ro w n s h rim p a n d la rv a e am o u n te d to 1 0 ,8 0 0 t and
6 .4 - 1 0 9 la rv a e in 19 8 8 , resp ectively. A s for la rv ae , a ctu a l
c a tc h c a n be a s h ig h as 1 . 3 - 1 0 10 la rv a e (a ssu m in g a 5 0 %
m o rta lity rate), a n d at a p r ic e o f U S $ 8 .6 p e r th o u sa n d
la rv a e , a n d c a n b e v a lu e d at U S $ 5 5 - 1 0 9 to 1 1 0 - 1 0 6 per
year.
T h e a rt is a n a l f is h e ry u se s s m a ll v e sse ls su c h as
rafts, c a n o e s, b o ats a n d b arg e s, m a n y o f w h ic h h a v e
been u se d s in c e the 16 th ce n tu ry ( L e n z -V o lla n d an d
V o lla n d 1 9 9 2 ) to c a tc h f is h , m o llu s c s a n d cru sta ce a n s.
T h e m o st im p o rta n t c ru sta ce a n s are p e n a e id sh rim p s
an d lo b s te rs w h ic h a re s o ld fre s h , fr o z e n , c o o k e d ,
ca n n e d o r sa lted . L a r v a l a n d ju v e n ile sh r im p are a lso
ca p tu re d fo r re a rin g in h a tch e rie s. T h e s e are ca p tu re d
th r o u g h o u t th e c o a s t l in e y e a r -r o u n d b u t are m o st
ab u n d a n t d u rin g the ra in y m o nths fro m N o v e m b e r to
A p r il (M c P a d d e n 1 9 8 5 ) . T h e a rtisa n al fleet a lso ca tch es
b e rrie d sh r im p fe m a le s u s in g tra m m e l nets.
C r a b s a re c a p t u r e d in m a r s h e s u s in g m a n u a l
m e th o d s, trap s a n d b a its . T h e s e a re s o ld fre sh an d
c o n su m e d lo c a lly a n d exp o rted as w e ll. M o llu s c s are
m a n u a lly e x tra cte d fro m the m u d , d u r in g lo w tid e .
T h e s e are so ld an d c o n s u m e d as fresh a n d u n s h e lle d
a n d in so m e c a s e s , ca n n e d o r fro ze n . T h e m a rk e t is
d o m e stic e x c e p t in the ca se o f Anadara tuberculosa w h ic h is a lso exp o rted . T h e f ish sp e c ie s ca p tu re d b y
the a rtisa n a l se cto r are v a r ie d an d c o n su m e d as fresh,
co o k e d , salted o r ca n n e d an d are co n su m e d b y d o m estic
an d fo re ig n m a rk ets.
Forestry
T h e e x p lo ita tio n o f m a n g ro v e forests in E c u a d o r
is s m a ll sc a le , d o n e m o s tly b y f a m ily g ro u p s, w h ic h
h a v e m a in ta in e d the tra d itio n a l e x p lo ita tio n syste m s
o v e r the y e a rs . T h e m a in m o d e s o f e x p lo ita tio n are
p a rtia l a n d s e le c t iv e lo g g in g . P a rt ia l lo g g in g in v o lv e s
the fe llin g o f altern ate strip s o f trees p e rp e n d ic u la r to
w a te rw a y s e v e r y 1 5 y e a rs ; th is p e rm its the n a tu ra l
re g e n e ra tio n o f the fo re st. S e le c t iv e lo g g in g is the
fe llin g o f trees w ith d ia m e te r greater than 5 to 1 2 cm ,
w h ile the s m a lle r ones are left stan d in g a lo n g w ith those
w h ic h b e ar se e d s to a llo w reg en era tio n o f the forest.
T h e p r in c ip a l u se o f w o o d in c lu d e s fe llin g o f trees
for ch a rc o a l and fire w o o d , and the m an u factu re o f w oo d
p ro d u cts fo r co n stru c tio n . It is p re su m e d that p resen t
e x p lo ita t io n sy s te m s h a v e n o t c h a n g e d m u c h fro m
tra d itio n a l fo rm s ( H o m a 19 8 0 ) .
20M o s t m a n g ro v e p ro d u cts are u s e d fo r co n stru ctio n .
R e d a n d w h ite m a n g ro v e s are v a lu e d fo r th e ir p u lp
w h ic h is u s e d fo r the m a n u fa ctu re o f b o a rd s, p a n e ls
a n d w o o d c h ip s . T h e re d m a n g ro v e is u s e d fo r c h a rc o a l
a n d fro m its b a rk is ta n n in so u rce d ; the latter is m e re ly
a b y -p r o d u c t a n d is e x p lo ite d o n a s m a ll sca le .
PRODUCTION
G ro w th o f m a n g ro v e s is slo w . T h e red m a n g ro v e ,
fo r e x a m p le , ta k e s a b o u t 2 5 to 3 0 y e a rs to a tta in
m a tu rity, w h ile the other sp e cie s take 1 5 to 2 0 ye a rs
( H o m a 1 9 8 3 ) .
Wood: T h e d e n sity o f red m a n g ro v e is 0 .9 to 1 .2
t -m '3. T o e s t im a te y ie ld p e r h e c ta re , w e c o n s id e r
b io m a s s p er h e cta re w ith the f o llo w in g p e rce n ta g e
d istr ib u tio n p er sp e c ie s :
R. mangle L. racemosa R o o ts 2 0 —
T r u n k 6 5 8 6
B ra n c h e s 1 2 1 0
L e a v e s 3 4
Charcoal: T h e y ie ld o f w o o d c h a rc o a l is 0 .5 m 3 o f
c h a rc o a l p e r m 3 o f w o o d , at a 5 0 % c o n v e rs io n rate.
T h u s , g iv e n a d e n s ity o f 6 8 0 k g m 3 o f w o o d ca rb o n ,
th is tran slates to 3 4 0 k g ca rb o n per m 3 o f w o o d .
Tannin: It is p o s s ib le to o b ta in up to 9 0 k g o f tree
b a r k fr o m a m a tu re tree fr o m w h ic h 3 0 % c a n b e
extracted as ta n n in . E x tra c t io n rates o f ta n n in fro m the
b a rk an d le a v e s are 1 5 to 4 2 % a n d 2 2 % , re sp e ctiv e ly .
Aquaculture
T h e g e o g ra p h ic a l c o n d it io n s o f the co a sta l zo n e
are c o n d u c iv e to the grow th o f the sh r im p a q u a c u ltu re
in d u s t r y w h ic h in 1 9 8 8 b e c a m e the s e c o n d m o st
im p ortant sou rce o f fo re ig n e x c h a n g e next to p etro le u m
(S o lo rza n o 19 8 9 ) . P re se n tly , E c u a d o r a cco u n ts fo r 7 6 %
o f sh rim p p ro d u ctio n in the w estern h e m isp h e re , is the
se co n d larg est e x p o rte r o f p o n d -r a is e d s h r im p in the
w o rld , an d the fo u rth la rg e st p ro d u c e r (A g ü e r o and
G o n z a le z 1 9 9 1 ) . W h ile in it ia te d in 1 9 6 8 , the p e rio d p f
ro b u s t g ro w th w a s b e tw e e n 1 9 8 0 a n d 1 9 8 7 fro m
w h e n c e g ro w th s t a b il iz e d . T h i s d e v e lo p m e n t h a s
d ire c tly ca u se d the d e stru ctio n o f a ro u n d 3 0 ,0 0 0 h a o f
m a n g ro v e forest; the M a n a b i re g io n su ffered the m o st
a n d at present h a s 5 0 % o f fo rest c o v e r (T a b le 2 ).

S h rim p fa rm s w ere in it ia lly co n stru cte d in salt flats
a n d a r e a s o f s p a r s e v e g e t a t io n ; h e r e , c o s t s o f
c o n s t r u c t io n w e re m in im a l . L a t e r , m a n g r o v e a n d
in te rt id a l a re a s a n d la n d s fo rm e rly u s e d fo r a g ricu ltu re
w ere a lso tapp ed (S n e d a k e r et a l. 19 8 8 ). T o date, sh rim p
fa rm s c o m p r is e 3 5 to 4 8 % o f the to tal a rea in h i l ly
g ro u n d s, 2 7 to 3 4 % in sa lt f la ts a n d 2 5 to 3 0 % in
m a n g ro v e s (M e lt z o f f a n d L iP u m a 19 8 6 ) .
In G u a y a s P r o v in c e a lo n e , 9 ,5 0 0 h a o f m a n g ro v e s
a n d 3 1 ,0 0 0 h a o f sa lt fla ts w ere co n v e rte d to sh rim p
fa rm s fro m 1 9 6 9 to 1 9 8 7 . O v e r a ll, in E c u a d o r, 1 1 7 , 0 0 0
h a o f sh r im p fa rm s h a v e b een co n stru cte d as o f 1 9 8 7 ,
6 3 % o f w h ic h is co n ce n tra te d in G u a y a s .
Table 2. Area o f mangroves, salt flats and shrimp farms in Ecuador, 19691987, by province.__________________________________________________
Province Year Mangroves Salt flats Shrimp ponds
Esmeraldas 1969 32.0 . .1984 30.2 - 1.61987 29.3 - 2.6
Manabi 1969 12.4 845.0 -
1984 8.0 164.0 8.41987 6.6 164.0 10.0
Guayas 1969 125.5 40.1 -1984 119.6 17.3 52.61987 116.1 9.8 74.4
El Oro 1969 33.6 9.8 -
1984 24.4 2.5 26.51987 23.4 2.5 29.7
Total 1969 203.6 51.5 -
1984 182.2 20.0 89.11987 175.5 12.4 116.8
CULTURE SYSTEMS
S h r im p fa rm s cu ltu re the w h ite sh rim p , Penaeus vannamei, w h ic h is m o re a d a p ta b le to e x is t in g cu ltu re
m e t h o d s ; o f s e c o n d a r y im p o r t a n c e is Penaeus stylirostris (A q u a c o p 1 9 7 9 ) .
S h r im p cu ltu re re q u ire s the c o n stru ctio n o f tan ks
o r p o n d s w ith h e ig h ts r a n g in g fro m 0 .5 to 1 . 2 m . T h e
la rv a e are ca p tu re d in e stu a rie s b y a rtisa n a l f ish e rs an d
tran sp o rte d to sto c k in g ta n k s. T h e la rv a e are e ith er
b ro u g h t to g ro w -o u t fa rm s or to h a tch e rie s. S u r v iv a l
rate is lo w th ro u g h the v a r io u s stages o f p ro d u ctio n
(c a p tu re , tran sp o rt a n d sto c k in g ) ra n g in g fro m 1 to 5 %
a n d m o rta lity m a y re a ch as h ig h as 5 0 to 1 0 0 % p er
stage.
P r e v a i l in g c u lt u r e s y s t e m s a re d if f e r e n t ia t e d
a c c o r d in g to the le v e l o f te c h n o lo g y , s to c k in g d e n sity ,
fe e d in g re g im e , fe rt iliz a t io n a n d w ater m a n a g e m e n t
(T a b le 3 ) . T h e c u ltu re s y s te m s u s e d in E c u a d o r an d
t h e ir c h a r a c t e r is t ic s in c lu d e th e e x t e n s iv e s y s te m ,
a c c o u n tin g fo r 3 5 % o f to ta l p o n d a rea , p ra c t ic e d in E l
O r o P r o v in c e ; the s e m i-e x te n s iv e s y s te m , a c c o u n tin g
f o r 5 5 % o f to ta l p o n d a re a , p r e v a le n t in G u a y a s
P r o v in c e ; a n d th e s e m i - in t e n s iv e s y s t e m , w h ic h
op erates u n d e r p ro fe s s io n a l, a n d .o fte n tim e s , fo re ig n
m a n a g e m e n t (M e lt z o f f a n d L iP u m a 1 9 8 6 ) .
S h r im p m a ric u ltu re b e g in s w ith the ca p tu re o f
la rv a e b y semilleros ( la r v a e c o lle c to rs ) in e stu a rie s,
a lth o u g h re c e n tly tra w le rs w ere o b se rv e d to ca p tu re
g r a v id fe m a le s fo r h a tch e ry p ro d u c tio n (M e lt z o f f an d
L iP u m a 1 9 8 6 ) . L a r v a e p r o d u c t io n h a s b e e n q u ite
e rra tic w ith p e a k s o c c u r r in g in 1 9 8 2 a n d 1 9 8 3 b e in g
a t t r ib u t a b le to th e “E l N i ñ o ” p h e n o m e n o n . T h e
d e v e lo p m e n t c y c le o f sh r im p m a ric u ltu re is o b se rv e d
to b e s e lf -d e fe a tin g w ith the c o n s tru c t io n o f p o n d s
c a u s in g w id e sp re a d m a n g ro v e d e stru ctio n (T e rc h u n ia n
et a l. 1 9 8 4 ) a n d the in e v ita b le lo ss o f b re e d in g g ro u n d s
fo r sh r im p la rv a e . T h u s , w h ile s h r im p p o n d c o v e ra g e
h a s b e e n in c r e a s in g , th e a v a i la b i l i t y o f la r v a e fo r
sto c k in g h a s a p p ro a c h e d c r is is le v e ls .
COSTS
T h e co sts a sso c ia te d w ith a q u a c u ltu re in c lu d e the
co st o f la n d , co n stru ctio n co sts an d o p eratin g exp en ses.
T h e co st o f la n d v a r ie s a c c o rd in g to its lo c a t io n , so u rce
o f w ater a n d s o il q u a lity . H ig h la n d s a n d m a n g ro v e s
a re p r ic e d at U S $ 1 , 0 0 0 - h a " 1 a n d U S $ 6 , 0 0 0 - h a 1,
r e sp e c tiv e ly . S a ltb e d s are p ric e d in b etw een (H o r n a
1 9 8 3 ) . In G u a y a q u il , a g r ic u ltu ra l la n d c o n v e rt ib le (to
sh r im p fa rm s) co sts a ro u n d U S $ 2 , 0 0 0 - h a 1.
C o s t o f in fra stru ctu re a n d e q u ip m e n t d e p en d s on
the te ch n o lo g y use d . C o n s tru c tio n a n d e q u ip m e n t co sts
m a y ra n g e f r o m U S $ 4 , 0 0 0 to 7 ,7 0 0 -h a " 1 w ith an
e c o n o m ic life t im e o f 5 to 1 0 y e a rs .
T h e m a jo r co m p o n e n ts o f v a r ia b le c o sts in c lu d e
c o s ts o f la r v a e , fo o d a n d e n e r g y . P r ic e o f la r v a e
d ep end s on a v a ila b ility . D e p e n d in g on the p o in t o f sale,
so u rce a n d tim e o f y e a r, the p r ic e o f la rv a e in recen t
y e a rs flu ctu a te d fro m U S $ 1 to 1 3 . 5 -th o u sa n d "1.
FINAL PRODUCT AND PRODUCTION TRENDS
U p o n h a rvest, sh rim p s are p ro ce sse d v ia ste a m in g
an d th e ir ta ils re m o v e d . H e a d le s s sh r im p s h a v e f in a l
w e ig h ts o f a b o u t 6 6 - 6 7 % o f l iv e w e ig h t. T h e s e are
p a c k e d a n d fro ze n fo r tran sp o rt an d s e llin g .
21

Table 3. Main features of shrimp culture systems in Ecuador.
22
Parameters Extensive Semi-extensive Semi-intensive
Stocking density ( P L l O h a 1)
10-10.5 30-35 80-100
Yield ( l b h a 'y e a r 1) 300-800 975-1,300 1,900-3,250
Weight (g) 23-35 18-21.5 15-18
Supplementary none only in final stage throughout cyclefeeding of life cycle Feeding ratio: 1.3-2
Fertilizers none yes yes
Breeding tanks none yes (40-45 days)
yes
Water management seawater pumped aeration
Area (ha) > 100 >1,000
% of use in Ecuador 35 55 10
Source: McPadden (1985); Espinoza (1989).
C u lt u r e d s h r im p p ro d u ctio n re a ch e d 7 7 ,8 0 0 t in
1 9 8 8 w ith a v a lu e a m o u n tin g to U S $ 3 2 2 m illio n . T o ta l
p ro d u c tio n b y b o th c a p tu re an d c u ltu re a m o u n ts to
a bo u t U S $ 4 1 6 m illio n /y e a r , w h ic h is a bo u t 4 . 2 % o f
G N P a n d 2 8 . 3 % o f p r im a ry p ro d u ctio n ( F E D E C A M
1 9 8 9 ) . T h e e x p o rt m a rk e t, n o ta b ly the U n ite d States,
a b so rb s 9 2 % o f total p ro d u ctio n w h ile the re m a in in g
is a b so rb e d b y the d o m e stic m a rk et.
P r o d u c tio n h a s d e c lin e d in re ce n t y e a rs . In 19 8 9
a n d 1 9 9 0 , o n ly 6 4 ,0 0 0 a n d 6 9 ,0 0 0 t o f s h r im p ,
re sp e c tiv e ly , w ere p ro d u ce d b y the a q u a c u ltu re secto r;
6 4 % o f to ta l p ro d u c tio n is a cco u n te d fo r b y the se m i
in t e n s iv e f a r m s a n d th e r e m a in d e r is p ro d u c e d b y
e x te n siv e fa rm s.
T o d a te , the m o st c r it ic a l fa c to r that a ffe cts the
v i a b i l i t y o f s h r im p c u lt u r e a s a w h o le , a n d th e
h a tch e rie s, in p a rtic u la r, is the a v a ila b ilit y o f n a tu ral
la rv a e fo r sto c k in g in g ro w -o u t p o n d s a n d fo r b re e d in g
in h a tch e rie s. In 1 9 8 8 , fo r e x a m p le , the a q u a c u ltu re
secto r u t il iz e d a to tal o f 9 1 0 9 la rv a e , 7 2 % o f w h ic h
w a s p r o v id e d b y the a rt is a n a l f is h e ry . A re c o rd o f
o p e r a t io n a l s h r im p f a r m s in 1 9 8 8 r a n g e d f r o m
6 1 ,0 0 0 h a to 1 2 3 ,0 0 0 h a, re sp ectiv ely . In G u a y a s , w here
there are a to tal o f 8 8 ,0 0 0 h a, ro u g h ly 4 8 ,0 0 0 h a or
5 3 % is o p e ra tio n a l (M e lt z o f f and L iP u m a 19 8 6 ) .
Linear Programming Application to the Mangroves of Guayas, Ecuador
The Optimization Model
A m o d e l w as constructed w h ic h seeks to
o p tim ize T o tal E c o n o m ic V a lu e ( T E V ) d erived
fr o m th e m a n g r o v e e c o s y s t e m in G u a y a s ,
E c u a d o r . O p t im u m T E V is a r r iv e d a t b y
c o m b in in g develo pm en t strategies (see F ig . 3),
ranging from the extrem e options o f conservation
o r co n v e rs io n , o r an interm ediate o p tio n , i.e .,
p a r tia l r e m o v a l o f m a n g ro v e a n d s u sta in e d
exp lo itation o f the rem ainder.
Conservation does not y ie ld a n y fo rm o f
goods b ut generates benefits v ia se rv ice s and
f u n c t io n s ( d is c u s s e d in p r e v io u s s e c t io n ) .
Sustainable exploitation in v o lv e s the extraction
o f forestry and fish e ry goods in a fash io n that assures
future generatio ns o f the sa m e q u a lity o f life (W o rld
C o m m is s io n on E n v iro n m e n t and D e v e lo p m e n t 19 8 7 ) .
T h is in c lu d e s the in d ir e c t b e n e fits a s s o c ia te d w ith
m angro ves su ch as the se rvice s and e c o lo g ic a l functio ns
d e riv e d fro m them . Conversion in v o lv e s a p a rtia l or
co m plete alteration o f the g e o p h y sica l attributes o f the
resou rce. W e c o n sid e r o n ly the co n v e rs io n to sh rim p
p o n d s b e ca u se its p re v a le n c e in o u r p ro je c t site has
elevated it to a m anagem ent co n cern . C o n v e rs io n results
in a p a rticu la r c o m m o d ity , sh rim p s, an d in c u rs co sts
a s s o c ia te d w ith o p e ra tin g s h r im p fa r m s a n d c o s ts
attributed to lo ss o f m an g ro ve resou rce, sca rcity co sts
and co m p ensatio n costs.
T h e m o d el co n sists o f the o b je ctive fu n ctio n , the
constraints and the te ch n ica l co efficien ts. T h e m athem a
tica l form u latio n o f these co m po nents are d iscu sse d and
su m m arize d as a representative tableau (F ig . 4 ).
T h e o b jective fun ctio n co n sists o f d e c is io n v a ria b le s
w h ich affect the m a x im iza tio n o b je ctive either p o sitiv e ly
or n e g a tiv e ly d ep en d in g on the v a lu e an d sig n o f the
co efficien t and on the m agnitude o f the d e cis io n variab le.
T h e d e c is io n v a r ia b le s in o u r o b je c t iv e fu n c t io n are
influenced b y tw o broad developm ent options, co nversio n
and su stainable exp lo itation, and their respective costs
and benefits.
A g e n e ral fo rm u la tio n is :
M a x Z = I N B s + 1 N B m

2 3
w h e re N B S is the n e t b e n e fit a sso cia te d w ith sh rim p
c u ltu re a n d N B . . is the net b e n e fit a s s o c ia te d w ithM
su sta in a b le d e v e lo p m e n t o f the m a n g ro v e .
T h e m a th e m a tic a l fo rm u la tio n o f the L P m o d e l
is :
t u v w y
M a x Z - 1XXIIXXX ■^■abc A j N klmn ^ abc A jN k]nma b c A ¡=1 N k= l 1=1 m =l n= l
S t U V W y
SISE s s s s s ^ a b c iA jN kimn *f-abc iA ¡NjAN klmn
T h e p r in c ip a l s u b in d ic e s d e f in e th e v a r ia b le
a c c o r d in g to the o p tio n o f c o n se rv a tio n o r c o n v e rs io n
to s h r im p fa rm s, the a rea o r zo n e o f e x p lo ita tio n , typ e
o f use o f the re so u rce an d e co sy ste m b ase d on its sou rce
o f v a lu e , the p ro d u c tiv e sector, le v e l o f c o n v e rs io n ,
te c h n o lo g y a p p lie d , re so u rce s u se d a n d f in a l p ro d u cts.
T h e n o m e n c la tu re adopted fo r d e c is io n v a r ia b le s
h a s the fo rm :
X
co e ffic ie n ts o f the o b je ctiv e fu n c tio n an d a ssu m e v a lu e s
p e rta in in g to co sts o r p rice s.
T h e su b in d ic e s represent:
1 ) a = la n d u se , a = { C , M } ;
C = area d evo ted to co n stru ctio n o f sh rim p
p o n d s; and
M = a r e a d e v o t e d to c o n s e r v a t io n o f
m a n g ro v e , su sta in a b le e x p lo ita tio n .
2 ) b = u se o f re so u rce s , b = { G , S , F , F V } ;
G = r e so u rc e s u se d fo r the p ro d u c tio n o f
g o o d s;
S = re s o u rc e s u s e d fo r the d e liv e r y o f
s e r v ic e s ;
F = re so u rce s u sed fo r the m a in te n a n ce o f
e c o lo g ic a l fu n c tio n s ; a n d
F V = r e s o u r c e s d e v o t e d f o r f u tu r e u s e ,
e x iste n c e v a lu e , an d oth er v a lu e s not
p r e v io u s ly co n sid e re d .
3 ) c = p ro d u c tiv e secto r; c = { F , P, A } ;
F = fo re stry ;
P = f is h e ry ; and
A = a q u a c u ltu re .
N o te that the su b in d e x c , fo r the a q u a c u ltu re sector,
is n o t w r itte n ; in s t e a d is a s s u m e d im p l ic i t in a l l
abciA .N ,, *j k lm n
P cabciA N,, a n d abciA N , r e f e r to th e
j k lm n j k lm n
*The typical variables in the model start with the letter X and refer to quantities (e.g., hectarage, number of postlarvae, liters o f tannin). Cases where the variable begins with a letter other than X represent situations where such variable is a component o f another or a percentage o f another; these variables take on a value between 0 and 1.
a b c i= lA j= lN k= l l= lm = ln = l

a c t iv i t ie s c o n c e r n in g s h r im p f a r m in g , o r w h e r e
su b in d e x a = c .
4 ) i = p ro c e s s in g a c t iv ity , i = { 1 s }
F o r th e p r o d u c t iv e s e c to r, th e n u m b e r in g o f
a c t iv it ie s is b a s e d o n th e c h r o n o lo g y : e x t r a c t io n ,
transport, p ro c e s s in g a n d sa les.
5 ) A = a re a w h ere a c t iv ity i o c c u rs
T h e A . ’ s are the d iffe re n t z o n e s o f the m a n g ro v e
as o u t lin e d b e lo w . T h e d e lin e a t io n s a re b a s e d on
d iffe re n t e c o lo g ic a l fu n c tio n s.
Z o n e A : o p en se a s, w ith h ig h s a lin e co n ce n tra tio n
Z o n e B : sw a m p s a n d e stu a rie s w h ere s a lin ity is
in te rm e d ia te
Z o n e C : c o a s t a l f r in g e s , fr e q u e n t ly in u n d a te d ,
d o m in a n t s p e c ie s is the red m a n g ro v e
Z o n e D : in te rio r z o n e o f the m a n g ro v e w h ic h is
in u n d a te d le s s f r e q u e n t ly th a n Z o n e C , d o m in a n t
sp e c ie s are b la c k m a n g ro v e a n d w h ite m a n g ro v e
Z o n e E : sa lt f la ts, ra re ly in u n d a te d a n d n o e x istin g
ve g e ta tio n
Z o n e F : h ig h e r /s lo p in g g ro u n d s, n e v e r in u n d a te d ,
g e n e ra lly u s e d b y a g ricu ltu re
2 4
6) N -
l ,m =
1 =
E =
I =
7 ) n =
le v e l o f c o n v e rs io n o f m a n g ro v e
area, k = { 1 ,. .4 } (see T a b le 4 )
le v e l o f te c h n o lo g y (T a b le 5 )
{ E , I } , m = { 1 . . . 4 ) , m is sto c k in g
d e n sity
e x te n siv e c u ltu re sy ste m
s e m i-in te n s iv e cu ltu re sy s te m
n a tu ra l re so u rc e / f in a l p ro d u ct
F o r the forestry sector, it w as a ssu m e d that Avicennia is the o n ly sp ecies extracted fro m A re a 1 an d fro m A re a
2 , the red m angrove. T h e fin a l products are firew o od fro m
Avicennia trees (F ) , p ile s fro m red m a n g ro ve trees (P ),
and tannin fro m red m an g ro ve trees (T ) .
In the fish e ry , the f in a l p ro d u cts in c lu d e m o llu s c s ,
c r a b s , s h r im p f r y , a d u lt s h r im p s a n d f is h . T h e s e
p r o d u c t s , a s d e f in e d , a s s u m e n o n e e d f o r fu r th e r
p ro c e ss in g . W e a ssu m e a ce rta in p erce n ta g e lo s s fo r
c le a n in g , fo r e x a m p le , in the ca se o f h e a d le ss sh rim p s.
Constraints
C o n stra in ts in c lu d e re so u rce co n stra in ts a n d others
r e la te d to l in e a r p r o g r a m m in g , in c lu d in g b a la n c e
e q u a t io n s , c o n v e x e q u a t io n s a n d c o u n t e r s . T h e
co n stra in ts are fo rm u la te d as e q u a lit ie s o r in e q u a lit ie s
in w h ic h the r ig h t-h a n d sid e ( R H S ) determ in es the lim it.
T h e c o e f f ic ie n t s a re r e fe r r e d to a s in p u t -o u t p u t
c o e ffic ie n ts o r te c h n ic a l c o e ffic ie n ts a n d rep resen t the
a m o u n t o f e a ch re so u rc e re q u ire d b y e a c h d e c is io n
v a ria b le .
T h e re le v a n t re so u rce co n stra in ts are:
1 ) L a n d
? ? £ n 5 M ( X ^ i A jNMm+x c . , AjNk, J < = A j
fo r a l l typ es o f la n d a re a j = ( 1 . . . .4 )
Table 4. Assumed conversion levels for mangrove zones C, D, and C and D, in Guayas, Ecuador, in 105ha.
Conversion level(k)
ZoneC&D
10203060
10203065
103060
120
Table 5. Assumed levels o f stocking density and effort for forestry and aquaculture corresponding to various levels o f technology.
Stocking density Aquaculture Forestry(m) Extensive Semi-Intensive
(PL IO ’ ha ')Area 1 Area 2
(T re e s h a 'y e a r1)
m = 1 30 70 60 28
m = 2 40 90 80 40
m = 3 50 110 75 35

2 5
Mangrove conversion Sustainable exploitation
Max TEVLand Construction
CostsOperating Harvesting
BenefitsSales Land
Costs (Forestry)
Exploitation ProcessingFishingEffort
BenefitsSales
RHS
Objective function coefficients XciAj X ciAjNkL CiNkl X CiNkl XciAjNkN M iAjNk XMiAjNkl X MjN ^MiAjN ^MiN
Decisionvariables
land area converted area to shrimp farms
area converted to shrim p farms with references to technology
quantity o f shrimp harvested
quantity o f shrimp sold
landarea
forest a rea quantity o f exploited trees felled
Fishing effort per zone and per species
quantity o f fishery and forestry products sold
c = A |j
< = L a
<=l f
<=LP<=PP<=PF<=PS< = Q f
< = Q p
<=F< = k l
< = K S
Balance equations Convex equations Counters
<=0<=1<=0
Aj = m angrove area from zones 1 ,...6 La = labor, aquaculture sector Lf = labor, forestry sector LP = labor, fishery sector Pp = plant capacity, packaging PF = plant capacity, freezing il
li il
il II
il plant capacity, sawmill demand, forestry products demand, fishery products fishing effort capital, small-scale capital, large-scale
Fig. 4. The LP tableau for mangrove utilization in Guayas, Ecuador.
2 ) M a x im u m c a r r y in g c a p a c ity o f fo rest, g iv e n
e x is t in g m a n g ro v e a re a o r le v e l o f c o n v e r s io n a n d
m a x im u m b io m a s s b a se d o n le v e l o f effort
X x ( x1=1 m=A M B F , A j N klmn R * AF A j N klmnY .
RPAjNklmn
4 ) P o stla rv a e
d e n sity o f re so u rce o r sp e c ie s n,
fo r typ e o f la n d A , c o n v e rs io n
le v e l N k, fo r le v e l o f te c h n o lo g y
1 a n d effort m
R c a .N, * A :
R Y*FA jNklmn
the m a x im u m b io m a ss o f sp e cie s
n , fo r ty p e o f c o n v e r s io n N ,
g iv e n b y le v e l o f te ch n o lo g y 1 and
effort le v e l m
is th e d e n s it y o f r e s o u r c e o r
sp e cie s n , p er typ e o f m a n g ro v e
= z o n e A , g iv e n c o n v e rs io n le v e l
N k, a n d le v e l o f te c h n o lo g y 1 an d
effort le v e l m
t u v w yX X X X X x ,
Aj= 1Nk =ll=t m= l„ ? iXcBClAJNkl™ < = PLM (A j ’N K) + CPL
C P L =
P L M (A ., N k)
5 ) L a b o r
c a p a c ity o f h a tc h e rie s
a v a ila b ilit y o f seed s fr o m the w ild
as a fu n c t io n o f a re a an d le v e l o f
c o n v e rs io n
3 ) M a x im u m ca rry in g ca p a city o f the fishery, g iven
e x is t in g m a n g ro v e a re a o r le v e l o f c o n v e r s io n a n d
m a x im u m b io m a ss b ased on ap p lied effort in the fish e ry
V W
X X X1=1 m =l
M B P A j N ^ Y * < = R P A :Nj N k l m n * A j
s v w yX X X I X MBC * R cinY* < = M M O ci=l 1=1 m=l n=l J
M M O c = la b o r a v a ila b le fo r se cto r c
Rein = c o e f f ic ie n t o f p r o d u c t i v it y o f a c t iv ity I
RPA iN klmn*A j
= m a x im u m b io m a s s o f sp e cie s n,
fo r le v e l o f c o n v e rs io n N , , an dk’le v e l o f te c h n o lo g y 1 a n d effort m
6 ) M a x im u m e ffo rt p e r p r o d u c t iv e se cto r, i.e ,
m a ch in e ry , n u m b e r o f nets, b o a ts a v a ila b le
v w yX X X X m b q * R cinY* < = M C E c1=1 m=l n=l

2 6
C
R „c llm n
MCE m a x im u m effort fo r secto r c . N u m b e r
o f m a c h in e s , nets, boats,
e x t r a c t io n r a t e ( p r o b a b i l i t y o f
ca p tu re ), p e r effort a p p lie d , p e r le v e l
o f te c h n o lo g y a p p lie d
7 ) M a x im u m p ro c e s s in g c a p a c ity p e r p ro d u ctiv e
se cto r
v w y
X I I x1=1 m =l n=l
MBC2lmn * R c2nY* < ^ c 2n
C 2 l m n
CPr
= c o e ff ic ie n t o r rate o f p ro d u c tio n p er
ty p e o f te c h n o lo g y m u t il iz e d
= m a x im u m c a p a c ity o f p la n t, secto r
c fo r p ro d u ct lin e n.
8 ) M a x i m u m c a p a c i t y o f c o l d s t o r a g e p e r
p ro d u c tiv e se cto r
v w yX X X X m b c * R ClnY*<cpc,n1=1 m =l n=l
xvc3lm n
C P c 3n
= v o lu m e o c c u p ie d in tran sp o rt secto r
m , p e r u n it o f p ro d u ct n transp orted
= m a x im u m c a p a c it y o f w a re h o u s e ,
free ze rs in secto r c fo r p ro d u ct lin e n
9) C a p it a l a v a ila b ilit y fo r s m a ll a n d la rg e in v e sto rs
in the a q u a c u ltu re secto r
a b le to s im u la te the re so u rce f lo w to f in a l p ro d u ct,
p a ss in g a ll stages a n d u n d e rg o in g a n d c a p tu r in g lo sse s
a n d w astag e to the e n v iro n m e n t.
T h e e q u a tio n c a n be e x p re sse d as:
X aBCiA jN klmn * R aBCilm nY *' •X.aBCa+lANk*1™
R aBClmnY*= p e r c e n t a g e u s a g e o f r e s o u rc e
b e tw e e n s u c c e s s iv e a c t iv it ie s ,
i.e ., i + 1 .
C o u n te rs h a v e a s im ila r p u rp o se e x c e p t that these
are u se d w h e n d e c is io n v a r ia b le s are b ro k e n d o w n in to
se v e ra l co m p o n e n ts, e .g ., h e cta ra g e , a n d d o n o t refer
to p r o d u c t t r a n s f o r m a t io n . C o n v e x e q u a t io n s a re
in c lu d e d to a s s u r e c o m p lia n c e w ith s e g m e n ta tio n
d efin ed b y p ie c e w ise lin e a riz a tio n u se d in in co rp o ratin g
n o n lin e a r fu n c tio n s.
L a s t l y , w e a ls o i n c l u d e th e n o n n e g a t iv i t y
co n stra in ts w ith re fe re n ce to o u r d e c is io n v a r ia b le s .
Values o f the Constants
T h e c o n s ta n ts in c lu d e th e c o e f f ic ie n t s o f the
d e c is io n v a r ia b le s in th e o b je c t iv e f u n c t io n , the
te c h n ic a l c o e ffic ie n ts , an d the r ig h t-h a n d s id e ( R H S )
ele m e n ts. T h e first e le m e n t d e fin e s the c o lu m n s o f the
L P ta b le a u w h ic h i s a l 4 1 x l l 5 m a trix w h e re as the
la st tw o m a k e u p the ro w s o f the ta b le au . T h e e lem en ts
o f th e L P ta b le a u a re d e s c r ib e d in m o re d e t a il in
A p p e n d ix 1 .
COEFFICIENTS OF THE OBJECTIVE FUNCTION
R
t u w yI I I I x
A : = l N k = l m = l n = l
*Rr < = K ,CBCjA jN k lnm * 'C A jN k lmnY* ^ “ C j
R ca i = initial investment (infrastructure andother operating costs) for shrimp farms located in area A operating under system 1
K = a m o u n t o f c r e d it a v a i l a b l e f o rci
investments in technology system 1.
Balance Equations, Counters and Convex Sets
B a la n c e e q u a t io n s w e re set u p fo r s u c c e s s iv e
a c t iv it ie s in the p ro d u c tio n p ro ce ss. W it h these w e are
T h e c o e ffic ie n ts o f the o b je c tiv e fu n c tio n re fle ct
the co n trib u tio n o f a p a rtic u la r a c t iv ity to the v a lu e o f
the o b je c t iv e f u n c t io n ( V O F ) . T h u s , c o s ts te n d to
dep ress V O F w h ile re v e n u e s in c re a se it.
T h e c o s t s c o n s id e r e d in c lu d e t h o s e o f la n d
c o n v e r s io n (c o n s t r u c t io n o f s h r im p t a n k s ) , s h r im p
fry , a n d e x tr a c t io n a n d p r o c e s s in g c o s t f o r fo r e s tr y
a n d f is h in g . T h e p r ic e s re fe r to th o s e o f f in is h e d
p r o d u c t s w h i c h i n c l u d e s h r i m p s f r o m th e
a q u a c u ltu r e s e c to r (w h o le a n d h e a d le s s ) ; fr o m the
fo re stry se cto r, f ire w o o d , p o sts a n d t a n n in ; a n d fro m
t h e f i s h e r y s e c t o r , m o l l u s c s , c r a b s , s h r im p
p o s tla r v a e , a d u lt s h r im p s a n d f is h . P r ic e s o f f in is h e d
p ro d u c ts a n d th a t o f p ro d u c t io n in p u ts a re b a s e d on
c u rre n t m a rk e t p r ic e s .

2 7
C o n s t r u c t i o n c o s t s r a n g e f r o m U S $ 1 0 0 to
U S $ 1 0 ,4 0 0 -h a '1 d e p e n d in g o n the m a n g ro v e z o n e an d
a re a l c o v e ra g e . D e v e lo p m e n t co sts are h ig h e r in salt
fla ts a n d s lo p in g g ro u n d s th a n in Z o n e s A to D . F o r
e x a m p le , c o n v e rs io n co sts in Z o n e A fo r a 1 0 ,0 0 0 h a
fa rm co sts U S $ 5 0 0 -h a ' as c o m p a re d to 6 0 ,0 0 0 h a in
Z o n e E w h ic h co sts U S $ 9 , 1 5 0 - h a 1. C o sts are g en erally
h ig h er for the sam e le v e l o f areal co n ve rsio n in Z o n e E .
C o n s t r u c t i o n c o s t s o f e x t e n s iv e f a r m s is
U S $ 8 ,4 9 0 -h a '1 w h ile that o f s e m i-in te n s iv e fa rm s is
U S $ 3 2 , 4 6 0 - h a " 1 w h ic h r e m a in s c o n s t a n t d e s p it e
d iffe re n t s to c k in g re g im e s. A n im p o rta n t d e te rm in an t
o f sto c k in g is the co st o f p o stla rv a e ( P L ) a n d re lated
o p e ra tio n a l co sts a sso c ia te d w ith fe e d in g a n d a ir an d
w a t e r m a n a g e m e n t . T h e s e c o s t s r a n g e f r o m
U S $ 8 .6 -t h o u s a n d " 1 P L ( e x t e n s iv e , 1 0 ,0 0 0 h a ) to
U S $ 1 6 .9 -t h o u s a n d " 1 P L ( e x t e n s iv e , 1 2 5 , 0 0 0 h a ) .
H a r v e s t in g co st is U S $ 6 0 0 - t 1 an d is u n ifo rm fo r a ll
typ e s o f o p e ra tio n s a n d a re a l co v e ra g e .
S u s ta in a b le e x p lo ita tio n o f the m a n g ro v e fo rest
in v o lv e s co sts o f ex tra ctio n an d p ro c e ss in g . E x tra c t io n
co sts fo r Avicennia in Z o n e D w ith a rea o f 1 0 ,0 0 0 h a
ra n g e s fr o m U S $ 3 0 0 -h a 1 to 7 0 0 -h a 1 w h ile fo r red
m a n g ro v e in Z o n e C , sa m e areal co v e ra g e , ran g es fro m
U S $ 2 2 5 -h a ' to 5 2 5 - h a 1.
In the fish e ry , c o lle c t io n o f c la m s a n d cra b s o c cu rs
in Z o n e C ; that o f sh r im p fry in Z o n e B ; and fo r a d u lt
sh rim p s a n d f is h , in Z o n e A , o r open seas. C o lle c t io n
co sts fo r th ese p ro d u cts as w e ll as m ark et p r ic e s o f
m a n g ro v e -d e r iv e d c o m m o d itie s are sh o w n in T a b le 6.
TECHNICAL COEFFICIENTS AND RHS VALUES
In the c a se o f a re so u rce co n stra in t, the te c h n ic a l
c o e ffic ie n ts rep resen t the co n trib u tio n o f a p a rtic u la r
re so u rce , i.e ., lab o r, to a p a rtic u la r d e c is io n v a r ia b le
in c lu d e d in the m a x im a n d .
R ig h t h a n d s id e v a lu e s d e fin e the lim its o f the
restrictio n s en um erated a b o ve or, in the ca se o f reso u rce
c o n stra in ts , the su p p ly o r a v a ila b ilit y o f the re so u rce .
Results and Discussion
Solutions to the Primal Problem
T h e so lu tio n s to the p rim a l p ro blem are p ro vid e d in
T a b le 7. T h e s e in c lu d e the o p tim a l va lu e o f the o b jective
fu n ctio n an d the va lu e s o f the d e c is io n variables.
Table 6. Average costs and market prices o f products derived from the mangrove of Guayas, Ecuador.
CommoditiesExploitation/
processing costs1 M arket price
Aquaculture us$t-‘whole n.a. 7,500
headless n.a. 6,700Fishery U S $ t ‘
clams 1,000 2,000crabs 1,000 4,000
postlarvae 10,000 8,600shrimps 5,000 6,700
fish 5,000 2,500Forestry U S$m -’
firewood 5 50posts 3 10
tannin 5 150
‘For foresty products.Source: FPVM (1987); FEDECAM (1989).
T o t a l n e t b e n e f it s th a t w o u ld a c c r u e to
s im u lta n e o u s c o n v e rs io n a n d e x p lo ita tio n o f G u a y a s
m a n g ro v e s a m o u n t to U S $ 1 7 4 - 1 0 6-y e a r 1. O f the total,
U S $ 1 0 6 - 1 0 6 is a cco u n ted fo r b y su stain a b le exp lo ita tio n
o f the m a n g ro v e : U S $ 1 8 - 1 0 6 fro m the fo re stry sector,
U S $ 8 8 - 1 0 6 fro m the fish e ry , a n d U S $ 6 8 - 1 0 6 fro m the
a q u a c u ltu re sector, in w h ic h U S $ 2 . 5 - 1 0 6 represen ts the
co sts o f tra n sfo rm in g the m a n g ro v e .
T h e a b o v e estim a te s are b a se d on the su sta in a b le
e x p lo ita tio n o f 1 1 9 . 5 - 1 0 3 h a o f m a n g ro v e s d istrib u te d
in Z o n e s C ( 4 6 % ) an d D ( 5 4 % ) a n d the c o n v e rs io n o f
5 . 5 - 1 0 3 h a p re fe ra b ly site d in Z o n e C b e c a u se o f the
lo w e r c o s ts ( c o n s t r u c t io n a n d o p p o r t u n it y c o s t s )
in cu rre d . O p t im a l area o f sh r im p fa rm is 4 9 - 1 0 3 h a w ith
areal d istrib u tio n as fo llo w s: m a n g ro v e s, 1 1 % ; salt flats,
6 4 % ; a n d the re m a in in g 2 5 % , s lo p in g g ro u n d s. T h e
d is tr ib u tio n o f s h r im p fa rm s a c c o r d in g to m o d e o f
o p e ra tio n is 3 7 - 1 0 3 h a fo r e x te n s iv e fa r m s , 8 4 % o f
w h ic h are lo ca te d in sa lt fla ts , a n d 1 3 - 1 0 3 h a fo r s e m i
in t e n s iv e f a r m s , a l l lo c a t e d in s lo p in g g r o u n d s .
O p e ra tio n s in m a n g ro v e a reas are e x te n siv e . T h o u g h
le s s in a re a , s e m i- in t e n s iv e fa r m s w o u ld p r o v id e
a p p ro x im a te ly 4 5 m illio n t o f sh r im p s (h e a d s -o n ) or
6 4 % o f total p ro d u ctio n .
C o m p a r in g the p a ra m e te r e stim a te s w ith a ctu a l
v a lu e s sh o w s that m a n g ro v e c o n v e r s io n h a s c le a r ly
g o ne b e y o n d su sta in a b le le v e ls , i.e ., b y abo u t 2 0 0 % .
T h e estim ates furtherm ore sh o w the p reference o f sitin g
p o n d s in m a n g ro v e s rather than in sa lt flats an d s lo p in g
g ro u n d s w h ic h are both u n d e ru tiliz e d .

28Table 7. Parameter estimates o f the primal LP problem for three alternative uses o f mangroves in Guayas, Ecuador.
Parameters Unit Model Actual*
Option: AquacultureExtensive shrimp farms ha-103 5.5 -
Semi-intensive shrimp farms 0 -
Shrimp farms, mangrove area 1 5.5 -
Shrimp farms, mangrove area 2 0 -
Total area o f shrimp farms, mangrove 5.5 9.4-22Extensive shrimp farms, salt flats 31.2 -
Semi-intensive shrimp farms, salt flats 0 -
Total area o f shrimp farms, salt flats 31.2 13-25Semi-intensive shrimp farms, sloping ground 12.6 -
Total area o f shrimp farms, sloping ground 12.6 17-36Total extensive shrimp farms 36.7 -
Total semi-intensive shrimp farms 12.6 -
Total shrimp farms 49.3 48-74.4Shrimp fry sourced from the wild PL-109 3.9 4.2Shrimp fry sourced from labs 1 1.5Total fry used 4.9 5.7Production, extensive systems MO3 16.4 15.8Production, semi-intensive systems 28.9 28.2Total shrimp production (heads-on) 45.3 44.1Sales o f shrimp, heads-on 11 -
Sales o f shrimp, headless 19.4 -
Total costs US$ lO ^year1 144.4 -
Gross income 212 212Net income 67.7 -
Option: sustainable exploitationMangrove area in Zone 1 ha-103 54.5 -
Mangrove area in Zone 2 “ 65 -
Total mangrove area “ 119.5 116.1Sector: forestryAvicennia felled cu.m 103 488.6 -
Rhizophora felled “ 510.5 -
Sale o f firewood “ 390.9 -
Sale of posts 367.6 -
Sale o f tannin 1.10s 35.7 -
Total costs US$ 103-year‘ 10.2 -
Gross income “ 28.6 -
Net income “ 18.4 -
Sector: fisherySale o f molluscs MO3 1.5 1.0-2.4Sale o f crabs bundles 103 2.7 600Sale o f fry PL-103 5.6 4.3-8.6Sale o f shrimps, heads-on t-103 4.4 7.2Sale o f fish 3.4 -
Total costs US$ lO ^year1 11 -
Gross income 99.4 110**Net income 87.6 -
Net benefits, service and function 0 -
Total cost o f conservation 22 -
Net income o f conservation 128 -
Net benefit 106 -
Total net benefit 173.7 -
*Based on 66% o f total figures for Ecuador given that Guayas accounts for same % mangrove.**Only for capture PL.
Solutions to the Dual Problem
T h e d u a l fo rm u la tio n o f the lin e a r p ro g ra m m in g
p ro b le m re su lte d in th e sa m e le v e l o f net b e n e fits , i.e .,
v a lu e o f the o b je c tiv e fu n c tio n ( V O F ) . Its m a th e m a tica l
interp retatio n as the rate o f ch a n g e in the V O F g iv e n a
c o r r e s p o n d in g c h a n g e in r e s o u rc e a v a i l a b i l i t y h a s
im m e n s e e c o n o m ic im p lic a t io n s : th e d u a l v a lu e s
p ro v id e m e a su re s o f o p p o rtu n ity co sts fo r in term ed ia te
g o o d s an d se r v ic e s su ch as la b o r w h ile in the ca se o f

f in a l g o o d s , d u a l v a lu e s re p re se n t th e c o n s u m e r ’ s
w illin g n e s s to p a y (T a b le 8).
In the c a s e o f la n d , the d u a l v a lu e is the v a lu e o f
fo reg o n e p ro d u ctio n i f the la n d w ere u se d a ltern a tively .
T h u s , the V O F is e stim a te d to in c re a se b y U S $ 3 4 4 an d
U S $ 2 9 4 fo r e v e ry h ectare co n v e rte d in to sh rim p p o n d s
in Z o n e s C a n d D , r e s p e c t iv e ly . T h e e c o lo g ic a l
fu n c tio n s p e rfo rm e d in Z o n e C re su lte d in a h ig h e r
sh a d o w p ric e than Z o n e D . R e s u lt s sh o w that e a ch
a d d it io n a l h e cta re o f sh r im p fa rm in Z o n e E , sa lt fla ts,
w o u ld a d d an a v e ra g e o f U S $ 6 7 7 to total net ben efits
n o tw ith sta n d in g the fa c t that it h a s a lre a d y re a ch e d
su b o p tim u m le v e ls . T h is is d u e to the fa ct that m o re
than 9 0 % o f sh r im p p ro d u ctio n is d e r iv e d fro m th is
zo ne.
T h e d u a l v a lu e s estim a te d fo r fo restry a n d f ish e ry
p ro d u cts a p p ro x im a te th e ir m a rk e t p ric e s . T h e h ig h e r
sh a d o w p ric e s a ss ig n e d to f is h e ry p ro d u cts, e s p e c ia lly
that o f sh r im p fry, e m p h a siz e s the ro le o f the m a n g ro v e
in the su ste n a n ce o f co a sta l m a rin e re so u rce s. A n o th e r
p o s s ib le ju s t if ic a t io n is that fo re stry p ro d u cts ca n be
s o u r c e d f r o m n o n m a n g r o v e f o r e s t s in c l u d i n g
d ip te r o c a r p a n d h a rd w o o d fo re s ts ; th u s , th e lo w e r
sh a d o w p rice .
F r y o b ta in e d fro m the w ild h a v e a p o s it iv e sh a d o w
p ric e b u t that o b ta in e d fro m the h a tch e rie s h a v e a zero
sh a d o w p ric e in d ic a t in g that the re so u rce is n o n sc a rce ,
i.e ., th e d e m a n d is le ss th a n the in sta lle d c a p a city .
R e s u lts further in d ica te that p a c k a g in g an d free zin g
c a p a c ity o f the a q u a c u ltu re secto r as w e ll as s a w m illin g
c a p a c it y in fo r e s tr y a re in e x c e s s o f d e m a n d , i .e .,
sh a d o w p ric e is zero . L ik e w is e , there is a su rp lu s o f
a v a ila b le la b o r in aq u acu ltu re , forestry and the a rtisa n al
f is h e r y r e la t iv e to the e x p lo it a b le r e s o u rc e . T h u s ,
in c re a s in g la b o r s u p p ly w il l not re su lt in a n y ch a n g e in
the o p tim a l b e n e fits p ro v id e d b y m a n g ro v e c o n v e rs io n
a n d /o r su sta in a b le e x p lo ita tio n .
Sensitivity Analysis
A s e n s it iv ity a n a ly s is w a s c o n d u cte d to d e te rm in e
the e ffe ct o f a lte rin g v ita l p aram eters on the net b e n e fit
( T a b le 9 ) . T h e b a se s c e n a r io re p re se n ts the p r im a l
p r o b le m w h i l e t h e a d d i t io n a l s e v e n s c e n a r io s
c o n s id e re d are b a se d on th e fo llo w in g :
1 ) r e la x a t io n o f the re strictio n p e rta in in g to the
lo c a t io n o f f is h f a r m s , p a r t ic u la r ly , to a s s e s s the
f e a s ib ilit y o f lo c a t in g in other m a n g ro v e z o n e s;
Table 8. Parameter estimates o f the dual LP problem for the mangroves of Guayas, Ecuador.
2 9
Parameter Dual value Unit
Mangrove area, Zone 3 344 U S S h a 'y e a r 1Mangrove area, Zone 4 294 “Shrimps farms, Zone 5 675 “Avicennia 35 U S $ m '3Rhizophora 15 “Firewood 50 “Posts 6 “Tannin 100 “Molluscs 2,000 uss-r1Crab 4,000 “Shrimp fry 9,800 “Shrimps 6,700 “Fish 2,500 “Fry sourced from wild 1.72 USS-10-3Fry destined for hatcheries 0 “Capital, extensive system 2 US$-106-year'Capital, intensive system 450
2 ) c h a n g e s in th e s u p p ly o f n a t u r a l f r y a s a
fu n c tio n o f E l N iñ o o c cu rre n c e s;
3 ) a v a ila b il it y o f c a p ita l fo r in v e s tm e n t in the
a q u a c u ltu re sector. A n in cre a se in in v e stm e n t ca n be
interpreted as a te c h n o lo g ic a l b re a k th ro u g h o r in fu s io n
o f fo re ig n in v e stm e n t.
In S c e n a r io s 1 a n d 2 , the area co n v e rte d to sh rim p
fa rm s in Z o n e C w a s a ssu m e d to in c re a s e w ith the
a d d it io n a l a rea b e in g re le a s e d fro m Z o n e F (h ig h e r
g ro u n d s) a n d fr o m the a re a o r ig in a lly in te n d e d fo r
su stain a b le m an ag em en t. In both ca se s, total net benefit
is lo w e r th a n th e b a s e s it u a t io n . I n th e c a s e o f
a q u a c u ltu re , the d e c lin e in net in c o m e is g reater in
S c e n a r io 2 d u e to the a d d itio n a l a ssu m p tio n o f a drop
in the su p p ly o f natural fry. N e t in c o m e fro m the forestry
secto r d ro p p e d b e ca u se o f a d e cre a se in e x p lo ita b le
a re a fo r re d m a n g r o v e s , a n d th u s , f ir e w o o d s a le s ,
w h e re as sa le s o f s h r im p la rv a e a n d o f a d u lt sh rim p
c a u se d the s lid e in the f is h e ry sector.
In S c e n a r io 3 , the in cre a se in n a tu ra lly su p p lie d
fr y c o m p e n s a te s fo r the to ta l lo s s o f h a tc h e ry fry,
re su ltin g in a net in c o m e h ig h e r than the b a se situ a tio n .
N e t in c o m e fro m the f is h e r y is l ik e w is e im p ro v e d
m a in ly through h ig h e r sales o f sh rim p la rv a e . H o w e v e r,
a n in c re a se in n a tu ral fry w a s not sh o w n to im p a c t on
the su p p ly o f a d u lt sh rim p and that o f f in f is h , in general.
Sce n ario s 4 and 5 have a strong co n serv atio n ist b ias
but nevertheless resulted in net in co m e s h ig h e r than the
base situation. S ce n a rio s 4 and 5 assu m e ch a n g es in the
siting o f sh rim p ponds in Z o n e s E an d F and w ith no
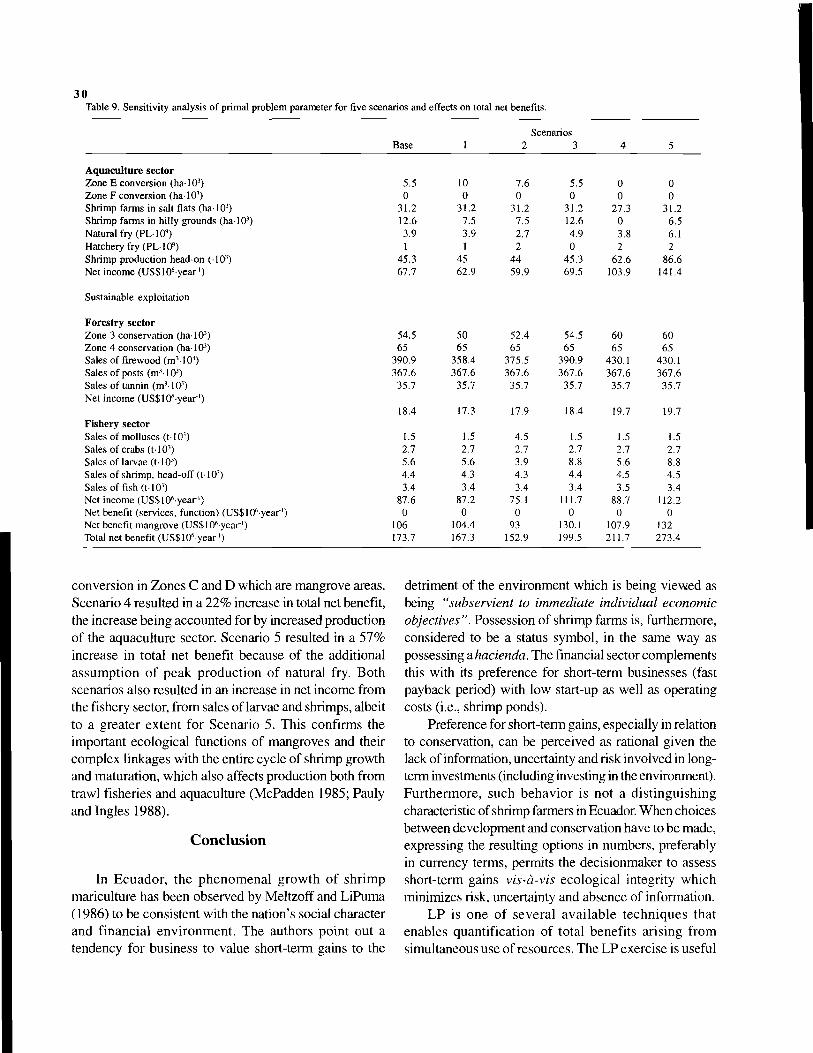
Table 9. Sensitivity analysis o f primal problem parameter for five scenarios and effects on total net benefits.3 0
Base 1 2Scenarios
3 4 5
5.5 10 7.6 5.5 0 00 0 0 0 0 0
31.2 31.2 31.2 31.2 27.3 31.212.6 7.5 7.5 12.6 0 6.53.9 3.9 2.7 4.9 3.8 6.11 1 2 0 2 2
45.3 45 44 45.3 62.6 86.667.7 62.9 59.9 69.5 103.9 141.4
Aquaculture sectorZone E conversion (ha-1 O’)Zone F conversion (ha-10’)Shrimp farms in salt flats (ha-103)Shrimp farms in hilly grounds (ha-103)Natural fry (PL-109)Hatchery fry (PL-109)Shrimp production head-on (-103)Net income (U SSK P-year1)
Sustainable exploitation
Forestry sectorZone 3 conservation (ha-103)Zone 4 conservation (ha-103)Sales of firewood (m 3-103)Sales o f posts (mMO3)Sales o f tannin (mMO3)Net income (US$106-yearl)
F ishery sector Sales o f molluscs (t-103)Sales o f crabs (t-103)Sales o f larvae (t-103)Sales o f shrimp, head-off (t-103)Sales o ffish (t-103)Net income (US$10f’-yearl)Net benefit (services, function) (US$106-year') Net benefit mangrove (US$106-year')Total net benefit (US$106-yearl)
co n v e rsio n in Z o n e s C and D w h ich are m angro ve areas.
S ce n a rio 4 resulted in a 2 2 % increase in total net benefit,
the in cre ase b e in g acco u n ted for b y increased pro ductio n
o f the aqu acu ltu re sector. S ce n a rio 5 resulted in a 5 7 %
in crease in total net benefit b ecau se o f the ad d itio n al
a s s u m p tio n o f p e a k p ro d u c tio n o f n a tu ra l fry. B o th
scenario s a lso resulted in an increase in net in co m e from
the fish e ry sector, fro m sales o f larvae and shrim ps, albeit
to a greater extent fo r S c e n a rio 5 . T h is co n firm s the
im portant e c o lo g ic a l fu n ctio n s o f m angro ves and their
c o m p le x lin k a g e s w ith the entire c y c le o f shrim p growth
and m aturation, w h ic h a lso affects pro ductio n both from
traw l fish e rie s a n d a qu acultu re (M cP a d d e n 19 8 5 ; P a u ly
and In g le s 19 8 8 ).
Conclusion
In E c u a d o r , the p h e n o m e n a l g ro w th o f s h r im p
m aricu ltu re has been observed b y M e ltz o ff and L iP u m a
( 1 9 8 6 ) to be co n sisten t w ith the n atio n ’s so c ia l character
a n d f in a n c ia l e n v ir o n m e n t. T h e autho rs p o in t out a
ten d en cy fo r b u sin ess to va lu e short-term gains to the
54.5 50 52.4 54.5 60 6065 65 65 65 65 65
390.9 358.4 375.5 390.9 430.1 430.1367.6 367.6 367.6 367.6 367.6 367.6
35.7 35.7 35.7 35.7 35.7 35.7
18.4 17.3 17.9 18.4 19.7 19.7
1.5 1.5 4.5 1.5 1.5 1.52.7 2.7 2.7 2.7 2.7 2.75.6 5.6 3.9
00oo 5.6 OO 00
4.4 4.3 4.3 4.4 4.5 4.53.4 3.4 3.4 3.4 3.5 3.4
87.6 87.2 75.1 111.7 88.7 112.20 0 0 0 0 0
106 104.4 93 130.1 107.9 132173.7 167.3 152.9 199.5 211.7 273.4
detrim ent o f the en viro n m en t w h ich is bein g v iew ed as
being “subservient to im m ediate individual economic objectives”. P o ssessio n o f sh rim p farm s is, furtherm ore,
co n sid ered to be a status sy m b o l, in the sam e w a y as
p o ssessing a hacienda. T h e fin a n c ia l sector co m plem ents
this w ith its preference for short-term b u sin esses (fast
p a y b a ck period) w ith lo w start-up as w e ll as operating
costs (i.e., sh rim p ponds).
Preference for short-term gains, e sp e cia lly in relation
to conservation, can be p erceived as rational g iv e n the
la ck o f inform ation, uncertainty and r is k in v o lv e d in lo ng
term investm ents (in c lu d in g investing in the environm ent).
F u rth e rm o re , su c h b e h a v io r is n o t a d is t in g u is h in g
characteristic o f shrim p farm ers in Ecuador. W h e n cho ices
betw een d evelo pm ent and co nservation have to be m ade,
exp ressing the resulting options in num bers, preferably
in cu rren cy term s, p erm its the d e cisio n m a k e r to assess
short-term g a in s vis-à-vis e c o lo g ic a l in te g rity w h ic h
m in im ize s risk, uncertainty and absence o f inform atio n.
L P is o n e o f s e v e r a l a v a ila b le te c h n iq u e s that
e n a b le s q u a n tif ic a tio n o f to ta l b e n e fits a r is in g fro m
sim u ltan eo u s use o f resou rces. T h e L P e x e rcise is u sefu l

in three w a y s : 1 ) in d e v e lo p in g the L P ta b le a u , the
re so u rc e s y s te m , its d iffe re n t co m p o n e n ts a n d th e ir
in te rlin k a g e s , is stru ctu red a n d q u a n tif ie d ; 2 ) th ro u g h
t h e p r im a l a n d d u a l s o l u t io n , b e n c h m a r k s f o r
d e c is io n m a k e rs are p ro v id e d ; and 3 ) through se n sitiv ity
a n a ly s is , a lt e r n a t iv e e n v ir o n m e n t a l a n d e c o n o m ic
sce n a rio s are s im u la te d . In th is e x e rc ise , w e p ro v e d
the c o m p a t ib il it y betw een e c o n o m ic s a n d e c o lo g y b y
s h o w in g that c o n se rv a tio n ist a p p ro a ch e s to m a n g ro v e
m a n a g e m e n t w o u ld re su lt in greater net b e n e fits . M o re
im p o rta n tly , w e h a v e sh o w n h o w the sh o rt-te rm g a in s
o f m a n g ro v e c o n v e rs io n to sh rim p p o n d s c a n be w ip e d
ou t b y se v e re d e c lin e s in la r v a l p ro d u ctio n , its m o st
c ritic a l input. T h is has been done g iv e n the interlinkages
between e c o lo g ic a l param eters sp e cifie d in the o b je c tiv e
fu n c tio n .
O u r a p p ro a c h is a fo rm o f ‘a d a p tiv e m a n a g e m e n t’
( H o l lin g 1 9 7 8 ) , w h ic h e m p h a siz e s v a r ia b ility in tim e
an d sp a ce b o u n d a rie s as w e ll as u n c e rta in tie s. T h u s ,
w h a t others p e r c e iv e to b e ra tio n a l ap p ears to be a ca se
o f m is in f o r m e d d e c is io n m a k in g . W e h a v e sh o w n
th ro u g h th is e x e rc ise h o w it is p o s s ib le to d e p ic t an
a rray o f o p tio n s that sp an lo n g -te rm as w e ll as short
te rm p la n n in g h o r iz o n s a n d t h u s , m a k e r a t io n a l
d e c is io n s on the b a s is o f p erfect in fo rm a tio n .
References
Agüero. M. and E. González. 1991. Una industria millonaria. Ecuador: el boom camaronero de América Latina, cultivo, divisas y empleo. [A millionaire industry. Ecuador: Latin America shrimp farming boom, c u ltu re , fo re ign ex ch an g e and em plo y m en t], A q u an o tic ias Internacional 3( 10 ):31 -43.
Aquacop. 1979. Penaeid reared brood stock: closing the cycle o f P monodon, P. stylirostris and P. vannamei. Proc. World Maricult. Soc. 10:445-452.
Cintrón, G. and Y. Schaefer. 1983. Introducción a la ecología del manglar. Oficina Regional de C iencia y Tecnología de la UNESCO para América Latina y el Caribe. Montevideo, Uruguay.
CLIRSEN. 1987. Estudio multitemporal de los manglares, camaroneras y areas salinas de la costa ecuatoriana mediante información de sensores remotos. Memoria Técnica. Quito, Ecuador. 35 p.
Cun, M. and C. Marín. 1982. Estudio de los desembarques del camarón (gen. Penaeus) en el Golfo de Guayaquil (1965-1979). Boletín Científico y Técnico 5(3). Instituto Nacional de Pesca, Guayaquil, Ecuador.
Espinoza, F. 1989. Situación actual de la maricultura del camarón en el Ecuador y estrategias para su desarollo sostenido. Memorias del S em in ario y D ocum ento T écn ico . In stitu to de E stra teg ias Agropecuarias. Doc. Tec. No. 21, 213 p.
FEDECAM. 1989. Serie: análisis sectorial. Doc. No. 10. La producción camaronera en Ecuador. Octubre, 1989. Eduardo Egas Pena.
FPVM (Fundación Pedro Vicente Maldonado). 1987. Ecuador. Perfil de sus recursos costeros. PMRC. Guayaquil, Ecuador. 269 p.
FPVM (Fundación Pedro Vicente M aldonado). 1989. Ecuador. Vision global del desarrollo de la costa. PMRC. Guayaquil, Ecuador. 241 p.
Holling, C.S., Editor. 1978. Adaptive environm ental assessm ent and management. Wiley Interscience, New York.
Homa, R. 1980. Relación suelo mangle, p. 195-214. En Estudio Científico e Impacto Humano en el Ecosistema de Manglares. Memorias Del Seminario Organizado Por Unesco, Con el Auspicio Del Gobierno de Colombia (Cali, 27 de Noviembre al 10 de Diciembre de 1978), Oficina Regional de Ciencia y Tecnología Para America Latina y el Caribe, Montevideo, Uruguay.
Horna, R. 1983. Diagnostico del ecosistem a de M anglares Ecuador, p. 321-328. En Trabajos Presentados a la Conferencia Internacional Sobre Recursos Marinos Del Pacifico, 16-20 M ayo 1983, Vina Del Mar, Chile.
Lenz-V olland, B. and M. Volland. 1992. D istribución geográfica y técnicas de la pesca en la C osta E cuatoriana du ran te el período colonial [G eographic distribution and gears o f the Ecuadorian fisheries during the colonial period], p. 92-113. In M. Agüero (ed.) C ontribuciones para el estud io de la pesca artesanal en A m erica Latina. ICLARM Conf. Proc. 35, 113 p.
McPadden, C.A. 1985. A brief review of the Ecuadorian shrimp fishery. Tec. Inst. Nac. Pesca Ecuador 8(1): 1-68.
Meltzoff, S.K. and E. LiPuma. 1986. The social and political economy of coastal zone management: shrimp mariculture in Ecuador. Coastal Zone Manage. J. 14(4):349-380.
Pauly, D. and J. Ingles. 1988. The relationship between shrimp yields and in te rtid a l v eg e ta tio n (m an g ro v e) a reas , p. 2 7 7 -2 8 3 . In A. Yáñez-Arancibia and D. Pauly (eds.) Proceedings o f the IREP/OSLR Workshop on the Recruitment o f Coastal Demersal Communities, 2 1-25 A pril 1986, C a m p e ch e , M ex ico . IO C (U N E S C O ) Supplementary Papers Workshop Rep. No. 44.
Paw, J.N and T.-E. Chua. 1991. An assessm ent o f the ecological and economic impact o f mangrove conversion in Southeast Asia, p. 201212. In L.M. Chou, T.-E. Chua, H.W. Khoo, PE . Lim, J.N. Paw, G.T. Silvestre, M.J. Valencia, A.T. W hite and P.K. Wong (eds.) Towards an integrated management o f tropical coastal resources. ICLARM Conf. Proc. 22, 455 p.
Rollet, B. 1986. Ordenación integrada de manglares. Síntesis de Siete Seminarios Nacionales en America Latina. FO: M ISC/86/4. FAO, Roma, Italia. 100 p.
Snedaker, S.C. et al. 1988. Ubicación de piscinas camaroneras y alternativas de manejo en ecosistemas de manglares en el Ecuador. Proyecto de Manejo de Recursos Costeros. Serie de Estudios No. 2. Fundación Pedro Vicente Maldonado. Guayaquil, Ecuador. 86 p.
Solorzano, C. 1989. La industria del cam arón en Ecuador. Instituto Centroamericano de Administración de Empresas INCAE.
Terchunian, A., V. Klemas and A. Segovia. 1986. Mangrove mapping in Ecuador: the impact o f shrimp pond construction. Environ. Manage. 10(3): 345-350.
Twilley, R. 1989. Im pacts o f shrim ps m aricu ltu re p ractices on the ecology o f coastal ecosystem s in Ecuador, p. 91-120. In Olsen et al. (ed.) A sustainable shrim p m ariculture industry for Ecuador. T ech n ica l R e p o rt S eries T R -E -6 . I n te rn a tio n a l R e so u rc e s M anagem ent Project, USA.
Velasco, A. 1987. Socioeconomic aspect of mangrove management, p. 6773. In State o f the art: mangrove research. Philippine Council for A gricu ltu re , Forestry , and N atu ra l R e so u rces R esearch and Development, Los Baños, Laguna, Philippines.

Optimization of Economic Benefits from Fishery and Forestry in Bio-Bio, Chile*
Description of Study Site
E d g a r d o A r a n e d a 1, ICLARM -ECLAC C ollaborative P roject on the Socioeconom ic Valuation o f C oastal Resources in Southwest Latin America, Casilla 179-D, Santiago, Chile
A n n a b e l l e C r u z - T r i n i d a d , International Center fo r Living Aquatic Resources Management (ICLARM), MCPO Box 2631, 0718 Makati City, Philippines
F r a n c i s c o M o r a l e s 2, ICLARM -ECLAC Collaborative P roject on the Socioeconom ic Valuation o f Coastal Resources in Southwest Latin America, Casilla 179-D, Santiago, Chile
A n g e l i c a A r e l l a n o 3, ICLARM -ECLAC Collaborative P roject on the Socioeconom ic Valuation o f Coastal Resources in Southwest Latin America, Casilla 179-D, Santiago, Chile
ARANEDA, E., A. CRUZ-TRINIDAD, F. MORALES and A. ARELLANO. 1996. Optimization o f economic benefits from fishery and forestry in Bio-Bio, Chile, p. 32-62. In A. Cruz-Trinidad (ed.) Valuation of tro p ica l coas ta l resou rces : theory and ap p lica tio n s o f linear programming. ICLARM Stud. Rev. 25, 108 p.
Abstract
The net economic value o f fishery and forestry in Bio-Bio, Chile was estimated with the environment as a third sector accounting for positive and negative externalities.
The main produce of the pelagic fishery is jack mackerel (Trachurus murphyi) and is caught mostly by small boats and barges while hake (M erluccius gayi) is targetted by purse seines. An average o f 95% of fishery production is converted into fishmeal 50% of which is sold to foreign markets. From the forestry sector, the pine (Pinus radiata) is transformed into logs for sawmilling and pulp.
Optimum net economic value is estimated at US$1.37 billion-year1 87% of which is accounted for by the forestry sector. Exports of wood chips from eucalyptus trees as well as logs and other wood products from pine contribute the bulk o f earnings o f this sector. The fishery sector contributed US$171 m illion m ainly through the exports o f fishmeal. However, water pollution caused by fishmeal plants dim inished total economic value by at least US$20 m illion-year1.
♦ICLARM Contribution No. 1219.'Present address: José Manuel Infante N" 2802, Nuñoa, Santiago,
Chile.2Present address: Calle Edipo Rey 5751, Las Condes, Santiago, Chile.’Present address: Stationary Sources Emissions Central Program
(PROCEFF), Olivares 1229, 6o Piso, Santiago, Chile.
Physical Attributes
LOCATION AND TOPOGRAPHY
B io - B i o is o n e o f C h i l e ’ s thirteen p o lit ic a l and
a d m in is tra tiv e d istr icts . T h is reg io n co v e rs a total area
o f 3 6 ,8 2 0 k m 2 a n d c o n s is t s o f 4 9 m u n ic ip a lit ie s
in c lu d in g N u b le , B io -B io , A r a u c o , T a lc a h u a n o and
C o n c e p c io n , the c a p ita l. A ls o in c lu d e d are the islands
o f Q u ir iq u in a , M o c h a and S a n ta M a r ia (F ig . 1).
T h e m a jo r to p o g ra p h ic a l features o f the region
in c lu d e :
1 ) A n d e a n m o u n ta in ran g e: h eig h ts re ach o v e r
2 ,0 0 0 m , dotted w ith num ero us vo lcanoes and the snow
ca p p e d M t. C h i l ia n ( 3 , 1 2 2 m ), A n tu c o (2 ,9 8 5 m ) and
C a lla q u i (3 ,0 8 0 m );
2 ) m o u n ta in s situated betw een the interm ediate
d ep ressio n and the A n d e a n m o u n ta in range;
3 ) an in term ed ia te d e p re ssio n in the northern part
o f the re g io n , a p p ro x im a te ly 1 0 0 k m latitu d e from
C h il ia n an d r o llin g p la in s south o f the B io -B io R iv e r ;
4 ) a c o a s t a l ra n g e n o rth o f the r e g io n w h ich
w e a k e n s to a s e r ie s o f r id g e s w ith in te rm e d ia te
ca tch m e n t a rea s; to the south o f the B io -B io R iv e r , the
co a sta l range sh a rp ly in cre ase s to a heig h t o f 1 ,0 0 0 m
and a cq u ire s a w a ll-l ik e feature, the N a h u e lb u ta R a n g e ;
5 ) r o c k y co a st to the north o f the B io -B io R iv e r
w ith m in o r co asta l p la in s ; in co ntrast, south o f the river
is the sm o oth A r a u c o -C a n e te p la in w ith an average
w id th o f 2 5 k m ;
6) co n tin e n ta l sh e lf: co n tig u o u s and p a ra lle l to the
co a st e x te n d in g 7 0 k m tow ards the T u m b e s p en in su la
a n d fro m C o n c e p c io n , d e cre asin g to 4 0 k m tow ards
A r a u c o ; and
7 ) c o n tin e n ta l s lo p e : the zo n e a ris in g fro m the
co n tin e n ta l trench up to the co n tin en tal shelf.
T h e co a sta l zo n e in c lu d e s the 4 9 m u n ic ip a lit ie s in
F ig . 1 , the co asta l C o rd illeras, the littoral p la in s, the B io
B io e stu a rin e sy s te m an d the co a sta l syste m o f the
A r a u c o G u l f an d the B a y o f S a n V ic e n te . T h e B io -B io
e stu a ry is a b r a c k is h in te rp h a se betw een the r iv e r
syste m an d the A r a u c o G u lf . P a ra lle l to the B io -B io
estuarine system is the B a y o f S a n V ic e n te /A ra u c o G u lf
system , ch a ra cte rize d b y the in flu x o f equatorial waters
d u rin g sp rin g a n d sum m er.
3 2

Fig. 1. The Chilean coastline and location o f Region VIII, B io-B io (left), and the coastal municipalities bordering Arauco G ulf and Bay o f San Vicente (right).
HYDROGRAPHY
T h e r e g io n ’s h y d ro g ra p h ic n etw o rk is sh a p e d b y
both the A n d e a n ran g e an d r iv e r sy ste m s. T h e A n d e a n
r iv e rs , n a m e ly , the B io -B io , N u b le , a n d L a ja , o rig in ate
fro m the in te rn a l a reas o f the A n d e a n m o u n ta in range,
i.e , fro m the m e ltin g o f sn o w w h ic h re su lts in a la rg e r
v o lu m e d u rin g the e n d o f sp rin g . T h e n o n A n d e a n riv e rs,
the C h i l ia n , D ig u il l in , C h o lg u a n , Itata, D u q u e c o an d
M u lc h e n , o r ig in a te fro m the w estern secto rs o f the
m o u n ta in ra n g e ; w ater su p p ly c o m e s fro m b o th ra in
and snow . T h u s , the f lo w o f w ater is as h ig h in su m m e r
as in sp rin g .
T h e B io - B i o R iv e r is one o f the larg est in C h ile
d r a in in g a n a rea o f 2 4 ,0 0 0 k m 2 at a flo w rate o f 9 0 0
m 3 s e c o n d I t s p r in c ip a l trib u tarie s are the V e rg a ra ,
L a ja , M a lle c o , R a h u e , R a n q u il, Q u e c o , D u q u e c o and
B u r e o r iv e rs . T h e Ita ta R iv e r d ra in s an area o f 1 1 , 5 0 0
k m 2 w ith a f lo w rate o f 1 4 0 n F -s e c o n d 1. Its m a jo r
t r ib u t a r ie s a re th e N u b le , C a t o , C h i l i a n , P a lp a l ,
D ig u il l in a n d L a r q u i r iv e rs .
CLIMATE AND OCEANIC CURRENTS
R e g io n a l c lim a te ra n g e s fro m w in try
r a in s to p ro lo n g e d d ry se a so n s, the latter
ra n g in g fro m se v e n to e ig h t m o n th s. T h e
c o a s t a l c o r d i l l e r a a c t s a s a c l im a t ic
b a r r ie r a f f e c t in g t e m p e r a t u r e a n d
d is t r ib u t io n o f r a in f a l l . O f f s h o r e , th e
H u m b o ld t C u r r e n t ( F ig . 2 ) tra n sp o rts
c o ld a n d lo w s a lin ity w a te rs la d e n w ith
n u trie n ts fro m th e su b a n ta rc tic re g io n .
A ls o , w ater is u p w e lle d fro m the d eep est
z o n e s r e p la c in g w a rm e r a n d n u t r ie n t -
d e f i c i e n t s h a l l o w w a t e r s . N u t r ie n t
e n ric h m e n t p ro ce sse s co n trib u te to a h ig h
p rim a ry (p h y to p la n k to n ) p ro d u c tio n an d
th u s, to la rg e sto c k s o f f is h .
Social and Economic Attributes
POPULATION CHARACTERISTICS
R e g io n V I I I is th e s e c o n d m o s t
p o p u la te d r e g io n o f th e c o u n t r y w ith e s t im a te s fo r
1 9 9 0 at 1 . 7 m i l l i o n , a b o u t 1 3 % o f C h i l e ’ s to ta l
p o p u la t io n . D e n s e l y p o p u la t e d c i t i e s in c l u d e
C o n c e p c i o n ( 4 8 % ) , Ñ u b l e ( 2 5 % ) a n d B i o - B i o
( 1 9 % ) . P o p u la t io n d e n s it y is 4 5 p e r s o n s k m 2 at the
r e g io n a l le v e l w ith v a r ia t io n b e tw e e n to w n s , i .e .,
C o n c e p c io n ( 2 3 1 p e r s o n s k m 2) a n d B i o - B i o ( 2 0
p e rs o n s k m 2). R e g io n a l p o p u la t io n g ro w th is 1 . 1 % ,
le s s th a n th e n a t io n a l a v e ra g e o f 1 . 6 % . A lm o s t 8 0 %
o f th e r e g io n ’ s p o p u la t io n l iv e in u r b a n a re a s .
INCOM E AND EMPLOYMENT
T h e r e g io n a l c o n t r ib u t io n to G D P w a s 9 % to
1 0 % in th e la s t d e c a d e . M a n u f a c t u r in g a c c o u n te d
fo r a n a v e ra g e o f 3 3 % o f r e g io n a l G D P ( 1 9 8 5 - 8 9 ) ,
w h ile th e fo r e s tr y s e c to r ra n k e d s e c o n d , at 1 3 % .
T h e la b o r f o r c e in R e g io n V I I I r e a c h e d 6 0 0 ,0 0 0
p e rso n s in 1 9 9 0 o r 1 2 . 8 % o f th e n a t io n a l la b o r fo r c e .
O f th e to ta l, 5 6 8 ,0 0 0 p e o p le w e re f u l ly e m p lo y e d .
A m o n g the p r o d u c t iv e s e c to rs , a g r ic u lt u r e , f is h e r ie s
a n d f o r e s t r y c o n t r ib u t e d 2 3 % ; s e r v i c e s , 2 3 % ;
in d u s t ry , 1 7 . 8 % ; a n d c o m m e r c e , 1 6 % . T h e g ro w th
in e m p lo y m e n t in th e r e g io n , w h ic h is 5 . 8 % is g reater
th a n the n a t io n a l a v e ra g e o f 4 . 7 % .
3 3

3 4
L o n g itu d e (°W)
Fig. 2. Oceanic currents influencing Chile’s coast.
T h e f is h e ry secto r e m p lo y s o v e r 2 5 ,0 0 0 p erso n s
w ith the a rtisa n a l secto r a c c o u n tin g fo r abo u t 1 5 ,0 0 0
fish e rs . O f m a jo r s ig n if ic a n c e is the in d u stria l f ish e ry ,
w h ic h e m p lo y s 1 0 ,0 0 0 p e rso n s, 6 0 % o f w h o m are
e m p lo y e d at f is h m e a l p lan ts. T h e re g io n co n trib u te s
5 0 % o f e m p lo y m e n t in the fo re stry se cto r w ith the
fo llo w in g b re a k d o w n : 5 7 % , p lantation an d s ilv ic u ltu re ;
3 9 % , in d u s tria l fo re stry ; and 6 2 % , fo restry se rv ice s.
INFRASTRUCTURE
T h e tran sp o rt sy ste m o f R e g io n V I I I c o n sists o f
ro a d n e t w o r k s , r a i lw a y s , p o rts a n d a ir p o r t s . T h e
r e g io n a l r o a d n e t w o r k is c o n s t r u c t e d a lo n g th e
lo n g itu d e o f the C e n tr a l D e p re ss io n w ith co n n e ctio n s
to the co a st, p a r t ic u la r ly in the c ity o f C o n c e p c io n , and
the A n d e a n ran g e. T h e m a in h ig h w a y is the C a rre te ra
P a n a m e r ic a n a w h ic h ru n s fro m n o rth to south
a n d cu ts th ro u g h the c it ie s o f C h i l ia n a n d L o s
A n g e le s . T h e c o a sta l ro a d n e tw o rk c o v e r s a
length o f 3 1 3 k m an d cu ts th ro u g h the c it ie s o f
Q u ir ih u e an d T ir u a . R o a d n etw o rk s b ra n c h out
fro m the m a in h ig h w a y , c o n n e c tin g the tow ns
o f B u ln e s a n d C h a im a v id a , an d C a b r e r o and
C h a im a v id a .
T h e r a ilw a y sy s te m c o v e r s 7 9 5 k m , 2 0 0
k m o f w h ic h b e lo n g to the ce n tra l r a ilw a y s and
the r e m a in in g , the m in o r lin e s . M o s t o f the
r a ilw a y tra ffic is d irecte d to w ard s C o n c e p c io n .
In 1 9 9 0 , 3 m illio n t o f ca rg o w ere transp o rted
v i a th e r a i l w a y s y s t e m w it h 6 0 % b e in g
a cco u n ted fo r b y w oo d an d w o o d p ro d u cts. T h e
o th e r c o m m o d it ie s in c lu d e s a lt a n d su g a r,
im p o r t e d w h e a t , f e r t i l i z e r s , c e m e n t a n d
p e tro c h e m ic a ls .
T h e m a jo r p o r t s in th e p r o v in c e a re
l ik e w is e co n ce n tra te d in C o n c e p c io n . A m o n g
the m o re im p o rta n t o n e s a re P u e rto d e S a n
V ic e n t e , w h ic h h a n d le s a b o u t 1 .0 4 m il l io n
t -y e a r 1 o f w o o d p ro d u cts; L ir q u e n , w h ic h is a
p riv a te p o rt; a n d M u e lle C A P w h ic h h a s a
c o m b in e d c a p a c ity o f 2 .5 m illio n t -y e a r 1. T h e
la tte r ’s n o rth e rn se cto r ca te rs to b u lk ca rg o
h a n d lin g w h ile the sou thern secto r is p re se n tly
p la g u e d w ith id le c a p a c ity b e ca u se o f the w eak
steel m arket.
T h e re g io n h a s three im p o rta n t a irp o rts:
C a r r ie l S u r in C o n c e p c io n ; M a r a D o lo r e s in L o s
A n g e le s ; an d B e rn a rd o O ’ H ig g in s in C h il ia n . T h e r e
are a lso 2 0 s m a ll a ir f ie ld s scattered in the co a st an d in
the C o rd ille ra s.
SO C IA L ISSUES
R e g io n V I I I e x p e r ie n c e s m o r e a c u t e s o c ia l
p ro b le m s than the other re g io n s o f C h ile . A c c o r d in g to
C E P A L ( 1 9 9 0 ) , 4 6 % o f the re g io n a l p o p u la tio n earn
in c o m e s in s u f f ic ie n t to m eet b a s ic n e e d s, 1 8 % are
in d ig e n ts , an d 2 5 % are b e lo w p o v e r ty le v e ls . T h e
larg est p ro p o rtio n o f the p o o r p o p u la tio n is fo u n d in
u rb a n a re a s . A b o u t 4 7 % o f the p o p u la t io n l iv e in
p o ve rty in the c it ie s but in d ig e n c e is r e la t iv e ly greater
in the ru ra l areas. T h is is m a n ife ste d in lo w in co m e
le v e ls w h ile in d ig e n c e , in a d d itio n to the fo rm e r, is
ch a ra cte rize d b y a dearth in in fra stru ctu re an d b a sic
se rv ice s.

___________________________________________ 35Natural Resources Endowment, Usage ___________________________________
and Impacts in the Coastal Zone cmJT) l9°
Legend:( Q Thermoelectric plants
Forestry
M ining
Beaches
Artisanal fishers
i t Other activities
i l L Processing plants
Ports
T h r e e d e ca d e s p rio r to 1 9 7 5 , e c o n o m ic g ro w th o f
the re g io n w a s o rie n te d to w ard s im p o rt su b stitu tio n .
T h e e m p h a s is w a s o n the p ro d u ctio n o f b a s ic m e ta ls,
c h e m ic a ls an d fo o d . In the 1 9 8 0 s , there w a s a sh ift
to w a rd s the e x p lo ita tio n o f n a tu ral re so u rce s su ch as
f is h s t o c k s a n d f o r e s t s . T h i s s t e e r e d e c o n o m ic
d e v e lo p m e n t to w a rd s the exp o rt m ark et, p a r t ic u la r ly
that o f w o o d p ro d u cts an d fish m e a l. T h e trend in natural
re so u rce d e p e n d e n c y , p a rt ic u la r ly in the c o a sta l zo n e ,
is d e p ic te d in F ig . 3 . N o te that the e c o n o m ic a c tiv it ie s
u se c o a sta l a n d m a rin e re so u rce s as ra w m a te ria ls for
fu rth e r p ro c e s s in g o r fo r w aste d e p o sitio n fro m the
in t e r io r a re a s w h e re h u m a n s e ttle m e n ts a n d o th e r
e c o n o m ic a c t iv it ie s a b o u n d .
T h e e n v ir o n s o f the B a y o f S a n V ic e n te p ro v id e
e x c e lle n t e x a m p le s o f m u ltip u rp o se reso u rces. T h e B a y
is the site o f a m a jo r port area, ca te rin g to both the
in d u stria l f is h in g in d u stry as w e ll as to c o m m e rc ia l and
p a sse n g e r ca rg o , f is h m e a l p lan ts, iro n an d steel p lan ts
a n d c h e m ic a l p la n ts . T o u r is t b e a c h e s are fo u n d in
L e n g a , R a m u n t c h o a n d R e c o to w h ile s m a ll f is h in g
c o m m u n it ie s are in the co a sta l to w n s o f S a n V ic e n te
a n d L e n g a . T h e other e c o n o m ic a c t iv it ie s in the area
in c lu d e : a rtisa n a l a n d in d u stria l f ish in g , in d u stria l w oo d
p la n ts ( C i a . C h i le n a d e A s t i l la s in S c h w a g e r a n d
A S T E X in C o lc u r a ) , m in e s ( C i a . C a r b o n if e r a in
S c h w a g e r a n d E N A C A R in P u e rto L o ta ) , b e a ch es in
P la y a B la n c a , C o lc u r a , C h iv i l in g o an d L a ra q u e te , and
s a w m ills an d th e rm o e le c tric p lan ts in P u e rto C o ro n e l.
A r t is a n a l f is h in g c o m m u n itie s an d to u rist b e a ch es
are scattered o v e r the A ra u c o c o a stlin e in the to w n s o f
A r a u c o , L l ic o , T u b u l an d P u n ta L a v a p ie . T h e tow n o f
A r a u c o is th e site o f fo re st p la n ta tio n s a n d re la te d
in d u strie s, i.e ., F o re s ta l A ra u c o , F o resta l C a ra m p a n g u e
an d C e lu lo s a A r a u c o y C o n s titu c ió n .
Fisheries
F ish e ry resource distribution in C h ile is heterogenous
du e to the w id e ran g e o f e n v iro n m e n ta l c o n d it io n s that
d e te rm in e p ro d u c tiv ity . T h e w aters o f R e g io n V I I I ,
e s p e c ia lly in the G u l f o f A ra u c o , su pp ort the h ig h e st
c a tc h e s; the total la n d in g s o f m a rin e re so u rce s reach ed
3 .2 m illio n t in 1 9 9 1 rep resen tin g 5 3 % o f the n a tio n a l
la n d in g s.
Fig. 3. The coastal area o f Region VIII, B io-Bio, Chile and the various resource-dependent econom ic activities situated here.
T h e m a rin e s p e c ie s o f c o m m e r c ia l im p o r ta n c e
n u m b e r a b o u t 1 2 5 ( I F O P 1 9 8 8 ) , 6 4 o f w h ic h are
ca p tu re d in R e g io n V I I I and w h ic h in c lu d e f ish (3 4 ),
m o l l u s c s ( 1 2 ) , c r u s t a c e a n s ( 9 ) , a lg a e ( 7 ) a n d
e ch in o d e rm s ( 1 ) (see A n n e x 1 fo r a co m p le te list). T h e
b u lk o f re g io n a l la n d in g s co n sists o f f is h sp e cie s w h ic h
in c lu d e Trachurus m urphyii ( C h ile a n ja c k m a c k e re l;
lo c a l n a m e , jurel), Sardinops sagax (S o u th A m e r ic a n
p ilc h a r d ; lo c a l nam e, sardina española), a n d E ngraulis ringens (P e r u v ia n a n c h o v y ; lo c a l n a m e , anchoveta).
F ig . 4 d e p ic t s th e h is t o r ic a l tre n d in th e to ta l
la n d in g s o f im p o rtan t p e la g ic sp e cie s in the T a lc a h u a n o
area. N o te the sharp in cre a se in ja c k m a c k e re l la n d in g s
b e g in n in g in the 1 9 7 0 s a g a in st the d ro p in sa rd in e s and
a n c h o v e t a . P r e s e n t ly , th e f is h e r ie s d e e m e d f u l ly
e x p lo ite d in c lu d e ja c k m a c k e re l a m o n g the p e la g ic s ,
a n d h a k e a n d lo bsters a m o n g the d e m e rsa ls.
O n a v e r a g e , 9 5 % o f th e t o ta l f is h c a t c h are
p r o c e s s e d in to f is h m e a l w h ile th e re st is p ro c e s s e d
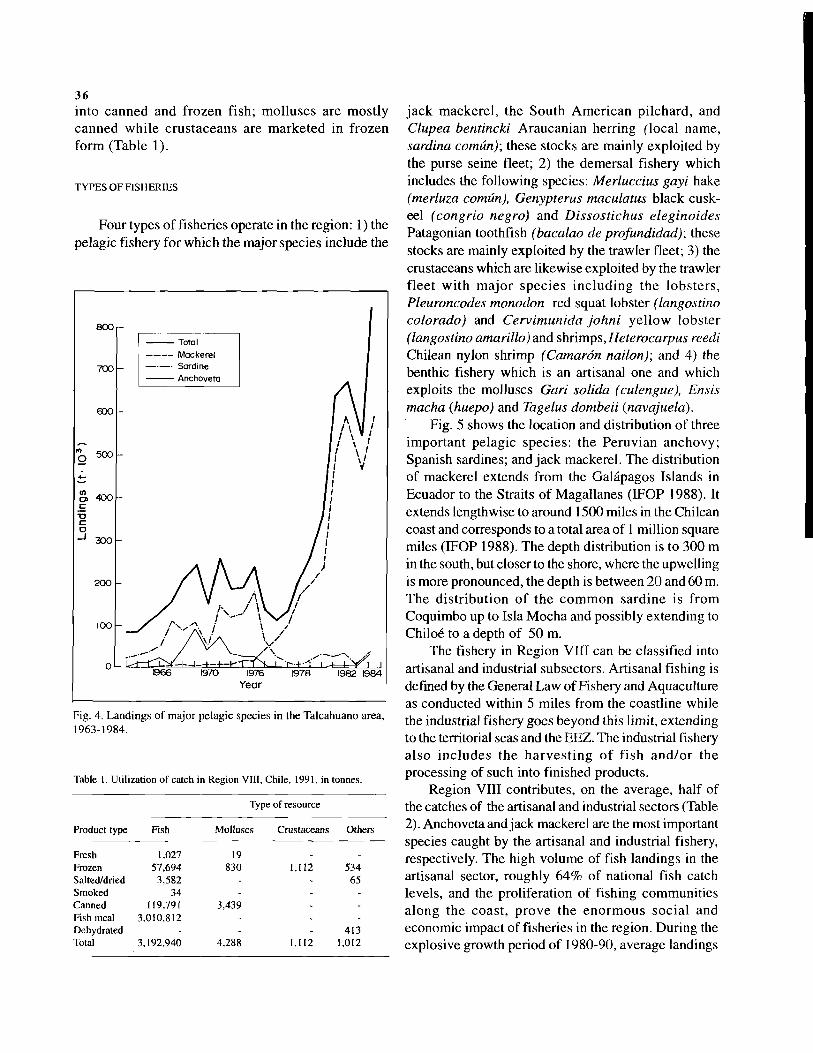
in to c a n n e d a n d f r o z e n f is h ; m o llu s c s a re m o s t ly
c a n n e d w h ile c r u s t a c e a n s a re m a rk e te d in f r o z e n
fo r m ( T a b le 1 ) .
TYPES OF FISHERIES
F o u r ty p e s o f fis h e rie s operate in the re g io n : 1 ) the
p e la g ic f is h e ry fo r w h ic h the m a jo r sp e c ie s in c lu d e the
3 6
Fig. 4. Landings o f major pelagic species in the Talcahuano area, 1963-1984.
Table 1. Utilization o f catch in Region VIII, Chile, 1991, in tonnes.
Type of resource
Product type Fish Molluscs Crustaceans Others
Fresh 1,027 19 _Frozen 57,694 830 1,112 534Salted/dried 3,582 - - 65Smoked 34 - - -
Canned 119,791 3,439 - -
Fish meal 3.010,812 - - -
Dehydrated - - - 413Total 3,192,940 4,288 1,112 1,012
j a c k m a c k e r e l, th e S o u th A m e r ic a n p ilc h a r d , and
Clupea bentincki A r a u c a n ia n h e rrin g ( lo c a l n a m e ,
sardina común); these sto ck s are m a in ly e x p lo ite d b y
the p u rse se in e fleet; 2 ) the d e m e rsa l f is h e ry w h ic h
in c lu d e s the f o llo w in g sp e c ie s : Merluccius gayi h a ke
(merluza común), Genypterus maculatus b la c k c u s k -
eel (congrio negro) a n d Dissostichus eleginoides P a ta g o n ia n to o th fish (bacalao de profundidad); these
sto ck s are m a in ly e x p lo ite d b y the tra w le r fle e t; 3 ) the
cru sta ce a n s w h ic h are lik e w is e e x p lo ite d b y the traw ler
f le e t w it h m a jo r s p e c ie s in c lu d in g th e lo b s t e r s ,
Pleuroncodes monodon red sq u a t lo b ster (langostino colorado) and Cervimunida johni y e l lo w lo b s t e r
(langostino amarillo) a n d s h r im p s, Heterocarpus reedi C h ile a n n y lo n sh r im p (Camarón nailon); a n d 4 ) the
b e n th ic f ish e ry w h ic h is an a rtisa n a l o n e an d w h ich
e x p lo its the m o llu s c s Gari solida (culengue), Ensis macha (huepo) a n d Tagelus dombeii (navajuela).
F ig . 5 sh o w s the lo c a t io n a n d d istr ib u tio n o f three
im p o r ta n t p e la g ic s p e c ie s : th e P e r u v ia n a n c h o v y ;
S p a n is h sa rd in e s; a n d ja c k m a c k e re l. T h e d istr ib u tio n
o f m a c k e re l e x te n d s fro m the G a lá p a g o s Is la n d s in
E c u a d o r to the S tra its o f M a g a lla n e s ( I F O P 19 8 8 ) . It
extends le n g th w ise to a ro u n d 1 5 0 0 m ile s in the C h ile a n
co a st a n d co rre sp o n d s to a to tal a rea o f 1 m illio n square
m ile s ( I F O P 1 9 8 8 ) . T h e dep th d istr ib u tio n is to 3 0 0 m
in the south, but c lo se r to the shore, w here the u p w e llin g
is m o re p ro n o u n c e d , the dep th is b etw een 2 0 a n d 6 0 m .
T h e d is t r ib u t io n o f th e c o m m o n s a r d in e is f r o m
C o q u im b o u p to Is la M o c h a a n d p o s s ib ly e x te n d in g to
C h ilo é to a depth o f 5 0 m .
T h e f ish e ry in R e g io n V I I I c a n be c la s s if ie d into
a rtisa n a l an d in d u s tria l su b se cto rs. A r t is a n a l f is h in g is
d efin ed b y the G e n e r a l L a w o f F is h e r y an d A q u a c u ltu re
as co n d u cte d w ith in 5 m ile s fro m the c o a s tlin e w h ile
the in d u stria l f is h e ry g o es b e y o n d th is lim it , e x te n d in g
to the territo rial seas a n d the E E Z . T h e in d u stria l f ish e ry
a ls o in c lu d e s th e h a r v e s t in g o f f is h a n d /o r the
p ro c e ss in g o f su ch in to f in is h e d p ro d u cts.
R e g io n V I I I c o n trib u te s, on the a v e ra g e , h a lf o f
the ca tch e s o f the a rtisa n a l an d in d u stria l secto rs (T a b le
2 ). A n c h o v e ta an d ja c k m a ck e re l are the m o st im portant
sp e cie s c a u g h t b y the a rtisa n a l an d in d u s tria l f ish e ry ,
re sp e c tiv e ly . T h e h ig h v o lu m e o f f is h la n d in g s in the
a rtisa n a l secto r, r o u g h ly 6 4 % o f n a tio n a l f is h ca tch
le v e ls , a n d the p ro life ra tio n o f f is h in g c o m m u n it ie s
a lo n g th e c o a s t , p r o v e th e e n o r m o u s s o c ia l a n d
e c o n o m ic im p a c t o f f is h e rie s in the re g io n . D u r in g the
e x p lo s iv e g row th p e rio d o f 1 9 8 0 -9 0 , a v e ra g e la n d in g s

Table 2. National and regional landings of the artisanal and industrial fishery (in tonnes) by major species, and production of the industrial fishery, by product type, 1989.
37
jack mackerel (C) along the Chilean coast, and location of the main fisheries.
Artisanal Industrial
Species National Regional National Regional
FishPeruvian anchovy 183,315 152,840 1,504,039 84,226Araucanian herring 53,171 46,899 106,479 106,454Chilean jack mackerel 16,879 10,235 2,372,982 1,751,486Hake 10,909 3,276 - -
Patagonian grenadier 2,744 2,676 207,209 207,157South American pilchard - - 1,564,674 28,437Others 86,838 12,371 99,950 33,544
MolluscsSnails 1,298 629 - _
Cockle 1,557 466 - -
Clam 33,367 373 - -
Mussels 8,763 284 - -
Others 65,489 573 - -
CrustaceansShrimps - - 5,575 1,196Crab 3,288 453 - .
Conch 1,193 328 - -
Prawns - - 573 573Algae 178,480 24,036 - -
Other species 28,887 1,110 4,541 1,769
Product typeFishmeal - - 1,377,796 515,066Oil - - 260,078 117,147Canned - - 53,970 25,949Frozen - - 57,236 12,472
Total 676,178 256,501 7,615,102 2,883,707
of the artisanal sector increased from 33 t to 151 t but this is nevertheless a minor percentage relative to the growth in the industrial sector.
Artisanal. Artisanal fishing com munities are distributed along the coast of the Bay of San Vicente but most especially along the Gulf of Arauco due to the diversity o f marine resources landed here. The major fishing towns are Concepcion, San Vicente and Coliumo, Gulf of Arauco, Santa Maria Island and between Lebu and Isla Mocha (Fig. 6). Boats usually fish within 5 km from the coastline reaching a maximum of 100 km depending on the kind of boat and on the species targetted.
The artisanal fleet is comprised of two types of fishing vessels: boats and barges. Boats are generally made of wood with a length of 10 m or less and without
crew cabins. The mode of propulsion may either be inboard motor, outboard motor or oar. Crew size is usually 2 to 4 people. The gears often used include gill nets, trammel nets, longlines, compressed air diving and traps.
Barges are longer than 10 m, and generally have crew cabins and wheelhouses, with an inboard motor and a crew of 4 to 10 people. Barges use mechanized equipment such as sonar and radar. The gears usually used are longlines, gill nets and trammel nets. The fish targetted by artisanal vessels are shown in Table 3. Barges account for 89% of the catches of large pelagics and offshore demersals while the smaller boats (both m echanized and nonm echanized) target coastal demersals such as hake and grouper. A characterization of the artisanal capture fishery according to target

3 8
Fig. 6. Location of the artisanal fishing communities in the Bay of San Vicente and G ulf o f Arauco area, Chile.
Table 3. Type and number of artisanal fishing crafts and target species in the Bay of San Vicente, Concepcion, Chile.
Target species Barge Motor boat Sail boat
Large pelagics and offshore demersals (albacore, deepsea cod, golden eel) 39
Small pelagics (Spanish sardine, common sardine, anchovy. Chilean jack mackerel) 3
Medium pelagics (grunt, chub mackerel, bonito. eel. bream) 2 5 1
Benthic invertebrates (squids, snails, mussels, crabs) 17 8
Coastal demersals (hake, grouper) - 43 19
Other coastal resources (algae, redfish. silversides) - 4 7
species, vessel, engine, equipment and gear as well as average fishing distance is presented in Table 4.
Artisanal vessels (boats and barges) operate along the entire coastline o f the Gulf of Arauco (Table 5).
The communities o f San Vicente and Lo Rojas have the largest number of vessels, with barges and sail- powered boats accounting for the largest share. Medium-size vessels (boats with inboard and outboard motors) are more prevalent in the communities of Tubul and Laraquete.
Fish landed at the ports of San Vicente and Lota are consumed fresh by the adjacent communities while those landed at the port of Coronel are used as inputs for fishmeal factories in the area. A small percentage of the fishery catch is processed, i.e., smoked, dried/ salted or salted.
Industrial. The industrial fishery consists of two major components: capture fishery and processing. The capture fishery is conducted in various fishing grounds depending on the fleet and on the target species. On the average, the trawler fleet reaches a distance of 20 to 25 km from the coast while the purse seine fleet operates from Isla Mocha up to San Antonio and further up to a distance of 130 km.
Target species include the hake, black cusk-eel and Patagonian toothfish. Jack mackerel landings of the industrial sector account for 94 to 96% of the total volume of landings at the national level with the region contributing 38% to the total.
The industrial fishery uses fishing vessels of weight greater than 50 GT and includes purse seiners and trawlers. Gears used and operational regimes vary according to targetted resources (Table 6).
Industrial processing consists of the reduction of fish into meal and/or oil, canned and frozen fish. In 1989, the country produced 1.8 million t o f fish products, 77% of which was fishmeal. Region VIII accounts for an average o f 38% of total fishmeal production (Table 2). Major species processed as fishmeal include Chilean jack mackerel, sardines and anchovies. These species are also canned in addition to molluscs.
Most of the fishmeal factories are found in the landing centers of the industrial fleet including the ports of Talcahuano (27), San Vicente (6), Coronel (8) and Tomé (I), where most of the fishmeal factories are found (Table 7). Table 8 shows pertinent characteristics of fish processing activities in the region.
Forestry
Due to favorable environmental conditions, Region VIII is basically a forestal region with over 41 % of its

Table 4. Characteristics o f the artisanal capture fishery by type o f species and utilization o f capital and technology.3 9
Species Fishing vessel Engine EquipmentType Useful HP Useful Type Useful
Length life life life(meters) (years) (years) (years)
FishingFishing gear distance
Type Useful (miles)life
(years)
1. Anchoveta,sardine
Barge with inboard engine: wooden hull
12-18 20 <120 15 Echosounder,winch
5 Encirclingnet
5 5-6
2. Deepsea cod Barge with inboard engine: wooden hull
12-18 20 140-200 15 Echosounder 5 “Espinel” 5 25-30
3. Swordfish Barge with inboard engine: wooden hull
12-18 20 200-250 15 Echosounder,sonar
5 Albacorenet
5 40-70
4. Merluza Barge withinboardengine
7-12 15-30 50-80 10 Littleequipment
“Espinel” 5 2-7
5. Shellfish Sailboat <7 8-10 25-40 5 - - - 1
6. Algae Boats withoutboardmotors
<7 10-15 25-40 5 Compressor,divingequipment
10/5 - <1
Table 5. Vessels used by the artisanal fishing fleet, per locality, 1990.
Locality Barges BoatsInboardmotor
Outboardmotor
Sail Total
San Vicente 86 14 47 59 206Lenga 26 49 75Boca Sur 16 16Maule 14 14Lo Rojas 53' 48 3 77 181Pueblo H. 1 17 18El Morro 1 2 10 13La Conchilla 1 4 5El Blanco 7 18 25Lota 25 20 4 49 98Colcura 15 15Laraquete 25 25 50Arauco 9 11 20Tubul1 26 49 75Llico 1 2 19 8 30Punta Lavapie 4 10 70 34 118
‘Twenty-one vessels land in Lo Rojas; the remaining vessels, in Coronel.2 Also includes Las Peñas.
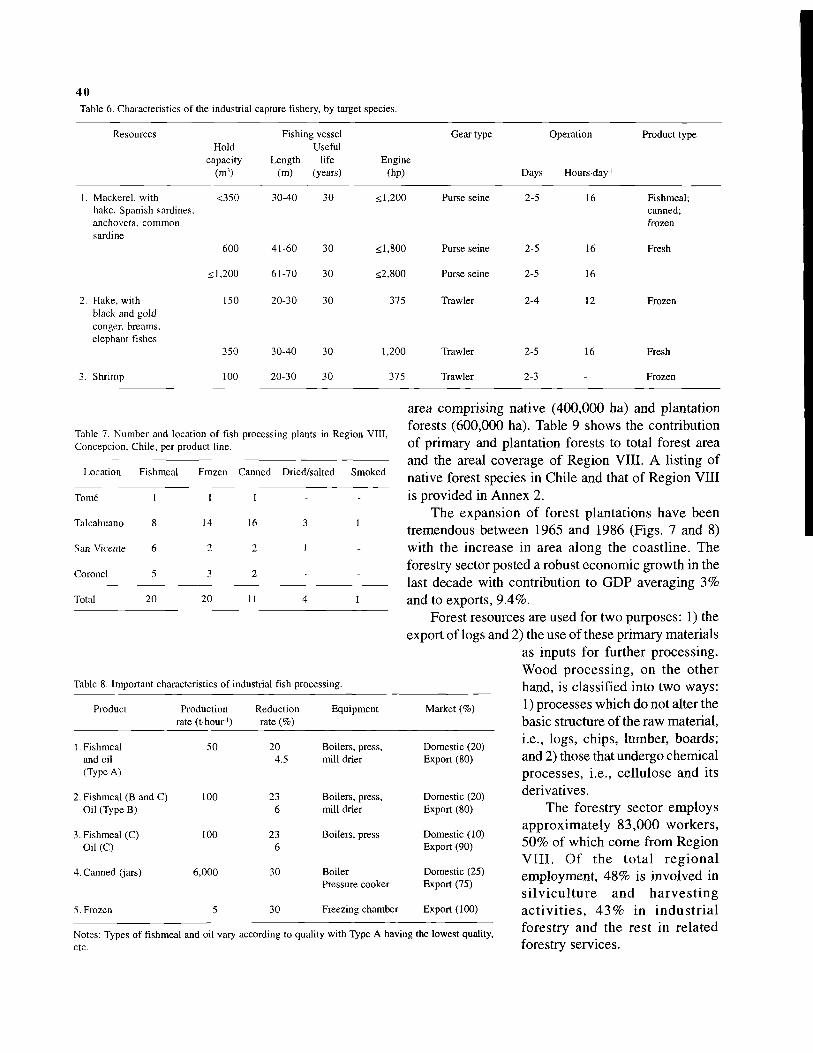
4 0
Table 6. Characteristics o f the industrial capture fishery, by target species.
ResourcesHold
capacity(m 1)
Fishing vessel Useful
Length life (m) (years)
Engine(bp)
Gear type
Days
Operation
H o u rsd a y 1
Product type
1. Mackerel, with <350 30-40 30 <1,200 Purse seine 2-5 16 Fishmeal;hake, Spanish sardines. canned;anchoveta, common frozensardine
600 41-60 30 <1,800 Purse seine 2-5 16 Fresh
<1,200 61-70 30 <2,800 Purse seine 2-5 16
2. Hake, with 150 20-30 30 375 Trawler 2-4 12 Frozenblack and goldconger, breams,elephant fishes
350 30-40 30 1,200 Trawler 2-5 16 Fresh
3. Shrimp 100 20-30 30 375 Trawler 2-3 - Frozen
Table 7. Number and location o f fish processing plants in Region VIII, Concepcion, Chile, per product line.
Location Fishmeal Frozen Canned Dried/salted Smoked
Tomé 1 1 1 - -
Talcahuano 8 14 16 3 1
San Vicente 6 2 2 1 -
Coronel 5 3 2 - -
Total 20 20 11 4 1
Table 8. Important characteristics o f industrial fish processing.
Product Production rate (t h o u r1)
Reduction rate (%)
Equipment Market (%)
1. Fishmeal 50 20 Boilers, press, Domestic (20)and oil 4.5 mill drier Export (80)(Type A)
2. Fishmeal (B and C) 100 23 Boilers, press, Domestic (20)Oil (Type B) 6 mill drier Export (80)
3. Fishmeal (C) 100 23 Boilers, press Domestic (10)Oil (C) 6 Export (90)
4. Canned (jars) 6,000 30 Boiler Domestic (25)Pressure cooker Export (75)
5. Frozen 5 30 Freezing chamber Export (100)
Notes: Types o f fishmeal and oil vary according to quality with Type A having the lowest quality,etc.
a re a c o m p r is in g n a tiv e (4 0 0 ,0 0 0 h a ) a n d p la n ta tio n
forests (6 0 0 ,0 0 0 h a ). T a b le 9 sh o w s the co n trib u tio n
o f p rim a ry a n d p la n ta tio n forests to total fo rest area
a n d the a re a l c o v e ra g e o f R e g io n V I I I . A lis t in g o f
n a tiv e fo rest sp e c ie s in C h ile a n d that o f R e g io n V I I I
is p ro v id e d in A n n e x 2 .
T h e e x p a n s io n o f fo re st p la n ta t io n s h a v e b een
trem en d o u s b etw een 1 9 6 5 a n d 1 9 8 6 (F ig s . 7 a n d 8)
w ith th e in c r e a s e in a re a a lo n g the c o a s t lin e . T h e
fo restry secto r p osted a ro b u st e c o n o m ic g ro w th in the
la st d e ca d e w ith co n trib u tio n to G D P a v e ra g in g 3 %
a n d to exp o rts, 9 . 4 % .
F o re s t re so u rce s are u se d fo r tw o p u rp o se s: 1 ) the
exp o rt o f lo g s an d 2 ) the use o f these p rim a ry m a te ria ls
as in p u ts fo r fu rth e r p ro c e s s in g .
W o o d p r o c e s s in g , o n th e o th e r
h a n d , is c la s s if ie d in to tw o w a y s:
1 ) p ro ce sse s w h ic h d o n o t a lter the
b a s ic structure o f the raw m a te ria l,
i .e ., lo g s , c h ip s , lu m b e r, b o a rd s;
an d 2 ) those that un d erg o c h e m ic a l
p ro c e s s e s , i .e ., c e llu lo s e a n d its
d e riv a tiv e s .
T h e fo re stry se cto r e m p lo y s
a p p r o x im a t e ly 8 3 ,0 0 0 w o r k e rs ,
5 0 % o f w h ic h co m e fro m R e g io n
V I I I . O f th e t o t a l r e g io n a l
e m p lo y m e n t, 4 8 % is in v o lv e d in
s i l v i c u l t u r e a n d h a r v e s t in g
a c t i v i t i e s , 4 3 % in in d u s t r i a l
fo r e s tr y a n d th e re st in r e la te d
fo restry se rv ic e s .
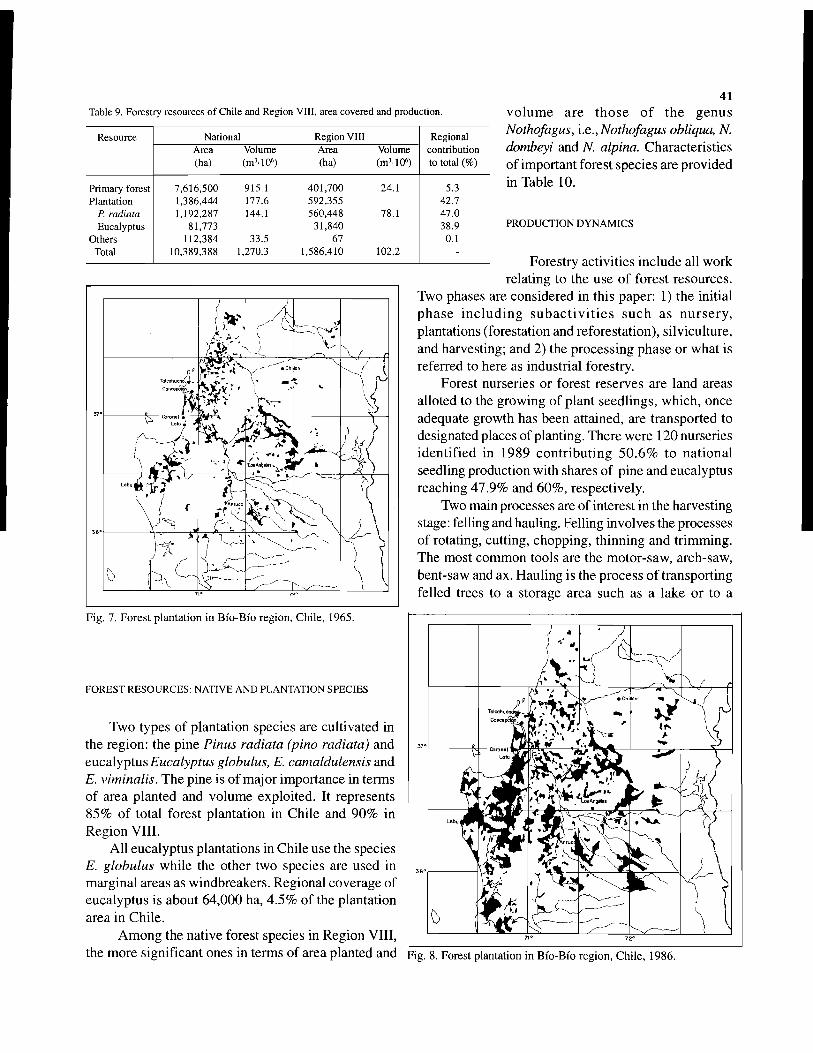
Table 9. Forestry resources o f Chile and Region VIII, area covered and production.
Resource National Region VIII Regional contribution to total (%)
Area(ha)
Volume(mMO6)
Area(ha)
Volume(mMO6)
Primary forest 7,616,500 915.1 401,700 24.1 5.3Plantation 1,386,444 177.6 592,355 42.7
P. radiata 1,192,287 144.1 560,448 78.1 47.0Eucalyptus 81,773 31,840 38.9
Others 112,384 33.5 67 0.1Total 10,389,388 1,270.3 1,586,410 102.2 -
v o lu m e a re t h o s e o f th e g e n u s
Nothofagus, i.e ., Nothofagus obliqua, N. dombeyi and N. alpina. C h a r a c te r is t ic s
o f im p o rtan t forest sp e c ie s are p ro v id e d
in T a b le 1 0 .
PRODUCTION DYNAMICS
4 1
FOREST RESOURCES: NATIVE AND PLANTATION SPECIES
T w o typ e s o f p la n ta tio n sp e cie s are c u lt iv a te d in
the re g io n : the p in e Pinus radiata (pino radiata) an d
e u c a ly p tu s Eucalyptus globulus, E. camaldulensis an d
E. viminalis. T h e p in e is o f m a jo r im p o rta n ce in term s
o f a rea p la n te d a n d v o lu m e e x p lo ite d . It represents
8 5 % o f to tal fo rest p la n ta tio n in C h i le an d 9 0 % in
R e g io n V I I I .
A l l e u c a ly p tu s p la n ta tio n s in C h i le u se the sp e cie s
E. globulus w h ile the other tw o sp e cie s are u se d in
m a rg in a l areas as w in d b re a k e rs. R e g io n a l c o v e ra g e o f
e u c a ly p tu s is a bo u t 6 4 ,0 0 0 ha, 4 . 5 % o f the p la n ta tio n
a rea in C h ile .
A m o n g the n a tiv e fo rest sp e cie s in R e g io n V I I I ,
the m o re s ig n if ic a n t o n es in term s o f a rea p la n te d and
F o r e s try a c t iv it ie s in c lu d e a ll w o rk
re la tin g to the u se o f fo re st re so u rce s .
T w o p h ases are c o n sid e re d in th is p ap e r: 1 ) the in it ia l
p h a s e i n c l u d i n g s u b a c t i v i t i e s s u c h a s n u r s e r y ,
p la n ta tio n s (fo restatio n an d re fo resta tio n ), s ilv ic u ltu re ,
a n d h a rv e stin g ; a n d 2 ) the p ro c e s s in g p h a se o r w h a t is
referred to here as in d u s tria l fo restry.
F o re s t n u rse rie s o r fo rest re se rv e s a re la n d areas
a llo ted to the g ro w in g o f p la n t s e e d lin g s , w h ic h , o n ce
a dequ ate grow th h a s b een atta in e d , are tran sp o rte d to
d esig n ated p la c e s o f p la n tin g . T h e r e w ere 1 2 0 n u rse rie s
id e n t if ie d in 1 9 8 9 c o n t r ib u t in g 5 0 . 6 % to n a t io n a l
se e d lin g p ro d u ctio n w ith sh ares o f p in e a n d e u c a ly p tu s
re a ch in g 4 7 . 9 % an d 6 0 % , r e sp e c tiv e ly .
T w o m a in p ro cesses are o f interest in the h a rv e stin g
stage: fe llin g and h a u lin g . F e llin g in v o lv e s the p ro cesses
o f ro tatin g , cu ttin g , c h o p p in g , th in n in g a n d tr im m in g .
T h e m o st co m m o n to o ls are the m o to r-sa w , a rc h -s a w ,
b e n t-sa w and a x . H a u lin g is the p ro c e ss o f tran sp o rtin g
fe lle d trees to a sto rage a re a su c h a s a la k e o r to a
8. Forest plantation in Bio-Bio region, Chile, 1986
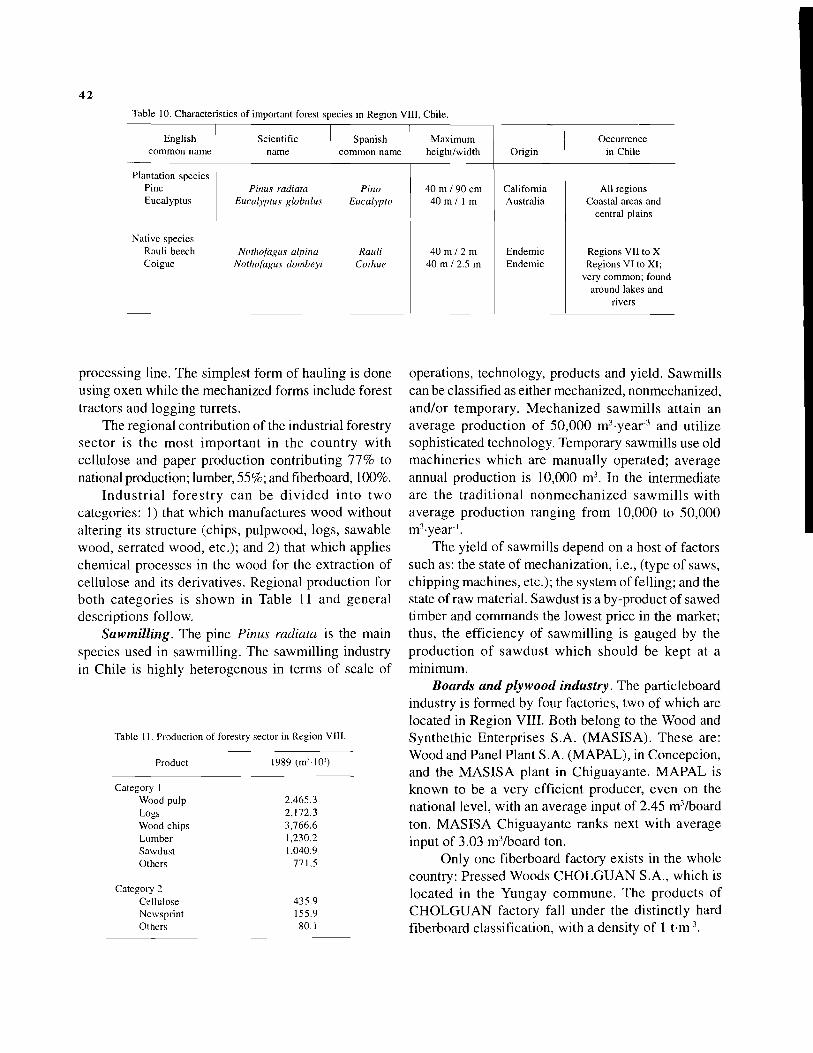
42Table 10. Characteristics o f important forest species in Region VIII, Chile.
English common name
Scientificname
Spanish common name
Maximumheight/width Origin
Occurrence in Chile
Plantation species PineEucalyptus
Native species Rauli beech Coigue
Pinus radiata Eucalyptus globulus
Nothofagus alpina Nothofagus dombeyi
PinoEucalypto
RauliCoihue
40 m / 90 cm 40 m / 1 m
40 m / 2 m 40 m / 2.5 m
CaliforniaAustralia
EndemicEndemic
All regions Coastal areas and
central plains
Regions VII to X Regions VI to XI;
very common; found around lakes and
rivers
processing line. The simplest form of hauling is done using oxen while the mechanized forms include forest tractors and logging turrets.
The regional contribution of the industrial forestry sector is the most important in the country with cellulose and paper production contributing 77% to national production; lumber, 55%; and fiberboard, 100%.
Industrial forestry can be d ivided into two categories: 1 ) that which manufactures wood without altering its structure (chips, pulpwood, logs, sawable wood, serrated wood, etc.); and 2) that which applies chemical processes in the wood for the extraction of cellulose and its derivatives. Regional production for both categories is shown in Table 11 and general descriptions follow.
Sawmilling. The pine Pinus radiata is the main species used in sawmilling. The sawmilling industry in Chile is highly heterogenous in terms of scale of
Table 11. Production of forestry sector in Region VIII.
Product 1989 (m1-1 O’)
Category 1Wood pulp 2,465.3Logs 2,172.3Wood chips 3,766.6Lumber 1,230.2Sawdust 1,040.9Others 771.5
gory 2Cellulose 435.9Newsprint 155.9Others 80.1
operations, technology, products and yield. Sawmills can be classified as either mechanized, nonmechanized, and/or temporary. M echanized sawmills attain an average production of 50,000 m3-year3 and utilize sophisticated technology. Temporary sawmills use old machineries which are manually operated; average annual production is 10,000 m3. In the intermediate are the traditional nonmechanized sawm ills with average production ranging from 10,000 to 50,000 nf-year1.
The yield of sawmills depend on a host of factors such as: the state of mechanization, i.e., (type of saws, chipping machines, etc.); the system of felling; and the state of raw material. Sawdust is a by-product of sawed timber and commands the lowest price in the market; thus, the efficiency of sawmilling is gauged by the production o f sawdust which should be kept at a minimum.
Boards and plywood industry. The particleboard industry is formed by four factories, two of which are located in Region VIII. Both belong to the Wood and Synthethic Enterprises S.A. (MASISA). These are: Wood and Panel Plant S.A. (MAPAL), in Concepcion, and the MASISA plant in Chiguayante. MAPAL is known to be a very efficient producer, even on the national level, with an average input of 2.45 m3/board ton. MASISA Chiguayante ranks next with average input of 3.03 m3/board ton.
Only one fiberboard factory exists in the whole country: Pressed Woods CHOLGUAN S.A., which is located in the Yungay commune. The products of CHOLGUAN factory fall under the distinctly hard fiberboard classification, with a density of 1 t-nr3.

Table 12. Names and important characteristics o f w ood chip centers in Region VIII, B io-B io, Chile.
Establishment Technology
Annualproduction
(m3) Species Market
Asseradero San Lorenzo Drum 10,000-50,000 Pine Export
Aserradero Copihue Disc 10,000-50,000 Pine Export
Astillas Exportaciones Disc > 100,000 Pine, eucalyptus native species Export
Astillas J.C.E. Ltda. Blade 10,000-50,000 Native species -
Bosques Arauco S.A. Disc 10,000-50,000 Pine Domestic
Cia. Astillas Concepcion Disc > 100,000 Eucalyptus and native species Export
Cia. Chilena Astillas Disc > 100,000 Eucalyptus and native species Export
Forestal Coronel S.A. Disc 50,000-100,000 Native species Export
Gonzalez Huepe Maria E. Blade < 10,000 Eucalyptus and native species Export
T h e v e n e e r a n d n o n v e n e e r
in d u stry is c o m p o s e d o f s ix enter
p r is e s , o f w h ic h o n e is fo u n d in
R e g io n V I I I , the A g r ic u lt u r a l an d
F o r e s t a l S o c ie t y C O L C U R A in
L o ta . T h e v e n e e r in d u s try u t il iz e s ,
e x c e p t fo r the e u c a ly p tu s sp e c ie s
Eucalyptus globulus, o n ly
in d ig e n o u s sp e c ie s . T h e in sta lle d
c a p a c ity o f the C O L C U R A p la n t
is 4 5 0 ,0 0 0 r r F -y e a r 1 o f veneer.
Wood chips. N i n e f ir m s
p ro d u ce w o o d c h ip s in the re g io n .
A l l f a c t o r ie s u s e s t a t io n a r y
e q u ip m e n t but d iffe re n t te c h n o lo
g ie s , le v e l o f p ro d u c tio n , sp e cie s
u se d a n d m a rk e t (T a b le 1 2 ) .
Cellulose and paper. T h e
in d u stry c o n sists o f s ix en terp rises
w h ic h operate se v e n p la n ts in the
r e g io n . T a b l e 1 3 l i s t s t h e s e
enterprises, their a n n u a l pro ductio n,
sp e cie s u se d a n d f in a l p ro d u ct.
4 3
Tourist Resources
Table 13. Paper and cellulose plants in Region VIII, Bio-Bio, Chile and selected characteristics.
FirmSpecies
used
Annualproduction
(t)Market
orientationFinal
product
Celulosa Arauco y Constitución
Planta Arauco I Pino radiata 150,000-200,000 Export Kraft cellulosePlanta Arauco II Pino radiata > 300,000 Export Kraft cellulose
Celulosa del PacificoPlanta Mininco
Compañía Manufacturer de Papeles y Cartones
Pim> radiata > 300,000 Export Kraft cellulose
Planta Laja
Forestal e Industrial Sta. Fe S.A.
Pino radiata Eucalipto
> 300,000 Export Kraft cellulose, printing paper, packing paper
Planta Nacimiento Eucalipto 200,000-250,000 Domestic and export
Kraft cellulose, white paper
Industrias ForestalesPlanta Nacimiento
Papeles Bío-Bío S.A. Planta San Pedro
Pino radiata
Pino radiata
100.000-150,000
100.000-150,000
Export
Domestic and export
Mechanical pulp, newsprint
R e g io n V I I I o ffe rs a d iv e r s e
ra n g e o f to u rist a ttra ctio n s: u rb an
c e n t e r s , r iv e r s , s n o w - c a p p e d
m o u n ta in s , hot s p rin g s, in d u s tria l
p a rk s , b e a c h e s an d p o rts, an d sites
o f h is t o r ic a l a n d c u lt u r a l im p o r
ta n ce . T h e b e n e fits p ro d u c e d b y
the to u ris m se cto r in c lu d e fo re ig n
e x c h a n g e g e n e ra tio n , s a v in g s (v ia
“ i n v i s i b l e e x p o r t ” o f n a t iv e
p r o d u c t s ) a n d e m p lo y m e n t
g e n e ra tio n , a ll o f w h ic h co n trib u te
s i g n i f i c a n t l y to r e g i o n a l a n d
n a tio n a l d e v e lo p m en t. T h e to u rism
in d u s t r y , h o w e v e r , c o n t r ib u t e s
m in im a lly to re g io n a l in c o m e an d
e m p lo y m e n t, the latter a v e ra g in g
n o m o re th a n 0 . 5 % . T h is p o te n tia l
is th re a te n e d b y p o llu t io n fr o m
in d u s t r y , m a in ly fr o m f is h m e a l
p la n t s a n d c e l l u lo s e a n d p a p e r
fa c to rie s.

The tourist attractions can be classified geographically as:
1) Andean zone
The principal resources include hot springs, volcanoes, snow slopes and fishing but there is no large- scale development except those with foreign tourist appeal. The main tourist attractions are the ski center and hot springs of Chilian. The ski center is complete with skiing equipment, a hotel, as well as five open-air and naturally heated pools. Of secondary importance is the Antuco tourist complex which is situated at the foot of the Antuco volcano which is inside the Laja Lake National Park. Site facilities include cablecars, restaurants, bars and ski equipment.
2) Coastal range
The most prominent attractions are the beaches to the north of Penco and to the south of the Bay of San Vicente. Among the beaches identified, less than half can be reached by public transport while most beaches do not have facilities such as hotels and restaurants (Table 14). Also of major importance is the Concepcion
4 4
metropolis which is considered a historical, cultural, folkloric and gastronomic center and boasts of major infrastructure including hotels and transportation facilities.
3) Araucanian route
The most important tourist attraction in the region based on the number of visitors are its beaches, notably the Playa Blanca, and the beaches at Chivilingo and Laraquete. Tourism services such as hotels, inns and camping sites, are most prevalent in Concepcion and Nuble. Tourism activities peak during spring (January and February) and winter (July and August). Domestic tourists come mainly from the Santiago area whereas foreign tourists come from the United States, Germany and several Asian countries.
Externalities
The environmental problems o f the region are reflective of the diverse economic activities and natural resource use in the area (Tables 15 and 16). The Bay of San Vicente is the site of petrochemical plants, fishmeal plants, cement plants, iron and steel mills,
Table 14. Location and characteristics o f beaches in the coastal zone of Region VIII.
Beach Town Transport Facilities Activities
Lenga Talcahuano Private None Recreation/swimming
Ramuntcho and Recoto Talcahuano Private None Recreation/fishing
Desembocadura Talcahuano Private None Recreation/fishing
Las Escaleras Talcahuano Private None Recreation/fishing
Escuadrón Coronel Private None Recreation/fishing
Playa Blanca Coronel Public Restaurants Recreation/swimming
Colcura Lota Public None Recreation/swimming
Chivilingo Lota Public None Recreation/swimming/fishing
Laraquete Arauco Public Hotels and restaurants Recreation/swimming/fishing
Arauco Arauco Public Hotels Recreation/swimming/fishing
Llico Arauco Private None Recreation/swimming/fishing
Tubul Arauco Private None Recreation/swimming/fishing
Punta Lavapie Arauco Private None Recreation/fishing

Table 15. Principal contaminants originating from liquid effluents in Concepcion Bay.
Pollutantsource
Productionsystem Product
Treatment Principalcontaminants
Tomé Slaughterhouse Cut meat None Water with blood, grease, excrementsTextile industry Spun cotton None Solids (fibers), maltose, glucose,
solvents, caustic soda, colorings, auxiliary chemical substances.
Fishing industry Flour, oil and frozen fish
Glue water concentration
Organic matter (Glue water, oils, blood water)
Penco Porcelain factory Porcelain, sanitary wares
- Clays, colorings, anilines
El Morro Fishing industry Flour, frozen oil and canned fish and shellfish.
Glue and blood water concentration
Organic matter
Isla Rocuant Fishing industry Flour, canned fish in oil
None Organic matter
Lirquen Glass industry Glasses and crystals - Fine sand, china clayTalcahuano Dockyards Heat, Calcium hydroxide,
Sodium hydroxide, Sodium carbonate, Sulphuric acid, Hydrocarbons.
M ercantile ships, petroleum retailers fishers and launches.
Spilled petroleum, oils, food residues.
San Pedro Paper factory - - Organic matter (fibers, bark), talc, china clay, aluminum sulfate, fungicides.
Laja Paper factory - “ Cellulose fibers (organic matter),Sodium lignite, Chlorine lignine, Mercury.
Chiguallante Textile factory Sodium sulfide, hypochlorite sulfite, sulfuric acid, formic acid, starch, glucose, wax, pectins, alcohols, fixatives, acetic acid, detergents, soaps, organic tints.
Brewery Beer Liquid presser and aquarelle tint, yeast, starch, alcohol, chromium salts.
Table 16. Principal contaminants originating from liquid effluents dumped into the Bay of San Vicente.
Pollutantsource
Productionsystem Product
Treatment Principalcontaminants
Talcahuano Iron and steel Iron ingots, Sedimentation Iron sheet, ammonia, phenols,mill laminated steel and neutralization ferrous salts, cyanid oils;
lubricants.Petrochemical Polychloride
vinyl (Pvc), chloride vinyl Dychlorotene hydrochloric acid polyethylene
SedimentationNeutralization
Hydrochloric acid, chloride, salts, oils, lubricants, hydrocarbon chlorates
Petrochemical Chlorine, caustic soda and other by-products
SedimentationNeutralization
Chlorine compounds, mercury
San Vicente Fishing industry Flour, canned fish in oil
Glue water concentration
Organic matter
Wood chips Chips - ChipsWire factory Wire - Small iron sheets, sulphuric
acid, hydrochloric acid, soapCement factory Cement - Heat, sedimentsMercantile ships Petroleum retailers and launches
Spilled petroleum, oils, food residues
San Vicente and Talcahuano
Sewage and waste disposal
Detergents, soaps, coliforms, excrements, grease oils, food residues, urea

Pumping water
Recovery of solids
D ischarge of raw m aterial -
>t
Separapumpinç
tion of station
Pumping water
R ecovery of blood water
Storage
1>
Firing
>?
Pressing
Coagulation
C lamp (vise)
Emission ofodor and material ^ “ |_D ry ing_ to the atm osphere
Trap liquids
Recovering solids
Coagulated blood w ater
R ecovery of insoluble solids
Evaporation Oil trap
Purification
Milling
Preservativeaddition
Dryflour
Finalproduct
Storage
Storage
Deodorized w ater v
W ash w ater o f equipm ent and plants
Fig. 9. Typical operation of a fish reduction plant and resulting effluents.
m e rch a n t v e s s e ls a n d o il ta n ke rs;
it a ls o se rv e s a s a re p o sito ry o f
th e p u b lic w a ste s y s t e m in the
t o w n s o f T a lc a h u a n o a n d S a n
V ice n te . In the B a y o f C o n c e p c io n ,
are abatto irs a n d te x tile m ills in
T o m é , f ish m e a l p lan ts in T o m p é,
E l M o r r o a n d I s l a R o c u a n t ,
s a w m ills in T a lc a h u a n o , a n d a
p ap er facto ry in L a ja .
T h e e n v ir o n m e n ta l p ro b le m s
o f the r e g io n a re a ttrib u ta b le to
tw o im p o rta n t e c o n o m ic secto rs,
n a m e ly : f is h e r y a n d fo restry.
I n d u s t r i a l e f f lu e n t s f r o m
r e d u c t io n p la n t s c o n s t itu te the
m a in s o u rc e o f c o n ta m in a tio n in
the re g io n in the fo rm o f liq u id
d is c h a r g e s , s p e c if ic a l l y in the
B a y s o f S a n V i c e n t e a n d
C o n c e p c io n , g a s e o u s e m is s io n s
a n d p a r t ic u la t e m a tte rs . F ig . 9
sh o w s the p ro c e s s in g stru ctu re o f
a t y p ic a l re d u c tio n p la n t a n d the
re su ltin g e fflu e n ts p e r stage in the
p ro d u c tio n c y c le .
T h e e n v iro n m e n ta l im p acts o f
the artisan al f ish e ry em anate from
inadequate so lid and w aste disposal
system s. T h is h a s p ro ve n h a rm fu l
to the m a rin e e n v iro n m e n t an d has
ca u se d attendant health r is k s in a ll
o f the co asta l f ish in g co m m u n itie s
(T a b le 1 7 ) . A n o th e r enviro n m en tal
co n ce rn is the co lle c tio n o f firew o od for c o o k in g w h ich
ca u ses not ju s t the deterioration o f m an g ro ve and u p la n d
forests b ut a lso e ro sio n a n d seaw ater seepage.
T h e in d u s t r ia l f o r e s tr y se cto r, m a in ly th ro u g h
c e llu lo s e a n d p a p e r p la n t s , is th e s o u r c e o f l iq u id
e fflu e n ts a n d g a se o u s e m is s io n s . T h e s e are d u m p e d in
h ig h c o n c e n tra tio n s in the B io -B io R iv e r o r d ire c tly
in to the A r a u c o G u l f fro m the se ve n p la n ts o p eratin g
in the re g io n . T h e p r in c ip a l co n ta m in a n ts are lig n in ,
c h lo r in e , m e r c u r y a n d d iffe re n t k in d s o f sa lts d e riv e d
fro m the w h ite n in g o f c e llu lo s e ( C O R E M A 1 9 9 2 ) . T h e
m o st n o x io u s is m e r c u r y w h ic h c a u se s h a rm fu l effects
on the n e r v o u s sy s te m a n d e v e n death w h e n abso rb ed
in h ig h d o sa g e .
46
A n o t h e r e n v ir o n m e n ta l irr ita n t a s s o c ia te d w ith
fo re sta l e x p lo ita tio n a n d the s a w m illin g in d u stry is the
d isch a rg e o f saw d ust o r c h ip s in to w a terw a ys or d ire ctly
to the sea r e su lt in g in the su ffo ca tio n o f m a rin e f lo ra
a n d fa u n a . T h is is p re v a le n t in D ic h a t o a n d in the P o rts
o f S a n V ic e n te a n d L ir q u e n w h ere s a w m ills a b o u n d .
E r o s io n is a n o t h e r s e r io u s p r o b le m d u e to b a d
m a n a g e m e n t a n d in a p p ro p ria te u se o f the s o il.
Model Formulation and Implementation
T h e v a rie d an d c o n flic t in g uses o f co a sta l reso u rces
a n d r e s u lt in g e n v ir o n m e n t a l e x t e r n a lit ie s se t the
fra m e w o rk fo r the d e v e lo p m e n t o f the lin e a r m o d e l.
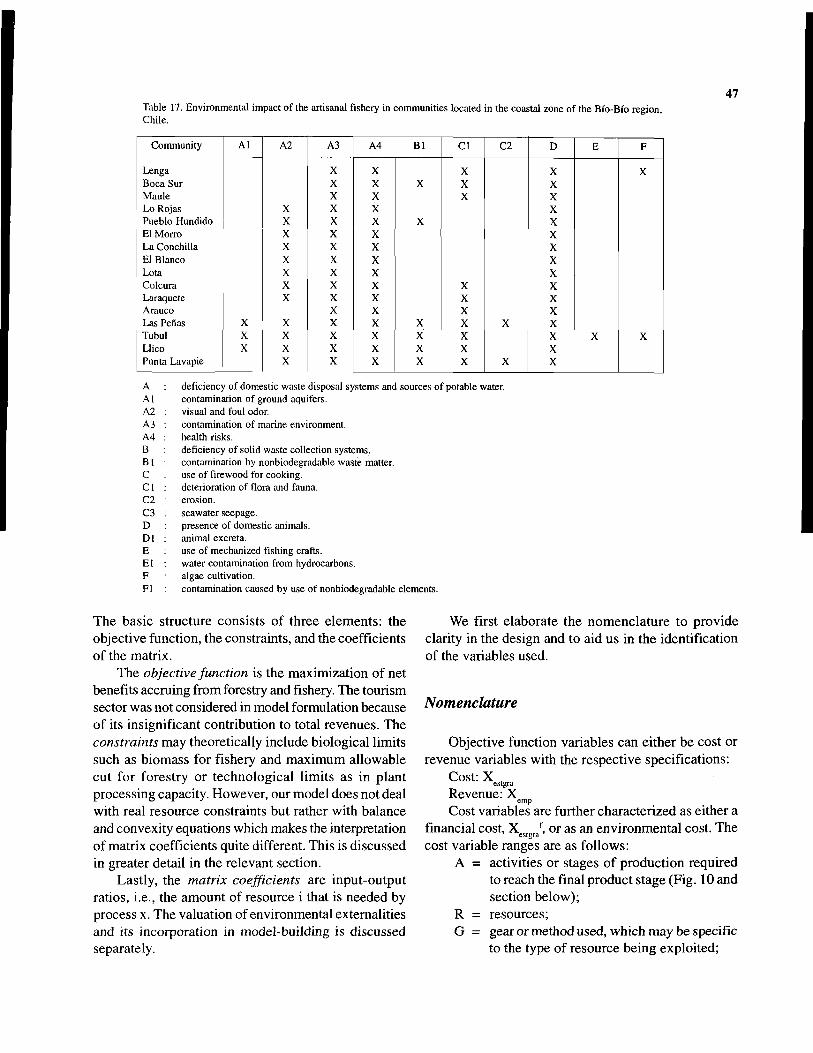
Table 17. Environmental impact o f the artisanal fishery in communities located in the coastal zone o f the Bio-Bio region, Chile. ’
47
Community A1 A2 A3 A4 B1 C l C2 D E F
Lenga X X X X XBoca Sur X X X X XMaule X X X XLo Rojas X X X XPueblo Hundido X X X X XEl Morro X X X XLa Conchilla X X X XEl Blanco X X X XLota X X X XColcura X X X X XLaraquete X X X X XArauco X X X XLas Penas X X X X X X X XTubul X X X X X X X X XLlico X X X X X X XPunta Lavapie X X X X X X X
deficiency of domestic waste disposal systems and sources o f potable water.contamination of ground aquifers.visual and foul odor.contamination o f marine environment.health risks.deficiency of solid waste collection systems, contamination by nonbiodegradable waste matter, use o f firewood for cooking, deterioration of flora and fauna, erosion.seawater seepage, presence of domestic animals, animal excreta.use o f mechanized fishing crafts, water contamination from hydrocarbons, algae cultivation.contamination caused by use o f nonbiodegradable elements.
A A 1 A2 A3 A4 B B 1 C C l C2 C3 D Dl E E l F FI
T h e b a s ic stru c tu re c o n s is ts o f th ree e le m e n ts : the
o b je c t iv e fu n c tio n , the co n stra in ts, a n d the c o e ffic ie n ts
o f the m a trix .
T h e objective function is the m a x im iz a t io n o f net
b en efits a c c ru in g fro m forestry an d fishery. T h e to u rism
secto r w a s not co n sid e re d in m o d e l fo rm u latio n b ecau se
o f its in s ig n if ic a n t co n trib u tio n to total re v e n u e s. T h e
constraints m a y th e o re tic a lly in c lu d e b io lo g ic a l lim its
su ch as b io m a s s fo r f is h e ry an d m a x im u m a llo w a b le
c u t fo r fo re stry o r t e c h n o lo g ic a l l im it s a s in p la n t
p ro c e ss in g ca p a c ity . H o w e v e r, o u r m o d e l d o es not d e a l
w ith re a l re so u rce co n stra in ts b u t rather w ith b a la n ce
and c o n v e x ity eq u atio n s w h ich m a k e s the interpretation
o f m a trix c o e ffic ie n ts q u ite d ifferen t. T h is is d is c u s s e d
in greater d e ta il in the re le v a n t sectio n .
L a s t ly , the matrix coefficients a re in p u t-o u tp u t
ra tio s, i.e ., the a m o u n t o f re so u rce i that is need ed b y
p ro ce ss x. T h e v a lu a tio n o f e n v iro n m e n ta l ex te rn a litie s
a n d its in co rp o ra tio n in m o d e l-b u ild in g is d is c u s s e d
sep arately.
W e first e la b o ra te the n o m e n c la t u r e to p ro v id e
c la r ity in the d e s ig n an d to a id u s in the id e n tif ic a tio n
o f the v a r ia b le s used .
Nomenclature
O b je c t iv e fu n c tio n v a r ia b le s c a n e ith e r b e co st o r
re v e n u e v a r ia b le s w ith the r e sp e c tiv e s p e c if ic a t io n s :
C o s t : X estgraR e v e n u e :X empC o s t v a r ia b le s are fu rth er c h a ra c te r iz e d as e ith e r a
f in a n c ia l co st, X , f, o r a s an e n v iro n m e n ta l co st. T h e’ estgra ’co st v a r ia b le ran g es are as fo llo w s :
A = a c t iv it ie s o r stages o f p ro d u c tio n re q u ire d
to re ach the f in a l p ro d u c t stag e ( F ig . 1 0 an d
se ctio n b e lo w );
R = re so u rce s;
G g ear o r m ethod use d , w h ic h m a y be s p e c if ic
to the typ e o f re so u rce b e in g e x p lo ite d ;

48THE OBJECTIVE FUNCTION
T h e o b je c tiv e fu n c tio n c o n sists o f e le m e n ts that
e ith er a d d (re v e n u e ) o r d im in is h (co st) the b e n e fits
d e riv e d fro m v a r io u s e c o n o m ic secto rs o f the co a sta l
z o n e . E n v ir o n m e n t a l e x t e r n a l i t i e s a r e a ls o
co n sid e re d as co st ite m s in the o b je c t iv e fu n c tio n .
T h e g e n e ra l fo rm o f the o b je c t iv e fu n c tio n is :
N B = (R fC .) ...1)
Fishery Forestry
Fig. 10. Activity stages for fishery and forestry. Note that capture fishery is equivalent to harvesting in the forestry sector; otherwise all other activities are the same.
T = te ch n o lo g y , here d e fin e d as b e in g c a p ita l
in te n s iv e o r la b o r in te n siv e ;
S = s c a le o f o p e ra tio n , h ere d e fin e d as la rg e
s c a le o r s m a ll sc a le ; and
E = e c o n o m ic secto rs, here d e fin e d as f is h e ry
a n d forestry.
T h e re v e n u e v a r ia b le ranges are:
P = f in a l p ro d u ct;
M = m a r k e t s , in c lu d in g 1 ) d o m e s t ic , m a jo r
m a rk e ts ; 2 ) d o m e s tic , m in o r m a rk e ts ; 3 )
in te rn a tio n a l m a rk e ts; an d
E = e c o n o m ic secto rs as p r e v io u s ly d e fin e d .
Elaboration o f Variables
T h e a c t iv it ie s in the f is h e ry a n d fo re stry se cto r
re se m b le th o se o f a m a n u fa c tu r in g c o n c e rn , i.e ., in it ia l
stage is a ctu a l p ro d u ctio n w h ile fin a l stage is m ark etin g .
In fis h e rie s , the in it ia l stage is cap tu re o r h a rv e stin g .
T h is is lik e w is e the c a s e fo r fo restry b u t o n ly fo r the
n a tiv e sp e c ie s w h ic h are not p lan te d . In the ca se o f
p la n ta tio n sp e c ie s c o n sid e re d here, i.e ., the p in e Pinus radiata a n d e u c a ly p tu s , the in it ia l stages b e g in w ith
p lan tin g an d s ilv ic u ltu re . H en ce fo rth , the reso u rces take
on a s im i la r p a th . A n e la b o r a t io n o f th e se sta g e s
a c c o r d in g to s c a le o f o p eratio n , g e a r o r m e th o d use d ,
re so u rce s , a n d f in a l p ro d u cts is p resen ted in T a b le s
1 8 , 1 9 an d 2 0 . :
w here
R . = total re v e n u e a sso cia te d w ith e c o n o m ic 1a c t iv it ie s r a n g in g fro m i to E ; an d
C . = c o s t s a s s o c ia t e d w it h e c o n o m ic 1a c t iv it ie s p r e v io u s ly d e fin e d .
T h e co m p u ta tio n a l fo rm is g iv e n as:
E S T G R A
C ! = £ Z X £ L Z [ ( C c s i g r a f * Q c s t i r a ' 1
' ...2)- f c x * o x 1v c s i g r a ^ c s l g r a '
w here
C , f = a s s o c ia t e d f in a n c ia l c o s t p e r a c t i -estgra r
v it y ;
Q estgra = q u a n t it y o f the p r o d u c t /g o o d fo r ag iv e n a c t iv ity le v e l;
C x = v a l u e p la c e d o n e n v ir o n m e n t a lestgra r
e x te rn a litie s ; an d
Q estgrax = q u a n t it y a s s ig n e d to a p a r t ic u l a r
e n v iro n m e n ta l e x te rn a lity .
P M Er , =yyy '*o 1 —3)JN-l ^emp
where
P ' = p ric e o f p ro d u ct P at m a rk e t M u t il iz in g
re so u rce E ; and
Qemp' = q u a n tity o f p ro d u ct P p ro d u ce d , d estin ed
fo r m a rk e t M , u t il iz in g re so u rce E .
T h e c o m p u ta t io n a l fo r m sh o w s th a t w h ile a ll
le v e ls o f co sts are c o n sid e re d p er a c tiv ity , o n ly the f in a l
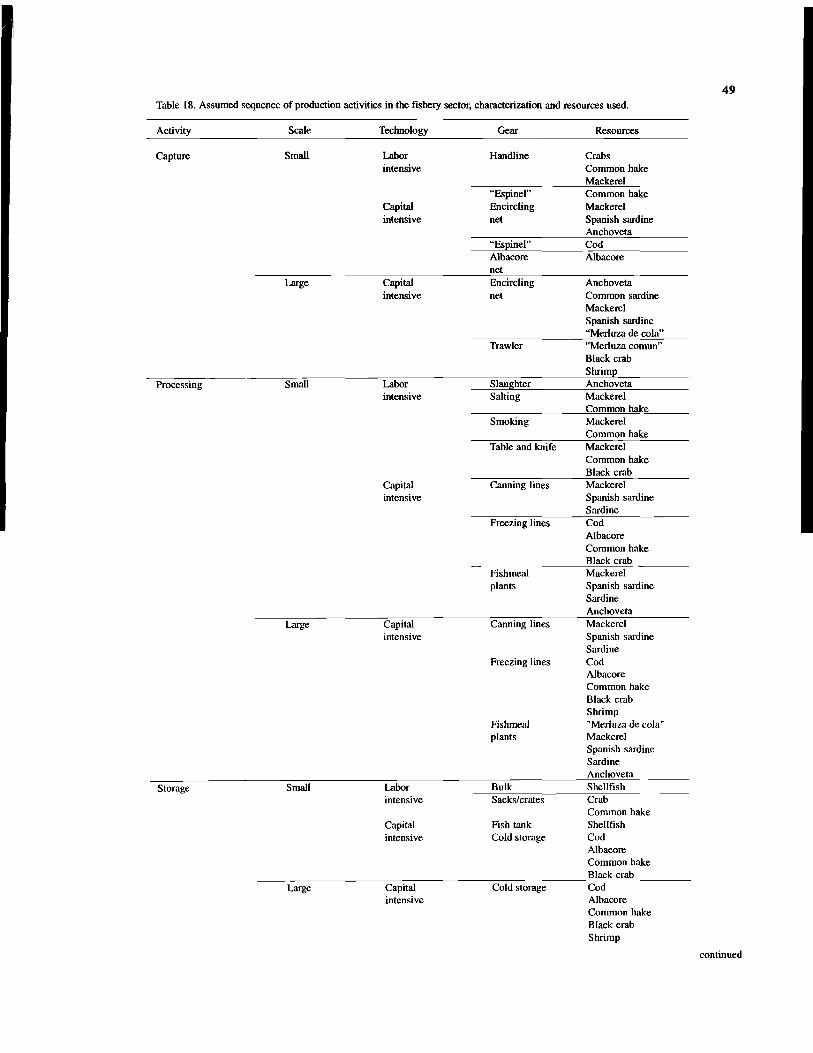
Table 18. Assumed sequence o f production activities in the fishery sector, characterization and resources used.49
Activity Scale Technology Gear Resources
Capture Small Laborintensive
Handline
“Espinel”
CrabsCommon hake Mackerel Common hake
Capital Encircling Mackerelintensive net
“Espinel”Albacorenet
Spanish sardineAnchovetaCodAlbacore
Large Capital Encircling Anchovetaintensive net
Trawler
Common sardine Mackerel Spanish sardine “Merluza de cola” “Merluza común” Black crab Shrimp
Processing Small Labor Slaughter Anchovetaintensive Salting
Smoking
Table and knife
Mackerel Common hake Mackerel Common hake Mackerel Common hake Black crab
Capital Canning lines Mackerelintensive
Freezing lines
Fishmealplants
Spanish sardineSardineCodAlbacore Common hake Black crab Mackerel Spanish sardine Sardine Anchoveta
Large Capitalintensive
Canning lines
Freezing lines
Fishmealplants
Mackerel Spanish sardine Sardine CodAlbacore Common hake Black crab Shrimp"Merluza de cola" Mackerel Spanish sardine Sardine Anchoveta
Storage Small Labor Bulk Shellfishintensive Sacks/crates Crab
Common hakeCapital Fish tank Shellfishintensive Cold storage Cod
Albacore Common hake Black crab
Large Capitalintensive
Cold storage CodAlbacore Common hake Black crab Shrimp
continued

50Tablel8. continued
Activity Scale Technology Gear Resources
Warehouse MackerelSardineSpanish sardine
Container “Merluza de cola”Warehouse Mackerel
Sardine_______________________________ Spanish sardine
Anchoveta Fishmeal “Merluza de cola”Sacks/warehouse Mackerel
SardineSpanish sardine
_______________________________ Anchoveta_______________________________________________________________________________ Bottles________________ Fish oil__________Transport Small Labor Human hauling Black crab
intensive Mackerel_______________________________ Common hake
Animals Black crab Mackerel Common hake
Capital Truck/van Mackerelintensive Anchoveta
SardineBarges Black crab
Mackerel Common hake Albacore
Capital Refrigerated Black crabintensive trucks Mackerel
Common hake Albacore
TrucksShrimpMackerelShellfishAnchovetaSardine
Tankers Bulk oilShip Fishmeal sacks
Bulk meal CansFrozen items

51Table 19. Assumed sequence o f production activities in the forestry sector, characterization, resources used and final products.
Activity ScaleTechnology
level GearFinal products
(Resource used)Planting Small Labor Seeding by
intensive handCapital Ploughintensive Animal cart
Large Capital Tractorintensive
Silviculture Small Labor Ax/hatchetintensive HacksawCapital n.a.intensive
Large Capital Mechanical sawintensive
Harvesting Small Labor Lum berjacksintensive Animal cartsCapital Lum berjacksintensive Tractors
Mechanical sawLarge Capital Lumber jacks/mechanical
intensive sawsTractors
Processing Small Labor Oven Charcoal/(PR, EG)intensive Hatchet Firewood/(PR, EG)Capital n.a. n.a.intensive
Large Labor Makeshift sawmills Lumber/(PR, EG, EN)intensive Wood products/(PR, EG, EN)Capital Chipmakers Chips/(PR, EG)intensive Pulp and paper industry Chemical pulp/(PR, EG)
Mechanical pulp/(PR, EG)Paper and carton/(PR, EG)
Woodboard industry Particleboard/(PR)Fiberboard/(PR)Plywood/(PR, EG, EN)Panel/veneer/(EN)
Mechanized sawmills Lumber/(PR, EG, EN)Wood oroducts/(PR. EG. EN)
Storage Small Labor Sacks Charcoalintensive Bulk storageCapital Warehouse Lumberintensive Timberyard Wood products
Large Capital Shed, storehouse Paper and cartonintensive Particleboards
FiberboardPlywood
Stacking yard ChipsTanks Chemical pulp
Mechanical pulpTransport Small Labor Animal and human Charcoal and firewood
intensive HaulageCapital Light trucks Lumber and wood productsintensive
Large Capital Tanks Chemical pulpintensive Mechanical pulp
Trucks LumberWood productsChips
Train Logs for exportLumberWood products
PR : Pinus radiata. Ships ChipsEG : Eucalyptus globulus. Chemical pulpEN : Endemic species. Mechanical pulp
Lumber Wood products Logs_________

5 2
Table 20. Upper limits o f catch levels (MO3), based on Schaefer yield functions segmented into 6 groups, Y. (i = 1,2....6).
Species Y, Y, Y, y 4 y 5 Y*
Eels 1.3 1.9 2.4 .2.7 2.9 3.0H ake 12.0 22.0 30.0 34.0 36.0 37.0Jack mackerel 550.0 1,000.0 1,430.0 1,720.0 1,850.0 1,900.0Molluscs 2.0 2.5 3.2 3.6 3.9 4.0Spanish sardine 20.0 25.0 32.0 36.0 39.0 40.0Anchovy 50.0 75.0 95.0 108.0 115.0 117.0Patagonian toothfish 22.0 0.35 0.45 0.53 0.58 0.60Swordfish 0.8 1.30 1.90 2.4 2.7 2.9Patagonian grenadier 72.0 84.0 94.0 100.0 104.0 106.0Shrimp 0.04 0.065 0.095 0.12 0.13 0.135Algae 5.5 9.50 13.0 15.0 16.0 16.5Common sardine 130.0 180.0 220.0 250.0 270.0 280.0
p r o d u c t s t a g e , i .e . , th a t w h ic h r e a c h e s f in a l a n d
in te rm e d ia te c o n su m e r, is in co rp o ra te d a s re v e n u e .
COEFFICIENTS O F THE OBJECTIVE FUNCTION
T h e c o e ffic ie n ts o f the o b je c tiv e fu n c tio n are p rice s
o f in p u ts a n d o u tp u ts. T a b le 2 1 sh o w s the y ie ld le v e ls
a sso cia te d w ith e a ch o f the s ix segm ents o f the S ch a e fe r
c u r v e ; h a rv e s tin g co sts are p resen ted in T a b le 2 2 . T h e
in c r e a s in g c o st fu n c tio n c a n b e e x p la in e d b y F ig . 1 1
w h ic h d e p ic ts lin e a r ly d e c re a s in g y ie ld p e r effort as
effo rt in c re a s e s . C o s t p e r u n it o f effort w a s a ssu m e d
co n sta n t a n d th u s b e c o m e s an in c r e a s in g fu n c tio n o f
o u tp u t (A g u e r o 1 9 8 7 ) .
T a b le 2 3 sh o w s the p ro c e s s in g co sts p e r p ro d u ct
lin e a n d the sp e cie s that un d erg o su ch p ro ce ssin g . C o s ts
w ere a s su m e d to b e co n sta n t o v e r a ran g e o f d iffe re n t
sp e c ie s . P r o c e s s in g o f fresh a n d d r ie d f is h p ro d u cts
in c u r the le a st c o st w h ile c a n n in g in c u r s the greatest
co st. A m o n g the s p e c ie s , ja c k m a c k e re l a n d the sa rd in e
sp e cie s are su b je cte d to m o st typ es o f p ro c e s s in g ; a lg a e
is o n ly p r o c e s s e d in to its d r ie d fo r m a n d b a c a la o ,
a lb a c o re , an d e e ls as fre sh a n d fro ze n .
S t o r a g e , t r a n s p o r t a n d m a r k e t in g c o s t s a re
p resen ted in T a b le 2 4 . T ra n sp o rt o f fresh a n d fro ze n
f is h is m o re e x p e n s iv e d u e to its h ig h p e r is h a b ility .
S to ra g e co sts fo r fresh a n d fro ze n a n d w e ll a s d rie d
f is h are r e la t iv e ly ch e a p e r d u e to the s im p le r te ch n o lo g y
re q u ire d , i.e ., cra tes a n d ic e ch e sts.
A v e r a g e w e ig h te d p r ic e o f p ro ce sse d f is h p ro d u cts
a n d m a rk e t d e stin a tio n v a r ie s a c c o rd in g to sp e cie s u se d
( T a b le 2 5 ) . T h e p r ic e o f f is h m e a l a n d o i l is n o t
d e p en d en t o n th e f is h sp e c ie s ; co n tra r ily , fro ze n f is h is
h ig h ly s e n s it iv e w ith s h r im p s, b a c a la o a n d a lb a co re
c o m m a n d in g the
h ig h e s t p r ic e s .
H a k e a n d j a c k
m a c k e re l, w h ic h
a re m o r e a b u n
d a n t , c o m m a n d
lo w e r p ric e s .
A v e r a g e co st
o f p la n t in g p in e
v a r ie s p r o p o r
tionally w it h
s to c k in g d e n s ity
( T a b le 2 6 ) . T h e
ran g e s g iv e n fo r
s i lv ic u lt u r e a n d
h a r v e s t in g c o r r e s p o n d to d if f e r e n t p r u n in g a n d
h a rv e stin g rates. P ro c e s s in g , storage a n d transp ort co sts
fo r p in e as w e ll a s d o m e s tic a n d m a rk e t p r ic e s are
sh o w n in T a b le 2 7 . N o te the h ig h m a rg in s betw een
exp o rt an d d o m e stic p ric e fo r a ll b u t on e p ro d u ct, w o o d
c h ip s .
N o p la n t a t io n a c t i v i t i e s w e r e a s s u m e d f o r
e u c a ly p tu s . H o w e v e r , p r u n in g a n d h a r v e s t in g co sts
w ere a ls o sh o w n to v a r y w ith le v e l o f e x p lo ita tio n , i.e .,
U S $ 3 3 . 3 3 - 1 5 6 h a '. O th e r co sts as w e ll a s p r ic e s are
p ro v id e d in T a b le 2 8 . L o g s , p u lp an d w o o d c h ip s are
m a rk e te d e n tire ly in fo re ig n m a rk e ts w h ile p ly w o o d ,
v e n e e r a n d f ir e w o o d a re s o ld e n t ir e ly in th e lo c a l
m a rk ets.
THE CONSTRAINTS
T h e typ e o f co n stra in ts u s e d in th is e x e r c is e in
a d d it io n to the n o n n e g a tiv ity co n stra in ts are:
1 ) C o n v e x it y
- X ( b i + 1 * l ) + b 1 = 0 ...4)
w here
b ‘
n
re so u rce b io m a s s in se ctio n i ; a n d
n u m b e r o f sectio n s c o n sid e re d (s ix , in th is
a p p lic a t io n ).
2 ) B a la n c e
pr * b‘ - Qrp = 0 ...5)

5 3Table 21. Assumed harvesting costs (in US$ t ‘) for various fish species and yield levels.
ResourcesHarvesting costs
Y, Y, y 3 y 4 Y, y 6
Eels 413 603 762 857 921 953Hake 150 275 374 424 449 462Jack mackerel 4,014 7,299 10,437 12,554 13,503 13,868Molluscs 334 418 534 601 651 668Spanish sardine 148 185 237 267 289 297Anchovy 604 906 1,148 1,305 1,390 1,414Patagonian toothfish 231 375 549 396 780 837Swordfish 61 98 126 148 162 168Patagonian grenadier 536 626 700 745 775 790Shrimp 55 90 132 166 180 187Algae 1,086 1,754 2,338 2,672 2,839 2,923Common sardine 1,593 2,206 2,697 3,064 3,310 3,432
Note: Harvesting costs correspond to each yield segment (Table 20).
Table 22. Assumed processing costs (in US$ t '1) by product.
Product Processingcost Eels Hake
Jackmackerel Mollusc
Spanishsardine
Commonsardine Anchovy Toothfish Swordfish Grenadier Shrimp Algae
Fresh 55.55 X X X X XFrozen 416.62 X X X X X X X X X XMeal A 97.61 X X X X XMeal B 97.61 X X X X XDried 40 XCanned 686.92 X X X X X
Table 23. Assumed storage, transport and marketing costs (in U S $ 4 1) per type o f processed fish product.
Costs
Product Storage Transport Marketing
Fresh 1.5 43 20Frozen 1.5 43 22Fishmeal A 12.0 30 26Fishmeal B 12.0 30 20Dried 1.5 30 10Canned 6.0 30 25
Fig. 11. Fundamental relationships between biological characteristics of fish resources and technology of capture and various cost factors. A) Relationships between yield and the underlying fish biomass (note that B, > B2 > B3). B) Relationships between yield, effort and the quotients cost per unit of yield and yield per unit of effort. C) Relationships between yield per effort, effort and cost per unit of yield.
Yield (Y)
C DY /f
E ffo rt Cost per unit of yield

5 4
Table 24. Average weighted price (export and domestic) (in U S S t1) o f processed fish products.
SpeciesFresh Frozen Meal A
Price
Meal B Oil A Oil B Dried Canned
Eel 5,500 2,143Hake 1,779Jack mackerel 1,435 400 450 867Mollusc 5,000 4,500 8,000Spanish sardine 5,000 682 400 450 138 150Anchovy 400 450 138 150 1,000Toothfish 5,000 6,150Swordfish 7,567 6,939Grenadier 400 450 138 150Shrimp 8,596Algae 532Common sardine 591 400 450 138 150 1,000Market distributionDomesticExport
0100%
595
4555
6238
Table 25. Plantation, culture and harvesting cost (in U S S h a 1) o f pine at various stocking densities.
Pine
Stocking density 1 769 s h a '1
Stocking density 2
1,845 s ha '1
Stocking density 3
2,190 s ha-1
Stocking density 4
3,280 s ha '1
Plantation 440 460 462 480Silviculture 6.7-21.8 6.2-21.9 6.2-17.5 5.5-17.5Harvest 36.6-115.8 34.4-109 31.3-99.5 31.2-97.8
Table 26. Processing, transport and storage costs (in US$-m3) for wood products derived from pine and corresponding market prices.
Product type Processing Transport (pine) StoragePrice
International Domestic
Logs 6.0 1.1 3.0 40 25Lumber 5.7 1.2 2.5 51 28Wood products 5.5 2.0 2.5 125 63Chips 3.1 1.7 2.0 166 183

Table 27. Processing, transport and storage costs (in US$ m 3) for wood products derived from eucalyptus and corresponding market prices.
5 5
Product type Processing Transport (pine) StoragePrice
International Domestic
Logs 5.1 3 1.1 48 n.a.Pulp 4.5 2.7 1.7 418 n.a.Chips 3.1 2.5 1.5 60 n.a.Plywood 4 3.2 1.2 n.a. 265Veneer 5.5 2.5 2 n.a. 296Firewood 1 1.5 0 n.a. 0
Table 28. Estimates o f net benefit per sector from LP exercise.
Economic sectorNet benefit
(US$.103-year')
Fishery 171,358Mackerel 120,177Common hake 21,551Others 29,630
Forestry 1,186,410Pine 105,552Eucalyptus 1,080,858
Total 1,357,768
Environment (20,000)
Total 1,137,768
T h e e q u a tio n in d ic a te s the c o n v e rs io n rate (p r)
re p re se n ta tiv e o f a p a r tic u la r p ro d u ctio n p ro ce ss, sa y
fro ze n f is h o r f is h m e a l in the ca se o f f ish p ro ce ssin g ,
at w h ic h th e b io m a s s is c o n v e rte d in to a f in is h e d
p ro d u ct (Q rp ).
3 ) B a la n c e
R r p * Q r p - Q r a = 0 ...6)
or
4 ) C o n v e x it y o f d e m a n d
( 1 / Q r a ‘) * Q r a < = 1
c o e f ( Q r a 1) * Q r a < = 1
. . .7 )
...8)
5 ) L a n d a v a ila b ilit y
A _ + A < = T o ta l A r e a ...9 )
T h e output o f a c t iv ity A b e co m e s the in p u t fo r
the n e x t a c t iv ity A , i.e ., n o w astag e is in v o lv e d .
T h is e q u a tio n in d ic a te s that e a ch a c t iv ity ca n be
taken as a seg m en t o f the total d e m a n d c u rv e , th u s, the
re strictio n < = 1 .
T h e o n ly re al re so u rce co n stra in t u s e d in the m o d e l
is the a v a ila b ilit y o f la n d fo r fo rest p la n ta tio n . T h e area
p la n te d to p in e a n d e u c a ly p tu s m u st be le ss than or
e q u a l to total p la n ta tio n area.
THE MATRIX COEFFICIENTS
C o e ff ic ie n ts p erta in to the y ie ld p er se g m e n t, as in
forestry, or c a tc h a b ility , as in the fish e ry . In m o st ca se s,
c o e ffic ie n ts are e x o g e n o u s ly d e te rm in e d p ercen ta g es
s u c h as the d is a g g re g a tio n o f h a rv e s ts b y s c a le o f
o p e r a t io n , ty p e o f g e a r, p r o d u c t ty p e a n d m a rk e t
d e s t in a t io n . In l ik e m a n n e r, c o e f f ic ie n t s re p re se n t
d isa g g re g a tio n o f f in is h e d w o o d an d f is h p ro d u cts into
its d iffe re n t fo rm s.
T h e m atrix co efficien ts, constants o f the o b jective
fun ctio n and co nstraint elem ents are incorporated into a
fin a l L P tableau that is a 7 8 2 x 5 3 0 m atrix (A p p e n d ix 1 ).
Environmental Externalities
A m o n g th e n u m e r o u s e n v ir o n m e n t a l e f f e c t s
re s u lt in g fro m a c t iv it ie s in the f is h e r y a n d fo re stry
secto r, o n ly w ater c o n ta m in a tio n as a c o n se q u e n c e o f
the f is h p ro c e ss in g a c t iv it ie s w a s q u a n tif ie d here. A n
in d e x o f w ater p o llu tio n is the d ecrease o f o x y g e n le v e ls
as m e a su re d b y d is s o lv e d o x y g e n ( D O ) le v e ls . O x y g e n
is re m o v e d fro m the w ater as the o rg a n ic m atter in it
d e c a y s . A c c o r d in g to I F O P ( 1 9 8 8 ) , liq u id e fflu e n ts o f
f is h m e a l p la n ts re a ch B D 0 7 le v e ls e q u a l to 0 .5 7 k g t 1
o f f is h p ro ce sse d . In o rd er to m a in ta in an a cce p ta b le
sta n d ard ( B D 0 7 1 0 m g I 1, as in S p a in ) , it is n e ce ssa ry
to d ilu te the a ffected a rea b y 5 7 ,0 0 0 1 fo r e v e ry tonne
o f f is h p ro ce sse d .

To implement this, a constant in the objective function was added, i.e., imputing the cost o f freshwater, here assumed to be US$ 1 -t1. The constraint row merely summed up total fish processed and is similar in form to the balance equations enumerated above.
Results and Discussion
Results
The solution to the linear programming problem is the estimate o f total net benefit generated by fishery and forestry. In the process, the solution identifies the optimum values of the variables which vary from one sector to another. In the fishery, the variable is the amount of fish “handled” at each activity level while in the forestry sector, the quantity of wood and/or wood products. The algorithm used in linear programming essentially estimates dual values as well as right-hand side and objective function coefficient ranges, but due to the absence o f real resource constraints the dual values as well as the right-hand side ranges are not analyzed.
Total net benefit amounts to US$1.36 billion-year1, 87% of which is accounted for by forestry; the fishery contributes US$171 million (Table 29). The Chilean jack mackerel, which is sold at international and national markets as frozen, fishmeal and oil, contributed 70% of sectoral revenue while hake, marketed only as frozen, ranked second (Table 30). The optimum annual harvesting levels for jack mackerel and hake are 1.9 million t and 37,000 t, respectively. These levels are contingent on several factors including final market demand, transport, processing and storage capacity, as well as current levels of effort in the industrial capture fishery.
The large-scale sector contributes a major portion of catch for hake, jack mackerel, Spanish sardine, anchoveta and Patagonian grenadier whereas the small- scale sector dominates the capture of eels, molluscs, bacalao, albacore and algae.
In the forestry sector, the optimum areas planted to pine and eucalyptus are 50,000 and 30,000 ha, respectively. All areas planted to pine are based on a stocking density of 3,280 seedlings h a 1. No planting is involved in the case of eucalyptus.
Total quantity of timber is based on the amount harvested and/or thinned, as part o f silvicultural
5 6
practices. Logs constitute a major use o f pines and the optimum level of export was estimated at 1,384 m3 (Table 31). In addition to wood products and wood chips, eucalyptus is also used for veneer and firewood. Wood chips constitute the major export and is valued at an average price of US$60-t ‘. N o pulpwood is extracted from both species.
The optimum net benefits are diminished by a total of U S$20 million considering the environmental externalities attributed to pollutants from fishmeal plants. This represents the cost o f pum ping in freshwater to improve the DO levels. The estimate of optimum net benefits should be lower due to a larger number of externalities which could not be quantified.
While real resource constraints were missing and that many variables were exogenously determined, the emphasis of this application is the linkage between different activities within each sector to arrive at an optimum quantity. Thus, the optim um quantity harvested is not based on biomass constraints or effort constraints alone but also by demand conditions for the final product.
The relevance o f coastal zone management and the “systems approach” espoused in Agiiero et al. (this vol.) is highlighted by the interconnectedness o f econom ic activities in the fishery and forestry^ A succinct example is the determination o f optimal catch levels in the capture fishery which was shown to be an indirect function of final market demand and constrained by prevailing capacities in the transport, storage and processing sectors. Without such framework, optimal catch levels would be based, for example, on either M SY or MEY, which are purely biological parameters. Even the latter, which at best considers appropriate measures of opportunity costs o f the factors o f production, thereby incorporating macroeconomic factors, is relatively m yopic and still quite lim ited to the capture fishery sector.
This framework has the potential of estimating the impact of factors outside the capture fishery sector on itself, e.g., changes in storage fees or in increased demand for substitute products. Unfortunately, this particular application, though not of linear programming in general, did not deal with real resource constraints. A useful sensitivity analysis would have emerged if hypothetical cases of increased or decreased resource endowments could be measured against potential economic benefits and on the values of the variables.
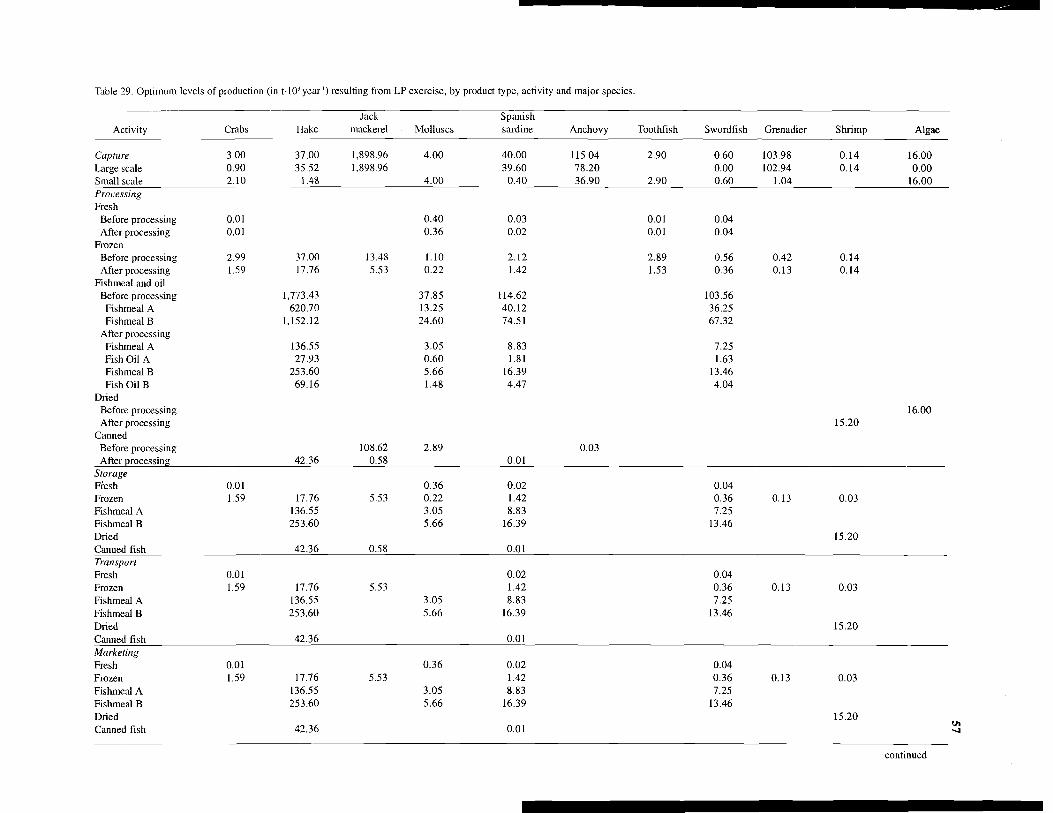
Table 29. Optimum levels of production (in t-103y ear') resulting from LP exercise, by product type, activity and major species.
Activity Crabs HakeJack
mackerel MolluscsSpanishsardine Anchovy Toothfish Swordfish Grenadier Shrimp Algae
Capture 3.00 37.00 1,898.96 4.00 40.00 115.04 2.90 0.60 103.98 0.14 16.00Large scale 0.90 35.52 1,898.96 39.60 78.20 0.00 102.94 0.14 0.00Small scale 2.10 1.48 4.00 0.40 36.90 2.90 0.60 1.04 16.00ProcessingFresh
Before processing 0.01 0.40 0.03 0.01 0.04After processing 0.01 0.36 0.02 0.01 0.04
FrozenBefore processing 2.99 37.00 13.48 1.10 2.12 2.89 0.56 0.42 0.14After processing 1.59 17.76 5.53 0.22 1.42 1.53 0.36 0.13 0.14
Fishmeal and oilBefore processing 1,773.43 37.85 114.62 103.56
Fishmeal A 620.70 13.25 40.12 36.25Fishmeal B 1,152.12 24.60 74.51 67.32
After processingFishmeal A 136.55 3.05 8.83 7.25Fish Oil A 27.93 0.60 1.81 1.63Fishmeal B 253.60 5.66 16.39 13.46Fish Oil B 69.16 1.48 4.47 4.04
DriedBefore processing 16.00After processing 15.20
CannedBefore processing 108.62 2.89 0.03After processing 42.36 0.58 0.01
StorageFresh 0.01 0.36 0.02 0.04Frozen 1.59 17.76 5.53 0.22 1.42 0.36 0.13 0.03Fishmeal A 136.55 3.05 8.83 7.25Fishmeal B 253.60 5.66 16.39 13.46Dried 15.20Canned fish 42.36 0.58 0.01TransportFresh 0.01 0.02 0.04Frozen 1.59 17.76 5.53 1.42 0.36 0.13 0.03Fishmeal A 136.55 3.05 8.83 7.25Fishmeal B 253.60 5.66 16.39 13.46Dried 15.20Canned fish 42.36 0.01MarketingFresh 0.01 0.36 0.02 0.04Frozen 1.59 17.76 5.53 1.42 0.36 0.13 0.03Fishmeal A 136.55 3.05 8.83 7.25Fishmeal B 253.60 5.66 16.39 13.46Dried 15.20Canned fish 42.36 0.01
continued

inoo
Table 29. continued
Activity Crabs HakeJack
mackerel MolluscsSpanishsardine Anchovy Toothfish Swordfish Grenadier Shrimp Algae
SalesFresh
International 0.01 0.36 0.02 0.01 0.04Domestic
Frozen 5.28International 1.51 16.87 5.22 0.21 1.35 1.46 0.34 0.13 0.03Domestic 0.08 0.89 0.06 0.01 0.07 0.08 0.02 0.01 0.00
Fishmeal A 136.55International 75.10 1.68 4.85 3.99Domestic 61.45 0.02 3.97 3.26
Fishmeal B 253.60International 96.37 1.35 6.23 5.12Domestic 157.23 2.15 10.16 8.35
Fish oil AInternational 27.93 0.60 1.81 1.63Domestic
Fish oil BInternational 69.16 1.48 4.47 4.04Domestic
DriedInternational 0.46Domestic 14.74
CannedInternational 0.43 0.01Domestic 0.14 0.00
Net benefit (U S$103) 1,600.8 21,550.81 120,176.84 5,065.87 2,286.37 5,207.66 7,459.51 2,299.04 4,658.38 21.39 1,030.73

59Table 30. Optimum estimates (in m’ 10’) o f LP exercise for forestry sector, by product type, activity and species.
Activity levels Pine Eucalyptus Activity levels Pine Eucalyptus
Plantation and Transportsilviculture Logs 2,308.13 n.a.
Quantity thinned 800.00 1,546.39 Lumber 907.98 n.a.Quantity o f timber extracted 800.00 17,647.06 Wood products 1,548.92 1,036.45
Harvesting Wood chips 1,218.72 10,433.56Quantity harvested 9,090.90 17,647.06 Veneer n.a. 1,036.45Quantity o f timber extracted 9,090.90 17,647.06 Firewood n.a. 191.93Total quantity of timber 9,890.90 19,193.45 Sales
Processing LogsRaw material inputs International 1,384.80
Logs 3,659.63 n.a. Domestic 923.20Lumber 1,681.45 n.a. LumberWood products 2,868.36 1,919.30 International 635.59Wood chips 1,681.45 14,395.00 Domestic 272.40Veneer n.a. 1,919.30 Wood productsFirewood n.a. 959.67 International 1,239.13 0.00
O utput Domestic 309.78 1,036.45Logs 2,308.13 n.a. Wood chipsLumber 907.98 n.a. International 1,218.71 10,433.56Wood products 1,548.92 1,036.45 Domestic 0.00Wood chips 1,218.72 10,433.56 VeneerVeneer n.a. 1,036.45 International 0Firewood n.a. 191.93 Domestic 1,036.45
Storage FirewoodLogs 2,308.13 n.a. International 0Lumber 907.98 n.a. Domestic 191.93Wood products 1,548.92 1,036.45Wood chips 1,218.72 10,433.56Veneer n.a. 1,036.45Firewood n.a. 191.93 Net revenue (US$) 105,552.47 1,080,858.35
References
A güero, M. 1987. A b ioeconom ic m odel o f the Peruvian pelagic fishery, p. 307-324. In D. Pauly and I. Tsukayam a (eds.) The Peruvian anchoveta and its upw elling ecosystem : three decades o f change. 1CLARM Stud. Rev. 15, 351 p.
CEPA L. 1990. U na e s tim ac ió n de la m agn itud de la p o b reza en
C h ile . E co nóm ica para A m érica L a tin a y e l C a rib e , S an tiag o , C h ile .
COREMA. 1992. Aspectos generales sobre recursos y contam inación en la V III R e g ió n . C o m is ió n R e g io n a l d e M e d io A m b ie n te , Concepción, Chile.
IFOP. 1988. A nálisis de la activ idad p esquera ex trac tiv a nacional. Caracterización Flota Pesquera Industrial. F lota Cerquera. IFOP, Santiago, Chile.

Annex 1. H ydrobiological resources o f Chile exploited at the national and regional (B io-B io) level (*).
Local name Scientific name Presence o f species in B io-B io, Chile
Fish1. Acha Kyhosus analogus2. Agujilla Scomberesox saurus3. Albacora Xiphias gladius *
4. Anchoveta Engraulis ringens *
5. Anguila Ophictus spp.6. Apañado Hemilutjanus macrophthalmos7. Atún aleta amarilla Thunnus albacares8. Atún aleta larga Thunnus alalunga9. Atún de ojo grande Thunnus obesus10. Ayanque Cynoscion analis11. Azulejo Prionace glauca12. Bacalao de profundidad Dissostichus eleginoides *
13. Bacalao o mero Polyprion spp.14. Blanquillo Prolatilus jugularis *
15. Bonito Sarda chiliensis16. Breca Acantholatris gayi17. Brótula Salilota australis18. Caballa Scomber japónicas *
19. Cabinza Isacia conceptionis *
20. Cabrilla Sebastes oculatus *
21. Cabrilla común Paralabrax humeralis *
22. Cachurreta Katsuwonus pelamis23. Caz.ón Galeorhinus ziopterus24. Chancharro Helicolenus lengerichi *
25. Cojinoba del norte Seriolella violácea *
26. Cojinoba moteada Seriolella porosa27. Cojinoba del Sur Seriolella caerulea *
28. Congrio colorado Genypterus chilensis *
29. Congrio dorado Genypterus blacodes *
30. Congrio negro Genypterus maculatus *
31. Corvina Cilus montti *
32. Dorado Coryphaena hippurus33. Jurel Trachurus murphyi *
34. Lenguado de ojos chicos Paralichthys microps *
35. Lenguado de ojos grandes Hippoglossina macrops *
36. Lisa Mugil spp. *
37. M achuelo Ethmidium maculatum ¡1«
38. M arrajo Isurus glaucus *
39. Merluza del sur Merluccius australis40. Merluza de cola Macruronus magellanicus *
41. Merluza de tres aletas Micromesistius australis42. Merluza común Merluccius gayi *
43. M ulata Graus nigra44. Nanue Girellops nebulosas45. Palometa Parona signata46. Pampanito Stromateus stellatus *
47. Pejegallo Callorhinchus callorhinchus *
48. Pejeperro Pimelometopon maculatus49. Pejerrata Coelorhynchus spp. *
50. Pejerrey de mar Odonteshes spp. *
51. Pejesapo Sicyases sanguineus52. Pejezorro Alopias vulpinus53. Peto Acanthocybium solandri54. Raya Raja spp. *
55. Reineta Lepidotus australis56. Róbalo Eleginops maclovinus57. Rollizo Mugiloides chilensis *
58. Roncacho Sciaena spp.59. Salmón del Pacifico Oncorhynchus spp.60. Salmón del Atlántico Salmo salar
"In d ic a te s p re s e n c e o f sp ec ies . c o n tin u e d .

Annex 1. continued
Local ñame Scientific name Presence of species in Bio-Bio, Chile
61. Sardina Sardinops sagax *
62. Sardina común Clupea bentincki X
63. Sargo Anisotremus scapularis64. Sierra Thyrsites atun X
65. Tollo Mustelus mentu X '
66. Tomoyo Labrisomus philipii67. Trucha arco iris Salmo gairdneri X
68. Trucha café Salmo trutta69. Trucha de arroyo Salvelinus fontinalis70. Vidriola Seriola mazatlana
Molluscs1. Almeja (taca) Venus antiqua X
2. Almeja Protothaca thaca X
3. Calamar Loligo gahi *4. Caracol lócate Thais chocolata5. Caracol trumulco Chorus giganteus =1=
6. Caracol tegula Tegula atra X
7. Chocha Calyptraea trochiformes8. Cholga Aulacomya ater X
9. Chorito M ytilus chilensis X
10. Choro zapato Choromytilus chorus X
11. Culengue Gari solida12. Jibia Dosidicus tunicata13. Lapas Fissurella spp. X
14. Loco Concholepas concholepas X
15. Macha Mesoderma donacium X
16. Navaja de mar Solen gaudichaudi X
17. Navaja de mar Ensis macha18. Navajuela Tagelus dombeii19. Ostión del norte Chlamys purpurata20. Ostión del sur Chlamys patagonica21. Ostra Ostrea chilensis22. Ostra del Pacifico Crassostrea gigas23. Piquihue Odontocymbiola magellanica24. Pulpo Octopus vulgaris
Crustaceans1. Camarón de roca Rhynchocinetes typus X
2. Camarón nailon Heterocarpus reedi X
3. Centolla Lithodes antarticus4. Centollón Paralomis granulosa .5. Gamba Haliporoides diomedeae X
6. Jaiba Cancer edwardsii7. Jaiba limón Cancer porteli X
8. Jaiba mora Homalaspis plana X
9. Jaiba peluda Cancer setosus X
10. Jaiba reina Cancer coronatus X
II. Krill Euphausia superba12. Langosta de Juan Fernández Jasus frontalis13. Langosta de Isla de Pascua Panulirus pascuensis14. Langostino amarillo Cervimunida johni15. Langostino colorado Pleuroncodes monodon X
16. Langostino de los canales Municla subrugosa17. Picoroco Megabalanus psittacus X
Algae1. Chasca Gelidium rex X
2. Chasca gruesa Gymnogongrus furcellatus3. Chascón Lessonia nigrescens X
continued.

Annex 1. continued
Local ñame Scientific ñame Presence o f species in B io-B io, Chile
4. Chicorea de mar Mastocarpus papillatus *
5. Cochayuyo Durvilaea antárctica %
6. Huiro Macrocystis pyrifera7. Lechuha de mar Ulva lactuca8. Liquen gomoso Chondrus canaliculatus *
9. Luche Phorphyra columbina10. Luga-luga Iridaea ciliata *
11. Pelillo Glacilaria spp. *
12. Anhfeltia Anhfeltia plicata
EchinodermsEriz.o Loxechinus albus
HemichordatePiure Pyura chilensis *
Annex 2. Principal native forest species o f Chile and Region V I I I (*).
Local ñame Scientific ñame Presence o f species in B io-B io , Chile
1. Araucaria Araucaria araucana *
2. Ciprés de Cordillera Austrocedrus chilensis *3. Alerce Fitz.roya cupressoídes4. Ciprés de Guaitecas Pilgerodendron uriferum5. Manió de Hojas Largas Podocarpus salignus *
6. Manió de Hojas Punzantes Podocarpus nubigemas7. Lleuque Podocarpus andinus *
8. Manió de Hojas Cortas Saxegothaea conspicua9. Espino Acacia caven10. Palma Chilena Jubaea chilensis11. Algarrobo Prosopis chilensis12. Tamarugo Prosopis tamarugo13. Pimiento Schinus molle14. Pelu Sophora microphylla *
15. Tineo Weinmannia trichosperma16. Avellano Gevuina avellana *
17. Trevo Dasyphyllum diacanthoides *
18. Naranjillo Villarez.ia mucronata *
19. Olivillo Aextoxicom punctatum *
20. Lingue Persea lingue *
21. Litre Lithraea caustica *
22. Canelo Drimys winteri *
23. Notro Embothrium coccineum *
24. Quillay Quillaja saponaria *
25. M aitén Maytenus boaria *
26. Sauce Chileno Salix chilensis
“"indicate presence o f species. continued.

Annex 2. continued
Local ñame Scientific ñame Presence o f species in B io-B io , Chile
27. Coigue de Chiloé Nothofagus nítida28. Coigue Nothofagus dombeyi *
29. Coigue de Magallanes Nothofagus betuloides30. Roble Nothofagus obliqua *
31. Ñirre Nothofagus antárctica *
32. Rauli Nothofagus alpina *
33. Ruil Nothofagus alessandri34. Bollan Kageneckia oblonga35. Molle Schinus latifolius *
36. Radal Lomatia hirsuta *
37. Lenga Nothofagus pumilio *
38. Hualo Nothofagus glauca39. Baldo Peumus boldus *
40. Peumo Cryptocarya alba *
41. Bellota del Sur Beilschmiedia berteorana *
42. Bellota del Norte Beilschmiedia miersii43. Qeule Gamortega keule44. Arrayán Luma apiculata *
45. Pitra Myrceugenia exsucca *
46. Luma Amomyrtus luma *
47. Meli Amomyrtus meli48. Patagua Crinodendron patagua *
49. Laurel Laurelia sempervirens *
50. Tepa Laurelia philippiana *
51. Tiaca Caldcluvia paniculata *
52. Ulmo Eucryphia cordifolia *

Options for Land Use Management in Lingayen Gulf, Philippines*
A n n a b e l l e C r u z - T r i n i d a d a n d Z o r a i d a A l o j a d o ,
In tern a tio n a l C en ter fo r L iving A qu a tic R esources M anagem ent, M C PO B ox 2631, 0718 M akati City, Philippines
A g n e s G r a c e G . C a r g a m e n t o , National Economic and Development Authority (NEDA) Region I, San Fernando, La Union, Philippines
CRUZ-TRINIDAD, A., Z. ALOJADO and A.G.C. CARGAMENTO. 1996. Options for land use management in Lingayen Gulf, Philippines, p. 64-77. In A, C ruz-Trin idad (ed.) Valuation o f tropical coastal resources: theory and application o f linear programming. ICLARM Stud. Rev. 25, 108 p.
Abstract
In view of the fast-changing pace of land use in the Lingayen Gulf area, Philippines, this study estim ates optimal land use combinations, particularly with respect to aquaculture. A direct cost and revenue approach would result in total net revenues o f P7.4 billion or US$0.29 billion and total conversion of remaining mangrove areas to milkfish ponds. However, the Total Economic Value (TEV) approach resulted in a net revenue of P35 billion with the following land use scenarios: i) no mangrove conversion; ii) conversion o f salinized ricelands to milkfish ponds; and iii) conversion of grasslands to shrimp ponds. The results emphasize the importance of valuation as this greatly influences the results o f linear programming solutions.
Introduction
Lingayen Gulf was the Philippine pilot site of the A SE A N -U SA ID Coastal Resources Management Project which was executed by the International Center for Living Aquatic Resources Management (ICLARM) from 1986 to 1992. The study produced several technical reports including the Lingayen Gulf Profile (McManus and Chua 1990) and the Lingayen Gulf Coastal Area Management Plan (NEDA Region I 1992). The area was subsequently studied using an approach based on Geographic Information Systems (GIS) with the major objective of a zonation scheme for both land use and water space utilization (Paw et al. 1994). This latter project was comprised of several
♦ICLARM Contribution No. 1220.
research components which independently determined suitable areas for human settlements (Cargamento and Rillon 1994), tourism (Cargamento et al. 1994), mangrove reforestation (Alojado et al. 1994) and brackishwater development (Paw et al. 1994).
Paw et al. (1994) determined suitability for brackishwater pond siting using several physical criteria including soil type, elevation, physiography, access to road networks, and access to water and land use. This study prioritized marginal lands (grasslands, swamps), coconut plantations, and unproductive agricultural lands as well as degraded mangroves as having the greatest potential for conversion.
As a complement to the study by Paw et al. (1994), this study focuses on net economic returns of particular land use options to determine the feasib ility o f converting to aquaculture (both shrimp and milkfish) or to retain the use o f land. Four land types are considered: 1) productive ricelands, 2) salinized ricelands, 3) grasslands, and 4) m angroves. The framework used is a constrained m axim ization approach where optimal land use results in the greatest level of net revenue for society. Net revenues are valued using a direct cost and revenues approach, future value approach and foregone earnings approach. The last two were used to account for indirect and nonuse values in accordance with the Total Economic Value (TEV) concept.
Lingayen Gulf Profile
Resource-based Activities and Issues: Fisheries, Aquaculture and Tourism
Lingayen Gulf, located in northwestern Luzon, Philippines, has a surface area o f 2,100 km2 and is bounded by the provinces of La Union and Pangasinan. Seventeen municipalities border the Gulf; ten are from Pangasinan, namely: Alaminos, Anda, Bani, Bolinao, Sual, Labrador, Lingayen, Binmaley, San Fabian and Dagupan, while seven are from La Union, namely: Agoo, Aringay, Bauang, Caba, Rosario, San Fernando and Sto. Tomas (Fig. 1).
Previous studies have delineated the Gulf into three sectors (Mines 1986). Sector I includes the municipalities of Sual towards the northernmost tip of Bolinao, characterized by hard-bottom coralline substrates. Most brackishwater ponds and trawling activ ities are
6 4

lo c a liz e d in S e c to r I I , c h a ra c te r iz e d b y soft a n d m u d d y
su bstrates a n d in S e c to r I I I , w ith sa n d y substrates.
T h e p o p u la t io n o f P a n g a s in a n a n d L a U n io n
p r o v in c e s w a s estim a te d at 1 . 1 5 m illio n in 1 9 8 9 b y the
P h ilip p in e N a t io n a l C e n s u s a n d S ta tist ic s O f f ic e w ith
an a v e ra g e o f 4 0 % l iv in g n e a r the co ast. D e n s it y is
h ig h e st in S e c to r I I at the m u n ic ip a l a n d v illa g e le v e ls .
E s t im a t e d p o p u la t io n g ro w th ra te is 3 . 2 % at th e
m u n ic ip a l le v e l b u t is e stim a te d to r e a c h 1 2 % in the
c o a sta l v illa g e s ( M c M a n u s a n d R iv e r a 19 9 0 ) .
F e rre r et a l. ( 1 9 8 8 ) note that the G u lf p ro v id e s m ore
than h a lf o f the e m p lo y m e n t in the a rea e ith er th ro u g h
d ire c t f is h in g o r its a n c illa r y a c t iv it ie s . F is h in g an d
related a c t iv it ie s a c c o u n t fo r 8 3 % o f to ta l e m p lo y m e n t
in S e c to r I I I b u t o n ly 4 6 % in S e c to r I w h e re fa r m in g is
a m o re im p o rtan t o c cu p a tio n .
FISHERIES
T h e f is h e r ie s o f L in g a y e n G u l f c o n s is t s o f the
c o m m e r c ia l a n d m u n ic ip a l secto r. T h e c o m m e r c ia l
secto r is represented b y at le a st th irty -e ig h t traw le rs
w h ic h in c re a se d tw o fo ld b y the 1 9 9 0 s o w in g to the
tra w lin g b an in M a n ila B a y . T h e in c re a se in n u m b e rs
m a y w e ll in c lu d e d a n is h se in e s (hulbot hulbot) w h ic h
are a c t u a lly re fitte d tra w le rs. A v e r a g e c a tc h o f the
c o m m e rc ia l se cto r a m o u n te d to 3 8 ,0 0 0 t y e a r 1 fro m
6 5
Longitude ( °W )
Fig. 1 . Lingayen Gulf coastal area.

Estuarine grasslands in Dagupan City, Pangasinan with potential for aquaculture conversion. Photo by A. Cruz-Trinidad.

67
Photos by A. Cruz-Trinidad
Mangrove area in Lingayen Gulf dominated by Nipa species (Nipa fruticans).
M B .* ■I.’ 1- V
líM A*í í É § ! ¿ : ' 4 ' :'! r'". T S V * * . ; ~ '

1989 to 1993 whereas the municipal sector landed an average of 21,000 t-year1 during the same period. The municipal sector has 28 different types o f gears (Silvestre and Palma 1990), the most important of which are gill nets and exp losives. The sectoral contributions to gross revenues are P631 million* and PI 30 million for the municipal and commercial sectors, respectively.
Several studies point to the overexploitation o f the Lingayen Gulf fisheries. Fox (1986) used fisher density, Silvestre (1986) analyzed biologically optimum mesh sizes and species composition, while Signey (1987) and Cruz and Silvestre (1988) compared profitability parameters o f various types of fishing gears. Furthermore, intense competition between municipal and commercial fishers is prevalent due to the intrusion of trawlers into municipal inshore waters. The situation is aggravated by the increase in number of municipal fishers who feel forced to deploy destructive fishing techniques such as blast fishing (Pauly 1990).
AQ U AC ULTUR E
The importance o f aquaculture, especially the brackishwater culture of milkfish Chanos chanos, and much later, shrimp, cannot be overemphasized. The region is the country’s third largest producer of milkfish and tiger shrimps (in volume and value terms) next to Western Vi say as and Central Luzon. From 1990 to 1993, an annual average of 17,000 t of milkfish was produced yield in g P585 m illio n -y e a r1. Shrimp production, while yielding an average of 2 ,1001 during the same period, resulted in annual average receipts of P343 million (Table 1).
There are 16,000 hectares o f fishponds in Pangasinan and La Union provinces, 13,000 ha of which are privately owned (Table 2). Fishpond density is highest in the municipalities of Dagupan, Binmaley and Lingayen with an average pond size of 1.9 ha. Fishponds are managed extensively with an average production not exceeding 1,000 kg-ha 'year1 (Paw et al. 1994). Monoculture of milkfish predominates, but some farmers especially in the Binmaley area have experimented with polyculture o f milkfish-siganid, shrimp-milkfish, and shrimp-siganid-milkfish. Oyster farms with an average area of 100 m2 are concentrated
6 8
Ì|!US$I = P25.4 (July 1992 to June 1993).
Table 1. Production o f milkfish and shrimp from brackishwater ponds in the Ilocos Region: volume and value of production, 1990-93.
1990 1991 1992 1993
Volume (t)Milkfish 17,804 23,561 17,017 11,195Shrimp 4,189 4,556 875 1,619
Value (in thousand pesos)1Milkfish 363,208 662,076 719,820 593,990Shrimp 518,442 534,186 119,611 199,600
'US$1 = P25.4, July 1992-June 1993
Table 2. Number and total area of privately-owned brackishwater fishponds in the coastal municipalities o f Pangasinan Province, 1984.
No. o f Total areaMunicipality fishponds (ha)
San Fabian 324 279Mangaldan 71 157Dagupan 2,693 3,830Binmaley 3,721 3,728Lingayen 2,337 1,729Labrador 138 153Sual 61 112Alaminos 305 1,200Bani 205 1,328Anda 137 881Bolinao 50 55
Total 10,042 13,452
in the Dagupan-Binmaley area. Hanging culture or bitin is the most common method. Cage culture o f groupers, snappers and siganids is a nascent but highly promising industry. Groupers, in particular, fetch attractive prices in the domestic markets, more so in the export market, especially when sold live (Agiiero and Cruz 1991).
Water pollution from domestic and industrial waste affects growth and survival of cultured species. Serious contamination of the Dagupan-Binmaley River with domestic wastes resulting in high coliform counts affect the oyster farms in the area. Industrial pollution from the Bayawas River and mine tailings from the Benguet uplands is detrimental to the fishponds. Another issue faced by the industry is the low productivity of milkfish ponds which has vast im plications on land use alternatives.
TOURISM
The Lingayen Gulf area is endowed with long stretches of sandy beaches running from Bauang to Agoo in La Union, natural scenic areas such as the Hundred Islands in Alaminos, and a rich culture and
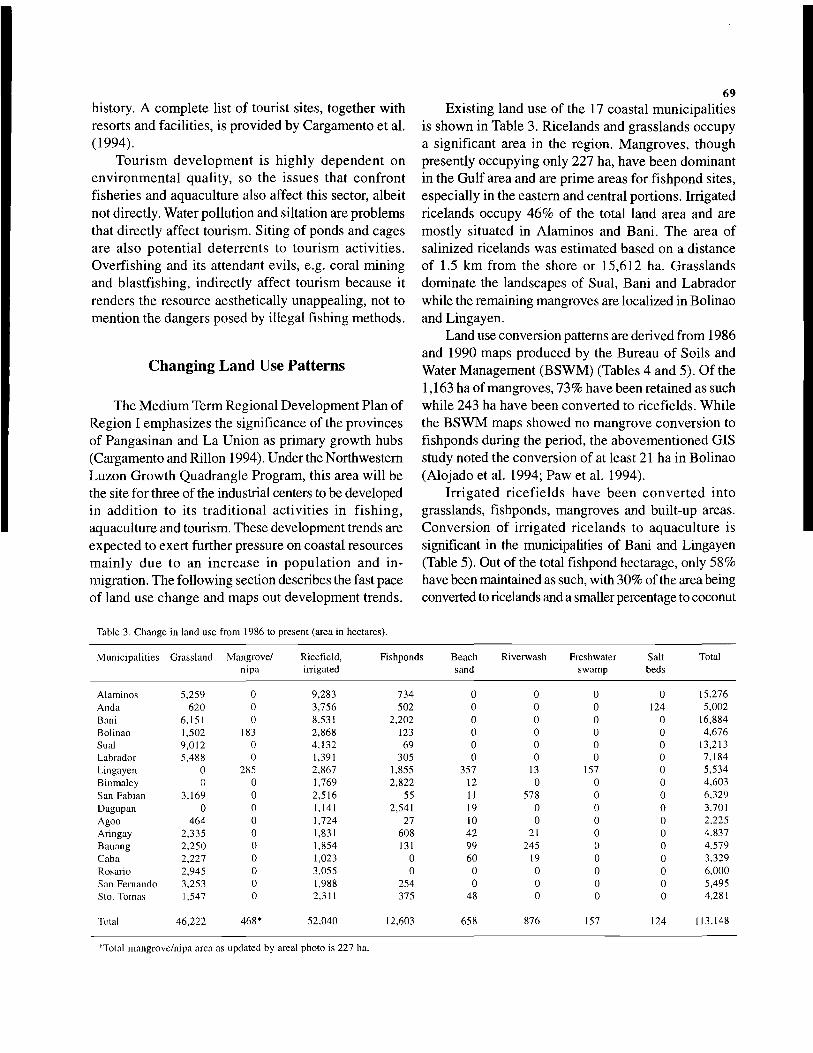
h isto ry . A c o m p le te lis t o f to u rist sites, tog ether w ith
resorts a n d f a c ilit ie s , is p ro v id e d b y C a rg a m e n to et a l.
( 1 9 9 4 ) .
T o u r is m d e v e lo p m e n t is h ig h ly d e p e n d e n t o n
e n v ir o n m e n t a l q u a lit y , so the is s u e s th at c o n fr o n t
f is h e rie s a n d a q u a c u ltu re a lso affect th is sector, a lb e it
not d ire c tly . W a te r p o llu t io n an d s ilta tio n are p ro b le m s
that d ir e c t ly affe ct to u rism . S it in g o f p o n d s a n d ca g e s
a re a ls o p o te n t ia l d e te rre n ts to to u r is m a c t iv it ie s .
O v e r f is h in g a n d its attendant e v ils , e .g . c o ra l m in in g
a n d b la s tf is h in g , in d ire c t ly affect to u ris m b e ca u se it
ren d ers the re so u rce a e sth e tic a lly u n a p p e a lin g , not to
m e n tio n the d a n g e rs p o sed b y ille g a l f is h in g m eth o d s.
Changing Land Use Patterns
T h e M e d iu m T e r m R e g io n a l D e v e lo p m e n t P la n o f
R e g io n I e m p h a s iz e s the s ig n if ic a n c e o f the p ro v in c e s
o f P a n g a s in a n an d L a U n io n as p rim a ry g row th h u b s
(C a rg a m e n to and R il lo n 19 9 4 ) . U n d e r the N o rthw estern
L u z o n G ro w th Q u a d ra n g le P ro g ra m , th is a rea w il l be
the site fo r three o f the in d u stria l centers to be develo ped
in a d d it io n to its t r a d it io n a l a c t iv it ie s in f is h in g ,
a q u a c u ltu re an d to u rism . T h e s e d e v e lo p m en t trends are
e x p e cte d to exert fu rth er p re ssu re on c o a sta l re so u rce s
m a in ly d u e to a n in c r e a s e in p o p u la t io n a n d in
m ig ratio n . T h e fo llo w in g sectio n d e scrib e s the fast p ace
o f la n d u se c h a n g e a n d m a p s ou t d e v e lo p m e n t trends.
E x is t in g la n d u se o f the 1 7 co a sta l m u n ic ip a lit ie s
is sh o w n in T a b le 3 . R ic e la n d s a n d g ra ss la n d s o c c u p y
a s ig n if ic a n t a re a in the re g io n . M a n g r o v e s , th o u g h
p re se n tly o c c u p y in g o n ly 2 2 7 h a, h a v e b e e n d o m in a n t
in the G u l f a rea a n d are p rim e a re a s fo r f is h p o n d sites,
e s p e c ia lly in the eastern an d ce n tra l p o rtio n s. Irr ig a te d
r ic e la n d s o c c u p y 4 6 % o f the to tal la n d a re a a n d are
m o s tly s itu a te d in A la m in o s an d B a n i. T h e a re a o f
s a lin iz e d r ic e la n d s w a s e stim a te d b a se d on a d ista n c e
o f 1 . 5 k m fro m the sho re o r 1 5 , 6 1 2 h a. G r a s s la n d s
d o m in a te the la n d sc a p e s o f S u a l, B a n i a n d L a b r a d o r
w h ile the re m a in in g m a n g ro ve s are lo c a liz e d in B o lin a o
a n d L in g a y e n .
L a n d use co n v e rs io n patterns are d e riv e d fro m 19 8 6
a n d 1 9 9 0 m a p s p ro d u ce d b y the B u r e a u o f S o ils an d
W a te r M a n a g e m e n t ( B S W M ) (T a b le s 4 a n d 5 ) . O f the
1 , 1 6 3 h a o f m a n g ro v e s, 7 3 % h a v e been retain ed as su ch
w h ile 2 4 3 h a h a v e b een co n v e rte d to r ic e f ie ld s . W h ile
the B S W M m a p s sh o w e d no m a n g ro v e c o n v e rs io n to
fish p o n d s d u rin g the p e rio d , the a b o v e m e n tio n e d G I S
stu d y noted the c o n v e rs io n o f at le a st 2 1 h a in B o lin a o
(A lo ja d o et a l. 1 9 9 4 ; P a w et a l. 19 9 4 ) .
Ir r ig a t e d r ic e f ie ld s h a v e b e e n c o n v e r t e d in to
g ra ssla n d s, fish p o n d s, m a n g ro v e s a n d b u ilt -u p areas.
C o n v e r s io n o f irr ig a te d r ic e la n d s to a q u a c u ltu r e is
sig n ifica n t in the m u n ic ip a litie s o f B a n i a n d L in g a y e n
(T a b le 5 ). O u t o f the total fish po n d hectarage, o n ly 5 8 %
h ave been m a intained as su ch, w ith 3 0 % o f the area being
converted to ricelands and a sm aller percentage to co conut
6 9
Table 3. Change in land use from 1986 to present (area in hectares).
Municipalities Grassland Mangrove/nipa
Ricefield,irrigated
Fishponds Beachsand
Riverwash Freshwaterswamp
Saltbeds
Total
Alaminos 5,259 0 9,283 734 0 0 0 0 15,276Anda 620 0 3,756 502 0 0 0 124 5,002Bani 6,151 0 8,531 2,202 0 0 0 0 16,884Bolinao 1,502 183 2,868 123 0 0 0 0 4,676Sual 9,012 0 4,132 69 0 0 0 0 13,213Labrador 5,488 0 1,391 305 0 0 0 0 7,184Lingayen 0 285 2,867 1,855 357 13 157 0 5,534Binmaley 0 0 1,769 2,822 12 0 0 0 4,603San Fabian 3,169 0 2,516 55 11 578 0 0 6,329Dagupan 0 0 1,141 2,541 19 0 0 0 3.701Agoo 464 0 1,724 27 10 0 0 0 2.225Aringay 2,335 0 1,831 608 42 21 0 0 4.837Bauang 2,250 0 1,854 131 99 245 0 0 4.579Caba 2,227 0 1,023 0 60 19 0 0 3,329Rosario 2,945 0 3,055 0 0 0 0 0 6,000San Fernando 3,253 0 1,988 254 0 0 0 0 5,495Sto. Tomas 1,547 0 2,311 375 48 0 0 0 4,281
Total 46,222 468* 52,040 12,603 658 876 157 124 113,148
"'Total mangrove/nipa area as updated by areal photo is 227 ha.
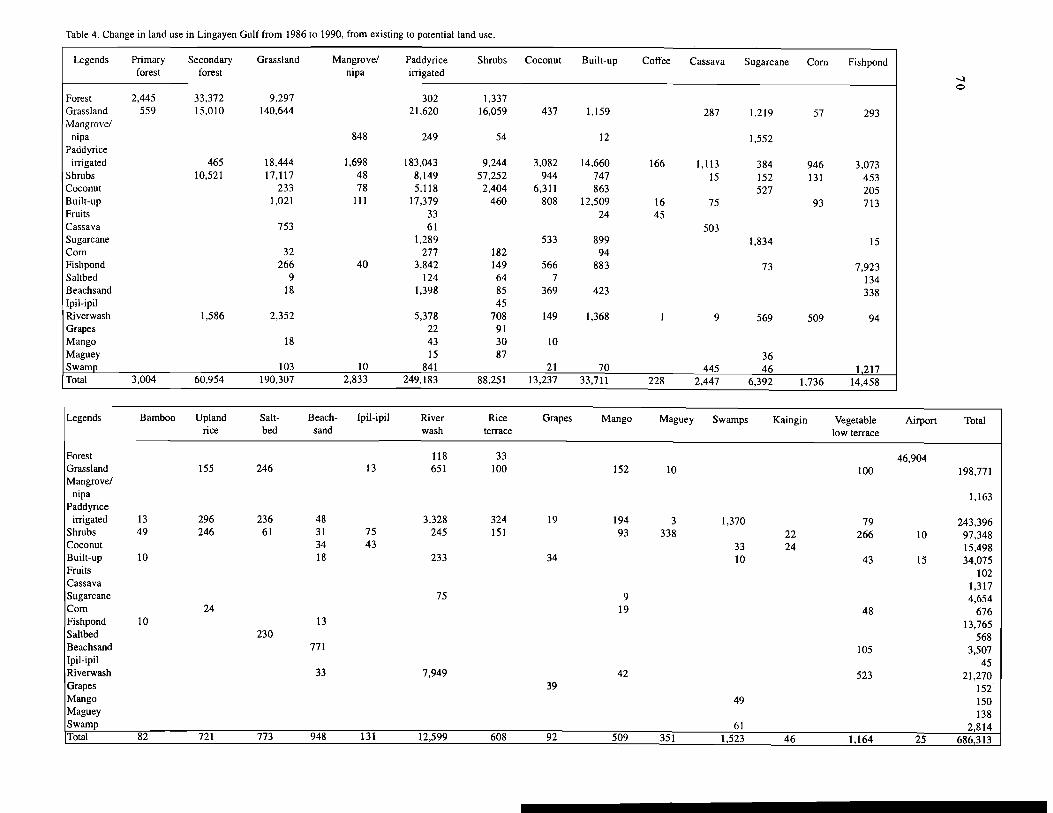
Table 4. Change in land use in Lingayen G ulf from 1986 to 1990, from existing to potential land use.
Legends Primaryforest
Secondaryforest
Grassland Mangrove/nipa
Paddyriceirrigated
Shrubs Coconut Built-up Coffee Cassava Sugarcane Corn Fishpond
- j
Forest 2,445 33,372 9,297 302 1,337o
Grassland 559 15,010 140,644 21,620 16,059 437 1,159 287 1,219 57 293Mangrove/
nipa 848 249 54 12 1,552Paddyrice
irrigated 465 18,444 1,698 183,043 9,244 3,082 14,660 166 1,113 384 946 3,073Shrubs 10,521 17,117 48 8,149 57,252 944 747 15 152 131 453Coconut 233 78 5,118 2,404 6,311 863 527 205Built-up 1,021 111 17,379 460 808 12,509 16 75 93 713Fruits 33 24 45Cassava 753 61 503Sugarcane 1,289 533 899 1,834 15Corn 32 277 182 94Fishpond 266 40 3,842 149 566 883 73 7,923Saltbed 9 124 64 7 134Beachsand 18 1,398 85 369 423 338Ipil-ipil 45Riverwash 1,586 2,352 5,378 708 149 1,368 1 9 569 509 94Grapes 22 91Mango 18 43 30 10Maguey 15 87 36Swamp 103 10 841 21 70 445 46 1,217Total 3,004 60,954 190,307 2,833 249,183 88,251 13,237 33,711 228 2,447 6,392 1,736 14,458
Legends Bamboo Upland Salt Beach- Ipil-ipil River Rice Grapes Mango Maguey Swamps Kaingin Vegetable Airport Totalrice bed sand wash terrace low terrace
Forest 118 33 46,904Grassland 155 246 13 651 100 152 10 100 198,771Mangrove/
nipa 1,163Paddyrice
irrigated 13 296 236 48 3,328 324 19 194 3 1,370 79 243,396Shrubs 49 246 61 31 75 245 151 93 338 22 266 10 97,348Coconut 34 43 33 24 15,498Built-up 10 18 233 34 10 43 15 34,075Fruits 102Cassava 1,317Sugarcane 75 9 4,654Corn 24 19 48 676Fishpond 10 13 13,765Saltbed 230 568Beachsand 771 105 3,507Ipil-ipil 45Riverwash 33 7,949 42 523 21,270Grapes 39 152Mango 49 150Maguey 138Swamp 61 2,814Total 82 721 773 948 131 12,599 608 92 509 351 1,523 46 1,164 25 686,313

Table 5. Change in land use in Lingayen Gujf area from 1986 to 1990, by municipality.
Change Alaminos Anda Bani Bolinao Sual Labrador Lingayen Binmaley SanFabian
Dagupan Agoo Aringay Bauang SanFernando
Sto.Tomas
Total
1 131.50 372.00 213.70 717.202 891.80 20.90 20.903 377.90 383.90 98.60 68.70 10.50 210.60 611.00 470.60 7.50 331.60 7.50 86.60 52.30 127.00 3,637.504 101.60 256.90 135.90 50.80 643.805 85.10 28.40 38.80 9.00 115.00 23.90 271.806 68.70 1.50 1,807.50 23.90 92.60 64.20 7.50 207.60 88.10 582.507 434.70 131.50 130.00 1.50 70.20 1,384.80 2,216.80 23.90 2,207.90 14.90 431.70 113.50 216.60 9,055.508 130.009 68.70 230.00 16.40 135.90 4.50 52.30 31.40 539.2010 89.60 4.50 94.1011 248.00 448.10 696.1012 9.00 9.0013 7.50 7.5014 3.00 3.0015 13.40 13.40
Total 1,114.40 1,239.90 2,956.30 279.20 224.20 304.70 2,414.10 3,429.70 65.80 2,998.00 26.90 607.90 131.50 253.90 375.00 16,421.50

and b u ilt-u p areas. G ra ss la n d s h ave been co nverted to
r ice paddies, e sp e c ia lly in the m u n ic ip a litie s o f A n d a and
S u a l, and into sh ru b lan d s and seco n d ary forests. T a b le 5
a ls o in d ic a t e s th a t s u it a b le a re a s f o r a q u a c u lt u r e
co n ve rsio n are m in im a l: som e 7 .5 h a o f r ice la n d , 3 h a o f
g ra ssla n d in S a n F a b ia n an d 1 3 .4 h a o f sh ru b la n d in
B o lin a o .
S u b s ta n tia l m a n g ro v e an d n ip a sw a m p s in c lu d in g
r ic e la n d s w ere co n v e rte d to a q u a c u ltu re fa rm s w ith
m a n g ro v e c o n v e rs io n h a v in g b e g u n d u rin g the 1 9 5 0 s
(D a n n h a e u s e r 1 9 8 6 ; P a w an d P a lm a 1 9 9 1 ) . P re se n t
aggregate a rea o f b ra c k ish w ater p o n d s is 1 4 ,5 8 9 h a w ith
ab o u t 1 ,5 6 6 h a lo c a te d in L a U n io n , the rest b e in g
d is tr ib u te d a m o n g th e m u n ic ip a lit ie s o f B in m a le y ,
D a g u p a n , B a n i, an d L in g a y e n in P a n g a s in a n . P a w et
al. ( 1 9 9 4 ) sh o w e d the c o n v e rs io n rate o f d iffe re n t la n d
use typ e s to b ra c k is h w a te r p o n d s fro m 1 9 8 6 to 1 9 9 0 to
total 6 ,5 3 4 h a o r an a v e ra g e o f 1 ,3 0 0 h a -y e a r 1.
Costs and Benefits of Altering Land Use
Monetary
T a b le 6 l is t s f o u r ty p e s o f la n d u s e ty p e s a n d
c o rre sp o n d in g p aram eters re fle ctin g a lte rn a tiv e u se s,
72
Table 6. Cost and revenue parameters o f different land use types in Lingayen Gulf area.
Alternative useExisting land use and parameters
Milkfishponds
Shrimpponds
Noconversion
Productive ricelandsConversion cost ( P h a 1) 100,000 100,000Operating cost (P ha ' y e a r1) 100,000 100,000 10,000Production (kg-year1) 5,000 4,000 9,200Average net revenue' 265,000 420,000 55,200
Salinized ricelandsConversion cost (P h a 1) 100,000 100,000Operating cost (P ha '-year') 100,000 100,000 12,000Production (kg-year1) 7,500 5,000 7,000Average net revenue 452,500 490,000 42,000
GrasslandsConversion cost (P h a 1) 200,000 200,000Operating cost (P ha '-year') 100,000 100,000 75,000Production (kg-year1) 5,000 4,000 0Average net revenue 255,000 360,000 -75,000"
MangrovesConversion cost (P h a 1) 500,000 500,000Operating cost (P ha '-year ') 100,000 100,000 0Production (kg-year1) 10,000 6,000 8,695Average net revenue 600,000 570,000 8,6953
'Based on farmgate price of P120 kg'' for shrimps, P75 kg '‘ for milkfish and P6-kg 1 for rice."Based on assessed value and represents foregone earnings.'Based on mangrove valuation in Pagbilao, Quezon.
i.e ., m ilk f is h p o n d s, sh r im p p o n d s an d m a in te n a n c e o f
e x is t in g u s e . “ M a in t e n a n c e ” u s e in c l u d e s b o th
p ro d u c tiv e an d n o n p ro d u c tiv e u se o f la n d .
P ro d u c tiv e a n d sa lin ize d r ic e la n d s ca n b e co n verted
to p o n d s at a d e v e lo p m e n t c o s t o f P 1 0 0 , 0 0 0 - h a 1.
C o n v e r s io n co sts o f g ra ss la n d s is P 2 0 0 ,0 0 0 h a 1, tw ice
the c o s t o f r ic e la n d s d u e to th e a b s e n c e o f p a d d y
structures. M a n g r o v e c o n v e rs io n co st is estim a te d at
P 5 0 0 , 0 0 0 - h a 1 ( A . C a r g a m e n t o , p e r s . c o m m .) a n d
in c lu d e s the co n stru ctio n o f d ik e s a n d th e c le a r in g o f
f o r e s t s . O p e r a t in g c o s t s f o r a l l t y p e s o f p o n d s
irr e s p e c t iv e o f in it ia l la n d ty p e is h e ld c o n s ta n t at
P 1 0 0 , 0 0 0 -h a 1 (P r im a v e ra 1 9 9 3 ) .
A v e r a g e m ilk f is h p ro d u c t io n is a s s u m e d to be
h ig h e r than the cu rre n t a v e ra g e to re fle c t th e th rust
to w a rd s s e m i-in t e n s iv e p o n d o p e ra t io n . M in im u m
p ro d u ctio n le v e l fo r m ilk f is h is 5 ,0 0 0 k g - h a ' - y e a r 1 fo r
p ro d u c tiv e r ic e la n d s a n d g ra ss la n d s b u t is a s su m e d to
be higher, i.e ., 7 ,5 0 0 k g h a -1 y e a r 1 fo r s a lin iz e d ric e la n d s
as an effect o f sa ltw ater in tru sio n . T h e p ro d u c tio n le v e l
fo r sh rim p is b a se d on e stim a tes u s e d b y P r im a v e r a
( 1 9 9 3 ) fo r s e m i-in t e n s iv e fa r m s . A s in th e c a s e o f
m ilk f is h , p ro d u ctio n le v e ls fo r sh rim p s fro m s a lin iz e d
fa rm s are in c re a se d to 5 ,0 0 0 k g - h a 1-y e a r ‘ .P r o d u c tio n
le v e ls fo r both sh rim p s a n d m ilk f is h are c o n s id e ra b ly
in cre a se d in the ca se o f c o n v e rs io n fro m m a n g ro v e s
d u e to its f a v o r a b le p h y s i c a l a n d e c o lo g ic a l
attributes.
R ic e la n d s y ie ld net re v e n u e s i f m a in ta in e d as
s u c h . P r o d u c t io n fo r a tw o c r o p p in g p e r io d is
9 ,2 0 0 k g -y e a r 1 ( C .R . d e la C r u z , p ers. c o m m .) a n d
o p e ra tin g c o st is P 1 0 ,0 0 0 -y e a r 1. O p e r a t in g c o st
in c lu d e s c o st o f seeds, fe rt iliz e r s , a n d la b o r an d is
a ssu m e d s im ila r fo r s a lin iz e d r ic e la n d s . A v e ra g e
p ro d u ctio n fo r the latter, h o w e v e r, w as a ssu m e d to
be 7 ,0 0 0 k g -y e a r 1 d u e to the e ffe ct o f sa ltw ater
in tru sio n .
G ra ssla n d s w o u ld y ie ld no revenue i f m a in ta in e d
in t h e ir e x is t in g f o r m b e c a u s e n o d i r e c t l y
m a rk e ta b le g o o d s an d s e rv ic e s a rise fro m th e ir use .
S o c ie ty w o u ld , in fact, in c u r a co st e q u iv a le n t to
th e ir cu rre n t a sse sse d v a lu e .
T h e v a lu e o f m a n g ro v e s w a s b a se d on P I D S
( 1 9 9 4 ) , w h ic h d id va lu a tio n w o rk fo r tw o m a n g ro ve
e c o sy ste m s, i.e ., P a g b ila o B a y in Q u e z o n P r o v in c e
an d U lu g a n B a y in P a la w a n . T h e v a lu e u s e d fo r
L in g a y e n G u l f w a s b ased on the fo rm e r b e c a u se o f
s im ila r a reas, i.e ., 3 5 0 h a fo r P a g b ila o a n d 2 2 7 h a
fo r L in g a y e n as o p p o se d to 1 ,8 0 0 h a fo r U lu g a n
B a y , as w e ll as status o f e x p lo ita tio n . T h e v a lu e

was based on summation of direct (fish, invertebrates and juveniles) and indirect goods (litterfall).
The conversion option resu lts in average net revenue based on a 10-year cash flow where conversion costs are reflected only for the first year. Thus, net revenue resulting from mangrove conversion are the highest among all alternatives despite high conversion costs. Net revenue resulting from the conversion of grasslands is the lowest. The status quo results in net revenue for productive and salinized ricelands, albeit lower for the latter. Net revenue accruing to mangroves is minimal but positive because no costs are incurred, w hile grasslands resu lt in a net loss because no marketable goods and services result from its nonuse.
A straightforward comparison of the net revenue resulting from three land use options shows that, based on economic efficiency objectives and in the absence of fixed (e.g., land availability) as well as exogenous limits (conversion limits), all mangroves would be converted to ponds and none of the existing land types would be re tained. The LP exercise allow s us to determine the optimal land use mix without compromising these limits.
Environmental
Use of the TEV approach necessitates the identification of use and nonuse values of land types as presented in Table 7. Ricelands and grasslands found in the L ingayen G u lf area have tw o direct uses: agriculture and human settlements. Moreover, ricelands and grasslands play an im portant role of providing vegetative cover thus preventing soil erosion and decreasing the amount of sediments reaching the Gulf. Granting that the Lingayen G ulf area is flood prone,
ricelands and grasslands also have a role in flood prevention.
Mangrove is a very critical resource found in the coastal area. Aside from the directly m arketable goods and serv ices such as fo rest re so u rces (charcoal, firewood, tannin), wildlife, fisheries, forage and water supply, mangroves have important ecological functions. Zamora (1989) points out that once a mangrove area is converted into a fishpond, it no longer functions as a n a tu ra l system and ce ases to c o n tr ib u te to the productiv ity o f the nearby n earsho re ecosystem . Furthermore, mangrove conversion results in the loss of all standing biomass as well as the total disruption of soil, preventing natural regeneration.
Adverse effects of mangrove conversion include decreases in catches of mature and juvenile fish and shrimp (Martosubroto and Naamin 1977; Camacho and Bagarinao 1986). The loss of nursery grounds and eventual scarcity of shrimp fry also affect aquaculture operations as docum ented in Bell and Cruz-Trinidad (this vol.).
L in e a r P ro g ra m m in g A p p lica tio n
Objective Function
The objective function is the m aximization of net revenue arising from the use of four types o f land for three possible options. N et revenue per option is dependent on two com ponents: 1) area of land devoted for a particular purpose; and 2) net revenue resulting from the production of marketable products including rice, shrimps, ponds. Component 2 is com puted based on prices and estimated production levels.
The solution to the objective function includes optimal land use mix and the resulting level of total
73
Table 7. Use and nonuse values o f land types in coastal areas o f Lingayen Gulf, Philippines.
Land type Direct use Indirect use Nonuse
Ricelands Agriculture Human settlements
Nutrient retention
Grasslands Agriculture Human settlements
Sediment retention Wildlife habitat
Mangroves Forest resourcesWildlifeFisheriesForageAgricultureWater supply
Groundwater recharge/discharge Flood and flow control Shoreline/bank stabilization Sediment retention Nutrient retention Biological diversity
External support Recreation/tourism Water transportUniqueness to culture/heritage

profits. The representation of the objective function is as follows:
M ax1!where f is profit and is equal to
1=NR„ * H ; ...1)JL ij u ’
Nr = the net revenue resulting from land type iand option j; and
H.. = the a rea d ev o ted to land ty p e i andpotential and use j.
The subscripts i and j refer to existing land type and potential land use, respectively:
i = I ,...41 = productive ricefield;2 = salinized riceland;3 = grasslands; and4 = mangroves,j = I , ...31 = no change;2 = milkfish ponds; and3 = shrimp ponds.
N r = TR - CC -O C ...2)'.1 >J U 'J
whereTr = Total revenue, product o f price, P k and
quantity of production, Qk;Cc = Conversion cost of land type i into option
j ’Oc.. = O perating cost o f land type i used for
option j ;where
k = 1....31 = rice;2 = milkfish; and3 = shrimp
Constraints
1) Land use constraints
74
H <= 36,428 ...3)<= 15,612 ...4)
H’j <= 46,222 ...5)h ' <= 227 ...6)
The above constraints are the existing area of the four types o f land use, which is theoretically the maximum allowable level of conversion.
2) Conversion constraints
H.2 <= 10,000 ...7)R 3 <= 10,000 ...8)
An additional constraint imposed on the system is the maximum conversion rate to pond aquaculture. The limit imposed is 10,000 ha each for milkfish and shrimp ponds and is binding for a period o f 10 years. This translates to an annual conversion rate o f 1,000 ha which was observed to be the average conversion rate for the region (Paw et al. 1994).
3) Nonnegativity constraints
H >= 0u
R e s u lts
Optimal Land Conversion Rates
Using a direct cost and revenues approach, the areal distribution for different land types across three land use options is sum m arized in Table 8. Productive ricelands are maintained but all salinized ricelands are converted to ponds. Milkfish ponds account for 63% o f the to tal area o f salin ized ricelands w hile the remaining amount is devoted to shrimp ponds. Due to the limits im posed on area of shrimp and m ilkfish ponds, only 4,161 ha o f grasslands resulted from optimal conversion rates, while the rem aining area would be retained despite the low returns. This scenario supports the total conversion of the remaining 227 ha o f mangroves to milkfish ponds. Potential benefits resulting from this land use mix am ount to P7.4 billion-year1 which is about 50% of the estimated Gross Value Added in agriculture and forestry of P15.3 billion in current prices (NSCB 1995).
The optimal distribution changes when the TEV approach is used. This approach involves the estimation o f F u tu re Value (FV )* and the in co rp o ra tio n of foregone benefits. The latter is estimated by subtracting from potential net revenues the corresponding amount foregone by maintaining the land in its existing form.
*An analog of the Present Value (PV) criterion, the use o f FV emphasizes the importance of future rather than present benefits.

Table 8. Optimal land use allocation (ha) using a direct costs and revenues approach (Case 1) and a Total Econom ie Value (TEV) approach (Case 2).
Case 1 Alternatives
M ilkfish Shrimp Existingponds ponds use
Productive ricelands 0 0 36 ,428Salinized ricelands 9,773 5,839 0Grasslands 0 4,161 42,061Mangroves 227 0 0Net benefits - 7 .4 -10s -
Case 2
Productive ricelands 0 0 36 ,428Salinized ricelands 10,000 0 5,612Grasslands 0 10,000 36 ,222Mangroves 0 0 227Net benefits - 35-109 -
For example, the conversion o f productive ricelands to m ilk fish p o nds w ou ld n ec essa rily e lim in a te possibilities o f using said land for rice production. Potential net revenue is then minimized by the amount of revenue foregone by maintaining land in its existing form (T able 9). T h is p ro ced u re is based on the assumption that land conversion results in adverse and oftentimes irreversible environmental impacts. On the other hand, land that is maintained in its existing form has im plicit potentials for conversion. The resulting net revenue is thus estim ated as the existing revenue plus average potential revenue arising from conversion. This procedure has an inherent conservationist bias since it has a minimization effect on the conversion option and an enhancement effect on the nonconversion option.
Future Values (FV) were estimated for mangroves because o f indirect as well as nonuse values which w ere not adequately assessed. Furtherm ore, it is assumed that the value o f critical ecosystems increase exponentially in relation to the remaining area mainly because o f th e ir bequest value. Fu tu re value o f mangroves was estim ated to reach P6.1 m illion-year1
Table 9. Estimation o f net revenue based on a Total Econom ic Value (TEV) approach, in pesos.
Land type M ilkfish Shrimp Existing use
Productive ricelands 219 ,8 0 0 3 24 ,800 3 17 ,500Salinized ricelands 42 2 ,5 0 0 460 ,0 0 0 4 71 ,250Grasslands 2 55 ,000 3 60 ,000 307 ,500M angroves 600 ,0 0 0 570 ,000 6 ,120 ,394
based on a 10-year planning scenario and a discount rate of 3%. The optimal land use mix resulting from said approach is as follows: 1) productive ricelands are maintained as such while more than 60% of salinized ricelands are better off being converted to milkfish ponds; 2) of the total grasslands area, 10,000 ha are proposed for conversion to shrimp ponds; and 3) no mangroves are to be converted to ponds. This optimal land use mix results in a net benefit of P35 billion.
Sensitivity Analysis
This exercise determines the effect o f changing the constraints and that of the coefficients in the objective function on the estimate of net revenue and optimal land use distribution, assuming a direct cost and revenue approach (Case 1). Changes in the constraints assumed a downscaling of the limits to pond conversion, i.e., from 10,000 ha-year1 to 5,000 ha-year1 for a period of 10 years. The result is a corresponding decrease in total revenue by more than half and a shift in the allocation o f land. The 5,000 ha conversion limit for milkfish ponds was allocated am ong salinized ricelands, 4,773 ha and m angroves, 227 ha. S h rim p ponds w ere w holly allocated to salinized ricelands. Productive ricelands and grasslands were maintained in their existing form, the form er because o f revenue resulting from rice production. Grasslands were retained because o f the relatively low returns after conversion (Table 10).
Changes in objective function coefficients would be brought about by changes in one or more o f the components, e.g., production levels, price, or costs. Assum ed increases in production levels o f milkfish would result in an increase in total revenues to P9.8 billion. M ilkfish pond conversion was totally allocated to grasslands with the remaining area being retained. The allocation for shrimp ponds was distributed among salinized ricelands, 9,773 ha and mangroves, 227 ha. Productive ricelands are retained.
C onclusion
The LP was used to determine optimal land use based on two conflicting scenarios. The first uses a direct cost and revenue approach and results in an optimal mix which maximizes net revenue but has an inherent bias towards short-term gains. Thus, Case 1 results in a total conversion o f mangroves. The second
75
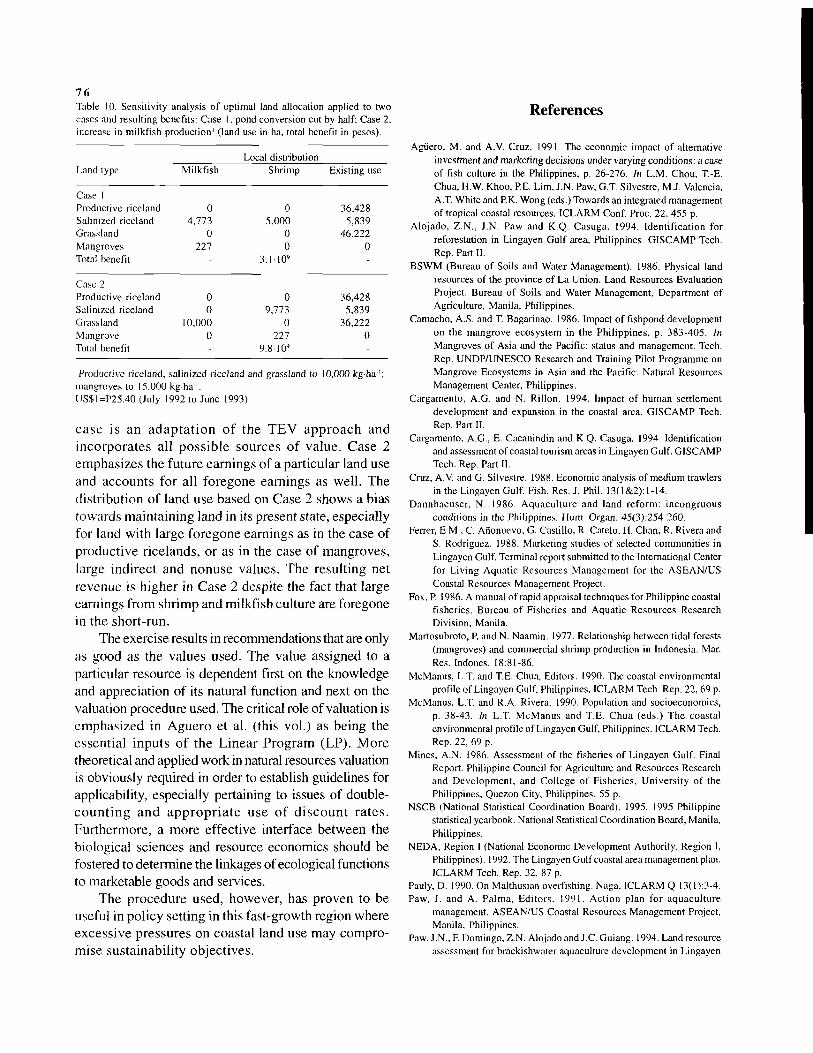
Table 10. Sensitivity analysis o f optimal land allocation applied to two cases and resulting benefits: Case I, pond conversion cut by half; Case 2, increase in milkfish production1 (land use in ha, total benefit in pesos).
76
Land typeLocal distribution
Milkfish Shrimp Existing use
Case 1Productive riceland 0 0 36,428Salinized riceland 4,773 5,000 5,839Grassland 0 0 46,222Mangroves 227 0 0Total benefit - 3.1■10" -
Case 2Productive riceland 0 0 36,428Salinized riceland 0 9,773 5,839Grassland 10,000 0 36,222Mangrove 0 227 0Total benefit - 9 .8 1 0 9 -
'Productive riceland, salinized riceland and grassland to 10,000 kg-ha mangroves to 15,000 kg h a '.U S$I=P25.40 (July 1992 to June 1993)
case is an ad ap ta tio n o f the TEV approach and incorporates all possib le sources o f value. Case 2 emphasizes the future earnings of a particular land use and accounts for all foregone earnings as well. The distribution of land use based on Case 2 shows a bias towards maintaining land in its present state, especially for land with large foregone earnings as in the case of productive ricelands, or as in the case of mangroves, large indirect and nonuse values. The resulting net revenue is higher in Case 2 despite the fact that large earnings from shrimp and milkfish culture are foregone in the short-run.
The exercise results in recommendations that are only as good as the values used. The value assigned to a particular resource is dependent first on the knowledge and appreciation of its natural function and next on the valuation procedure used. The critical role of valuation is emphasized in Aguero et al. (this vol.) as being the essential inputs of the L inear Program (LP). M ore theoretical and applied work in natural resources valuation is obviously required in order to establish guidelines for applicability, especially pertaining to issues of doubleco u n tin g and ap p ro p ria te use o f d isco u n t rates. Furthermore, a more effective interface between the biological sciences and resource economics should be fostered to determine the linkages of ecological functions to marketable goods and services.
The procedure used, however, has proven to be useful in policy setting in this fast-growth region where excessive pressures on coastal land use may compromise sustainability objectives.
Agüero, M. and A.V. Cruz. 1991. The economic impact of alternative investment and marketing decisions under varying conditions: a case of fish culture in the Philippines, p. 26-276. In L.M. Chou. T.-E. Chua, H.W. Khoo, P.E. Lim, J.N. Paw, G.T. Silvestre, M.J. Valencia, A.T. White and P.K. Wong (eds.) Towards an integrated management of tropical coastal resources. ICLARM Conf. Proc. 22, 455 p.
A lojado, Z.N ., J.N. Paw and K.Q. Casuga. 1994. Identification for reforestation in Lingayen G ulf area, Philippines. GISCAM P Tech. Rep. Part II.
BSWM (Bureau of Soils and Water Management). 1986. Physical land resources o f the province o f La Union. Land Resources Evaluation Project. Bureau of Soils and W ater M anagement, Department of Agriculture, Manila, Philippines.
Camacho, A.S. and T. Bagarinao. 1986. Impact o f fishpond development on the mangrove ecosystem in the Philippines, p. 383-405. In Mangroves o f Asia and the Pacific: status and management. Tech. Rep. UNDP/UNESCO Research and Training Pilot Programme on M angrove Ecosystems in Asia and the Pacific. Natural Resources Management Center, Philippines.
Cargam ento, A.G. and N. Rillon. 1994. Im pact o f human settlem ent development and expansion in the coastal area. GISCAM P Tech. Rep. Part II.
Cargamento, A.G., E. Cacanindin and K.Q. Casuga. 1994. Identification and assessment of coastal tourism areas in Lingayen Gulf. GISCAMP Tech. Rep. Part II.
Cruz, A.V. and G. Silvestre. 1988. Economic analysis o f medium trawlers in the Lingayen Gulf. Fish. Res. J. Phil. 13(1 &2): 1-14.
D annhaeuser, N. 1986. A quaculture and land reform : incongruous conditions in the Philippines. Hum. Organ. 45(3):254-260.
Ferrer, E.M., C. Anonuevo, G. Castillo, R. Catelo, H. Chan, R. Rivera and S. Rodriguez. 1988. Marketing studies of selected communities in Lingayen Gulf. Terminal report submitted to the International Center for Living Aquatic Resources M anagem ent for the ASEAN/US Coastal Resources Management Project.
Fox, P. 1986. A manual o f rapid appraisal techniques for Philippine coastal fisheries. Bureau o f Fisheries and Aquatic Resources Research Division, Manila.
Martosubroto, P. and N. Naamin. 1977. Relationship between tidal forests (mangroves) and commercial shrimp production in Indonesia. Mar. Res. Indones. 18:81-86.
McManus, L.T. and T.E. Chua, Editors. 1990. The coastal environmental profile of Lingayen Gulf, Philippines. ICLARM Tech. Rep. 22, 69 p.
McManus, L.T. and R.A. Rivera. 1990. Population and socioeconomics, p. 38-43. In L.T. M cM anus and T.E. Chua (eds.) The coastal environmental profile of Lingayen Gulf, Philippines. ICLARM Tech. Rep. 22, 69 p.
Mines, A.N. 1986. Assessment of the fisheries o f Lingayen Gulf. Final Report. Philippine Council for Agriculture and Resources Research and D evelopm ent, and College o f Fisheries, U niversity o f the Philippines, Quezon City, Philippines. 55 p.
NSCB (National Statistical Coordination Board). 1995. 1995 Philippine statistical yearbook. National Statistical Coordination Board, Manila, Philippines.
NEDA, Region I (National Economic Development Authority, Region 1, Philippines). 1992. The Lingayen Gulf coastal area management plan. ICLARM Tech. Rep. 32, 87 p.
Pauly, D. 1990. On Malthusian overfishing. Naga, ICLARM Q 13(1 ):3-4.Paw, J. and A. Palm a, Editors. 1991. A ction plan for aquaculture
management. ASEAN/US Coastal Resources Management Project, Manila, Philippines.
Paw, J.N., F. Domingo, Z.N. Alojado and J.C. Guiang. 1994. Land resource assessment for brackishwater aquaculture development in Lingayen
References
G ulf area, Philippines. GISCAM P Tech. Rep. Part 11.PIDS (Philippine Institute for Developm ent Studies). 1994. Philippine
m angrove resource valuation project. A ccom plishm ent Report, Septem ber 1994. PIDS, Makati City, Philippines.
Primavera, J.H. 1993. A critical review o f shrimp pond culture in the Philippines. Rev. Fish. Sci. 1 (2): 151 -201.
S ig n ey , L .O . 1987 . C o n seq u e n c es o f e x c e s s iv e fish in g e ffo r t in L ingayen G ulf, Ph ilipp ines, p. 2 0 8 -2 1 7 . In IPFC S ym posium on the E xploitation and M anagem ent o f M arine Fishery R esources in S o u th ea st A sia , 16-19 February 1987, D arw in , A ustralia . RAPA Rep.: 1987 /10 . R egional O ffice for A sia and the P acific ,
F ood and A g r icu ltu re O rg a n iza tio n o f th e U n ited N a tio n s, B angkok .
Silvestre, G.T. 1986. A ssessm ent o f the m ultispecies demersal stock o f the Samar Sea, Philippines. Dept. Mar. Fish. Tech. Rep. 7 ,6 5 p. University o f the Philippines in the Visayas, Iloilo, Philippines.
Silvestre, G.T. and A.L. Palma. 1990. Econom ic sector, p. 15-31. In L.T. McManus and T.E. Chua (eds.) The coastal environmental profile o f Lingayen Gulf, Philippines. ICLARM Tech. Rep. 22 , 69 p.
Zamora, P.M. 1989. Philippine mangroves: their depletion, conversion and decreasing productivity. W allaceana 58:1-5
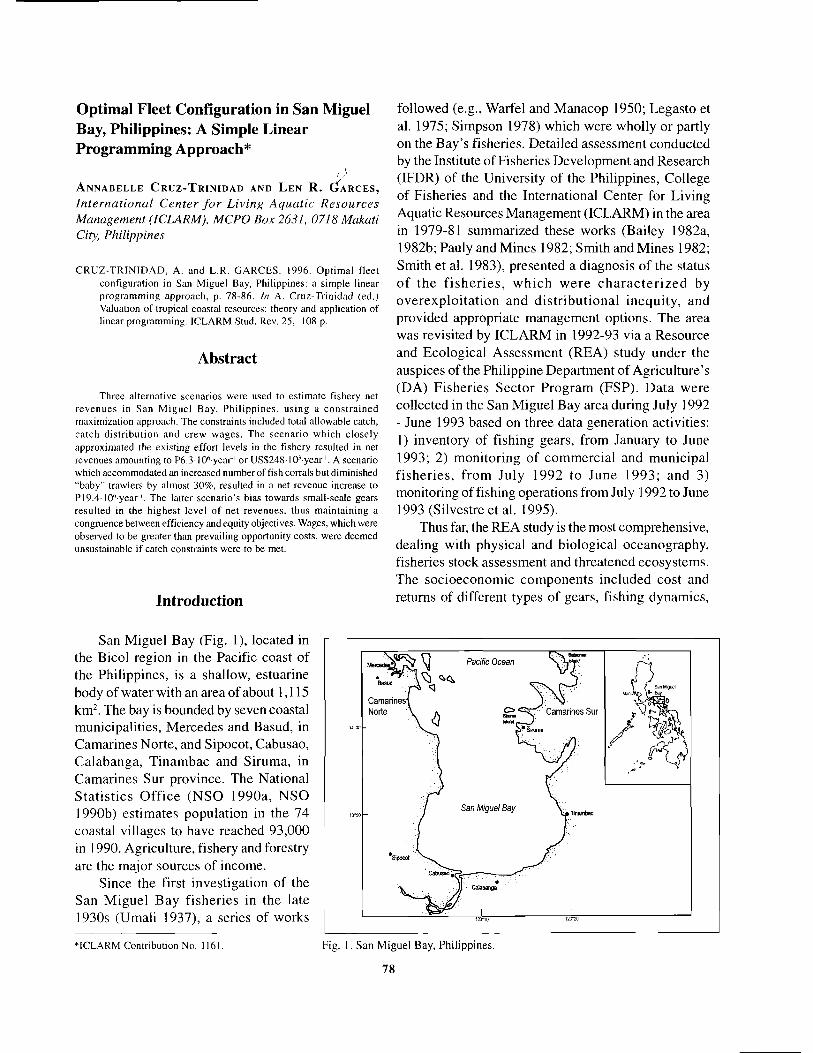
O p tim a l F lee t C o n fig u ra tio n in S a n M iguel B ay, P h ilip p in es : A S im ple L in e a r P ro g ra m m in g A p p ro ach *
A n n a b e l l e C r u z - T r i n i d a d a n d L e n R . ( Í a r c e s ,
In tern a tion a l C en ter f o r L iving A qu atic R esources Management (ICLARM), M CPO Box 2631, 0718 Makati City, Philippines
CR U Z-TRIN TD A D , A. and L.R. G A R CES. 1996. O ptim al fleet configuration in San Miguel Bay, Philippines: a simple linear program m ing approach, p. 78-86. In A. Cruz-Trinidad (ed.) Valuation o f tropical coastal resources: theory and application of linear programming. ICLARM Stud. Rev. 25, 108 p.
A b s tra c t
Three alternative scenarios were used to estim ate fishery net revenues in San M iguel Bay, P h ilipp ines, u sing a co n stra ined maximization approach. The constraints included total allowable catch, catch d istribu tion and crew w ages. The scenario w hich closely approximated the existing effort levels in the fishery resulted in net revenues amounting to P6.3-1 (T-year1 or US$248T03y ea r '. A scenario which accommodated an increased number of fish corrals but diminished “baby” trawlers by almost 30%, resulted in a net revenue increase to P19.4-I06 year f The latter scenario’s bias towards small-scale gears resulted in the h ighest level o f net revenues, thus m aintaining a congruence between efficiency and equity objectives. Wages, which were observed to be greater than prevailing opportunity costs, were deemed unsustainable if catch constraints were to be met.
In tro d u c tio n
San M iguel Bay (Fig. 1), located in the Bicol region in the Pacific coast of the Philippines, is a shallow, estuarine body of water with an area of about 1,115 km 2. The bay is bounded by seven coastal municipalities, M ercedes and Basud, in Camarines Norte, and Sipocot, Cabusao, C alabanga, T inam bac and Sirum a, in Camarines Sur province. The National S ta tis tic s O ffice (N SO 1990a, NSO 1990b) estim ates population in the 74 coastal villages to have reached 93,000 in 1990. Agriculture, fishery and forestry are the m ajor sources of income.
Since the first investigation of the San M iguel Bay fisheries in the late 1930s (Umali 1937), a series of works
followed (e.g., Warfel and M anacop 1950; Legasto et al. 1975; Simpson 1978) which were wholly or partly on the B ay’s fisheries. Detailed assessment conducted by the Institute of Fisheries Development and Research (IFDR) of the University of the Philippines, College of Fisheries and the International Center for Living Aquatic Resources Management (ICLARM) in the area in 1979-81 summarized these works (Bailey 1982a, 1982b; Pauly and M ines 1982; Smith and M ines 1982; Smith et al. 1983), presented a diagnosis o f the status o f the f ish e r ie s , w h ich w ere c h a ra c te r iz e d by overexp lo ita tion and d is trib u tio n al inequity , and provided appropriate management options. The area was revisited by ICLARM in 1992-93 via a Resource and Ecological A ssessm ent (REA) study under the auspices of the Philippine Department of A griculture’s (DA) Fisheries Sector P rogram (FSP). D ata were collected in the San M iguel Bay area during July 1992 - June 1993 based on three data generation activities:1) inventory of fishing gears, from January to June 1993; 2) m onitoring o f com m ercial and m unicipal f ish erie s , from Ju ly 1992 to June 1993; and 3) monitoring of fishing operations from July 1992 to June 1993 (Silvestre et al. 1995).
Thus far, the REA study is the most comprehensive, dealing with physical and biological oceanography, fisheries stock assessment and threatened ecosystems. The socioeconom ic com ponents included cost and returns of different types of gears, fishing dynamics,
♦ICLARM Contribution No. 1161 Fig. 1. San Miguel Bay, Philippines.
78

m ark e t p e rfo rm a n c e , liv e lih o o d o p tio n s and institutional arrangements.
This paper estimates fishery net revenues from data collected by the DA-FSP San Miguel Bay project, using a constrained m axim ization approach. F ishery net revenue is the aggregate revenue earned by individual fishing units and is thus affected by fleet structure. Several strategies can be adapted to m axim ize net revenues: for example, concentrate on a choice group o f h ig h ly e f fic ien t vesse ls ; or fu lly ex p lo it the resource to increase catch levels. The first proposal is invalidated by equity considerations while the latter is not sustainable. A possibility exam ined here is the m ax im iza tio n o f net revenues th a t inco rporates c o n s tra in ts such as a llo w a b le c a tc h e s , eq u ity implications and minimum wages.
T h e S an M iguel B ay F ish ery
San M iguel Bay is characterized by a multigear and multispecies fishery. About 5,300 fishers reside in the seven coastal municipalities bordering the bay (Sunderlin 1995a, 1995b) and employ over 50 distinct types o f fishing methods/gear and over 4,700 units of v arious types o f fish in g gear. T he m ajo r gears considered in this paper contributed roughly 75% of the total catch in 1993 and are listed together with the number of boats per class in Table 1. They are classified
as trawlers, gill nets, push nets and stationary gears including fish corrals, lift nets, and filter nets.
Gears Operating in San Miguel Bay
TRAWLERS
San M iguel Bay is one o f the m ost im portant traw ling grounds in the Philippines. It is relatively shallow, with 89% less than 7 fathoms, and 95% of its bottom is composed of sand, mud and sandy-muddy substrate. The fishing fleet is dominated by trawlers and their “derivatives” the latter including mini and baby trawlers, both classified, by tonnage less than 3 gross tons (GT), as municipal gears.
Small or ‘baby’ trawlers use boats that are 1.6-3.0 GT with 68-160 hp diesel engines. Crew size is five to six fishers. Each trip lasts 2-3 days. M ini trawlers (itik- itik or kuto-kuto) use bancas with outriggers and are powered by 10-16 hp gasoline engines. Crew size is two to three fishers and fishing lasts from 5 :00 a.m. to 3:00 p.m. Mini trawls are used in shallow waters of 410 m depth and target sergestid shrimps.
There were 35 large traw lers and 38 m edium trawlers registered in the area but only one large trawler was observed to operate interm ittently during the sampling period. There are 260 mini trawlers and 50 baby traw lers presently operating; these were all included in the sample.
79
Table 1. Comparison o f fishing effort and catch per gear type in San M iguel Bay from 1980-81 to 1992-93.
Gear type 1980-81 1992-93
No. o f Trips per units year Catch (t)
No. o f (%) units
Trips per year Catch (t) (%)
TrawlersLargeM ediumSmallMini
30 103" 2,385» 12.5» 35 125» 25 0 .1417 38 308 1.772 9,291° 48.6° 50 3 ,905 22188 191 260 202 1,901 10.7
Other gearsG ill nets 1,345 156 4 ,854 25 2,670 171 7 ,550 42Lift net 171 53 624 3 60 115 1,021 6Filter net 60 225 295 1.5 260 240 967 5Scissor net 834 150 476 2.5 245 168 823 5
"All others»Large and medium'Sm all or (baby) and mini
80GILL NETS
The study identified 24 types of gill nets totalling to 2,670 units. Gill nets are named according to mode of operation (e.g., drift gill net, bottom set gill net) or target species (e.g., shrimp gill net, lait; crab gill net, pangasag) but the most common is the ordinary gill net, panke. C haracteristics of gill nets in Table 1 actually refer to an index based on panke units.
PUSH NETS
Silvestre et al. (1995) described push nets or scissor nets (hud-hud) as consisting of collapsible, triangularly- framed netting material mounted over two criss-crossed bam boo poles. Operations usually involve a single fisher pushing the gear along the bottom within wading depth but they have been recently observed to be m ounted in front o f bancas pow ered by 10-16 hp gasoline engines.
STATIONARY GEARS
Stationary gears include fish corrals, lift nets and filter nets. The descriptions provided below are based on Silvestre et al. (1995).
Fish corrals, sagkad, are sem i-perm anent gears used for guiding and trapping fish. The gear consists o f a guiding barrier, two to three playground areas, and a bunt or catching area. The bunt is usually set in the evening; h arvesting using scoop nets occurs the following morning. Operations involve two to three fishers who are transported by a nonmotorized banca. Target species are pelagics but usually include small demersals and shrimps.
Lift nets, bukatot, are square-shaped nets attached by pull ropes to four bases made of bamboo or coconut trunks planted on the seabed. Lift nets are operated in waters of about 10-20 m depth usually near the mouth of the Bay and were observed in the towns of Mercedes, Siruma and Basud. They are only used during the dark phases of the moon and have kerosene lamps to attract fishes. Operations involve about four to five fishers who raise the net via the pullropes. Target fishes are slipmouths and clupeids.
Filter nets, biakus, are conical bags o f netting set against the tidal currents near the mouth o f rivers. The net is usually lowered at dusk and retrieved 4 hours
later; the process is repeated for harvest the following morning. Target species include sergestid and penaeid shrimps and anchovies.
Catch and Species Composition
Total landings were estimated to be about 17,7501 from July 1992 to June 1993 (Silvestre et al. 1995). About 35% were landed by trawls, 42% by gill nets and the remaining 23% by the other gears.
A total of 175 species distributed among 110 genera and 70 families were observed to occur in the catch (C incoeta l. 1995). Croakers (Sciaenidae), slipmouths (L e io g n a th id a e ), p en ae id sh rim ps (P en a e id ae ) , sergestid shrimps (Sergestidae), crabs (Portunidae) and anchovies (E ngrau lidae) dom inate the land ings, collectively accounting for 58.5% of the total landings during the period. A detailed breakdown of species composition per gear type is provided in Silvestre et al. (1995).
Status o f Exploitation
A comparison of key physical indicators by major gear types between the 1980-81 and 1992-93 studies is presented in Table 1. Except for the small/baby trawlers, all gears increased in numbers. Moreover, there is also a marked increase in the frequency of trips per gear type.
In addition to increased fishing effort are other parameters that point to a worsening of the status of exploitation in the Bay including: excessive fishing pressure, changes in species composition, and changing economic performance.
EXCESSIVE FISHING PRESSURE
E xcessive fishing pressure continues to be an overriding issue confronting the fisheries of San Miguel Bay despite the reallocation of effort (Silvestre et al. 1995). A comparison of relative indices o f total catch, aggregate traw l horsepower, num ber of fishers and trawlable biomass shows that trawlable biomass has declined by about 80% from its 1940 levels (Fig. 2). The decline in catch rates is most abrupt for trawlers, i.e., 11,700 t in 1980 to about 6,100 t in 1992-93, in view o f the strict enforcement of the 7 km, 7 fathom ban, the decline in number of small trawl units, and reduced catch rates of mini trawls.

81
Trawable biomass
Number of municipal fisheries
Aggregate hp of trawlers
Total catchO O
I 40 0)DC
CHANGE IN ECONOM IC PERFORM ANCE
Fig. 2. Relative indices of trawlable biomass, total catch, number of fishers and aggregate horsepower of trawlers in San Miguel Bay from the 1940s to the early 1990s.
The im pacts o f these variables on economic parameters are shown in Table 3a. M onthly catch value for all but one gear, push nets, has declined severely. Baby trawls were the largest casualties with monthly catch value depreciating by alm ost 90% from 1980-81 levels.
Declines in the rate o f return on investm ent (ROI) were experienced by fish corrals and mini and baby traw lers although rem ain ing positive . In c o n tra s t, f i l te r n e ts , push nets and g ill nets experienced robust growth. Changes in ROIs can be partially attributed to changes in capital requirements (Padilla et al. 1995). The 1980-81 study showed that it was more expensive to engage in gill net fishing than other artisanal fishing methods such as fish corrals and lift nets (Supanga 1982; Supanga and Smith 1982; Tulay and Smith 1982; Yater 1982). At that time, investment cost for mini trawlers was only half of that required by gill nets. By 1993, capital
C inco et al. (1995) also noted that mean exploitation ratio for the more abundant species is 0.65. These observations are indicators of overfishing and are supported by conventional fisheries theory and likewise reflects that a stock is overfished when biomass is reduced below 30 to 50% of virgin stock levels or if the exploitation ratio is way above the “optimum ” values ranging from 0.3 to 0.5 (Silvestre et al. 1995).
CHANGE IN SPECIES COMPOSITION
Table 2 gives a summary of trends in species co m p o sitio n ch an g es re flec tiv e o f grow th , recruitm ent and ecosystem overfishing (Cinco et al. 1995). This trend is also manifested in species composition changes by gear type. In 1980-81, croakers (abo and pagotpot) constituted 82% of the catch of gillnets; this figure was down to 20% in 1992-93 with other species such as shrimp, manta rays, and hairtails occurring. Liftnets still catch anchovies (dilis) but none of the minor catches such as herrings, crevalles and squids are known to presently occur in the catch; instead, there has been replacem ent by other species including croakers, slipm ouths and sergestid shrimps.
Table 2. Changes in relative abundance of various families/groups in the catch during surveys in San Miguel Bay in the late 1940s, early 1980s and early 1990s (Cinco et al. 1995).
Family/groupObserved change in relative abundance Probable cause
Sharks and rays Massive decrease Recruitment overfishing
Cephalopods Relative increase Reduced predation
Penaeid shrimps Relative increase Reduced predation
Pristidae Disappearance Recruitment overfishing
“Trash” fisha) low-value species
(e.g., Gobiidae)b) juveniles of high-value
species
Relative increase
Relative increase
Species replacement reduced predation Growth overfishing
Leiognathidae Massive decrease No straightforward explanation
TetraodontidaeApogonidae
Relative increase Species replacement
SphyraenidaeDrepanidaeSynodontidae
Relative decrease Recruitment overfishing
EngraulidaeTrichiuridae
CarangidaeScombridae
Relative increase Technological improvement (higher trawl opening and speed)
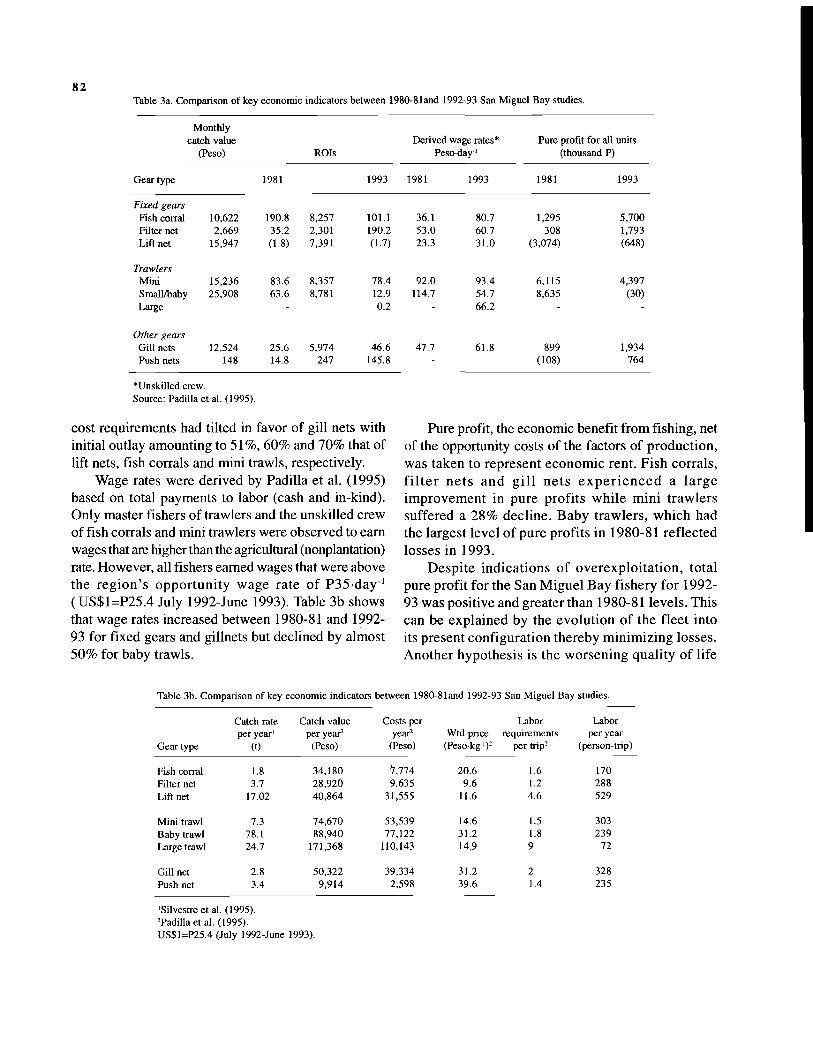
82Table 3a. Comparison o f key econom ic indicators between 1980-81and 1992-93 San M iguel B ay studies.
M onthlycatch value Derived wage rates* Pure profit for all units
(Peso) ROIs Peso d a y 1 (thousand P)
Gear type 1981 1993 1981 1993 1981 1993
Fixed gearsFish corral 10,622 190.8 8,257 101.1 36.1 80.7 1,295 5,700Filter net 2,669 35.2 2,301 190.2 53.0 60.7 308 1,793Lift net 15,947 (1.8) 7,391 (1.7) 23.3 31.0 (3,074) (648)
TrawlersMini 15,236 83.6 8,357 78.4 92.0 93.4 6,115 4,397Small/baby 25,908 63.6 8,781 12.9 114.7 54.7 8,635 (30)Large - 0.2 - 66.2 - -
Other gearsGill nets 12,524 25.6 5,974 46.6 47.7 61.8 899 1,934Push nets 148 14.8 247 145.8 - - (108) 764
♦Unskilled crew.Source: Padilla et al. (1995).
cost requirements had tilted in favor of gill nets with initial outlay amounting to 51%, 60% and 70% that of lift nets, fish corrals and mini trawls, respectively.
Wage rates were derived by Padilla et al. (1995) based on total payments to labor (cash and in-kind). Only master fishers of trawlers and the unskilled crew offish corrals and mini trawlers were observed to earn wages that are higher than the agricultural (nonplantation) rate. However, all fishers earned wages that were above the region’s opportunity wage rate o f P35 day_1 (US$1=P25.4 July 1992-June 1993). Table 3b shows that wage rates increased between 1980-81 and 199293 for fixed gears and gillnets but declined by almost 50% for baby trawls.
Pure profit, the economic benefit from fishing, net of the opportunity costs of the factors of production, was taken to represent economic rent. Fish corrals, filter nets and g ill nets experienced a large improvement in pure profits while mini trawlers suffered a 28% decline. Baby trawlers, which had the largest level of pure profits in 1980-81 reflected losses in 1993.
Despite indications of overexploitation, total pure profit for the San Miguel Bay fishery for 199293 was positive and greater than 1980-81 levels. This can be explained by the evolution of the fleet into its present configuration thereby minimizing losses. Another hypothesis is the worsening quality of life
Table 3b. Comparison of key economic indicators between 1980-81and 1992-93 San Miguel Bay studies.
Gear type
Catch rate per year1
(t)
Catch value per year2
(Peso)
Costs per year2
(Peso)Wtd price
(Pesokg ')"
Labor requirements
per trip2
Labor per year
(person-trip)
Fish corral 1.8 34,180 i,1 1 4 20.6 1.6 170Filter net 3.7 28,920 9,635 9.6 1.2 288Lift net 17.02 40,864 31,555 11.6 4.6 529
Mini trawl 7.3 74,670 53,539 14.6 1.5 303Baby trawl 78.1 88,940 77,122 31.2 1.8 239Large trawl 24.7 171,368 110,143 14.9 9 72
Gill net 2.8 50,322 39,334 31.2 2 328Push net 3.4 9,914 2,598 39.6 1.4 235
'Silvestre et al. (1995)."Padilla et al. (1995).US$1=P25.4 (July 1992-June 1993).

in the region which drives down the alternative uses and returns to labor and capital.
L in e a r P ro g ra m m in g A p p lica tio n
Linear programming was used to estimate potential benefits accruing to the San Miguel Bay fishery under varying constraints. The elements of the linear program are as follows: 1 ) an objective function, the maximization of net revenues; 2 ) constraints, includ ing total a llow able catch, minimum and/or maximum number of units per gear type; and 3) the input-output coefficients, including catch rates per gear type. The variables optimized by the linear program in the primal formulation, i.e., the primal solution, are the number of units per gear type. The dual solution, being the converse of the primal, has as its variables the constraints used in the primal solution. The dual solution provides a measure of the opportunity cost of the particular resource (Agiiero et al., this vol.) and as such indicates changes in net revenue if a certain constraint is relaxed.
Objective Function
Maximize profit, n , such that:
FI = TR - TC
8n = I [{(R, - OC.) * X,} - {LC * W.}] ...1 )i— 1
where the coefficients include:
TR = total revenue;
TC = total costs;
Rl = catch value of fish per gear type;
°C. = material and fixed expenses per geartype; and
LC i = labor costs per gear type
and the variables are:
X. = number of boats per gear class; and
W. = wage rate.
The coefficients of the objective function are catch value per year and operating costs. Catch value is estimated by multiplying catch rate per year (Silvestre et al. 1995) by average weighted prices per gear type (Padilla et al. 1995). All cost items were derived from the work of Padilla et al. (1995). The eight types of gears considered include three fixed gears, i.e., fish corral, filter net and lift net; three types of trawlers, i.e., mini, baby (small) and large; and gill nets and push nets.
Constraints
a) Total allowable catch
L C V * X < = 14,000 ...2)l l ’ /
where CV = volume of catch per gear type.
Given the level of overexploitation, total annual catch for all gear types must be less than or equal to 1993 levels.
b) Distribution of catch
X CV* X. <= 5,880 ...3)
X C V * X < = 4,900 ...4)
X CV* X. <= 3,220 ...5)
The present distribution of total catch should be maintained with gill nets, stationary gears and trawlers contributing 42%, 35% and 23%, respectively. This is to ensure that in the search of maximum revenues, equity objectives are not compromised.
c) Effort limits
X <=X B ...6)1 E 7
In consonance with effort reduction in the trawl fleet, the number of units for all types of trawlers should be less than or equal to existing levels; the other types of gears were allowed to expand.
83

d) Minimum wage rates
W. >= 35 ...7)
Wage rates must be at least equal to the prevailing opportunity cost of labor in the region.
e) Non-negativity constraints
X.>=0 ...8)
W.>=0 ...9)
84
Input-Output Coefficients
Volume of catch per gear type, C V , is provided in constraint (a), the summation of which should be less than or equal to total allowable catch. The same coefficient is used to satisfy constraint (b), the distribution of catch. Otherwise, the other coefficients would take on a value of 1 or 0 depending on whether they are affected by particular constraints.
R esu lts
The primal values correspond to the optimal number of gears and wage levels (Table 4). The dual value of wages represents the opportunity cost of labor; that of gears represent the increase (decrease) in the value of the objective function if constraints on the number of units were relaxed, i.e., specific gears were increased by one unit.
Scenario A is a current representation of the San Miguel Bay fishery with the following constraints: total allowable catch of 14,000 tyear1, a catch distribution ratio as specified in constraint b), and minimum wage rates of P35day'. Scenario B examines the effect of a different fleet configuration on net revenues, i.e, current level of effort for the trawler fleet is maintained while gill nets and other stationary gears are allowed to expand. Scenario B likewise considers constraints (a) and (b). Scenario C is similar to Scenario B except that catch distribution ratio is modified as follows: 50%, gill nets, 30%, stationary gears, and 20%, trawlers. Scenario D is a situation wherein wage rates were pegged at the levels derived by Padilla et al. (1995)
which were, in most cases, higher than the opportunity costs of P35-day‘.
Scenario A yielded net revenues of P6.3 million with lift nets, gill nets and push nets, sustaining losses. Optimal number of units matches existing levels except for baby trawls which were reduced by 24%. Dual values show that fishery net revenues would diminish by P9,206, P492 and P909, for every lift net, gill net and push net added to the existing fleet, respectively. In the same manner, fishery revenues would increase if the number of profitable gears were expanded, for example, each large trawl has the potential of increasing net revenue by P57,613.
The constraints introduced by Scenarios B and C via limitations on “perceived” destructive gears such as trawlers and on catch distribution resulted in higher levels of net revenue (Table 4). The number of baby trawls diminished by 24% for Scenario B and 88% for Scenario C whereas optimal number of fish corrals increased by 82% and 520%, respectively. The optimal number of other stationary gears however remained unchanged. Scenario C resulted in the highest level of benefits, P19.4 million, despite having the lowest number of baby trawlers (88% less than existing levels) and the highest number of fish corrals. Lift nets had the highest opportunity costs despite having a minimal fleet size, i.e., 60 units. This is because of its huge labor requirement per year and the relatively large costs incurred relative to catch value (Table 3b). Scenario D resulted in a net loss of P14 million and the total eradication of mini and baby trawlers; otherwise, the number of all other gear types are maintained at its present levels.
The primal value of wages is P35-day' for all scenarios. Because wage is a cost factor in the estimation of net revenue, the dual values are negative, with the magnitude depending on the labor requirements per gear type and the wage rate. For example, increasing wages by one peso would result in a P74 reduction in net revenue for large trawlers; on the other hand, gill nets would suffer a greater decline amounting to P509,712.
C onclusion
The LP sim ulation proved to be a useful management tool in its predictive and analytic capacity. This exercise helped predict changes in fishery net

Table 4. Optimal number of units per gear type and optimal wage levels (primal) compared with opportunity costs (dual) o f linear programming variables used to model San Miguel Bay fisheries.
85
Scenario A Scenario B Scenario C Scenario DCurrent
levels
Gear
Optimal number o f units per gear
type/ optimal
wage rates
Opportunity costs
Optimal number o f units per gear
type/ optimal
wage rates
Opportunity costs
Optimal number o f units per gear
type/ optimal
wage rates
Opportunity costs
Optimal number of
units per gear type/
optimal wage rates
Opportunity costs
Number o f unitsFish corral 123 123 20,456 224 0 767 0 123 20,456Filter nets 260 260 9,205 260 (32,843) 260 (32,843) 260 9,205Lift nets 60 60 (9,206) 60 (202,629) 60 (202,629) 60 (9,206)Mini trawls 260 260 10,203 260 10,203 260 10,203 0 10,203Baby trawls 50 38 . 0 38 0 11 0 0 0Large trawls 1 1 57,613 1 57,613 1 57,613 1 57,613Gill nets 1,554 1,554 (492) 1,554 (492) 1,554 (492) 1,554 (492)Push nets 245 245 (909) 245 (39,548) 245 (39,548) 245 (909)
Wage rates (Peso)Fish corral 80.7 35 0 35 (38,137) 35 (130,692) 80.7 (20,910)Filter nets 60.7 35 0 35 (74,880) 35 (74,880) 60.7 (74,880)Lift nets 31.0 35 0 35 (31,740) 35 (31,740) 31.0 (31,740)Mini trawls 93.4 35 0 35 (78,780) 35 (78,780) 93.4 (78,780)Baby trawls 54.7 35 (31,740) 35 (9,111) 35 (2,685) 54.7 (9,111)Large trawls 66.2 35 0 35 (72) 35 (72) 66.2 (72)Gill nets 61.8 35 (509,712) 35 (509,712) 35 (509,712) 61.8 (509,712)Push nets - 35 (57,575) 35 (57,575) 35 (57,575) - -
Net revenues (Peso) P6.3 million P8.4 million P19.4 million (P I4 million)
US$1 = P25.4, July 1992-June 1993.
revenues given alternative fleet configuration and wage structures. Scenario A is the closest approximation to the existing situation in San Miguel Bay minus the constraints. The exercise shows that had these constraints been in force, the fishery would gain P6.3 million per year or 6% of operating and labor costs. It seems rational to assume that existing net revenues are larger given that no catch limits are in force; this is corroborated by the work of Padilla et al. (1995) who estimated positive pure profits amounting to PI 3 million.
Linear programming is another economic technique that uses economic efficiency as its sole numeraire,i.e., equity considerations are not considered. In fact, in situations where catch distribution limits were not applied, the resulting fleet structure consisted solely of large trawlers. Likewise, the institution of catch distribution limits as well as limits on the number of trawlers caused the phenomenal increase in the number of fish corrals simply because it had, relative to the other stationary gears, the largest average profit. Both
configurations would increase net revenues substantially but would provide reason to eradicate the small-scale, mostly unprofitable, gears.
This situation was resolved by incorporating catch distribution ratios as constraints. In this exercise, there seems to be a congruence between economic efficiency and equity objectives given that Scenario C, which has an inherent bias towards small gears resulted in a fishery revenue that was also the highest. This observation seems to augur well for future management initiatives especially in effort reduction because this will tend to minimize potential conflicts.
Simulating alternative wage levels indicates the increasing volatility of the labor market in the region. Current wage payments coupled with catch constraints resulted in a nonfeasible solution as in Scenario D, i.e., net revenues were negative. Clearly, wages cannot be maintained by specific gear types if catch or effort limits were sim ultaneously enforced. Thus, resource overexploitation can be viewed as an indirect result of maintaining current wage rates because if labor were

paid rates higher than prevailing opportunity costs, then due to open access, more fugitive labor is attracted to the fishery. The fishery resource would be subsidizing labor that is being used inefficiently. Thus, it is often the case that in overexploited fisheries, e.g., Lingayen Gulf (Cruz and Silvestie 1988) and Philippine small pelagics fishery (Trinidad et al. 1993), labor earns pure profit even if entrepreneurs sustain economic losses. On the other hand, if access were limited by any of the constraints incorporated in the linear program, current wage rates could not possibly be maintained.
This theoretical exercise provides a useful tool for policy setting and while the estimates may never attain point accuracy, the method certainly contributes appropriate benchmarks for decisionmaking.
A cknow ledgem en ts
Many thanks to Ms. Madz Dalusung, Mr. Gerry T. Silvestre, Dr. John McManus, Dr. Hal McArthur and Dr. Madan Dey, who shared with us some of their views and materials for this paper.
R eferences
Bailey, C ., Editor. 1982a. Sm all-scale fisheries o f San M iguel Bay, Philippines: social aspects o f production and marketing. ICLARM Tech. Rep. 9, 57 p.
Bailey, C „ Editor. 1982b. Sm all-scale fisheries o f San M iguel Bay, Philippines: occupational and geographic mobility. ICLARM Tech. Rep. 10, 57 p.
Cinco, E.A., J.C. Diaz, Q.P. Sia III and G.T. Silvestre. 1995. A checklist of fishes caught in San Miguel Bay. In G. Silvestre, C. Luna and I. Padilla (eds.) M ultidisciplinary assessment o f the fisheries in San Miguel Bay, Philippines (1992-93). ICLARM Tech. Rep. 47. CDROM. ICLARM, Manila.
Cruz, A. V. and G.T. Silvestre. 1988. Economic analysis o f medium trawlers in the Lingayen Gulf. Fish. Res. J. Philipp. 13( 1 -2): 1-14.
Legasto, R.M., C.M. del M undo and K.E. Carpenter. 1975. On the hydro- biological and socioeconomic surveys o f San Miguel Bay for the proposed fish nurseries/reservations. Philipp. J. Fish. 13(2):205-246.
NSO. 1990a. 1990 Census o f population and housing. Report No. 2-22E Camarines Norte, National Statistics Office. Manila. Philippines.
NSO. 1990b. 1990 Census o f population and housing. Report No. 2-23E. Camarines Norte, National Statistics Office. Manila, Philippines.
86Padilla, J.E., M.L. Dalusung and G.B. Calica. 1995. Economics o f capture
fisheries in San Miguel Bay. In G. Silvestre, C. Luna, and J. Padilla (eds.) Multidisciplinary assessment o f the fisheries in San Miguel Bay, Philippines (1992-1993). ICLARM Tech. Rep. 47. CD-ROM. ICLARM, Manila.
Pauly, D. and A.N. Mines, Editors. 1982. Small-scale fisheries o f San Miguel Bay, Philippines: biology and stock assessment. ICLARM Tech. Rep. 7, 124 p.
Silvestre, G., E. Cinco, R. Gatchalian and J. Diaz. 1995. Catch and effort in the San Miguel Bay fisheries. In G. Silvestre, C. Luna and J. Padilla (eds.) Multidisciplinary assessment o f the fisheries in San Miguel Bay, Philippines (1992-93). ICLARM Tech. Rep. 47. CD-ROM. ICLARM, Manila.
Simpson, A. 1978. Report o f the BFAR/SCS workshop on the fishery resources o f the Pacific coast o f the Philippines. South China Sea Development and Coordination Programme, Manila. SCS/GEN/78, 48 p.
Smith, I.R. and A.N. Mines, Editors. 1982. Small-scale fisheries o f San Miguel Bay, Philippines: economics o f production and marketing. ICLARM Tech. Rep. 8, 143 p.
Smith, I.R., D. Pauly and A.N. Mines. 1983. Small-scale fisheries o f San M iguel Bay, Philippines: options for m anagem ent and research. ICLARM Tech. Rep. 11, 80 p.
Sunderlin, W.D. 1995a. Livelihood options for fishing families in San M iguel Bay. In G . S ilv es tre , C. L una, and J. P ad illa (eds.) M ultidisciplinary assessm ent o f the fisheries in San Miguel Bay, P hilippines (1992-1993). ICLARM Tech. Rep. 47. CD-RO M . ICLARM, Manila.
Sunderlin, W.D. 1995b. Socioeconomic characteristics o f communities and fishing households bordering San Miguel Bay. In G. Silvestre, C. Luna and J. Padilla (eds.) Multidisciplinary assessment o f the fisheries in San Miguel Bay, Philippines (1992-93). ICLARM Tech. Rep. 47. CD-ROM. ICLARM, Manila.
Supanga, N.C. 1982. Costs and earnings o f Cabusao pushnets, p. 61-63. In I.R. Smith and A.N. Mines (eds.) Small-scale fisheries o f San Miguel Bay, Philippines: economics o f production and marketing. ICLARM Tech. Rep. 8, 143 p.
Supanga, N.C. and I.R. Sm ith. 1982. C osts and returns o f Cabusao stationary gears, p. 45-60. In I.R. Smith and A.N. Mines (eds.) Small- scale fisheries o f San M iguel Bay, Philippines: econom ics o f production and marketing. ICLARM Tech. Rep. 8, 143 p.
T rin idad, A .C ., R .S. Pom eroy, P.V. C orpuz and M .A giiero. 1993. Bioeconomics o f the Philippine small pelagics fishery. ICLARM Tech. Rep. 38, 73 p.
Tulay, E. and I.R. Smith. 1982. Costs and earnings o f mini trawlers, p. 6477. In I.R. Smith and A.N. Mines (eds.) Small-scale fisheries o f San Miguel Bay, Philippines: economics o f production and marketing. ICLARM Tech. Rep. 8, 143 p.
Umali, A.F. 1937. The fishery industries o f San Miguel Bay. Philipp. J.Sci. 63(2): 227-258.
Warfel, H.E. and P.R. Manacop. 1950. Otter trawl explorations in Philippine waters. U.S. Fish and W ildlife Serv. Dept. Int. Res. Rep. 25, 49 p.
Yater, F. 1982. Gill-netters: costs, returns, and sharing systems, p. 27-44. In I.R. Smith and A.N. Mines (eds.) Small scale fisheries o f San M iguel Bay, P h ilip p in e s : e co n o m ics o f p ro d u c tio n and marketing.(ICLARM Tech. Rep. 8, 143 p.)

O P U S: In te ra c tiv e S o ftw are f o r Solving L in e a r P ro g ra m m in g M odels U sing the S im plex A lg o rith m *
M a x A g ü e r o 1 and S t a f f o f t h e ICLARM /ECLAC2Project on Socioeconomic Valuation o f Coastal Resources o f Southwestern Latin America
AGÜERO, M. and staff o f the ICLARM/ECLAC Project on Socioeconomic Valuation of Coastal Resources of Southwestern Latin America. 1996. O PU S: an interactive software for solving linear programming model using the simplex algorithm, p. 87-99. In A. Cruz-Trinidad (ed.) Valuation of tropical coastal resources: theory and application o f linear programming. 1CLARM Stud. Rev. 25, 108 p.
A b s tra c t
This document introduces the OPUS software conceptualized and developed under the ICLARM/ECLAC Project on Socioeconomic Valuation of Coastal Resources o f Southwestern Latin America from 1990 to 1992. The softw are is designed and developed for use with IBM PC or its compatibles. The routines in the software are structured to assist scientists working on coastal resources valuation through linear programming models.
In tro d u c tio n
OPUS’ menus serve as a guide to the different procedures and functions o f the program. These facilities, as an example, allow you to:
• manage and maintain the data files efficiently;• select data entry (tableau in a matrix format);• select the working language (English or
Spanish; English is the default); and• sort the data based on geographic areas.The program was developed using the “Revised
Simplex” algorithm, for solving large models.
87
OPUS Structure
OPUS has two main modules, Data Manager and Solution Algorithm . Data Manager enables management of the data and controls the execution of the model. It also generates the interface between the users and the Solution Algorithm.
The second m odule, Solution A lgorithm , solves the model using the “Revised Sim plex” algorithm.
This section gives a general description of the program and defines the symbols and conventions followed or used in the OPUS software and this manual.
What Is OPUS?
OPUS is an interactive and user-friendly linear programming software. Its design philosophy is intended for users with little experience in microcomputers. Depending on the need of the user, OPUS offers a set of facilities for file management and for configuring the program’s working environment. The other contributions in this volume should be consulted for the theory behind this approach and examples of practical applications.
"TCLARM Contribution No. 1221.'In ternational C enter for S ustainable Ecological D evelopm ent
(ICSED), Casilla 27004, Santiago, Chile.2United Nations Economic Commission for Latin America and the
Caribbean (ECLAC), Casilla 179-D, Santiago, Chile.
Symbols and Conventions
The following symbols and conventions are used or followed throughout this manual:
•I ' 1This box emphasizes important messages of
command or set of instructions.
• BOLD WORDS This is used to highlight terms in this manual.
S o ftw are In s ta lla tio n
This section lists the hardware and software required to install OPUS. It describes the contents of the diskettes including configuration parameters and installation procedure.

System Requirements
OPUS was designed to run on the IBM PC (DOS ver. 3.0 or later) and its compatibles. The following is the minimum system configuration:
• 640 K-bytes of RAM memory;• 1 Floppy Disk drive (only for installation);• 1 Hard Disk drive;• Color or Monochromatic monitor; and• 1 Printer.
88
OPUS cannot run from floppy disks. It is essential to install the program in a hard disk.
Installation Procedure
An installation routine is included in the distribution disk to install properly the software to a hard disk. Installation involves a set of procedures described below.
Insert the Disk in a floppy drive and enter the following command:
INSTALL destination drive:>
To complete the installation, the AUTOEXEC.BAT file will have to be edited to include the following command lines:
P A T H = C :\ installation directory
S E T O P L 'S=C :\ installation directory
Finally, you must reboot the system to record the new commands.
Installation Test
Once you have completed the installation, the following steps can be used to test that installation was successfully completed.
1st. Run OPUS from DOS prompt.
C:\OPHS01 <enter>
OPUS will display its identification screen (Fig. 1).
Press any key to exit from this logotype screen and get into the Main Menu.
2nd. Once you are inside the OPUS Main Menu, select the test file MANGLAR.
3rd. From the Parameters screen, press <F4> to activate the data entry/edit procedure (tableau).
4th. Once you are in the data tableau, run the program with <F3> and then see the outputs.
0 P U S / P c Linear Programming Systcn
Uersion 1.0
^ ■Econom ic C o n n is s io n f o r L a t in A m erica and t h e C arib b ean
I n t e r n a t i o n a l C e n te r f u r L iv in g A q u a tic R e so u r c e s Management
P .O . Box 179 -D S a n t ia g o . CHILE P hone: <5G 2> 2 0 85051 C a b le : UNATIONS T e le x : 4 4 1 0 5 4 <ITT>
Fig. I. OPUS introductory screen.

895 th . Press <F10> several times to go to the
preceding level screens, to complete a run o f all of the routines in OPUS.
If the system does not respond correctly, proceed as follows:
1) Make sure that the AUTOEXEC.BAT file has the correct path given in the installation.
2) Make sure that you have enough memory (640K).
3) Reduce the parameter definitions in the P A T H and S E T com m ands in the C O N FIG .SY S file.
4) M ake sure that in the in sta lla tio n directory o f OPUS, all the fo llow ing files exist:
Using the Software
OPUS.EXE LPNEW 006.EXE SWAPCTRL.EXE LSORT.EXE PL_MESSA.ENG PL_MESSA.SPN PL_HELPR.ENG PL_HELPR.SPN MANGLAR.*
(System manager) (SIMPLEX algorithm) (Swap routine)(Sort procedure)(English messages) (Spanish messages)(Help in English)(Help in Spanish)(Data files to test installation)
File Organization
In order to facilitate file management, it is advisable to create the directories to store data at DOS level (please refer to the DOS manual for details on how to create subdirectories). Moreover, it is recommended that you update the information contained in the working directories used by OPUS as often as possible. It is important to delete all files that are not used and backup all the standing files. If you want to delete files, you may do it automatically from the program’s M ain M enu but if you want to make backup files, use the DOS COPY or BACKUP commands.
Screens and Messages
One of the main characteristics of OPUS is the common screen format used throughout for the user interface so as not to distract and to avoid confusion in using the program.
OPUS has two kinds of messages, help messages and e rro r m essages. The former is activated by pressing <F1> and provides information and guidance on the use of the different commands and functions of the program (Fig. 2). The Help feature can be invoked while using the following routines: file management,
orus /pc LINEAH PROGRAMMING SYSTEM R iilcr.l o r C a t. h Ne w F i 1 e
DATE:«ijz'31/1V 9S OPUS/-PC
E:\OPUS0i
U sin g arrow k e y s , s e l e c t an e x i s t i i f i l e and p r e s s <ENTER>.
P r e s s <F4> and e n t e r th e b a s ic in fo r n i t i o n ab ou t t h i s new f i l e . O p tio n a l! you can c r e a t e a cop y o f an e x i s t i i f i l e .
U sin g arrow k e y s , e r a s e and p r e s s <
P r e s s <FS> and e n t e r th e f u l l p a th nai
Fig. 2. Sample help window.

parametrization, data entry and editing. The error messages are automatically activated every time an invalid operation is encountered or invalid data are entered.
Both kinds of messages are shown in the same screen where it was activated or where the error appeared. The help messages are displayed in a window while the error messages appear on the 23rd line of the screen (on top of the Options Menu). To deactivate a message, press <ESC>.
Main Menu
The M ain menu contains a set o f f ile management functions and utilities to configure the program’s working environment. In the upper portion of the window, the names of the existing data files in the selected directory are shown, while file creation/identification is done in the lower window (see Fig. 3).
File management includes creation, copying and deleting. The program configuation allows the user to select the working language (English or Spanish) and define data directories.
• To create a new data file (NewFile). Press <F4>, and the following data/information requirements appear:
• New file (nam e): Use a combination of up to eight alphanumeric characters based on the
90format conditions of the file names managed by the MS-DOS Operating System.
• Base file (copy from ): To create a copy of an existing file, enter the name of this file then press <F2>.
• Comments: To make your file identification easier, provide some kind of comments referring to the model/application you want to make with the data.
Once you have entered everything, press <F2> to proceed and record the data or press <Esc> to Cancel. These comments are displayed in the lower part of the window.
• To select any existing data file, look for its name in the list of Existing Files, set the cursor on top of it using the arrow keys, and then press <Enter> to complete the selection and the screen for S03 - parameters is displayed (see section PARAMETERS for further information).
• To delete a data file (Erase), set the cursor on top of the name using the arrow keys and then press <F3>. Once you have done this, OPUS will ask you to confirm the operation.
• If you want to access your files from a particular directory (Dir), press <F5> and then enter the pathname of the directory (refer to DOS manual for more information about directories and pathnames).
OPUS/PC LINEAR PROGRAMMING SYSTEM S e le c t o r C rea te New F i l e
F l-H e lp F 3 -E ra se F 4-N ew F lle F S -D lr F8—Lang F 1 0 -E x it
Fig. 3. File selection screen.

91OPUS/PC L1NI.DK FKOCKnnniNC SYSTEM D fiT E :0 5 /3 i/1 9 9 5
S e le c t o r C rea te New F i l e OPUS/PC
C re a te f i l eName : __________ Copy from :Comments :
Fig. 4. Language selection screen.
• OPUS can operate in two languages, English or Spanish. To select the language interface, press <F8> and then choose the language using the arrow keys (see Fig. 4). Press <Enter> once you have selected or <Esc> if you want to keep the language selected before.
• To terminate OPUS and exit to DOS, press <F10>. To temporarily exit to the DOS environment, press <F9>. On a temporary exit to DOS, once you have finished working in DOS, enter ‘E X IT ’ from the DOS prompt to return to the OPUS environment.
Parameter Setting
This routine allows you to:• select the kind of optimization that will be carried
out with the data;• fix the control points to ran the program; and• define data ranges for calibration.The required data for this screen are as follows
(see Fig. 5):• To begin the maximization process, type MAX,
otherwise type MIN. Press <Enter> to go to the next field, or move with the arrow keys.
• To select the number of restrictive equations (rows) that your model will have, press <Enter> to go to the next field and replace with new inputs or move with the arrow keys.
• To select the number of variables of the model, less the slack and artificial variables, press <Enter> to replace new inputs or move with the arrow keys.
Data Entry/Edit
The data entry/edit routine allows the configuration of the tableau in a matrix form. The screen format used for this purpose is shown in Fig. 6 and the main components are as follows:
1. Heading: On the first two lines of the screen, OPUS shows the file identification and the objective,i.e., minimize or maximize. The data that may be entered/edited here are:
• Data filename• Kind of process (maximize or minimize)• Number of constraints in the tableau• Number of variables (without considering slack
and artificial variables)• Active edition sector in the tableau (objective
function, constraints coefficients and the right-hand side of the constraints)
• Cursor position in the tableau2. Data tableau: OPUS uses its own coordinate
system. It utilizes the columns identified through a sequence of alphabetic characters that are located immediately under the screen heading. The constraints are enumerated at the left side of the tableau.
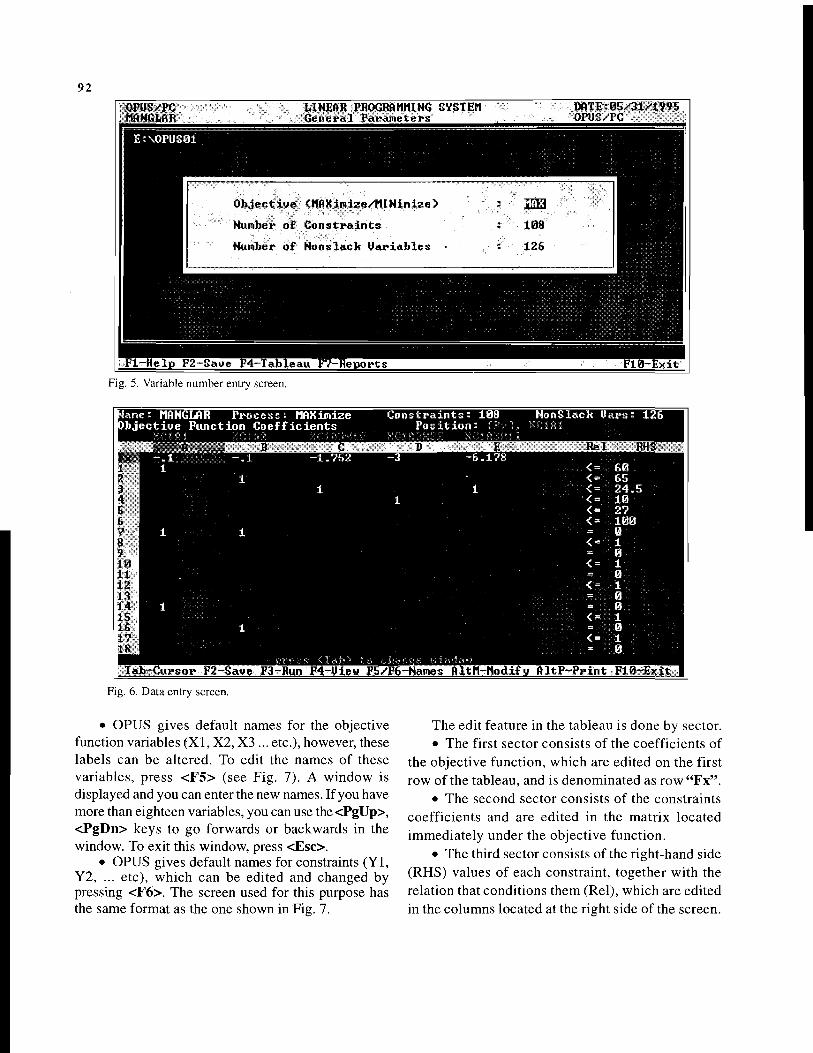
92
Fig. 5. Variable number entry screen.
Wane: MANGLAR P r o c e s s : MAXinize C o n s tr a in t s : 108 N onS lack U a r s : 126 1¡O b je c t iv e F u n c tio n C o e f f i c i e n t s P o s i t i o n : : . ; >s1 '■ ' ! O 1 x i"z 1 >■! 'A .\ £ 1 'ú 1 ' 1► ..........m u * M C D 1: R el RIISFx m m wm ÊÊÊÊm - .1 -1 .7 5 2 -3 -6 .178■ I 1 < = 60m i < = 6Sm i 1 < = 24.5m 1 < = 10m < = 27
< = 100i 1 i = 0
< = 1= 0
01 < = 1f [IB = 0
IB < = 1' 01 = 0' m i m : 0* | j j <= 11 jjÊ i = 0
<= 1m
o clici.fvie wip do Vfsa 0
T ab -C u rsor F 2 - S ave F3-Run F 4-U iew F5/F6-N am es A ltM -M odify A lt P - P r in t F I0-Ex i t 1
Fig. 6. Data entry screen.
• OPUS gives default names for the objective function variables (XI, X2, X3 ... etc.), however, these labels can be altered. To edit the names of these variables, press <F5> (see Fig. 7). A window is displayed and you can enter the new names. If you have more than eighteen variables, you can use the <PgUp>, <PgDn> keys to go forwards or backwards in the window. To exit this window, press <Esc>.
• OPUS gives default names for constraints (Y1, Y2, ... etc), which can be edited and changed by pressing <F6>. The screen used for this purpose has the same format as the one shown in Fig. 7.
The edit feature in the tableau is done by sector.• The first sector consists of the coefficients of
the objective function, which are edited on the first row of the tableau, and is denominated as row “Fx” .
• The second sector consists of the constraints coefficients and are edited in the matrix located immediately under the objective function.
• The third sector consists of the right-hand side (RHS) values of each constraint, together with the relation that conditions them (Rel), which are edited in the columns located at the right side of the screen.

93P1™ - MANGLAR P r o c e s s : MAXinize C o n s t r a in t s : 108 N onS lack U ars: 126 1
i U.tr i .ili It: n,trmv;f
P o s i t io n : t ■ C.,1. N1.
XI = C D E Re 1 RHSV X2 = XC1A2 -3 - 6 .1 7 81 X3 - XC1A3N1E < = 602 X4 = XC1A3N2E < = 653 X5 = XC1A3N1I 1 < = 2 4 .54 X6 = XC1A3N21 1 < = 105 XV - XC1A4N1I < = 2?6 X8 - XC1A4N2I < = 1007 X9 = C1A12N1 = 08 X10 - C1A12N2 < = 19 X li = C1A12N3 = 01 X12 = C1A12N4 < = 11 X13 = C1A1N1 = 01 X14 = C1A1N2 < = 11 X15 = C1A1N3 = 01 X16 - C1A1N4 = 0* X17 = C1A2N1 < = 11 X18 = C1A2N2 = 01 < = 11■
S c r o l l E s c -E x it — 0
Fig. 7. Variable name entry screen.
To move within the tableau, use the <Tab> key and arrow keys.
3. Functions menu: The functions menu provides alternatives and facilities to execute the process.
• To save your data in the data directory, press <F2>. While the data are being saved, a message appears at the right corner of the screen which indicates this.
• To execute the process, press <F3>. Processing time depends on the size of data and speed of computer. Hence, it is advisable to first save the data (see below) before pressing <F3> (see Fig. 8).
• To see the results of a previous execution (View), press <F4>. This operation displays the outputs of a process, if any.
4. Multiplying data: To change the values of the objective function and/or the constraint’s coefficients, and/or the right-hand side in a proportional way, i.e., m ultiplying each group by a constant, press <Alt>+<M> and a window will be displayed for you to enter the options (see Fig. 9). If you enter an option, the program prompts for the ranges and for the multiplicative factor. Press <F2> to proceed or <Esc> to Exit.
arne : MANGLAR P r o c e s s : MAXinize b j e c t i o e F u n c tio n C o e f f i c i e n t s
C o n s tr a in t s : 108 P o s i t io n :
N onS lack U a r s: 126
P r o c e s s in
< = 60< = 65<=- 2 4 .5< = 10< = 27<- 100= 0< = 1= 0< = 1= 0< = 1= 0= 0< = 1= 0< = 1= 0
Fig. 8. Process status window.

5. Exiting: To exit the data tableau and go to the previous screen, press <F10>.
Printing
• DataTo print the information contained in a data tableau
(Print), press <Alt>+<P>. This function will activate
94
Fig. 9. Multiply data menu.
the menu that will allow you to use one of print options (see Fig. 10):
1. Print the variables and coefficients of the objective function. For that, you have to enter the range you want to print, or use the range given by default if you want to print the objective function completely.
2. Print the constraint coefficients and, optionally, print the objective function coefficients and the right side of the tableau.
To print part of the coefficients matrix, enter the coordinates of the upper left corner and the lower right corner.
3. Print only the values of the right-hand side of the tableau and its relational operators. In case the printer is not enabled, an error message is displayed.
Press <F2> to proceed or <Esc> to Exit
• ReportsBefore you enter the tableau and run the process,
you can select the listings with the results. To do that, press <F7> and a window with a different set of options is displayed.
The screen that displays the final results has the following options:
Selecting the options : To select the results of the process, the following may be followed:
1st. Set the cursor on top of the kind of result you want to obtain.
2nd. Mark this result pressing <Space>3rd. Repeat steps one and two to select the results
of interest.To complete the selection procedure, press <F2>.Exit results menu: To exit the results selection
screen, press <Esc>.
Outputs
OPUS can generate a set of reports from the final results of the process. As an option, OPUS generates a report with the partial results in each iteration that you specify.
ante : MANGLAR P r o c e s s : MAXinize O b je c t iv e F u n c tio n C o e f f i c i e n t s
C o n s tra in ts : 108P o s i t i o n : :
NonSlack U a rs : 126
Re I RHS

• Final resultsThe report with the final results that you selected is
shown in a special screen which provides a set of options that, among other things, allows you to print selected results (Fig. 11).
• OPUS allows you to print results selectively. To do that, a special menu is displayed that is activated by pressing the<F7>key. This function allows you to select from a menu (see Fig. 13), the kinds of results you want and the variable range to print, menu.
95
Fig. 10. Data printing menu.
• To move from one place to another in the • To activate the results printing process, pressresults report (Fig. 12), use the <PgUp>, <PgDn>, <^ >’ . . . .» T o exit this screen and go back to the previousand arrow keys. one, press <F10>, otherwise press <Esc>.
OPUS/PC MANGLAR
LINEAR PROGRAMMING SVSTEM G e n e ra l P aram eters
E:\OPUS0i
DATE:0 6 /0 1 /1 9 9 5 OPUS/PC
PRIMAL UALUES DUAL UALUESRMS RANGES COST RANGES
Output Menu 'The solution to the l i n e a r program The s o l u t i o n to the dual :Ranges for e l e m e n t s of the RHS column ;i Ranges for elements of the o b j e c t i v e row
Fig. 11. Output menu.

96Nane: MANGLAR P r o c e s s : MAXimize C o n s t r a in t s : 108
_ ^ ^ _ ^ ^ ^ _ O u t j£ U tP r o b Ie ir i_ J > o lu t io n _ _ _ i_N onS lack U a rs: 126
MANGLAR
U a r ia b le
O p tin iz e d U alu e:PRIMAL PROBLEM SOLUTION
S ta t u s
5 4 3 .4 0 3 8 7 0
L e v e l
S o lu t io n i s MAXIMU 5/31/199$
XC1A1XC1A2XC1A3N1EXC1A3N2EXC1A3N1IXC1A3N2IXC1A4N1IXC1A4N2IC1A12N1C1A12N2C1A12N3C1A12N4C1A1N1C1A1N2
B a s isB a s isN o n b a sisN o n b a sisB a s isN o n b a sisB a s isN o n b a sisB a s isNonbas i sB a s isB a s isB a s isN o n b a sis
10.00000.00000.00000.0000
2 4 .5 0 0 00.0000
2 7 .0 0 0 00.00001.00000.00000.00000.00001.00000.0000
- 0.1000- 0.1000- 1 .7 5 2 0- 3 .0 0 0 0- 6 .1 7 8 0
- 10.0000- 6 .4 7 8 0
- 10.0000- 0 .0 8 0 0- 0 .7 2 0 0- 2 .8 8 0 0
-1 1 .5 2 0 0- 0 .5 0 0 0- 1 .2 5 0 0
t-I«--»-Scroll PgUp/PgDn-ScrMou F 7 ~ S et0 u t F 8 ~ P r in t F I 0 - E x it IFig. 12. S o lu tio n o u tp u t screen .
Name: MANGLAR P r o c e s s : MAXimize C o n s t r a in t s : 108 O utput Problem S o lu t io n
N onS lack U ars: 126
Fig. 13. O u tp u t sta tu s m enu.
A cknow ledgem en ts R eference
™ ■ r t / '- 't A n n * T -i- Pauly, D. 1993. D ata-rich books. B ioScience 43(3): 167-168.1 he assistance ot 1CLARM programmers, bn Garnace and Felimon C. Gayanilo, Jr. as well as the supervision from Daniel Pauly are acknowledged gratefully.

Appendix 1. Documentation of LP tableaus.
In the tradition of data-rich books (Pauly 1993), this appendix is written for users who may want to test, verify and update the data used in the linear programming tableaus (Araneda et al., this vol.; Bell and Cruz-Trinidad, this vol.; Cruz-Trinidad et al., this vol.; and Cruz-Trinidad and Garces, this vol.).
The files used in these application papers are available in spreadsheet format. Files Bio.wbl and Fabio.wbl. having been validated using LP88, are available in LP format. Files L inga.w bl and Sanmig.wbl have been validated using the LP routine of a commercial spreadsheet package.
All files can be accessed and processed in OPUS software or any other LP program that is available.
File Name File Size (KB)1. Fabio.wbl 31,2002. Bio.wbl 115,6523. Linga.wbl 6,7364. Sanmig.wbl 34,264
Appendix 2. Glossary of technical terms.
a r tif ic ia l m arket - a market that could be constructed for experimental purposes, to determine consumer willingness to pay for a good or service. For example, a home water purifier kit might be marketed at various price levels or access to a game reserve might be offered on the basis of different admission fees, thereby facilitating the estimation of the value placed by individuals on water purity or on the use of recreational facility, respectively.
backup - security copy for effective recovery in the event of loss of service from some other resource.
balance equations - constraint equations used in the stepwise linearization process.
basic so lu tion - augmented corner-point (infeasible) solution.
bequest value - value that people derive from knowing that others (perhaps their own offspring) will be able to benefit from the resource in the future (also heritage or preservation value).
coefficient - constant value for variables in the various equations and/or objective function.
collusion - agreement between firms to cooperate to avoid mutually damaging rivalry which may involve informal or tacit agreement, arising, for instance, from
the pooling of information, to formal arrangement within cartel organizations where sanctions are imposed on defectors.
con stra in ed m axim iza tion approach - the maximization of an objective function where the choice variables are subject to some constraints.
constraints - restrictions to which the objective function is subjected; usually a mathematical relationship between the choice variables of an optimization problem, in which some function of the variable (e.g., a linear function) is not equal to a constant. An example is a budget constraint on the maximization of utility.
contingent valuation - a nonmarket valuation technique which tries to obtain information on consumers’ preferences by posing direct questions about willingness to pay. What is sought are personal valuations of the respondent for increases or decreases in the quantity of some good, contingent upon a hypothetical market.
data files - set of stored data, containing the inputs given by the users, grouped together under a unique file name.
defensive expenditure - one approach in eliciting willingness to pay based on direct effects valued on conventional markets. Individuals, firms, and governments undertake a variety o f “defensive expenditures” in order to avoid or reduce unwanted environmental effects. Environmental damages are often difficult to assess, but information on defensive expenditures may be available or can be obtained at lesser cost than direct valuations of the environmental good in question. Such actual expenditures can then be interpreted as a minimum valuation of benefits.
dual - the minimization associated with each linear programming problem in standard form, i.e., mathematically,
given LP1: Max c'xsuch that Ax < b
x > 0then the LP given by
LP2: Min b'y
such that A‘y > c y > 0
is called the dual of LP1 and LP1 is called the primal.
elasticity - a measure of the percentage change in one variable with respect to a percentage change in another variable. Measures of elasticity tend to be
97

carried out for very small changes in the variable causing the response (e.g., a percentage change in quantity due to a very small change in price).
existence value - the perceived value of an environmental asset unrelated either to current or optional use; that is, simply because the resource exists.
externality - externalities are variously known as external effects, external economies and diseconomies, spillovers and neighborhood effects. Externalities exist when the production or consumption of a good or service by one economic unit has a direct effort on the welfare of producers or consumers from another unit.
future value - the value in the future of an amount to be received or paid in the current period. This is determined by multiplying the present value of income by the discount factor 1 -*■ (1 + i)n.
game theory models - models using a theory of individual rational decisions under conditions of less than full information concerning the outcomes of those decisions. The theory examines the interaction of individual decisions given certain assumptions concerning decisions made under risk, the general environment, and the cooperative or uncooperative behavior of other individuals.
indirect use value - value of an ecosystem in the provision of a number of biological life support functions that are generally public goods (e.g., coral reefs provide biological support in the form of nutrients and habitat for coral fisheries, and coastline protection functions).
input-output models - models utilizing a method of analysis in which the economy is represented by a set of linear production functions, describing the interrelationships between all sectors.
lin ear p rogram m in g - a technique for the formalization and analysis of constrained optimization problems in which the objective function is a linear function, and is to be maximized or minimized subject to a number of linear inequality constraints.
market failure - the inability of a system of private markets to provide certain goods at the most desirable or ‘optimal’ levels. In general, market failures arise because of 1) nonexcludability; and/or 2) nonrival consumption of a good. Nonexcludability means that individuals who have not paid for a good cannot be prevented from enjoying its benefits. A good is nonrival if its consumption by one person does not preclude its
98enjoyment by anyone else.
monopoly - in the strictest sense of the term, a firm is a monopoly if it is the only supplier of a hom ogeneous product for which there are no substitutes and many buyers.
multiperiod linear programming - activities are repeated in a number of periods and constraints are progressively modified over time so that the optimal solution within periods varies.
nonlinear programming - in contrast to linear programming, this involves an optimization framework that can handle nonlinear objective functions as well as nonlinear inequality constraints.
nonuse value - value attributed to a resource for its use by future generations (bequest value), its future direct and indirect use by present generations (option and quasi-option value), and its present utility because of the knowledge of its existence (existence value).
objective fu n ction - a function relating the objective (the variable to be optimized) to the choice variable in an optimization problem.
option value - the value of a resource based on how much individuals are willing to pay today for the option of preserving the asset for future (personal) direct and indirect use.
perfect competition - a market structure is perfectly competitive if the following conditions hold: 1) a large number of buyers and sellers; 2) homogenous products;3) availability of perfect information; and 4) free entry.
pivot element - coefficient located in the intersection of the entering basic variable and the leaving basic variable.
primal - (see dual).property value - also referred to as a “hedonic
price” technique, the property value method is based on the general land value approach. The objective is to determine the im plicit prices o f certain characteristics of properties. In the environmental area, for instance, the aim of the method is to place a value on the benefits of environmental quality improvements, or to estimate the costs of a deterioration (for example, the effects of air pollution in certain areas).
pure profit - a residual sum left over when we have subtracted from the revenue generated by some activity all of the opportunity costs of production, the normal profit required to keep the producer in business.

reduced cost/return - feasible range given to the cost/return variables in the optimization process.
replacement cost - under this approach, the costs that would have to be incurred in order to replace a damaged asset are estimated. The estimate is not a measure of benefit of avoiding the damage in the first place, since the damage costs may be higher or lower than the replacement cost. However, it is an appropriate technique if there is some compelling reason as to why the damage should be restored, or certainty that this will occur.
right-hand side (RHS) - constant value located at the right-hand side of the equation (constraint).
sensitiv ity analysis - involves changing the parameters of a decision problem and studying how this affects the outcome. It is particularly associated with cost-benefit analysis, where the most common form is the use of alternative discount rates. The purpose of the analysis is to identify the important assumptions upon which the analysis is based - those to which the outcome is sensitive.
shadow price - an imputed valuation o f a commodity or service which has no market price. Shadow prices are used in cost-benefit analysis and in the application of mathematical programming to a planned economy. They represent the opportunity cost of producing or consuming a commodity which is generally not traded in the economy. Even in a market economy certain outputs such as health, education, and environmental quality do not attract a market price. A set of shadow prices representing consumers’ marginal rates of substitution or producers’ marginal rates of transformation between such commodities may be calculated reflecting the marginal costs of production or the marginal value of their use as inputs. To the extent that market prices do not reflect opportunity costs, cost-benefit analysis may substitute shadow prices.
shadow price vector - represents the (maximum) change in value that the objective function can take if an additional unit of a constraining factor is available.
sim plex algorithm - a simplex is a sort of n-dimensional analog of a triangle, with corners that represent extreme points, and the simplex method provides a systematic procedure whereby we can move from one extreme point of the feasible region to
another, till the optimal one is reached.slack variables - variables that are introduced to
convert the functional inequality constraints into equivalent equality constraints.
swap - computational techniques that involve transferring data to another storage media while it is not being used to maximize RAM memory.
tableau - a tabular form to record the essential information in a linear programming problem, namely, the coefficients of the variables, the constants on the right-hand side of the equations, and the basic variables for each equation.
Total Economic Value (TEV) - sum of total use value and nonuse values of the environment when viewed as an asset.
travel cost - the travel cost method measures the benefits produced by recreation sites (parks, lakes, forests, wilderness). A related method can also be used to value “travel time” in projects dealing with fuelwood and water collection.
use value - associated with both direct extractive uses (e.g., of fish, coral) and nonextractive direct uses (e.g., recreation) of the environment as an asset.
virtual disk - a store management system in which a user is able to use the storage resources of a computer without regard to constraints imposed by a limited main store, and the requirements of other applications which may be using the system.
wage difference - this method is based on the theory that in a competitive market the demand for labor equals the value of the marginal product and that the supply of labor varies with working and living conditions in an area. A higher wage is therefore necessary to attract workers to locate in polluted areas or to undertake more risky occupations. Again, as in the case of property value, the wage differential can only be used if the labor market is very competitive.
w illingness to pay (WTP) - a measure of consumer’s surplus, it is the amount a consumer is willing to pay over and above current consumption of a particular good or service.
working directory - directory configured by the user to save swap files, communication files between the data manager module and the solution algorithm module, and output files. The default working directory, if the user does not configure one, is the data directory.
99
1 0 0
Author/Name Index
Agüero, M. vi, viii, 1, 4, 6-7, 9, 20, 31, 52, 56, 59, 68, 76, 83, 86-87
Ahmed, M. viii, 4, 7 Alojado, Z. 1-2, 64, 68-69, 72, 74, 76, 97 Alterman, R. 5, 8 Añonuevo, C. 65, 76 Aquacop 21,31 Araneda, E. viii, 1-2, 13, 32, 97 Arellano, A. viii, 1-2, 13, 32, 97 ASEAN/US CRMP 7 Aylward, B. 10-11,16 Bagarinao, T. 73, 76 Bailey, C. 78, 86 Balsiger, J.W. 4, 8 Barbier, E.B. 10 -11 ,14 ,16 Barton, D.N. 14, 16Bell, F.W. vi, viii, 1-2, 6, 16-17, 56, 83, 97Binudin, C. viiiBishop, R.C. 14, 16Bower, B.T. 4, 8Boyle, K.J. 14, 16Brekke, K. 4, 8BSWM 6 9 ,7 6Buhyoff, G. 14,16Bunpapong, S. 7-8Cacanindin, E. 64, 69, 76Calica, G.B. 83-86Camacho, A S. 73, 76Cargamento, A.G.C. 1 -2, 64, 69, 72, 76, 97Carpenter, K.E. 78, 86Carpenter, R.A. 12, 16Castillo, G. 65 ,7 6Casuga, K.Q. 64. 69, 76Catalan, A. viiiCátelo, R. 65. 76CEPAL 59Chan. H. 65, 76Chou, L.M. 6 -7 ,3 1 ,7 6Chua, T.-E. 1, 6-9, 16, 18, 31, 64, 76-77Cinco, E. 78, 80-83, 86Cintrón, G. 17,31CU R SEN 17,31COREMA 46, 59Corptiz. P.V. 86Costanza, R. 13, 16Cruz, A.V. 68, 76, 86Cruz-Trinidad. A.V. vi, vii, viii, 1-4, 6, 9, 13, 17, 19, 31-32, 56,
64. 73, 76, 78, 83, 87, 97 Cun, M. 19,31 Dalusung, M.L. 81-86 Dannhaeuser. N. 72, 76 de la Cruz, C.R. 72 del Mundo, C M. 78, 86 Dey. M. 86Diaz, J.C. 78. 80-83. 86 Dixon, J.A. 2, 4, 7-8, 12-13, 16
Domingo, F. 64, 68-69, 72, 74, 76Dourojeanni, A. vDow, J.P., Jr. 4, 8Doyle, J.K. 14, 16Edwards, W. 14, 16Espinoza, F. 22, 31Fabunan, A. viiiFallon, L.A. 12, 16Fallon-Scura, L. vi, 9, 16Färber, S.C. 13, 16FEDECAM 27,31Ferrer, E.M. 65, 76Fischhoff, B. 14, 16Flores, X. 7, 9Folke, C. 13,15Fox, P. 6 8 ,76FPVM 27,31Furby, L. 14, 16Garces, L. 1 ,3 -4 ,7 8 ,9 7Garcia, S.M. 9, 16Gamace, E. viii, 96Garrod, D.J. 4, 8Gatchalian, R. 78, 80-83, 86Gayanilo, F.C., Jr. viii, 96Glass, R.J. 14, 16Gonzalez, E. vi, viii, 1, 6, 20, 31, 56, 76, 83Gregory, R. 11, 14, 16Guiang, J.C. 64, 68-69, 72, 74, 76Haywood, K. 2Hazell, B.R. 3, 8Hilbom, B. 14, 16Hill, M. 5, 8Hodgson, G. 13, 16Holling, C. 7-8,31Homa, R. 19-21,31Hufschmidt, M. 4, 8, 14, 16Hundloe, T. 11 ,13 ,16Hupert, D.D. 4, 8Hyman, E.I. 5, 8, 11, 13-14, 16IFOP 36 ,59Ignizio, J.P. 3, 8Ingles, J. 30-31James, D.E. 4, 8Johnson, M. 14, 16Karberger, T. 13,16Keeney, R. 5, 8, 14, 16Kennedy, J.O.S. 4, 8Khoo, H.W. 31 ,76Klemas, V. 17 ,21 ,31Krutilla, J.V. 10,16Laszio, E. 2, 8Lazo, J.K. 14,16Legasto, R.M. 78, 86Lenz-Volland, B. 20,31Leontief, W.W. 4, 8Lim, P.E. 31 ,76

LiPuma, E. 21-22, 30-31 Luna, C. 86 Lutz, E. 12, 16 Manacop, P.R. 78, 86 Manopimoke, S. 12, 16 Marín, C. 19,31 Markandya, D. 14, 16 Marsh, J.B. 16 Martosuboro, P. 7-8, 73, 76 Matessich, R. 2, 8 Maxwell, J. 13, 16 McArthur, H. 86 McCarl, B.A. 4, 8 McClelland, G.H. 14,16 McManus, J. 86McManus, L.T. 7-8, 64-65, 76-77McPadden. C.A. 22,30-31Medina. M. viiiMeister, A.D. 4, 8Meltzoff, S.K. 21-22,30-31Mines, A.N. 64, 76, 78, 86Morales, F. 1-2, 13, 32, 97Moran, D. 9, 16Mueller, J.J. 4, 8Munasinghe, M. 12, 16Muth. R.M. 14, 16Naamin, N. 73, 76NEDA 6 4 .76Newton. C. 9, 16Norton. R.D. 3, 8NSCB 7 4 .7 6NSO 78, 86Padilla, J .E. 4 ,8 ,8 1 ,8 3 -8 6 Palma, A. 68. 72, 76-77 Panayotou, T. 9 ,1 6Pauly, D. vii, viii, 7, 30-31, 59, 68, 77-78, 86, 96-97Paw, J.N. 1.7-8, 1 8 ,3 1 ,6 4 ,6 8 -6 9 ,7 2 ,7 4 ,7 6Pearce, D.W. 9. 14, 16Pido. M.D. 1,8P1DS 72, 77Pomeroy. R. viii, 86Primavera. J.H. 72, 77Raffia, H. 5, 8. 14, 16Randall, A. 5, 8, 13, 16Rettig, B. 14, 16Rillon, N. 64-65, 69, 76Rivera. R.A. 65, 76Robilliard, G. 5, 8Rodriguez, S. 65, 76Rollet. B. 19,31Rothschild, B.J. 4, 8Ruitenbeek, H.J. 13, 16Sadorra. M.S.M. 6-8
Sawyer, D.A. 13, 16 Schaefer, Y. 17,31 Schulze, W.D. 14 ,16 Schuman, H. 14-15 Scott, A. 14, 16Scura, L.F. 1, 8 see also Fallon-Scura, L.Segovia, A. 17, 21, 31Shepherd, J.G. 4, 8Sherman, P.B. 12, 16Sia, Q .P.III 80-81,86Siegel, R.A. 4, 8Signey, L.O. 68, 77Silvestre, G.T. 31, 68, 76-78, 80-83, 86Simpson, A. 78, 86Smith, LR. 78, 81, 86Snedaker, S.C. 21,31Snyder, W. 14, 16Solorzano, C. 20, 31Sorenson, J. 5, 8Spindler, J. 14, 16Spreen, T.H. 4, 8Spurgeon, J.PG . 11, 16Squires, D. 4, 8Stiftei, B. 5, 8, 11, 13, 16Sunderlin, W. viii, 79, 86Supanga, N.C. 81 ,86Terchunian, A. 17 ,21 ,31Torres, F.S.B., Jr. viiiTrinidad, A.C. 86 see also Cruz-Trinidad, ATsukayama, 1. 7, 59Tulay, E. 81, 86Twilley, R. 18,31Ulvila, J. 14,16Umali, A.F. 78, 86United States Fish and Wildlife Service 5, 8Valencia, M.J. 31 ,7 6Velasco, A. 18,31Volland, M. 20,31Walker. K.B. 14, 16Wallace, S.W. 4, 8Warfel, H.E. 78, 86Watkins, J.W. 4, 8Weisbrod, B.A. 10, 16Wellman, J. 14, 16Welsh, M.P. 14, 16White, A.T. 7-8, 86 »Whitehead, J.C. 14, 16Williams, M.J. viii, vWinterfeldt, D. von 14, 16Wong, P.K. 31, 76Yanez-Arancibia, A. 31Yater, F. 81, 86Zamora, P.M. 73, 77

1 0 2
Geographic Index
Africa, subSaharan vi Agoo 64 ,68-69 .71 Alaminos 64, 68-69, 7 1 América Latina 31 ,5 9 America, Latin v. 1, 31
South vi. vii. viii Anda 64 .68 -6 9 .7 1 -7 2 Andean mountain range 32-34 Antuco 32, 44 Arauco 32, 39, 44, 47
-Cañete 32G ulf 32, 33, 36-38, 46
Aringay 64, 69, 7 I Asia vi, 76
Southeast vii. 7, 31, 77 Australia 42 Ban Don Bay 7-8 Bangladesh vi, 4, 7 Bani 64 ,68 -6 9 ,7 1 -7 2 Barents Sea 4 Basud 78, 80 Bauang 64, 68-69, 71 Bayawas River 68 Benguet 68 Bicol region 78 Binmaley 64, 68-69, 71-72 Bintuni Bay 16Bio-Bio viii, 1, 32-34, 41, 46-47, 60-63Boca Sur 39, 47Bolinao 64 .68 -6 9 ,7 1 -7 2Bristol Bay 4Brunei Darussalam 6-7Bulnes 34Bureo 33Caba 64, 69Cabrero 34Cabusao 78, 86Calabanga 78California 42Callaqui 32Camarines Norte 78, 86Camarines Sur 78Caribbean 1Carolina, North 14Carretera Panamericana 34Cato 33Chaimávida 34Chiguallante 45Chiguayante 42Chile vi, vii. viii. 1, 11, 32-33. 34-36, 38, 40-43, 47, 59-63Chillan, Mt. 32-34, 44Chiloé 36Chivilingo 35, 44Cholguán 33Colcura 35, 39, 44. 47Coliumo 37
Concepcion 32-34, 37-38, 42, 44 Bay 45-46
Coquimbo 36 Coronel 38-40, 44 Dagupan 6 4 ,6 6 ,6 8 -6 9 ,7 1 -7 2 Desembocadura 44 Dichato 46 Diguillín 33 Duqueco 33Ecuador vi, vii, viii, 1, 9, 14-15, 17-22, 24-25, 27-31, 36El Blanco 39,47El Morro 39,45-47El Oro Province 21England, New 4Escuadrón 44Esmeraldas 21Europe 11Florida 13Galápagos Islands 36 Germany 44Great Barrier Reef 11,13 Guayaquil 21,31
Golfo de 31G ulf of viii, 1, 9, 14-15, 17-19
Guayas 17-19 ,22 ,24-25 ,27-29 Province 17, 21 River 17
Guimaras Strait 4 Indonesia 7-8, 16, 76 Irian Jaya 16 Isla Mocha 36-38 Isla Rocuant 45-46 Israel 8 Itata 33Johore, South 6-7 La Conchilla 39, 47 La Union 64-65, 68-69, 72, 76 Labrador 64 ,68-69 ,71 Laja 33,45-46
Lake National Park 44 Laraquete 35, 38-39, 44, 47 Larqui 33 Las Escaleras 44 Las Peñas 39, 47 Lebu 37Lenga 35, 39, 44, 47 Lingayen 68-69
Gulf vii, 1, 7-8, 64-65, 67-68, 70-73, 76-77, 86 Lirquen 45-46 Llico 35, 39, 44, 47 Lo Rojas 38-39, 47 Los Angeles 34 Lota 38 -39 ,44 ,47 Luzon 64
Central 68 Northwestern 69

Magallanes, Straits of 36 Malaysia 6-7 Malleco 33 M anabi 20-21 Mangaldan 68 Manila vi, 86
Bay 65 Maule 39, 47 Mercedes 78, 80 Michigan, Lake 14 Mocha 32 Montevideo 31 Mulchén 33 Nahuelbuta Range 32 Nuble 32-33 ,44 Oregon 16 Pacific 76
coast 4, 78, 86 Pagbilao Bay 72 Palawan 13, 72 Palpal 33Pangasinan 64-66, 68-69, 72 Penco 44-45 Peru viPhangnga Bay 7-8Philippines v, vi, vii, 1, 4, 7-8, 13, 64-65, 73, 76-79, 86Playa Blanca 35, 44Pueblo Hundido 39, 47Puerto Coronel 35Puerto de San Vicente 34Punta Lavapie 35, 39, 44, 47Queco 33Quezon Province 72 Quirihue 34 Quiriquina 32
Rahue 33Ramuntcho 35, 44Ranquil 33Recoto 35, 44Rosario 64, 69Samar Sea 77San Antonio 38San Fabian 64, 68-69, 71-72San Fernando 64, 69, 71San Miguel Bay vii, 1, 3-4, 78-86San Pedro 45San Vicente 38-40, 46San Vicente, Bay o f 32-33, 35, 37-38, 44-46Santa Maria Island 32, 37Santiago vi, 59Segara Anakan-Cilacap 7-8Sipocot 78Siruma 78, 80South Java 8Spain 55Sto. Tomas 64, 69, 71 Sual 64 ,68 -69 ,71-72 Talcahuano 32, 38, 40, 44-46 Thailand 7-8 Tinambac 78 Tirua 34Tomé 3 8 ,40 ,45 -46 Tompé 46Tubul 35, 38-39, 44, 47 Tumbes peninsula 32 Ulugan Bay 72 United States 11, 22, 44 Uruguay 31 Vergara 33Visayas, Western 4, 68

104
Species Index
abo 8 1 see croaker(s); pagotpot Acacia caven 62 A canthocybium solandri 60
Acantholatris gayi 60
Acha 60
Aextoxicom punctatum 62 Agujilla 60
Albacora 60
albacore 38, 49-50, 52, 56
Alerce 62algae 3 5 ,3 7 -3 9 ,5 2 - 5 4 ,5 6 -5 8 ,6 1
Algarrobo 62Almeja (taca) 61Alopias vulpinus 60
Amomyrms luma 63
Amomyrtus meli 63
A nadara granáis 19 see m ollusc(s)
Anadara similis 19 see m ollusc(s)
Anadara tuberculosa 19-20 see m ollusc(s) anchoveta 35-37, 39-40, 49-50, 56, 60 see also Engraulis
ringens; anchovy, Peruvian
Peruvian 7, 59
anchovies 80-81 see also dilis anchovy 38. 52
Peruvian 36-37, 53-54, 57-58 see also Engraulis ringens; anchoveta
Anguila 60
Anhfeltia 62 Anhfeltia plicata 62 Anisotremus scapularis 61 Apañado 60
A pogonidae 81
Araucaria 62 araucana 62 Arrayán 63
Atún aleta amarilla 60
Atún aleta larga 60
Atún de ojo grande 60
Aulacomya ater 61
Austrocedrus chilensis 62 Avellano 62
Avicennia 18, 24, 27-29nítida 19 see also m angrove spp. 17 see also m angrove, black
Ayanque 60
Azulejo 60
Bacalao 52, 56
de profundidad 36, 60 see Dissostichus eleginoides; toothfish . Patagonian
Beilschmiedia berteorana 63
Beilschmiedia miersii 63 Bellota de l N orte 63
Bellota de l Sur 63 Blanquillo 60
Baldo 63
Bollán 63
Bonito 38, 60
bream (s) 38, 40
Breca 60 Brótula 60
Caballa 60
caballero 19
Cabinza 60
Cabrilla 60
común 60
Cachurreta 60
Calamar 61
Caldcluvia paniculaía 63
Callinectes toxotes 19 see m olluscs
Callorhinchus callorhinchus 60
Calyptraea trochiformes 6 1 Camarón de roca 6 1
Camarón nailon 36, 61 see also Heterocarpus reedi; shrim p,
C hilean nylon
Cancer coronatus 6 1 Cancer edwardsii 61 Cancer porteri 61
Cancer setosus 6 1 Canelo 62 Caracol locate 61
Caracol tegula 6 1 Caracol trumulco 6 1
C arangidae 81
carp 4
catfish 4
Cazón 60
Centolla 6 1
Centollón 61
cephalopod(s) 81
Cervimunida johni 36, 61 see lobster, yellow ; langostino amarilloChancharro 60
Chanos díanos 68 see m ilkfish
Chasca 61
gruesa 61
Chascón 6 1
Chicorea de mar 62 Chione subrugosa 19 Chlamys patagónica 6 1
Chlamys purpurata 61 Chocha 6 1
Cholga 6 1
Chonclrus canaliculatus 62 Chorito 6 1
Choro zapato 6 1
Choromytilus chorus 61 Chorus giganteus 61
Cihts montti 60
Ciprés de Cordillera 62 Ciprés de Guaitecas 62 clam (s) 27, 37
Clupea bentincki 36, 61 see herring, A raucanian
clupeid(s) 80
Cochayuyo 62 cockle(s) 18, 37 cod 38-39.49 Coelorhynchus spp. 60 Coigue 42. 63
de Chiloe 63 de Magalkmes 63
Coihe 42Cojinoba del none 60 Cojinoba del Sur 60 Cojinoba moteada 60 conch 37Concholepas concholepas 61
condor 11conger, black and gold 40('ongno Colorado 60 Congrio dorado 60Comzrio negro 36, 60 see eel, black cusk-; Genypterus maculatus Conocarpus erectus 19 see mangrove
Corvina 60Corxphaena hippurus 60crab(s) 19-20. 24, 26-27. 29-30, 37-38, 49, 57-58, 80 see also
jaiba; Callinectes wxotes; Portunidae; Ucides spp,
black 49-50 Crassostrea gigas 61 crevalles 81Crinodendron paragua 63croaker(s) 80-81 s e e also abo; pagotpotcrustacean(s) 2. 15. 19,35-37 see also crab(s)
Cnpiocaiya alba 63Culengue 36,61 see also Gari solidaCvnoscion analis 60cvprinid 14 see also Notropis chrysocephalus Dasyphyllum diacanthoides 62 demersals 80 dibs 81 see anchoviesDissostichus eleginoides 36 see bacalao de profundidad;
toothfish, Patagonian Dissostichus eleginoides 60 Dorado 60 Dosidicus tunicata 61 Drepanidae.81 Drimys winteri 62 Dun'ilaea antarctica 62 eagle, bald 11 Echinoderms 35, 62 eel(s) 38 .53-54 .56
black cusk- 36. 38 see also Genypterus maculatus Eleginops niaclovinus 60 elephant fishes,40 Einbotliriuin coccineum 62 Engraulidae 80-81 see anchoviesEngraulis ringens 35, 60 see anchovy, Peruvian; anchoveta Ensis inacha 36, 61 see huepo Eri:o 62 Espino 62Ethnndium maculatum 60 Eucalipto 43 Eucalypto 42
eucalyptus 3 2 ,4 1 ,4 3 ,4 8 ,5 5 -5 6 , 59 Eucalyptus camaldulensis 41 Eucalyptus globulus 41-43, 51 Eucalyptus viminalis 41 Eucryphia cordifolia 63 Euphausia superba 61 Fissurella spp. 61 Fitzroya cupressoides 62 Galeorhinus ziopterus 60 Gamba 61 Gamortega keule 63 Gari solida 36, 61 see culenge Gelidium rex 61 Genypterus blacodes 60 Genypterus chilensis 60Genypterus maculatus 36, 60 see eel, black cusk-; congrio negroG em ina avellana 62Girellops nebulosas 60Glacilaria spp. 62Gobiidae 81Graus nigra. 60grenadier 54, 57-58
Patagonian 37, 52-53, 56 groundfish 4 grouper(s) 38, 68 grunt 38Gymnogongrus furcellatus 61 hairtail(s) 81hake 32, 35-38; 40, 52-54, 56-58 see also Merluccius gayi; merluza,
común common 49-50, 55
Haliporoides diomedeae 61 Helicolenus lengerichi 60 Hemichordate 62 Hemilutjanus macrophthalmos 60 herring 81
Araucanian 36-37 see also Clupea bentincki; sardina común Heterocarpus reedi 36, 61 see Camarón nailon; shrimp, Chilean
nylonhilsa 4Hippoglossina macrops 60 Homalaspis plana 61 Hualo 63huepo 36 see also Ensis macha Huiro 62 Iridaea ciliata 62 Isacia conceptionis 60 Isurus glaucas 60 Jaiba 19, 61 see crab
limón 61 mora 61 peluda 61 reina 61
Jasus frontalis 61 Jeli prieto 19 Jibia 61Jubaea chilensis 62jurel 35, 60 see mackerel, jackKageneckia oblonga 63

106Katsuwonus pelamis 60 Krill 61Kyhosus analogus 60 Labrisomus philipii 61 Laguncularia 18-19 see mangrove
racemosa 20 spp. 17
Langosta de Isla de Pascua 61 Langosta de Juan Fernández 61langostino amarillo 36, 61 see also Cervimunida johni; lobster,
yellowLangostino colorado 36, 61 lobster, red squat; Pleuroncodes
monodon Langostino de los canales 61 Lapas 61 Laurel 63Laurelia philippiana 63 Laurelia sempervirens 63 Lechuha de mar 62 Leiognathidae 80-81 see slipmouths Lenga 63Lenguado de ojos chicos 60 Lenguado de ojos grandes 60 Lepidotus australis 60 Lessonia nigrescens 61 Lingue 62 Liquen gomoso 62 Lisa 19,60 see mullet Lithodes antarticas 61 Lithraea caustica 62 Litre 62 Lleuque 62 lobster(s) 20, 35-36
red squat 36 Pleuroncodes monodon; langostino colorado yellow 36 see also Cervimunida johni
Loco 6 I Loligo gahi 6 1 Lomatia hirsuta 63 Loxechinus albus 62 Luche 62 Luga-luga 62 Luma 63
apiculata 63 Macha. 61 Machuelo 60 mackerel 40, 55, 49-50
Chilean jack 35, 37-38 see also Trachurus murphyi chub 38jack 32, 35-37, 52-54, 56-58 see also Trachurus murphyi
Macrocystis pyrifera 62 Macruronus magellanicus 60 Maitén 62 mangle 19
blanco 19 bobo 19 cholo 19 de pava 19 ateado 19 atucho 19
embra 19 guaner 19 acho 19 ojo 19 salado 19
mangrove 20black 17, 24red 17, 20, 24, 27 see also Rhizophora spp. white 20, 24
Manió de Hojas Cortas 62 Manió de Hojas Largas 62 Manió de Hojas Punzantes 62 Marrajo 60Mastocarpus papillatus 62 Maytenus boaria 62 Megabalanus psittacus 61 Meli 63M erluccius australis 60 Merluccius gayi 32, 36, 60 see hake Merluza 39
común 36, 49, 60 see hake; Merluccius gayi de cola 49-50, 60 de tres aletas 60 del sur 60
M esodesma donacium 61 Micromesistius australis. 60milkfish 3, 64, 68, 72, 74-76 see also Chanos chonos Molle 63mollusc(s) 15, 19, 24, 26, 29, 36-37, 52-54, 56-58, 61, see also
Anadara granáis; Anadara similis; Anadara tuberculosa; Callinectes toxotes; Mytella guayanensis. Ostrea columbiensis
Mugil spp. 60curema 19 see mullet
Mugiloides chilensis 60 Mulata 60mullet 19 see also liza; Mugil curemaMunida subrugosa 61mussel(s) 18, 37-38Mustelus mentu 61Myrceugenia exsucca 63Mytella guayanensis 19 see molluscsMytilus chilensis 61Nanue 60Naranjilla 62Navaja de mar 61Navajuela 36, 61 see Tagelus dombeii ñipa 67, 69, 72 see also Ñipa fruticans Ñipa fruticans 67 Nothqfagus 41
alessandri 63 alpina 41-42, 63 antárctica 63 betuloides 63 dombeyi 41-42, 63 glauca 63 nitida 63 obliqua 41, 63 pumilio 63
Notro 62Notm pis chrysocephalm 14 see also cyprinid Ñirre 63Octopus vulgaris 61 Odonteshes spp. 60 Odontocymbiola magellanica 61 Olivillo 62 Oncorhynchus spp. 60 Ophictus spp. 60 Ostión del norte 61
Ostión del sur 61 Ostra 61
del Pacifico 61 Ostrea chilensis 61 Ostrea columbiensis 19 see molluscs otter 4oyster(s) 18,68pagotpot 81 see croaker(s); aboPalma Chilena 62Palometa 60Pampanito 60Panulirus pascuensis 61Paralabrax humeralis 60Paralichthys microps 60Paralomis granulosa 61Parana signata 60Patagua 63Pejegallo 60Pejeperro 60Pejerrata 60Pejerrey de m ar 60Pejesapo 60Pejezorro 60pelagic(s) 80Pelillo 62Pelu 62penaeid 31
shrimp 17 Penaeidae 80 see shrimp(s), penaeid Penaeus 19 see shrimp Penaeus californiensis 19 Penaeus monodon 31 Penaeus occidentalis 19 Penaeus stylirostris 19, 21, 31 Penaeus vannamei 19, 21, 31 Persea lingue 62 Peto 60 Peumo 63 Peumus boldus 63 Pliorphyra columbina 62 Picoroco 61pilchard. South American 35-37 see also Sardinops sagax Pilgerodendron uriferum 62 Pimelometopon maculatus 60 Pimiento 62
pine 32.41-43,48,52,54-56,59 Pino 42
radiata 41, 43 Pinus radiata 32, 41-42, 48
Piquihue 61 Pitra 63 Piure 62Pleuroncodes monodon 36, 61 see lobster, red squat; langostino
colorado Podocarpus andinas 62 Podocarpus nubigemus 62 Podocarpus salignus 62 Poly prion spp. 60 Portunidae 80 see crab(s) prawn(s) 4, 37
Prionace glauca 60 Pristidae 81 Prolatilus jugularis 60 Prosopis chilensis 62 Prosopis tamarugo 62 Protothaca thaca 61 Pulpo 61Pyura chilensis 62 Qeule 63Quillaja saponaria 62 Quillay 62 Rodal 63 Raja spp. 60 Rauli 63 Rauli beech 42 ray, manta 81 Raya 60 redfish 38 Reineta 60Rhizophora spp. 17-18, 28-29 see also mangrove, red
harrisonii 19 see also mangrove mangle 19-20 see also mangrove racemosa 19 see also mangrove
Rhynchocinetes typus 61 Róbalo 60 Roble 63 Rollizo 60 Roncaeho 60 Rui! 63Salilota australis 60 Salix chilensis 62 Salmo gairdneri 61 Salmo salar 60 Salmo trutta 61 Salmón del Atlántico 60 Salmón del Pacifico 60 salmon, coho 14, 16 salmonid stocks 5 Salvelinus jontinalis 6 1 Sarda chiliensis 60 Sardina 61
común 36, 61 see also Clupea bentincki; herring, Araucanian
española 35 see pilchard, South American; Sardinops
s a g a x
sardine(s) 36-38, 39, 49-50common 38, 40, 49, 52-54Spanish 36, 38, 40, 49-50, 52-54, 56-58

Valuation o f tropical coasta l resources: theory and application of linear programming. A. Cruz-Trinidad, Editor. 1996. ICLARM Stud. Rev. 25, 108 p.
TITLES OF RELATED INTEREST
A model to determine benefits obtainable from the m anagement of riverine fisheries of Bangladesh. M. Ahmed. 1991. ICLARM Tech. Rep. 28, 133 p.
Bioeconomics of the Philippine small pelagics fishery. A. CruzTrinidad, R.S. Pomeroy, P.V. Corpuz and M. Agüero. 1993. ICLARM Tech. Rep. 38, 74 p.
The economics and management of Thai marine fisheries.T. Panayotou and S. Jetanavanich. 1987. ICLARM Stud. Rev. 14, 82 p.
Small-scale fisheries of San Miguel Bay, Philippines: economics of production and marketing. I.R. Smith and A.N. Mines, Editors. 1982. ICLARM Tech. Rep. 8, 143 p.
Integrative framework and methods for coastal area management. T.E. Chua and L.F. Scura, Editors. 1992. ICLARM Conf. Proc. 37, 169 p.
HOW TO ORDER
For book prices and more publication information, please contact:
The Editor ICLARMMCPO Box 2631,0718 Makati City, Philippines Tel. nos. (63-2) 812-8641, 818-0466 ext. 110 Fax no. (63-2) 816-3183 E-mail: [email protected]
Payment should be in US dollars by bankdraft or check (payable to ICLARM) from a US-based bank. We also accept payment through the American Express card.
Visit our home page: http://w w w .cgiar.org/iclarm /

Notro 62Notropis chrysocephalus 14 see also cyprinid Ñirre 63Octopus vulgaris 61 Odonteshes spp. 60 Odontocymbiola magellcmica 61 Olivillo 62 Oncorhynchus spp. 60 Ophictus spp. 60 Ostión del norte 61 Ostión del sur 61 Ostra 61
del Pacifico 61 Ostrea chilensis 61 Ostrea columbiensis 19 see molluscs otter 4oyster(s) 18, 68pagotpot 81 see croaker(s); aboPalma Chilena 62Palometa 60Pampanito 60Panulirus pascuensis 61Paralabrax humeralis 60Paralichthys microps 60Paralomis granulosa 61Parona signata 60Patagua 63Pejegallo 60Pejeperro 60Pejerrata 60Pejerrey de m ar 60Pejesapo 60Pejezorro 60 'pelagic(s) 80Pelillo 62Pelu 62penaeid 31
shrimp 17 Penaeidae 80 see shrimp(s), penaeid Penaeus 19 see shrimp Penaeus californiensis 19 Penaeus monodon 31 Penaeus occidentalis 19 Penaeus stylirostris 19, 21, 31 Penaeus vannamei 19, 21, 31 Persea tingue 62 Peto 60 Peumo 63 Peumus boldus 63 Phorphyra columbina 62 Picoroco 61pilchard, South American 35-37 see also Sardinops sagax Pilgerodendron uriferum 62 Pimelometopon maculatus 60 Pimiento 62pine 32, 41-43, 48, 52, 54-56, 59 Pino 42
radiata 41, 43 Funis radiata 32, 41-42, 48
Piquihue 61 Pitra 63 Piure 62
Pleuroncodes monodon 36, 61 see lobster, red squat; langostino colorado
Podocarpus andinus 62 Podocarpus nubigemus 62 Podocarpus salignus 62 Polyprion spp. 60 Portunidae 80 see crab(s) prawn(s) 4, 37 Prionace glauca 60 Pristidae 81 Prolatilus jugularis 60 Prosopis chilensis 62 Prosopis tamarugo 62 Protothaca thaca 61 Pulpo 61Pyura chilensis 62 Qeule 63Quillaja saponaria 62 Quillay 62 Rodal 63 Raja spp. 60 Rauli 63 Rauli beech 42 ray, manta 81 Raya 60 redfish 38 Reineta 60Rhizophora spp. 17-18, 28-29 see also mangrove, red
harrisonii 19 see also mangrove mangle 19-20 see also mangrove racemosa 19 see also mangrove
Rhynchocinetes typus 61 Róbalo 60 Roble 63 Rollizo 60 Roncacho 60 Ruil 63Salilota australis 60 Salix chilensis 62 Salmo gairdneri 61 Salmo salar 60 Salmo trutta 61 Salmón del Atlántico 60 Salmón del Pacifico 60 salmon, coho 14, 16 salmonid stocks 5 Salve linus fontinalis 61 Sarda chiliensis 60 Sardina 61
común 36, 61 see also Clupea bentincki; herring, Araucanian
española 35 see pilchard, South American; Sardinops sagax
sardine(s) 36-38, 39, 49-50common 38, 40, 49, 52-54Spanish 36, 38, 40, 49-50, 52-54, 56-58
Sardinops sagax 35, 61 see pilchard. South American; sardina española
Sargo 61Sauce Chileno 62Saxegothaea conspicua 62Schinus latifolius 63Schinus molle 62Sciaena spp. 60Sciaenidae 80Scomber japonicus 60Scomberesox saurus 60Scombridae 81Sebustes oculatus 60Sergestidae 80 see shrimp(s), sergestidSerióla mazatlana . 61Serioleha caerulea 60Seriolella porosa 60Seriolella violácea 60shark(s) 81shellfish 39. 49-50shrimp(s) v, 2-3, 9, 11-12, 17-18, 19-24, 26-31, 36-37, 40, 49-50,
52-54, 57-58, 64, 68, 72-76, 80-81 see also Penaeus californiensis; Penaeus occidentalis; Penaeus stylirostris; Penaeus vannamei
Chilean nylon 36 see also Camarón nailon; Heterocarpus reedi
white 21penaeid 20, 80-81 sergestid 79-81 see also Penaeidae tiger 68
Sicyases sanguineus 60 Sierra 61 siganid 68 silverside(s) 38slipmouth(s) 80-81 see also Leiognathidaesnail(s) 37-38snapper(s) 68Solen gaudichaudi 61Sophoru microphylla 62Sphyraenidae 81
108squid(s) 38, 81 Stromateus stellatus 60 swordfish 39, 52-54, 57-58 Synodontidae 81Tagelus dombeii 36, 61 see navajuela Tamarugo 62 Tegula atra 61 Tepa 63Tetraodontidae 81 Thais chocolata 61 Thunnus alalunga 60 Thunnus albacares 60 Thunnus obesus 60 Thyrsites atun 61 Tiaca 63 Tinea 62 Tollo 61 Tomoyo 61 toothfish 54, 57-58
Patagonian 36, 38, 52-53 see also Dissostichus eleginoides
Trachurus murphyi(i) 3 2 ,3 5 ,6 0 .sec mackerel, jack;
mackerel, Chilean jack
Trevo 62
Trichiuridae 81
Trucha arco iris 61 Trucha café 6 1 Trucha de arroyo 61 tuna, bluefin 8 tuna, southern bluefin 4 Uca spp. 19 see crab(s)Ucides spp. 19 see crab(s)Ulmo 63
Ulva lactuca 62
Venus antiqua 61
Vidriola 61
Villarezia mucronata 62
Weinmannia trichosperma 62
whale(s), bowhead 4, 8
Xiphias gladius 60

Valuation of tropical coastal resources: theory and application of linear programming. A. Cruz-Trinidad, Editor. 1996. ICLARM Stud. Rev. 25, 108 p.
TITLES OF RELATED INTEREST
A model to determine benefits obtainable from the m anagement of riverine fisheries of Bangladesh. M. Ahmed. 1991. ICLARM Tech. Rep. 28, 133 p.
Bioeconomics of the Philippine small pelagics fishery. A. CruzTrinidad, R.S. Pomeroy, P.V. Corpuz and M. Agüero. 1993. ICLARM Tech. Rep. 38, 74 p.
The economics and management of Thai marine fisheries.T. Panayotou and S. Jetanavanich. 1987. ICLARM Stud. Rev. 14, 82 p.
Small-scale fisheries of San Miguel Bay, Philippines: economics of production and marketing. I.R. Smith and A.N. Mines, Editors. 1982. ICLARM Tech. Rep. 8, 143 p.
Integrative framework and methods for coastal area management. T.E. Chua and L.F. Scura, Editors. 1992. ICLARM Conf. Proc. 37, 169 p.
HOW TO ORDER
For book prices and more publication information, please contact:
The Editor ICLARMMCPO Box 2631,0718 Makati City, Philippines Tel. nos. (63-2) 812-8641, 818-0466 ext. 110 Fax no. (63-2) 816-3183 E-mail: [email protected]
Payment should be in US dollars by bankdraft or check (payable to ICLARM) from a US-based bank. We also accept payment through the American Express card.
Visit our home page: http://w w w .cgiar.org/iclarm /