theoretical modeling of guided wave propagation in a ... modeling of guided wave propagation in a...
TRANSCRIPT

International Journal of Solids and Structures 49 (2012) 3233–3241
Contents lists available at SciVerse ScienceDirect
International Journal of Solids and Structures
journal homepage: www.elsevier .com/locate / i jsols t r
Theoretical modeling of guided wave propagation in a sandwich plate subjectedto transient surface excitations
Sauvik Banerjee ⇑, Chandrakant B. Pol 1
Civil Engineering Department, Indian Institute of Technology Bombay, Powai, Mumbai 400 076, India
a r t i c l e i n f o a b s t r a c t
Article history:Received 3 January 2012Received in revised form 30 May 2012Available online 31 July 2012
Keywords:Sandwich structureGlobal matrix methodGuided wave modeTransient sourcesWavelet transformation
0020-7683/$ - see front matter � 2012 Elsevier Ltd. Ahttp://dx.doi.org/10.1016/j.ijsolstr.2012.06.022
⇑ Corresponding author. Tel.: +91 22 2576 7343; faE-mail addresses: [email protected] (S. Banerje
Pol).1 Tel: +91 22 2576 7301; fax: +91 22 2576 7302.
A fast and efficient two-dimensional (2D) semi-analytical model based on global matrix method is devel-oped to study the general characteristics of guided wave propagation in a honeycomb composite sand-wich structure (HCSS) subjected to time-dependent transient surface excitations. The HCSS used inthis study has an extremely lightweight and thick nomex honeycomb core, which is sandwiched betweentwo thin graphite woven composite skins. The homogenized material properties of the skin and the coreare considered to be elastic and quasi-isotropic in nature. Far-field time history of surface displacementsare calculated for vertical and horizontal tone-burst surface excitations that are representative of thick-ness and radial mode of vibrations of piezoelectric transducers, respectively. Results are compared withthose obtained from Finite element modeling (FEM) in LS-DYNA showing good agreement. Wavelettransform is then performed on the time-domain signal to obtain the group velocities of the propagatingmodes for their accurate identification on the basis of the theoretical dispersion curve. It is found that theresponse signal is dominated by the first anti-symmetric mode for a vertical excitation, whereas, the sig-nal characteristics are multimodal in nature with dominating higher order symmetric and anti-symmet-ric modes for a horizontal excitation. The model is expected to be helpful for appropriate guided wavemode tuning and rapid analysis of data for experimental detection of disbonds in these novel structures.
� 2012 Elsevier Ltd. All rights reserved.
1. Introduction
‘‘Honeycomb composites’’ are sandwiched structures in whichthin composite skins are bonded with adhesives to the two facesof extremely lightweight and relatively thick metallic honeycombs(Bitzer, 1997). Recently, these novel components are widely usedin many modern applications, especially in aerospace and automo-tive industries with limited applications in civil infrastructure,such as highway bridges and building construction. The sandwichstructures with honeycomb core exhibit unique and advantageousproperties such as high strength-to-weight ratio and high energy-absorption capability, which make them very attractive for impactprotection and mitigation related applications. Unfortunately, thebond between the honeycomb and the skin may degrade withage and service loads leading to separation of the load-bearing skinfrom the honeycomb (called ‘‘disbonds’’) and compromising thesafety of the structure. To overcome the limitations of the conven-tional, costly, and time-consuming off-line non-destructive exam-ination of large area structures, in situ inspection methods, which
ll rights reserved.
x: +91 22 2576 7302.e), [email protected] (C.B.
do not require the disassembly of the structure, have been subjectof recent studies. Guided Lamb wave based methods offers suchpotential for detection of disbonds in sandwich structures (Hayet al., 2003; Diamanti et al., 2005; Baid et al., 2008). Tuning ofappropriate guided wave modes plays an important role for non-destructive evaluation and health monitoring of composite struc-tures using piezoelectric transducers (Maslov and Kundu, 1997;Xu and Giurgiutiu, 2007).
The general features of guided waves that can be transmitted inisotropic and anisotropic plates have been studied in great detailover the past several decades. Approximate thin-plate theories,such as, classical plate theory (C.P.T, under Kirchoff–Love kine-matic assumption) and shear deformation plate theory (S.D.P.T)or Mindlin theory based on a priori ansatz on deformation weredeveloped to obtain the analytical solution to a variety of problemsinvolving the dynamic response of thin isotropic and anisotropiclaminated plates (Achenbach, 1978; Nayfeh, 1995). The exact solu-tion of three-dimensional guided wave problems consisting ofmultilayered, angle-ply laminates of finite thickness and large lat-eral dimensions subjected to various types of transient surfaceloads were presented in Lih and Mal (1996). A detailed discussionon the accuracy of approximate theories for wave field calculationsin composite laminates in comparison to the exact theory wasgiven in Lih and Mal (1995). It was shown that the C.P.T and
3234 S. Banerjee, C.B. Pol / International Journal of Solids and Structures 49 (2012) 3233–3241
S.D.P.T produced desired results when the wavelength was muchlonger than the thickness of the plate, or in other words, the thick-ness-frequency product was very low. In contrast, theoretical mod-els that can accurately capture the behavior of elastodynamic fielddue to high frequency transient sources in sandwich structureswere not considered. Development of robust theoretical modelsis, of course, difficult because the dynamics of sandwich structurescan be quite complicated with different behaviors in different re-gimes of frequency and wavelength.
In an early attempt, an analytical model for wave propagation ina three layered sandwiched structure with different boundary con-ditions was developed (Nilsson, 1990). The governing equationswere derived partly by applying the general field equations (2-Dtheory) to the core and partly, by utilizing the thin plate/beam the-ory (1-D) to the laminates. The dispersion equation for the struc-ture was derived and solved using the winding-integraltechnique. The other higher order models were also developed tostudy dynamic response of sandwich beams (Nosier et al., 1993;Backström and Nilsson, 2006; Sorokin, 2006; Qiao and Yang,2007). However, these models used various a priori kinematicassumptions. A more efficient two-dimensional semi-analyticalmodel based on the Thomson–Haskell method (Castaings and Hos-ten, 2003) has been developed for predicting the dispersion curvesand the through-thickness, displacement, stress and energy flowdistributions of guided modes propagating along sandwich platesmade of anisotropic, viscoelastic material layers. The model is usedto quantify the sensitivity of both the dispersion curves and thethrough-thickness mode shapes to the level of material viscoelas-ticity. Recently, a complete description of the dispersion relationwith no restrictions on frequency and wavelength was providedfor a sandwich structure comprising of isotropic layers (Liu andBhattacharya, 2009). This is accomplished by transforming thewave equation to a Hamiltonian system and then using a transfermatrix approach for solving the Hamiltonian system. However,the above studies were only limited to frequency and wave-num-ber domain and were not extended to the calculations of elastody-namic response due to transient sources.
In another variation, spectral finite element method (SFEM)based on first order laminated theory was used for wave propaga-tion studies in laminated composite plate (Chakraborty and Gopal-krishnan, 2004). Commercially available finite element software,e.g., LS-DYNA, ABAQUS etc. have been used to solve impact andguided wave propagation problems in sandwich structures (Qiaoand Yang, 2007; Song et al., 2009). Although the FEM can handlecomplex geometries and has the capability to accommodate reflec-tions from the lateral boundaries, it is computationally much moreintensive than the analytical methods discussed above.
In this article, a robust 2D semi-analytical model for rapid cal-culations of elastodynamic field due to transient sources on thesurface of a laterally unbounded honeycomb-composite sandwichplate is presented. At the frequencies of interest here, the wave-lengths are larger than the individual cell dimension of the honey-comb core, but can be shorter than the thickness of the core, so thathomogenized material properties can be used for the core. The for-mulation is based on a global matrix method, where the displace-ments and stresses in each layer (skin or core) are ‘exactly’represented in the frequency-wavenumber domain in terms of fourunknown constants in each layer, which are then solved by apply-ing the interface continuity conditions and the stress conditions on
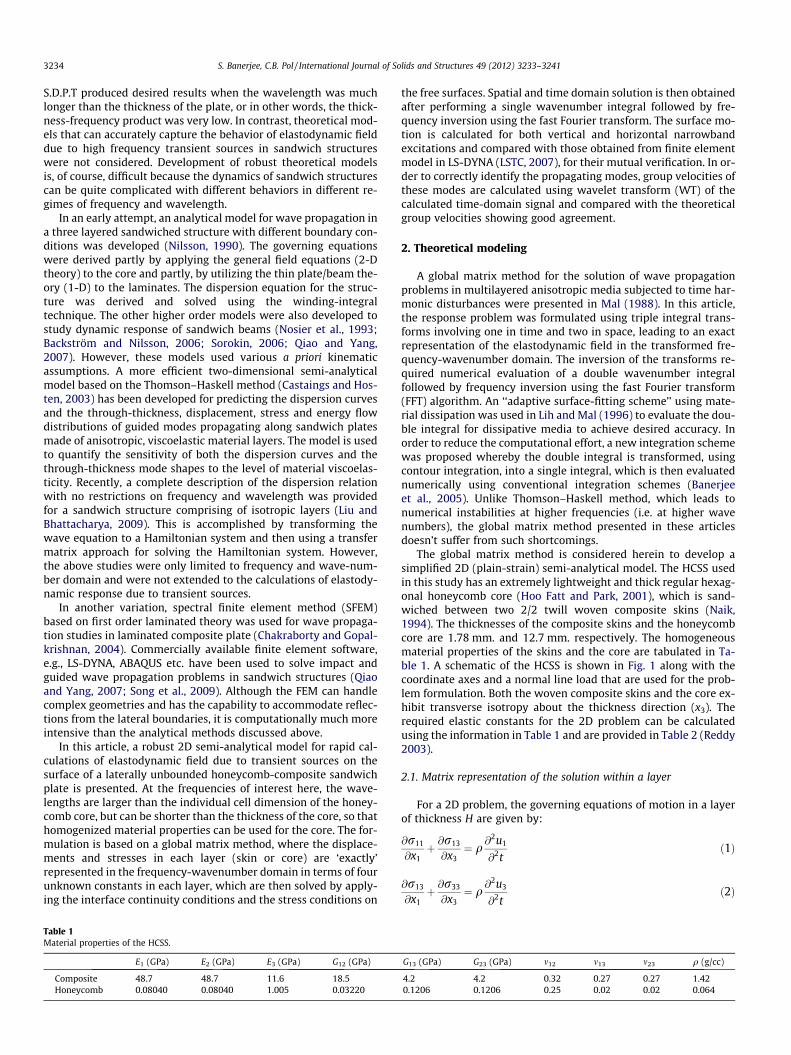
Table 1Material properties of the HCSS.
E1 (GPa) E2 (GPa) E3 (GPa) G12 (GPa)
Composite 48.7 48.7 11.6 18.5Honeycomb 0.08040 0.08040 1.005 0.03220
the free surfaces. Spatial and time domain solution is then obtainedafter performing a single wavenumber integral followed by fre-quency inversion using the fast Fourier transform. The surface mo-tion is calculated for both vertical and horizontal narrowbandexcitations and compared with those obtained from finite elementmodel in LS-DYNA (LSTC, 2007), for their mutual verification. In or-der to correctly identify the propagating modes, group velocities ofthese modes are calculated using wavelet transform (WT) of thecalculated time-domain signal and compared with the theoreticalgroup velocities showing good agreement.
2. Theoretical modeling
A global matrix method for the solution of wave propagationproblems in multilayered anisotropic media subjected to time har-monic disturbances were presented in Mal (1988). In this article,the response problem was formulated using triple integral trans-forms involving one in time and two in space, leading to an exactrepresentation of the elastodynamic field in the transformed fre-quency-wavenumber domain. The inversion of the transforms re-quired numerical evaluation of a double wavenumber integralfollowed by frequency inversion using the fast Fourier transform(FFT) algorithm. An ‘‘adaptive surface-fitting scheme’’ using mate-rial dissipation was used in Lih and Mal (1996) to evaluate the dou-ble integral for dissipative media to achieve desired accuracy. Inorder to reduce the computational effort, a new integration schemewas proposed whereby the double integral is transformed, usingcontour integration, into a single integral, which is then evaluatednumerically using conventional integration schemes (Banerjeeet al., 2005). Unlike Thomson–Haskell method, which leads tonumerical instabilities at higher frequencies (i.e. at higher wavenumbers), the global matrix method presented in these articlesdoesn’t suffer from such shortcomings.
The global matrix method is considered herein to develop asimplified 2D (plain-strain) semi-analytical model. The HCSS usedin this study has an extremely lightweight and thick regular hexag-onal honeycomb core (Hoo Fatt and Park, 2001), which is sand-wiched between two 2/2 twill woven composite skins (Naik,1994). The thicknesses of the composite skins and the honeycombcore are 1.78 mm. and 12.7 mm. respectively. The homogeneousmaterial properties of the skins and the core are tabulated in Ta-ble 1. A schematic of the HCSS is shown in Fig. 1 along with thecoordinate axes and a normal line load that are used for the prob-lem formulation. Both the woven composite skins and the core ex-hibit transverse isotropy about the thickness direction (x3). Therequired elastic constants for the 2D problem can be calculatedusing the information in Table 1 and are provided in Table 2 (Reddy2003).
2.1. Matrix representation of the solution within a layer
For a 2D problem, the governing equations of motion in a layerof thickness H are given by:
@r11
@x1þ @r13
@x3¼ q
@2u1
@2tð1Þ
@r13
@x1þ @r33
@x3¼ q
@2u3
@2tð2Þ
G13 (GPa) G23 (GPa) m12 m13 m23 q (g/cc)
4.2 4.2 0.32 0.27 0.27 1.420.1206 0.1206 0.25 0.02 0.02 0.064

Fig. 1. Schematic representation of the honeycomb composite sandwich structure.
Table 2Elastic material constants of the HCSS.
c11 (GPa) c13 (GPa) c33 (GPa) c55 (GPa)
Composite 56.1830 4.854 12.224 4.20Honeycomb 0.0865 0.0272 1.0186 0.1206
S. Banerjee, C.B. Pol / International Journal of Solids and Structures 49 (2012) 3233–3241 3235
The stress–strain relationships (Hooke’s law) are stated as,
r11
r33
r13
264
375 ¼ c11 c13 0
c13 c33 00 0 c55
264
375 u1;1
u3;3
u1;3 þ u3;1
264
375 ð3Þ
We further assume that the potential functions are related tothe displacement components through:
u1 ¼@/1
@x1; u3 ¼
@/3
@x3ð4Þ
Substituting these displacement fields in the stress–strain rela-tionships in Eq. (3), the governing equations of motion in terms ofpotential functions can be represented in matrix form:
c11@2
@x21þ c55
@2
@x23� q @2
@t2 ðc13 þ c55Þ @2
@x23
ðc13 þ c55Þ @2
@x21
c33@2
@x23þ c55
@2
@x21� q @2
@t2
24
35 /1
/3
� �¼ 0 ð5Þ
We convert the field variables from spatial and time domain tothe frequency and wavenumber domain by performing the follow-ing Fourier transformation:
/ðx1; x3;xÞ ¼Z 1
�1/ðx1; x3; tÞe�ixtdt ð6Þ
and,
/ðn1; n3;xÞ ¼Z 1
�1
Z 1
�1�/ðx1; x3;xÞe�iðn1xþn3xÞdx1 dx3 ð7Þ
Applying Fourier transform on Eq. (5), the equations of motionin frequency and wavenumber domain can be written in matrixform as,
c11n21 þ c55n
23 � qx2 ðc13 þ c55Þn2
3
ðc13 þ c55Þn21 c33n
23 þ c55n
21 � qx2
" #/1
/3
" #¼ 0 ð8Þ
Solution to Eq.(8) is referred to as Eigen value problem. For anon trivial solution of the potential functions, the determinant ofthe 2 � 2 matrix has to be zero, which will give n2
3 as roots (Eigenvalues) as a function of n1. The characteristic equation is given by:
ða1a5Þ|fflfflffl{zfflfflffl}A
n43 þ a2
5 þ a1a2 � a23
� �n2
1 � ða1 þ a5Þx2� �|fflfflfflfflfflfflfflfflfflfflfflfflfflfflfflfflfflfflfflfflfflfflfflfflfflfflfflfflfflfflfflfflffl{zfflfflfflfflfflfflfflfflfflfflfflfflfflfflfflfflfflfflfflfflfflfflfflfflfflfflfflfflfflfflfflfflffl}B
n23
þ a2n21 �x2� �
a5n21 �x2� �� �|fflfflfflfflfflfflfflfflfflfflfflfflfflfflfflfflfflfflfflfflfflfflfflffl{zfflfflfflfflfflfflfflfflfflfflfflfflfflfflfflfflfflfflfflfflfflfflfflffl}
C
¼ 0 ð9Þ
which can be solved to obtain the two roots of n23 as:
b1 ¼�Bþ
ffiffiffiffiffiffiffiffiffiffiffiffiffiffiffiffiffiffiffiffiB2 � 4AC
p2A
and b2 ¼�B�
ffiffiffiffiffiffiffiffiffiffiffiffiffiffiffiffiffiffiffiffiB2 � 4AC
p2A
Thus, the roots of n3 can be defined by the vertical wavenum-bers , g1, g2. The ‘‘vertical’’ wavenumbers gi (i = 1, 2) are subjectto the restriction, Im(gi) P 0, to ensure the outgoing wave condi-tion at infinity and exponential decay of the evanescent waves inthe layers at high frequencies. The next step is to reduce by onedimension the integrals in Eq. (7) using a contour in the complexn3-plane consisting of the real axis together with a large semicirclein the upper half-plane, the contributions from this semicirclebeing vanishingly small (Buchwald, 1961). With this device, theintegration with respect to n3 can be replaced by appropriate con-tributions from the roots on the integrands.
Thus the general solution of the potential function can be writ-ten in matrix form as:
/1
/3
" #¼
q11 q13
q31 q33
� �eig1x3 0
0 eig2x3
" #Aþ1Aþ2
" #
þq11 q13
q31 q33
� �e�ig1x3 0
0 e�ig2x3
" #A�1A�2
� �ð10Þ
Here, qij are the Eigen vectors and are given by:
q11 ¼ b1a3; q13 ¼ b2a3; q31 ¼ x2 � a2n21 � a5b1; q33
¼ x2 � a2n21 � a5b2
where, a1 ¼ c33q ; a2 ¼ c11
q a5 ¼ c55q and a3 ¼ ðc13þc55Þ
q .
The quantities Aþi and A�i (i = 1, 2) are four unknown constants,which control the terms associated with upward and downwardgoing waves as determined by the vertical wavenumbers gi. It istherefore customary to express stresses and displacements in thefrequency and wave number in condensed matrix form as:
u1
u3
r13
r33
26664
37775 ¼ Q 11 Q 12
Q 21 Q 22
� �Eþðx3Þ 0
0 E�ðx3Þ
� �Aþ
A�
" #ð11Þ
where,
Q 11 ¼in1q11 in1q13
ig1q31 ig2q33
� �; Q 12 ¼
in1q11 in1q13
�ig1q31 �ig2q33
� �
Q 21 ¼�c55g1n1ðq11 þ q13Þ �c55g2n1ðq13 þ q33Þ�c13n
21q11 � c33g2
1q31 �c13n21q13 � c33g2
2q33
" #
Q 22 ¼c55g1n1ðq11 þ q13Þ c55g2n1ðq13 þ q33Þ�c13n
21q11 � c33g2
1q31 �c13n21q13 � c33g2
2q33
" #
Aþ
A�
" #¼
Aþ1Aþ2A�1A�2
26664
37775
Eþðx3Þ ¼ diag eig1x3 eig2x3� �
E�ðx3Þ ¼ diag eig1ðH�x3Þ eig2ðH�x3Þ� �
3236 S. Banerjee, C.B. Pol / International Journal of Solids and Structures 49 (2012) 3233–3241
The Eþðx3Þ wave signifies the down going wave while the E�ðx3Þwave signifies the up wards going wave. The unknown constantsmust be solved from the imposed stress and displacement bound-ary conditions for a given problem at the top and bottom surfacesof the layer.
2.2. Global matrix formualation for the sandwich structure
In order to facilitate the application of the appropriate boundaryconditions at the top and bottom surfaces and the interfaces, it isconvenient to introduce the four-dimensional ‘‘stress-displace-ment vector : fSmg,’’ in the transformed domain through
Smðn1; x3;xÞn o
¼ umi rm
i3
�ði ¼ 1;3Þ ð12Þ
where m denotes the layer number.The arguments, n1 and x in fSmg will be omitted for brevity. It
should be noted that in absence of interfacial forces, fSmðx3Þgiscontinuous in the domain, xm�1
3 < x < xm3 and that in the mth layer,
fSmðx3Þg can be expressed in a partitioned matrix product form as
fSmðx3Þg ¼Q m
11 Q m12
Q m21 Q m
22
" #Emþðx3Þ 0
0 Em�ðx3Þ
" #Amþ
Am�
( )¼ ½Q m�½Em�fAmg
ð13Þ
where, Am� are complex constants related to down going and up
going waves within the mth layer, and ½Em� � are the ‘vertical’ propa-
gation vectors:
½EmþðX3Þ� ¼ Diag eig1ðX3�Xm�1
3 Þ eig2ðX3�Xm�13 Þ
h i½Em�ðX3Þ� ¼ Diag eig1ðXm
3 �X3Þ eig2ðXm3 �X3Þ
� � ð14Þ
The 4m constants Am must be determined from the interfaceconditions and the appropriate boundary conditions on the topand bottom surfaces of the plate.
In order to illustrate the solution procedure, we first considerthe case where a time dependent normal point excitation is ap-plied to the top surface of the plate denoted by f ðtÞdðx1 � 0Þ andits double Fourier transform by f ðxÞ. Thus the stress boundaryconditions at the topmost surface and the lowermost free surfaceare given as,
½Q1�½A1� ¼ ½F�; Q 3�½A3� ¼ ½0� ð15aÞð15bÞ
where , ½Q1� ¼ Q121 Q1
22E1�
� �; ½Q3� ¼ Q3
21E3þ Q3
22
h i; ½F� ¼ r13
r33
� �¼
0f
� �In case of horizontal excitation, the force vector is given by:
½F� ¼r13
r33
� �¼ f
0
" #ð16Þ
If there are no disbonds at the two interfaces, the traction anddisplacement components must be continuous across the inter-faces parallel to the X1X2-plane, which gives us:
�uðmÞi ¼ �uðm�1Þi ; �rðmÞi3 ¼ �rðm�1Þ
i3 ; X3 ¼ Xm�13 ðm ¼ 2;3Þ
where, Xm�13 is the location of the interface between the layers m
and m–1. Thus at the first interface i.e. of the layer 1 (skin) and 2(core):
½Q1�½A1� ¼ ½Q2�½A2� ð17Þ
At the second interface i.e. of the layer 2 (core) and 3 (skin):
½Q 02�½A2� ¼ ½Q 3�½A3� ð18Þ
where ,
½Q 1� ¼Q 1
11E1þ Q 1
12
Q 121E1
þ Q 122
" #; ½Q2� ¼
Q 211 Q2
12E2�
Q 221 Q2
22E2�
" #;
½Q 02� ¼Q 2
11E2þ Q 2
12
Q 221E2
þ Q 222
" #; ½Q 3� ¼
Q 311 Q 3
12E3�
Q 321 Q 3
22E3�
" #
Finally, Eqs. 15(a,b), (17) and (18) can be represented in a con-densed global matrix form as:
Q 1 0 0Q 1 �Q 2 00 Q 02 �Q3
0 0 Q 3
266664
377775
12�12
A1
A2
A3
264
375
12�1
¼
F
000
266664
377775
12�1
ð19Þ
The determinant of the 12 � 12 matrix will produce the desireddispersion relation of the form:
Gðn1;xÞ ¼ 0 ð20Þ
For a range of values of x, we can determine the roots as n1 andsubsequently determine the phase velocity c which is given by therelation c ¼ x=n1. The plot of the phase velocity ‘c’, versus the fre-quency x gives the desired dispersion curve. The dispersion curvecan be sought in terms of group velocity ‘cg’, versus the frequencyx through cg ¼ dx
dn1. Group velocity is often referred to as energy
velocity as well. It should be noted that for a fixed frequency, infinitenumber of roots (real and complex) of n1 can be obtained from Eq.(20). The real roots represent the propagating guided waves in theplate, while the complex roots represent non-propagating modesthat decay exponentially with propagation distance from the source.
The unknown constants ½A� are determined using LU decompo-sition of Eq. (19). The vertical surface displacement can thereforebe written in the following form:
u3 ¼Fðn1;xÞGðn1;xÞ
ð21Þ
It is now desired to invert the solution back to the spatial do-main through:
�u3ðx1; x3;xÞ ¼Z 1
�1
Fðn1;xÞGðn1;xÞ
ein1x1 dn1 ð22Þ
The amplitudes of the non-propagating modes become negligi-ble in comparison with the propagating modes at distances fromthe source larger than about only a few multiples of the platethickness (Vasudevan and Mal, 1985). Since this condition is satis-fied in most guided wave applications, the residue contributionsfrom the complex roots can be ignored without significantly affect-ing the accuracy of the results. Thus, the integration in (22) can besolved exactly by applying Cauchy’s residue theorem on the realroots of n1 (nr , where r = 1 to N, N = No. of real roots) as:
�u3ðx1; x3;xÞ ¼ 2piXN
r¼1
Fðnr;xÞGðn1 ;xÞ
dn1
���n1¼nr
einr x1 ð23Þ
Finally, an inverse Fourier transform is performed to obtain theresults in the time domain.
3. Results and discussions
3.1. Dispersion curves
Dispersion curves (frequency vs. group velocity) for the com-posite skin and the sandwich structure are presented in Fig. 2. Asstated earlier, there exist multiple propagating wave modes thatcorrespond to real roots of Eq. (20). Steepest descent method isused to extract these roots (Banerjee et al., 2005). The symmetricmodes are designated S0, S1, S2, etc., while the anti-symmetric

(a)
(b)Fig. 2. Dispersion curve (frequency vs. group velocity) for (a) the composite skinand (b) the HCSS.
S. Banerjee, C.B. Pol / International Journal of Solids and Structures 49 (2012) 3233–3241 3237
are designated A0, A1, A2, etc. (Achenbach, 1978). The dispersioncurve for the skin, which is shown in Fig. 2(a), exhibits two possiblewave modes, namely, first antisymmetric (A0) and first symmetric(S0) modes, for a wide frequency range. In contrary, the dispersioncurve for the sandwich structure shown in Fig. 2(b) exhibits pres-ence of higher order modes (e.g. second antisymmetric (A1), sec-ond symmetric (S1), and so on) after 50 kHz. The vast differencesin the two dispersion curves are mainly governed by the differ-ences in the thickness and the material properties of the respectiveplate. The effect of thickness may be explained in the context ofwell known Rayleigh-Lamb wave dispersion relations in isotropicplates (Achenbach, 1978). At low frequency-thickness (xh) prod-uct, S0 mode is non-dispersive and A0 mode phase velocity variesas
ffiffiffiffiffiffiffixhp
. In the limit of high frequency-thickness (xh), the phasevelocity of both the S0 and A0 modes approach the Rayleigh wavespeed (CR), and all higher order modes approach the shear wavevelocity (CT), which is slightly higher than CR. Thus, for the HCSSboth the A0 and S0 modes quickly attain almost the same speedafter only 50 kHz due to high xh (approximately 0.8 MHz-mm at50 kHz). This is, however, not the case for the plate comprising ofskin alone since its xh remains low (approximately 0.09 MHz-mm at 50 kHz). It should be further noted that the variations inthe material properties of the skin and the core, and the thicknessof the individual layer can affect the dispersion curve (Fig. 2(b)) forthe HCSS. Nonetheless, the dispersion curve for the HCSS has thesame structure as found earlier through experiments (Castaingsand Hosten, 2003).
3.2. Response to surface loading
In order to understand the influence of modes on the guidedwave propagation, surface displacements of the sandwich struc-
ture and the composite skin alone are calculated due to an excita-tion signal, which is a five cycle sine pulse in a Hanning windowcarrying a central frequency. This tone-burst signal is often de-ployed in nondestructive evaluation and health monitoring usingPZT transducers because it produces a narrowband excitation thatminimizes the effect of highly dispersive nature of guided wavemodes. Two different excitation frequencies are considered: (a)25 kHz and (b) 100 kHz. As per the dispersion curve for the HCSS,only two modes can possibly be excited at 25 kHz, whereas, morethan two modes can appear for 100 kHz. A typical excitation signalat 100 kHz central frequency and its Fourier spectrum is shown inFig. 3.
To examine the accuracy of the theoretical model, surface dis-placements are calculated at receiver distances both relatively clo-ser (50 mm, roughly 3 times the total plate thickness) and far away(300 mm) from the source. 300 mm distance is chosen to allowadequate separation of propagating guided wave modes. The out-of-plane (u3) surface displacement is calculated due to a verticalexcitation (normal loading) to represent thickness mode of vibra-tions of piezoelectric transducers in an experiment, such that oneof the transducers acts as a transmitter and the other one as a re-ceiver. On the other hand, in-plane (u1) surface displacement is cal-culated for a horizontal excitation (shear loading) representingradial mode of vibrations of piezoelectric transducers. The resultsare compared to those obtained from LS-DYNA simulations. Inthe LS-DYNA models, 4 noded plane-strain elements are usedand the element size is controlled so that its dimension does notexceed one-tenth of the minimum wavelength, which is calculatedbased on the velocity of the slowest propagating mode at the exci-tation frequency. The skin and the core are discretized in 6 and 20elements, respectively, along the thickness direction, and an ele-ment dimension of 0.5 mm is maintained along the x direction tomeet the aforementioned condition in the frequency range ofinterest. Since the skin is thin, finer discretization is used in thethickness direction to capture the effect of shear deformationappropriately. The models are prepared long enough so that theedge reflections can be separated from the direct pass of the signal.A 4 m long model is prepared for the 25 kHz frequency excitation,and for the100 kHz frequency excitation, the model is 2 m lomg. Apoint force is applied at the mid node on the top surface and thedisplacements are calculated at a surface node to the right.
Theoretical and simulated responses for the ‘composite skinalone’ are compared in Figs. 4 and 5 for normal and horizontal exci-tations, respectively. Excellent agreements between the theoreticaland simulated results are found for an excitation frequency of100 kHz. Notably, for the normal excitation, the response is domi-nated by the A0 mode (Fig. 4), whereas, for the horizontal excita-tion, both A0 and S0 modes are present at 300 mm receiverdistance and that the A0 mode is followed by a weak S0 mode(Fig. 5). Reflections form the edges are seen in Fig. 5. Since S0 modehas a group velocity of about 6 mm/ls at a frequency of 100 kHz,the first reflection at the receiver located at 50 mm (Fig. 5(a)) tothe right of the source is expected to arrive at approximately325 ls from the right edge. The second S0 mode reflection fromthe left edge of the model appears next.
The results for the ‘HCSS’ are presented in Figs. 6 and 7. In caseof a normal excitation (Fig. 6), response is strongly influenced bythe presence of A0 mode only at the two excitation frequencies(25 kHz and 100 kHz) and the receiver distances (50 mm and300 mm). But, in case of a horizontal excitation (Fig. 7), the signalcharacteristics are multimodal in nature. At 25 kHz horizontalexcitation (Fig. 7(a) and (b)), only two modes, A0 and S0, are pres-ent in the response signal. The separation between these twomodes is evident for a receiver distance of 300 mm (Fig. 7(b)).But, at 100 kHz horizontal excitation (Fig. 7(c) and (d)), presenceof dominating higher order symmetric and anti-symmetric modes
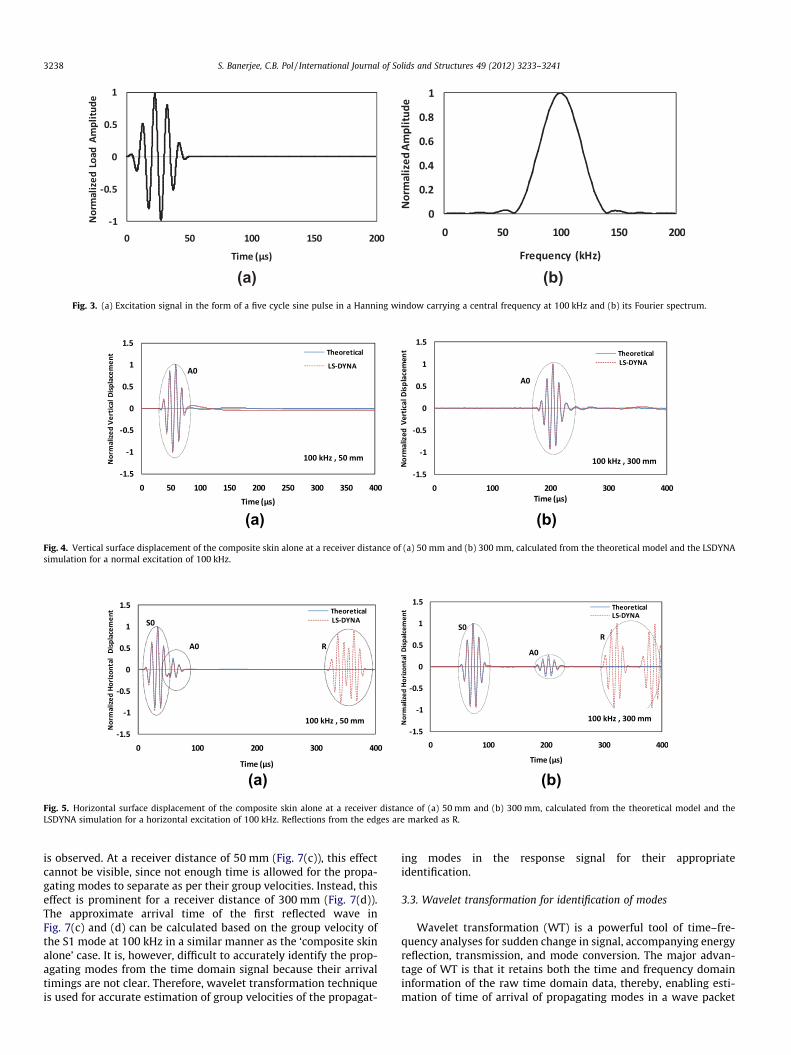
(a) (b)Fig. 3. (a) Excitation signal in the form of a five cycle sine pulse in a Hanning window carrying a central frequency at 100 kHz and (b) its Fourier spectrum.
(a) (b)Fig. 4. Vertical surface displacement of the composite skin alone at a receiver distance of (a) 50 mm and (b) 300 mm, calculated from the theoretical model and the LSDYNAsimulation for a normal excitation of 100 kHz.
(b)(a)Fig. 5. Horizontal surface displacement of the composite skin alone at a receiver distance of (a) 50 mm and (b) 300 mm, calculated from the theoretical model and theLSDYNA simulation for a horizontal excitation of 100 kHz. Reflections from the edges are marked as R.
3238 S. Banerjee, C.B. Pol / International Journal of Solids and Structures 49 (2012) 3233–3241
is observed. At a receiver distance of 50 mm (Fig. 7(c)), this effectcannot be visible, since not enough time is allowed for the propa-gating modes to separate as per their group velocities. Instead, thiseffect is prominent for a receiver distance of 300 mm (Fig. 7(d)).The approximate arrival time of the first reflected wave inFig. 7(c) and (d) can be calculated based on the group velocity ofthe S1 mode at 100 kHz in a similar manner as the ‘composite skinalone’ case. It is, however, difficult to accurately identify the prop-agating modes from the time domain signal because their arrivaltimings are not clear. Therefore, wavelet transformation techniqueis used for accurate estimation of group velocities of the propagat-
ing modes in the response signal for their appropriateidentification.
3.3. Wavelet transformation for identification of modes
Wavelet transformation (WT) is a powerful tool of time–fre-quency analyses for sudden change in signal, accompanying energyreflection, transmission, and mode conversion. The major advan-tage of WT is that it retains both the time and frequency domaininformation of the raw time domain data, thereby, enabling esti-mation of time of arrival of propagating modes in a wave packet

(a) (b)
(c) (d)Fig. 6. Vertical surface displacements of the HCSS at 50 mm and 300 mm receiver distances calculated from the theoretical model and the LSDYNA simulation for a normalexcitation of (a,b) 25 kHz and (c,d) 100 kHz.
(a) (b)
(c) (d)Fig. 7. Horizontal surface displacements of the HCSS at 50 mm and 300 mm receiver distances calculated from the theoretical model and the LSDYNA simulation for ahorizontal excitation of (a,b) 25 kHz and (c,d) 100 kHz. Reflections from the edges are marked as R.
S. Banerjee, C.B. Pol / International Journal of Solids and Structures 49 (2012) 3233–3241 3239
(a) (b)Fig. 8. WTC profile of the response signal at a distance of 300 mm for (a) 25 kHz and (b) 100 kHz horizontal excitation.
3240 S. Banerjee, C.B. Pol / International Journal of Solids and Structures 49 (2012) 3233–3241
at a particular excitation frequency. All the wavelet transforma-tions (WTs) are calculated with AGU-Vallen Wavelet that uses aGabor function as the mother wavelet with a central frequencyof 7 MHz, and has been used extensively in the pioneering researchof wavelet analysis in the field of guided wave acoustic emission(Hamstad et al., 2002). Group velocity is usually considered to bepropagation speed of a wave packet (envelope) with a central fre-quency carrying maximum energy, whereas, individual frequencycomponent in the packet is propagated at its phase velocity. Thus,it is convenient to use wavelet transformed data of the source andthe received signal for the calculation of group velocity of a prop-agating mode as follows:
cg ¼dDt
ð22Þ
where, d is distance between the source (excitaion) and the recei-ver, and Dt is defined as the time interval between the peaks ofthe WT envelopes of the source signal and the propagating modein the received signal, respectively, at the central frequency.
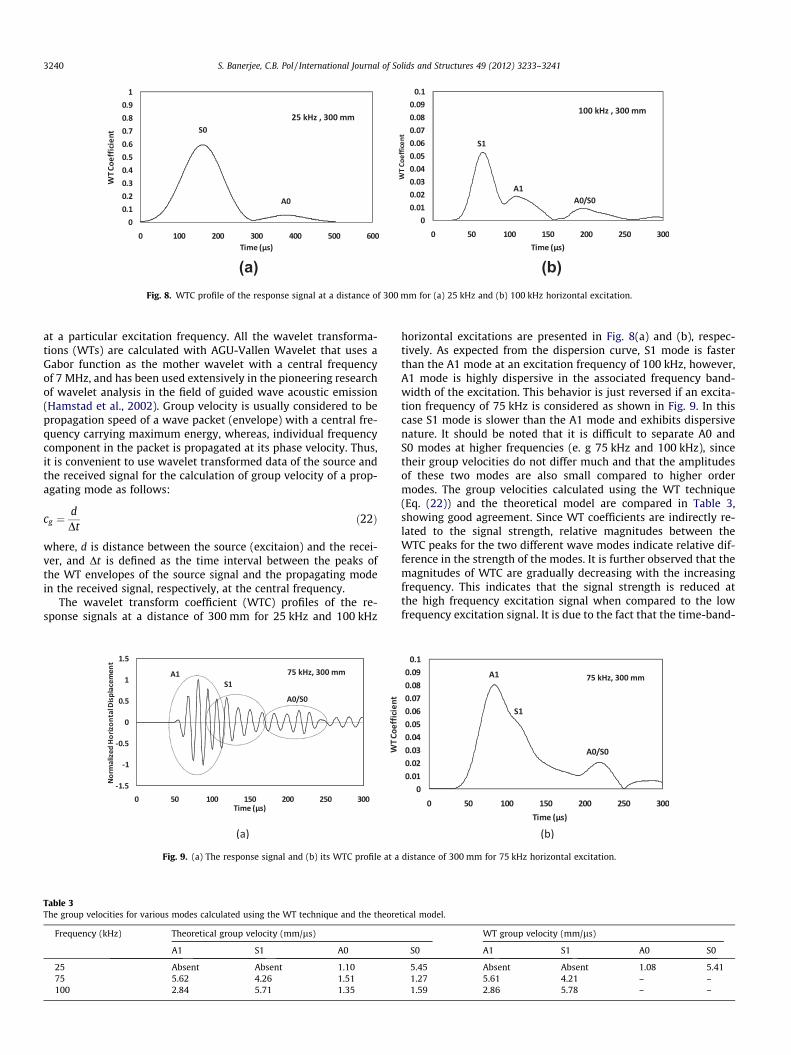
The wavelet transform coefficient (WTC) profiles of the re-sponse signals at a distance of 300 mm for 25 kHz and 100 kHz
Fig. 9. (a) The response signal and (b) its WTC profile at a
Table 3The group velocities for various modes calculated using the WT technique and the theore
Frequency (kHz) Theoretical group velocity (mm/ls)
A1 S1 A0
25 Absent Absent 1.1075 5.62 4.26 1.51100 2.84 5.71 1.35
horizontal excitations are presented in Fig. 8(a) and (b), respec-tively. As expected from the dispersion curve, S1 mode is fasterthan the A1 mode at an excitation frequency of 100 kHz, however,A1 mode is highly dispersive in the associated frequency band-width of the excitation. This behavior is just reversed if an excita-tion frequency of 75 kHz is considered as shown in Fig. 9. In thiscase S1 mode is slower than the A1 mode and exhibits dispersivenature. It should be noted that it is difficult to separate A0 andS0 modes at higher frequencies (e. g 75 kHz and 100 kHz), sincetheir group velocities do not differ much and that the amplitudesof these two modes are also small compared to higher ordermodes. The group velocities calculated using the WT technique(Eq. (22)) and the theoretical model are compared in Table 3,showing good agreement. Since WT coefficients are indirectly re-lated to the signal strength, relative magnitudes between theWTC peaks for the two different wave modes indicate relative dif-ference in the strength of the modes. It is further observed that themagnitudes of WTC are gradually decreasing with the increasingfrequency. This indicates that the signal strength is reduced atthe high frequency excitation signal when compared to the lowfrequency excitation signal. It is due to the fact that the time-band-
distance of 300 mm for 75 kHz horizontal excitation.
tical model.
WT group velocity (mm/ls)
S0 A1 S1 A0 S0
5.45 Absent Absent 1.08 5.411.27 5.61 4.21 – –1.59 2.86 5.78 – –

S. Banerjee, C.B. Pol / International Journal of Solids and Structures 49 (2012) 3233–3241 3241
width of the input signal is reduced at a high frequency while itspeak amplitude remains unchanged in comparison to the low fre-quency excitation signal.
4. Conclusions
A 2D semi-analytical model with no prior restrictions on fre-quency and wavelength is presented in an effort to understandmultimodal characteristics of propagating guided waves (GW) inHCSS due to transient sources. The wavenumber integral tech-nique, however, takes into account contributions from only propa-gating GW modes (real roots of dispersion equation). This enablesrapid calculation of ‘far-field’ surface motion in HCSS with a goodaccuracy when compared to LS-DYNA simulation results. Whileexecution of LSDYNA model takes more than an hour, theoreticalmodel takes only a few second. In HCSS, for all cases of normalloadings, response is strongly influenced by the presence of A0mode. In contrary, the surface motion is dominated by S0 mode fol-lowed by a weak A0 mode at a low frequency horizontal excitation,whereas, the presence of higher order modes (e.g. S1, A1) is seen todominate the surface motion at a high frequency horizontal excita-tion . For the HCSS, it is noticed that at the 100 kHz frequency, thewavelength of the A0 mode is roughly 10 mm, which is less thanthe thickness of the plate as well as that of the core. Thus, it is evi-dent that the approximate theories, in principle, cannot even real-istically model A0 mode at this frequency. For the ‘skin alone’,however, approximate theories can be used in the frequency rangeof interest since the wavelength is much longer than the thicknessof the plate (Banerjee et al., 2004). The wavelet transformationtechnique is used as a potential tool to identify the propagatingguided wave modes accurately on the basis of theoretical disper-sion curve. The semi-analytical model is expected to help in theselection and tuning of appropriate guided wave modes for effi-cient damage detection in sandwich structures using PZT transduc-ers. Another major advantage of the model is that the integrationscheme can be exploited to obtain the time-domain solution forany specific propagating mode. In addition, it is possible to intro-duce dissipative material characteristics in the model by usingcomplex elastic modulii, however, full integration of Eq. (22)should be performed that can increase the computational costmanifold.
Acknowledgments
This research was supported by Indian Space Research Organi-zation under Grant No. 11ISROC001. The authors wish to thankProf. Ajit Mal, Mechanical and Aerospace Engineering Department,University of California Los Angeles for his helpful suggestions dur-ing the course of this research.
References
Achenbach, J.D., 1978. Wave Propagation in Elastic Solids. North-Holland, New York.Backström, D., Nilsson, A., 2006. Modeling flexural vibration of a sandwich beam
using modified fourth-order theory. J. Sandwich Struct. Mater. 8, 465–476.
Baid, H., Banerjee, S., Mal, A.K., Joshi, S., 2008. Detection of disbonds in a honeycombcomposite structure using guided waves. In: Proceedings of SPIE, SmartStructures and Materials & Nondestructive Evaluation and Health MonitoringVI, March 9–13, San Deigo, California.
Banerjee, S., Mal, A.K., Prosser, W.H., 2004. Analysis of transient Lamb wavesgenerated by dynamic surface sources in thin composite plates. J. Acoust. Soc.Am. 115 (5), 1905–1911.
Banerjee, S., Prosser, W.H., Mal, A.K., 2005. Calculation of the response of acomposite plate to localized dynamic surface loads using a new wave numberintegral method. ASME J. Appl. Mech. 72, 18–24.
Bitzer, T., 1997. Honeycomb Technology: Materials, Design, Manufacturing,Applications and Testing. Chapman & Hall, London.
Buchwald, V.T., 1961. Rayleigh waves in transversely isotropic media. Quart. J.Mech. Appl. Math. XIV, 293–317.
Castaings, M., Hosten, B., 2003. Guided waves propagating in sandwich structuresmade of anisotropic, viscoelastic, composite materials. J. Acoust. Soc. Am. 113,2622–2634.
Chakraborty, A., Gopalkrishnan, S., 2004. A spectrally formulated finite element forwave propagation analysis in laminated composite media. Int. J. Solids Struct.41, 5155–5183.
Diamanti, K., Soutis, C., Hodgkinson, J.M., 2005. A lamb waves for the non-destructive inspection of monolithic and sandwich composite beams. Compos.Part A 36, 189–195.
Hamstad, M.A., O’Gallaghar, A., Gary, J., 2002. A wavelet transformation applied toacoustic emission signals: part 1: source identification. J. Acoustic Emission 20,39–61.
Hay, T.R., Wei, L., Rose, J.L., 2003. Rapid inspection of composite skin–honeycombcore structures with ultrasonic guided waves. J. Compos. Mater. 37, 929–939.
Hoo Fatt, M.S., Park, K.S., 2001. Dynamic models for low velocity impact damage ofcomposite sandwich panels – part a: deformation. Compos. Struct. 52, 335–351.
Lih, S.S., Mal, A.K., 1995. On the accuracy of approximate plate theories for wavefield calculations in composite laminates. Wave Motion 21, 17–34.
Lih, S.S., Mal, A.K., 1996. Response of multilayered composite laminates to dynamicsurface loads. Compos. Part B 27B, 633–641.
Liu, L.P., Bhattacharya, K., 2009. Wave propagation in a sandwich structure. Int. J.Solids Struct. 46, 3290–3300.
LSTC, 2007. LS-DYNA Keyword User’s Manual, Volume 1, Version 971, LivermoreSoftware Technology Corporation (LSTC).
Mal, A.K., 1988. Wave propagation in layered composite laminates under periodicsurface loads. Wave Motion 10, 257–266.
Maslov, K.I., Kundu, T., 1997. Selection of lamb modes for detecting internal defectsin laminated composites. Ultrasonics 35, 141–150.
Naik, N.K., 1994. Woven Fabric Composites. Technomic Publishing Co., Inc.,Lancaster, PA.
Nayfeh, A.H., 1995. Wave propagation in layered anisotropic media withapplications to composites. In: Achenbach, J.D. (Ed.), North-Holland Series inApplied Mathematics and Mechanics, vol. 39. Elsevier Science, Amsterdam.
Nilsson, A.C., 1990. Wave propagation in and sound transmission through sandwichplates. J. Sound Vib. 138, 73–94.
Nosier, A., Kapania, R.K., Reddy, J.N., 1993. Free vibration analysis of laminatedplates using a layer-wise theory. AIAA J. 31, 2335–2346.
Qiao, P., Yang, M., 2007. Impact analysis of fiber reinforced polymer honeycombcomposite sandwich beams. Compos. Part B 38 (739–750), 2007.
Reddy, J.N., 2003. Mechanics of Laminated Composite Plates and Shells: Theory andAnalysis, second ed. CRC Press.
Song, F., Huang, G.L., Hudson, K., 2009. Guided wave propagation in honeycombsandwich structures using a piezoelectric actuator/sensor system. Smart Mater.Struct. 18, 125007.
Sorokin, S.V., 2006. Analysis of propagation of waves of purely shear deformation ina sandwich plate. J. Sound Vib. 291, 1208–1220.
Vasudevan, N., Mal, A.K., 1985. Response of an elastic plate to localized transientsources. ASME J. Appl. Mech. 107, 356–362.
Xu, B., Giurgiutiu, V., 2007. Single mode tuning effects on Lamb wave time reversalwith piezoelectric wafer active sensors for structural health monitoring. J.Nondestruct. Eval. 26, 123–134.