theoretical evaluation of the vapor compression cycle with
TRANSCRIPT

NISTIR 5606
Theoretical Evaluation of the VaporCompression Cycle With a Liquid-Line/Suction-Line Heat Exchanger, Economizer,and Ejector
Piotr A. Domanski
March 1995
U.S. Department of CommerceRonald H. Brown, SecretaryTechnology AdministrationMary L. Good, Under Secretary for TechnologyNational Institute of Standards and TechnologyArati Prabhakar, Director

ABSTRACT
The report presents a theoretical analysis of three vapor compression cycles which arederived from the Rankine cycle by incorporating a liquid-line/suction-line heat exchanger,economizer, or ejector. These addendums to the basic cycle reduce throttling losses usingdifferent principles, and they require different mechanical hardware of different complexityand cost. The theoretical merits of the three modified cycles were evaluated in relationto the reversed Carnot and Rankine cycle. Thirty-eight fluids were included in the studyusing the Carnahan-Starling-DeSantis equation of state. In general, the benefit of theseaddendums increases with the amount of the throttling losses realized by the refrigerantin the Rankine cycle. The liquid-line/suction-line heat exchange cycle shows the smallestCOP improvement. Theoretically, the ejector cycle can reach the highest COP, but thisrequires a high level of ejector efficiency, which has not been demonstrated to be feasiblein practice. If the two-phase ejector efficiency is assigned the value attainable in a typicalsingle-phase ejector, the COP of the ejector cycle is comparable to the COP of the one-stage economizer cycle.
Key Words: air conditioning; ejector; liquid-line/suction-line heat exchange; Rankinecycle; refrigeration; vapor compression cycle
. . .111

ACKNOWLEDGEMENT
This study was sponsored by the Advanced Technology Program at the National Institute ofStandards and Technology. The author thanks Mr. P. Rothfleisch and Dr. D. Didion of NISTand Mr. P. Gkunm of the Trane Company for their review and comments on the draft of thisreport.
iv

TABLE OF CONTENTS
ABSTRACT . . . . . . . . . . . . . . . . . . . . . . . . . . . . . . . . . . . . . . . . . . . . . .. iii
ACKNOWLEDGEMENT . . . . . . . . . . . . . . . . . . . . . . . . . . . . . . . . . . . . . ..iv
TABLE OF CONTENTS . . . . . . . . . . . . . . . . . . . . . . . . . . . . . . . . . . . . . . ..v
LIST OF FIGURES . . . . . . . . . . . . . . . . . . . . . . . . . . . . . . . . . . . . . . . . . ..vi
NOMENCLATURE . . . . . . . . . . . . . . . . . . . . . . . . . . . . . . . . . . . . . . . . ..viii
1. Introduction . . . . . . . . . . . . . . . . . . . . . . . . . . . . . . . . . . . . . . . . . ...11.1 Scope . . . . . . . . . . . . . . . . . . . . . . . . . . . . . . . . . . . . . . . . . . . ...11.2 Theoretical Background . . . . . . . . . . . . . . . . . . . . . . . . . . . . . . . . ...1
2. RankineCycle . . . . . . . . . . . . . . . . . . . . . . . . . . . . . . . . . . . . . . . ...5
3. CyclewithaLiquid-Line/Suction-Line Heat Exchanger . . . . . . . . . . . . . . . . 10
4. Economizer Cycle . . . . . . . . . . . . . . . . . . . . . . . . . . . . . . . . . . . . ...16
5. Ejector Cycle . . . . . . . . . . . . . . . . . . . . . . . . . . . . . . . . . . . . . . . ...22
6. Summary . . . . . . . . . . . . . . . . . . . . . . . . . . . . . . . . . . . . . . . . . . ..28
7. References . . . . . . . . . . . . . . . . . . . . . . . . . . . . . . . . . . . . . . . . . ..30
v
LIST OF FIGURES
1.2.
3.
4.
5.
6.7.
8.9.
10.
11.
12.
13.
14.15.16.
17.
18.
19.
20.
21.22.
23.
Carnotand Rankine cycle . . . . . . . . . . . . . . . . . . . . . . . . . . . . . . . . . ...3Reciprocal of the slope of saturated vapor line (ds/dT) on T-Sdiagram atTr=0.65 . . . . . . . . . . . . . . . . . . . . . . . . . . . . . . . . . . . . ...3Values ofhfJTevaP (at T, =0.65) and ~P,l (average valueofheatcapacity at T,=O.65and0.82) . . . . . . . . . . . . . . . . . . ...” . . . ...8Relation between (Tevap.~,l)/hf~ and molar heat capacity ofliquid and vapor . . . . . . . . . . . . . . . . . . . . . . . . . . . . . . . . . ...-....8COP of the Rankine cycle and the cycle without throttlingirreversibilities referenced to COPc . . . . . . . . . . . . . . . . . . . . . . . . . . . ...9Relative penalties degrading the Rankine cycle COP . . . . . . . . . . . . . . . . . ..9Schematic of hardware arrangements for the basic cycle andcycle with the liquid-line/suction-line heat exchanger . . . . . . . . . . . . . . . . . . 11Key refrigerant state points in the basic cycle and llsl-hx cycle . . . . . . . . . . . . 11Change of the COP~Xat different effectiveness of the llsl-hx atT =-23 °Cand TCOn~=42.50C . . . . . . . . . . . . . . . . . . . . . . . . . . . ...12C~&city and work of the llsl-hx cycle referenced to capacity andworkofthe Rankine cycle... . . . . . . . . . . . . . . . . . . . . . . . . . . . . ...12COP of the llsl-hx cycle referenced to COPC (Tevap,r=0.65,Tcond,r =0.82, refrigerants sorted by CPv at TevaP,r) . . . . . . . . . . . . . . . . . . . 14The effect of vapor-side pressure drop ‘in the llsl-hx on the COP~Xfor R-123 and R-125 (Te,r=0.65, TC,r=0.82, ?h~=0.5) . . . . . . . . . . . . . . . . 14COP of the llsl-hx cycle referenced to COPC (T,v,p=80C, TCOnd=460C,refrigerants sorted by~p,lTevap/l@ . . . . . . . . . . . . . . . . . . . . . . . . . . ...15Schematic of the economizer system. . . . . . . . . . . . . . . . . . . . . . . . . . ..17Pressure-enthalpy diagram with economizer cycle . . . . . . . . . . . . . . . . . . . . 17Capacity and work for the economizer cycle referenced to capacityand work for the Rankine cycle (TevaP,r=0.65, TCOnd,r=0.82) . . . . . . . . . . . . . 19COP of the economizer cycle and Rankine cycle referenced to COPC
–0.65, TCOnd,r=0.82, refrigerants sorted by CP,Vat TevaP,r). . . . . . . . . . 20(Tev,P,r-Optirnum intermediate temperature and pressure, and the geometricmean intermediate pressure (Tevap,r=0.65, TCOnd,r=0.82) . . . . . . . . . . . . - . . 20COP~co for R-12, R-227ea, R-717, and R-744 as a function of theintermediate temperature (Tevap,r=0.65, TCOnd,r=0.82) . . . . . . . . . . . . . . . . . 21COP of the economizer and Rankine cycle referenced to COPC(TevaP=8°C, TCOnd=460C,refrigerants sorted by ~P,lTevaP/Q . . . . . . . . . . . . 23Schematic of theejector system and ejector . . . . . . . . . . . . . . . . . . . . . . . . 23Capacity and work for the ejector cycle referenced to capacityand work for the Rankine cycle Tevap,r=0.65, TCo~d,r=0.82,ejector components 100% efficient) . . . . . . . . . . . . . . . . . . . . . . . . . . ...25COP of the ejector cycle referenced to COPC (TevaP,r=0.65md TCOnd,r=0.82, refrig-nts sorted by Cp,vat Tcvap,r) . . . . . . . . . . . . . . . . . 25
vi

24. COP improvement of the ejector cycle over the COP~ (Tev,P,r=0.65and TCOn~,r=0.82, refrigerants sorted by CP,Vat TeYaP,J . . . . . . . . . . . . . . . . . 26
25. COP of the ejector cycle referenced to COPC (T,V,P=8°C, TCO~~=46”C,refrigerants sorted by~P,lTevJhfJ . . . . . . . . . . . . . . . . . . . . . . . . . . ...27
26. COP improvement of the ejector cycle over the COP~(T~v,P=8“C, TCO~~=460C,refrigerants sorted by ~P,lTev,P/l@ . . . . . . . . . . . . 27
27. Improvement of volumetric capacity of the ejector cycle overthat of the Rankine cycle (Tev,P=80C, TCO~~=460C,refrigerants sofiedby FP,lTevJhf.J . . . . . . . . . . . . . . . . . . . . . . . . . . ...28
vii

NOMENCLATURE
COP - Coefficient of PerformanceCP- molar heat capacity at constant pressure; ~P - average valueeff - efficiency of ejector componentsh - enthalpy
hfg - latent heat of evaporationllsl-hx - liquid-line/suction-line heat exchangerP - pressure; POT- saturation pressure at temperature equal to 0.7” TC-.itR - universal gas constants - entropyT - temperatureu - velocityv - specific volumeQ - heat, capacityW - work
/3 - coefficient of thermal expansion; ~ - average valueq - nozzle efficiencyq~X- effectiveness of
Subscripts:
c - Carnotcond - condensercrit - criticald - diffuser, ejectorECO - economizerevap - evaporator
llsl-hx
exp - related to isenthalpic expansionhx - related to llsl-hx cyclei - inletint - intermediatej - ejector1- liquidm - motive nozzle in ejector0- outletR- Rankines - suction nozzle, ejectorsup - related to superheatedr - reduced valuev - vaporx- mixing, ejector
vapor horn
. . .

1. Introduction
1.1 Scope
This study analyzes the performance of pure-component refrigerants in the basic refrigeration(reversed Rankine) cycle and in modified cycles in which the throttling-processirreversibilities are minimized. The three modified cycles considered here are:
- the liquid-line/suction-line heat exchange (llsl-hx) cycle- the economizer cycle- the ejector cycle.
Each of these cycles can achieve an improved Coefficient of Performance (COP) over that ofthe Rankine cycle by reducing throttling irreversibilities, but accomplishes this using differentthermodynamic principles. COP improvements of these modified cycles are different andhave to be realized at the expense of additional hardware of different complexity and cost.This study compares the potential of these cycles for a wide range of working fluids.
The refrigerants considered in this study were the 38 fluids covered by REFPROP [1], andREFPROP thermodynamic property routines were employed in simulation models used toevaluate their performance. The Carnahan-Starling-DeSantis equation of state was used forall fluids except ammonia, for which a high-accuracy formulation by Harr and Gallagher wasapplied. Table 1 lists the studied fluids and their basic themnodynamic properties.
1.2 Theoretical Background
Thermodynamically, all refrigerants have the same COP potential in the ideal vaporcompression cycle. At prescribed condenser and evaporator temperatures, this potential isdefined by the Coefficient of Performance of the reversed Carnot refrigeration cycle,
TCOP = evap
c Trend- Tevap
The Carnot cycle consists of two isentropes and two isotherms. It is assumed to operate withinfinite-area heat exchangers between two isothermal heat reservoirs. Since the Carnot cycleis completely reversible, it is an unattainable ideal model for a refrigeration cycle.Consequently, the more realistic Rankine cycle is used to represent the thermodynamicprocesses in a refrigeration machine. The Ranlcine cycle is composed of two isobars, anadiabatic expansion and an isentropic compression.shown in Figure 1. (Note that in the Carnot cyclerepresent two compression processes, with processcompressor).
Me Rankine cycle and Carnot cycle arepresented Figure 1, lines 1-2C and 2C-2V2C-2V requiring an isothermal
1

TabIe 1. Selected properties ofstudied refrigerants
# Refrigerant TCrit WM ~;~ol ~,~o; ~ ~,~~ ~ ‘r = 0“65 ‘r ~C0+82“c g/mol . . ‘c
1 R-14 -45.6 88.0 11562.9 41.7 78.5 -125.3 -86.62 R-23 25.9 70.0 16857.1 42.3 89.2 -78.7 -28.03 R-13 28.9 104.5 15191.2 54.4 88.7 -76.8 -25.54 R-744 30.9 44.0 16445.9 34.0 78.3 -75.5 -23.95 R-125 66.2 120 20001.1 80.5 132.2 -52.6 5.16 R-13B1 67.1 148.9 17189.1 61.5 99.1 -52.0 5.87 R-218 72.0 188.0 20431.6 125.1 170.5 -48.8 9.98 R-143a 73.1 84.0 19102.8 66.2 105.2 -48.1 10.89 R-32 78.2 52.0 19829.2 39.5 78.5 -44.8 15.010 R-115 79.9 154.5 19575.9 93.9 138.4 -43.7 16.411 R-22 96.2 86.5 19835.1 51.6 93.4 -33.1 29.712 R-290 96.7 44.1 18330.5 65.3 102.7 -32.8 30.113 R-134a 101.1 102.0 22491.6 76.0 126.0 -29.9 33.814 R-227a 101.9 170.0 23256.6 120.6 179.0 -29.4 34.415 R-245cb 106.9 134.1 22508.3 107.1 159.4 -26.1 38.516 R-12 111.8 120.9 19684.3 68.2 107.4 -22.9 42.517 R-152a 113.6 66.0 21716.8 62.2 102.1 -21.8 43.918 R-C318 115.2 200.0 24149.5 142.3 198.8 -20.7 45.319 R-134 118.9 102.0 22746.2 83.9 131.5 -18.3 48.420 R-124 122.5 136.5 22878.5 91.7 140.2 -16.0 51.321 R-C270 125.2 42.1 19117.1 51.1 84.6 -14:3 53.522 NH3 132.2 17.0 21641.8 36.5 73.0 -9.6 59.323 R-600a 134.7 58.1 20892.1 90.0 127.4 -8.1 61,324 R-142b 137.1 100.5 22268.7 79.3 118.3 -6.5 63.325 R-236a 139.3 152.0 25867.9 118.3 173.1 -5.1 65.126 R-114 145.7 170.9 23729.2 113.1 166.5 -0.9 70.327 E134 147.1 118.0 26871.6 93.6 166.6 0.0 71.528 R-600 152.0 58.1 22192.4 95.3 134.9 3.2 75.529 R-143 156.7 84.0 25832.8 75.6 131.5 6.27 79.430 E-245 170.9 150.0 28204.5 132.5 187.3 15.5 91.031 R-21 178.5 102.9 24068.0 62.4 108.0 20.4 97.232 R-123 183.8 152.9 26360.1 103.9 153.5 23.9 101.633 I-C5 187.4 72.2 24800.3 121.1 163.4 26.2 104.534 R-123a 187.9 152.9 26520.6 105.5 158.9 26.6 105.035 N-C5 1%.4 72.2 26027.2 123.7 168.0 32.1 111.936 R-n 198.1 137.4 24342.9 80.9 121.4 33.1 113.237 R-141b 204.2 116.9 25785.6 92.0 137.9 37.1 118.338 R-113 214.3 187.4 27164.1 123.1 169.6 43.7 126.6
* evaluatedat Tr=0.65
2

T
1
— Camot Cyda— Rankina oyde
s
Figure 1. Carnot and Rankine cycle(work and capacity marked for the Rankine cycle)
0.15T 9
0.1 9
.F m
❑
0.05 ❑ m..m
o 1 1 t I 1 ! 1● m I
“s 20 40 60 8Q = 100 120 140 160E -0.05E
@@lm2% -0.1
,& ,s ■
9 “%.g -0.15\% ❑ m
-0.2 ❑
-0.25+I
-0.3tI
-0.351
Vapor molar heat capacity (kJ/kmol K)
Figure 2. Reciprocal of the slope of saturated vapor line (ds/dT) on T-Sdiagram at T,=O.65 for 38 fluids of Table 1
3

As opposed to the Carnot cycle, the Rankine cycle incorporates some of the irreversibilitiesof a real vapor compression system. Specifically, refrigerant superheating at the end ofcompression (point 2~) and the isenthalpic (non-isentropic) expansion process (3-4R).Because of its inherent irreversibilities, the COP of the Rankine cycle is lower than that ofthe Carnot cycle. In contrast to the fluid-insensitive Carnot cycle, the fluid thermodynamicproperties will cause the Rankine cycle to have a fluid-dependent COP.
The suitability of refrigerant thermodynamic properties can be inferred from the slopes of theliquid and vapor saturation lines on temperature-entropy coordinates. Ideally, both linesshould be vertical. In reality, the slope of the saturated vapor line may be either positive ornegative, while only a positive slope is possible for the saturated liquid line [2]. On thecompression side, a positively sloped saturation line would cause the end state of thecompression process to lie within the two-phase region. This is an undesired condition for apositive displacement compressor. With a negative slope, excessive compression work isrequired. On the expansion side, the saturation line’s gradient is related to the part of theevaporator capacity that is lost due to liquid flashing.
The slope of the saturation line on temperature-entropy coordinates can be represented withthe equation proposed by Duffield and Hodgett [3]:
dT _ Tds vCp- B —“ hfg vv_ VI
For a given absolute temperature, the fluid properties in the denominator control the signand magnitude of dT/ds. For the liquid saturation line, the small values of (31and vl/(vv-vJcause the heat capacity to be the dominant term and ensures that dT/ds is always positive.For the vapor saturation line, the term vv/(vv-vl) is approximately equal to one since v,>> V1. When evaluated at the same reduced temperature Tr= 0.65, the molar heat capacityof different fluids varies by a factor of four. Although the latent heat, 4g,also variessignificantly (by a factor of two), the term (3V”hf~”vv/(vv-vl) is contained in a mrrow band-10% to +11% from the average value for all the fluids. This causes the molar heatcapacity to be the most influential term on the slope of the vapor saturation line. The molarheat capacity’s effect on dT/ds for the vapor saturation line is graphically depicted in Figure2.
Most of the cycle simulations in this study were performed at the evaporator and condenserreduced temperatures of TevaP,r=0.65 and Tcond,r=0.82. This allowed examining a diverseset of refrigerants (all 38 fluids covered by REFPROP) at their best operating temperaturerange, while still testing them against the same COP limit of the Carnot cycle. Keeping thereduced temperatures constant for different fluids results in different absolute temperaturesand temperature lift.
4

In addition to the evaluations based on reduced temperatures, several simulations were alsoconducted at assigned absolute temperatures in the evaporator and condenser , TevaP= 8‘Cand TCO~d= 460C, which are representative of refrigerant temperatures for a residential air-conditioning application. The simulations based on absolute temperatures result in differentevaporator and condenser pressures between screened fluids. Refrigerants 14, 23, 13, and744 were excluded from these simulations because the specified 46 “C saturation temperaturein the condenser was above the critical temperature for these fluids.
2. Rankine Cycle
In this section we will examine the performance of various refrigerants in the reversedRankine cycle. Although the Rankine cycle has been extensively examined in the literature,a short coverage of the topic is given here for completeness.
Refer to Figure 1 which displays the Rankine and Carnot cycles on temperature-entropycoordinates. It follows from the definition of entropy, Tds = Q, that the area under areversible-process line represents the heat transferred to or from the refrigerant during theprocess. Combining this with the First Law of Thermodynamics, the work input to the cycleis shown in Figure 1 as the enclosed area. The non-overlapping areas of the two cyclesindicate a loss in the refrigerating capacity and an increase in the work required for theRankine cycle over the Carnot cycle.
For the Carnot cycle, the refrigerating capacity is represented by the area under the line4C-1, and the work is outlined by the rectangle 1-2C-3-4C. The work for the Rankine cycleincludes that for the Carnot cycle plus the work depicted by the triangle 2C-2-2V and therectangle located under the line 4c-4R. The fnst area represents the additional work requireddue to vapor superheating above the temperature of the heat sink, while the secondcorresponds to the work needed to compensate for the irreversible expansion process 3-4R.The area under the line 4c-~ also represents the loss of refrigerating capacity. Hence, theirreversible expansion causes an equal loss of refrigerating capacity as it increases the neededcycle work.
Based on these observations from Figure 1, we can write the following equations for theRankine cycle capacity, work, and COP~:
QR= Qc - Qexp
QQR
1--3?
COPR = — = COPCQc
WR w wfw+_I+_ sup
Wc Wc
5

The last equation represents the coefficient of performance of the Rankine cycle in terms ofthe COPC and the multiplier, which is always smaller than one,
We can evaluate Q.XP/Qc in a few steps using sirnpli@ing assumptions. Considering thatliquid isobars almost coincide with the saturated liquid line on the temperature-entropydiagram, we can calculate the entropy change between points 4~ and 4~ by the followingequation:
‘p$l (Tcond - Tevap)‘4R
- S4L zTevap
where ~P,l is the average heat capacity of the liquid for the temperature intervalWe can also calculate the entropy change between point 4C and 4~ as follows:
‘cond - ‘evap”
S4C -s4~=s3-s4~=\
~dT=
Combining and multiplying by the evaporator temperature,refrigerating capacity loss due to isenthalpic expansion:
TcondEp,l ln—
Tevap
we can obtain a relation for the
Q =)ew = (S4R - S4C) Tevw = ‘p,l (Tcond - ‘evap - ‘ev~ ln Tevap
The capacity of the Carnot cycle can be expressed in terms of the latent heat and enthalpychange between points 4C and 4L:
TQc = hf~ - T,V.JS4C- S4L) = hfg - ‘e.v&),l ln #
evap
By combining the relations for Q,XPand QC, and rearranging, we obtain the followingexpression for the relative loss of refrigerating capacity due to isenthalpic expansion:
6

1 T
Q- lnQ?$
COPC T.v,P
& = h~~ T- lnM?!!!
Ti5 Tevap p,] evap
At this point, we may comment that the relative loss of work due to isentropic expansion,W,XP/Wc, is related to Q,XP/Qc through the Carnot efficiency:
w exp
WcQ= 3 COPCQc
since WeXP=QexPand Wc=Qc/COPc.
Odyonetem intiederived relation for Q,XP/Qc is fluid-prope@ dependent, while theremaining three terms depend on operating conditions. If we evaluate refrigerants at thesame absolute or reduced temperatures in the evaporator and condenser, the three operatingregime dependent terms will have the same values for all the fluids. Thus the relative loss ofthe refrigerating capacity will depend solely on the latent heat, heat capacity of liquid atconstant pressure, and the absolute temperature in the evaporator.
If we consider the term h#(T ~vaP”cP,l)at a given reduced temperature, the ratio hf~ /TevaPdoes not vary significantly between fluids. For all 38 refrigerants, the maximum deviationwas found to be *16 percent. The deviation of molar heat capacity is much larger (from -44% to + 52%), as shown graphically in Figure 3, making the heat capacity the mostsignificant variable in hf~ /(Tev,PocP,l). Figure 4 presents the relation between this term andCp,vat Tr=0.65 and average value of Cp,lcalculated for Tr =0.65 and Tr =0.82. Since thevapor points appear to have less scatter, the molar heat capacity of vapor will be used as aconvenient sorting criterion for refrigerants when their performance is evaluated at the samereduced temperatures. When refrigerant screening is performed at the same absolutetemperatures, the term hf~/T~vapis not that uniform between different refrigerants and willhave to be included for refrigerant sorting.
It should be noted that the limited variation of ~~/T, when evaluated for different fluids atthe same reduced temperature, can be deduced from the way hf~ /T is correlated h the0.6< T,< 1.0 range with the Pitzer acentric factor, ~ [4]:
%g _—-T
where ~ = -10glo(Po.7/PCriJ-1
# [7.08(1-T,)0354 + 1O.95(J(1-TJ0456]r
does not significantly influence the result.
7

225
200
2 175
g 1503$$ 125
,.2 100
Figure 3. Values of @JTWw(at T,= O.65) and ~P,l (average value of heat capacity atT,=O.65 and 0.82, refi-igerants sorted by CP,Vat T,= O.65.)
2.5
2
PEPa&
t
■
■
o I
o
Figure 4.
50 100 150 200 250
Molar heat capacity (kJ/kmol K)
Relation between TW&J&~ and molar heat capacity of liquid and vapor
(T~W, h~, CP,,eval~ted at T,= O.65, CP,lis the average of heat capacitiesat T, =0.65 and 0.82)
8

‘T0.9
0.8
0.7
~v 0.60~ 0.520~ 0.4
0.3
0.2
0.1
0 I
❑ Rankine
Figure 5. COP of the Rankinereferenced to COPCat T,= O.65)
0.7
0.6>% 0.5c
a~ 0.4>.-% ~3z“a
0.2
0.1
0
cycle and the cycle with no throttling irreversibilities(Tmq,,=0.65, T~n~,,=0.82, refrigerants sorted by CP,
I I❑WS”JW I R “R-E
Figure 6. Relative pemlties degrading the Rankine cycle COPT~ti,,=O. 82, refrigerants sorted by CP,Vat T,= O.65)
(Twq,r=0.65,
9

Figures 5 and 6 present results of simulations performed for a Rankine cycle defiied byisentropic compression, isenthalpic expansion, and saturation temperatures in the condenserand evaporator. Condenser subcooling and evaporator superheat were specified zero. Thetemperatures in the evaporator and condenser were 0.65- TCritand 0.82” TCrit,respectively.The Carnot COP for these conditions is
Tevap 0.65 TCfitCOPC=T _T = 3.82
cmd ~vw = (0.82 _ 0.65) TC~it
Figure 5 presents the ratio of different refrigerant COPS to this Camot COPC. The blackbars represent the COP of the Rankine cycle (as shown in Figure 1), while the unshaded barsrepresent the COP for a cycle with the superheated vapor horn and with isentropic (notisenthalpic) expansion. The difference between the two COPS indicates the impact ofisenthalpic expansion losses on the cycle COP. In general, small heat capacity refrigerantshave a higher COP than refrigerants with a large heat capacity. Most of the COP penaltycomes from the throttling losses, particularly for fluids having a larger heat capacity.
The penalties degrading the Rankine cycle COP~ relative to the Carnot cycle, Qexp/Qc,W~XP/Wc,and W~UJWc, are presented in Figure 6. For simplicity, these penalties aregraphed on one bar for each fluid, though they do not have a straight additive effect on theCOP. The terms QJQc and WeXP/Wcdiffer by a factor approximately equal to Copc,which we have already deduced in this chapter. Fluids of large heat capacity do not havesuperheated-horn losses (compression process ends in the wet-vapor region), but they havethe largest total losses due to throttling. Overall, the penalties caused by the isenthalpicexpansion constitute the largest part of the total losses, and its share of the total penaltyincreases with molar heat capacity. Thus, minimizing these losses is an interesting challengein the quest for improving the COP of the vapor compression
3. Cycle with Liquid-Line/Suction-Line Heat Exchanger
cycle.
The cycle with a liquid-line/suction-line heat exchanger (llsl-hx) is probably the mostcommon variation of the Rankine refrigeration cycle in practice. In the llsl-hx cycle, a heatexchanger is installed to subcool the high-pressure refrigerant with the low-pressure suctionvapor, which is being superheated in the process. Figure 7 shows the schematic of thearrangement for the basic and llsl-hx cycle, and Figure 8 presents both cycles on thepressure-enthalpy diagram. The llsl-hx cycle has been studied by several researchers. Thepertinent publications and theoretical analysis are included in reference [5]. The essence ofthis analysis is given below.
Addition of the liquid-line/suction-line heat exchanger to the Rankine cycle may have positiveor negative performance implications. Figure 9 presents an example of the impact of the llsl-hx on the COP calculated for four different refrigerants. The ordinate is the ratio of COP
10

3 2Condenser
1
E;p:a.)n Compressor
4 1
3I
2I Condenser I
I IvCompress
Figure 7. Schematic of hardware arrangements for the basic cycle and cycle with theliquid-line/suction-line heat exchanger.
@g* *
*
ENTHALPY
Figure 8. Key refrigerant state points in the basic cucle and llsl-hx cycle
11

1.101- -1
1.08 L
~“1.06
g--1.04u
1.02‘1
1.00t
0.98II I I I I IIo 20 40 .60 80 100
~hx (%)
Figure 9. Change of the COPh at different effectiveness of the llsl-hxat T.vW=-23°C and T@.~=42.50C [5]
2T1.9 +
1.2t
1.1 +
u
R
■■
1 4 i
25 50 75 100 125 150
Vapor molar heat capacity (kJ/kmol K)
Figure 10. Capacity and work of the llsl-hx cycle referenced to capacity and work of theRankine (T@q,,=0.65, T~nd,,=0.82, qh.= 1,0)
12

obtained for a given llsl-hx effectiveness (qh~) to the Cop ob~ined for the same wor~gfluid in the Rankine cycle (~hX=0). For R-134a, the increase in COP is the highest, asmuch as 9.1% percent at the theoretical limit of 100% effectiveness of the heat exchanger.For R-22, the llsl-hx causes degradation in COP at low values of the llsl-hx effectiveness,some of which is recovered at 100% effectiveness.
The ratio of the COP for the llsl-hx cycle and Rankine cycle may be expressed in terms ofthe ratios of capacities and work:
%xCophx QR
=—COP~ WhX
WR
For obvious reasons QhX/Q~is always greater than 1. Also, WhX/WRis always greater than1.0 since the slope of the constant-entropy line (which idealizes the compression process)decreases on the pressure-enthalpy diagram with increasing vapor superheat. Figure 10presents these capacity and work ratios for the 38 studied fluids for theoretical limit of 100%effectiveness of the llsl-hx. The figure shows that the change in work required does not varysignificantly for different fluids, but the change in capacity varies considerably with themolar heat capacity of vapor. Among other factors influencing the COphXare the latent heat,coefficient of thermal expansion, temperature lift (TCOnd- Tev.J, and amount of superheatresulting from the heat transfer between the liquid and suction line, as they appear in thefollowing COP#Op~ relation [5]:
~p,v(T1’ - Tl) T1’ - TI1+
coPhx 4, - ‘p,l ( ‘cond - Tev,p) 1 + hfgfip,v - (Tcond - ‘evap) ‘p,liFp,v—— = =
C(liPR VI‘ - VI1+
1 + ~v . (T1’ - TJ
In the above equation, the latent heat is evaluated at the evaporator temperature, ~P~is theaverage heat capacity of liquid for the temperature interval TCond- T~vap,and ~p,v k the heatcapacity of vapor at the evaporator pressure in the temperature range T1’ - T1.
Figure 11 presents the coefficient of performance of the llsl-hx cycle, COP~X,referenced tothe COP of the Carnot cycle. Three bars are displayed for each fluid; the fwst one for heatexchanger effectiveness equal to zero (which constitutes the Rankine cycle), and the next twofor the effectiveness equal to 50% and 100%. The figure demonstrates two points:
1. Fluids of low heat capacity do not benefit from the installation of the llsl-hx, andperform better in the basic, unmodified Rankine cycle. For the fluids of very lowheat capacity, the COP declines when the llsl-hx is installed.
13

1I ,
-0.8 I
0.7
0.6
0.5
0.4
0.3
0.2
0.1
0 [
Figure 11. COP of therefrigerants
1.2
1.15
1.1
1.05
1
0,95
0.9
0.85
0.80
llsl-hx cycle referenced)sorted by CP,Vat ‘Tevap,r
to Cope (Tevap,r =0.65, Tw.~,,=0.82,
5 10 15 20 25 30 35
Pressure drop (kPa)
Figure 12. The effect of vapor-side pressure drop in llsl-hx on COPk for R-123and R- 125 (T~vW,~=0.65, T~nd,,=0.82> qhx=O-5)
14
40

2. Fluids having a high molar heat capacity have a low COP in the Rankine cycle, buttheir performance improves with 11s1heat exchange and can exceed the COP of thebest performing fluids in the Rankine cycle at the theoretical limit of 100%effectiveness of the llsl-hx.
The COP improvement potential due to installation of the llsl-hx may be hampered byrefrigerant pressure drop on the vapor side of llsl-hx. Figure 12 shows that 20 IcPa pressuredrop totally eliminates the COP benefit of the 50% effective heat exchanger. Consideringthat the two refrigerants shown in Figure 12 (R-115 and R-123) have a similar pressure-droppenalty regardless of significantly different normal boiling points, the figure may be expectedto be representative for other fluids. Refrigerant pressure drop on the liquid-line side of llsl-hx showed no effect on the cycle performance.
Figure 13 shows simulated results for the assigned absolute temperatures in the evaporatorand condenser of 8“C and 46 ‘C, respectively. The results are presented for refrigerantssorted in the ascending order of T~vaP.~ ~/h~~,but the COP trend is not as consistent as in
{Figure 11. This is the effect of a signi &ntly different superheated vapor horn and relatedadditioml compression work when the compression occurs between different reducedtemperatures in the evaporator and condenser. When we consider the relative values of COPwith and without Ilsl-hx, we can make the same observation from Figure 13 as from Figure11 that only poor performing fluids in the Rankine cycle benefit from the liquid-line/suction-line heat exchange.
1
0.9
0.8
0.7
d o.e
g~ 0.5
Ii=o 0.4u
0.3
0.2
0.1
0
Figure 13. COP of the llsl-hx cycle referenced torefrigerant sorted by ~p,lTevaP/hfg)
COPC (T.vq =8”C, Tcond=460C,
15

4. Economizer Cycle
The economizer refrigeration cycle differs from the Rankine cycle by a two-stage expansionwith a liquid/vapor separator, and a compressor equipped with an intermediate-pressuresuction port. In the economizer cycle (shown in Figures 14 and 15), the liquid and vaporphases are separated afier the fust-stage expansion; the vapor is fed to the intermediate stageof the compressor, and the liquid undergoes further expansion on its way to the evaporator.The flash gas existing at the intermediate pressure Pti~ is not allowed to expand to theevaporator pressure. Consequently, the compression work for this portion of the totalrefrigerant mass flow rate is lower, which results in a COP improvement for the economizercycle.
We can relate the COP for the economizer cycle to the COP~ by considering the Rankinecycle capacity and work and the differences in capacity and work between the economizerand Rankine cycle:
‘QEco
QECO1+
Q~ + AQEcO = COPCOpE~~ = ~ =
QRWR + AW~co R
ECO ‘WECO1,lT-
WR
The COP improvement in the economizer cycle depends on the value of the COP~ multiplierin the above equation. The denominator of this multiplier is always less than 1.0 becauseAWEco is negative. This results from the fact that in the economizer cycle not allrefrigerant reaching the condenser has to be compressed from the evaporator pressure.Because it is difficult to intuitively predict the effect of the numerator, a derivation is helpful.
Using the assumptions stipulated in the section analyzing the llsl-hx, we can express thecapacity of the Rankine and economizer cycle by the following relations:
QECO = [hfg- ~p,l(Tht- Tevap)l(l - Xht)
QR = kg - ‘p,l(Tcond - T,,,P)
where Ttit is the intermediate temperature and xkt ‘~~,l(TCond-T~t)/hf~,~tis the flow qualitYafter the fwst-stage expansion. The difference in capacity between the Rankine andeconomizer cycle is then expressed by the equation:
AQECO = QECO - QR = ~p,l (Tcond - Tkt) - bfg - ~p,(Tkt - %@%
16

6 (xint) . ~
b
I
I I
7’ ~
(1 - Xi~t)
8— EVAPORATOR .
Figure 14. Schemat.ic of the economizer system
I
4
h
Figure 15. Pressure-enthalpy diagram for the economizer
17

If we use x~t ‘~P,l(TCO~d-T#hf~,ti and expand the above relation, we can see that the sign ofAQECO depends on the sign of the term ~~,kt +$JTbt-TcvaP)-~~, which is positive for apositive slope of the saturated vapor line on the pressure-enthalpy diagram. Since this is thecase in the temperature application range of a vapor compression cycle (far from the criticaltemperature), we may deduce that AQECOis positive as well. The positive value of AQECOand negative value of AWECOrenders COPECOgreater than COPR for any fluid.
The results discussed in this section were generated by simulating the economizer cycledepicted in Figure 15. The evaporator and condenser reduced temperatures were 0.65 and0.82, respectively. Zero subcooling was used at the inlet to both expansion devices, and anadiabatic throttling process was assumed. The saturated vapor entering the compressor atPevaPwas compressed to the intermediate pressure, Pmt. At the intermediate pressure, thesaturated vapor from liquid-vapor separator (state 9) was mixed with the refrigerant that wascompressed from the evaporator pressure (state 2). The saturation temperature of theintermediate pressure level was optimized for each refrigerant to obtain maximum COP.
The economizer cycle improves the COP for each fluid, but the extent of COP improvementdepends on molar heat capacity, as shown in the next two figures. Figure 16 presents thecapacity and work of the economizer cycle referenced to the respective values of the Rankinecycle. The capacity ratio and work ratio are well correlated by the molar heat capacity ofvapor. As we have deduced earlier, changes in both capacity and work promote animprovement of the system COPEco.
The ratios of COPECOand COP~ to COPC for the studied fluids are presented in Figure 17.The figure shows that the economizer cycle improves the COP for every fluid, but the degreeof COP improvement is larger for fluids with large heat capacity. The COPS of differentrefrigerants are more uniform for the economizer cycle than for the Rankine cycle. We mayalso notice that the best-performing fluids in the Rankine cycle are still the best performers inthe economizer cycle,
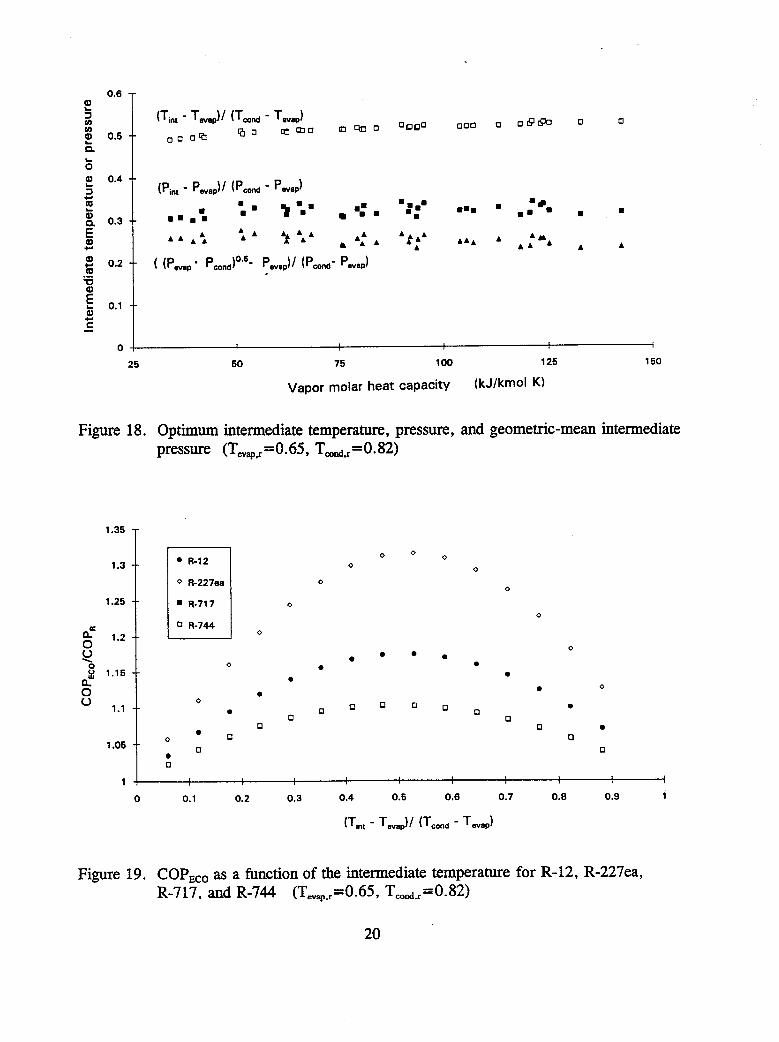
The optimum intermediate saturation temperature, Tht, is fairly uniform for the fluidsconsidered and can be well approximated by the mean temperature between the condenserand evaporator (i.e., 0.5(TCO~d+T~v,P)). There is some dependency of the optimum Tkt onmolar heat capacity, but it is rather small, as shown in Figure 18. The optimum pressure isalso uniform, but correlates with more scatter. The geometric mean pressure(i.e. ,(p~”d”p~~~~)0”5), which ensures the minimum work for two-stage compression of aperfect gas with complete intercooling [6], underestimates the optimum pressure for the realgases in the economizer cycle. The mean temperature also indicates the optimumintermediate temperature well for other combinations of evaporator and condensertemperatures.
Figure 19 shows the sensitivity of COP~co on the selection of Ttii for four refrigerants ofdifferent molar heat capacity. As expected, selection of an appropriate Ttit was more criticalfor a fluid benefiting most from the economizer. In this case, R-227ea was most affected by
18

1.25
1.2
1.15
1.1
1.05
1
! m QEco/QR
B
0.95 +
0.8 --
0.75 ( I
25
Figure 16.
50 75 100
Vapor molar heat capacity (kJ/kmol K)
125
Capacity and work of the economizer cycle referenced to thework of the Rankine cycle (T,VW,,=0.65, T~.~,,=O. 82)
capacity
150
and
1
0.9 ❑ co PR/coPc •1 co PEco/coPc..-
0.8
0.7
0.6
0.5
0.4
0.3
0.2
0.1
0 I
m
Figure 17. COP of the economizer and Rankine cycle referenced
-a UK 5
to COPC (TCVW,,=0.65,T~nd,r=0.82,refrigerants )sorted by CP,Vat Tevap,r
19
“
co
PE~
o/c
oP
R
,,
,{
❑0
o
ae
o
00
0
❑●
o
0
n o ❑ o
0
0
n
a●
00
●
●
●
● ●
●
●
●
● 0
>
0
0
0
0 0
0
0
0
0
Inte
rmed
iate
tem
per
atu
reo
rp
ress
ure
o0
00
00
0“A
bL
*b
!0
,I

the selection of T;,.*. The potential improvement in the economizer cycle is related to theIl..
expansion losses for a given refrigerm-t. For example, ammonia and C02 have similar molarheat capacity and expansion losses, and their points coincide in Figure 19 regardless of theirquite different temperature lifts (resulting from different TCrit).
Additional simulations were performed for the specified absolute temperatures in theevaporator and condenser of TevaP=8°C and TCOnd=46“C. The COP results are presented inFigure 20. The relative trends in results are consistent with those for the same reducedtemperatures discussed earlier in this section.
‘T
Figure 20. COP of the economizer cycle and Rankine cycle referenced to COPC(T~v,p=8°C TC0.~=460C, refriger~t sorted by ~p,lTevap/~g )
21

5. Ejector Cycle
The majority of work onejectors has been forsingle-phase applications. Anextensive list ofpublications onthetopic isgivenin [7]. Intheapplication considered here, the ejector isemployed to reduce throtiing irreversibilities through the use of kinetic energy of flash gasto increase refrigerant suction pressure at the compressor inlet. Besides basic systemcomponents, the cycle includes a jet ejector and separator, which are contlgured in thesystem as shown in Figure 21. The ejector itself consists of four main parts: the motive(primary) nozzle, suction nozzle, mixing section, and diffhser. High-pressure refrigerantexpands and accelerates in the motive nozzle and mixes with the refrigerant vapor whichenters the ejector through the suction nozzle. The mixture decelerates in the diffiser whichincreases mixture pressure above the pressure in the evaporator. The separator separates thetwo-phase stream into saturated vapor and liquid. The vapor enters the compressor while theliquid is directed to the evaporator through a small-pressure-drop expansion device. Sincethe compression process starts from a higher pressure than the evaporator pressure,compression work is reduced. Also, withdrawal of energy from the expanding refrigerantresults in a lower refrigerant quality entering the evaporator. The resulting effect is anincrease in the cycle COP and volumetric capacity.
Simulating the ejector cycle involved many assumptions. As in the previous sections, theheat exchangers and connecting pipes were considered to have negligible pressure drop.Refrigerant leaving the evaporator and condenser was a saturated vapor and liquid,respectively. Isenthalpic expansion and isentropic compression were assumed. Incalculations, the separator offered zero pressure drop and had 100% effectiveness inseparating the two-phase mixture into saturated vapor and liquid.
The analysis followed the assumptions and calculating scheme presented by Kornhauser [8]for one-dimensional simulation of the ejector. Properties and velocities of the refrigerantwere assumed to be uniform over any cross seetion. The streams entering and leaving theejector were at stagnation conditions, and the mixing of the motive fluid and secondary vaportook place at constant pressure. The processes in the motive and suction nozzles wererepresented by their respective efficiencies, so that velocities at the outlets could becalculated as follows:
The motive nozzle: u~ =
The suction nozzle: us =
h,. = 4n,i - %l%,i - k,. is),
h =h. -n(h .-h .)S,o
where the enthalpies following the isentropic expansion, ~,o,isthe respective inlet entropies to the nozzles and pressure in the
22
--s,1 ‘1s ~--s,l -s,0,1s/
and ~,o,i~, were. defiied bymixing section.

COMPRESSOR
EJHXOR
SEPARATOR
EXPANSIONDEVICE
Figure 21. Schematic of the ejector system and ejector
1.3
1.2
1.1 I
g
2“p 0.9 --m
~a 0.8 --\.a
o.7, --
IJ#
❑ ❑a ❑❑
0.6 I , I
25 50 75 100 125 150
Vapor molar heat capacity (kJ/kmol K)
Figure 22. Capacity and work for the ejector cycle referenced to capacity and work for theRankine cycle (TevaP,,=0.65, TC0,d,r=().82, ejector cornpon&ts
23

Conservation of mass, momentum, and energy for the mixing process results in:
rm+r~=l
Ux = u~r~ + u~r~
Refrigerant enthalpy at the diffuser outlet was calculated by the equation:
The pressure at the diffuser outlet, Pd, was calculated applying the diffiser efficiency conceptand the energy conservation equation:
2
h~’ = h~ + q$
P~ = f(h~’, Sx)
where SXis refrigerant entropy after the mixing process defined by hXand PX.
The mixing pressure in the ejector affects the cycle performance. In all simulationsperformed for this study, the mixing pressure was optimized for each fluid to providemaximum COP. The cycle COP is also affected by the individual efficiencies of the motivenozzle, suction nozzle, and diffuser. The COP displays a different sensitivity to eachcomponent efficiency [7]. Different ejector component efficiencies were used in simulations,but they were all assigned the same efficiency level for a given simulation run. Therefore,the sensitivity of the COP to individual ejector components was not considered in this study.
As in the previous sections on llsl-hx and economizer, 38 refrigerants were simulated atreduced temperatures in the evaporator and condenser of 0.65 and 0.82, respectively. Asshown in Figure 22, the ejector cycle realizes an improvement in both the work requirementand capacity. On a percentage basis, the reduction in work is greater. For the same reducedtemperatures in the evaporator and condenser, the extent of the benefit from the ejector cycleis well correlated by the molar heat capacity of vapor leaving the evaporator. The trend ofQj/Qr and Wj/Wr is very sfiilar to mat for tie econom~er cycle depicted fi FitWre 16J butthe benefit displayed in Figure 22 (which presents the results for all ejector componentefficiencies equal to 100%) is greater. However, when the ejector component efficienciesare all lowered to 80%, the results are nearly identical to the economizer cycle.
24

Figure 23 presents the COP of the ejector cycle for different levels of ejector componentefficiency. The lowest bars in the figure are for a system with the ejector efficiency equal tozero, which reduces the ejector cycle to the Rankine cycle, The additional bar fragmentsindicate COPS for different levels of ejector component efficiency. In general, the ejectorcycle COP is very sensitive to the ejector efficiency. This sensitivity increases at the higherend of ejector component efficiency. In other words, for the same increment in efficiencythe COP improvement is larger at a larger component efficiency value. At low ejectorcomponent efficiencies, low-heat-capacity refrigerants have a better COP. At high ejectorcomponent efficiencies, high-heat-capacity fluids show a higher COP, but it is uncertainwhether such high efficiency levels can be attained in two-phase ejectors.
1
0.9
0.8
0.7
U 0.6
6Q 0.5
>
: 0.4 -
C)0.3
0.2
0.1
0
E3eff=l.O
N eff=O.9
❑ eff=O.8
❑ eff=O.7
❑ eff=O.6
❑ eff=O.O
mt,
Figure 23. COP of the ejector cycle referenced to COPC (Tc,w,r=0.65,TcOnd,r=0.82,refrigerants sorted by CP,Vat Te.W,J
25

Figure 24 supplements the information of Figure 23 by presenting the COP percentimprovement over the COPR. The figure shows an improvement (referenced to COPR) for agiven ejector component-efficiency level. The bottom bar indicates the improvement overthe Rankine cycle for the ejector component efficiency equal to 0.6. Each additional bardenotes an additioml COP improvement over the lower-efficiency level of ejectorcomponents.
Figures 25, 26, and 27 present simulation results for selected refrigerants at assignedabsolute temperatures in the evaporator and condenser, TeVaP= 8‘C, TCo~d=46°C. Inaddition to a COP improvement, Figure 27 shows that the ejector cycle also improves thevolumetric capacity. For most of the fluids the improvement in the volumetric capacity islarger than the COP increase.
80
T
Figure 24.COP improvement of the ejector cycle over the COPR (T~vW,r=0.65,TW~~,,=0.82,refrigerants sorted by Cp,vat T.VW,,)
26

Figure 25. COP of therefrigerants
80
•M eff=l.O
E3 eff=O.9
❑ eff=O.8
E% eff=O.7
❑ eff=O.6
ejector cycle referencedsorted by Z~,lTevaP/hfg)
to COPC (TevaP=80C, TCo~d=460C>
10
0
Figure 26. COP improvement of the ejector cycle over the COP~ (Tevan=80C,TCO~~=46°C, refrigerants sorted bY ‘p,lTevapfhfg)
‘
27

80
70
g
60
;50- -
g’
‘a40
_.
~: ~.
1
~ 20
•llI eff=l.O
S eff = 0.9
❑ eff=O.8
❑ eff=O.7
■ eff=O.6
-10
0
Figure 27. Improvement ofvolmetiic capaci~of tieejector cycle over tiatoftie Ratie
cycle (TeVap=8°C, TCo~~=46”C, refrigerants sorted by ~P,lTev#@
6. Summary
The objective of this study was to compare the theoretical COP potential of three alternativesto the Rankine cycle: the liquid-line/suction-line heat exchange cycle, economizer cycle, andejector cycle. All three modified cycles reduce throttling irreversibilities which vary withevaporator and condenser temperature and from one refrigerant to another.
To limit the infinite possibilities for operating conditions that could be used in this study,simulations were performed at one set of reduced temperatures and one set of absolutetemperatures in the evaporator and condenser. The reduced temperature approach evaluatesfluids at different temperature lifts and allows screening of all fluids. The absolutetemperature evaluation is more oriented towards a given application. General observationsfrom both simulations are summarized below.
The cycle with liquid-line/suction-line heat exchange showed the smallest COP improvementpotential of the three cases studied. In fact, its incorporation into the cycle penalizes theCOP of refrigerants with small molar heat capacity, which are the highest COP~ fluids in thereduced temperature screening. The llsMx improves the COP of large molar heat capacityrefrigerants which have a low COPR. At the theoretical limit of 100 percent llsl-h.x
28

effectiveness, these fluids can achieve the highest COP of all refrigerants. At smaller,realistic values of llsl-hx effectiveness, the COP of all refrigerants is approximately even.The COP change approximates the change in volumetric capacity effected by the llsl-hx [5].
Incorporation of the llsl-hx results in additional superheat at the compressor inlet andincreased temperature at the compressor discharge. This aspect may preclude the use of llsl-hx with small and moderate heat capacity fluids; however, it may encourage the use withlarge heat capacity refrigerants for which the compression process results in a two-phasedischarge condition when no superheat exists at the compressor inlet.
Although the llsl-hx may be the easiest to implement on the a unitary product, theeconomizer cycle is the easiest to implement on a large chiller with either multistagecentrifugal or screw compressors. In some systems, the llsl-hx may be implemented byproviding a physical contact between the existing suction and liquid lines. If a special heatexchanger has to be installed to facilitate the heat exchange, its pressure drop on the vaporside will diminish or may even eliminate the COP benefit of this heat exchanger.
The economizer cycle is a more complicated option, but it improves the COP for all fluids.The improvement results from both the increased capacity and reduced work, the latterhaving a more significant effect. The fluids performing worst in the Rankine cycle benefitedmost in the economizer cycle. Similar to the llsl-hx cycle, the economizer tends to evenperformance for all refrigerants but at a higher level; the COP~co is approximately 10 to 15percent greater than COP~Xfor individual fluids. Still better COP~co could be attained in atwo-stage economizer cycle. Compared to a single stage, the second stage does not provideas large an incremental improvement although it can still be significant; an additional 5%COP improvement on the top of 16% single-stage improvement was evaluated in [9] for R-22at TCO~~=40”C and a condenser/evaporator pressure ratio of 12.
The economizer cycle requires a special compressor with an economizer inlet port. Inpractice, this modification is applied to centrifugal and screw compressors, and may not bepossible for other types of compressors. Thus, the economizer concept may not beapplicable to all refrigeration applications unless staged compressors are employed.
Similar to the economizer cycle, the ejector cycle improves the COP for all refrigerants.The improvement comes from both increased capacity and reduced compression work. TheCOP improvement is sensitive to the ejector’s efficiency. This dependence increases stronglywith the efficiency of the ejector (i. e., the same incremental increase in ejector efficiencyprovides a larger improvement of system COP at a higher ejector-efficiency level).
With the assumptions used in this study, the ejector cycle has a better COP than the one-stage economizer cycle if the efficiency of ejector components (primary nozzle, secondarynozzle, and diffuser) is better than 80 percent. It is unclear whether this high level ofcomponent efficiency can be achieved in a two-phase ejector. It is probably safe to assumethat the efficiencies attainable in a single-phase system (O.85-0.9 for a nozzle and 0.7 for a
29

diffuser) are the practical limit for two-phase ejectors. With very little research done so faron two-phase ejectors, it is unknofi to what degree they can approach the performance ofthe single-phase devices. When the single-phase component efficiencies (O.85 for a nozzleand 0.7 for a diffiser) were applied in simulations for R-134a at two operating conditions(T~vaP=-10”C, TCO~~=460C,and TevaP=8 “C, TCO~~=460C),the economizer cycle had amarginally better COP than the ejector cycle.
The application of the ejector is not limited by the refrigeration system size or design, unlessthere is some limitation as to the size and capacity of the ejector itself. The ejector packagecan be incorporated into a system with typical components, although some component sizechange may be warranted to obtain the COP or economical optimum.
The similar feature for all three modified cycles is that their capability to improve the systemCOP increases with the amount of the throttling losses. For a given application (T~,,P andTCO~~)these losses are related to the ratio ~P,l/~~; for a given fluid, the throttling lossesincrease with the temperature lift (TCOn~-TevaP).
The theoretical character of this study has to be emphasized. No refrigerant heat-transfercoefficients, transport properties, or system effects were considered. Several modelingsimplifications and assumptions were accepted for simulations. Some of the assumptionswere identical for all three cases (e.g., zero superheat at the evaporator outlet) while otherswere applied to a given system (e.g., no losses at the intermediate port of the compressor inthe economizer cycle or no losses in the ejector cycle separator). Although these resultshave to be taken with some degree of caution, it is believed that they fairly assess the relativemerits of the three cycles studied.
7. References
1. Gallagher, J., McLinden, M., Morrison, G., and Huber, M., “NIST ThermodynamicProperties of Refrigerants and Refrigerant Mixtures Database (REFPROP)”, Version4., NIST Standard Reference Database 23, National Institute of Standards andTechnology, Gaithersburg, MD, November 1993.
2. Morrison, G., “Alternative Refrigerant Properties Measurement and CorrelationProgram at NIST”, Proceedings of XI* IUPAC Conference on ChemicalThermodynamics, Como, Italy, Pure and Applied Chemistry, Vol. 63, pp. 1465-1472, 1991.
3. Duffield, J. S., and Hodgett, D. L., “The Choice of Working Fluids for Heat PumpsCondensing at up to 120”C”, Proceedings of the XV* Int. Congress of Refrigeration,Vol. II, pp. 259-265, Venice, 1979.
4. Reid, R. C., Prausnitz, J.M., and Poling, B.E., “The Properties of Gases andLiquids”, McGraw-Hill, Inc., New York, NY, 1987.
30

5. Domanski, P. A., Didion, D. A., and Doyle, J.P., “Evaluation of Suction-Line/Liquid-Line Heat Exchange inthe Refrigeration Cycle”, Int. J. Ref., Vol. 17, pp. 487-493,1994.
6. Threlkeld, J. L., “Thermal Environmental Engineering”, Prentice-Hall, Inc.,Englewood Cliffs, NJ, 1970.
7. Huang, B.J., Jiang, C. B., and Hu, F. L., “Ejector Performance Characteristics andDesign Analysis of Jet Refrigeration System”, Transactions of ASME, Vol. 107, pp.792-802, July 1985.
8. Kornhauser, A. A., “The Use of an Ejector as a Refrigerant Expander”, Proc.ASHRAE-Purdue CFC Conference, Int. Inst. Refrig., Paris, pp. 10-19, 1990.
9. Jonsson, S., “Performance Simulations of Twin-Screw Compressors withEconomizer”, Int. J. Refrig., Vol. 14, pp. 345-350, November 1991.
31