thecb 1/2007 participation forecast and report on participation and success progress january 25,...
TRANSCRIPT

THECB 1/2007
Participation Forecast Participation Forecast andand
Report on Participation and Report on Participation and Success Progress Success Progress
January 25, 2007January 25, 2007
THECB 1/2007
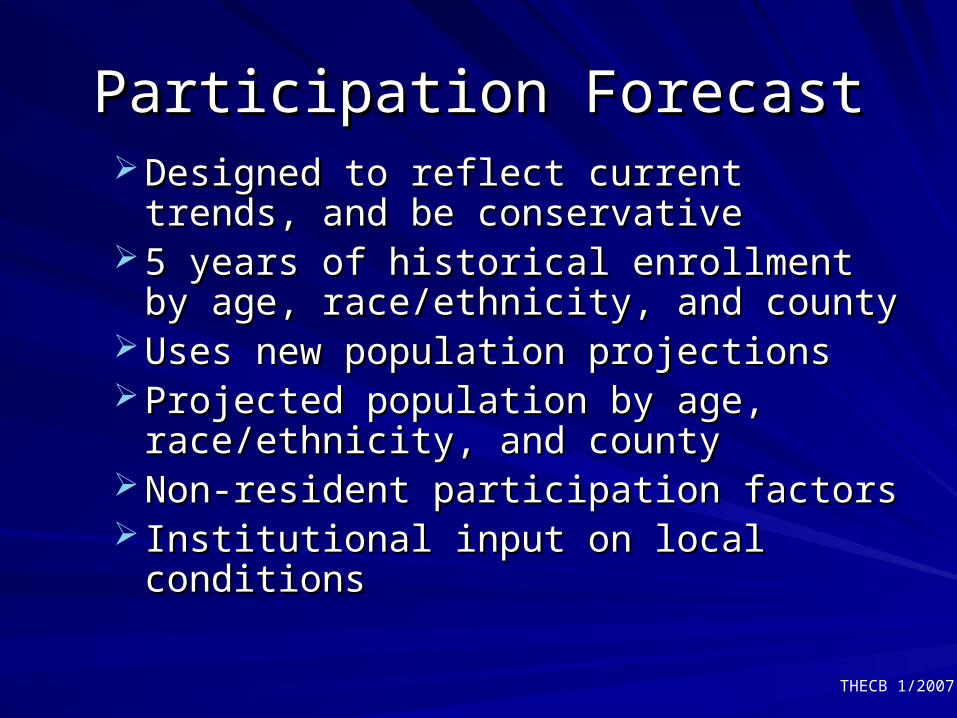
Participation ForecastParticipation Forecast Designed to reflect current trends, and Designed to reflect current trends, and
be conservativebe conservative 5 years of historical enrollment by age, 5 years of historical enrollment by age,
race/ethnicity, and countyrace/ethnicity, and county Uses new population projectionsUses new population projections Projected population by age, Projected population by age,
race/ethnicity, and countyrace/ethnicity, and county Non-resident participation factorsNon-resident participation factors Institutional input on local conditionsInstitutional input on local conditions

THECB 1/2007
2015 Projection is lower than 2015 Projection is lower than previous forecastprevious forecast
Population projections decreased due to Population projections decreased due to change in the recommended migration change in the recommended migration rate which:rate which:
– Lowered statewide population projectionLowered statewide population projection
– Difference largest for HispanicsDifference largest for Hispanics
Most recent five-year enrollment trend Most recent five-year enrollment trend flatter than that used two years agoflatter than that used two years ago
THECB 1/2007
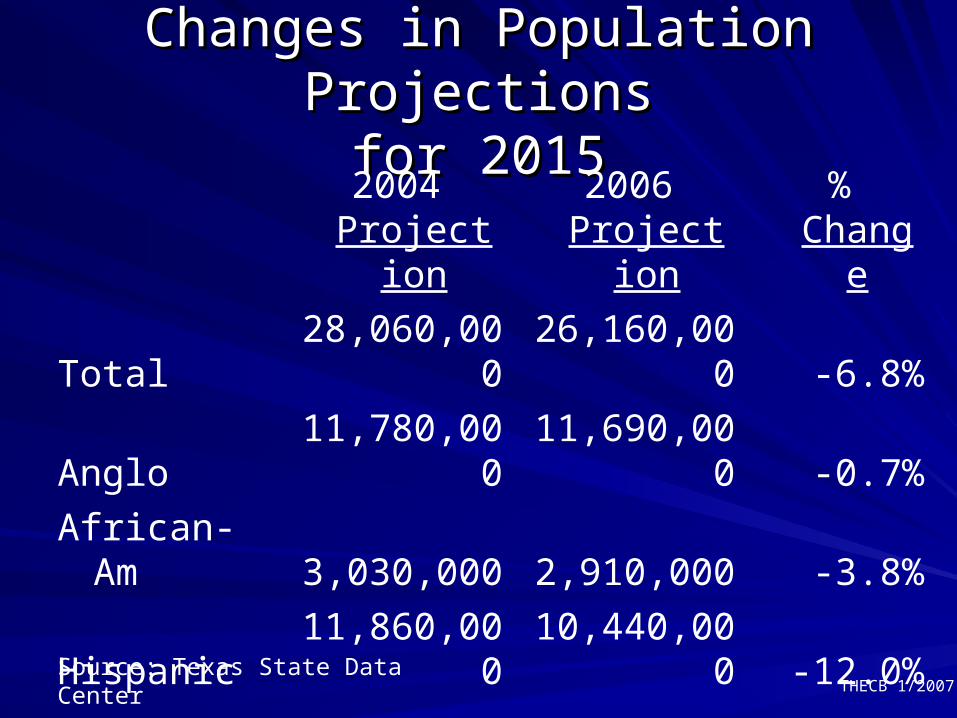
Changes in Population ProjectionsChanges in Population Projectionsfor 2015for 2015
2004 Projectio
n
2006 Projectio
n
% Chang
e
Total 28,060,000 26,160,000 -6.8%
Anglo 11,780,000 11,690,000 -0.7%
African-Am 3,030,000 2,910,000 -3.8%
Hispanic 11,860,000 10,440,000 -12.0%
Source: Texas State Data Center

THECB 1/2007
800,000
1,000,000
1,200,000
1,400,000Actual Forecast
Forecasted EnrollmentPublic Colleges and Universities

THECB 1/2007
2004 and 2006 Participation 2004 and 2006 Participation Forecast DifferencesForecast Differences
1,150,000
1,250,000
1,350,000
2005 2010 2015
2004 Forecast 2006 Forecast
1,317,000
1,292,000

THECB 1/2007
Closing the GapsClosing the Gaps vs Forecast vs Forecast
Closing the GapsClosing the Gaps
Based on where Based on where Texas wants be by Texas wants be by 20152015
Expect changes to Expect changes to happen to reach happen to reach goalsgoals
ForecastForecast
Based on the historic Based on the historic trends trends
What will happen if What will happen if current patterns do current patterns do NOTNOT change change

THECB 1/2007
Close the Gaps in Close the Gaps in ParticipationParticipation
By 2015, close the gaps in By 2015, close the gaps in enrollment rates across Texas to enrollment rates across Texas to add 630,000 more students.add 630,000 more students.

THECB 1/2007
0
200,000
400,000
600,000
800,000
1,000,000
1,200,000
1,400,000
Actual/Forecast CTGs Goals
Institutional Targets
Given Current Trends Texas Will Not Reach Closing the Gaps 5.7% Goal
Public Colleges and Universities

THECB 1/2007
11%
50%
27%
12%
Higher Education is more diverse Higher Education is more diverse
African-Am.
HispanicWhite
Other
Fall 2006
11%
23%
56%
10%
African-Am.
White
Hispanic
Fall 2000
Other

THECB 1/2007
2010 Hispanic Target remains2010 Hispanic Target remains a big challenge a big challenge
140,047
15,67883,990
126,523
51,68434,159
96,55954,618
35,830
0
40,000
80,000
120,000
160,000
200,000
240,000
2010 Insts. Targets
2010 CTG Target
2006 Progress
* Asians are not targeted in the plan.
White Hispanic African-Am

THECB 1/2007
4 Regions account for 91% of Hispanic 4 Regions account for 91% of Hispanic enrollment increase fall 2005 to fall 2006enrollment increase fall 2005 to fall 2006
Metroplex, 17.8%
Others, 9.0%
Gulf Coast, 21.4%
So. Texas, 36.0%
Central Tx, 15.8%

THECB 1/2007
Changes In Rate of IncreaseChanges In Rate of Increase
Decrease in the number of delayed-entry Decrease in the number of delayed-entry studentsstudents
University University – One-year persistence is stableOne-year persistence is stable– Two-year persistence dropped in 2002 and is Two-year persistence dropped in 2002 and is
reboundingrebounding
Two-Year CollegesTwo-Year Colleges– One- and two-year persistence is stableOne- and two-year persistence is stable

THECB 1/2007
108,778108,691105,63699,54194,84992,51088,59286,962
0
20,000
40,000
60,000
80,000
100,000
120,000
1998 1999 2000 2001 2002 2003 2004 2005
The percent of students entering from public high schools increased slightly.
(44.1%)(43.6%) (43.4%)(44.1%)(44.2%)
Percent of GraduatingClass
(44.4%) (45.4%)
Into public higher education only.
(44.5%)

THECB 1/2007
Participation SummaryParticipation Summary
Fall 2006 enrollments represented 2.1% Fall 2006 enrollments represented 2.1% growth over previous fall; low rate but growth over previous fall; low rate but better than 0.9% growth from fall 2004 to better than 0.9% growth from fall 2004 to fall 2005fall 2005
Hispanic enrollment growth was Hispanic enrollment growth was substantial but continues to trail targetssubstantial but continues to trail targets
Percentage of students coming directly Percentage of students coming directly from high school increased slightlyfrom high school increased slightly
THECB 1/2007
Close the Gaps in Close the Gaps in SuccessSuccess
By 2015, award 210,000 undergraduate By 2015, award 210,000 undergraduate degrees, certificates and other identifiable degrees, certificates and other identifiable student successes from high quality student successes from high quality programs.programs.
THECB 1/2007
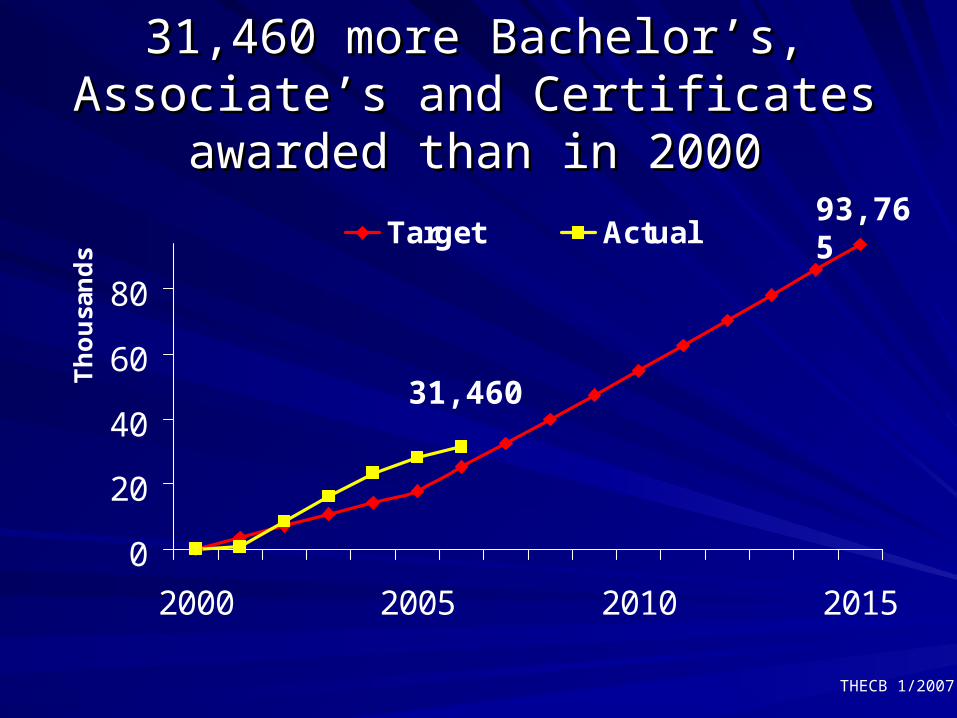
31,460 more Bachelor’s, Associate’s 31,460 more Bachelor’s, Associate’s and Certificates awarded than in 2000and Certificates awarded than in 2000
0
20
40
60
80
2000 2005 2010 2015
Th
ou
san
ds
Target Actual
31,460
93,765

THECB 1/2007
University Graduation Rates University Graduation Rates Increasing Increasing
Graduation Rate FY 1999 FY 2005
4-Year 19.9% 24.3%
5-Year 39.7% 48.1%
6-Year 49.2% 56.7%
Graduation & Persistence 63.5% 70.3%
Transfers’ Grad Rate 49.3% 52.2%
Students Receiving Pell 25.7% 31.6%

THECB 1/2007
Two-Year CollegesTwo-Year CollegesGraduation and Persistence IncreasingGraduation and Persistence Increasing
FY 2000 FY 2005
Bachelor’s Degrees 12.6% 16.3%
Associate’s Degrees 8.7% 9.9%
Certificates 4.4% 4.4%
Persisting 12.3% 13.4%
Total Grad & Persist Rate 38.0% 44.0%

THECB 1/2007
Public Institutions’ Bachelor’s targets still Public Institutions’ Bachelor’s targets still below the 2010 Closing the Gapsbelow the 2010 Closing the Gaps
7,163
21,115
13,04711,763
14,263
5,664
0
4,000
8,000
12,000
16,000
20,000
24,000
2010 Insts' Targets
To Reach 2010 CTG Target
2006 Progress
Bachelor’s Associate’s

THECB 1/2007
Public Doctoral Institutional targetsPublic Doctoral Institutional targetsExceed 2010 Closing the Gaps targetExceed 2010 Closing the Gaps target
1,201
422
120
0
300
600
900
1,200
1,500 2010 Insts' Targets
To Reach 2010 CTG Target
2006 Progress

THECB 1/2007
Institutional Targets for Undergraduate Institutional Targets for Undergraduate Minority Awards’ are Far Short Minority Awards’ are Far Short
3,403
17,5189,976 11,806
14,177
13,492
4,6206,254
0
5,000
10,000
15,000
20,000
25,000
30,000 2010 Insts' Target
To Reach 2010 CTG Target
2006 Progress
* Not targeted in the Plan.
White* Hispanic African-Am.

THECB 1/2007
How can we increase graduates in How can we increase graduates in critical fields?critical fields?
4,075
11,022
4,997
501
3,018
5,380
0
4,000
8,000
12,000
16,0002010 Insts' TargetTo Reach 2010 CTG Target2006 Progress
Technology Nursing/Allied Health
THECB 1/2007
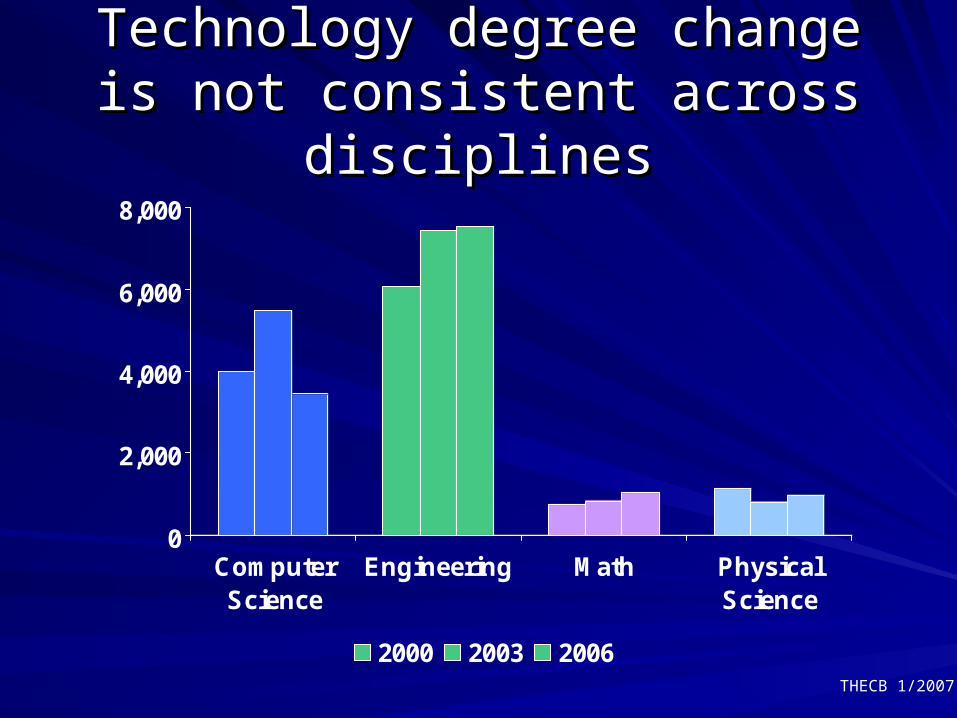
Technology degree change is not Technology degree change is not consistent across disciplinesconsistent across disciplines
0
2,000
4,000
6,000
8,000
ComputerScience
Engineering Math PhysicalScience
2000 2003 2006

THECB 1/2007
UG awards in Allied Health and Nursing UG awards in Allied Health and Nursing continue to improve continue to improve
0
2,000
4,000
6,000
8,000
10,000
12,000
14,000
16,000
18,000
20,000
THECB 1/2007
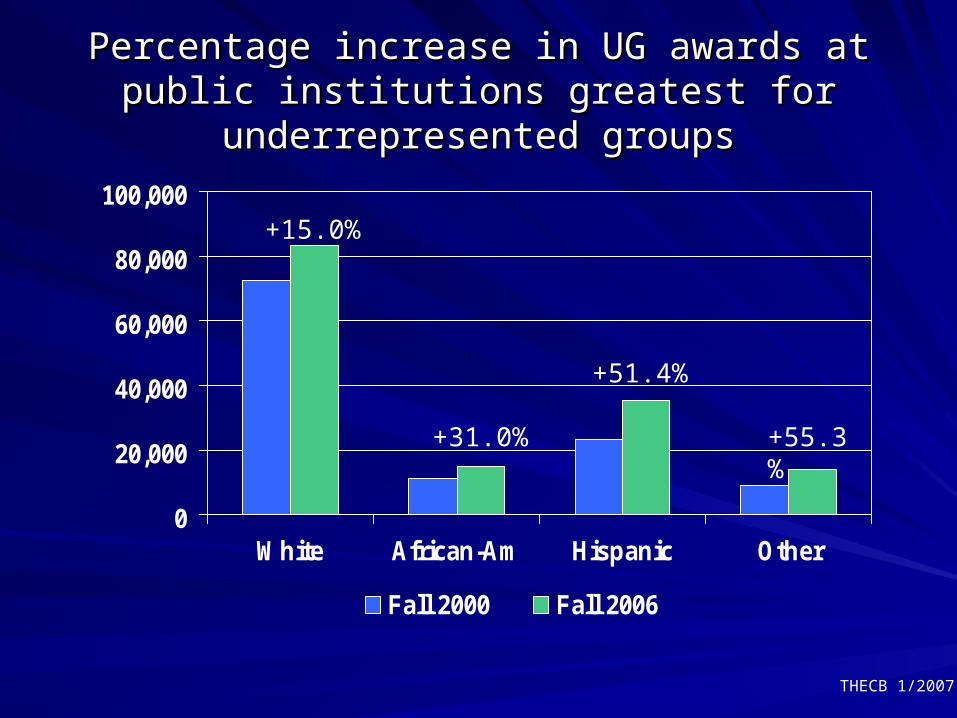
Percentage increase in UG awards at public Percentage increase in UG awards at public institutions greatest for underrepresented groupsinstitutions greatest for underrepresented groups
0
20,000
40,000
60,000
80,000
100,000
White African-Am Hispanic Other
Fall 2000 Fall 2006
+15.0%
+31.0%
+51.4%
+55.3%

THECB 1/2007
Next Steps?Next Steps?
Revise strategies for each Revise strategies for each Closing the Closing the GapsGaps area to focus efforts on pertinent area to focus efforts on pertinent activities that lead to genuine progressactivities that lead to genuine progress
Concentrate on Hispanic participation and Concentrate on Hispanic participation and success success