the world in 2100 population climate: sea level future of global society forests / carbon cycle...
TRANSCRIPT

The World in 2100
Population
Climate:
Sea level
Future of global society
Forests / Carbon cycle
Arctic sea ice cover
Catastophes

Philosophy
•Detailed future prediction is not possible. Some events are inherently unpredictable (except perhaps in a probabilistic way?). Examples are:
natural disasters: meteorite impact, plagues…
Unanticipated technological advance: Industrial revolution, powered flight, telecommunications, computers).
•Involves extrapolation of existing trends… reliability decreases the further into the future one goes.
•However, some limits can be placed on what is most probable.
(Major conflicts – WW I, II, III?)

The dangers of extrapolation:
In mid-Victorian London, horse dung and coal smoke were the major pollution problems. Commentators believed they would eventually make the city uninhabitable.
Children earned money by sweeping a clean path along the street for wealthy people.

Population

UK population 1600-2000
0
10,000,000
20,000,000
30,000,000
40,000,000
50,000,000
60,000,000
70,000,000
1600 1700 1800 1900 2000 2100

Population in 2100
Optimistic: voluntary population control in a wealthy, educated world results in a stable, sustainable global population, possibly below today’s in 2100.
Pessimistic: Continuing lack of education, inadequate healthcare and contraception availability results in a population of 12-20 billion.
Most probable (?) (Lutz et al., Nature 412, 543-545, 2001) peak of <10 billion before 2100.
(Currently 6.3 billion, rising about 1% per year).

IPCC SRES scenarios global population projections.•All scenarios predict slower rate of increase through most of the 21st century than at present.

Optimistic
Rapid population growth is a transitory phase associated with change from pre-industrial to post-industrial society.In poor regions where mortality rates are high, birth rates are high.Advances in medicine and hygiene lower mortality rates, but birth rates initially remain high population grows rapidly.Eventually the birth rate declines because of:
Reliable access to medicine, hospitalsAvailability of contraceptionChanging attitudes of the society to women and
family.Increasing education and awareness of population.
True for Western Europe, but less so for USA.

Temperatures in 2100

Range of temperature predictions from IPCC climate models for a doubling of CO2 by 2100
3.2
1900
2.4
1.6
0.8
0
-0.8
21001800 2000 2200
(Source: Java climate model parameterizations, by Ben Matthews, Sarah Raper).

Climate model response and uncertainty
•Current models predict a 2-3.5 ºC increase over 1900 temperatures, for a doubling of CO2 by 2100. No uncertainties due to release scenarios (i.e. social factors) are included in the uncertainty.
However, both the prediction and its uncertainty has changed little over this time.
(i.e. US National Academy of Sciences report in 1980 gave 1-3 ºC increase for a doubling of CO2)
Climate models and understanding have increased greatly in sophistication since 1980.
Reasons: The fundamental mechanism of global warming (increased IR opacity of the atmosphere) is well understood.However, many important details of the climate system are complex, difficult to model and not amenable to experiment.

Sea level rise?
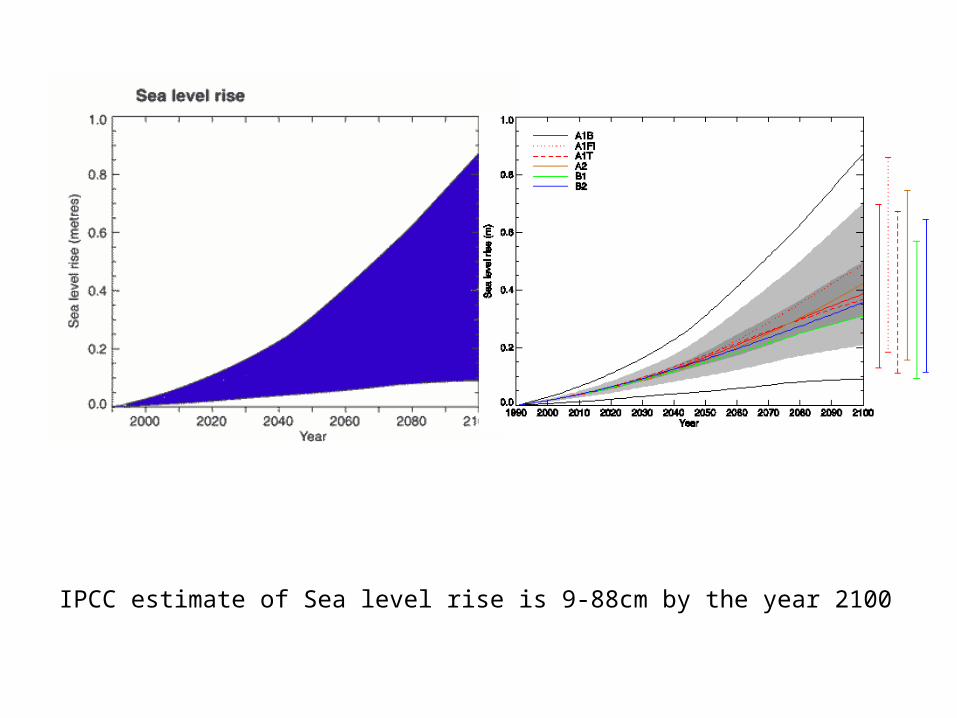
IPCC estimate of Sea level rise is 9-88cm by the year 2100


GFDL coupled model, Princeton
Predicted sea ice thickness

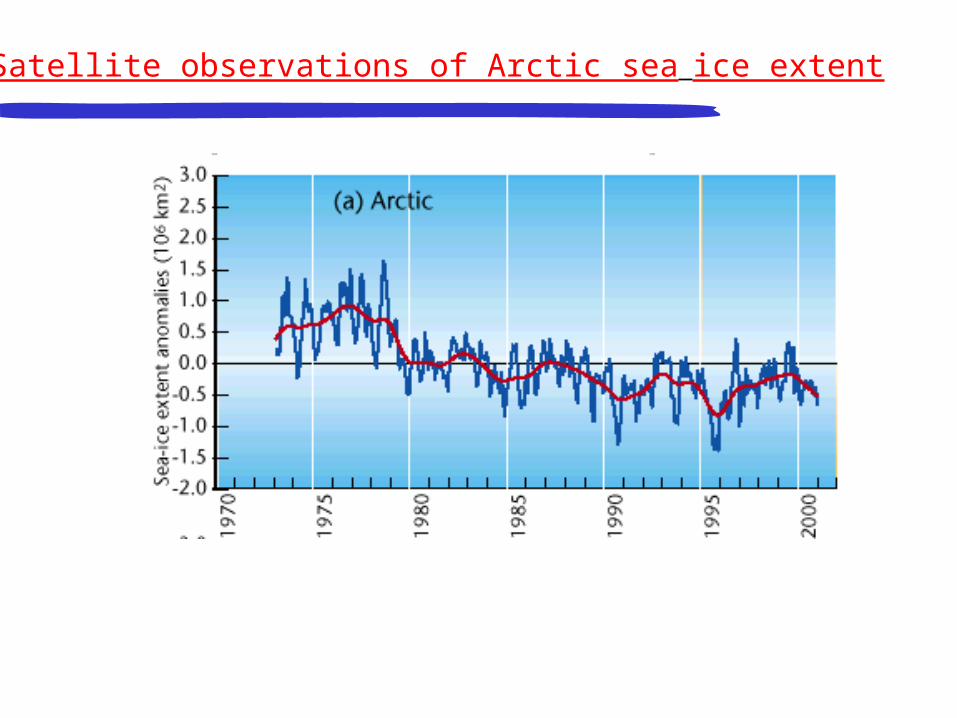
Satellite observations of Arctic sea ice extent

Sea ice extent
•Models in general predict a substantial loss of sea ice, particularly in the Arctic.
There is controversy over the extent to which sea ice is actually thinning and contracting, and whether the observations fit existing models.
•Large sea ice decrease will exacerbate climate change (already incorporated in many models). There will be loss of habitat for Arctic species.
•It may open a polar route for commercial ships between Europe and the Far East.

Courtesy John Grace, U. Edinburgh

Courtesy John Grace, U. Edinburgh


Carbon cycle:change of carbon in vegetation and soils according to the Hadley Centre coupled carbon-climate model.

Forests and carbon
•Deforestation is occurring rapidly in the tropical regions; at current rates primary tropical forest will be mostly destroyed before the end of the century. •In contrast, temperate forests are mostly increasing in extent and biomass.•However, tropical forests have much greater biomass and biodiversity than temperate forests.
•Land use change interacts strongly with climate and the carbon cycle, but the most sophisticated models disagree fundamentally on what the effect will be on the future climate:
•The Hadley centre coupled carbon/climate model suggests that climate change will cause the Amazon to release much of its stored carbon to the atmosphere, accelerating climate change and destroying the forest.
•The IPSL model doesn’t show this effect at all.

Global Social Scenarios
1) Variables include: economic growth ratePopulation growth rateTechnological and medical advanceEnergy efficiency and fuel typeSocial coherence: “globalization” to “self-sufficiency”Number and severity of wars and conflicts.
2) Catastrophes are generally excluded: social breakdown, global epidemic, Wars killing > 108 peopleMeteorite impact, etc
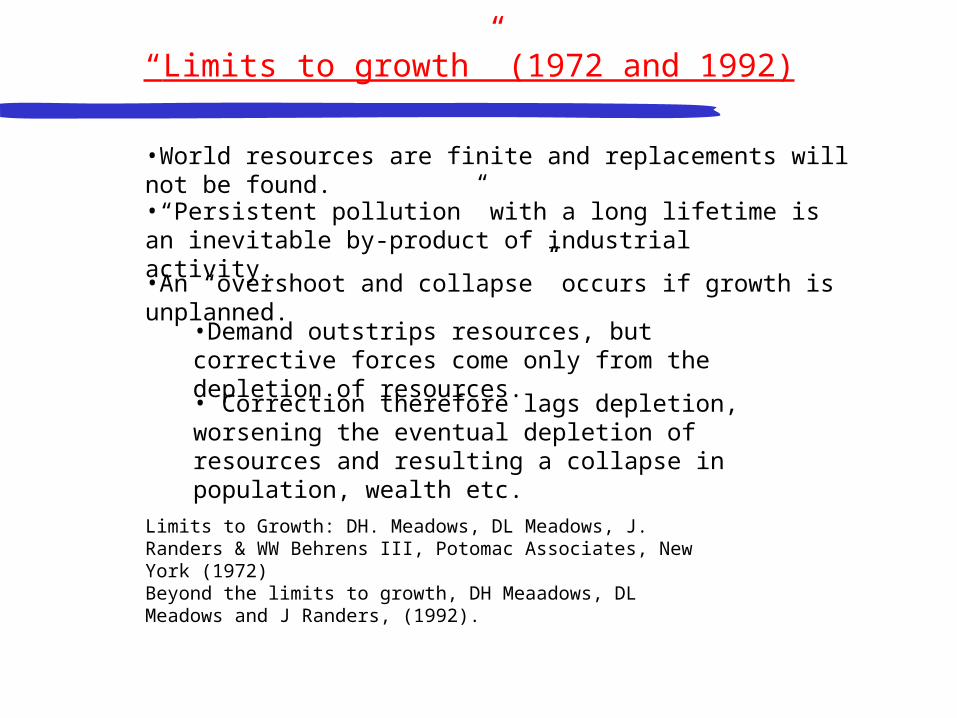
“Limits to growth” (1972 and 1992)
•World resources are finite and replacements will not be found.
Limits to Growth: DH. Meadows, DL Meadows, J. Randers & WW Behrens III, Potomac Associates, New York (1972) Beyond the limits to growth, DH Meaadows, DL Meadows and J Randers, (1992).
•“Persistent pollution” with a long lifetime is an inevitable by-product of industrial activity.
•An “overshoot and collapse” occurs if growth is unplanned.
•Demand outstrips resources, but corrective forces come only from the depletion of resources.• Correction therefore lags depletion, worsening the eventual depletion of resources and resulting a collapse in population, wealth etc.
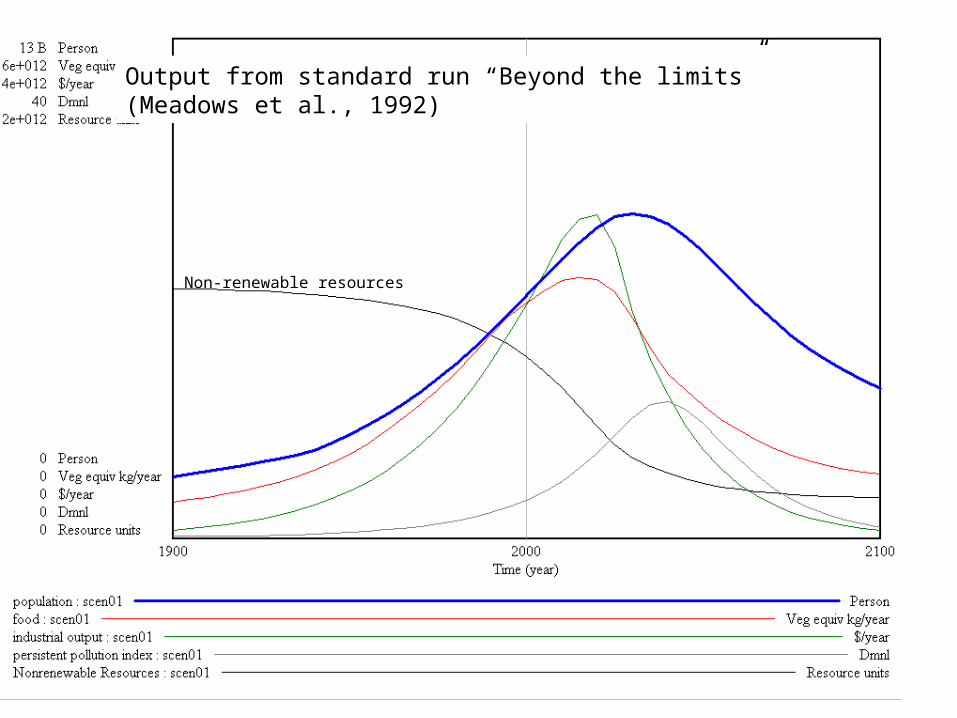
Output from standard run “Beyond the limits”(Meadows et al., 1992)
Non-renewable resources


Criticisms of “Limits to growth” approach.
•Difficulty of predicting technological advance.
•Rigidity of structure and variables in a relatively simple computer model.
•An alternative approach involves the generation of qualitative “storylines” and “scenarios” to describe possible futures, which may then be used to guide more quantitative models.
•This is the approach adopted by the IPCC.
•One-dimensional variables are used to describe complex quantities such as “resource depletion”, “industrial output”, and “persistent pollution”. •The relation between variables cannot alter with time or prevailing circumstances.
Catastrophes
•Though we can’t predict them deterministically, we can say something about their probability of occurrence, using graphs of frequency versus destructiveness. Try this for:
•1) Meteorite/cometary impacts
•2) Major wars

10-8
10-4
100
1014 1016 1018 1020
Energy of impact (Joules)
Fre
qu
en
cy p
er
yea
r
Revelstoke
Tunguska
Zhamanshin
1022 1024
104
Meteor Crater
Eros?
Chicxulub
World’s nuclear arsenal
Frequency vs energy of extra-terrestrial impact
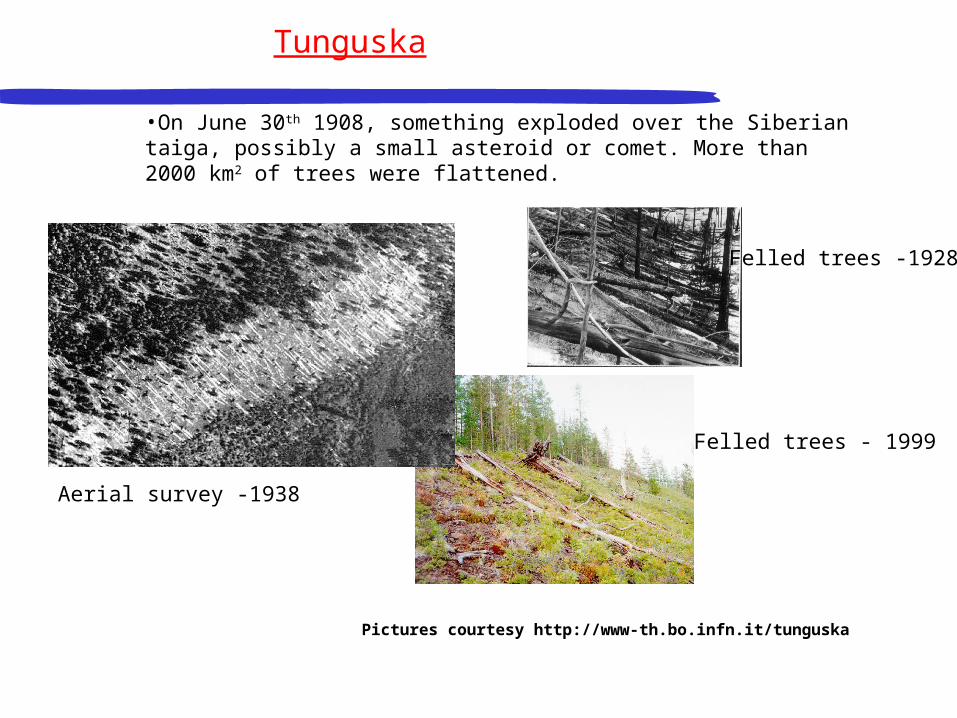
Tunguska
•On June 30th 1908, something exploded over the Siberian taiga, possibly a small asteroid or comet. More than 2000 km2 of trees were flattened.
Pictures courtesy http://www-th.bo.infn.it/tunguska
Felled trees -1928
Felled trees - 1999
Aerial survey -1938

Richardson, L. F., Statistics of Deadly Quarrels. (Quincy Wright and C. C. Lienau, eds.)
Pittsburgh: Boxwood Press, 1960.
Present world population
WW 1&II
8
6
4
2
0
2 4 6 80 10
8
6
4
2
0
Log
10 n
o o
f co
nflic
ts
Log10 number of deaths per conflict
Richardson’s Analysis of wars over 126 year period(1820 – 1945)
Extinction?Return periodA few hundred years

