the 'workmen's compensation injury table' and …
TRANSCRIPT

110 WORKMEN'S COMPENSATION INJURY TABLE
THE "WORKMEN'S COMPENSATION INJURY TABLE" AND "STANDARD WAGE DISTRIBUTION TABLE"- -
THEIR DEVELOPMENT AND USE IN WORKMEN'S COMPENSATION INSURANCE RATEMAKING*
BY
BARNEY FRATELLO
INTRODUCTION
Workmen's Compensation Insurance Ratemaking is, in its broad aspects, similar to ratemaking in the other fields of casualty insur- ance. It is known, for example, that the various casualty lines are engaged in a common search for rates that are "adequate" but "not excessive" or "discriminatory"; that in order to attain this common objective, it generally involves the accumulation and analysis of a large volume of loss experience which is adjusted to reflect current conditions through the application of experience modification factors. The manner in which adjustment factors are determined, however, usually proceeds along specialized lines that are singularly appropriate to a particular line of insurance. In Workmen's Compensation Insur- ance, for instance, the so-called "Law Amendment Factor" is unique in the manner of determination but, as with other experience factors, it is essentially designed to adjust loss experience to reflect current conditions. In this respect "current conditions" signifies the latest revision of benefit provisions contained in the Workmen's Compensa- tion Insurance Act of a particular state.
Underlying the workmen's compensation loss experience of a given state is the Workmen's Compensation Insurance Act of that particular state. When the "Act" is amended by the state legislature in a man- ner that affects the future payment of compensation benefits, it is obviously important to determine a "Law Amendment Factor" which serves to express the loss experience, under examination for the purpose of revising rates, in terms of the revised benefit provisions. If this revision is of such a nature that "accident distributions" are essential to its determination, this factor may be calculated for the most part in two ways.
The first method involves the revaluation of a representative sample of the compensable accidents underlying the loss experience under consideration in terms of the revised benefit provisions and comparing the resulting cost to the actual cost. Although this may appear to be a commendable procedure, experience reveals that it is wholly impracticable for routine procedure. Besides, the notion of "representative sample" hinges on the immediate availability of an
*This p a p e r p r e s e n t e d by inv i t a t ion .

WORKMEN'S COMPENSATION INJURY TABLE I i i
adequate volume of cases and on the assumption that complete details regarding every compensable accident is made available to the rating organization which, in fact, is not the case. The other method, adopted by the National Association of Insurance Commissioners, provides for the valuation of benefit provisions based on a single distribution of countrywide compensable accidents, which once established, serves as a relatively permanent base. This latter method furnishes an equally satisfactory but much simpler device for determining the benefit effect of certain types of law amendments.
It is recognized that recourse to an "accident distribution" table is not always essential for determining benefit differentials. As a matter of fact, a review of workmen's compensation legislation which became effective during 1951 and 1953, the heaviest legislative years prior to this writing, reveals that it was necessary in less than fifty percent of the valuations to resort to the "accident distribution" tables. For the most part, the remainder of the valuations was based on a table of "Standard Wage Distributions."
When revision of the compensation act involves a revised weekly benefit scale, it is at times sufficient to merely resort to a table of "wage distributions," disregarding "accident distributions," in order to determine the benefit differential. Since the various state "Acts" provide for payment of compensation benefits at a percentage of the injured employee's average wage, but subject to certain specified minimum and maximum weekly amounts, it follows that wages have a limited effect on loss experience.
Consider the employee whose weekly benefit award, at the specified rate of compensation provided in the "Act," amounts to less than the statutory minimum weekly benefit. Application of the minimum con- dition will result, in effect, in the payment of benefits based on a higher wage than is actually earned by the injured employee. Con- versely, the employee whose weekly benefit award is subjected to the maximum limitation will receive, in effect, an award based on a lower wage scale. Although more will be said on this particular sub- ject in Parts II and III of this paper, it may be stated at this point that with a change in the statutory benefit scale of the Compensation Act there is involved a corresponding change in effective benefit wages. In order to measure the effect of the change, it is essential to resort to some standard wage distribution (unless the compensable cases underlying the loss experience are to be revalued which, for the reasons previously mentioned, is not feasible).
Thus the determination of the "Law Amendment Factor" may require the employment of an accident and/or wage distribution table, depending on the nature of the law amendment. The development of Workmen's Compensation accident and wage distributions will con- stitute the subject matter of this paper. Par t I will treat with acci- dent distributions, Par t II with wage distributions and Par t III will illustrate the combined use of these distributions in valuing the effect of a hypothetical law amendment.

112 WORKMEN'S COMPENSATION INJURY TABLE
PART I - DEVELOPMENT OF THE "W0RKMEN'S COMPENSATION INJURY TABLE."
A. Historical and Statistical Background: This paper would be incomplete, we believe, if we neglected to comment on the "American Accident Table" published in Volume VII, P.C.A.S. 1920-21" and the "Standard Wage Distribution Table," described in Volume IX, P.C.A.S. 1922-23.T The development of these tables precede the newly created "Workmen's Compensation Injury Table" and "Standard Wage Distribution Table" by approximately thir ty years. During the course of this period, there have been many instances where the calculated effect of a law amendment based on these earlier tables had been rechecked by actual revaluation of accidents and the two results were found to be in rather close agreement. Preliminary tests indicate that the new "Workmen's Compensation Injury Table" and "Standard Wage Distribution Table" will produce results that are similar to their older counterpart.
However, subsequent tests indicate an appreciable difference in the results produced by the old and new tables where the amendment pro- vides for increased benefits for the so-called "healing period," that is, benefits for temporary total disability in addition to benefits for permanent partial disability. In this connection it is to be noted that the limitations of the old table with respect to a valuation of a change in the healing period is clearly set forth in the following quotation from Page 61, Volume VII, Proceedings of Casualty Actuarial Society:
"Very little material was available for a distribution of temporary total disability in permanent partial cases, only two states, California and Oregon, having presented such statistics and these for only one year each. However, the results followed very closely those obtained by Dr. Rubinow in the Standard Accident Table and it was felt that the data when smoothed was sufficiently reliable for the present purpose. The comparison with Dr. Rubinow's results ob- tained by the use of Russian statistics which is presented on the preceding page is interesting."
The new table incorporates, for the first time, accurate statistics, based on American data, with respect to the healing period. The new data are found to have considerably more effect on compensation costs than that derived from the sketchy data available when the old American Accident Table was compiled.
Considering the limited amount of workmen's compensation sta- tistics available thir ty years ago and the many changes in compen- sation benefit provisions, working and social conditions since that time, it is a tribute to the capabilities of the original authors that
*See "An Amer. Acc. Table" by Olive E. Outwater. tSee "Legal Limits of Weekly Compensation in Their Bearing on Ratemaking for Workmen's Compensation Insurance" by A. H. Mowbray.

WORKMEN'B COMPENSATION INJURY TABLE 113
their tables have produced consistently satisfactory results. The "older" tables are not being replaced for functionary reasons but simply because of a desire to base law valuations on relatively more recent statistical data.
In 1950, the National Council on Compensation Insurance decided to undertake a statistical study aimed at reviewing, and, if necessary, to revise the "American Accident Table." At the December 1950 session of the National Association of Insurance Commissioners, the Chairman of the Workmen's Compensation Committee appointed a Subcommittee of Departmental Technicians "to study the valuation of law amendments separately and in conjunction with the National Council staff." During the spring of 1951, the National Council's Committee, after meetings with the Subcommittee of Departmental Technicians, ~irculated a special "Call for Accident Statistics" (repro- duced as Appendix "A") among the insurance carriers. This "Call" visualized the accumulation of 10,000 Major Permanent Partial cases; 25,000 Minor Permanent Partial cases; and 40,000 Temporary Total injury cases. Supplementing the "Call" directed at the insurance car- riers, another special "Call" (reproduced as Appendix "B") directed at the Independent Rating Organizations was expected to produce 25,000 additional Fatal and Permanent Total injury cases. These data were to be taken from Individual Case Reports filed by the carriers with the National Council or with the Independent Bureaus.
The response to both "Calls," although gratifying when considering the expense in man-hours, varied with some organizations reporting data almost immediately and a few reporting as long as one year after circulating the "Call." However, the time element was not significantly important inasmuch as it required more than a year to audit each reported case for inconsistencies with the instructions appended to the "Call" and to search out obvious conflicts with the jurisdictional Workmen's Compensation Act. In this respect, a vol- uminous amount of correspondence was carried on between the Na- tional Council and the participating organizations.
While the next phase of the study involving the transfer of data to punch cards was, in itself, an enormous task, designing suitable punch cards which would assure the necessary tabulations presented the major problem. Since the analysts engaged in the study could not anticipate the quantity or the nature of tabulations that would ultimately enter into the study, it was decided to punch as much of the descriptive and statistical data as reasonably possible. As a result, cards were set up for Fatal, Permanent Total, Major and Minor Permanent Partial and Temporary Total injuries that would produce the tabulations outlined in Exhibits A-I through A-IV. Before pro- ceeding with the t ransfer of the bulk of the data to punch cards, however, a series of preliminary tabulations based on the reportings of a large carrier revealed that the cards as d e s i g n e d - except for a few minor changes - -wou ld produce a wide variety of tabulations. It is estimated that data on approximately 100,000 compensable cases,

114 WORKMEN'S COMPENSATION INJURY TABLE
after being carefully audited and coded, were transferred to punch cards prior to tabulation.
B. Fatal Tabulations: The total number of reports included in the study of Death cases numbered 24,282, of which, there were 10,762 National Council and 13,520 Independent Rating Organization Case Reports. Preliminary tabulations established the following relation- ships :
Percent of Total Cases Type of Dependency Council
No Dependents 9.9% Completely Dependent 83.0 Partially Dependent 2.4 Dependency Undetermined 4.7
Total '100.0%'
Independents Combined
12.7% 11.4%
75.8 79.0 0.4 1.4
11.1 8.2
100.0% 100.0%
Compensation benefits to "Partial Dependents" are usually contin- gent upon a variable degree of dependency. In this respect, the infor- mation contained in the small number of individual case reports involving "Partial Dependents" was, for the most part, incomplete and entirely inadequate for the purpose of determining a reliable average. Besides, the typical Workmen's Compensation Act allows benefits to "Partial Dependents" only if maximum benefits provided in the "Act" have not been exhausted by "Completely Dependent" cases and the inclusion or exclusion of these few cases from the dis- tribution would produce a very n e g l i g i b l e - if a n y - effect on the ultimate cost of insurance. As a result, it was decided to include the cases in this category with the "No Dependent" cases.
With regard to the group marked "Dependency Undetermined" (cases for which a reserve had been set up but for which a dependency status "may" or "may not" materialize), it was decided to exclude these cases from the study which, in effect, is equivalent to redistribut- ing them proportionately over the original distribution. On the basis of the forementioned observations and conclusions, the final Death tabulations indicated that "No Dependent" cases constitute 13.9% and "Dependent" cases 86.1% of the Fatal distribution. Exhibit B-I shows the actual distribution of 24,282 Death cases before adjustment.
Having established the accident frequency according to the nature of dependency, the next phase of the study involved the determination of average ages representing the various dependency classes. In this respect it was decided to calculate the "arithmetic average age" and, in addition, a so-called "pension age" from punch card data which contained complete age information for the designated dependency classes. For Fatal computations involving a Workmen's Compensation act wherein the benefit provisions are limited to a specified duration

WORKMEN'S COMPENSATION INJURY TABLE 115
and/or subject to a maximum amount payable in the aggregate, it was decided that the determination of present values would be based on the "arithmetic average age" in accordance with established pro- cedure. However, in order to properly value a compensation act which provides for benefit awards that are the equivalent of life annuities or which revises temporary awards to awards involving life benefits, it was decided to base present values on the "pension age."
The determination of the "arithmetic average age" followed the procedure commonly associated with statistical distributions. The "pension age," however, was determined so that the product of the total number of cases (appearing in Exhibits B-II and B-III) and the present value of a life pension at the "pension age" is equal to the summation of the present values of similar life pensions at the differ- ent ages included in the age distribution. With regard to the "pension age" involving widows or parents, the present values were taken from Special Bulletin 222, 1948, New York Workmen's Compensation Tables.
Due to the effect of remarriage in the tabular values of the tables involving widows, it was discovered that two entirely different ages could represent the "pension age" and yet produce similar results for computational purposes.
Exhibit B-IV shows both "pension ages" as a matter of interest, although it has been decided that the younger of the ages will be used for determining the value of a life benefit.
As for the "pension age" involving dependent parents, it will be noted (Exhibit B-IV) that the "arithmetic average age" is identical to the "pension age." Of course, the determination of the "pension age" for dependent children is, in effect, without meaning since the various compensation acts generally provide benefit p a y m e n t s - - e x - cept for the infrequent occurrence of mental or physical incapacita- t i o n - to children until age eighteen or, as in a few isolated compen- sation acts, until age twenty-one. For the purpose of routine compu- tations it was decided to use a single average age to represent depen- dencies of the same genus. It was felt, however, that the detailed age breakdown of Exhibit B-IV should be made available for calcula- tions of a special nature.
Although it is not too important, since it concerns but a minute portion of the fatal distribution, it might be interesting to mention that the average age for "brothers and/or sisters" presented a peculiar problem. The average of the "American Accident Table" for this particular status of dependency indicated age "11." The new tabulations indicated a radical departure from the generally accepted notion that dependent brothers or sisters were necessarily juvenile. It was observed that for these cases, the average age of the brother or sister was approximately "43" years. Since this was the most striking departure from the average ages of the "American Accident Table," the age data for this group were studied in detail and in

116 WORKMEN'S COMPENSATION INJURY TABLE
conjunction with the age details of the corresponding deceased em- ployee :
BROTHERS and/or SISTERS
No. of Average Age No. of Cases
2 2 1 7
10 13
5 3 2 1 1
Dependents Dependents Dependent Deceased
1 Brother or Sister 2 17 22 1 Bro ther or Sister 2 28 44 1 Bro ther or Sister 1 34 18 1 Brother or Sister 7 44 51 1 Bro ther or Sister 10 52 64 1 Brother or Sister 13 64 53 1 Brother or Sister 5 74 66 2 Bro thers or Sisters 6 11 23 3 Brothers or Sisters 6 17 Not Given 4 Brothers or Sisters 4 51 48 4 Brothers or Sisters 4 12 19
Total and Average 60 43 48
It will be noted that the average age of the deceased employee is approximate ly "48" and, therefore, unlikely that the average age of the brother or sister would deviate radically f rom that of the de- ceased. As a possible explanation, it was offered that the dependent may be an unmarr ied sister or sisters acting in the capacity of house- keeper. Whatever the t rue explanation, it was decided to use the sta- tistical indications.
C. Permanent Total Tabulations: The procurement of tabulations fo r Pe rmanen t Total disability did not present any part icular prob- lems wor thy of special mention. The requirements of an accident table fo r routine Pe rmanen t Total calculations are relatively simple involving, merely, the total number of Pe rmanen t Total disability cases and a single representat ive average age. Inasmuch as most Pe rmanen t Total calculations are independent of the accident dis- tr ibution, the requirements of an accident table, in effect, are fur ther reduced to the determinat ion of a single average age. However, in order to take care of the few calculations that require special t reat- ment, i t was decided to make available (Exhibi t C-I) a detailed and summarized breakdown of Pe rmanen t Total cases.
While on the subject of "special" Pe rmanen t Total calculations, it will be noted that a few state compensation acts provide for benefit awards based on the existence and nature of dependency. In the past, when a Pe rmanen t Total calculation required a knowledge of depen- dency, it was assumed that the dependency distr ibution of "Fa ta l " in ju ry was also applicable to Pe rmanen t Total disability. Since indi- vidual case reports, the original source of Pe rmanen t Total data, did

WORKMEN~S COMPENSATION INJURY TABLE 117
not contain any information relative to "dependency," it was decided to continue with established procedure. As a result, the "Workmen's Compensation Injury Table" as finally assembled in Exhibit F-II indicates that 86% of the Permanent Total accident distribution con- sists of dependent cases and, by inference, that cases involving a dependent wife comprise 34.2%; a dependent wife with one child 15.5% ; a dependent wife with two children 11.7% ; etc.
With regard to average ages, it was decided to determine an "arith- metic average age" and, as in fatal injury, to investigate the feasi- bility of using a "pension age". In this respect, the method of deter- mination followed the procedure outlined for Fatal injury with the exception that averages were based on the age distribution shown in Exhibit C-II. The "arithmetic average age" and corresponding "pen- sion age" were determined to be "age 50" and "age 52" respectively. The employment of either age for computational purposes, however complex, would not produce a significant difference. As a result, it was decided to employ the younger age for all types of Permanent Total valuations.
D. Permanent Partial Tabulations. A study of the survey form appended to the "Call for Accident Statistics" will reveal that the in- surance carriers were requested to report, separately for Major and Minor Permanent Partial disability, the "Principal Basis of Award or Settlement" as related to the "Dismemberment Schedule", to "Permanent Total" (the body as a whole), or by "Lump Sum Settle- ment." The committee requested preliminary tabulations according to this breakdown before combining the data into a unified whole. But before proceeding along these lines, it was decided to dispose of a sizeable number of "multiple injury" cases; so-called because the cases involved injury to more than one bodily member and/or func- tional impairment of the body.
These "multiple injury" cases were treated in the following manner: (1) For cases involving amputation and/or loss of use of two or
more members of the body, anyone of which could constitute Major Permanent Partial disability, the percentages corresponding to the loss were accumulated separately, counting total dismemberment as 100% and partial loss of use at the reported percentage. Each 100% of the accumulated total for each member was tabulated as one case. This assumes that the compensation for partial loss or loss of use of a member will be the same proportion of the compensation for total loss, as partial loss bears to total loss; and also, that the compensa- tion for injury to two members (not producing Permanent Total dis- ability) will equal the sum of the compensation that would be paid separately for each member.
(2) Cases reported as Major Permanent Partial disability and which involved injury only to "minor" members were converted to terms of a "major" member before tabulation. For example, injury to several "fingers" or "toes" were converted into the equivalent

118 WORKMEN'S COMPENSATION INJURY TABLE
percentage of "hand" or "foot ." The accumulation outlined in Para- graph (1) then followed the conversion of data.
(3) For cases involving in jury to both "ma jo r" and "minor" members in the same accident, as for example, a "hand" and "fingers of the other hand," the in jury to the "minor" members were trans- lated to terms of the corresponding major member before "summa- tion." In both (2) and (3), whenever necessary, loss of hear ing in one ear was converted to loss of hear ing in both ears.
(4) In cases involving in jury to "ma jo r" members and also "gen- eral par t ia l" disability expressed as a percent of total disability, the "ma jo r" members were t reated by the summation procedure of Pa rag raph (1) but average partial disability was determined by dividing the summation of percentages by the actual number of cases.
(5) Minor Permanent Par t ia l "multiple in ju ry" cases received the same t rea tment as Major Pe rmanen t Par t ia l "multiple in ju ry" cases.
In order to per form the conversions required under Pa rag raphs (2) and (3), a comparison was made, s tate by state, of the Permanent Par t ia l Schedule Awards for the different members. These compari- sons are shown in Exhibits D-I and D-II where it will be observed tha t the data indicates the folowing relat ionships:
Thumb . . . . . . . . . . . . . . . . . . . . . . . . . . . . 35% of a hand Index Finger . . . . . . . . . . . . . . . . . . . . . . . 20% of a hand Middle Finger . . . . . . . . . . . . . . . . . . . . . . 20% of a hand Ring Finger . . . . . . . . . . . . . . . . . . . . . . . 15% of a hand Little F inger . . . . . . . . . . . . . . . . . . . . . . . 10% of a hand
Hear ing (one ear) . . . . . . . . . . 30% Hear ing of both ears
Great Toe . . . . . . . . . . . . . . . . . . . . . . . . . . 25% of a foot Other Toe . . . . . . . . . . . . . . . . . . . . . 33~A~ of a Great Toe
Under Pa rag raph (2) , a case reported as Majo r Pe rmanen t Par t ia l involving 100% loss of a thumb, 100% loss of an index finger, 75% loss of a r ing finger and 100% loss of a grea t toe was converted to the equivalent loss of a hand and foot, before applying the summa- tion procedure mentioned in Pa rag raph (1) .
Fo r example: (100%) / .35) -t- (100%) / .20) + (75% X.15)~--- 66% Hand (100%) / .25 ) ~ 25% Foot
Under Pa rag raph (3), a case involving 100% loss of a hand and 50% loss of an index finger on the other hand was converted to the loss of a hand:
For example : (50% X.20) -t-100% = 110% Hand

WORKMEN'S COMPENSATION INJURY TABLE 119
The "multiple injury" cases af ter being expressed in terms of a single injury were included with other single injury data. The study then proceeded in accordance with the plan outlined in the opening paragraph of this section. Exhibits D-III and D-IV show the detailed distribution of Permanent Partial disability cases by "Basis of the Award or Settlement" according to the nature and extent of the injury.
An appreciable difference between the "American Accident Table" and the tabulations that underlie the "Workmen's Compensation Injury Table" appears in the Permanent Partial distributions. The "Accident Table" shows approximately 60% of the Major Permanent Partial and "/5% of Minor Permanent Partial are dismemberment or enucleation cases; whereas, the "Injury Table" indicates that approximately 20% of the "Major" and about 15% of the "Minor" distributions are dismemberment or enucleation cases. The "Accident Table" does not include Permanent Partial cases other than those cases that are related to dismemberment; the "Injury Table" indicates that about 40% of the "Major" and 30% of the "Minor" cases are not related to the dismemberment schedule. The "Accident Table" provides for taking loss of use at a uniform 90% of the dismember- ment cases; the new tables indicate varying percentages according to the nature of the injury. The new tabulations also show varying "Healing Period" durations. With regard to the duration of "Healing Period," the averages indicated in Exhibits D-III and D-IV were based solely on accident cases for which "Healing Periods" were reported in the "Call" and involve only the periods for which com- pensation benefits were actually paid.
Exhibit D-V shows the only available data regarding Major Per- manent Partial disfigurement awards.
E. Temporary Total Disability Tabulations: Under the preceding sections of this paper, the frequency distributions primarily involve the "number" of compensable accidents. While the distributions of this section similarly deal with accident frequency, a knowledge of Temporary Total disability durations is of equal importance. The Workmen's Compensation Acts of the various states, with the single exception of Oregon, contain a "waiting period" provision that is especially applicable to injury cases of a Temporary Total nature. Assuming, for the purpose of illustration, that the "waiting period" is changed by legislative activity from "7" to "3" days. It is fairly obvious that injury cases which last "4", "5", "6" and exactly "7" days would qualify for compensation benefits on the basis of the amended provision. In order to measure the effect on "Cost" produced by the additional expected cases, it is necessary to resort to a fre- quency distribution expressed in terms of the duration of disability.
A survey of compensation acts revealed that the various states (Exhibit E-I) fell into distinct "waiting period" groups. This sug- gested grouping of states with similar "waiting periods" as shown in

120 WORKMEN'S COMPENSATION INJURY TABLE
Exhibit E-II. A glance at this exhibit indicates the shortest period to be "3" days. There is no information regarding the number of injuries lasting "1", "2" or "3" days and, in certain instances, limited infor- mation with regard to injuries lasting from "4" to "7" days. I t was decided to derive the unknown data before proceeding with the study.
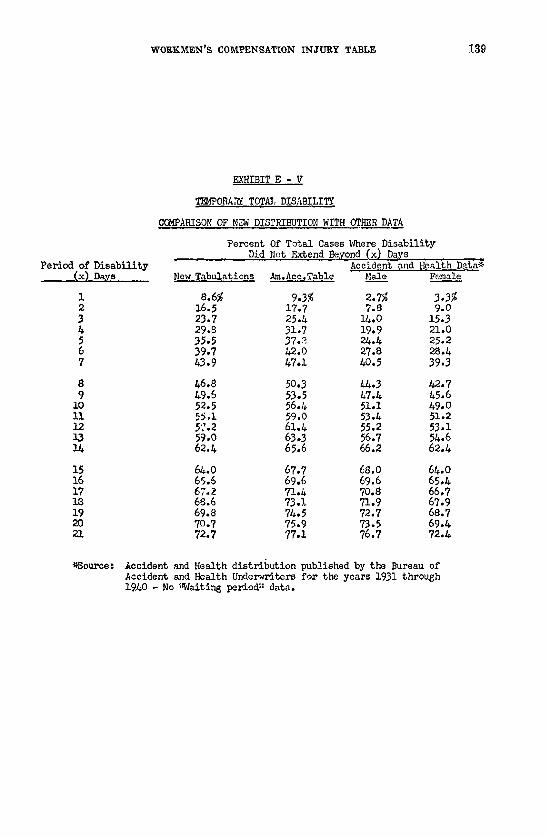
The first step towards solving this particular problem indicated the determination of those injuries lasting from "4" to "7" days from the known distributions and after having obtained this information to derive the number of injuries lasting "1", "2" and "3" days. In this respect several proposed methods were tested and, except for the procedures demonstrated in Exhibits E-III and E-IV, generally produced unreasonable results. The total number of cases with a dura- tion of "4" to "7" days were filled in from data for states with "wait- ing periods" of less than "7" days on the basis of the ratios shown by the state data. The number of cases for durations of "1", "2" and "3" days were filled in by comparison of the ratios of the number of cases during 10 ensuing days from the new tabulations to the cor- responding number of cases from the "American Accident Table." For example, the number of cases with durations from "4" to "13" days inclusive is available for both the new tabulations (as filled in per Exhibit E-III) and the "American Accident Table." This ratio was applied to the number of cases in the "American Accident Table" with "3" day's duration in order to determine the corresponding cases for the new tabulations. Using this figure, ratios for cases with "3" to "12" day's duration were applied to the "American Accident Table" cases with "2" days' duration, etc. This latter calculation is shown in Exhibit E-IV. As a matter of interest, Exhibit E-V shows a com- parison of the resulting distribution with data from other sources.
Since the advent of the first statistician, there has existed a strong desire to smooth a reasonable volume of tabulated data. After filling the voids several attempts were made along these lines but the sta- tistics stubbornly refused to blend with the mold. As a result, it was decided to abandon the "smoothing" notion. On fur ther analysis, this decision was not without merit since a graphical picture of the raw data showed a heavy concentration of cases occurring at weekly inter- vals, probably reflecting the natural inclination of injured employees to "kill" the week. By not smoothing the raw data, this phenomenon was retained in the distribution.
The next step involved setting up "commutation columns" as shown in Exhibit E-VI in order to establish a table which would readily lend itself to computation. The mechanical operations involved in setting up this particular exhibit are briefly explained, as follows:
Column (1)--represents a listing of days of disability. Column (2)--shows the number of cases lasting exactly "1" day,
"2" days, etc. Column (3) - - i s an accumulation upward of the data shown in
Column (2).

WORKMEN'S COMPENSATION INJURY TABLE I21
Column (4)- - is an accumulation upward of the data shown in Column (3). This accumulation corresponds to sum- ming the products of Columns (1) and (2).
For an act which does not contain a "waiting period" provision, Line (1), Column (4) supposedly represents the hypothetical total days of disability. For an act which contemplates a "1 day waiting period," Line (2), Column (4) represents the corresponding total days of dis- ability, i.e., since the figures 1,578,486 supposedly represent the total days of disability where there is no "waiting period" then the sub- traction of "1" day for each case in the distribution or 68,944 days results in 1,509,542 total days disability; subtraction of another day for each remaining case in the distribution or 62,990 days produces 1,446,552 total days of disability which corresponds to a "2 day wait- ing period."
The last half of this exhibit shows the data grouped according to weekly periods as a matter of convenience. The figures shown were taken from the original tabulations which were based on "1" day intervals. Thus, for a "waiting period" provision of "42" days, an overly exaggerated example, one might expect 520,543 total days of disability; for a "49 day waiting period," one might expect 460,484 total days of disability; etc.
F. The Workmen's Compensation Injury Table: This table, so named in order to distinguish it from the "American Accident Table," actually consists of five independent industrial accident distributions that are broken down according to the individual characteristics which affect benefit cost, such as, dependency and age in Fatal, de- pendency and age in Permanent Total, loss of function or dismember- ment in Major and Minor Permanent Partial and duration of dis- ability in Temporary Total.
It was suggested on completing this statistical study that the five tables be integrated into one table by proportionately distributing the accident frequencies according to countrywide accident relativity based on Unit Statistical Plan Data. It was decided that this would be unwise since the tables then, conceivably, might be used for a purpose for which they were not primarily intended.
At about the time the statistical study entered its final phase, Ralph Marshall, Assistant Actuary at the National Council (who inciden- tally may be largely credited with bringing this long study to a successful conclusion), completed a separate "Medical Loss' study based on tabulations of Unit Statistical Plan Data. The results of this study, as illustrated in Exhibit F-VI, show the total medical in excess of various amounts per medical claim for states where the medical benefits provided by the Compensation Act are, in effect, unlimited with respect to both duration and amount. This additional exhibit is published, merely for the sake of completeness. Although the use is explained in Par t III, the development of this table is be- yond the scope of this paper.

122 WORKMEN'S COMPENSATION INJURY TABLE
Thus, the following tables, supplemented by additional data fur- nished in this paper, constitute the "Workmen's Compensation Injury Table"; these tables will be used whenever necessary for law valua- tions in lieu of the "American Accident Table" :
EXHIBIT F-I FATAL DISABILITY
EXHIBIT F-II PERMANENT TOTAL DISABILITY
EXHIBIT F-III MAJOR PERMANENT PARTIAL DISABLITY
EXHIBIT F-IV MINOR PERMANENT PARTIAL DISABILITY
EXHIBIT F-V TEMPORARY TOTAL DISABILITY
EXHIBIT F-VI MEDICAL

EXHIBIT A-I SCH~4ATIC OUTLINE - FATAL INJURY
i DEATH CASES 'i
I IDepelL ~,., I Completely I Dependent Cases
L l Accident Frequency By Dependency
L D Partly F Undetermined I spender% Cases [Dependency CasesJ
I I I Accident Frequency By Dependency
' 1 I
II P [7 . <I I c~pi'te~ Rept'dVFa~ly Repo~ II, ~ot Repo~.d I I Not Reported artly Reported Completel~ Rept,
I By Dependency 1 By Dependency i
0
0
c,-i

EXHIBIT A-II sCH~4ATIC OUTLINE - PERMAN~T TOTAL INJURY
I State I
Accident Frequency According to Members
J Amputation J Loss of Use Amputation And
Loss Use Cases | Cases of Cases
I I 1 t "' Age by Type Injury Distribution of
I PE~t~N~T TOTAL CASES
I |~,
Policy Period
General Disability
Accident Frequency Accordin~ to Disability: 1
J i. Head or Mental 3. Paralysis 5. Other General 2. Back or Spine ~. Disease Disability
flll
11 Age Distribution by Type of Disability
Single Age Distribution J (Based on Complete A~e Informatio~
o
(% o
c~

EXHIBIT A-III SCHh,MATIC OUTLINm - Pe.~4AN~.~T PARTIAL LNJUI~
State
l PP.,,~.AN~IT PART'r-_AL CA$~
Policy Period I
BASIS OF THE AWARD OR SETT~T
i
DI SM ~/4,B~,E2~T SCIIE]~I~.
Accident Frequency By Member And Point of In Jut7
Amputation I Losm of [ Frequency I Use by ~ 5osa
of Use
i
P ~ E N T TOTAL DISA~I.TTY
Accident Frequ~cy By General ; Disabilit~: ~ck , Head t etc t !
Frequency According to ~ of j Bod.i.l,.v or Functional Impairment
!
I Frequency of Temporary Total In Permanent Par t ia l Cases
( According To Duration of Healing Period)
LU~ SUM' AWARD
Accident Frequency BY Member And Point of In.lur~
~mputation I Loss of ~requency I uae [by ~ Z~,,- l I o f lime
0
0
c
t ~
b-a b 3

O~
EXHIBIT A-IV smmaTiG OUTLINE_- TEMPOn~ TOTAL ZN~U~
I T~C~ORARI TOTAL CASES
I STATES GROUPED BY WAITING 1 Pi~TOD ON:
i i i I I I t l
Temporary Total
Temporary Partial
I Frequency of Cases by % Disability
ACCIDenT FREQUENCY .BY DAYS DISABILITY
Total Partial
l by % Disability [ i
Temporary Temporary Total Par t ia l
l _ Frequency of Cases by % Disabil i ty
I i ~' I T~o~ '~ F~ I
Cases by ~ Disab]
O E
O
c~

WOREMEN'S COMPENSATION INJURY TABLE 19.7
Actual Number Cases
32O 2,777 7,620 3,~53 2,607 i,~26
713 290 33~ ~O1 223 ~9 45 ~5
891 6O2 89 22 22 ~5 22 45 67 89 22 21
2~,282
NOTE:
F~IBIT B-I
~ccident Freauency ~Fatal Cases (Aoc6rdin~ %~ O~pendency)
Tzoe of_ De end~
Partial Dependents No Dependents Widow alone Widow with one child Widow with 2 children Widow with 3 children Widow with ~ children Widow with 5 children Widow with children (average 7) One orphan Two orphans Three orphans Four orphans Orphans (average 5) One parent Two parents One brother or sister Two brothers or sisters Brothers or sisters (average ~) One parent and brother or sister One parent and two brothers or sisters One parent and brothers or sisters (average ~) Two parents and brothers or sisters (average 2) Widow and one parent Widow and one other dependent One other dependent Undetermined Dependency
The above distribution excludes New Jersey and the monopolistic states where the Compensation business is written by "~tate Funds', Joe. Nevada, North Dakota, Ohio~ Oregon, Washington, ;Vest Virginia and Wyoming. Included are Pennsylvania data obtained from P.C.A.S., Volume XXXII, page 157.

128 WORKMEN'S COMPENSATION INJURY TABLE
~NIBIT B-I~
A~, iDistribu%$on~ of Widows - Fat alDisabillty
(1) (2) O) (~) (5) (6) (?) (e) . . . . . . Number of Caseff
- Widow Widow Widow Widow - Widow Widow With- Age Widow With 1 With 2 With 3 With 4 With 5 More Than Total Widow
Grouo Alon 9 Ch$1~ ~hildre n i l ~ Children Children 5 Children With Children
15-19 8/+ IO1 19 2 xx xx xx 122 20-2/+ 195 375 177 70 ~ 6 xx 6~2 25-29 225 319 3~2 180 86 31 25 983 30-3& 216 271 360 217 94 53 49 1,0~ 35-39 254 259 285 185 112 48 58 947 40-~ &16 273 201 118 62 37 4,3 734 45-~9 5 ~ 231 135 53 36 9 1~, h78 50-5~ 777 166 79 33 6 5 ~x 289 55-59 669 115 33 I0 4 xx xx 163 60-64 601 32 i 1 xx XX xx 3~ 65-69 347 8 I x x xx xx xx 9 70-7~ 137 2 xx xx xx xx xx 2 75-?9 39 xx xx xx xx ~x xx xx 80-8~ ~ xx r¢ xx . , ~ xx x z r ¢
To~al 4p510 2,152 1,633 869 ida 189 189 5,~k6
As a mat ter of convenience, the above d i s t r i b u t i o n s have been grouped in f i ve year i n t e r v a l s . However, the average ages shown in Exhibi t B-IV were based on t abu la - t i o n s involving age i n t e r v a l s of one year . "
EXHIBIT B-III
~Age D!, stribution of Parenb or Parents - Fatal Disability,
Age One P a r e n t Case _ Two Paten% Cases, Groul) ,,(Mother o r F a t h e r ) Motl~ler F a t h e r P a r e n t ~
30-3& 3 2 1 3 35-39 Ii IO 4 IA 40-4~ 32 27 23 50 45-49 52 27 19 46 50-54 46 28 30 58 55-59 74 33 34 67 60-64 65 25 29 54 65-69 65 19 13 32 70-74 53 8 1/+ 22 75-79 33 :3 11 1~ so-84 3o _2 _6 _e
Total 46/~ 184 184 368

EXHIBIT B-IV
DISTRIBUTION OF. AVERAGE AGES ACCORDING TO D~PE!~T~NCY -FATAL DISABILITY
No .Of Dependency Cases
Average Age Of AVERAGE AGE OF CHILDR~X~ Widow or Parent Oldest 2nd 3rd ~th 5th 6th 7th 8th 9bh Arith. Pension Child Child Child Child Child Child Child Child Child •
Widow alone 6,510 50 56 29 Widow w/l Child 2,152 36 55 30 Widow w/2 children 1,633 35 56 31 Widow w/3 children 869 35 53 32 Widow w/4 children ~i~ 3.5 52 33 Widow w/5 children 189 35 51 33 Widow w/6 children 95 35 51 33 Widow w/7 children 61 37 50 36 Widow w/8 children 23 38 /~8 ~6 Widow w/9 children i0 37 48 37
1 orphan 272 - 2 o'~ p~-ns 153 - 3 orphans 73 - 6 orphans ~5 - 5 orphans - - 6 orphans 39 -
1 Parent 66~. 61 61 2 Parents 368 56 56
(a) Mothe~ 18~ 55 55 (b) Fathe~ 184 58 5a
9 io 6 11 8 5
1o 7 6 13 11 9 6 3 IA 12 10 8 5 15 13 11 9 7 16 1~ ~ lO 8 17 15 13 11 9
ORPHANS
12 13 10
13 l o 8 5
15 13 10 8
PARENT OR PARENTS
2
6 3 O 7 6 2
3
o
o
u~
0
#.a t,o

1S0 WOREMEN'S COMPENSATION INJURY TABLE
TYPE OF INJURY
~/4PUTATION CASES -. A Arms Hands Legs" Feet Eyes (enucleation) Arm and Leg Arm and Legs Arm and Hand Arm and Foot Hand, Leg and Foot Leg and Eye (enuleat~
TOTA]
EXHIBIT C-I
ACCIDENT DISTRIEUTION - PEE.5~ENT TOTAL- DISABILITY A!cording to Injury
DETAIIZD BREAKDO%~
TYPE ~ INJURY
E. AC~ 40
n)
NO.OF CAS__~
9 15 34 6 6 9 i 2 2 i i
NO.OF LOSS OF U~ CASES - A~. t:CE 4~ CAS~S
Arms 9 Hands 13 Legs ~O Feet Eyes 58 Arm and Leg ]4 Arm, Leg and Foot l Hand and Foot 3 Hand and Leg 3 Hand and Eye 2 Leg and Foot 5 Leg and Eye 1 Foot and E~ye l A~.I and Legs 1 Arm and Foot l Arm and Eyes i Arm and Legs I
Total 158 ~S~JTATIOE & LOSS O! USE - AVE. AGE 47 Eye (enucleation)& ye (Less of Use) 5 Leg (Amputation)& eg (Loss of Use) 7 Arm (Amputation)& eg (Loss of Use) 2 Leg (Amputation)& and (Loss of Use) l LeE (Amputation)&iyes (Loss of Use~ 1 Foot (Amputation)& and (Loss of Use) I Leg (Amputation)& rm (Loss of Use)_~l
Total 18
AMPUTATION OR LOSS
Arms Hands Le~s Feet Eyes Other Combinations ( Other Permanent Tota
Total
A~e Group Under 15
15 a.u. 20 20 aAu. 25" 25 a.u. 30 30 a.u. 35 35 a.u. ~0 ~0 a.u. ~5 h5 a.u. 50
NOTE: Age distrib~t Information.
OTHER PER/MNENT TOTAl_- AVE,. AGEtl
Head or Mental Impairment 263 Back or Spine &73 Paralysis 101 Occupational Disease 501 Not Classified. and Other Cases 11300
Total
DETAILED S~Z[ARY
USEr AVE , AGE ~0
18 28 81 iO 69
odilyMembers) 56 Case 2638
2900 EXHIBIT C-II
DISTRIBUTION - PF/~'~T TOTAL DISABILL"/
No_..~.of Cases ARe Group No. of Cases 2 50 a.u. 55 309
~5 5~ a.u. 60 360 llO 60 a.u. 65 376 137 65 a.u. 70 287 177 70 a.u~ 75 15~ 251 75 a.u. 80 68 237 80 a.u. 85 I~ 3o9 Total ~35
.on taken from punch card data containing ec~pl~te aEe

WORKMEN'S COMPENSATION INJURY TABLE 131
EXHIBIT D-I
PE~ANENT PARTIAL DISABILITY
.BAS. IS OF CONVERSION OF: ,,F~OEP~,,..TO,'HAN~'
,Index Middle Rin~ Little _ All Hand SC~EDULEg...WEEKS OF IND~I'~
Ala. 60 65 30 20 15 170 150 Ark. 60 35 30 2O 15 160 150 Col. 50 26 18 11 13 118 106 Conn. 75 &8 38 25 20 206 208 Del. 60 35 30 20 15 160 200 D.C. 51 28 18 17 ? 121 212 Fla. 60 35 30 20 15 160 175 Ga. 60 35 30 20 15 160 150 Hawaii 51 28 18 17 7 121 212 Ida. 70 &O 40 30 20 200 200 Ill. 70 &O 35 25 20 190 170 Ind, 60 &O 35 30 20 185 200 Iowa 60 35 30 25 20 170 175 Kans. 60 37 30 20 15 162 150 Ky. 60 &5 30 20 15 170 150 La, 50 30 2O 20 20 140 150 Maine 50 30 25 18 15 138 125 Md. 50 30 25 20 15 i~O 166 Mich. 60 35 30 20 15 160 200 Minn. 60 35 30 20 15 160 188 Miss. 60 35 30 20 15 160 150 Mo. 58 ~3 33 33 19 186 168 Mont. 75 37 37 25 15 189 187 Nebr. 60 35 30 20 15 160 175 N.H. ~0 25 20 15 i0 ii0 140 ~. J. 75 50 ~0 30 20 215 230 N.M. 50 25 20 15 12 122 105 N.Y. 75 66 30 25 15 191 2~4 N.C. 65 &O 35 22 16 178 170 Okla. 6O 35 30 2o 15 160 2oo Pa. 60 35 30 20 15 160 175 R.I. 60 36 26 20 18 160 199 S.C. 60 35 30 20 15 160 15o S.D. 50 35 30 20 15 150 150 Tenn. 60 35 30 20 15 160 150 Tex~s 60 65 30 21 15 171 150 Utah 60 30 30 20 12 152 150 Ut. 40 25 20 15 i0 iiO 140 Va. 60 35 30 20 15 160 150
Total 2305 1394 1133 819 59~ 62/+5 6618
,]TQES" ~S PERCI~T OF "FO0~ ~ O.Toe ..Other .Toe Foot
30 10 125 30 iO 125 26 11 i06 38 13 156 30 10 150 26 S 173 30 IO 175 30 10 125 26 8 173 30 12 125 35 12 135 60 10-30 150 ~0 15 150 30 10 125 30 10 200 20 iO 125 25 10 125 25 10 150 30 10 150 35 10 ]40 30 10 125 ~O 14 150 37 15 156 30 10 150 20 8 120 40 15 200 30 12 I00 38 16 205 35 10 IS 30 10 150 ~0 16 150 30 i0 150 30 10 125 30 10 125 30 i0 125 30 iO 125 30 12 125 20 8 120 30 10 125
XX ~ XX
laercent of All Fingere 36.9% 22.3% 18.1~ 13.1~ 9.5% 100.0% % Rounded 35 20 20 15 i0 I00.0
By Inspection G.Toe 1~3 ~oot Other Toe : G.Toe

132 WORKMEN~S COMPENSATION INJURY TABLE
EXHIBIT D-II
PER~NENT PARTIAL D,I.SABI__LITY
Basis of Conversion of "Hearin~:-One Ear" to "Hearing -Both Ears"
~tate
Sch,eduled Weeks, Comp.
i Ear Both Ears Ratio
Alabama - 150 Arizona 20 60 Ark-~nsas 40 150 Colorado 35 139 Connecticut 52 156
3.0 3.8 L.O 3.0
Delaware 52 District of Columbia 52 Florida ~O CeorEia Hawaii 52
iO~ 2.O 2OO 3.8 150 3.8 150 2oo 3.8
Idaho 35 150 &.3 ~llinois 50 125 2.5 Indiana 75 200 2.7 Iowa 50 175 3.5 Kansas 25 I00 A.O
Kentucky 75 Maine 25 ;5 2?6 ~ryland 50 150 3.0 ~Hnnesota 55 170 3. i Mississippi &O 150 3. ~,
Missouri ~ 168 3.8 Montana 25 150 6. O Nebraska 50 i00 2. O New FaI~shire ~ 170 A.O Ne~¢ Jersey 60 200 3.3
New Hexico 35 New York 60 !;orbh Carolina 70 Pennsylvania Rhode Island 60
135 3.8 150 2.5 150 2.1 150 150 2.5
South Carolina 70 Tennessee Texas Vermont &2. Virginia 50
150 2.1 150 150 170 ~.O
Wisconsin (50) (333 1/3)
Unwtd Average 3.3 Hearing One Ear 30% Both Ears

WORKMEN'S COMPENSATION INJURY TABLE 133
EX~{IBIT D -III
MAJOR PEPJt4r~EJIT PARTIAL DISABILITY
ACCIDE}~ DISTRIBUTION - AT/I~AGEPERCEI~LO$S OF USE - AVERAGE HF~%LIUG PERIOD
BASIS OF THE AWARD P~lated Lump Sum Total And (a)
Dism°Sched. To P.T. Award Average Hezlin Injured Point & Nature No.Of % "' ~:o.Of -% ~ No.Of %- N0.Of % ~ Period Member of Injury Ca§es Loss Cases Loss Cases Loss Cases .Loss (Wks.)
A. FMJOR MEMBERS (Schedu-le Injuries)
Wrm Dimn. at/above elbow 264 i00 xx xx bism. below elbow 131 i00 xx ~x Loss of Use 558 63 xx xx
Hand Dismemberment 518 I00 xx xx Loss of Use 894 69 xx xx
Leg Dism. at/above knee 264 i00 xx xx Oism. below knee 106 i00 xx xx Loss of Use 500 63 xx xx
Foot Dismemberment 113 i00 xx xx Loss of Use 360 60 xx xx
Eye Enucleation 377 i00 xx xx Loss of Use 1007 97 xx xx
Hearing (Both Ears) 7 69 xx xx
Total 5099 xx xx xx
23 100 287 i00 29 8 i00 139 I00 20 90 57 648 62 37
i00 560 lOb 106 56 IO00 68 26
12 i00 276 i00 A9 8 i00 ii~ i00 49
135 59 635 62 51
9 I00 122 i00 36 56 62 416 60 39
57 i00 434 i00 1~ iii 92 1118 97 16
_ i ~ lq ~ ~
660 xx 5759 xx xX
B, OTHER t.~JOR PEE~I~,!TPARTI!J~ INJURIES (b)
Head -Functional Loss xx xx 102 48 65 38 Back - " " xx xx 5~6 38 370 36 Herni~ - " ~' xx xx 7 45 9 26 Other General " xx xX 1427 Al &55 ~0 Total & Average(Other P°P.) xx xx 2082 41 899 38
I~ Based on durations for which compensation benefits were actually paid, Loss of function related to the body as a whole,
167 ~ 64 916 37 ~1 16 34 36
2981 40 43

134 WORKMEN'S COMPENSATION INJURY TABLE
EXI{IBIT D - IV
MI_ ,~j~ P_PF~AND]T P~/[TIAL DI~A~ILIT !
ACCIDENT DISTRIBUTION - A'~'uV~ PERCENT LOSS OF USE - AVERAGE HEALING PERIOD
Injured Point & Nature
BASIS OF THE AWAP~D
Dism, Sched. No.Of
Member of T,LJury _ Cases
A. MI~IOR I~.~3ERS
Thumb Oism, ist Phalange 163 100 Oism 2 Or more Phals, 79 i00 Loss of Use 1029 26
Index Bism, ist Phalange 451 iO0 Finger ;i 2 or more Phals. 315 I00
Loss of Use 1556 34
Middle Dism. ist Phala~e 402 i00 Finger '~ 2 or more Phals.308 iOO
Loss of Use 1261 31
Ring Dism, ist Phalange 2~5 i00 Finger " 2 or more Phals. lq8 i00
Loss o£ Use 9:~2 32
Little Dimu. is5 Phalange I['4 i00 Finger " 2 or more Phals. 187 I00
Loss of Use 775 37
Great Dism. ist Phalange 2.~ i00 Toe " 2 or more Phals. 19 I00
Loss of Use 686 26
Other D'is~emberment , 96 I00 Toe (i) 373 32
Hearin~ (One Ear) 43
Total 9328 xx
Arm Loss of Use 1045 15 Hand Loss of Use 15&l 16 Leg Loss of Use 1086 15 Foot Loss of Use 1129 15 Eye Loss o f Use 276 19 LOSs of Hearing (Both) -_ 27 2 j
Total 5104
C. OTHER
Head - Functional Loss xx Back - " tt :(X Hernia " I, :xx Other General " xx Total & Average (Other P.P.) xx
Related Lump St~ Total And (a) To P.T. Award _ Avera~.e Healin
% No,Of % ~ o . ~ No.Of % Per iod Loss Cases Loss _Cases _Loss Cases Loss (W,ks.)
(Schedule Injuries)
xx xx 24 I00 187 i00 9 xx xx 12 i00 91 iOO 11 xx xx 167 26 1196 26 7 xx xx 52 i00 503 iOO 7 xx xx 51 i00 396 I00 12 xX xx 251 36 1807 34 6
xx xx 60 I00 &62 i00 6 xx 26 iO0 334 i00 14
• x xx 221 30 1482 31 6
xx xx 6A i00 279 i00 5 xx xx 28 I00 226 I00 I0 xx xx 13~ 33 1076 32 5
xx xx 29 i00 183 i00 5 xx xx 18 I00 205 i00 8 xx xx 116 3~ 891 37 6
xx ~:~ i i00 2& i00 9 xx xx 2 i00 21 i00 16 ~X xX &5 27 731 26 6
• x ~ 7 i00 103 i00 8 xx ~ 31 38 &CA 32 7
= _ 8 65 ~1 4_1 _~ xx xx 1327 xx 10652 xx ~x
, (Schedule In , lu r i~s )
xx xx 193 17 1238 15 16 • x xx 279 17 1820 16 12 xx xx 229 16 1315 15 21 xx xx 246 15 1375 15 15 xx xx 79 21 355 19 I0 ~___ ~__. 5 22 32 2~2 2.22 xx xx 1031 ~x 6135 xx x~
PEPd'AN~!T PARTIAL. INJURIES (b)
xx 171 5 66 9 237 6 IA xx 980 8 435 12 I~15 9 16 xx 66 7 129 6 195 6 ii ~x lO82 1 __~ l O ~ _s xx 2299 7 1037 i0 3336 8 15
(a) Based on durations for which compensation benefits were actually paid. (b) Loss of function related to the body as a whole.

WORKMEN'S COMPENSATION INJURY TABLE 135
EXHIBIT D-V,
MAJOR P ~ . T PARTIAL DISABILITY
Di~ fiKu~m~n~ Award~
State
South Carolina Delaware New York Dist. of Col. Pennsylvania Virginia Maryland Massachusetts Tex~s All Other S£ates
Total MaJor P.P. Indemnit~
501,O93 82,096
8,5~,395 &O5,560
1,15&,~25 370,230 767,102
1,628,300 2,781,619
Disfigurement Ind~m, Percent ~f Major ;nd Facial Bodily Facial Bodily
17,903 83,965 3.6% 16.8%
77,160 0.9 3,ooo Ca) 0.7 (a)
2,097 0.6 2,5&6 800 0.3 0.I
0 2,~85 0.2 1,100 &,602 - 0.2
less than 0.i 0.I
Total (Facial) To~1 (Bodi~)
35,266,&77 125,919 xx O.&~ xx 21,977,112 xx 9&,331 xx O.&5
(a) No specific provision for bodily disfigurement.
R~IBIT E~I
T~ORARY TOTAL DISABILITY
Tabulation_Of States Accordin_~ To Waitin~@riod
7 DaM Waiting Period: Alabama Idaho Massachusetts New York Arizona Illinois NXchiean North Carolina Arkansas Indiana ~nnesota Pennsylvania California Iowa Montana South Carolina Colorado Kansas Nebraska South Dakota Connecticut Kentucky New Hampshire Tennessee Dist. of Columbia Louisiana New Jersey Texas Georgia Maine New Mexico Vermont
Virginia
5 PaY Waiting Period: Hajji Mississippi Oklahoma
DayWaitin~ Period: Florida
Day Wai%~in~ Period- Alaska Maryland RhodehIsl~ Wisconsin Delaware Missouri Utah

136 WORKMEN'S COMPENSATION INJURY TABLE
EXH !q31T E-If
TF/~O.Rt~RY TO~AL ACCIDENT DISTRIBUTION
ACCORDI~. TO DURATION OF DISABILITY
(1) Disability (x)
Period 7 Day ~ ~ w,P.,
O O 1 2 3 No 4 Data 5 6
1 O I 160~ 2 1528 3 1531
1373 5 1178 6 1021
2 O 2017 1 896 2 89& 3 -e95 & 762 5 657 6 555
and 3wks. under & wks 3761 4 ~ " 5 " 2914 5 " " 6 " 1958 6 " " 7 " 1760 7 :' " 8 " 1290 g " " 9 " 1185 9 :' :' IO " 754
i0 " " 15 " 1897 15 :' " 20 " 702 20 " " 25 " 357 25 " " 30 " 220 30 " " 35 " 152 35 :' " &O " 84 40 " " 45 " &6 &5 " " 50 " 51
50 " " 60 " 53 60" " 70 " &A 70 " " 80 " 28 ~0 " " 90 " 26 90 " " i00 " 14
I00 wks and over __53 Number of cases over 7 days
(2) (3) (4) (5) Nu._mber Of Cases Lasting (x) Period I
5 Day 4 Day 3 DaY Total W:P~. W.P. W.P. ~ses_
No No No Data
Data Data Ltd. Da~ • . &~O or
133 425 No Data 71 79 323 •
SO 109 296 61 88 257 20~ 57 77 257 1919 63 5& 320 1968 50 136 237 1796 58 63 196 1495 28 45 105 1199
75 65 2OO 2357 33 51 1~3 1123 22 36 115 1067 28 22 161 1106 22 67 IiO 961 26 34 103 8~0 19 21 53 6t~:
i00 130 493 Z~4 64 86 302 3366
65 235 2302 A6 10& 181 2091 30 &2 157 1519 24 29 103 134/ 14 l& 72 C54
56 &l 182 2176 2~ i0 62 798 13 8 23 &Of 6 3 22 251 2 6 8 168 5 i 7 97 I 2 6 55 I 0 2 5&
2 2 2 59 0 2 ~ 50 1 0 1 30 0 0 3 29 0 1 0 15
978 38--~70

WORKMEN'S COMPENSATION INJURY TABLE 137
(1) Period Of Disability
I 2 3 t+ 5 6 7
Over 7
.~C{IBIT ~-III
T ~ TOTAL DISABILITY
Nu~r of Case~ with Duration of &. 5. 6, and 7 DaYs
(2) (3) • (~) (5) (6) Number of Cases o~' Duration_o~ .(x~ Days Prom States With
Day & Day 5 Day 7 Day Waiting Waiting. Waiting Waitin~ All Pe~-iod Pe~o~ Period Perlo~ State~.,.
&~o (~3) (1o7) (3520) (~o) ~g 133 (ioo) (331&) (3972) 323 79 71 (2381) (2~5~) 296 109 8o (2t%1) (2926)
AI2~ 1307 978 32261 38670
(7)
~ a t i o n
7 ~ a ~ 6 ~ y s 5De~
w
N
(8) No.of Cases Duration (x) (2)+(3)+(~)
~5 &73 553" n
&501 111
n
(9) (lO) (n) (~2) No.of Cases No.of Cases No.of Cases Over 7 Days Ratio Over 7 Days Duration (x) (2)+(3)+(&) (S)+(9) (As Indicated) (ii) x (iO)
6&09 .07567 (Col. S) 32261 2&J+l 6/.~? .07380 " 32261 2381 5&31" • iO27& " 32261 331~ " • i027& ( Col • ~) 978 I00
~/2&t .i0912 (Coi.5) 32261 3520 " .10912 (Col.~) 978 107 " • 10912 (Col. 3) 1307 I%3
'~ol. (2

138 W O R K M E N ' S C O M P E N S A T I O N I N J U R Y T A B L E
EXHIBIT E - IV
T~ORS~Y TOTALDISABIYXTY . _ ,. ~ = = , _
Number of Cases wlth i. 2 and 3 Days Duration
(z) (2) (3) (4) Present
Period Of American New Disability Accident Tabul- Ratio ~n Days Tabl~ ations (3) + (2)
1 2 3
5 6 ?
8823 (595~ 8O86 (5450)*
604 (~20~ 5255 ~3972) 4606 (~54)
.67/~5
.6%0~
.67267
.702
.756
.620
.607
*Based on iO Ensuing Days
2-11 47439 32024 .67~5
3-12 ~628 28059 .67404
I" b-13 36214 2/+360 .67267
8 3O90 2C~I .651 9 30?/+ 1919 .624
i0 2740 1968 .718 11 2475 1796 .726 12 2275 3495 .657 13 1868 1199 .6/+2 I~ 2190 2357 1.076
Over 24 32793 25925 .791 TOTAL 95388 689/~4 .?23
WORKMEN'S COMPENSATION INJURY TABLE 139
EXHIBIT E - V
T~4PORA2Y TOT2J, DISABILITY
COMPARISON OF NEW DISTRIBUTION WITH OTHER DATA
Percent Of Total Cases ~ere Disability Did Not Extend Bey�nd (x)Days
Period of Disability Accident and Health Data* (x) Days New Tabulations Am.Acc.Table Male Female
1 8.6% 9.3% 2.7% 3.3% 2 16.5 17.7 7.8 9.0 3 23.7 25.A i~.0 15.3 4 29.8 31.7 19.9 21.0 5 35.5 37.2 2&.4 25.2 6 39.7 ~2.0 27.8 28.~ 7 ~3.9 ~7.1 40.5 39.3
8 ~6.8 50.3 ~.3 ~2.7 9 ~9,6 53-5 ~7.~ ~5.6
10 52.5 56.~ 51.I ~9.0 n ~5,1 59.0 53.~ 5 ' . 2 12 57.2 61.~ 55.2 53.1 13 59.0 63.3 56.7 54.6 I~ 62.~ 65.6 66.2 62.&
15 6&.O 67.7 68.0 6~.O 16 65.6 69.6 69.6 65.& 17 67.2 71.& 70.8 66.7 18 68.6 73.1 71.9 67.9 19 69.8 74.5 72.7 68.7 ~0 7O.7 75.9 73.5 69.4 21 72.7 77.1 76.7 72.~
-~Source s Accident and Health distribution published by the Bureau of Accident and Health Underwriters for the years 1931 through 19AO - No ~rWaiting period u data.

140 WORKMEN'S COMPENSATION INJURY TABLE
- (i; ~m~,~tlon
1 2 3
5 6 ?
8 9
10 11
15 16 17
19
21
23 24 25 26 27
29 3O 3i 32 33 34 35
36 37 38 39 40
4~
Ccmnutatiion Col~.nn~ (2) (3) '(~)
S~mwm~. D~ys Disability No.Of Of (2) Lasting Col.(1) ~ases. Upward And0yer
Temporary Total Disability (1) (2) - (3) (~)
S~m,,~. Days Disability Duration No.Of Of (2) Lasting Col.(i) (Da~s) qases Upward And Over
(595~) 689~ 1,578,&86 (5450) 62990 1,509,542-
I ~98) 575~0 l,~6,552 4220) 52642 1,36%o12 (3972) 48422 1,336,37o ~2854) /~50 1,287,948 2926 /+1596 1,243,498
43 - &9 1861 933& 520,S&3-&68,&11 50 - 56 1552 %73 &60,&S&-&i8,~7 57 - 63 113A 592/ 4/2,009-378,857 64 - 70 779 ~787 373,760-346,549 71 - 77 555 &O08 342,306-319,261 78 - 84 500 3453 315,670-295,839 85 - 91 355 2953 292,700-275,658
2011 38670 1,201,902 1919 36659 1,163,232 1968 34740 1,126~573 1796 32772 1,O91,833 1495 30976 1,O59,O61 1199 29&81 1,O28,085 2357 28282 998,60~
92 - 98 3AA 2598 272,963-258,O18 99 - 105 262 2254 255,652-2A2,639
106 -112 207 1992 240,572-~8,992 113 - 119 176 1785 227,137-216,759 120 - I_26 3348 1609 215,091-205,708 127 - 133 130 3461 204,197-195,681 134 - IAO 120 1331 194,311-186,&81
25925 970,322 141 - 1067 24802 %4,397 ~ - 3/06 23735 919,595 155 - 961 22629 895,560 162 - 820 21668 873,.°.31 169 - 648 20848 ~51, 5.~3 176 - 1365 20200 630,715 183 -
570 18835 810,515 190 - 627 18265 791,680 197 - 566 17638 773,~15 204 - 528 17072 755,777 ~ - 459 165&A 738,705 218 - 369 16085 722,161 225 -
1028 15716 706,076
~O3 14688 690,360 232 - 470 ]4285 675,672 267 - &O7 13815 661,387 302 - 436 13~08 647,572 337 - 378 12972 634,16A 372 - 2~,4 1259~, 621,192 407 - 686 12350 608,598 642 -
286 2/66& 596,2~ 477 - 282 11978 584, 58~ 334 11o96 573,2o6 512 - 258 10762 562,110 582 - 251 i050~ 551,3~8 652 & 205 10253 5~0,~ 71~ 100~ 530,591
l&7 103 1211 185,212 -178,117 154 80 1108 176,97&-170,487 161 70 1028 169,~3&-163,393 168 6~ 958 162, b, I0-156,753 175 52 89~ 155,830-150,537 182. 61 8&2 12+9,669-144, 710 189 $5 781 143,906-139,313
266 121 500 I/2,897- 98,060 301 67 379 97,675- 86,058 336 5& 312 85,7&2- 75,896 371 50 258 75,632- 67,626 406 22 208 67, ~IA- 60,679
19 186 60,~91- 3&,380 476 2& 167 5~,211- ~8,903
511 PJ~ l&3 ~8,760- ~A,26k
581 2~ 119 &A, I~- 36,693 651 27 95 36,597- 31,127 Over - 68 31,O59- xx
196 55 735 138,566-13&, 2~I 203 38 680 133,5~i-129,5 $6 210 &2 642 128; 875-125 H)7 217 33 600 12~,~9o-12o; 933 224 &A 567 12o,348-117,o37 231 23 523 116,501-113,403

No, of Cases~ ~ooo 139 342 155
117
64
32
13
15
18 10 4 2 2
&O 27
WORKMEN's COMPENSATION INJURY TABLE
~m~i~T ~-~ WORNMEN!S COMPENSATION INJUP~ TABLE - FATAL DISABILITY-
No, of ~erson P~ceivin~ Co~pensatio~ ~ Arithmetic
None O xx Widow Alone i 50 Widow and i 35 Child I 8 Widow and 1 35 Children 2 8 Widow and I 35 Children ~ 8 Widow and 1 35 Children ~ 8 Widow and i 35 Children 5 8 Widow and i 35 Children (More than 5) 7 (Ave.) 8
orphan i 11 Orphans 2 ii Orphans 3 11 Orphans ~ 11 Orphans (mere than 4) 5 (Ave.) 11
Parent I 61 Parents 2 56
Brother or Sister I 43 l Brothers or Sisters 2 43 1 Brothers or Sisters ~ (Ave.) 43
2 Parent and i 51 Brother or Sister I 13
1 Parent and I j 51 Brothers or Sisters 2 13
2 Parent and 1 51 Brothers or Sisters 4 (Ave.) 13
3 Parents and 2 51 Brothers or Sisters 2 (Ave.) 13
4 Widow and i 39 Parent I 61
i Widow and I 50 Other Dependent i 43
1 Other Dependents I (Ave.) 61
* 2/~,282 Fatal cases included in the original study. 2002 "Undetermined Dependency" cases were excluded before proportionally reducing the re- mining cases to i000 for valuation purposes.
141
Average A~e
xx 29 31
31
31
31
31
31
61 56
43 43 Ij
51
51
51
51
29 61 29 43 61

142 ~VORKMEN'S COMPENSATION INJURY TABLE
F~IBIT F-II WQR/~,~.~!'S Cg,MPENS.A.TION INJURY T~BL~
PERMANENT TOTAL DISABILITy
No. of Averse ,~e Cases* Degendency Distribution Arithmetic Pension i00 -'~ Injured (No Dependents) 50 50 86 Injured (With Dependents) 50 50
* 2900 Permanent Total cases included in the original study, Number of cases reduced proportionally to I00 for cmmputation purposes.
Membe~
F~IBI T F-III WORKMEN' S. CoMPENSaTION INJURY TABLE
No. of Average Percent Average Healing Injury - Type and Point Cases* , .Loss of Use Period (weeks).
Arm Dismemberment, at or above elbow 33 xx 29 Dismemberment, below elbow 16 xx 20 Loss of Use 7~ 62% 37
Hand Dismemberment 64 ~ Loss of Uee ll~ 66% 26
Leg Dismembermentp at or above knee 32 xx A9 Dismemberment, below knee 13 xx A9 Loss of Use 73 62~ 51
~c .36 /~ 6 ~ ;39
50 xx 1~
z 7c~ 2e
I000 xx 35
* 8,7~0 cases included in the original study. Number of
Fco~ Dismemberment Loss of Use
Eye Enucleation Lose of Use
Lo~ of Hearing (Both Ears)
Other Major Perm. Partial
'~__o';:L1 Major ~erm. Partial
cases reduced p r o p o r t i o r ~ L ~ to l, uo0 for valuation purpo6es.
** Indicate= Percent of Permanent Total (Body as a whole) or loss of earning power.

WORKMEN'S COMPENSATION INJURY TABLE 143
~m%~,s ~.~.SATrON ~.Jt~Y T@LE ,HI,OR _P~.!~N~IPARTIAL DIS~JHLITY
Average Average Healing
No .Of Percent Period Member Ir~ury- Tyne and Point Cases* Eo~p Of Us 9 (Weeks)
A° Minor Members
Thumb Dismemberment, ist Phalange 18 xx 9 Dismemberment, 2 or more Phalanges 9 xx II Lose of Use 112 26% ?
Index Dismemberment, let Phalange ~7 xx 7 Finger Dismemberment, 2 or more Phalanges 37 xx 12
Lose of Use 170 3~% 6
YLiddle Dismemberment, let Phalau~e ~3 xx 6 Finger Dismemberment, 2 or more Phalanges 31 xx i~
Loss of Use 139 31~ 6
Ring DismemBerment, .let Phalange 26 xx 5 Finger Dismemberment, 2 or more Phalanges 21 xx I0
Loss of Use I01 32% 5
Little Dismemberment, 1st Phalange 17 xx 5 Finger Dismemberment, 2 or more Phalanges 19 xx 8
Lose of Use 8~ 37% 6
Great Dismsmberment, ist Phalange ~ xx 9 Toe Dismemberment, 2 or more Phalenges 2 xx 16
Lose of Use 69 26% 6
Other Dismemberment lO xx 8 Toe Loss of Use 38 32% 7
Loss of Hearing (one Ear) ~ ~ 21 Total Minor Members i000 xx 7
B. Me let Me~ber~
Arm Loss of Use 116 15% 16 Hand Loss of Use 171 16 12 Leg Loss of Use 123 15 21 Foot Lose of Use 129 15 15 Eye Loss of Use 33 19 I0 l-~earing Loss of Hearing (Both Ears) 3 22 22
~otal .Major Members 575 XX 15
Other Minor Perm. Partial 313 8_~ 15
.To~3. Ninon" Perm. Partial 1888 XK 12
-20,123 Minor Permanent Partial Cases included in the original study~ consisting of 10,652 cases involving loss or loss of use of "fin~ers" or "toes"; 6,135 involving loss of use of arms, legs, etc,; and 3,336 cases o~ .general disability" related ~o Permanent Total disability. Number of Cases reduced proportionally to produce I,O00 cases involving fingers and toes~ 575 cases inVolving arms, legs, etc.; and 313 cases relates to Permanent Total.
*~Indicatee Percent of Pe,mmnent Total (Body as a whole) or loss of earnin~ power.

144
(1)
Duration (o,~-s)
8 9
10 11 12 13
15 16 17 18 19 20 2.l
23
25 26
28
29 30 31 32 33 % 35
(2)
No.0f Ca@e~
5954 5450 4898 42~0 3972 ~5~ 2926
2011 1919 1968 1796 2495 2/99 2357
1123 1067 1106 961 82O 6&8
1365
570 627 566 528 459 369
1028
h03 /,70 &07 &36 378
686
WORKMEN'S COMPENSATION INJURY TABLE
uEXHIBIT FLV wo~,~ COME~ ,~T_ ION., ZNam~ T~L~
~ ~ T(~A L D;[SAB]~I~T~
(3) Sulk. Of (2) Upward
.689~ 62990 575~0 526~ h8~.2 ~/.50 h1596
3867O 36659 3h7~o 32772 30?76
28282
25925 2~80~ ~.735 22~29 21668 208h8 2O20O
18835 18265 17638 17O72 165hA 16O85 15716
Ih688 Ih285 13815 13~08 12972 12594 12350
(~) (1) (=) Total
~lsabil i ty Duration No.Of (Days) _ (Da~e) Cases
1,578,t~86 36 286 1,509,5&2 37 282 i, ~6,552 38 334 1,389,012 39 258 1,336,370 ~0 251 1,287,9&8 Al 205 1, ~3, t~8 42 714
1,201,902 /43 272 1,163,232 ~24 271 1,126,573 45 250 1,091,833 &6 259 1,059,061 47 190 1,028,085 48 135
998,604 A9 &SA
970,322 50 190 9h~ ,397 51 181 919,595 52 206 895,860 53 17& 873,231 5& 161 851,563 55 123 830,715 56 517
810,515 57 151 791,680 58 162 773,/+15 59 192 755,777 60 ~9 738,705 61 97 722,161 62 73 706,076 63 310
690~360 6& 82 675,672 65 136 661,387 66 97 6&7,572 67 93 63&,164 68 80 621,192 69 56 608,598 70 235
(3)
of (2)
1166~ 11378 11096 10762 lO5O& 10253 lOOhS
933& 9062 8791 85&1 828~ 8092 7957
7~73 7283 7102 6896 6722 6561 6&38
5921 5770 5608 5h16 5267 5170 5097
~787 &?05 ~569
~379
(~) Total
Disabili
596,:~ 584,58/* 5?3,206 562,110 551,3~ 5~0,8~ 530,591
5~, 5/+3 511,209 502,11+7 A93,356 ~8~,815 ~76,533 h68,u.1
A53,011 &&5,728 &38,626 &31,73C &25,00~ &18,~7
h12,C/39 ~O6,088 ~@3,318 38,710 389,29/* 38~,027 3?8,85?
373,760 368,973 36~,268 359,699 355,22? 350,8~ %6,549
etc. etc. etc. etc.

WORKMEN'S COMPENSATION INJURY TABLE 145
D.ISTRI,BL~ION OF ~D, "r~AL LOSSES.BY SI~E
~ote !
Medical Loss Percent of Total Medical Per Claim in Excess of (i)
(2)
o ioo.o% 100 LS.0 200 33.3 30o 27.5 ~00 23.3
500 20.1 600 ].7.9 700 16,0 800 ~. 5 9OO 13.2
I,C09 12.0 1,500 8.5 2,000 6.3 2,500 5.0 3,000 ~.2
&,000 3.2 5,000 2.6 I0,000 I • 5 15,000 0.9 25,000 0.6
Based on Unit Statistical Plan Data filed with the National Council for the states of Connecticut, lllinoisp Maryland, Nebraska, South Carolina and New York.
146 WORKMEN'S COMPENSATION INJURY TABLE
PART I I - DEVELOPMENT OF THE NEW STANDARD WAGE DISTRIBUTION TABLE
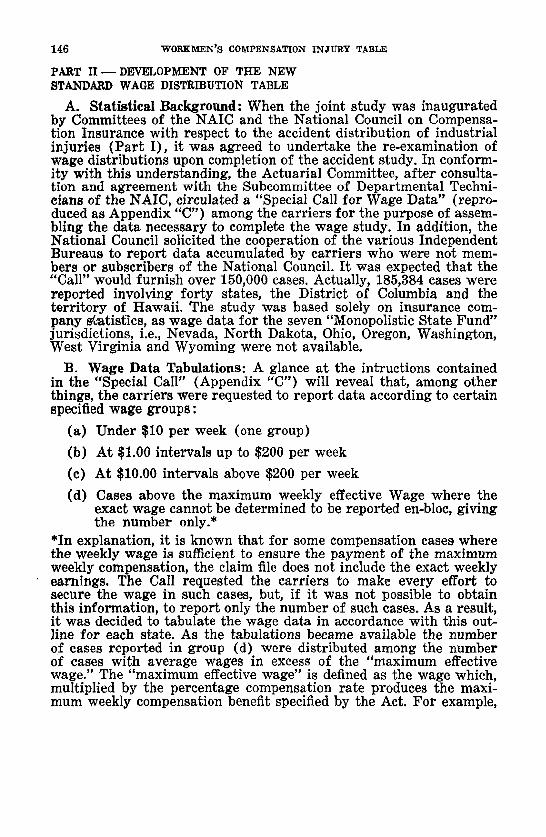
A. Statistical Background- When the joint study was inaugurated by Committees of the NAIC and the National Council on Compensa- tion Insurance with respect to the accident distribution of industrial injuries (Par t I), it was agreed to undertake the re-examination of wage distributions upon completion of the accident study. In conform- ity with this understanding, the Actuarial Committee, af ter consulta- tion and agreement with the Subcommittee of Departmental Techni- cians of the NAIC, circulated a "Special Call for Wage Data" (repro- duced as Appendix "C") among the carriers for the purpose of assem- bling the data necessary to complete the wage study. In addition, the National Council solicited the cooperation of the various Independent Bureaus to report data accumulated by carriers who were not mem- bers or subscribers of the National Council. It was expected that the "Call" would furnish over 150,000 cases. Actually, 185,384 cases were reported involving forty states, the District of Columbia and the terr i tory of Hawaii. The study was based solely on insurance com- pany sL~tistlcs, as wage data for the seven "Monopolistic State Fund" jurisdictions, i.e., Nevada, North Dakota, Ohio, Oregon, Washington, West Virginia and Wyoming were not available.
B. Wage Data Tabulations: A glance at the intructions contained in the "Special Call" (Appendix "C") wilI reveal that, among other things, the carriers were requested to report data according to certain specified wage groups:
(a) Under $10 per week (one group)
(b) At $1.00 intervals up to $200 per week
(c) At $10.00 intervals above $200 per week
(d) Cases above the maximum weekly effective Wage where the exact wage cannot be determined to be reported en-bloc, giving the number only.*
*In explanation, it is known that for some compensation cases where the weekly wage is sufficient to ensure the payment of the maximum weekly compensation, the claim file does not include the exact weekly earnings. The Call requested the carriers to make every effort to secure the wage in such cases, but, if it was not possible to obtain this information, to report only the number of such cases. As a result, it was decided to tabulate the wage data in accordance with this out- line for each state. As the tabulations became available the number of cases reported in group (d) were distributed among the number of cases with average wages in excess of the "maximum effective wage." The "maximum effective wage" is defined as the wage which, multiplied by the percentage compensation rate produces the maxi- mum weekly compensation benefit specified by the Act. For example,

WORKMENTS COMPENSATION INJURY TABLE 147
with a 66~% compensation rate and a $30 maximum weekly s~am- tory amount, the "maximum effective wage" is equal to $45 (66~% X $45 ~ $30). The distr ibution of these indeterminate wage cases was per formed for each state on a pro-ra ta basis. For the assumption made above, if we had 600 cases earning over $45 per week where the wage was reported and 18 cases reported with no wage given, the number of cases in each wage bracket above $45 wouId be increased 3% ( 1 8 - 600) ; the number of cases earning less than $45 per week would be unaffected since it is known that the 18 cases earn in excess of $45 per week. F rom Exhibi t I, it is noted that the total number of cases fall ing into this part icular cate- gory constitute approximately 2% of the total dis tr ibut ion. Also shown in this exhibit are the "maximum effective wages" and the average weekly wages which underlie the adjusted state distributions. With respect to this lat ter item, it will be noted that the average wages thus determined line up fair ly well with the average wages derived f rom another source (i.e. : the Semi-Annual Call for Wage Data) indicating, in a broad sense, tha t the wage data could be con- sidered representative.
The next phase of the study centered about the possibility of com- bining individual state data with the ult imate purpose of establish- ing a single countrywide wage distribution. An examination of the data, s tate by state, showed essentially the same pattern, suggest ing that the data for the various states could be combined. The direct combination of data, however, was not immediately possible since a distr ibution obtained by combining the data for a s tate with a $50 average wage with the data for a state with a $60 average wage would be meaningless. However, if the data for each state are t rans- formed so as to express the different wage brackets in terms of the ratio to the state average wage and the number of cases reported (a f te r assignment of the indeterminate wage cases) in each wage bracket in terms of the ratio to the total number of cases, a much bet ter comparison can be made of the data for each s ta te ; it is also perfect ly valid to combine data in this form. This t rans format ion was made and resulted in a wage distr ibution for each state (Ex- hibit II) in the following fo rm:
Col. (1) Ratio Actual Wage To Average Wage
10% 15 2O
Col. (2) Percent of
Total Number of Cases Earning Wage Equal to or Less Than Col. (1)
Comparison of results state by state expressed as above showed

148 WORKMEN'S COMPENSATION INJURY TABLE
essentially the same distribution about the state average wage. These results are summarized in Exhibit III. This exhibit has been limited to only eleven different actual wage sizes for ease in review but the figures for the ether wage sizes show a similar agreement. Exhibit III shows for example that in Connecticut 7.85% of the cases earned a wage equal to or less than 55% of the average wage; 18.02% of workers earned a wage equal to or less than 70~ of the average wage, etc. This is a cumulative distribution, i.e., the 18.02% of cases earning 70% or less of the average wage include the 7.85% of eases earning up to 55% of the wage, etc. This exhibit shows that 52.26% of all workers earn the average wage or less in Connecticut, 59.82% of al]~ workers earn the average wage or less in Delaware, etc. The country-wide average shown by this latest study is 56.61% as com- pared with 57.76% in the old distribution.
A similar cumulative distribution of the wages reported in the Call is given in Exhibit IV. Here again the actual wage is expressed in terms of its ratio to the state average wage. The cumulative amount of wages paid is expressed in the form of index numbers, the total wage for all workers being given the index 10,000. This is in accord- ance with the procedure followed in the present wage distribution (See the May 27, 1953 Report to the NAIC re: Valuation of Law A m e n d m e n t s - American Accident Table for details of the calcula- tion of limit factors). In discussing this exhibit it is more convenient to translate these index numbers to percentages by pointing off two places; thus an index of 350 is equivalent to 3.50%, an index of 1004 is equivalent to 10.04%, etc. Thus, Exhibit IV shows that 39.63% (index~3963) of the total wages in Connecticut are earned by work- ers earning the average weekly wage or less. The corresponding figure for Delaware is 43.23%, 43.50% for the District of Columbia, etc., with a countrywide average of 41.69% for the new distribution as compared with 44.27% for the old distribution.
A summary of the results shown in Exhibits III and IV is given in more complete detail in Exhibit V. This exhibit shows the country- wide "overall" average and also sectional averages (East, Central, West and South) as compared to the present distributions of em- ployees and cumulative payrolls. In deriving the sectional and countrywide averages, the distributions for each state were assumed to be equally valid and were given equal weight.
From a review of the similarity of distribution of number of em- ployees and wages earned when expressed in terms of percent of the average wage and percent of employees (or total wages), as shown in Exhibits II, III, IV and V, it is evident that a single countrywide dis- tribution can be used for calculating the effect of a law amendment in any state. As an illustration of this conclusion, the effect on compensa- tion costs of various amendments affecting the percentage rate of compensation and/or the amount of maximum weekly compensation were calculated, using:

WORKMEN'S COMPENSATION INJURY TABLE 149
(a) The new average countrywide distribution.
(b) Single state distributions for two states with the greatest de- partures from the average distribution. State #1 is a state with a large concentration of workers at the lower end of the wage scale, and State #2 is a state with a large concentra- tion of workers at the upper end of the wage scale.
(c) The present wage distribution for purposes of comparison.
The amendments assumed and the corresponding law amendment factors are shown in Exhibit VI. The effect of these amendments were calculated in accordance with the standard procedure. It should be noted that the results obtained from the various wage distributions depend upon the type of amendment. For an amendment increasing the percentage compensation rate but not changing the maximum weekly compensation, it would be expected that the distribution show- ing the greatest concentration of cases at the lower end of the wage scale would show the greatest effect. In such a state the full per- centage increase would be realized on more cases than in a state with a concentration of cases at the upper end of the wage scale where the maximum weekly compensation would be the governing element. This is borne out by the results for the first four assump- tions, where the distribution for State #1 gives the largest amendment factors. Conversely, for an amendment increasing the maximum weekly compensation, the distribution with the concentration of cases at the upper end of the wage scale would show the greatest effect. This is illustrated by the results shown for State #2 for the 2rid and 3rd group of assumed law amendments in Exhibit VI. For an amend- ment increasing both the percentage compensation rate and the maxi- mum weekly compensation, the two elements discussed above would work in opposite directions. This is illustrated by the last three assumptions of Exhibit VI which show only slight departures from the average distribution for States #1 and #2. An effect of a change in the amount of minimum weekly compensation would be calculated in the same manner. However, the minimum weekly compensation has only a very slight effect on the resulting limit factor and the calcula- tions of Exhibit VI were carried through on the basis of assuming no minimum weekly compensation.
The results shown in this exhibit fully bear out the conclusion previously expressed, namely, "a single countrywide (wage) distribu- tion can be used for calculating the effect of a law amendment in any state." In this exhibit the effects of typical changes in indemnity benefits have been calculated using the countrywide average distribu- tion, and the individual state distributions for two states showing the greatest deviation from the countrywide average. The differences between the amendment factor produced by the individual state dis- tribution and the countrywide average distribution are shown in columns (8) and (10). The greatest difference is an excess of .016

1~0 WORKMEN'S COMPENSATION INJURY TABLE
fo r the individual s ta te distr ibution over the countrywide average. Medical benefits are of course unaffected by changes in the weekly limits or compensation rate, and this difference of .016 would there- fore usually be less than .010 (1.0%) on an overall basis. This differ- ence is insignificant.
The results shown in Exhibi ts I to VI inclusive were reviewed by tlYe Actuarial Committee of the National Council at a meet ing held May 19, 1954. I t was noted that the data shown on these exhibits were based on the data as reported by state wi thout adjustment , except to dis t r ibute the cases where the wage was not reported, pro ra ta among the other cases with wages in excess of the maximum effective wage. These final results for all s tates combined still showed minor irregulari t ies in the percent of total cases fall ing in each wage bracket. I t was recommended that this distr ibution of cases be smoothed, and the corresponding cumulative wage distr ibution be determined by accumulat ing the product of the percentage of cases in each wage bracket (10% to 15%, 15% to 20% etc.) by the mid- point of each wage bracket (12.5%, 17.5% etc.). The actual and /o r smoothed distr ibution of cases and corresponding index of wages pay- able are presented in Exhibi ts VII, VIIA and VIIB.
Exhibi t VII I shows a comparison of the "old," wage distr ibution wi th the "new." I t will be noted that the new distr ibution shows a slightly heavier weight of cases toward higher w a g e s - as could be expected. The new distr ibution runs to wages 200% above the aver- age state wage as compared to 170% above the average for the old distribution.
The National Council on Compensation Insurance will use the re- vised wage distribution, as recommended by the Actuarial Committee and approved by the N.A.I.C. for calculating the effect of law amend- ments involving the use of "Limit Factors ."

WORKMEN'S COMPENSATION INJURY TABLE 151
State . . . . .
Connecticut Delaware Dist. Cf Col. Maine Naryland Massachusetts Ne,:~ Hampsklre New Jersey Mew Y ~rk Pennsylvania Rhode Island Vermont
EAST TOTAL
Illinois Indiana Iowa Kansas Michigan M~mesota Mississippi Missouri Nebraska South Dakota Wisdonsin
C~TRAL TOTAL
California Colorado Idaho Montana New Mexico Utah Hawaii
k~ST TOTAL
Alabama Arkansas Florida Georgia Kentucky Louisiana North Carolina Oklahoma South Carolina Tennessee Texas Virginia
SOUTH TOTA,~,
GRAND TOTAL
, hTd11~IT I
S~- Max.hn~ No. Of Cases Reported
Special Annual Effective Call . .q~! i~ago Total
69.13 67.38 66.67 2,675 63,57 50.00 433 65.08 66.52 962 52.5o 55.02 53.50 SO.50 1,082 63.98 66.~I 52.50 3,102 63.01 62.93 65.00 8,996 55.01 5&.00 &9.50 1,027 71.36 70.59 &5.00 9,282 66.98 66.77 AS.O0 16,%~ 65.10 ~9.75 ;*,623 62.09 61~75 &6.67 1,227 5;*.31 53.67 50.00
xx xx xx 50,853
72.11 71.96 37.00 12,5;,5 65.83 65.29 50.00 4,671 64.31 62.30 42.00 2,092 71.42 70.50 ;*6.67 2,077 77.75 77.21 67.31 5,680 66.73 6~.9~ 48.00 3,607 k9.TA 48.&0 37.50 1,903 6;*.36 63.81 52.50 5,558 65.31 64.79 &2.00 1,383 6~.98 6;*.67 50.91 3;*9 67.19 66,48 52,86 6.227
xx ax xx 65,892
76.A0 73.27 53.85 23,572 7&.03 69,55 46.62 893 75.05 78.26 A6.67 476 74.02 72.77 67.36 210 78.37 78.46 50.00 1,9~8 71,01 69.7~ 45,8~ 975 56.69 63.01 52.50 518
xx mc ,xx ~ , 5 9 ~
51.~7 51.18 38.67 1,760 53.13 51.65 38.46 2,o66 57.75 57.58 58.33 6,136 52.35 51.68 48.00 2,5&3 62.35 62.36 41.56 1,719 59.61 59.21 ;.6.15 5,666 51.57 51.79 50.09 3,3;*5 63.16 6~.21 42.OO 3,483 51.78 51.76 58.33 1,295 53.39 56.~9 ~6.67 2,~A8 69.12 66.71 &1.67 26,276 56.61 52.05 61.67 3.36~.
x x xx xx 60,067
~ ~ 185,38~
Above Elf. Wage Max.With Not Wage Stated, Given
267 2 569 8 739 " 5
1,935 61 /*,357 35
6~.0 9 7,746 3.37 12,~/i 575 3,296 133
933 2 2
3~,553 1,O36
10,925 ~2 3,082 88 1,7~ 21 1,735 22 4,966 2,855 31 1,121 39 3,481 132 1,136 32 Z~2
4,6oo __gl
35,80? 877
18,901 152 758 S ~6 2 174 2
1,616 28 667 198 3#~ o
a2,867 390
1,041 1,431 52 2,375 361 1,1~ 69 1,298 11 3,288 181 1,336 5 2,791 150
387 17 ! , 2 ~ 69 21,256 571 .2am2 5
39,765 1,611 132#992 3,9M~

152 WORKMEN~S COMPENSATION INJURY TABLE
OJ~tAZ'~E Dtm'Rtmn~t~ OF ~LO~ES ~D pA~Qtt ~ s t ~ oF mm~IP WA~
Rase~ On Raw Da~
(1) (~) O) {~) (5) (63 (?)
Wage '1"o Ave~a~e WaRe Alab~_~ae Cal~/orn$~ Colorado Oor~ec%leu~ Delaware
PERCE~ T(EAL ~I'LOIrEF~ WITH WAGES EC~AL TO OR LESS THAN COLU~ (i)
(8)
D. 0o
zo~ 25 hO 55 70 85
10o
325 130 ~ 5 160 175 190
2O5 220 235 250 265 300
1 0 2 0 0 0 2 6 10 39 ? 12 23 2?
102 71 119 66 64 65 123 385 221 396 50'/ ~50 4?0 535
1593 992 11~ 1004 lh31 1618 2862 3394 2086 261+ 22/+1 2693 277+
~63 ~56 .~915 +O68 3963 +323 6350
5209 5750 5723 5808 5766 5665 532 63?O 6h~, 7313 6670 693+ 6?20 63o7 7056 7261 848? 7909 8321 %5? 69O? 7890 '7?78 92~ 8890 90"/+ 7997 7519 8~69 8261 95/d4 92/+6 95+8 8191 8078 8687 8?53 9751 94O9 9666 9057 8850
923+ 9058 98~3 9610 9763 9511 9h03 9~J,~9 9329 9899 9683 9869 9807 96.~.3 9?03 %51 9918 9735 9906 9858 9?86 976t~ 9586 9932 9?63 9931 9912. 9811. ~YgO 9689 9952 9763 9951 9912 9811. I0000 10000 10000 10000 10(300 10000 i0000
10~ .n~ .o~ .2o~ .oo~ .oo~ .oo~ .3~ 25 .34 .4e 2.92 .~ .64 L~ ~.~6 40 =.~ 2:" 4~8 2.13 2.Z? 2.31 ~.16 55 8.16 5.28 9.84 11,20 ?.85 10.62 12.t~? 70 2%08 27.08 19.17 21.95 18.a2 25.8? 29.52 85 ~.87 50.~ 33.28 +0.09 :D.?9 ~ . ~ t~.28
10o 58.7k 61.97 53.o0 55.88 52.26 59.82 61.23
115 67.99 ?3.93 69.~. ?2.00 69.57 ?2.29 ?0.2? 130 78.O5 ?9 ,~,6 82.63 79.06 80~5 80.83 78.48 1,6,.5 m.33 85.66 91.16 88.24. ~9.91 83.85 82.95 160 89.m ~.o5 95.~0 ~,:~, 95.9~ ,~.~, 86.90 175 92.+, 91.96 97.m . . 7 9 90.99 9o . . 190 93.85 9+.67 99.03 9?.?6 98.+? 95.61 9+.59
205 96.78 96.22 99.52 98.77 98.99 97.92 97.51 220 9"1.8"I 97.53 99.66 99.2.0 99.58 99.31 98.65 235 9%02 98.01 99.95 99.33 99.66 99.5~. 99.2? 250 99.31 98.64 99.~ 99.~ 99.?8 99.77 99.38 265 99.~,3 99.03 99.88 99J,& 99.~ 99.77 99.38 500 lO0.O0 1<30.00 100.00 100 .00 1 0 0 . 0 0 100.00 100.00
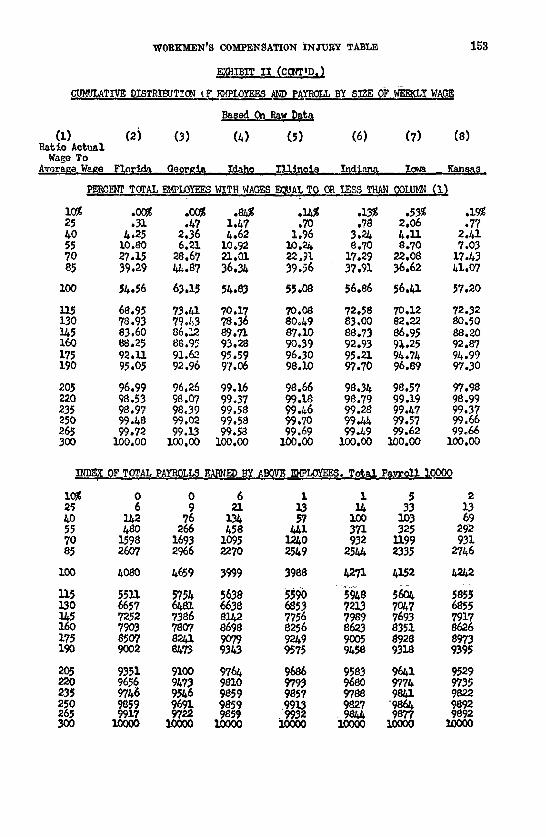
WOREMEN'S COMPENSATION INJURY TABLE 1~3
Based On Raw Da~a
(Z) (~) (3) &) (5) (6) (7) (8) Ra~io Actual
~/age To Average. W~e Flo~ida GeorKia Idaho l"LlL~qie .... Indiana ~owa Kansas
25 /*0 55 ?0 85
1OO
130 IA5 160 1?5 190
205 22O 235 ~50 ~65 300
.O0~ .OO~ .8~ .~ .13~ .5~
.31 .,7 1.47 .70 .78 2.06 /*.25 2.36 ,°62 1o96 3.24 /*°11 10.80 6.21 10.92 IO.~ 8.70 8.?0 27.15 28.67 21.O1 22.~1 17.29 22.08 39.29 ~.87 36.3~ 39.56 37.91 36.62
5/+.56 63.15 5,.83 55,,08 56.86 56.~1
68.95 73.~ 70.17 ?0.O8 72.58 "/0.12 78.93 79oZ:3 ?8.36 80.49 83.00 82.~ 83.60 86.12 89.9'1 87.10 88.?3 86.95 88.25 88.95 93.28 90.39 9:~.93 91.25 92.11 91.62 95.59 96.30 95.21 9,.?A 95.05 92.96 97.06 98.10 97.70 96.89
96.99 96.26 99.16 98.66 98.3t,, 98.5? 98.53 98.07 99.37 99.18 98.79 99.19 98.97 98.39 99.58 99.46 99.28 99./*7 9%,8 99.02 99.58 99.70 99~4d~ 99.57 99o72 99.13 99.58 99.69 99./*9 99.62 100o00 100.00 100o00 100.00 100.00 I00.00
.77 2.,i 7.O3 17./.3 41.O7
57.20
72.32 80.50 88.20 92.8? 9/, .99 9"/.30
9/.98 98.99 99.3? 99.66 99~66
100.00
~DEX OF TOTAL PAYROLL8 EA]~NED ~ ABOVE ]D~PLO~. Tota I Payroll i000~
2=;
55 70 85
100
115 130 ~ 5 Z60 Z?5 190
205 220 235 250 265 3O0
0 0 6 1 1 5 6 9 21 23 1/* 33
1~2 96 13~ 57 100 103 480 266 ,58 Z~l 371 325
1598 1693 1095 1~0 932 1199 2607 2966 22?0 25~9 25~ 2335
4080 ,~9 3999 39~ ~ ~2
5511 5?5/+ 5638 5590 ~ 59/.8 56o~ 6657 ~ 6638 ~53 7213 ?o~./ 7252 ?386 8142 ??56 ?989 "/693 ?903 ?80? 8698 8256 8623 8351 8507 ~ 9079 92/+9 9005 8928 9002 ~T~ 93,3 95?5 %58 9318
9351 9100 976~ 9686 9583 9~1 9656 9/*?3 9810 9793 9680 9??/* 9?,6 95/*6 9859 985? 9?88 98~ 9859 9691 9859 .9913 982? '98~ 991./ *~ 9859 .9~2 .9~V~, 98?7
2OOO0 1O00O 1O00O IO(O)O
2 13 69
292 931
2746
1,91.9
5855 6855 7917 8(o6 89?3 9395
9529 9/35 9822 9892 9892
1OOO0

1~4 WORKMEN'S COMPENSATION INJURY TABLE
_~_._ZB!T ZZ (CO~T.D.)
O~A. TI~E DISTP~TION OF ~PLOY~Y~S A~) PAYROLL BY SIZE OF WE~Z WAGE
(1) (2) 0 ) (~) (5) (6) (7) (8) Ra%io AcC~a] Wage To
Awra~e Wa~e KenCuck~ X~ui~..lana Mai~e Maryland Massachusett~ Mic~i~a~ Y~inn._
10~ 25 hO 55 ?0 85
100
115
1~5 160 175 190
205 220 235 250 265 500
PERCENT T~AL ~ E E S ,W1TH WAGES E~JAL TO O R T:~'.qq THAN qO_L~R ' (2,)
.00~ .00~ .00~ .06~ . ~ .0~ Jj. .% .65 ,52 .69 .58
2,73 3.67 1.85 2.% 2 ,~ 3.06 12.80 13.% 6.75 10.06 8.28 8.9~ 26.hi 29.97 26.99 21.18 20.55 19,61 hl.~2 t+6.95 hO.ll 37.85 35.82 38.10
56.08 5%?0 55.55 5h.61 55.03 57.71
69.~+ 68.09 70,15 71.24 70.62 72.69 80J,5 75.56 81.05 82.1~ 83.16 83.59 85.69 81,01 89.~,6 87.% 89.60 88.61 88.13 85A9 93.62 91.68 93.98 93.5h 93.08 91 .:.8 95.h7 93.91 96.h3 96.29 96.% 95.89 97.13 96.55 9'7.53 9%15
98.1~ 97.30 98,15 98.~8 99.09 98.2~ 98.72 98,01 98.61 99.07 99.38 98.6~ 99.O1 98.M- 90.35 99.61 99.h9 98.86 99.~2 98.87 99.72 99.71 99.69 99.12 99.77 99.28 99.72 99.77'7 99.77 99.~ 100,00 100.00 100.00 i00.O0 I00.o0 100.00
.O0~ 1.08 2.t~. 8.~3
18.30 38.81
57.03
73~i 83.75 89.02 93.65 96.78 98.03
98.56 99.1~ 99.28 9%50 99.6/+
1(30.00
~DE~ OF TOTAL
lo~ o 25 6 ~0 7~ 55 562 70 ~I 85 2580
100 3%6
115 536~ 130 6716 lh5 7h38 160 78~ 175 8617 190 927h
205 9551 220 9676 235 97h3 250 98z~1 265 993/. 300 10008
O O 1 1 1 13 12 10 13 10 113 51 91 86 98 62? 300 h61 353 386 1652 1621 1169 11 ~;: 10~ 2976 2635 2478 2315 2507
3922 h072 ~000 ~099 &327
h998 56&3 573~ 5?72 5920 5891 696o 7050 72% 7252 6629 8110 7836 8175 7%7 7331 8?33 8407 88~8 8697 8205 9O~6 8780 9261 9150 9033 9351 9256 9~60 930~
930~ 9553 9633 9763 9518 9/,51 9651 9?58 9822 96~ 950 9820 98"/9 98h7 9653 9~,7 9911 9903 9895 9713 97h9 9911 992O 9915 9791 10000 10000 i0000 i00OO i0000
O 20 66
366 10OA 26O6
h30o
6o~ ?332 8055 8761 9283 951~
9620 9738 9770 9825 9861 i00OO

WORKMEN'S COMPENSATION INJURY TABLE 155
E~szm'r n (ce~c 'D. )
_~sed On Raw Data
(1) (2) (3) (~) (5) (6) (7) (8) (9) Ratio Actual Wage To
Average Wa~e . Mis~Missouri Montana Nebraska N.H. New Jersey ~ew Mexico N~w York
PERCENT TOTAL ~LOYEES WITH WAOKS ~JAL TO OR LESS TK~N COLUNN (I)
lo% .oo% .~ .4~ .oo~ .oo% .2O% .oo~ .1~ 25 . ~ .61 2.86 .58 .~9 .79 1.13 .93 ~0 1.94 2.14 5.71 2.75 I~27 2.74 3 .~4 2.87 55 6.94 9.57 i0.95 8,03 6,?-3 7.66 ll.O& 9.13 70 29.64 23,&3 19.52 20,97 12.37 17.56 24.90 20.30 85 51.71 38.79 35.24 39.~8 30.19 35.61 41.53 36.84
i00 59.75 56.68 55.24 57.~i 55.99 5~.72 55.95 5~.69
115 72.20 70 .28 69.52 73.~6 74.10 7~.6& 67.15 70.58 130 78.98 82~28 78.10 81.78 87.05 84,60 77.10 81.52 145 83.55 ~'/,,24 90.00 87.64 92o21 90.02 89.8~ 88.86 ibO 88.~ 96.64 c2.86 93.20 96,11 92.28 94.15 92.70 175 91.64 93.65 97.62 95.66 97,86 94.79 96.00 95.47 190 93.75 97.37 ~8.10 97.18 98.73 97.35 97.95 97.43
205 96.32 98.63 98.57 98.19 99.22 98.83 98.51 98,49 220 97.16 99 o14 99,52 98.77 99.81 99.38 99.18 98.95 235 98.00 99¢59 9~.52 99.13 99.90 99.49 99.54 99,32 250 98.27 99.69 ?9.52 99.28 99.9O 99.61 99.74 99.49 265 99.00 99.80 99.52 99.64 I00.00 99.7~ 99.90 99.63 300 100.00 ZOO.O0 1~.00 I00.00 IOO.O0 100.00 loo.o0 tOO.CO
INDEX OF TOTAL PAYROLLS F_ARN~D BY ABO~E ~PLOYEES. Tota.,l Pavro.l~l I0000
108 0 2 3 0 0 2 0 2 • % 8 IA 40 13 9 7 ~ I;" /to 61 64 ~5 89 35 64 lO6 8~ ~5 30~ ~37 395 349 287 3O2 485 398 70 1751 1346 937 1178 687 917 1375 1119 ~5 3455 2567 2189 2613 208~ 2319 2~96 2380
I0~ 4187 4197 4037 4278 ~4~3 ~099 4034 3991
115 5481 56~3 5562 6026 6412 622/+ 5226 5691 130 6301 708& 6623 7045 7995 7~3 6&75 7021 lA5 6925 7754 8203 7839 8692 8182 8223 8016 160 7654 8320 8635 8679 9285 8523 8874 8592 175 8187 8758 943& 9083 9567 8941 9185 9052 190 8569 9434 9520 9353 9728 9401 9543 9~05
205 9068 9680 9612 9555 9826 9695 9654 9613 220 9251 9785 9821 9664 9953 9810 9798 9710 235 9h33 9886 9821 9748 9975 9837 9879 9792 250 9499 9913 9821 9784 9975 9866 9931 9833 265 9691 9937 9821 9078 I0000 9897 9971 9869 300 10000 10O00 100O0 10000 10OO0 10000 i0000 10O00
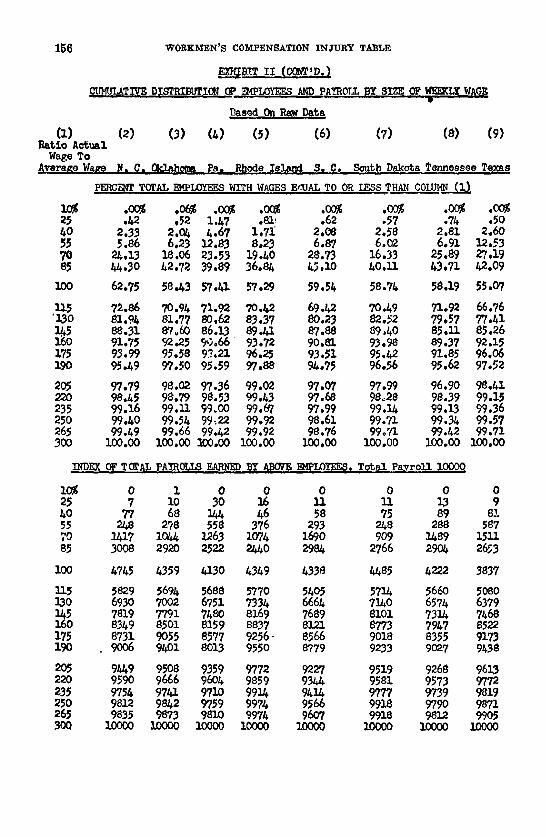
156
(1) ~/at5 o Ac t~ l Wage To
hvera£e WaL, e
lO~ 25 40 55 70 e5
IO0
115 "130 ~5 Z~O 175 190
2O5 220 235 250 265 3O0
WORKMEN~S COMPENSATION INJURY TABLE
.Daaed On Raw Data
(2) O) (6,) (5) (6) (7) (8) (9)
N. C. Gklahom_ pa, Rhode i~_la~i S.C. South Dakota Tennessee Texas
.Pm~ ~ m~um~ WITH WAOES E~Tq ,oR,, LESS TH~COU~ (1)
.OO~ .0~ .00~ .OO~ .00~ .OO~ .OO~ .00~ • /~ ,52 l.h7 .al! .62 .57 .76, .50
2.33 2.Oh h.67 1.71 2.08 2.58 2.81 2.60 5.86 6,23 12.89 8*23 6,87 6.02 6.91 12.53 2h,13 18.06 23.53 19.40 28.73 16.33 25.89 27,19 /,~.30 h2.72 39.89 36.8& &~.lO &O.ll 43.71 &2.09
62.75 58&3 57.~. 57.29 59.56, 58.76, 58.19 55.07
72.86 70.94 71.92 7O.6,2 69J.2 70.49 71.92 66.76 81.94 81.77 80,62 83.37 80.23 82.52 79.57 77,~% 88.31 87,60 86.13 89./,,1 87.88 89,40 85.11 85.26 91.75 92.25 9,3.66 93.72 90.81 93.98 89.37 92.15 93.99 95.58 93,21 96.25 93'51 95.62 91.85 96.06 95.&9 97.50 95.59 97.88 9h.75 96.56 95.62 97.52
97.79 98.02 97.36 9%02 97.07 97.99 96.90 98.41 98.6,5 98.79 98,53 99.43 97.68 98,28 98.39 99,15 99.3.6 99.11 99,00 99.67 9?.99 99.1& 99.19 99.36 99.40 99.5/, 99~22 99.92 98.61 99.71 99.36, 99.57 99.&9 99.66 99./~2 99.92 98.76 99o7"I c)9.~ 99.71 i00.00 I00.00 100.00 IOO.00 1(30,00 I00.00 iO0.00 IO0.00
,,INDEX. OF .TOTAL. PAYROLIS ~ . BY ABC~ ~DYEES, T�tal P%vr.o.ll 1(3000
lO~ 25 40 55 70 85
IO0
115 130 ~5 160 175 190
2O5 220 235 250 265 30Q
0 1 0 0 0 0 0 0 ? 10 30 16 11 11 13 9
77 68 ~ ~6 58 75 89 8! 2h8 2?8 558 376 293 2~8 288 587
I~17 lOhh 19,63 1074 1690 909 I~89 1511 3008 2920 2522 2hkO 298& 2766 290~ 26~3
h745 ~59 &1.30 ~3~9 h338 ~,85 &222 3837
5829 569h 5688 5770 5h05 5714 5660 5080 6930 70O2 6751 7336, 666& 71&0 6576, 6379 7819 7791 7h80 8169 7689 8101 731~ 76,68 836,9 8501 8159 8837 8121 8773 79/+7 8522 8731 9055 8577 9256 - 8566 9018 8355 9173 9006 9/+01 8013 9550 8779 9233 9027 96,38
9hA9 9508 9359 9772 9227 9519 9268 9633 9590 9666 9606, 9859 93hh 9581 9573 9772 9?56, 97Z~1. 9710 99~ 9hl& 9777 9739 9819 9812 98~2 9759 9974 9566 9918 9790 9873. 9835 9873 9810 9976, 9607 9918 9812 9905 10000 10000 10000 1000O 10000 10000 10000 1000O

(1) Ratio Actual Wage To
Average WsKe
WORKMEN'S COMPENSATION INJUBY TABLB 157
~::Brr n (corr. ,9,)
.~TIVE DISTRIBUT!C! OF_E~LOY.~S AND pAYROIL BY SIZE 0P WE~IY WAGE
Based O~ Raw Da%@
(~) (3) (h) (5) (6)
Utah Ve~ont Vir~in~ Wi~o~msln Rawai~
pERCENT .TOTAL .E~4PLOYESS WITH WAGES E~'JAL TO OR LESS T}~ COi~ (i~
lO~ . ~ .oo~ .oo~ .o55 .0o~ 25 .hl .99 .36 .51 .19 ho 2.15 2.38 1.96 1.80 1.16 55 8.62 &.96 5 ~68 7.~7 h.25 70 1&. ~7 11.51 ~ .85 18.29 10.62 85 31.79 26 ~19 l: 5.93 33.05 25.48
10O &8.92 57.~ 59.78 55.89 63.2~
115 69.6h 76.98 71.58 71.66 61.97 130 83.0s 86.51 79.25 83.65 69.11 1&5 92.~2 92.86 85 .O5 90.12 82.82 150 96.~2. 95.oh 89.60 9h.38 9o.35 175 98.15 97 • 02 92 • 60 97.53 93.63 190 99.08 99,01 9~.89 98.83 96.14
205 99.38 99.60 96.h0 99.hh 97.k9 220 99.59 99.60 97 .~4 99.58 98.O7 235 99.59 99.80 98.16 99.73 99.03 250 99.79 99.80 99.38 99.76 99.03 ~65 99.79 99.~O 99.&9 99.89 99.~2 300 10O.00 10O.00 10O.00 100.00 100.00
INDEX OF TOTAL PAYROI/S EARNED I~_.ADOVE ~PLOYF2~. Total Payroll 1'3000
10~ 2 0 0 0 0 25 8 17 6 10 ,.'~o 82 65 61 52 36 55 ~63 189 235 327 175 ?0 896 610 2363 1008 5~5 85 2172 1758 2971 2165 1571
I00 3731 h635 &238 h282 30~6
115 590~ 67h7 5500 5980 hSh7 130 7;~97 7889 ~39 7&&9 5627 1&5 8775 8757 7233 8333 7291 160 9h0~ 9085 ?92t~ 8977 8313 175 9595 9h16 ~,2h 9506 88O5 190 9759 9782 8837 97~. 9210
2O5 9810 9901 9136 9861 9hA9 220 986~ 9901 9311 9891 9558 295 986b, 99h5 9520 992& 975h 250 9896 9945 981~ 9931 975h 265 9896 99h5 98h5 996h 98hA 300 1O00O 10000 1O000 10000 10000

158 WORKMEN'S COMPENSATION INJURY TABLE
E~ IBIT III
STPDY (~. WAGE DISTRI~UTIONS
Cumulative Distribution Of Cases Receiving Actual Wage Indicated ~g~r~s ~ P~er~nt)
Ratio Of Actual W a~e To. Average, Wa~e Stat_.._~e ~ 7~,~ 85% ~ ii~. ~ 145~ 160% 17~ ~ 190% 205%
Corm. 7.85 18.O2 33.79 52.26 69.57 80.45 89.91 94.92 97.79 98.47 9~.99 Dela. 10.62 25.87 42.03 59.82 72.29 80.83 86.37 89.84 90.99 95.61 97.92 D,oA C, 12,47 29,52 44,28 61,23 70,27 78.~8 82.95 86,90 90.33 94,59 97.51 ~aine 6,75 26,99 &O,ll 55.55 70,15 81.05 89.46 93.62 95.47 97.13 98.15 Md. 10.06 21.18 37.85 54.61 71.24 82.~+ 87.94 91.68 93.91 96.55 98.48 Mass. 8.28 20.55 35.82 55.O3 70.62 83.16 89.60 93.98 96.43 97.53 99.09 N,Hamp. 6.13 12.37 30.19 55.99 74.iO 87.05 92.21 96.11 97.86 98.73 99.22 N.J. 7.66 17.56 35.61 54.72 74.6& 84.60 90.02 92.28 94.79 97.35 98.83 N, Y. 9.13 20.30 36.84 54.69 70.58 81.52 88.86 92.70 95.47 97.43 98.49 Pa. 12.83 23.53 39.89 57.41 71.92 80.62 86.13 90.66 93.21 95.59 97.36 R. I. 8.23 19.&O 36.84 57.29 70,&2 83.37 89.41 93.72 96.25 97.88 99.02
EAST ~VEP~GE 8,75 20,57 36,62 56,31 71,90 82,48 88,81 92,62 94.96 97.16 98,56
Ill, 10,24 22.91 39.56 55,08 70,08 80,49 87,10 90,39 96,30 98,10 98,66 Ind, 8.70 17.29 37.91 56.86 72.58 83.00 88.73 92.93 95.21 97.70 98.34 Iowa 8.70 22.08 36~62 56.~I 70.12 82.22 86.95 91.25 9&.74 96.89 98.57 Kansas 7.03 17.43 &l.07 57.20 72.32 80.50 88.20 92.87 94.99 97.30 97.98 Mich. 8.94 19.61 ~8.10 57.71 72.69 83.59 88.61 93.54 96.29 97.15 98.28 Minn, 8.43 18.30 38.81 57.O3 73.41 83.75 89.02 93.65 96.78 98.03 98.56 Miss, 6.94 29.64 51.71 59.75 72.20 78.98 83.55 88°44 91.64 93.75 96.32 Mo, 9.57 23.43 38.79 56.68 70.28 82.28 87.24 90.64 93.65 97.37 98.63 Neb. 8.03 20.97 39.h8 57.41 73.46 81.78 87.6& 93.20 95.66 97.18 98.19 S.D. 6.02 16.33 l~O.ll 58.74 70.49 82.52 89.40 93.98 95.42 96.56 97.99 Wisc. 7.&7 ~ ~3.O~ $~.89 71..66 8~.6~ 90.12 94.~8 97.53 98.83 .9~ CENTRAL AVerAGE 8.19 20.57 39.56 57.16 71.75 82.07 87.87 92.30 95.29 97.17 98.28
Calif, 9,84 19,17 33,28 53,00 69,81 82.63 91,16 95.&0 97,88 99,03 99,52 Col j~ 11,20 21,95 40,09 55,88 72,00 79,06 88,24 94,7& 96,86 97,76 98,77 "G~o 10,92 21.O1 36,34 54,83 70,17 78.36 89,71 93,28 95,59 97.06 99.16 £ont, 10,95 19,52 35,24 55,24 69.52 78,10 90,00 92,86 97,62 98,10 9:).57 ~!, ~A, 11,04 2&,90 41,53 55,95 67,15 77,10 89°84 94,15 96,00 97,95 98.51 Utah 8,62 14,97 31,79 &8,92 69,64 83,08 92,72 96,92 98,15 99,08 99,38 Hawaii ~.2~ .10.62 25.A8 &3.24 61.97 69.11 ~..82 90.35 93.63 96.14 97.&9 WEST AVerAGE 9,55 18,88 34,82 52,&4 68.61 78,21 89,21 93,96 96,53 97,87 98,77
A•e Ark, Fla. Ga. Kp, La, N. Co Okl~ S. C.
8.16 29.08 42.87 58.74 67.99 78.05 83.33 89.02 92.64 93.85 96.78 5.28 27.08 50.~ 61.97 73.93 79.46 85.66 89.05 91.96 94.67 96.22
10.80 27.15 39.29 54.56 68.95 78.93 83.60 88.25 92.11 95.05 96.99 6.21 28.67 44.87 63.15 73.41 79.43 86.12 88.95 91.62 92.96 96.26
12.80 26.41 &1.42 56.08 69.34 80.45 85.69 88.13 93.08 96.74 98.1& 13.94 29.97 46.95 57.70 68.09 75.56 81.01 85.69 91.18 95.89 97.30 5.86 24.13 44.30 62.75 72.86 81.94 83.31 91.75 93.99 95.49 97.79 6.23 18.O6 42.T2 58.43 70.94 81.77 87.60 92.25 95.58 97.50 98.(%2 6.87 28.73 45.10 59.54 69.6,2 80.23 87.88 90.81 93.51 94.75 97.07

WOEKMEN'S COMPENSATION INJURY TABLE 159
r,__mrBIT I n (C0~T,D.)
STUDY OFWAOE DISTRIBUTIONS
Cumulative Distribution Of Cases ReceiviDE__ActualWage Indicates (Fi~es In- Pe~t) • '
Ratio Of Actual Wage Te Average Wage state ~ ~ ~ , ~ mo~ Z~ l~q; ~5~ ~ !7~ ~ 2o5~
Tenn. 6.91 25.89 43.71 58.19 71.92 79.57 85.11 89.37 91.85 95.62 96.90 Texas 12.53 27.19 ~2.09 55.07 66.76 77.41 85.26 92o15 96.06 97.52 98o41 va, 5.68 2_42~.8 4~.9~ 59.78 71.58 79.2~ 8~.o~ 89.6_0 92.60 9&.89 96.&o SOUTH AVEP~GE 8 , ~ 26,&3 4&,14 58,83 ?O,&3 79,34 8&.97 89,59 93,02 95,41 97,19
OVERALL AVERAGE 8.65 21~97 39.2# 56.61 70.89 69.77 87.53 91.89 9~.75 96.78 98.13
SMOOTHED AVERAGE 9.05 22.08 39.01 56.&5 70.66 80.52 87.35 91.64 9&.94 97.00 98.32
STATES ~;ITI] O~ZATES~ DEVIATION FRC~OVDR~(~-~
Plus Ls, La. Misse NO, N,J. N,Ho N,H,
Minus Ark, N,H, NoH, Conn, Tex, La. La,
N.ll, Cal. Cal. Wisc, (N.H.) (N.H.)
Lao La, Ga, Ark,
*Excludes states with less than I000 reported cases,

160 WORKMEN'S COMPENSATION INJURY TABLE
EXHIBIT IV
~TUDY OF)~AGE DISTRIDUTIOk~S
Cum~t~v~ mstrlbut~on of ~e~ i~o~af - 10.000)
IL~t~ Qf/~Ctt~ Wa~e.~T~;~AVera~e Wa~e
Corm. 350 1004 2241 3963 5766 6934 8321 9074 Dela. 470 1431 2693 4323 5665 6720 7457 7997 8191 D. of C. 535 1618 2774 4350 5322 6307 6907 7519 l~ine 372 1621 2314 4072 5643 6960 8110 8733 ~. 461 1169 2478 4000 5734 7050 7836 8407 Mass. 353 1124 2315 /,099 5772 7294 8175 8848 New '.{amp. 287 687 2023 4463 6/,12 7995 8692 9285 H.J. 302 9].7 2319 4099 62;~-4 7443 8182 8523 N.Y. 398 1119 2380 3991 5691 7021 8016 8592 Pa. 558 1263 2522 4130 561,C 6751 7480 8159 R.I. 376 1074 ~440 4349 5770 7334 8169 8S37 Vt. 189 610 1758 A635 6747 7389 87~7 908~ EAST AVERAGE 388 1136 2360 4206 5870 7142 8009 8588 8976
9548 9666 97~ 9057 95]
8078 8850 94C 9046 9351 95~ ~780 9256 96~ 9261 9460 97~ 9567 9728 9~ 8941 9401 96'~ 9052 9405 96] 8577 8013 935 9256 9550 977 9516 9702 99C
9293 96~
Ill. 4/+1 1240 2549 393~ 5590 68~3 7756 8256 9249 9575 Ind. 371 932 2544 4271 59~$ 7~13 7989 0623 9005 945~ Iowa 325 1199 2335 4152 5604 7047 7693 8351 892~ 9313 Kensas 292 931 2746 ~2~2 5<~55 6C55 7917 8626 8973 9395 Mich. 386 1064 2507 4327 5920 7252 7947 8697 9150 9304 ~nt,. 366 1004 2606 ~300 6064 7332 ~055 8761 92~3 9514 ilss. 302 1751 3455 4137 54"%1 6301 6925 7654 81~7 8569 Mo. 437 13~6 2567 &~)7 5643 7034 7754 8320 C758 9434 Neb. 349 I178 2613 427C 6026 7045 7839 8679 9083 9353 S.D. 248 909 2766 4d~85 5714 7140 $i01 8773 9018 9233 Wisc. ~2~ 1008 2!6~ ~ 59:30 7&Aq ~ ~977 95O6 97&i C~ITRAL AV~/~E 349 1142 2623 4246 5802 7052 7846 8520 9013 9354
96~ 95C 96~ 95~ 95] 96~. 90~ 96~ 955 95]
95~
Ccl~f. 396 992 2084 3915 5723 7313 C487 9134 9544 9751 9~/, Cul:,, 507 1134 2614 4068 5303 6670 7909 8,390 924~ 9409 961 Idaho 452 1095 2270 3999 5638 6638 C142 S698 9079 9343 97~ l~ont. 395 937 2189 4037 5562 6623 7794 8635 9434 9520 96] N. ,,. 485 1375 2696 4034 5226 6475 8223 8874 9184 9543 965 Utah /~3 896 2172 3731 5904 7497 0775 9~04 9595 9759 9:~:] i~.~ii 175 535 1571 30~6 ~ 5627 7291 ~3~$ 8205 9~I0 I~T AVerAGE 411 1002 2228 3833 5530 6692 L~89 0850 9270 9505 967
Ala. 385 1804 2862 4263 5209 $370 7656 7890 3469 8687 92~ Ar~:. 221 1593 339& 4456 5750 6424 7261 777~ 8261 8753 90~ Fla. /+80 1598 2607 &OGO 5511 6657 7252 7903 8507 9002 93~ Ga. 266 1693 2966 4659 5754 6~! 73q6 7~07 8241 8473 9]£ Ky. 562 1421 2580 3946 5364 6716 7438 7~ii 8617 9274 95~ La. 627 1652 2976 39P~2 4998 5q91 6629 7331 8205 9033 93[ N.C. 248 1417 3008 4745 5329 6930 7819 8349 8731 9006 94Z Okla. 278 1044 2920 ~359 5694 7002 7791 8501 9055 9401 95( S.C. 293 1690 2984 4338 5~O5 666~ 7689 8121 $566 8779 92~

~ORKMEN'S COMPENSATION INJURY TABLE 161
EGIIBIT IV (CONT,D)
STt~&'. OF 14AOE D~S_TRIBUTIONS
..Cumulative Di@trlbution of ~;aKe (Tote.l - i0.000)
P~.~io O$ Actual Wage To Ave.ra~e Wa~@
Temp. 288 I~89 290& ~227 5660 657& 731& 79&7 8355 9027 9268 Texas 587 1511 2653 3837 50~0 6379 7468 8522 9173 9&38 9613 Va. 2_~ I%3 2971 ~ 5500 64~9 723B 792~ 8424 S~37 91B6 SOUTH AVERAGE 373 1523 2902 ~25~ 5&79 65~/~ 7361 7990 85~O 8976 9317
OV~qA~ AVF~AGE 377 1226 2562 4~169 56S~ 6S73 7794 8~+3 8913 925& 953@
S~ DOTHED AVERA~ 38e 1201 2512 ~17~ 56~2 6843 7777 @429 8978 9353 9612
STATE ~ :-rlTH. ~2~ATES T DEVlA.T.IQN FR(~! C~ALL AVE~AGE~
Plus
~r~nus
La. Ala. l~8s. N.'C. ~,.H. N.H. ~.H. N°R. NoH. Cal. Wise. (N.H.) (mH.)
Ark. N.H. N.H. T6x. Ea. La. La. La. ~ss. Oa. Ark, (La.)
*Excludes states with less than 1,000 reported cases.

162 WORKMEN'S COMPENSATION INJURY TABLE
E~IBIT V
CU~JIATIVE DISTRIBUTION OF D~LOYEES AND PAYROLL BY SIZE OF ~E~Y WAGE
(1) (2) (3) (~) (5) (6) (7) Ratio Actual Percent Total Employees With ~ges Wage Equal To Or.,Less Than Col. (1) To Av. [~ra~e
Index Of Total Payroll's Earned By S uchEmployees Total Payroll=tO.O@
~zer All .OverAll East Cent. West South Act. Smooth East Cent. West ~ Act~ .~9o !
1 2 0 1 2 5 2 2 7 8 4 6
14 20 9 l& 25 35 21 26 45 51 69 67
40 2.64 2.58 3.36 2.66 2.75 2.89 h5 3.79 &.22 6.88 3.93 4.12 &.31 50 5.71 6.0~ 6,74 6-15 6.09 6.28 55 8.75 8.19 9.55 8J~ 8.65 9.05 60 ii.75 10.97 11.87 l& 73 12.62 12.73 65 16.O1 15.96 15.58 2C,29 17.15 17.16
77 76 98 84 82 127 147 167 l&l 143 219 235 260 249 239 21 388 349 ill 373 377 3~ 557 511 549 742 596 5' 828 826 783 1097 897 8
70 20.57 20.57 18.88 26,43 21.97 22.08 1136 1142 1002 1523 1226 i~ 75 25.72 26.AI 23.18 31.72 27.20 27.49 1513 1571 1307 1911 1608 15 ~ 80 31.59 32.89 28.11 38.58 33.40 33.24 1972 2075 1709 ~:~2 2089 20.' 85 36.62 39.56 3&.82 44.14 39.24 39.01 2360 2623 2228 2902 2562 2% 90 &2.41 &A.&9 39.85 48.83 $4.37 4/~.85 289& 3054 2655 3313 3016 3~ 95 50.09 51.60 &5.80 54.20 50.95 50.66 3600 3708 3199 3807 3621 35
!00 56.31 57.16 52.&4 58.83 56.61 56.45 &206 &246 3833 &255 ~169 &l:
105 61.54 62.70 58.17 63.21 61.76 61.60 4738 4812 &ill &697 &691 46, 110 66.79 67.29 64.23 66.52 66.62 66.35 5298 5302 5047 5047 5186 51 115 71.90 71.75 68.61 70.63 70.89 70.66 5870 5802 5530 5479 568& 5& 120 76.07 75.95 72.03 73.80 74.72 74.&O 6357 6291 5926 5865 6128 6~ I~5 79.19 78.92 75.07 76.47 77.66 77.68 6736 6710 6296 6186 6499 6&~ 130 82.48 82.07 78.21 79.34 80.77 80.52 7142 7052 6692 65~ 6873 6&
135 84.70 84.06 83.01 81.19 83.25 83.16 743& 7316 7300 679& 7198 ~' 140 86.95 86.19 86.&5 83.16 85.58 85.~I 7749 7607 7766 7050 7515 75~ IA5 88.81 87.87 89.21 84.97 87.53 87.35 8009 7846 8089 7361 779& 77' 150 90.07 89.27 91.1A 86.70 89.07 8~.97 819& 8053 8425 7561 8015 8~ 155 91.19 91.03 92.21 88.09 90.43 90,3& 8365 8317 8583 7759 8215 8Z 160 92.62 92.30 93.96 89.59 91.89 91.6A 8588 8520 8850 7990 8443 8~
165 93.66 93.36 95.21 90.85 92.98 92.90 8724 8687 9053 8189 8616 8~ 170 94,17 9&.~l 96.16 92.10 93.97 9&.12 88&0 8861 9205 8397 8780 88.' 175 94.96 95".29 96.53 93.02 94.75 94.94 8976 9013 9270 8550 8913 89 180 95.69 95.88 97.30 93.74 95.&5 95.66 9105 9116 9~03 8675 9035 91. 185 96.68 96.46 97.55 94.67 96.13 96.34 92&9 9220 9~8 8840 9158 9Z 190 97.16 97.17 97.87 95.41 96.78 97.00 9293 935& 9505 8976 925& 931
(8) (9) (1o) (11) (12) (13
10% .07% .12% .25% .01% .i0% .10% 1 15 .2o .20 .50 .16 .23 .25 2 20 .&8 .&6 .67 .30 .~5 .~8 7 25 .88 .79 1.19 .&9 .~O .81 16 30 1.31 1.18 1.67 .91 1.22 1.27 28 35 1.80 1.78 2.16 1.76 l.~& 1.92 b2~

WOEKMEN'S COMPENSATION INJURY TABLE 163
EX}IIDIT V (CQNT'D.)
C~TIVE D!STRIBUTION.O[D~LOYEES AND PAYROLL BY SIZE 0~ WEEKLY WAGE
(~) (2) O) (~) (5) (6) (7) (8) (9) (10) (11) (12). (13) Ratio Actual Percent Total ~ployees With Wages Index Of Total Payrollts Earned By Wage Equal To Or Lest.Than Col. (i) .... Such Em~loy~es Total Payrol!210.O00 To Av, Over All Over All
East Cent. West South Act.. Smooth East Cent, West~outh Act, ~oot~;
195 97,69% 97,70% 98.17% 96,~5% 97,42% 97,55 95&O 9&58 9555 9171 9&16 9&59 200 98,26 97.91 98.&6 96,76 97,77 98,00 9590 9&98 9619 9230 9&68 95&7 205 98,56 98,28 98.77 97.19 98.13 98,32 96h9 9569 9677 9317 9538 9612 210 98,82 98,50 98.87 97,55 99,38 98,60 9706 9616 9698 9388 9590 9670 215 99,0& 98.65 98.98 97.93 98,61 98,83 9751 96~9 9722 9465 9638 9719 220 99,18 98,81 99,21 98,20 98,81 99,03 9782 9681 9776 9524 9681 9762
225 99,30 98,95 99.3& 98,&3 98,97 99,19 9809 971& 9803 9575 9716 9798 230 99,&i 99,11 99,36 98,57 99,08 99,32 983& 97&9 9806 9607 97&2 9827 235 99,51 99,21 99.~8 98~73 99.20 99.~3 9856 9773 9833 96L~I 9769 9853 240 99,58 99,28 99.~9 c.~,98 99,31 99,53 9872 9791 9835 9700 9796 9876 245 99,62 99.37 99,50 c¢°iO 99,39 99,62 9881 9810 9838 9737 981& 9898 250 99.67 99,h3 99,56 .~9,21 99,&6 99.68 9893 9825 9851 9757 9829 9913
255 99,70 99,50 99,57 99,27 99,50 99,73 9902 98&5 9855 9771 98~2 9926 260 99;71 99,57 99,61 99,33 99,55 99,77 9905 9863 9863 9787 9853 9936 265 99-73 99,60 99,65 99~41 99,59 99,81 9910 98~I 9872 9807 986& 99&6 270 99,76 99.65 99.72 99.&& 99,63 99,85 9917 988& 9891 9815 9875 9957 300 I00.00 i00.00 100.(30 I00.00 I00,00 i00.00 i0000 i0000 I0000 i0000 i0000 I0000

164 WORKMEN'S COMPENSATION INJURY TABLE
SHC%FING EFFECT OF :aGE DISTRIBUTION ON LAW ANEND~T FACTORS
(1) (2) (3) (4)
Law Amendment
BASED ON i',65.00 AVERAGE bEEKLy_WAGE
(5)
Old , F rom To l~x.;~. ~t~x.i~, Distr.
60 $25.00 65 $25.0O 1,0oo 60 30.00 65 30.00 1.o16 6O 35.00 65 35.00 1.027 60 4O.00 69 40.00 1.037
60 $25.00 60 030.00 1.16& 60 30.0o 60 35.00 1.116 60 35.00 60 4O.00 l.OGO
65 $25.00 65 $30.00 1.173 65 30.00 65 35.00 1.1"!.9 65 35.OO 65 4O.00 1.o90
60 ~5.oo 65 030.00 1.~2 60 30.00 65 35.00 1.'-~7 60 35.0O 65 40.00 Z.L~O
(6) (7) (~) (9) (1o) Indemnity Amendment Based On
New New Single State Distributi_on Ove rall Dif £. Diff. Distr. State #I (7)-(6) State.~2 (9)z(6)
I. 009 1.013 +.004 1.006 -.003 1.O17 1.021 +.004 1,011 -.006 1.O27 1.O34 +.007 1.O22 -.005 1.040 1.O42 +.002 1.038 -.002
1.161 1.15o -.O11 1.176 +.O15 1.111 1.O99 -.012 1.127 +.016 1.O76 1.O67 -.009 1.077 +.001
1.170 1.159 -.O11 1.182 ÷.OL2 1.122 1.112 -.O10 1.130 +.o16 1.089 1.076 -.O13 1.095 +.001
1.181 1.174 -.007 1.189 +.008 1.1/+2 1.136 -.006 1.151 ~.009 1.119 1.119 -.007 1.119 .(DO

V¢ORKMEN'S COIV[PENSATION INJURY TABLE 165
EXHIBIT. VII
Revised Standard WageDistributi�~
(1) (2) (3) (~) (5) (6) % OfWorkmens Earni~ ~ Or Wages C~rres.
Less Than Upper To (5) Total Ratio Actual Wage % Of Cases Midpoint Limit Col. (I) Wages = 10,00f To Average Wa~9 Actual Smoothed* (1)x(3) = Col. (3) ~Col. (A)
0 - I0 .i08 .I08 .50 .I~ 0 I0.01 - 15 .13 .15 1.87 .25 2 15.01 - 20 .22 .23 &.03 .A~ 6 20.01 - 25 .35 .33 7.42 .ill 13 25.01 - 30 .42 .&6 12.65 1.27 26 30.01 - 35 .62 .65 21.13 1.92 &7 35.01 - &O .91 .97 36.37 2.89 83 &OoOl - A5 1.37 1.42 60°35 A.31 l&4 &5oOl - 50 1.97 1.97 93.58 6.28 237
50.01 - 55 2.56 2.77 i&5.42 9.05 382 55.~i - 60 3.77 3.68 211.60 12.73 593 60.01 - 65 &.73 &.43 276.88 17.16 870 65.01 - 70 &.R2 &.92 332.10 22.08 1201 70.01 - 75 5.23 5.&l 392.22 27.&9 1592 75.01 - 80 6.20 5.75 ~5.63 33.2& 2037 80.01 - 85 5.8& 5.77 ~76.02 39.01 2512 85.01 - 90 5.13 5.8~ 511.00 ~24.85 3022 90.01 - 95 6.5~ 5.81 537.&3 50.66 3559
95.01 - I00 5.66 5.79 56&.52 56.~5 &122
i00.01 - 105 5.15 5~5 527.8~ 61.60 ~6&9 105.01 - ii0 A.66 &.75 510.62 66.35 5159 ii0.01 - 115 A.A7 &.31 ASA.88 70.66 56~2 115.01 - 120 3.83 3.7~ ~39.~5 7~.AO 6081 120~01 - 125 2.9~ 3-2~ ~O1.80 77.6~ 6482 i25.01 - 130 3.11 2.8A 362.10 80.52 68~3 130.01 - 135 2.~3 2.6& 349.80 83.16 7193 ,~..i - 140 2.33 2.25 309.37 85.&I 7501 A~O.OI - I~5 1.95 l, �& 276.&5 87.35 7777
l&5.01 - 150 1.5A 1.62 238.95 88.97 8016 !50.01 - 155 1.36 1.37 208.93 90.3& 8224 155.01 - 160 .66 1.30 20&.75 91.6& 8h29 160.01 - 165 1.89 1.26 20&.75 92.90 8633 165.01 - 170 .99 1.22 20&.35 9&.12 8837 170.01 - 175 .78 .82 l&l.~5 9A.9~ 8978 175.01 - 169 .70 .72 127.80 95.66 9106 180.01 - 185 .68 ,68 12&.lO 96.3& 9229 185.01 - 190 .65 .66 123.75 97.00 9353 190.01 - 195 .6& .55 105.87 97.55 9~59

166 WORKMEN'S COMPENSATION INJURY TABLE
~ , _ o .
R~e_vised s tanda~.d Wa~e Distribution
(z) (2) (3) (~)
Ratio Actual Wage ~ Of Cases N~dpoint _To Average Wa~e Actual ~mogth~d* (l~x(3)
195.01 - 200~ .35~ .~5% 88.88 200.01 - 205 .36 .32 64.80 205.01 - 2i0 .25 .28 58.10 210.01 - 215 .23 .23 &8.87 215.01 - 220 .20 .20 ~3.50 220.01 - 225 .16 .16 35.60 225.01 - 230 .Ii .13 29.5~ 230.01 - 235 .12 .II 2~57 235.01 - 2~0 .Ii .i0 23.75
2&O.Ol - 2~5 .08 .09 21.83 2k5.01 - 250 .07 .06 i&.85 250.01 - 255 .OA .05 12.62 255.01 - 26O .05 .O& ~0.30 260.01 - 265 .Oh .0~ 10.50 265.01- 270 .OA .0~ 10.70 270.01 - 275 .07 .03 8.18
8.~8 280.01 285 285.01 - 290 .06 .02 5.75 290.01 - 295 .06 .02 5.85 295.01 - 300 .06 .02 5.95
(5) (6) % of W o r ~ n s Earnings ~ or Wages Cortes.
Less Than Upper To (5) Total Limit Col. (I) Wages - IO,000
~Col. (3) _ ~Col. (4)
98.003 95&7 98.32 9612 98.60 9670 98.83 9719 99.03 9762 99.19 9798 99.32 9827 99.&3 9853 99.53 9876
99.62 9898 99, 68 9913 99.73 9926 99.77 9936 99.81 99&6 99.85 9957 99.88 9965 99.91 997A 99. %, 9982 99 • 96 9988 99.98 99%
i00.00 i0000
Actu~l percent of cases * Generally smoothed by 3 term moving average
i.e..10+.13+.22-15, .13+.22+.35-.23

% of Workers
7.0
~IBIT VII - A COUNTRYWIDE WAGE DIST~RI~TIOM
Unsmoothed Frequenc~ Distribution
6.5
6.0
5.5
5.0
4o5
&.O :3.5
3°0 i
2.5,
2°0 / 1.51
1°0 I " 5 0 4 0
6o so 90 1Co no no 'i3o ~ o 15o 16b 170 "18o' 190 2oo 2i0 220 2~0 ~o 250-~oLl~-oo ~ Ratio of Actual Wa~e to Average Wa~e -
0
0
~4
c

168 WORKMEN'S COMPENSATION INJURY TABLE
.E~. IBIT. VII - B ~,,,UNTI~CWIDE WAGE DISrRIBUTI~I
O~v. ?t S~oothea Di~b.t.to. - Oo1~s } ,~ 6, E~,., VII
M
E
P
E
10(
9~
9(
8;
8(
7(
6;
6(
5;
5c
35
3o
25
2G
15
1G
5
20 A0 60 80 i00 120 D.,O 160 180 200 220 2~0 260 2@0 300 .-__I~,tiO ,~ Act~LI W~* to Avel'a~e WA~e -- Z

WORKMEN'S COMPENSATION INJURY TABLE 169
EXHIBITVIII
amoothed 6%bmulative Disbribution Of Employees And P~yroll By Size Of Weekly Wa~,e
(1) (2) (3) Ratio Actual Percent Total ~ployee With Wages Wage Equal To Or Less Than Col. (i) To Av. New Old New Wa~e Di~tributioq Distribution Distribution
10% • IO • O2 O 15 .25 .06 2 20 .48 .l& 6 25 .81 .32 13 30 1.27 .65 26 35 1,92 1.24 &7
40 2.89 2.20 83 45 4.31 3.66 I~ 50 6.28 5.75 237 55 9.05 8.56 382 60 12.73 12. l& 593 65 17.16 16. ~ 870
70 22.08 21.52 1201 75 27.49 2v. 13 1592 80 33.24 33.15 2037 85 39, 01 39.39 2512 90 ~.85 &~.68 3022 95 50.66 51.85 3559
i00 56.45 57.76
105 61.60 63.31 &649 110 66.35 68. tO. 5159 115 70.66 73.03 5642" 120 7/+.40 77.15 6081 125 77.68 80.77 6~2 130 80.52 83.91 6843
135 ~3. ~ 6 86.61 7193 ~,o 85. ax 88.91 7501 1~,5 87.35 90.86 7777 150 88.97 92.49 8016 155 90.34 93.85 822~ 160 91.64 94.98 8~9
165 92.90 95.91 8633 170 9&. 12 96.62 8~37 175 9&.9A 97.31 8978 180 95.66 97.82 9106 185 96.3& 98.2& 9229 190 97. O0 98.58 9353
Index Of Total Payroll's Earned by Such Employee@. Total Payroll~lO,O~
01d Distributio~
0 1 2 7
17 37
76
246 &01 616 898
1251 1672 215~ 2684 3250 3%36
~7
5010 5573 6104 65?9 7051 7459
7824 82~6 8~29 8673 g884 9O65
9219 9350 9~60 9552 9630 9694

170
(z) Ratio Actual Wage To Av.
195 200 205 210 215 220
225 230 235 2&O 2&5 250
~55 ~60 265 270 275 ~80 285 290 295 3OO
WORKMEN'S COMPENSATION INJURY TABLE
_EX~TBIT VIII (Co~T'D)
Smoothed Cum,lative Distribut~o, Of Employees , And P~yroll By S~ze Of Weekly !a~e_
(2) (3)
Percent Total Employees With Waces Index Of ?oral Payrol lgs Earned By Equal To Or Less. Than Co!. (!) ~lozees. Total Payroll~lOiOOQ
New Old New Old Distribution Distribution Distribution Distribution
97.55 98.86 9&59 97/*9 98.00 99.03 95;~7 9793 98.32 99.26 9612 9830 98.60 99. &l 9670 9861 98.83 99.53 9719 9888 99.03 99.63 9762 9910
99.19 99 • 71 9793 9928 99.32 99.77 9827 9%2 99. &3 99.82 9853 995& 99.53 99.86 9~76 9963 99.62 99.89 9898 9971 99 • 68 99 • 92 9913 9978
99.73 99 • 9& 9926 9983 99.77 99.96 9936 9988 99.81 99.98 99&6 999& 99.85 i00.O0 9957 IOOOO 99.88 I00.o0 9965 I0000 99.91 iOOo OO 997& 1OO(30 99.9& i00. OO 9982 iOO00 99.96 I00o00 99~8 i0000 99 • 98 i00. O0 999& i0000
I00.00 i00. O0 I000o I0000

WORKMEN'S COMPENSATION INJURY TABLE 171
PART I I I - DETERMINATION OF THE EFFECT ON BENEFIT COSTS RESULTING FROM LEGISLATIVE ENACTMENT OF A HYPOTHETICAL LAW A M E N D M E N T
The purpose of this par t is to present the student with a general example of the manner in which the effects of law amendment on benefit costs are calculated when based on the accident and wage distributions established in Par ts II and III. The following calcula- tions were performed by type of benefit (i.e. Fatal, Permanent Total, Major and Minor Permanent Partial and Temporary Total) in accord- ance with standard procedure as presented to and adopted by The National Association of Insurance Commissioners. Before continuing with explanations of the exhibits, however, it may serve a useful purpose to clarify certain basic notions and to define the technical terminology underlying the computations.
A. Definitions: The effect on benefit costs for a specific type of benefit, resulting from a change in benefit provisions of the Work- men's Compensation Law, may be expressed by the following relation- ships :
Monetary Cost (After Amendment) (1) Effect of A m e n d m e n t ~
Monetary Cost (Before Amendment)
where
(2) Monetary Cost ~ The Cost Expressed in Units of Weeks Wages X The Average Weekly Benefit Payable
which are fur ther defined
(3) Cost in Weeks Wages ~ Accident Frequency X Commuted Benefit Duration
(4) Average Weekly Benefit ~ Average Weekly Wage X % Rate of Compensation X Limit Factor
Thus, the relationship indicated in (1) above is expressed in its simplest elements for the purpose of computation:
Monetary Cost (After Amendment) (5) Effect of Amendment
Monetary Cost (Before Amendment)
Cost In Weeks Wages Average Weekly Benefit A c c . Freq.XCommuted Durat ion×Av. WageX% RateXLimit Factor
Acc. Freq.XCommuted DurationXAv. WageX% RateXLimit Factor
B. Source of Elements': The accident frequencies referred to in the basic formula, above, are taken f rom the accident distributions of the Workmen's Compensation Injury Table. The Benefit Duration, before commutation, is usually specified in the Workmen's Compensa-

172 WORKMEN'S COMPENSATION INJURY TABLE
tion Act. Some Acts do not expressly specify a Benefit Duration but do provide for a maximum amount payable in aggregate. In which instance, the
Amount payable m_ Benefit Duration X Average Weekly Benefit and by simple algebraic transposition, the
Amount Payable Benefit Duration -~
Average Weekly Benefit
The Average Weekly Wage is taken from the National Council's Semi~Annual Call for Wage Data which is based on the latest avail- able compensable injury wage experience. The % Rate of Compensa- tion is also specified in the Act, usually indicating that benefits are payable at ( X ) % of the injured workman's average weekly wage. The Limit Factor involves a separate calculation based on the wage distribution table established in Par t II.
C. The Limit Factor: This factor serves to measure the effect of the minimum and maximum weekly benefit limitations specified in the Workmen's Compensation Act. The Average Weekly Wage to which the calculations are keyed cannot be used for determining the Average Weekly Benefit without adjusting for the effect of weekly compensation limitations. Due to these limits, the effective % rate of compensation may differ from the percentage rate specified by statute. For example, in our hypothetical calculations, the statutory limits imposed by the Act are $5.00 minimum and $25.00 maximum. Since Compensation is payable at the rate of 50% of average weekly wages, an injured employee who earns more than $50.00 ($25 -- .50) per week would receive less than 50% of his wages as benefits and, conversely, an injured employee who earns less than $10.00 ($5 -- .50) per week would receive more than 50% of his wages as benefits. Em- ployees earning between $10.00 and $50.00 weekly would, of course, not be subject to the minimum and maximum limits and, therefore, receive exactly 50% of his wages as benefits.
The following exhibit may serve to illustrate the characteristics and operations involved in a Limit Factor calculation. It wnl be noted, in this illustration, that the Effect of Amendment (1.395) results from the ratio of Average Weekly Benefit of which 33~% (.6667--.50) is due to the change in the % Rate of Compensation and 4.6% ( . 8 8 7 3 - .8481) is due to the change in minimum and maximum weekly benefits, or stated in another way, the ratio of Limit Factors, before and after amendment, will produce the effect of amendment resulting from a change in weekly benefit limits.
Fortunately, it is not necessary to become involved in this rather lengthy calculation in order to determine Limit Factors. In Exhibit VII, we have computed Limit Factors in a less time consuming but equally accurate manner. An explanation of this latter calculation appears in the following "Explanation of Exhibits."

LI~LIT FACTOR CALCULATION AND EFFECT OF LAW ~4E~DMD'T (Based ~'Rav-ised Wage Distribut'i~ "PART l I , EXHIBIT V~Z)
H[potheticalWorkment s Compensation Law_ and Law Amenciment_:
(i) - State Average Weekly Wage (2} -. Rate of Compensation - % of Average Weekly Wage (3) - Minimum ~@ekly Benefit Specified by Act (A) -- Ma~ Weekly Benefit Specified by Act
Before Amendme..~
$9).00
5.00 25.00
After Amendment
~50.00
10.00 ~ .67
(5) (6) (?) (e) (9) (1o) ( ~ ) (12) 0.3) Rati~ Of LAW AI~I~R A~D~NDMENT LAW ~EFO~ AMENDMF~T Effect
Actual Wage Number of Average Weekly Benefits Average Wee Ik!y Benefits LIMIT FACTOR Of Law To Injured ..(i) x (2) x ,Midpoint (5) (i) x (2) x Midpoint (5) After Amend. Before Amend- Amendmant
Average Wa~e Em~loyees Uithout Limits ~;ith Limits Without Limits With Limits "~8)+(7) (10)+(9) (8)+(10)
Under 2 ~ .... rib $ A.A& $i0.00~ S 3.SA $ 5.00* 2.2~2 ~ 2.000
~0 - ~0 79 8.33 zo.m~ 6.25 6.25 1,200 z.ooo 1.600 3o - 4o )62 u . 6 7 ~ . 6 % e.7~ 8.75 1.ooo z.ooo 1.33~
~O- 50 339 15.00 15.(]0 ]]..25 i]..25 1.000 1.000 1.333 ~0 - 60 .6~ 18.33 1~.3~ ~ 13.75 1.000 1,000 1.33~
68 - 70 935 21.66 21.66 16.25 16.25 1.O00 1.000 1.339 ~0 - 80 1116 25.00 2~,0() 18.75 18.7~ 1,000 I..000 1.3~3
~O - 90 1161 28.33 28.33 21.25 21.25 1.000 1.000 1.333 -I00 1160 31.67 31.67 23.75 23.75 I.ooQ i.,~ 1.333
lED -110 990 35.00 35.00 26.25 25.00t 1.(XX) .952& 1.AO0 Over. -Ii~ 3365 ~7.76 36.67t 35.96 2~.OQt .76~6 .67~2 1.@7 Tote& o*" Average IO(X~ $33.~35 $29.59 $25.01 $21.21 .8873 .8481 I. 395
*Minimmn weekly benefit applicable %Ma~ weekly benefit applicable
o
v~
o E
t~
c$

174 WORKMEN~S COMPENSATION INJURY TABLE
D. Explanation of Exhibit I to X EXHIBIT I - - A N A L Y S I S AND COMPARISON
OF BENEFIT PROVISIONS
This exhibit is a summary of the assumed benefit provisions of the Compensation Act before and after amendment and serves to present in abbreviated form those features which are to be valued. In select- ing this hypothetical illustration, an attempt has been made to select an example which will serve to illustrate the standard procedure and, at the same time, to avoid unnecessary complications of a technical nature which are matters of detail rather than of fundamental prin- ciple.
EXHIBITS II, II-A AND I I - B - FATAL CALCULATIONS
Exhibits II-A and II-B involve the determination of benefit costs expressed in Units of Weeks Wages, that is to say, the Monetary Cost at a $1.00 weekly benefit rate. The first four columns constitute the frequency, dependency and age distributions of the Workmen's Com- pensation Injury Table for 1,000 Fatal cases. Since the benefits under the law before and after amendment are payable for limited periods, the arithmetic average age has been used in these calculations instead of the pension age referred to in Par t I.
Column (5) shows the standard annuity symbols for 312 weeks (or 6 years) and for 400 weeks (or 7.692 y e a r s ) b e f o r e and after amendment, respectively.
a'x :'y-] = An annuity payable momently to a widow age (x) for (y) years provided she lives and remains unmarried (') during the allowed benefit period.
x : y / = An annuity payable momently to a single dependent age (x) for (y) years provided the dependent lives during the allowed benefit period.
a ~-] ___ An annuity certain payable at the end Of each week for (y) weeks.
This symbol was employed where the Workmen's Compensation In- jury Table indicated the existence of more than one dependent and assumes that at least one dependent will survive the benefit period to receive compensation benefits.
Column (6) shows the present value of an annuity of 1 per year for the annuity symbol shown in column (5).
Column (7) shows the present value of an annuity of 1 per week for the annuity symbols shown in column (5). For Widow alone cases, the annuity value was computed from Commutation Columns based

WORKMEN'S COMPENSATION INJURY TABLE 175
on U.S. Life Tables (White Females) 1939-41 and American Re- marriage Tables at a 21/~% interest rate. An extract of these particu- lar Commutation Columns are appended as Exhibit X. For other single dependencies, the annuity values were computed from Com- mutation Columns based solely on U. S. Life Tables (Total Popula- tion) 1939-41 at a 21/2% interest rate. An extract of these Commuta- tion Columns are appended as Exhibit IX. Where the Workmen's Compensation Injury Table indicates multiple dependencies the speci- fied duration were discounted merely for interest at 21/2%.
Column (8) shows the Cost In Weeks Wages. Exhibit II shows the development of Total Monetary Cost for Fatal.
This exhibit is self-explanatory.
EXHIBITS III, IlI-A, III-B AND III-C PERMANENT PARTIAL CALCULATIONS
The first four columns of Exhibits III-A, III-B and III-C are taken from the Workmen's Compensation Injury Table. The number and type of injury are shown in column (1) ; the number of cases in column (2) ; the percent loss of use in column (3) ; the average dura- tion of temporary total disability (Healing Period) in column (4). Dismemberment is taken as 100% except for "other" cases where the percentage shown is the percent of Permanent Total disability.
Column (5) shows the benefit durations provided in the schedule of the Compensation Act for each member. The Compensation Law is assumed to provide that dismemberment of an arm below the elbow or leg below the knee is equivalent to the loss of a hand or foot respectively.
Column (6) shows the number of weeks benefit payable as the prod- uct of the schedule duration for 100% loss times the percent loss shown in column (3). Where such product is greater than 52 weeks, the present value of an annuity certain of 1 per week, with payment at the end of the week, has been entered in lieu of the uncommuted duration represented by the product. Because of the extremely slight commutation effect, durations of less than 52 w~eks were not dis- counted for 2V2% interest.
Column (7) shows the cost of Permanent Partial injuries expressed in Units of Weeks Wages and column (8) the cost of the Healing Period similarly expressed.
Exhibit III uses the costs, thus determined, in order to arrive at the Total Monetary Cost for Major and Minor Permanent Partial separately.
EXHIBIT I V - - P E R M A N E N T TOTAL CALCULATION
This exhibit shows the operations involved in determining the Total Monetary Cost. The effect of amendment shown on Line (11) could have been more easily obtained simply by taking a ratio of

176 WORKMEN'S COMPENSATION INJURY TABLE
Average Weekly Benefits, Line (9), since the elements which make up the Cost In Weeks Wages were unchanged by amendment. The determination of Total Cost is computed for the sake of completeness. The number of cases shown on Line (1) were taken from the Work- men's Compensation Injury Table. Line (2) shows the standard annuity symbol for the 520 week, uncommuted, benefit duration speci- fied in the Compensation Act before and after amendment. Line (3) shows the present value of the annuity of 1 per year for the annuity symbol shown on Line (2) and the annuity value of 1 per week on Line (4). The present value of this annuity was determined from Commutation Columns based on U.S. Life Tables 1939-41 (Total Population) at 21/2% interest rate (See Exhibit IX).
EXHIBIT V - - TEMPORARY TOTAL CALCULATION
The Cost expressed in Units of Weeks Wages for this particular calculation is based on the Temporary Total Distributions of the Workmen's Compensation Injury Table (See Exhibit F-V, Par t I) . We first enter Exhibit F-V at the eighth day of disability since bene- fits do not become payable until the eighth day because of the seven day waiting period specified by statute. It is found from column (4) Exhibit F-V, that for cases lasting eight days or more we can expect 1,201,902 total days of disability. As compensation payments become retroactive to the date of injury af ter 28 days, before amendment, it is necessary to determine the additional days' disability resulting from the "retroactive" feature of the Compensation Law. It is found from column (3), Exhibit F-V, that there are 14,688 cases where Temporary Total disability exceeds 28 days. As the initial waiting period is seven days, these additional cases involve 102,816 days (14,688 X 7). The Total Number of Days' Disability, therefore, is 1,201,902 plus 102,816. The division of the total by 7 days produces the cost expressed in Units of Weeks Wages or 186,388. The applica- tion of the Average Weekly Benefit to this figure results in the Total Monetary Cost.
EXHIBIT V I - - M E D I C A L CALCULATION
In our hypothetical example, we have assumed that prior to amend- ment, the Compensation Act provided for a maximum medical of $500 with no monetary maximum subsequent to amendment. Exhibit F-VI, Par t I, shows that if medical losses were unlimited, 20.1% of the total medical losses would result from medical losses in excess of $500 per claim. The other 79.9% of total medical losses represent medical losses with a $500 per claim limit. In other words, if the monetary limit on medical losses were to be removed, the amount of medical losses incurred would increase by the ratio of 100% to 79.9% or 25.2% (100.0 -- 79.9 ~--- 1.252).
It is known that insurance carriers sometimes pay medical losses

WORKMENTS COMPENSATION INJURY TABLE 177
in excess of the statutory limit when the payment of such medical will speed recovery or reduce the amount of terminal disability. In calculating the effect of medical amendments, the amount paid in excess of the statutory amount is taken into consideration. For this example, it is assumed that of the total medical paid on the basis of the law prior to amendment, 7.5% of the total medical represents medical in excess of $500 per claim. The medical amendment under this condition would, therefore, be equal to (1.000- .075)X 1.252 ~- 1.158 or an increase of 15.8% in the medical already paid.
EXHIBIT VII EXPLANATION OF LIMIT FACTOR CALCULATION
This exhibit shows the calculations to recognize the fact that, due to the minimum and maximum limits to weekly compensation speci- fied in most Acts, the actual effective rate of compensation may be different from the percentage rate specified by the statute.
The unnumbered column at the extreme left of Exhibit VII is merely an identification column. The figures in this column indicate 10% of the average weekly wage, 20% of such average, 30%, and so on.
Column (A) is based on the standard wage distribution and shows the percentage of workers receiving the percentage, or less, of the average wage indicated in the preceding column. Thus, 6.28% of the workers receive a wage equal to, or less than, 50% of the average wage; 56.45% of the workers receive a wage equal to, or less than, 100% of the average wage, etc.
Column (B) shows, as index numbers, the summation of wages received by the percentage of workers shown in Column A. Thus, 237 is the index number representing the wages received by the 6.28% of employees who receive a wage equal to, or less than, 50% of the average wage.
Lines (1) and (2) are merely identifying items. Line (3) shows the nominal percentage of weekly wages payable
as compensation. Lines (4) and (5) show the minimum and maximum weekly limits
to compensation, as specified by the Act. Lines (6) and (7) show the weekly wage required to produce the
minimum and maximum weekly compensation shown on Lines (4) and (5) respectively, at the statutory percentage rate shown on Line (3).
Line (9) is the average weekly wage based on injury cases occur- ring in the State.
Lines (10), (11), (12) and (13) express the minimum and maxi- mum effective weekly wage [Lines (6) and (7)] as percentages of the state average weekly wage shown on Line (9).
Line (14) is an index number representing the total wages re- ceived by all employees receiving a weekly wage equal to, or less than, the effective minimum weekly wage shown on Line (6). The

178 WORKMEN'S COMPENSATION INJURY TABLE
figure shown on Line (14) is the figure of Column B corresponding to the ratio shown on Line (12).
Line (15), similarly, represents the total wages received by all em- ployees receiving a weekly wage equal to, or less than, the maximum effective weekly wage shown on Line (7). The figure shown on Line (15) is the figure of Column B corresponding to the ratio shown on Line ( 1 3 ) .
Line (16), therefore, which is the difference between Lines (15) and (14), represents the total wages received by all employees receiv- ing wages between the minimum and maximum.
Line (17) represents the percentage of employees receiving a wage equal to or less than the minimum and is the figure of Column A corresponding to the ratio shown on Line (12).
Line (18) represents the percentage of employees receiving wages equal to or less than the maximum and is the figure of Column A corresponding to the ratio shown on Line (13).
Line (19), which is the difference between 100% and Line (18) represents the percentage of employees receiving wages equal to or greater than the maximum.
Line (20) represents the effective wage income of employees re- ceiving the min imum weekly compensation.
Line (21) represents the effective income of employees receiving the maximum weekly compensation. The sum of Lines (16), (20) and (21) represents the effective wage of all employees related to the index 10,000 as representing total actual wages.
Line (22) is the "Limit Factor" representing the average effect of the min imum and maximum limits. In other words the limit factor represents the reduction in this example, due to the limits, from those compensation benefits which would be applicable in the absence of limits.
EXHIBIT V I I I - - P U R E PREMIUM MULTIPLIER AND OVERALL E F F E C T
This exhibit uses the State actual loss experience for the two latest available policy periods for the purpose of determining the Serious and Non-Serious Pure Premium Multipliers and Overall Effect of Law Amendment. The Serious Pure Premium Multiplier of 1.587, involving Fatal, Permanent Total and Major Permanent Part ial benefits, is determined by taking the sum of column (4) for the same injuries and dividing by the sum of column (2), (11,209,887 + 7,063,970). The Non-Serious Pure Premium Multiplier is deter- mined by taking the sum of column (4) for Minor Permanent Part ial and Temporary Total benefits and dividing by the sum of column (2) for the same benefits, (5,213,511 + 3,647,580). The Overall Effect of Amendment is determined by taking the sum of column (4) for all injuries and dividing by the sum of column (2), (22 ,625,374- 16,067,324).

WORKMEN'S COMPENSATION INJURY TABLE lq9
E~{IBIT ; T ANA~m A~ ~p~R~S~! OF ~-FI.~.,~RQVISIONS
la~_~ective Be~9~e Amendment Law Effective A~%er Amendm~n~
~ATAL
Rate of Cc~ensation: 50% of average Rate of Cce~ensation: 66 2/3% of average weekly wages weekly wages
Maximum weekly: $25.00 ~hxim~ weekly: $36.67 l[Inimum weekly: $ 5.00 l~Inim~m weeF~ly: $i0.00 Maximum duration: 312 weeks }~dmum duration: ~00 weeks Burial: ~200. OO " Burial: $250.00 Upon death of widow or widower, compensa- Upon death of widow or widower, compensa-
tion shall be paid to other dependents, tion shall be paid to other dependents.
"P~,.~,~ TOTAL
Rate of Ccmpeneation: 50% of average weekly wagee
Naximum weekly: $25.00 Minimum weekly: $ 5.00 Maxim~a durat ion: 520 weeks
Rate of Compensation, 66 2/3% of average weekly wagee
~xim~a weekly: $36.67 Minimum weekly= $10.00 ~&~cimum duration: ~20 weeks
PEP~NAN~ ~ PARTIAL
Rate of Ccmpensation: 50% of average weekly wages
~Mximum weekly~ $~5.00 Minimum wee]dy: $ 5.00 Specific schedule: 13 - 225 weeks Temporary Total payable during healing period
Rate of Co~eneation: 66 2/3% of average weel~ly wages
}~udmum weekly: $36.67 Minimum weekly: $i0.00 Specific schedule: 13 - 2~0 weeks Temporary Total payable during heal ing period
T~PORARY ~TAL
Rate of Campensation: ~ of average Rate of Compensation: 66 2/3% of average weeldy wages weekly wages
Ms.~,m~ weekly: $2~.00 Maximum weekly: $36.67 t~inim~ weekly- $ 5.00 ~ weekly: $I0.00 ~dmum duration: 520 weeks Maxim~ duration: ~20 weeks Waithlg period 7 days, retroactive after Waiting period 7 days, retroactive after 28 ds~ 21 ds~
~CA~
No l i m i t on dura t ion. Monetary l i m i t No l i m i t with respect to e i t h e r durat ion of $500. or monetary amount

180 WORKMEN'S COMPENSATION INJURY TABLE
EZ[{IBIT II
FATAL - CALCULATION OF iONETARY COSTS fCTD F2FECT OF ~rDtD~NT
(a) (b) l~r~nenVs Cc~pensatiopLaw
Before Amendment After Amendme~t
I. Cost Expressed in Units of WeePs l;ages - (See Totals Exhibit IIA and liB) 2M+,&O&
2. Average Weekly Wage $50.00 3. Rats of Compensation .50 &. Limit Factor (See Exhibit VII) .8491 5. Average Weekly Benefit (2)x(3)~) $2-1.20 6. Cost of Dependency (1)x(5) $5,181~365 7. Funeral Costs, per case 9200 8. Cost of 1,000 Funerals $200;000 9. Total Monetary Cost (6)+(8) $5,381,365 lO. Effect of Amendment on Fatal Benefit
Cost (gb)+(9a)
304,O39 $50.oo .66-2/3 .8273
$29.57 $8,990,~33
$250 $250,000
~,2.4.0,433
1.717

WORKMEN'S COMPENSATION INJURY TABLE 181
EXHI~I~ IIA
VAtUATION OF FATAL BE~IT PROVISIONS
C~) (2) C3) (~) Person No.Of Aver.
No.Of Receiving Depen- Age C~?ses Compe~s~+,ion dents (Arith.) ~,000
139 None None XXX _X~ 3~2Widowalone i 50 a'50:6~ 5.3359
155 Widow with i 35 a3~ child i 8
117 Widow with I 35 " children 2
64Widowwith i 35 o children 3 8
32 %~dow with i 35 :' children ~
13Wido1~with i 35 :' children 5 3
15 Widow with I 35 " (:,;ore)
7" i~ o~ d~nCth~5) i n ~:P 5.~59~
10 Orphans 2 ll ~312/ 4 Orphans 3 !I u 2 Orphans & ii :'
(More ) 20rphans(tha~&) 5~ ii " 4 %adow and I 39 :'
parent 1 61 1 11idow and 1 50 :~
Other dependent i* &3 ~0 Parent 1 61 ~61:6-~ 5.1533
27 Parents 2 56 a312/
h Brother or Sister i 43 ~3:6-~ 5.~607 1 Brothers or Sisters2 ~3 a3~--~7 i Brothers or SistersA* h3 O
2 Parent i 51 " Brother or Sister i 13
i Parent I 51 ~' Brothers or Sisters2 13
2 Parent l 51 " Brothersor SiBters 4" 13
3Parents 2 51 :' Brothers or Sisters2* 13
I Other Dependents i* 61 ~61:6-7 5.1533 *Average
(5) (6) (7) (s) Cost in
A~muity Annuity Valus Weeks ~ges STnnbol 1 Per Yr. i Per ~. (1)x(~)
X~ D ~ 277.~7 9~,$95
239.:7 ~4,930
" 33,915
" 9,276
" 3,768
239.11 5,20~
2~9.~7 2,899 " 1,159 " 580
" 580 ': 1,159
;' 290
267.97 10,719
289.37 7,~26
2~3.96 1,136 2S9. S? 29O " 290 " 530
" 290
" 580
~t 870
267.97 268 Total 2t~,~04

18~ WORKMEN'S COMPENSATION INJURY TABLE
(1) (2) Person
No.Of Receiving Ca~es ComDens~.tion 1,000
139 None 3A2 ~idow alone 155 '.;idow with
child 117 1';idow with
children 6~ Widow with
cldldren 32 Widow with
children 13 Widow with
chi ldren 15 Widow with
~.n 5) I# Orphan
i0 Orphans Orphans
2 Orphans ~ , (~re)
2 urp,'~ns(than' 4) & Widow and
parent i Widow and
Other dependent
40 Parent 27 Parents
4 Brother or Sister
I Brothers or Sisters 1 Brothers or Sisters 2 Parent
o~rother or Sister 1 Parent
~ r o ~ e r s o r S i s t e r s 2 Parent
Brothers or Sisters 3 Parents
Brothers or Sisters 1 Other Dependents
• -Avere~e
~KHIBIT I I B
V~UAT~0~[ 0~ FATAL B~n P~0WS~0~S
(3) (4) (5) (6) (7) (8) No.Of Aver. Cost in Depen- Age . Annuity AI1nu~y I Valu.e Weeks Wages d~nts (Arith,~ S~m~ol ~ Per Yr, I Pe~ W~, (~)x(7)
None XIX - IX XX XX XZ i 50 a'50;~ 6.6163 3~.07 117,672 i 35 a~-~ 364.15 56 ,~3 i 3 1 35 " :' 42,606 2 3 1 35 " " 23 306 3 8 1 35 " " 11,653 4 S 1 35 n " 4,734 5 3 1 35 "~ " 5,462
1 II ~ii : 7-~ t 6.~04~ 333.05 5,995
2 iI a36--~ 33~.IA 3,3~i 3 Ii " :' 1,337 4 11 :, :' 669
5* I! :' :' 669
1 39 : ' " i,~57 1 61 i 50 " " 3~ i* 43
1 61 a61: ~9---~ 6.3059 327.91 13,116
2 56 a~o0/ 364.15 9,C32
1 43 a43: 7.69-692---~ 6.5101 354.13 1,417
2 43 a~- '~ 364.15 364 4* 43 " : ' 364 i 51 :' ;' 72~ 1 13 1 51 " :' 364 2 13 1 51 :' " 729 4* 13 2 51 " " 1,092 2* 13 I* 61 ~61:~ 6.3059 327.91 329
Total 30&,039
fCc~ensation to ceaee at age 13.

WORKMEN'S COMPENSATION INJURY TABLE 183
,~.B~c...Ii, z
Permane~. ~ .Pe~.lal- .Galcuhtic~l. o~ Mone%ar~" Cost and Effect of ~nendmen%
A. ,m~OR P'm~mNENT PA~..~L
(~) (b) Workmenfs C~npepqatio~ A~
Before Amend. ~er Amend.
I. Cost Expressed in Units of Weeks Wages (See Totals Exhibits III-A) 195,283
2. Average Weekly Wage $50.00 3. Rate of Compensation .50 4. Limit Factor (See Exhibit VII .8481 5. Average Weekly Benefit (2)x(3)x(4) $21.20 6, Total Monetary Cost (1)x(5) SA,I~O,O00 7. Effect of Amendment on Major Perm. Part,,
Benefit Cost (6b)+(6a)
20~,IIO $50.00
.8873 $29.5?
$6,035,533
LA~
8, Cost Expressed Units of Weeks Wages (See Totals Exhibit III-B and III-CJ 63,58~
9. Average Weekly Benefit (Same as Major) ~_1.20 I0, Total Monetary Cost (8~(9) $1,3~7,981 11. Effect of Am~dmont on Minor Penn,,
Part,. Bene..eit Cost (1ObH(io~)
65,602 $~.57
~,939,851
~.AS9

184
(1)
r~e IqJur~
Arm: Dism. a~ or above ~ibow 33 Dism. below elbow 16 Loss of use 7~
Hand: Dismembermen% 6~ i00 Loss of Use Ii~ 68
Leg: Dis~. at or above knee 32 i00 Dism. below knee 13 i00 Loss of Use 73 62
Foot: Dismemberment iA i00 Loss of use &8 60
Eye: Enuclea~ion 50 i00 Loss of use 127 97
Hearing: Both ears
Other MaJ.(Relat.to P,T.)
T~AL MAJOR PEPS.
WORKMEN'S COMPENSATION INJURY TABLE
~(A~A~O~ OF ~ 0 ~ ~ r ~A~A~
~ver, ~eckis Duration _ ~ost I~ Wks. Heal, Benefit Weeks Schedule Healir~
No.Of % Period Sched. Payable~ Injuries Period Cases Loss (Wk~.) At ~ (3)x(S) (2)x(6)... (2)x~.~)
100% 29 225 213.32 7,0~0 957 i00 20 175 167.8~ 2,686 320 62 37 225 1SA.% 9,986 2,738
21 175 167.87 I0,74A 1,3A~ 26 175 115.67 13 ,186 2,964
~9 208 19%99 6,3~6 1,568 49 156 150.31 1,954 637 51 208 125.05 9,129 3,723
36 156 15o.31 2,'~,~ 50~ 39 156 91,52 4,393 1,872
16 156 150.31 ?,516 700 16 156 1A5.96 18 ,537 2,032
1 ?0 28 156 106:39 107 28
3~ hO(P,T.)43 520 197 .99 67,515 IA,663
1000 XX XX XX XX 161,233 3A,050
LAW AFT~ A~D~T
D.~., at or above elbow 33 I0~ 29 Di~ below elbow 16 i00 20 ~s of use 7~ 62 37
H~nd: Di~embement 6~ i00 21 Loss of use 116 68
Leg: Dism. a t or above knee 32- I00 49 Dis.,. below knee 23 100 ~.9 Loss of use ?3 62 51
Foot: Die~e~erment 16 3.00 ~ s s of use ~8 60 39 ~ye.. Enuclea'~:~ 50 100 Loss of use 127 97 16 Hearing: Bo~h ears 1 70 28 Other MaJ.(relat.to ~,T.) 3AI 40(P.T.)43 T~AL MAJOR PE~I. PART, IOCO ;~ XX '~se oc~u ted durat ion i f over 52 weeks
250 235.66 7,776 95? 208 197.99 3,168 3~.0 250 169 .39 11 ,055 2,?:38
208 19%99 12,671 1,3~ "20e 2S6.75 15 ,590 2,964
225 213.32 6,826 1,568 175 167.87 2,182 637 225 134.% 9,851 3,723
175 167.87 2,350 5o4 I75 I02~O 6,916 I,~72
156 150.31 %516 ?0o 156 145 .96 18,5.t7 2,o~
106.39 10? 28 520 197.99 6%515 16,663 XX XX I70,060 ~,C50

WORKMEN'S COMPENSATION INJURY TABLE 185
(l) (2)
No.Of T~oe In.lur~ Cases LOss., ~(Wks. i
Thumb: Dism. i phalange 18 100% 9 Dism. 2 or more phalange 9 i00 ii Loss of use 112 26 7
Index Finger: Dism. i phalange ~7 I00 7 Dism. 2 or more phalange 37 I00 12 Loss of use 170 3~ 6
Middle Finger: Dism. i phalange ~3 iO0 6 Diam, 2 or more phalange 31 i00 14 Loss of use 139 31 6
Ring Finge~: Diam. i phalange 26 i00 5 Diam. 2 or more phalange 21 i00 iO Loss of use i01 32 5
Little ¥inger- Diam. i ph-1~nge 17 I00 5 Diam. 2 or more phalange 19 I00 8 ~oss of use 84 37 6
Great Toe: ~ism. I phalange 2 100 9 Dism, 2 phalange 2 i00 16 X~ss of use 69 26 6
Other Toes= Di~amberment I0 I00 8 Loss of use 38 32 ?
Hearing! One Ear 5 47 21
Less of use ors Arm 116 ].5 16 Hand 171 16 12
oot 129 15 ]-5 Eye 33 19 lO Hearing(2 ears) ~ 22 22
Other (Related to P,T.) 313 8(P.T.) 15 TOTAL MINOR PEPS. PART.IS88 XX XX *Use commuted duration if ever 52 w~eks
~AmATZON o~oR PE~r~'r, ?~aTnL LAW BEFORE ~%~D~.~T (3) (4) (5) (6) (7) (8)
Aver, Weeks Duratio~ Cost In W k ~ Heal. Benefit Weeks Schedule Healing
% Period Schod, Payable* Injuries Period ms.) At 106 (3)x(5) (2)x(6) (2)x(,)
30 30 540 162 60 59.14 532 99 60 15.60 1,747 784
12 2/3 12.67 595 329 38 38 l,&O6 A4A 38 12.92 2,196 ,1,020
iO 10 ~30 258 30 30 930 434 30 9.30 1,293 834
8 1/3 8e33 217 130 25 25 525 210 25 8 808 505
6 2/3 6.67 113 85 20 20 380 152 20 7.40 622 50~
19 19 38 18 38 38 76 32 38 9.88 682
13 13 130 80 13 ~.16 158 266
52 ~.~ 122 105
225 33.75 3,915 1,856 175 28.00 ~,788 2,052 208 31.20 3,838 2,583 156 23.40 3,019 1,935 156 29.64 978 330 156 3~.3g 103 66 520 ~1.60 13,O21 &,695 XX XX &3,202 20,382

186
(1)
WORKMEN'S COMPENSATION INJURY TABLE
~X~I~IT IIIC
~VA~UATION. OF. ~NOR P .~. ]~T PARTIAL
~e In i~Lrv
Thumb:Dism. i phalange Diem. 2 or more phalange Loss of use
Index Finger :Disn~l phalange
Dism.2 or more phalange Loss of use
Middle Finger:Dism. 1 phalange
Diem. 2 or more ph~lange Loss of use
~ng Finger:Dism. 1 phalange
Diem. 2 or more phalange Loss of use
Little Finger:Dism. 1 phalanEe
Dism. 2 or more phalange Loss of use
Great Toe:Diem. i phalange
Dism. 2 ph~lange Loss of use
Other Toes :Dismemberment
Loss of uso
Hearing: One Ear
Loss of use o~:
Arm Hand Leg Foot Eye Hearing(2 ears)
Other(Related to P.T.)
TOTAL Mr~OR PERM.
LAW AFTER A/~DI~T
(2) (3) (4) Aver= Heal.
No.Of ,o~ Period Cases Loss ( ~ s . )
Z~ lo0% 9 9 IO0 ii
112 26 7
(5) (6) C7) (~) Weeks Dur~t~ow Cost in W~.~ges Benefit l,reeks Schedule Healing Sched. Payable* Injuries Period At..lO0% (3)x(~) (2)x(6) (2)x(&)
30 30 5~0 162 60 59.1~ 532 99 60 15.60 i,%7 7~
47 i00 7 12-2/3 12.67 595 329 37 IO0 12 39 38 1,406 444 170 34 6 33 12.92 2,196 1,020
43 IO0 6 iO iO ~30 258 31 i00 I~ 30 30 930 431~
139 31 6 30 9.30 1,293 334
26 i00 5 8-1/3 8.33 217 130 21 IOO 10 25 25 525 210
i01 32 5 25 8 80S 505
17 100 5 6-2/3 6.67 113 35 19 i00 8 20 20 330 152 8/, 37 6 20 7.40 622 504
2 IOO 9 19 19 38 18 2 100 16 38 38 76 32 69 26 6 38 9.88 682 41~
iO100 8 13 13 130 30 38 32 7 13 4.16 153 266
5 &7 21 52 ~.~4 122 105
116 15 16 250 37.50 ~,350 1,856 171 16 12 208 33.~8 5,691 2,052 123 15 21 225 33.75 4,151 2,5C3 129 15 15 175 26.25 3,386 1,935 33 19 I0 156 29.64 978 330 3 22 22 156 34.32 103 66
313 8(P.~15 520 4i.60 13,0~i 4,695
1888 XX XX XX XX 45,220 20,382 *Use commuted duration if over 52 weeks

WORKMEN'S COMPENSATION INJURY TABLE 187
P F~2~NT TOT;,L - C.'IC I.\TION OF HO~IET.ARY COST &!D EFFECT OF AM~DKENT
i. Number of Perm~lent Total Cases 2. Annuity Symbol, years 3. Anmdty Value, i per yea~ ~. Anm'ity VaL~e, I per week 5. Cost in Units of ~{eeks Wages (1)x(4) 6. Average Wee~<ly Uage 7. Pate of Co~nensation 8. linit Factor 9. Average Uee~ly Benefit (6)x(7)x(~)
10. Total Nonetary Cost (5)x(9) ll. Effect of Amendment on
Ferm. Total Deneflt Cost (llb)+(lla)
(~) (b) Wcr_]o~e,~nsetion 1,~w
De,ore ~nendment After Amendme it
- I00 i00 a5o: lo-7 750: 8.3132 ~. B132 432.29 /~37.29 &3P~9 &32~.9 $50.00 $50.00
• 50 66 2/3 • 84=i .~73
,~21.20 ~9.57 $916,~55 $1,27~,292
1.395
EXHIBIT V "
~E}~ORARy TOTAL - CALCL~ATIC~ OF ~O;,~_TARY COST AND EFFECT OF A~DMENT
(a) (b) Wor~engs Compensation L%w
Belgie AmeDdment After Amendment
I. Waiting Period 7 Days 2. Retroactive Feature Applicable After: 28 Days 3. Total Days Disability Based On (1) 1,201,902(a)
(14,683x7 Days) &. Additional Days Disability Based On (2) i02,816(b)
5. Cost in Units of Weeks Wages (3)+(&) 186,3G$ 7 Days
6. Average Weekly Wage $50.00 7. Rate of Compensation .50 9. Limit Factor .8~81 9. Average Weekly Benefit (6)x(7)x(8) $2.1.20
I0. Total Monetary Cost (5)x(9) $3,991,&26 ]I. Effect of Amendment on Temporzry
Total Benefit Cost (lOb)+(iOa) - I.&26
• 7Days 21 Days
1,201,902(a) (18,935x7 Days 131,8~(C)
190,535
$50.0o .66-2/3 .~73 $29.57
$5,634,12o
(a) See line S, col~mn ~, EyJ~ibit F-V, Part I, Workman'e Compensation Injury Table.
(b) See llne 9, coltmm 3, Same Exhibit as note (a), above.
(e) See llne 22, coltmm 3, Same Exhibit as note (a), above.

188 WORKMEN'S COMPENSATION INJURY TABLE
F~G~IB!T VI
Medical=DeterminationoftheEffect of Amen__~entonMedical Cos~
i. Increase %, Unlimited Fr~ $500 20.1% (a)
2. Increase Factor, 100% +,L[O0% - 20.~ 1.252
3. % of Hypothetical State Paid Medical Losses in Excess of $500 7.5% (b)
&. Discount Factor (i.0OO - .075) .925
5. Effect of Amendment on Medical Benefit Cost (2) x (&) I~I~8 |
(~) See Exhibit F-VI, Part I
(b) Assumed % of medical losses p~Idby the carriers in excess of the statutory amount specified in the Compensation Act of our hypothetical state

WORKMEN'S COMPENSATION INJURY TABLE 189
(2
(7
(1o
(12 (13
(161 (17)
(21) {22)
EXHIBIT vii
!n~FAqTO~ CALCULAT~01~
Olaes ~fXnJm'y Effective Date of Comp.Law Nomlnal% of Compensation ~nimumWeekly Compensation ~,L~xlmumWeekly Compensation Eff.WeeklyWage for }itn.Benefits (~)+(3) Eff.Wee;~lyWage for Max.Benefits (5)+(3) Policy Year Av~rageWeeklyWage ~tlo to Aver.(~animum) % (6)+(9) I~tio to Aver.(l~xlmum) % (7)+(9) Line (iO) adjusted to nearest % Line (ll) adjusted to nearest 5% (B) for (12) From Table Below (B) for (13) From Table Below Difference (15)-(i~) (A) for (12) From Table Below (A) for (13) From Table Below Difference I00.00 - (I$) Product (lO)x(lT) Pre~uct (n~xlZg) . . Limit Factorl(16)÷(20)+(21//+ I0,000
Fatal and Disability Before Amendment After Amendment
• 5O .6667 $5.00 io.oo $25.00 36.67 $lo.oo 15.oo $50.00 55.00
OTot Used) ~50.00 $50.00
2O 3O i00 110 20 30
i00 IiO 6 26
/~122 5%59 ~116 5133 .~8 1.27
56.~5 66.35 &3.55 33.65
iO 35 ~355 3702 .~i .8~73
Column (A) - Percentage of workers receiving not more than the average wage percen- tage indicated in preceding col~.
Col~m (B) - 8~mmatlon of Wages, as index numbers with I0,000 as the radix, received by the 9ereen%aF, e of works shown in Column (A).
~DP~S CO~$ATI~N WAGE DIS TRIBUTI0}~ TABLE
Ratio To Ratio To Ratio To Average Average Average
lO .IO 0 lie 66.35 5159 210 98.60 9670 15 .25 2 115 70.66 561,2 215 98.03 9719 20 .~8 6 120 7&.&O 6001 220 99.03 9762 25 .Sl 13 125 77.68 6~82 225 99.19 9793 30 1,27 26 130 80.52 6~3 230 99.32 9~27 35 1.92 /+7 135 83.16 7193 235 99.43 9053 ~0 2.89 83 lhO 85.41 7501 2&O 99.53 9376 ~5 &.31 I~ 145 87.35 7777 2A5 99.62 909~ 50 6,28 237 150 88.97 8016 250 99.60 9913 55 9.05 30~ 155 90.34 822~ 255 99.73 9926 60 12.73 593 160 91.64 8429 260 99.77 9936 65 17.16 870 165 92,90 8633 265 99.81 9946 70 2~T. O~ 1201 170 94.12 8837 270 99.35 9957 75 27.49 1592 175 94.9~ 8978 275 99.02 9965 80 33.2~ 2037 180 95.66 9106 280 99.91 9974 85 39.O1 2512 185 96.34 9229 285 99.9~ 9902 90 ~.05 3022 190 97.00 9353 290 99.96 9985 95 50.66 3559 195 97.55 9459 295 99.9,8 999~
I00 9645 ~122 200 98.00 9~7 300 I00.00 i0000 105 61.60 ~ 9 205 9~.32 9612

190 WORKMEN'S COMPENSATION INJURY TABLE
DETERMINATION OFPURE P~=~I,,ON..],~,X~LTIPLIE2S AND OV~LLEF~CT OFAMENDMEN~
(1) (2) (3) (~) Actual Losses Adjusted To
Ass1~ed Amended State Actual Effect Of Benefit Laves
T~pe of ~enefit Loss F~ er~enee* Amen______~ent m 2~x~_~
Fahal ~3,659,930 1.717 $6,28&,!OO Fer~mnent Total 592,~90 1.395 826,2&5 Kajor Perm. Partial 2,811,750 1.458 &,099,532
Serious 7,063,970 l__~. 587) iI ~20~.~877
F~nor Perm. Partial 927,%10 ~,~39 1,335,119 Temporary Total 2,719,770 1.426 3,878,392
Non-Serious ~ ._~I~I~29) ~,21.~3~_~L_
Medical .5.~1%.77& I_~8__. f
Total & Average ~]6,067,32~ (l.&08~ ,
*Latest 2 policy periods of actual loss experience developed in our hypothetical state, adjusted, if neeessa~,, to reflect the benefit provisions of Lhe Compensation Act before Amendment and converted to an ultimate Unit Statistical Plan reporting basis.
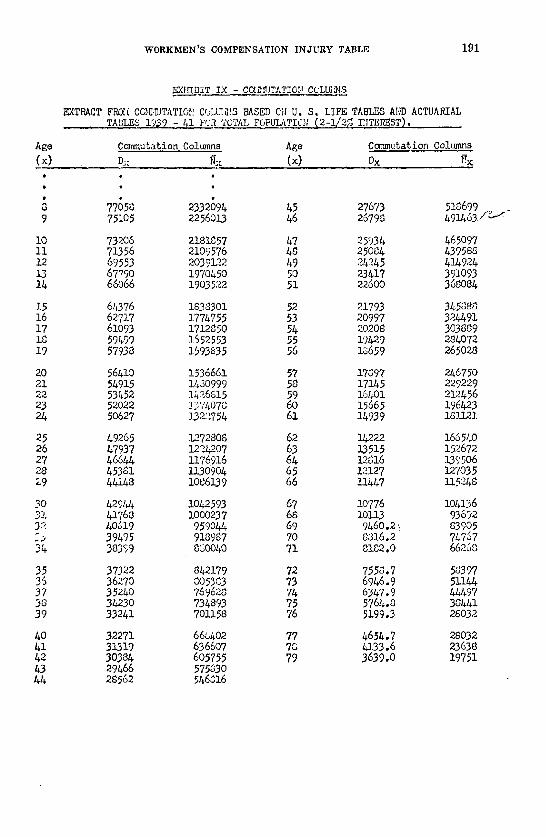
WORKMEN'S COMPENSATION INJURY TABLE 191
Age
EX}[IBIT IX - CC[~ITATI0~! Ct'LU;~S
~XTRACT FPo0H CO~UJTATIO~! CCL~,~S BASED Ci.! U. S, LIFE TABLES AND ACTUAPJAL TABLES 1959 -41 FCR TOTAL POP ULITIQ:< (2-i/2 Z INTEREST).
Commubation Columns Age Commutation Columns
O~ ~ (x) Dx r~x
• • •
7765~ 233~6% 45 27673 518699 _ _ 9 75105 22560].3 46 26798 49]463/d~
10 73206 2181857 47 25934 465097 Ii 71356 2109576 48 25084 439588 12 69553 20393-°.2 49 24245 41~924 13 67790 1970450 50 23417 391093 14 66066 1903522 51 22600 368084
15 64376 1838301 52 21793 345888 16 627].7 ].774755 53 20997 324491 17 61093 1712850 54 20208 303889 10 59499 ~552553 55 19429 284072 19 57938 1593835 56 iS659 265028
20 56410 1536661 57 17097 246750 21 54915 14~o999 58 17145 229229 22 53452 1426615 59 16401 212456 23 52022 ~5',"4078 60 15665 196423 24 50627 1322754 61 14939 18112].
25 49265 1272808 62 15222 166540 26 47937 1224207 63 13515 152672 27 4664& 1176.916 6~ 12~16 139506 28 45381 1130904 65 12127 127035 29 44148 1086139 66 11447 115258
30 4291J+ 1042593 67 10776 104136 3! $1768 1000237 68 10113 93692 32 40619 95904/+ 69 %60.2~ 83905 ~ 39495 918987 70 8816.2 74767 34 38359 8~0040 71 8182.O 66260
35 37322 842179 72 7558.7 58397 36 36270 C05383 73 6946.9 51144 37 35240 769628 74 6357.9 ~LJ+97 38 35230 735893 75 5764.8 30~i 39 33241 701158 76 5199.3 28032
40 32271 666402 77 4654.7 28032 41 31319 636607 7S 4].33.6 23638 42 30384 605755 79 3639.0 19751 43 29566 575~30 44 28562 546S16

192 WORKMEN'S COMPENSATION INJURY TABLE
_mo~i~T X - c~A~o, c0u~s
~RAOT FROM CO~ATION COLJ~',IS BASra ON U.S. LIFE TABLES AND ACTUARIAL TABLES ~ ('~'W.IIT E F~ALF~) 1939-t~ AND ;~ICAN R ~ L k C , E TABLE%. (2-1/2% .I~TERE~)
Age C~z~utation Columns
20 ~8303 553150 55 21 ~1891 508O53 56 22 36547 ~68834 57 23 32106 434508 58
2~,50 ~0~230 59
25 25372 377319 6O 26 2281~ 353226 61 27 20637 331500 62 28 18817 311773 63 29 17233 2937~.8 64
3O 1586~ ~77~00 65 31 14680 261928 66 32 136~ ~??66 67 33 1273~ 234577 68 34 11926 ~22247 69
35 11204 210682 70 36 1O556 199,~02 71 37 99?3.6 189537 72 38 9448.6 179826 73 39 8970.1 17O616 74
AO 8532.4 161865 75 41 8130.3 15353~ 76 ~2 7758.1 145589 77 43 7414.1 138OO3 78
7O%.5 1307~+9 79
~5 6796.0 123804, 80 46 6516.0 11714? 81 47 6252.4 110763 82 ~8 6002.4 104636 83 49 5765.2 98751.8 8~
50 5538.6 93099.9 85 51 5322.8 8?o99.2 86 5~ 5L~4.7 8~A5o.4 87 53 4914.7 77h35.7 88 54 4721.5 72617.6 89
~omm~ta~i~Co!um~
Dx .
453~.i 67989.8 ~352.5 635~6.5 417~.9 59282.8 4001.9 55194.4 3832.4 51277.3
3666.3 47527.9 3503.3 ~39~3.1 33~2.5 AO52O.2 3184.5 3?256.? 3028.3 3~150.3
287~.3 31199.0 2?22.1 28A00.8 2571.6 25?54°0 ~2.2 2325?.i 2274.5 209o8.7
2128.3 187O7.3 1983.2 16651.6 1839.6 i~740.2 1697.9 12971.k 1558.9 L~343.2
1~25.4 9851.3 ~94.8 8~91.2 1167.6 7260.0 104~.6 6153.9 926.52 5168.3
8~.17 Am98,o 7o8.~0 3536.7 609.67 2877.6 518.55 2313.5 435.5~ 1836.4
360.90 1438.2 294.69 M.04.h 237.00 8~.57 187o49 632°33 .145.82 465.67
*See An American Remarriage Table by W~11¢am F. Roeber and Ralph M. Marshalla Volume ~ j Proceedings CAS.

WORKMENYS COMPENSATION INJURY TABLE 193
APPENDIX "A"
PERMANENT PARTIAL AND TEMPORARY TOTAL DISABILITY
INSTRUCTIONS FOR PREPARATION OF "CALL FOR ACCIDENT STATISTICS"
The attached Call for Accident Statistics is to be filled out for all cases on which indemnity was paid, (except death, permanent total and occupational disease cases) from the information contained in the claim file at the time of closing, supplemented by such other in- formation as may be readily available from other sources. The follow- ing instructions should be observed:
GENERAL
(a) Occupational disease cases shall not be reported. (b) All cases involving "temporary disability," but no permanent
disability, closed during one calendar month shall be reported. (c) All cases involving "minor" permanent partial disability only,
closed during three calendar months shall be reported. (d) "Major" permanent partial cases shall be reported from a ran-
dom selection of recent cases where the nature of the injury has been established. The random selection shall be made from any source which is readily convenient to the carriers anc~ which includes all states in which the carrier operates. The number of cases reported shall be in accordance with the quota assigned to each carrier.
(e) One of the attached forms shall be submitted for each case re- port, filled out in accordance with the details of the case being reported. Check marks only are required in the squares. Appro- priate figures shall be entered on the blank lines.
SPECIAL INSTRUCTIONS
(f) The "State" reported shall be the one to which the case is assigned.
(g) "Class Code" shall be the Workmen's Compensation Manual classification to which the case is assigned.
(h) "Date of Accident" reported shall be the date the accident oc- curred.
(i) "I TYPE OF INJURY." Indicate by check in the appropriate square the type of injury to which the case is assignable for the Unit Statistical Plan report.
(j) "II PRINCIPAL BASIS OF AWARD OR SETTLEMENT."

194 WORKMEN'S COMPENSATION INJURY TABLE
"(1) Dismemberment Schedule" The compensation laws of most states provide specific schedules of duration of benefits for the loss of various members, such as a hand, foot, arm, leg, eye, finger, toe, etc., and such laws usually provide that partial loss of use shall be compensated in proportion to such schedule. Cases compensated in accordance with the schedule or proportional to the schedule shall be indicated by a check mark following item (1) on the form.
"(2) Related to Permanent Total" Certain types of injury, such as back cases for example (all cases in California), are not provided for in a specific schedule, and the amount of compensation for permanent disability is determined on the basis of the percentage of total disability or resulting loss of earning power. Such cases shall be indicated by a check mark following item (2) on the form.
"(3) Temporary Only" Item (3) on the form should be checked for cases in- volving temporary total or temporary partial disability only. The block "IV Disability Period - - For Temporary Disability Cases" at the upper right hand side of the form shall also be filled in for these cases only.
"(4) Lump Sum" Certain cases are closed on a compromise basis by a lump sum settlement. Such cases shall be indicated by a check mark following item (4) on the form. The nature and location of injury shall nevertheless be filled in for these cases, and if the claim file does not disclose the percentage loss of use of member, or per- centage of permanent total disability, it shall be deter- mined by relating the amount of settlement to the amount that would be paid for complete loss of the member or permanent total disability.
(k) "III TOTAL INDEMNITY." Enter total amount of indemnity incurred, including indemnity for the specific injury, for the healing period, for disfigurement, and for any other reason, in this blank. Do not include medical losses.
(1) "IV DISABILITY PERIOD - - FOR TEMPORARY DISABIL- ITY CASES." The block at the upper right hand side of the form shall be filled in for each case involving temporary dis- ability only. The duration of the period of disability shall in- clude the "waiting period" provided by the Compensation Act. Report the disability period in weeks and days. In cases involv- ing both total disability and partial disability show the total durations of each type of disability. In cases involving partial
(m)
W0RKMEN'S COMPENSATION INJURY TABLE 195
disability give the average percent of part ial disability as re- lated to total disability, following item (3) on the form.
"V N A T U R E AND LOCATION OF I N J U R Y - P E R M A N E N T DISABILITY CASES ONLY" "AGE." The age at date of acci- dent shall be shown in the space provided on the form for each case involving permanent disability. The nature and location of in jury shall be shown by enter ing check marks or appropria te figures under items "1. ARM" to "16. H E A L I N G PERIOD," inclusive. This information is not required on cases where no permanent disability was incurred.
Under item "1. ARM" and item "2. H A N D " on the form, the first lines require a check mark a f t e r "Majo r (1 ) " or "Minor (2)" . The r ight a rm or hand is con- sidered the "Major" arm or hand, except for a left handed person the lef t would be the "Majo r" arm or hand. In cases where specific information is lacking the r ight a rm or hand shall be considered the "ma jo r" member. (This has nothing to do with the Type of In jury . ) Dismemberment (or enucleation of an eye) shall be indicated by a check mark in the appropr ia te square. I t is desired that the physical facts of the case should be reported ra ther than the basis upon which compen- sation is awarded. For example some laws provide tha t amputat ion between the elbow and the wr is t is equiva- lent to loss of hand; such case should be checked on the form opposite (3) under "1. ARM", provided the claim file reveals this information. Otherwise such a case would be indicated by entering the figure "100%" af ter d ismemberment under item "2. HAND." Provision is made for entering a percentage figure ra ther than a check a f te r d ismemberment of hand to provide for those cases where only par t of the hand is lost. However in case of dismemberment of several digits, the individual digits severed should be indicated and no entry made under "2. HAND", if the claim file gives this informa- tion, even though compensation may be based on part ial loss of hand. I t is desired to keep "loss of use" cases separate f rom dismemberment cases even though the compensation may be the same. The appropriate percentage loss of use should be indicated, using 100% for complete loss of use, or a lesser figure for part ial loss of use. Dismemberment or loss of use of more than one digit should be indicated by checks or appropria te notat ion for each digit. In the case of "13. O T H E R TOES", show the number of

196 WORKMEN'S COMPENSATION INJURY TABLE
toes, using fractions if necessary. In case of loss of use of more than one toe, add the percentages, for example 30% of one toe plus 50% of another toe would appear as 80%. If the award includes an amount for disfigurement show the amount awarded for such disfigurement under item "14. DISFIGUREMENT", on the form. "15. OTHER PERMANENT" is to be used for report- ing cases that are not related to a specific dismember- ment schedule. The percent of permanent total disability should be indicated; if the claim file does not show the required percentage it should be estimated to the best ability of the carrier. The ratio of indemnity incurred to the amount of indemnity which would be payable for permanent total disability may be used to determine this ratio if no better basis is available. "16. HEALING PERIOD" requires the healing period compensated in addition to any award for permanent partial disability. The compensation laws of some states provide that the dismemberment schedule is in lieu of all other compensation; for such states the only entry required is a check mark after "(1) Not com- pensated." Otherwise, the healing period compensated should be shown in weeks and days. The same instruc- tions apply as for reporting in block " I V DISABIL- ITY P E R I O D - - F O R TEMPORARY DISABILITY CASES", except that the waiting period would not be included unless compensation was paid for such period. In cases involving injury to more than one member, each member affected should be indicated by appropri- ate check or notation. However, minor injuries of an inconsequential nature, such as bruises or abrasions to a second member, should be disregarded.

prz~h~E~ PA~ZAL AND TAMPORARY TOTAL DISABILITY
CALL FOR ACCIDE~P ~TATISTICS
~tate Class Code Date o£ Accident "(~,o.)' (Day) (Year)
C,JhRIER
Co. Claim File No.
IV.DISABr7 ITY PERIOD - FaR TF~'~OP~RY DISABILITY CASKS
I. TYPS OF INJURY II.PRINCIP;I.B~SIS OF ANARD OR SETTLF~.R~ III.TOT;~ INDGa'ITY
(1)~J. Z~70)r=p. L~7 (1)D~.S~ed-~e ~ (3)Z~ Only Z[~ (2)V~nor ~ (2)Related to P.T. ~(A)Lump Sum ~7
(1)Total Oisabilit~.__~%.._.Days
(2)Part.Disab~__lity k~ Days
(3)Av.Part.Disability % V.NATU?~E ~D LOCATION OF INJURY - PE~/4A~aNT DISABILITY CASI'S ONLY ., , Indicate by check or enter appropriate figure under member affected. Age_.___
(leg Cont.) " (Tn~nb Cont.) (Ring Finger Cont.) -' l. AP~_~ (3)Dism.below knee Z~ 7 (2)Oism.2pl.or more i~7 (3)Loss of use % IA.DISF!GURFJ4E~ q Cost
MaJ.(1), ~iin.(2) L~7 (A)Loss of use % (3)Loss ofuse%ll. LITTLE FINGER (1)Facial $
(i)Dism.above elbow ~ 4. f~ 8. =~D,X FD[G~2 (1)Dism.l phal. ~ (2)Bodily
(2)Dism. at elbow Z~7 (1)Dimn. % (1)Dim.l p~. ~ (2)Dism.2 pl.or more ~ 15.~H~ PF~;E~ Give % of Total Disab,
(3)Dism.belowelbow~ (2)Loss of use % (2)Diam.2 p l .or m O r e ~ (3)Loss of use % (1)Read or mental. %
(~)LoSS of use % 5, EYZ (3)Loss of use %12. GREAT TOE (2)Back %
2. HAND (1)Enucleaticn ~ 9. ,iIDDLE FINGER (1)Dism.l phal. ~7 (3)Hernia %
~j.(1), ZZ7~.(2) ~7 (2)~s of V~ion ~ (1)Dism.l phi. f[7 (2)Di~.2 pl. L~ (4)~ber Oen.
(1)Dism. ~ 6. LOSS OF 'h~IRING (2)Dism.2 pl.or more~-- 7 (3)Loss of use ~16. HEALING PERIOD
(2)Loss of use % (1)One Ear % (3)Loss of r i s e % 13. OYM5~ TOES (1)Not compensated~7 Give Period Compensated
3. LE_~G (2)Other Ear % iO. RING FINGER (1)Amputation ~ (2)Tot.Dis.__~P~ Day No.of toes
(1)Dis~above knee ~ 7. THUMB (1)Dism.l phal. ~7 (2)Loss of use (3)Pt.Dis. Wk Day No. of toes
(2)Dism.at knee ~7 (1)Dism.l phal. ~ (2)Dism.2 pl.or more~ 7 Sum % each toe % (&)Av.Part.Dis. %
o
F~
o
Z
Note: In case o£ settlement based on ~njury of more than one member', enter sppropriate notation under each member effected.
--I

198 WORKMEN~S COMPENSATION INJURY TABLE
APPENDIX "B" -- FATAL
Instructions For Completing Call For Accident Statistics M Death
1. "Page No." is to be left blank. 2. Use a separate sheet for each state and each policy year.* 3. Use one line of the form for each death case. 4. Indicate each case with total dependents by Code "1" in col-
umn (1). Indicate each case with only partial dependents by Code "2" in
column (1). 5. Enter number of dependents of each type in columns (2) to (9). W~Widow or Widower B~---Brother or Sister C ~--- Children G.P. ~ Grandparents 0 ~ Orphan G.C. ~ Grandchildren P ~ Paren ts Others ~ All Others
In cases involving both total and part ial dependents, disregard the par t ia l dependents.
6. En te r age of deceased in column 10. 7. En te r ages of dependents in columns (11) to (16). In entering
ages, list in the same order as dependents are listed in columns (2) to (9) . In cases involving more than one dependent of the same kind, list the ages in ascending order (youngest first) . En te r a check mark or an "x" for each dependent whose age is not given. Fo r example with a widow age 27, three children ages 7, 10, and "not given," and a parent age not given, columns (2), (3) , (4) and (5) would show "1", "3", "0", and "1" respectively, and the ages would be listed in columns (11) to (15) inclusive in the order "27", "7", "10", "x", "x". Do not show ages beyond the sixth dependent.
8. Give total number of cases with no dependents at bot tom of sheet. 9. Give total number of cases where number and type of dependents
are not given at bot tom of sheet. *Limited to the latest available 5 policy periods.
Call For Accident Statistics--Death (51) State: (5-6) Policy Year: (4)
(1) (2 ) (3 ) (4 ) (5 ) (6 ) (7 ) (8) (9) (10) (11) (12) (13) (14) (15) (16) K I N D W I C 50 7 8
Number Age of of Dependents Deceased
0 .P.J .C.lOt er
14
No. Cases with no Dependents
Age of Dependents
1st I 2ndl 3rd 4th I 5th
65-661 I 173"74 80-81187-88 34-35
No. Cases type dependency unknown
6th o r
Over i40-41

WORKMENTS COMPENSATION INJURY TABLE
A P P E N D I X "B" - - P E R M A N E N T TOTAL DISABILITY
Instruct ions for Completing Call for Accident S t a t i s t i c s - -
Permanent Total
199
1. "Page No." is to be left blank. 2. Use a separate sheet for each state and each policy year.* 3. Use one line of the form for each permanent total case. 4. Leave column (1) blank. This column will be filled in at the
National Council. 5. For each case, indicate the member or members affected by enter-
ing the number of such members affected in the appropriate col- umn. Use columns 2 to 6 inclusive for amputat ion of members, columns 7 to 11 for loss of use but not amputation. Cases of per- manent total disability due to general disability where amputa- tion or loss of use of more than one member is not involved shall be indicated by a check mark or "x" under column (12) to (15) as may be appropriate. The meaning of the symbols shown at the head of the various columns is as follows:
A ~ Arm S ~ Skull, brain or head injuries H = Hand B--~-Back or spine injuries L ~--- Leg P ~ Paralysis F ~ Foot NOC -~- All Others E ~ Eye
6. En te r the age of the injured employee at date of accident in the last column.
*Limited to the latest available 5 policy periods.
Call For Accident S t a t i s t i c s - -Pe rmanen t Total (51)
State: (5-6) Policy Year :
(1) (2) (3) (4) (5) (6) (7) (8) (9)(I0)(11)(12)(13)(14) (15)
(4)
A
62
H L F
63 64 65
Amputation C O D E
10
E
66
Loss of Use
A H L F
70 71 72 73
E S
74 78
All Other
B P N.O.C.
79 80
A~e of Injured
87 -88

200 ~VORKMEN~S COMPENSATION INJURY TABLE
APPENDIX (C)
Special Call for Wage Data
In accordance with the action of the Actuarial Committee, you are hereby requested to file with the National Council on or before Febru- ary 1, 1954 your wage data, distributed by size of average weekly wage, for the three calendar months September, October and Novem- ber, 1953.
The data are to be reported separately by state and shall show for all compensable cases arising during the three month period, the following items assigned to wage groups as indicated on the attached forms.
1. Number of compensable accidents falling within each wage group.
2. Summation of the average weekly wage for all claims falling within each wage group. Individual items are to be left in terms of dollars and cents, but the sums are to be rounded to the nearest dollar before posting on the form. If wage is given in terms of "monthly" wage, "daily" wage, etc., the wages should be converted to a weekly basis.
The form consists of two sheets. It will be noted that the first wage group includes all claims where the weekly wage is under $10.00. From $10 to $200, claims are to be reported at intervals of One Dollar. For example any claim with average weekly wage of $36.00 to and including $36.99 is to be assigned to the "$36 Group". Where there are no claims falling in a particular wage group, the line may be left blank. Cases with an average weekly wage of $200 per week or over are to be reported by Ten Dollar intervals, $200.00 to $209.99 to $210.00 to $219.99, etc. Since it is expected there will not be many claims with weekly wage over $200 per week, the wage groups have not been entered on the form and the carrier is requested to report for only those wage groups where they have cases, as for example:
Wage No. of Total Group Cases Wages
230 4 928
250 2 510
290 1 295
BE SURE TO FILL IN THE CARRIER NAME AND STATE ON EACH SHEET
It is important that actual weekly wages be reported for those cases earning wages greater than the wage equivalent of the maximum weekly compensation and a special effort should be made to secure

WORKMEN'S COMPENSATION INJURY TABLE 201
such actual data. If it is not possible to secure an exact wage it is requested that the carriers omit such cases from the distribution by wage size, but that they report the number of such cases in the special block provided at the end of the form.
Carriers who do not keep their statistical records so that data on compensable cases may be separated from those on non-compensable cases, may include all accidents reported instead of confining the report to compensable cases. In this case the reports should be clearly marked "All Accidents Reported."
Wage data in connection with underground coal mines and risks written under the National Defense Projects Rating Plan should be excluded.
Please note that the date for reporting these data is February 1, 1954. We expect to submit a report to the National Association of Insurance Commissioners at the June Convention. Therefore it is essential that these data be reported promptly.
Instead of reporting wage data on these special forms, a carrier may if it so desires, submit a tabulator tape giving its wage data in equivalent form. If this latter option is adopted, an individual listing of claims where the weekly wage is $200 or more will be acceptable.
A sample of a form for reporting these data is attached. There is also attached an acknowledgement of receipt of this Call which we request that you sign and return to the National Council at once, indicating the number of sets of forms you will need (one set for each state) or whether you will adopt the alternate procedure of reporting on tabulator tapes.

2 0 2 W O R K M E N ' S C O M P E N S A T I O N I N J U R Y T A B L E
Carrier State
N o . O f I ' No.Of : ~agu IComp. ]Total Wage Comp. Total Wage 3rqup LCases'lWa~es Grouv Cases Wa~es • Gr.ou~ U n d e r I i $iO.O01 ' 35 i 61 _
~I0 I 36 62 : I
n . ! 37 63_
1 2 , 3 8 i 6 ~ _
13 i _ _ . 3 9 _ . ., 6 5
4o . ' .66..,
I
J-~ , i ,~ ~m . . . . . 67 ,
z_7 ~3 I 69 1
_l~ , , . v , 1 . , ~ 7 o _ j
_19 . ~ 5 . . . 71 ] F
! ' 1 20, ~ . . . 46 . ' ' - I 7 2
n ~7 I ?.I
o-., i , . . . . , , , I
34
Note:
No.Of Comp. Total Cases . WaRes
I No.Of I Wage Comp. Total Group I Cases Wage~
l~•l I ~99 ! I: $200 & Over By $i0 Intervals As Needec
I
(i) Exclude Underground Coal Mine and National Defense Data (2) Use block at the end of this form when the Actual wage is
unobtainable.
2~ A I. 30.. , ~ 5 6 ,
' i 57 ~:
32 5 8
3&
8 1
8.3 '
8(, L F I
N o . o f c a s e s ~ l t h w a g g r e a t e r t h a n e q u i v . U
r~v~. , u e l d ~ y U o m p . N o . C a e e ~