the wealth of the nation - finfacts06.pdf · the wealth of the nation ... international comparisons...
TRANSCRIPT

The wealth of the nation
How Ireland's wealthy will
invest in the next decade
�
P r e s e n t e d b y
B a n k o f I r e l a n d P r i v a t e B a n k i n g L i m i t e d


The wealth of the nationHow Ireland’s wealthy will invest in the next decade
Pat O’SullivanSenior Economist
Bank of Ireland Private Banking

2

3
The wealth of the nationHow Ireland’s wealthy will invest in the next decade
Executive summary . . . . . . . . . . . . . . . . . . . . . . . . . . . . . . . . . . . . . . . . . . . . . . . . . . . . . . . .5
Section 1: A golden age of wealth accumulation . . . . . . . . . . . . . . . . . . . . . . . . . . . . . . . . . .12
■ Background and overview . . . . . . . . . . . . . . . . . . . . . . . . . . . . . . . . . . . . . . . . . . . . . . . . . . . . . . . .12
■ Demographics – Ireland continues to buck the trend . . . . . . . . . . . . . . . . . . . . . . . . . . . . . . . . . . . . .12
■ Irish economic forecasts – underpinned by demographic trends . . . . . . . . . . . . . . . . . . . . . . . . . . . . .13
■ Household savings – evidence of a structural increase . . . . . . . . . . . . . . . . . . . . . . . . . . . . . . . . . . . .14
■ Ireland is amongst the wealthiest economies in the OECD . . . . . . . . . . . . . . . . . . . . . . . . . . . . . . .15
■ Household wealth – robust growth and favourable prospects . . . . . . . . . . . . . . . . . . . . . . . . . . . . . . . .16
■ International comparisons – Irish household imbalances highlighted . . . . . . . . . . . . . . . . . . . . . . . . .20
■ Conclusions . . . . . . . . . . . . . . . . . . . . . . . . . . . . . . . . . . . . . . . . . . . . . . . . . . . . . . . . . . . . . . . . . . .22
Section 2: The asset allocation of the nation . . . . . . . . . . . . . . . . . . . . . . . . . . . . . . . . . . . . .30
■ First generational wealth – a defining characteristic . . . . . . . . . . . . . . . . . . . . . . . . . . . . . . . . . . . . . .30
■ Forecasting the asset allocation of the nation . . . . . . . . . . . . . . . . . . . . . . . . . . . . . . . . . . . . . . . . . .33
■ Conclusions . . . . . . . . . . . . . . . . . . . . . . . . . . . . . . . . . . . . . . . . . . . . . . . . . . . . . . . . . . . . . . . . . . .34
Appendix I: . . . . . . . . . . . . . . . . . . . . . . . . . . . . . . . . . . . . . . . . . . . . . . . . . . . . . . . . . . . . .38
■ Irish household assets – vast accumulation . . . . . . . . . . . . . . . . . . . . . . . . . . . . . . . . . . . . . . . . . . . .38
■ Households’ liabilities – the other side of the balance sheet . . . . . . . . . . . . . . . . . . . . . . . . . . . . . . . . .48


Executive summary

6
Executive summary1. Irish wealth now ranks second amongst leading developed countries
With a decade of wealth accumulation behind it, the Irish economy’s total wealth per head places
the country second amongst 8 leading OECD countries, behind Japan and ahead of both the UK
and the US. Total wealth per head in Ireland stood at €148,130 at the end of 2005.
If we look back, even a decade to 1995, the comparable level of wealth per head stood at €45,995,
meaning we have seen a growth in per-capita wealth of 12.4% per annum over the past ten years.
2. Residential property; the driver of wealth in the past decadeAs can be seen from the graph, the engine of growth in wealth has been residential property.
increasing from a total value of €92 billion in 1995; by 2005 it had delivered 19% per annum
growth and grown to €542 billion in size.
3. The Irish balance sheet is extremely strong and is set for further dramatic growthEmerging market-like income growth, American-style spending and Germanic savings habits
underpin a continued growth in the stock of wealth over the coming decade.
The Irish household balance sheet is in a very strong position, with gross assets close to €800
billion at the end of 2005. The asset side of the balance sheet includes both financial and non-
financial assets. The dominant asset, unsurprisingly, is residential property.
Household debt stood at €115 billion at the end of 2005, or 140% of personal disposable income.
At €681 billion, net assets as a percentage of personal disposable income stood at just under 830%
– a healthy ratio by any standards.
0
50000
100000
150000
200000
250000
Germany CanadaFranceItalyUSUKIrelandJapan
Wealth rankings based on a per capita basis
net wealth per head
net financial wealth per head
€
Ireland ranks second only to Japan in terms of wealth per capita
Source: Bank of Ireland Private Banking Limited, OECD

7
Currently, the personal savings ratio (as a percentage of disposable income) stands at 12%, or
approximately €10 billion. The ESRI forecast that the annual level of savings1 will increase to
around the €13.5 billion mark by 2010. By 2015, it is forecast that the annual flow of household
savings will be in the region of €24 billion per annum, a trebling in the volume saved today.
We forecast that net household assets will grow to €864 billion by 2010, an increase of 27%. By
2015, they are expected to rise to €1,222 billion, an increase of 79%.
4. Ireland’s wealth will shift towards financial assets and away from propertyMuch of the wealth created in the Irish balance sheet over the past decade has come from price
appreciation in residential property, leaving Irish households significantly overweight in residential
property compared to other countries.
The corollary of holding the largest weight in residential property is that Irish households have the
lowest weight invested in financial assets as a percentage of total assets.
As Ireland’s wealth matures we forecast a shift in the composition of the asset base of Irish
households. We forecast that residential property will decline to 64% of total assets by 2010 and to
59% by 2015.
While the dependence on residential property is a potential source of risk, our view is that
residential property is well supported by demographic trends within Ireland. However, interest-rate
increases seen in the recent months will ultimately act as a brake on price appreciation. Excluding
an external shock, our view is that the residential market will slow to low single digit growth rates
over the coming decade.
Consequently, investors will shift their attention to increasing their holdings of other asset classes.
The most likely candidates to benefit from this shift will be investment funds and deposits, as
Ireland’s wealthy begin to conform to global norms.
Investment funds, primarily linked to equity markets failed to grow in popularity in the aftermath
of the 2000-2002 equity bear market. The proportion of wealth being invested in such vehicles in
Ireland stayed static in the 2000-2005 period. This contrasts starkly to the three-fold increase in
flows into cash and the nine-fold increase in investment in commercial property.
1 Personal savings is that portion of personal income that is not expended on current goods and services or on payment of taxes onincome and wealth. This item is vulnerable to small errors in the underlying aggregates, and should be treated with caution.
AT the end of 2005, net household
wealth stood at €681 billion, an
increase of nearly 350% in ten years.

8
A consequence of the focus on property has been the slower than anticipated growth in pension
funds. Despite the most significant of tax breaks, pension fund investing has also been outpaced by
the phenomenon of individuals investing in property as a retirement asset.
5. Ireland has borrowed to invest, instead of borrowing to consume Internationally, the use of borrowing to fund consumer expenditure is a phenomenon that has given
some cause for concern. In particular in the US, consumers have used equity built up in the housing
stock to fund a consumer boom. Ireland, in contrast, appears to have borrowed to invest, using
equity gains in the property market to fund further investment. As interest rates increase, even
marginally, and given that yields on property have fallen back, we expect to see a reduction in the
levels of leverage being deployed.
6. Indebtedness has increased rapidly but to a normal level Much has been made of the level of indebtedness in the Irish economy. The pace of growth in debt
has been higher than in many other countries. However, we started from a lower base and from a
locally higher interest rate environment. At the end of 2005, our average debt relative to wealth had
reached the European average.
7. Ireland’s wealthiest will grow assets to in excess of €214 billion by 2015We estimate that the asset base (excluding residential property) of the top 1% of the population is
approximately €86 billion. And we forecast that this asset base of the top 1% of the population will
increase to €129 billion by 2010, a 50% rise on this 2005 level and to €214 billion by 2015, an
increase of a further 67%.
8. First generational wealth has important implicationsOne of the key differentiating characteristics between the wealth in Ireland and in many of our
OECD peers is that the wealth is of a first generational nature. That is, the vast bulk of the wealth
in Ireland has only been made in the last 10 years or so. By contrast, the wealth in many other first
world economies is of a much older vintage. For example, we estimate that Irish net wealth
increased by 350% between 1995 and 2005, while the net worth of UK households increased by
96% over the same period. This has specific implications for the way the money is invested, the
expectations for returns, the willingness to take risks and issues of inheritance and philanthropy.

9
The implications As the population ages, a trend will gradually emerge in which more liquid, financial assets grow in
popularity compared to the higher risk, leveraged transactions that have dominated for the past decade.
Property will remain a national obsession but higher interest rates, lower rental yields and consequently
lower returns to investors will curb the appetite for leverage. Greater diversification in assets is likely
to result. The use of leverage to invest further will continue as Ireland’s appetite for larger and larger
investment portfolios will not change overnight. However, a still more conspicuous consumer may
yet emerge, as more of this wealth is turned into luxury consumption.
Property’s only competitor for ‘asset class of the year’ in recent times has been the plain old cash
deposit. With deposits standing at nearly 100% of personal disposable income in 2005, there is
substantial capacity for investing in other areas. We believe that cash deposits will continue to grow
at a pace of €6-7 billion per annum but the pace of growth in investment funds (and in particular
pension funds) will increase significantly as investment in property cools. The result will be a
gradual change in Ireland’s ‘asset allocation’ – the way in which the country chooses to invest –
towards the norms of other mature western economies. The big winners in this process of
normalisation will be investment or pension funds that invest in the world’s capital markets and
cash deposits.
Gradually we will see the emergence of second and third generation wealth management issues that
are seen in mature economies. Interest in estate planning, strategies to preserve wealth and interest
in philanthropy and charitable giving will all increase in the coming decade.
One of the key differentiating
characteristics between the wealth
in Ireland and in many of our OECD peers
is that the wealth is of a first generational
nature. This is about to change.


A golden age ofwealth accumulation

12
A golden age of wealthaccumulation
1.1 Background and overview
Our view is that the Irish economy is entering a more mature phase of growth. This should result in
illiquid/non-financial forms of wealth (i.e. property, land, business equity, etc.) transforming into more
liquid/financial assets. The first sign of this is the rapid increase in household savings and deposits that
has occurred in the last five years (even allowing for the distorting effect of the SSIAs). Underpinning
this transition is the moderate ageing of the population, albeit one that is still expanding. As of the end
of 2005, net household wealth (i.e. household assets minus household debt) stood at €681 billion, an
increase of nearly 350% since 1995. The main driver of this increase was residential property. We are
forecasting that net household wealth will grow to €864 billion by the end of 2010, an increase of 27%,
but the composition will shift somewhat from non-financial assets to financial assets. By 2015, we are
forecasting that Irish household net wealth will be €1,222 billion.
1.2 Demographics – Ireland continues to buck the trend The population of 51 countries, including Germany, Italy, Japan, the Baltic States and most of the
successor states of the former Soviet Union, is expected to be lower in 2050 than in 2005. In marked
contrast, the Irish economy will continue to see an expanding population, albeit one that is getting older.
The Irish population is expected to grow by 23% between now and 2020 and by close to 60% (i.e. a
population of 6.6 million) by 2050; rates of growth comparable with many developing economies. This
contrasts sharply with the general decline in the population of many of the world’s modern economies
(the US and the UK are the most prominent exceptions). These population forecasts are based on the
high-growth forecasts of the United Nations World Population Forecasts.
0
30
60
90
120
150
IrelandEuropeNorth America
AsiaLatin America
OceaniaAfrica
%
Population growth to 2050 – UN high growth forecasts
Source: United Nations World Population Forecasts
World population trends

13
The average age of the Irish population will get older over the coming decades; an important development
in terms of wealth accumulation and investment. In particular, the number of people in the key wealth-
generating cohorts will see accelerated rates of growth.
Over the next five years, the number of people in the 25–44 age cohort will grow by 10% (an increase of
130,000 people) and by 13% (an increase of 121,000 people) in the 45–64 age cohort, while the overall
population will grow by only 8%.
Population growth forecasts by age cohort in 2010, 2015 and 2020(percentage change from 2005 base year)
20052000 2010 20150
20000
40000
60000
38010 41032 44358 47846
1%
popu
latio
n
The number of people in 1% of the population
2 These forecasts are from the ESRI’s Medium Term Review 2005–2012 and are the high-growth variant of the forecasts. These arereal GNP forecast growth rates; the respective real GDP forecasts are 5.7% and 3.9%.
1.3 Irish economic forecasts – underpinned by demographic trendsThat the Irish population will benefit from an expanding demographic base is key to the long-term
positive economic outlook for the country. Over the next five years the economy is expected to grow by
4.9% per annum on average and by 3.3% on average in the following five years.2 Following from these
forecasts, the outlook for disposable incomes and personal savings rates are even more positive. Personal
disposable income is expected to grow by 6.2% on average per annum between 2005 and 2010 and by
8.5% on average per annum in the subsequent five years. That is, personal disposable income is expected
to increase by over 100% over the next 10 years.
2010
0-14 Age Cohort
15-24 Age Cohort
25-44 Age Cohort
45-64 Age Cohort
65+ Age Cohort Total
9.9 -9.6 10.2 13.4 12.2 8.1
2015 20.3 -10.3 15.6 24.4 33.5 16.6
2020 26.4 -4.1 14.2 37.7 57.1 24.0
Source: CSO of Ireland
Source: CSO of Ireland

14
1.4 Household savings – evidence of a structural increaseThe ageing of the population, combined with the growth in the economy and disposable income, means
that a structural increase in the level of savings is inevitable. In fact, there is evidence that we are
currently experiencing this structural increase and that the volume of personal savings in the Irish market
will remain very robust over the coming decade.
The annual amount, or flow, of household savings was €2 billion in 1990 and by the end of the decade
this doubled to €4 billion. However, in the five years between 1999 and 2004, the flow of household
personal savings doubled again to stand at over €8 billion and is estimated to be €10 billion in 2005.
That is, according to the national accounts’ definition of household personal savings, €10 billion in new
household savings was made last year. The SSIAs obviously play a part in boosting savings over the last
five years or so. Nevertheless, we believe a step change in the level of savings has occurred.
1990
1991
1992
1993
1994
1995
1996
1997
1998
1999
2000
2001
2002
2003
2004
2005
2006
2007
2008
2009
2010
2011
2012
2013
2014
2015
0
50000
100000
150000
200000
€ m
illion
s
103% forecast increase
PDI forecast to 2015
Personal disposable income
1990
€ m
illion
s
doubles
mor
e tha
n dou
bles
1991
1992
1993
1994
1995
1996
1997
1998
1999
2000
2001
2002
2003
2004
2005
2006
2007
2008
2009
2010
2011
2012
2013
2014
2015
0
5000
10000
15000
20000
25000
Personal saving
doubles
Household savings in Ireland
Source: The ESRIs Medium Term Review & CSO of Ireland
Source: The ESRIs Medium Term Review, CSO of Ireland & Bank of Ireland Private Banking Limited

15
Based on the above numbers and a personal savings rate rising to 12% of disposable income, the ESRI
forecast that the annual level of savings will increase to around €13.5 billion by 2010. By 2015, it is
forecast that the annual flow of household savings will be in the region of €24 billion per annum.
Implicit in this last forecast is a rise in the savings ratio to 14% of disposable incomes – contrasting
sharply with the recent averages of 1% in the US and 5% in the UK. We have to look to Germany to
find a similar attitude to savings, where it approaches 10%.
The giant in the savings market is cash deposits, which have grown dramatically in recent years. At the end of
2005, household deposits stood at nearly 100% of personal disposable income, well ahead of the 10-year
average of 83%. We believe that Irish households will continue to add at least €6-7 billion per annum in
cash savings over the next five years.
Rather than focusing too heavily on the actual level of savings in any given year, it is probably more valuable
to examine the rate of growth in the level of savings, which averaged close to 20% over the last five years.
This 20% rate of growth was boosted by the impact of the SSIAs. Looking at the next five to ten years we
estimate that the rate of growth will fall to around 10% per annum.
1.5 Ireland is amongst the wealthiest economies in the OECD
We may have ample information about income but for most economies, particularly smaller ones, there
is a relative paucity of information about the stock of wealth. A key part of our research has been to
splice together the various sources of information about wealth in the Irish economy. Making
comparisons to other countries has proved challenging. Nonetheless, we have sourced comparable data
for most of the major economies within the OECD – eight in total. Remarkably, the pace of Ireland’s
growth puts it in second place when compared to some of the largest economies in the OECD.
0
50000
100000
150000
200000
250000
Germany CanadaFranceItalyUSUKIrelandJapan
net wealth per head
net financial wealth per head
€
Wealth rankings based on a per capita basis
Source: Bank of Ireland Private Banking Limited & OECD

16
1.6 Household wealth – robust growth and favourable prospects
At the end of 2005, the total amount of Irish household assets stood at €796 billion or 968% of
personal disposable income, while the household debt ratio stood at 140% of disposable income. Irish
household assets increased by 350% over the last 10 years. If we exclude residential property from the
asset base, this still leaves households sitting on over €254 billion in assets, with a significant portion
concentrated in the hands of higher income cohorts. We estimate that the top 1% of the population
holds 20% of the wealth, the top 2% holds 30% and the top 5% holds 40%3. However, if we exclude
the value of housing and focus primarily on financial wealth, the concentration of wealth increases. In
this instance, 1% of the population accounts for around 34% of wealth.
The following chart highlights the growth rate of the major components of household wealth over the
last decade and also provides 10-year forecasts. (Note: This reflects growth in asset values, plus net
inflows into each asset class.)
It is of no surprise that both residential and commercial property assets have experienced the strongest
increases, with both coincidentally growing by about 485%. Over the same period, the value of
investment funds grew by 173%. At the end of 2005, residential property, with a value of €542 billion,
was the most significant part of Ireland’s household balance sheet. At the other end of the scale was
commercial property with about €20 billion in personal ownership. The following table breaks out the
actual values of the main components of household assets as at the end of 2005 and provides very
tentative forecasts for their values over the next 5 and 10 years under two scenarios. But first, a brief
outline of the methodology behind the numbers and forecasts.
%
0
100
200
300
400
500
600
Investment funds
Pensionfunds
DepositsBusinessequity
Directequity
Commercialproperty
Residentialproperty
2005 - 2015 (forecast)1995 - 2005
Growth in main components of household wealth - percentage change
Growth in household assets
3 We assume that the distribution of wealth mirrors closely the distribution of wealth in the UK, which is less concentrated than theUS but more concentrated than many other European countries. This also accords with the relative Gini coefficient for income inIreland and other European countries. The Gini coefficient is a measure of income distribution. A score of zero indicates perfectequality, and 100 indicates that all national income is enjoyed by one person. According to the UN, Ireland’s Gini coefficient is 36,as is the UK’s. We assume that the Gini coefficient for wealth distribution is the same in Ireland as it is in the UK, which is close to70. In the US, the coefficient is around 89. The distribution of wealth is even more concentrated than that of income, as evidencedby the above numbers.
Source: The Central Bank of Ireland, IAIM, IAPF, CSO of Ireland & Bank of Ireland Private Banking Limited

17
The forecastsForecast 1 – the straight line approachForecast 1 for both 2010 and 2015 makes two simple assumptions:
1. Personal disposable income is forecast to be €111 billion in 2010 and €167 billion in 2015,
up from €82 billion in 2005. The source of this forecast is the ESRI’s Medium Term Review.
2. The ratio of each of the individual components to disposable income in 2010 and 2015 is
maintained at the 2004 level.
These assumptions produce a forecast of €1,021 billion in gross household assets by 2010, an increase
of 28%, and €1,536 billion by 2015, an increase of 93%. Net assets rise to €887 billion and to €1,334
billion by 2010 and 2015, respectively. Household debt grows to €134 billion by 2010 and then to
€202 billion.
Forecast 2 – closer to international normsForecast 2 for both 2010 and 2015 makes a number of subjective assumptions that are coloured by the
characteristics of the US and UK household portfolios. The assumptions are:
1. Personal disposable income is forecast to be €111 billion in 2010, up from €82 billion in 2005.
The source of this forecast is the ESRIs Medium Term Review.
2. The ratios of each of the individual components to disposable income in 2010 and 2015 are adjusted
and incorporate the following major adjustments:
a. Irish house prices moderate over the next 10 years.
b. The flows into deposits stabilise at €7 billion a year over the next 5 years and then averages €13
billion over the following 5 years.
c. The proportion of flows into financial assets increase, especially into pension funds and
investment funds.
d. The ratio of debt-to-disposable income increases to 180% by 2010 and stabilises at this level
thereafter. This results in the stock of household debt rising to €200 billion by 2010 and to
€300 billion by 2015.
These changes are designed to gradually force the Irish household asset allocation and ratios to a
disposable income closer to more international norms. We feel that this is appropriate as the economy
itself matures.
These assumptions produce a forecast of €1,064 billion in gross household assets by 2010, an increase of
34%. By 2015, they rise to €1,522 billion. Net assets rise to €864 billion, an increase of 27% and to
€1,222 by 2015. Household debt grows to €200 billion, an increase of 74%. This forecast implies that
the asset base (excluding residential property) of the top 1% of the population will increase to €129
billion by 2010, a 50% rise on the 2005 level.
The main conclusion is that the scope for financial asset growth in general and investment fund growth
in particular is very significant.

18
Irish household assets and net worth – High-growth scenario to 2010
Source: The Central Bank of Ireland, IAIM, IAPF, CSO, ESRI & Bank of Ireland Private Banking Limited
Irish household assets and net worth – High-growth scenario to 2015
Source: The Central Bank of Ireland, IAIM, IAPF, CSO, ESRI & Bank of Ireland Private Banking Limited
€ Billions
Residential property
20052010
(Forecast 1)2010
(Forecast 2)
542 704 684
Deposits 80 104 112
Pension funds 64 76 90
Business equity 43 54 64
Investment funds 28 35 57
Direct equity 19 24 30
Commercial property 20 24 27
Gross assets 796 1 021 1 064
Household debt 115 134 200
Net assets 681 887 864
€ Billions
Residential property
2005
542
Deposits 80
Pension funds 64
Business equity 43
Investment funds 28
Direct equity 19
Commercial property 20
Gross assets 796
Household debt 115
Net assets 681
2015(Forecast 1)
2015(Forecast 2)
1 059 891
157 177
114 160
81 96
53 106
36 56
36 36
1 536 1 522
202 300
1 334 1 222
19
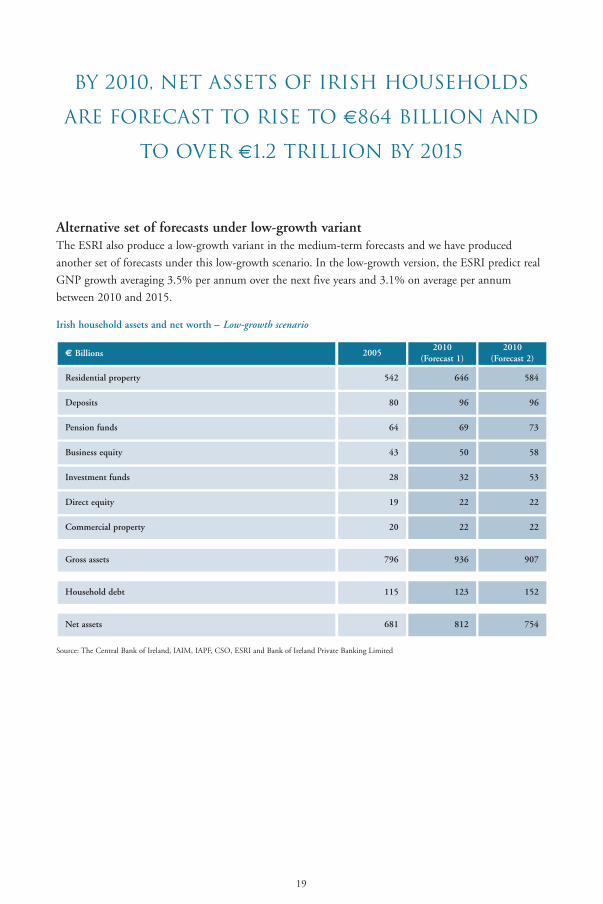
Alternative set of forecasts under low-growth variantThe ESRI also produce a low-growth variant in the medium-term forecasts and we have produced
another set of forecasts under this low-growth scenario. In the low-growth version, the ESRI predict real
GNP growth averaging 3.5% per annum over the next five years and 3.1% on average per annum
between 2010 and 2015.
Irish household assets and net worth – Low-growth scenario
Source: The Central Bank of Ireland, IAIM, IAPF, CSO, ESRI and Bank of Ireland Private Banking Limited
€ Billions
Residential property
20052010
(Forecast 1)2010
(Forecast 2)
542 646 584
Deposits 80 96 96
Pension funds 64 69 73
Business equity 43 50 58
Investment funds 28 32 53
Direct equity 19 22 22
Commercial property 20 22 22
Gross assets 796 936 907
Household debt 115 123 152
Net assets 681 812 754
by 2010, net assets of irish households
are forecast to rise to €864 billion and
to over €1.2 trillion by 2015

1.7 International comparisons – Irish household imbalances highlightedComparing the composition of Irish household balance sheets with many of our international peers
highlights a number of imbalances. It also puts into context the debt burden faced by domestic households.
The following table indicates the variation in the structure of household portfolios as a percentage of
total assets across various countries for three different years (1995, 2000 and 2003).
The only non-financial asset used in the calculation of total assets is housing, which excludes commercial property
and business equity as we have previously used. This is done in order to facilitate cross-border comparisons.
20
Irish household assets and net worth – Low-growth scenario
Source: The Central Bank of Ireland, IAIM, IAPF, CSO, ESRI & Bank of Ireland Private Banking Limited
Irish households are overweight in
residential property in their portfolios
€ Billions
Residential property
20052015
(Forecast 1)2015
(Forecast 2)
542 780 691
Deposits 80 116 116
Pension funds 64 84 88
Business equity 43 60 70
Investment funds 28 39 64
Direct equity 19 26 26
Commercial property 20 26 26
Gross assets 796 1 131 1 081
Household debt 115 149 185
Net assets 681 982 896

21
Residential property overweightIrish households are overweight in residential property in their portfolios. At 74.3% of total assets it is
significantly above the European average of 57.7%. The importance of property increased quite sharply
over the last decade from 60.5% in 1995 to 67.6% in 2000 to its 2003 level. It should be noted that
2003 is the latest year where cross-border data is available for all of the above countries. The only other
country in Europe with a comparable figure is Spain, with Spanish households holding 72% of total
assets in residential property. The fact that both Ireland and Spain experienced very strong housing
booms exacerbated this trend over the period under review.
It is interesting to note that the weight of residential property in household portfolios in the US and UK
stood at 30.9% and 49%, respectively. These more moderate weights reflect the greater diversity of assets
held by these households. The UK household balance sheet has seen a shift towards residential property
over the last decade, with its weight increasing from 36.6% in 1995 to 49% in 2003. This is explained
by the strong bull market in residential property combined with the equity market shake out of
2000–2002. Despite a similar environment in the US, residential property’s weight increased from
27.1% in 1995 to only 30.9% by 2003.
Source: Banco de Portugal & Bank of Ireland Private Banking Limited
*This calculation for Ireland adds back commercial property and business equity to total assets. This increases thedenominator and thus reduces the relevant ratios of housing, financial assets and liabilities to total assets.
International comparisons – household wealth as a percentage of total assets
1995 19952000 2003% of total assets 2000 2003 1995 2000
Housing Financial assets Liabilities
49.7
55.4
65.2
49.0
64.9
36.6
60.5
54.5
27.1
41.6
56.0
44.3
51.8
63.4
45.2
53.6
39.0
67.6
52.1
25.4
37.2
59.9
44.7
50.6
72.0
52.3
60.8
49.0
74.3
57.7
30.9
33.7
68.6
Portugal
Germany
Spain
France
Italy
United Kingdom
Ireland
Europe (7)
USA
Japan
Ireland*
50.3
44.6
34.8
51.0
35.1
63.4
39.5
45.5
72.9
58.4
36.4
55.7
48.2
36.6
54.8
46.4
61.0
32.4
47.9
74.6
62.8
29.6
55.3
49.4
28.0
47.7
39.2
51.0
25.7
42.3
69.1
66.3
23.7
12.8
19.2
10.8
13.5
4.3
17.9
10.2
12.7
17.5
18.9
9.4
21.4
20.1
12.4
12.0
5.6
14.7
9.8
13.7
16.7
17.8
9.1
24.6
19.7
11.9
12.1
5.7
18.0
12.4
14.9
19.8
17.7
11.4

22
Not enough diversification
The corollary of holding the largest weight in residential property, Irish households have the lowest
weight invested in financial assets as a percentage of total assets.
At the end of 2003, the weighting stood at 25.7%, below the average of the seven European countries of
42.3%. The proportion of financial assets held by domestic households fell from 39.5% in 1995 and
marks the sharpest fall of any of the other eight countries under review. The average of the seven
European countries is only modestly lower than the 1995 weight of 45.5%. US households hold close to
70% of their assets in financial instruments, which is slightly lower than the 1995 level of 72.9%. In the
UK, the 2003 number is slightly over 50%, which is a good deal lower than the 1995 holding of 63.4%.
Between 1995 and 2000, households in Europe, the US and Japan for the most part saw their holdings
of financial assets increase as a percentage of total assets due to the decade-long bull run in global equity
markets. In the period 2000 to 2003, residential property started to reassert its dominance given the
broad-based decline in global equity markets. Following the strong recovery in equity markets since
2003, it is reasonable to expect that the financial assets of households as a share of total assets recovered
again. The exception however is Ireland, where the latest data indicate a continued increased holding of
residential property.
Domestic households will always have an above average weighting towards residential property (due to one
of the highest home ownership rates in the world), but the recent run-up in prices and the emergence of
the buy-to-let investor has exacerbated this underlying trend.
Evidence would suggest that Irish households are not dipping into home equity to fund their
consumption habits, but rather are using this equity to fund further residential investment. The first bit
is good, the other bit less so. One thing is certain – the current rate of house price appreciation is unsustainable.
Another characteristic of Irish investment habits that our research highlights is the lack of growth in equity
market investing. Between 2000 and 2005 the flow into investment funds was broadly unchanged at around
€2 billion.
Fast growing liabilities, but not a problem… yet
Liabilities (defined as household mortgage debt and consumer credit), as a percentage of total assets,
remain quite low by international standards. At 12.4% of total assets, Irish households’ liabilities at the
end of 2003 were less than the Europe seven average of 14.9% and the US level of 19.8%. The
accumulation of liabilities since 2003 in Ireland has continued to accelerate and stood at 14.2% at the
end of 2004 and 15.5% by the end of last year. It is the growth rate that is unusual as opposed to the
actual level. Using the 2005 number, the percentage of total assets accounted by liabilities is roughly at
the average for the seven European countries.
The following table looks at the same assets and liabilities but expressed as a percentage of disposable
income. One of the flaws of this approach is that both assets and liabilities are a stock item (i.e. an
aggregate sum accumulated over time), while disposable income is a flow item. Nevertheless, this
approach is widely used and provides an alternative basis for international comparisons.

23
Liabilities, as a percentage of total
assets, remain quite low by
international standards.
International comparisons – household wealth as a percentage of disposable income
Source: Banco de Portugal & Bank of Ireland Private Banking Limited
1995
Housing Financial assets Liabilities
19952000 2003% of total assets 2000 2003 1995 2000 2003
209
–
–
271
371
234
437
–
–
–
–
219
–
–
276
437
270
385
–
–
–
–
226
–
–
268
635
318
477
–
–
–
–
Portugal
Belgium
Denmark
Germany
Spain
France
Italy
The Netherlands
Austria
Finland
Sweden
212
362
279
218
198
243
237
411
181
100
211
276
468
356
256
252
328
333
560
203
185
295
279
398
308
262
247
290
308
465
210
177
262
54
63
175
94
61
64
29
108
52
65
95
106
69
225
107
86
72
40
175
72
60
101
124
67
214
104
105
74
44
201
75
70
117
218 301 381United Kingdom 378 471 397 107 113 140
285 488 569Ireland 186 235 197 48 70 93
289
–
339
–
410
–
Europe (7)
Europe
–
247
–
324
–
292
–
78
–
97
–
108
146 157 184USA 391 460 411 94 103 118
262 240 216Japan 367 407 424 119 115 113

24
In 1995, Irish housing as a percentage of disposable income stood at 285% and was broadly in line with
our international counterparts. By 2003, however, it was second only to Spain at 569%. This trend
continued over the last couple of years and we estimate that it now stands at close to 660% of disposable
income. This contrasts with the UK and the US where housing as a percentage of disposable income
stood at 381% and 184%, respectively, at the end of 2003. These are two countries that experienced very
strong housing booms but nothing of the scale and magnitude of the Irish experience.
Not surprisingly, the financial asset base as a percentage of disposable income of the Irish household
remains at the bottom of the table and stood at only 197% at the end of 2003, and we estimate that it
rose to 230% by the end of 2005. These numbers again illustrate the unbalanced nature of the Irish
households’ store of wealth – an imbalance which ultimately will have to be corrected.
By the end of 2003, Irish household liabilities stood at 93% of disposable income, broadly in line with
the European average. This convergence to the European average was reasonably quick, as Ireland stood
at only two-thirds of the European average in 1995. The Irish ratio rose to 140% by the end of 2005,
moving above the European average (which we estimate to be around 117%).
Viewed in isolation, the debt numbers can be made to look ominous, but we should not forget the other
side of the household balance sheet, which has seen an explosion in the growth of assets. Our forecasts
make some normalising assumptions and two of them stem from the above analysis. First, we anticipate
that the importance of housing as an asset class will diminish over the next decade and, second, the pace
of mortgage accumulation will moderate. International experience points to such an evolution for Irish
household balance sheets: the issue is whether this prospective outcome will be smooth or abrupt.
Viewed in isolation, the debt
numbers can be made to look
ominous, but we should not
forget the other side of the
household balance sheet, which
has seen an explosion in the
growth of assetS.

25
Composition of financial assets
The following table breaks out the composition of households’ financial assets for 15 countries, as a
percentage of disposable income. Unfortunately, a direct comparison between the Irish and other
countries’ numbers is difficult, as the domestic numbers are derived on a different basis. Nevertheless,
broad trends can be identified and analysed. The composition of Irish households’ financial assets is in
line with the European average, with 45% on deposit, 22% in mutual funds and direct equities and 33%
held in pension assets. It is notable that the proportion invested in deposits remained unchanged from
1995, while most countries experienced a decline in currencies and deposits as a percentage of disposable
income.
International comparisons – household wealth as a percentage of disposable income
Source: Banco de Portugal & Bank of Ireland Private Banking Limited
* The Irish definitions do not fully coincide with the above headings. For all the other countries the numbers are based onfinancial accounts according to ESA 95. These numbers are not published in an Irish context and the above Irishnumbers are based on direct estimates.
1995 19952003% of total assets 2003 1995 2003
Currency & Deposits Mutual funds & other equities Pension Funds
63
61
42
55
57
42
71
26
77
79
38
–
–
–
–
–
–
–
–
–
–
–
55
51
36
48
45
33
49
29
66
36
23
Portugal
Belgium
Denmark
Germany
Spain
France
Italy
The Netherlands
Austria
Finland
Sweden
25
29
23
19
31
35
20
20
6
5
30
–
–
–
–
–
–
–
–
–
–
–
27
29
17
22
39
36
35
11
16
41
40
11
10
34
26
10
21
10
53
16
15
31
–
–
–
–
–
–
–
–
–
–
–
17
19
46
30
16
31
15
60
21
23
37
27 – 28United Kingdom 20 – 16 53 – 56
45 – 45Ireland* 23 – 22 32 – 33
48 – 39Europe (13) 30 – 35 22 – 27
25 – 32USA 46 – 48 29 – 30
60 – 62Japan 14 – 11 26 – 27

26
The proportion of financial assets held in mutual funds and direct equities is the third lowest in Europe,
with only the UK and the Netherlands lower. Offsetting this for these two economies is the fact that
they both have the biggest weighting in pension fund assets, while Irish households hold significantly
less. Dutch and British households held 60% and 56% of their financial assets as a percentage of
disposable income as pension assets, respectively, at the end of 2003, while Irish households held only
33%. These figures suggest that there is room for greater household participation in financial markets,
whether through direct equity, investment fund or pension fund exposure. We use the Dutch and British
examples as the benchmark for our analysis as these countries take a less paternalistic approach to long-
term savings and pension-fund investing than many of their European counterparts and are more akin to
the Irish system.
A clear message
The progress of Irish wealth to the top of the league table has been propelled by the extent of growth in
residential property. Essentially Ireland’s wealth was lifted to a greater extent by the growth in local, and
indeed global property markets. While we do not predict the demise of growth in property markets, we
do believe that the coming decade will see a reduction in growth rates in the residential market in Ireland.
Having benefited from property, it must now seek to add other sources of growth if it is to maintain its
table-topping status.

27

28

Section 2: The asset allocation
of the nation

30
1995 1996 1997 1998 1999 2000 2001 2002 2003 2004 2005
€ m
illion
s
0
100000
200000
300000
400000
500000
600000
700000
800000
350% growth
Net wealth - gross assets minus total liabilities
Much of the wealth creation occurred in the last decade in Ireland
Section 2: The asset allocation
of the nation
2.1 First generational wealth – a defining characteristicOne of the key differentiating characteristics between the wealth in Ireland and in many of our OECD
peers is that our wealth is of a first generational nature. That is, the vast bulk of the wealth in Ireland has
only been made in the last 10 to 20 years. By contrast, the wealth in many other first world economies is
of a much older vintage. For example, we estimate that net wealth increased by 350% between 1995 and
2005, while the net worth of UK households increased by 96% over the same period.
This has specific implications for the way the money is invested, the expectations for returns, the
willingness to take risks and issues of inheritance and philanthropy.
First generational wealth tends to be more entrepreneurial and self-directed in nature and quite often this
new wealth is realised by discontinuous ‘liquidity events’. That is, wealth is realised by the sale of land or
a business, an increasingly common event in Ireland. Anecdotal evidence provides strong support of this
if we look at the various rich lists produced for Ireland. Amongst the top names in recent years on these
lists, all but one or two, are self-made millionaires, with inheritance playing little or no part in the
creation of this wealth. Furthermore, the vast bulk of this wealth was made in the last decade.
First generational wealth is also inclined to take on more risk in order to generate strong returns and is
willing to eschew diversification in order to achieve this. Individuals that have created this wealth in a
short space of time are accustomed to generating very high returns and are focused on trying to repeat
such returns on an ongoing basis. As wealth grows and matures, however, the benefits of diversification
Source: Bank of Ireland Private Banking Limited

31
become compelling and an increasing amount of this wealth is allocated to other assets. We believe that
this transition is only just beginning in Ireland and underlines many of the assumptions we have made in
our forecasts.
Other areas where we see significant potential for growth and change in Ireland are inheritance and
philanthropy. As the wealth market matures, we believe that we will see increased incidences of large
donations to charities and in some cases the creation of philanthropic foundations. This is quite a
common occurrence in the US, although the scale of some of the foundations are quite staggering.
The following table highlights the top 10 foundations in the US by asset size.
Rank Name Assets ($ billion)
Top 10 US foundations by asset size (June 2005)
Source: Corporate Executive Board 2006
1 Bill & Melinda Gates Foundation $26.8
2 The Ford Foundation $10.6
3 J. Paul Getty Trust $9.1
4 Lilly Endowment Inc. $8.6
5 The Robert Wood Johnson Foundation $7.9
6 W.K. Kellog Foundation $6.8
7 The William and Flora Hewlett Foundation $6.0
8 The David and Lucile Packard Foundation $5.9
9 Gordon and Betty Moore Foundation $4.8
10 The Andrew W. Mellon Foundation $4.7

32
How many millionaires are in Ireland? – how long is a piece of string?
There are no definitive numbers about the number of millionaires within the Irish economy, with some
estimates as high as 100,000. This number would suggest that the percentage of millionaires in the total
population would be as high as 2.5%. In contrast, the percentage of millionaires in the US and the UK
stands at around 0.7%.
An obvious problem is how a millionaire is defined, principally how one treats the value of a principal
private residence and how one considers debt.
As a consequence of asset growth in residential property there are many tens of thousands of ‘asset
millionaires’. However the need for a roof over one’s head and the impact of indebtedness significantly
reduces the extent to which a ‘millionaire lifestyle’ is in any way realistic for most.
In most countries, a more meaningful, if still imperfect, measure is total assets less principal private
residence. This measure includes broad estimates of business equity, commercial property and financial
assets, but makes an imperfect adjustment for indebtedness in total.
Our estimate of millionaires focuses on this as a measure of individuals with a true net worth at, or in
excess of, the million euro level.
Using the above analysis this would imply that there are somewhere in the region of 30,000 millionaires
in the country.
Based on international evidence we estimate that there are over 300 individuals with a net worth in excess
of €30 million within the Irish economy and a further 2,700 with a net worth of between €5 million
and €30 million. The remaining 27,000 have a net worth of between €1 million and €5 million.
Source: Bank of Ireland Private Banking Limited
+ € 30m
€ 5m - € 30m
€ 1m - € 5m
300
2,700
27,000
Millionaires by financial assets, 2005

33
2.2 Forecasting the asset allocation of the nation
As wealth managers, we obsess about ‘asset allocation’ – how investors divide up the pie between the major
asset classes. Thus far, Ireland’s obsession with property has served it very well – helping it leap-frog
countries whose focus has been elsewhere. In the coming decade as the process of normalisation occurs, we
expect to see the pace of growth in wealth slow to levels more on a par with other developed economies.
Our forecast indicates that investment in the equity market is likely to feature increasingly in Irish
investment habits as our ‘asset allocation’ aligns more closely with more mature wealth markets.
Investment in property will continue as a disproportionately large slice of Ireland’s investment habits –
and will continue to be higher than other countries, but perhaps less so than in the past decade.
The asset allocation of the nation – change is at hand
Asset allocation 2005 Asset allocation 2010
3%16%
10%
71%
4%
19%
11%
66%
Asset allocation 2015
5%
22%
12%
61%
Property
Cash
Public and Private Equity
BondsSource: Bank of Ireland Private Banking Limited
300 individuals with a net worth
in excess of €30 million within
the Irish economy and a further
2,700 with a net worth of between
€5 million and €30 million.
27,000 have a net worth of between
€1 million and €5 million.

34
ConclusionsThe duality of a high level of personal savings and strong disposable income growth is the bedrock of the
Irish wealth market. Personal disposable income doubled over the last 10 years and approximately €10
billion is saved on an annual basis at the moment. Both measures are forecast to exhibit some of the
highest growth rates in the OECD over the coming decade, with personal disposable income expected to
double and the personal savings ratio set to increase to 14% from an already high 10%.
At the end of 2005, we estimate that Ireland is the second wealthiest economy of eight leading
economies based on the stock of wealth on a per capita basis, having increased by 350% over the past
10-years. The Irish household balance sheet is very healthy and is forecast to remain so. We estimate that
households have gross assets of €796 billion at the end of 2005. With household debt of €115 billion,
this means that net assets are at a very robust €681 billion or 828% of disposable income. By 2010, we
expect that gross assets will grow to €1,064 billion and to €1,522 billion by 2015. Household debt is
expected to increase to €200 billion by 2010 and to €300 billion by 2015. This would then leave
household net assets standing at €864 billion by the end of the decade and at €1,222 billion by 2015.
While the overall health of the Irish household’s balance sheet is in good shape, the composition of the
balance sheet is a concern. The balance sheet is overweight in property, as it accounts for nearly 70% of
total assets. The corollary of holding the largest weight in property, is that Irish households have the
lowest weight invested in financial assets as a percentage of total assets. At the end of 2003, the weighting
stood at 25.7%; significantly below the European average of 42.3%.
As Ireland’s wealth matures, we forecast a shift in the composition of the asset base of Irish households.
We forecast that property will decline to 66% of total assets by 2010 and to 61% by 2015. Conversely
the weighting towards other assets will increase, rising to 34% by 2010 and to 39% by 2015.
We estimate that the asset base (excluding residential property) of the top 1% of the population is
approximately €86 billion. The above forecasts imply that this asset base of the top 1% of the
population will increase to €129 billion by 2010, a 50% rise on the 2005 level and to €214 billion by
2015, an increase of a further 67%.
One of the key differentiating characteristics between the wealth in Ireland and in many of our OECD peers
is its first generational nature. That is, the vast bulk of the wealth in Ireland has only been made in the last
10 to 20 years. By contrast, the wealth in many other first world economies is of a much older vintage.
We believe that the wealth market in Ireland is still in its embryonic stage and as the market matures so
will the demands of households and the supply of services. The rapid growth in wealth has specific
implications for the way the money is invested, the expectations for returns, the willingness to take risks
and issues of inheritance and philanthropy.


Appendix

38
Appendix IA1 Irish household assets – vast accumulationAt the end of 2005, the total amount of Irish household assets stood at €796 billion or 968% of
personal disposable income, while the household debt ratio stood at a far more modest 140% of
disposable income. Irish household assets increased by 350% over the last 10 years. If we exclude
residential property from the asset base, this still leaves households sitting on over €254 billion in assets,
with a significant portion concentrated in the hands of higher income cohorts. We estimate that the top
1% of the population holds 20% of the wealth and the top 5% of the population holds 40% of the
wealth. As mentioned previously, if the value of residential property is excluded the concentration of
wealth increases, with the top 1% owning one third of the assets (34%).
A1.1 The main stores of wealth – growth on all fronts even allowing for a sharpincrease in debt
There is no single source of data on Irish household wealth statistics and a multitude of sources have to
be used. Furthermore, some important asset items have to be estimated because of the lack of data. The
following lists the assets that are included in our analysis:
Financial assets
■ Deposits
• Bank deposits (including deposit-based trackers)
• Credit Union deposits
• Government savings schemes
■ Investment funds
• Unit trusts
• Unit linked
• Tracker bonds (insurance-based trackers)
• With profits
• SSIA components
• Other
■ Pension funds
■ Direct equity
Non-financial assets
■ Residential real estate
■ Commercial real estate
■ Business equity

39
On the liability side of the balance sheet, the following items are analysed:
Liabilities
■ Household mortgages
■ Other personal debt, including credit card debt
A1.2 Financial assets – the liquid componentFinancial assets are the relatively liquid component of household savings (defined above), and account for
€191 billion or approximately 24% of total assets. This proportion of wealth held in liquid assets is low
by international standards and reflects in part the Irish obsession with property and the decade long
property boom in the economy. Financial assets account for around 50% of total assets in the US, the
UK, Germany and France. The illiquidity of the wealth also reflects the fact that much of the wealth is
of a first generational nature and a relatively recent phenomenon.
Nevertheless, financial assets increased by 217% between 1995 and 2005, which equates to an
annualized rate of growth of 12.2%.
1995 1996 1997 1998 1999 2000 2001 2002 2003 2004 2005 2010(f)
2015(f)
€ m
illion
s
% P
DI
0
100000
200000
300000
400000
500000
150
100
50
200
250
300
Financial assets Financial assets % PDI (r.h.s.)
Stock of financial assets and as a % of personal disposable income
Irish household financial assets
One of the key assumptions underlying our forecasts is that financial assets will become a more
important part of household portfolios over the next decade. At the end of 2005, financial assets
accounted for 232% of personal disposable income, which we expect to increase to 260% of disposable
income by 2010 and to just under 300% by 2015. As a percent of total assets, financial assets should
increase from their current low level of 24%, to 27% by 2010 and to 33% by 2015.
Source: Bank of Ireland Private Banking Limited

40
A1.2.1 Deposits – the biggest component of Irish household financial assetsWe estimate that the total amount of household money sitting on deposit at the end of 2005 amounted
to a little over €80 billion or 42% of household financial assets. This €80 billion comprises of €63
billion in bank accounts, €11 billion in credit union accounts and €6 billion in government sponsored
savings schemes (excluding the SSIAs).
The level of household deposits increased by 200% over the last 10 years from €27 billion in 1995. The
flow of household deposits increased from €1.4 billion 10 years ago to an annual flow of €7 billion per
annum and approaching €10 billion by the end of 2005.
A number of important trends should be noted when analysing the deposit base in the Irish market over
the recent past:
1. Household deposits stood at nearly 100% of personal disposable income at the end of 2005.
This is significantly higher than the 10-year average of 83%. Consequently, there is vast scope for
alternative investments.
2. We expect that Irish households have the capacity to continue adding at least €6–7 billion in cash
savings per annum over the next five years, based on the personal savings rate assumptions and
forecasts already made. This would mean that household deposits would remain at around 100%
of disposable incomes by 2010.
The following chart illustrates the historical trend in household deposits:
We expect household deposits to be in the region of €110 billion by 2010 and to be over €175 billion
by the end of 2015. Deposits, though, would fall as a proportion of financial assets from 42% in 2005 to
35% in 2015.
1995 1996 1997 1998 1999 2000 2001 2002 2003 2004 2005 2010(f)
2015(f)
€ m
illion
s
% P
DI
Household deposits Deposits % PDI (r.h.s.)
0
50000
100000
150000
200000
60
40
80
100
120
Household deposits and as a % of personal disposable income
Irish household deposits
Source: The Central Bank of Ireland, the ESRI & Bank of Ireland Private Banking Limited

41
A1.2.2 Investment funds – indirect holdings of equities, bonds, property, cash and alternatives
We estimate that €27.7 billion was the stock of assets held in investment funds by Irish households at
the end of 2005. We define investment funds as unit trusts, unit-linked funds, tracker bonds (insurance-
based trackers), with-profits funds and SSIA equity-linked products. The growth in fund holdings tends
to be more erratic than most other forms of savings given the short-term volatile nature of the
underlying asset classes, such as equities, bonds and property.
Household investment funds as a percentage of disposable incomes experienced a marked decline
between 1999 and 2002, from 38% to a low of 25%. Since 2002 this ratio has gradually increased, and
stood at 34% of personal disposable income at the end of last year.
The annual flow of funds into investment products has been outpaced by the annual flow of money
entering the deposit base. In 2000, the flow of money into the investment fund market by households
was €2 billion, while the flow of cash into deposits stood at €4 billion. At the end of 2005, the flow of
money into investment funds was broadly unchanged at around €2 billion, while the flow into deposits
had increased to over €9.5 billion. As a point of information, the flow of money into Irish and UK
commercial property was around €1.1 billion in 2000 and this increased to €7 billion, the vast bulk of
which was made by private investors.4
There is scope for a sizeable increase in the flow of money into investment funds over the coming years.
The actual volume of cash savings, whether defined as actual household cash deposits or by the personal
savings ratio from the national accounts, has increased over the last five years, while investment volumes
have remained largely unchanged.
1995 1996 1997 1998 1999 2000 2001 2002 2003 2004 2005 2010(f)
2015(f)
€ m
illion
s
% P
DI
Investment funds Investment funds % PDI (r.h.s.)
0
20000
40000
60000
80000
100000
120000
20
0
30
40
50
60
70
80
Irish household investment funds and as a % of personal disposable income
Irish household investment fund holdings
4 The source of this number is CBRE’s Irish Investment Market View Q1’06. These flows are the total amount invested, that is,inclusive of gearing. The total spend amounted to over €9 billion.
Source: IAIM’s Personal Investment Survey (various years), the ESRI & Bank of Ireland Private Banking Limited

42
We expect a significant transformation in the flows of money being allocated to investment funds by Irish
households over the coming years. As a result, we expect that the value of investment funds will increase to
€57 billion by 2010 and to €106 billion by 2015. As a percentage of disposable income, these
investment funds are expected to increase from 34% in 2005 to 51% in 2010 and to 63% by 2015.
A1.2.3 Pensions – stock and coverageThe total amount of money held in pensions at the end of 2005 was €64 billion, or 78% of personal
disposable income. This is the aggregate of defined benefit (DB)5 and defined contribution (DC)
pensions. We estimate that of this €64 billion, defined contribution pensions account for approximately
€17.5 billion.6
While the outstanding value of pension assets has recovered fully from the equity bear market of 2000, 2001
and 2002, the level of assets as a percentage of personal disposable income is still below its 1999 peak of 96%
of disposable income, at only 78% at the end of 2005. There is both a necessity and an opportunity for strong
growth in pension flows over the coming years.
Consequently, we expect the value of pensions to grow by over 150% between 2005 and 2015. This
would see pension funds as a percentage of disposable income increase to 96% from its current low
levels. The growth and the ageing of the population will be the key factors driving the flows of money
into pension funds and it would be no surprise if these forecasts actually prove to be too conservative.
the total amount of money held in
pensions at the end of 2005 was €64
billion, or 78% of personal disposable
income. we expect the value of pensions
to grow by 150% between 2005 and 2015.
5 A contingent liability is the estimated size of the defined benefit pension deficits. While the overall defined pension deficit does notimpact on the current assets of the fund, it does raise questions about the sustainability of some defined pension funds over thelonger-term. It is difficult to quantify the size of the total deficit but Mercers last year estimated that the size of this deficit for the 10biggest companies in Ireland stood at €3.3 billion.
6 Based on work done by Life Strategies, the 2003 DC assets stood at €11.8 billion. Using the average managed balance fund as theperformance benchmark, which saw 9% growth in 2004, combined with estimated inflows of €1.1 billion in 2004, we arrive at ourestimate of €14 billion in outstanding DC assets at the end of 2004. For 2005, we assume another €1.1 billion flow plus aperformance return of 17% to arrive at our 2005 estimate. These estimates are quite crude as they do not take any explicit accountfor outflows that occurred over the last two years.

43
A1.2.4 Direct equity holdingsGiven that there are no official statistics for holdings of direct equities by households, the best we can do
is to approximate the current assets outstanding. We take a broad-brush approach and assume that 20%
of the market is held by Irish households. Based on this estimate, the value of direct equity holdings
stood at €19 billion at the end of 2005.
Using the above assumptions, the estimated €19 billion in direct equity holdings accounts for only 10%
of households’ financial assets and only 2% of financial and non-financial assets. In the US, for example,
household holdings of direct equity account for 27% of financial assets and for 10% of total assets.
Again, we expect direct equity holdings to increase over the next decade and to stand at €56 billion by
2015. This would be 34% of disposable income and account for 11% of households’ financial assets.
1995 1996 1997 1998 1999 2000 2001 2002 2003 2004 2005 2010(f)
2015(f)
€ m
illion
s
% P
DI
Pension assets Pension assets % PDI (r.h.s.)
0
50000
100000
150000
200000
40
20
0
60
80
100
Irish resident pension assets and as a % of personal disposable income
Irish pension assets
€ m
illion
s
% P
DI
1995 1996 1997 1998 1999 2000 2001 2002 2003 2004 2005 2010(f)
2015(f)
Direct equity Direct equity % PDI (r.h.s.)
0
10000
20000
30000
40000
50000
60000
10
0
15
20
25
30
35
Direct equity holding and as a % of personal disposable income
Household direct equity holdings
Source: IAPF annual survey, ESRI & Bank of Ireland Private Banking Limited
Source: Irish Stock Exchange & Bank of Ireland Private Banking Limited

44
A1.3 Non-financial assets – dominated by residential real estateThe composition of household non-financial assets includes residential property, commercial
real estate and the equity portion of privately owned (not publicly listed) businesses. Not surprisingly,
residential property dominates not just non-financial assets but the entire asset holding of Irish households.
A1.3.1 Residential property – the giant among giantsThe gross value of Irish residential property stood at €542 billion at the end of 2005. This estimate was
arrived at by multiplying the average price of second-hand houses by the stock of housing.7 At the end of
2005, there was €94 billion in residential mortgages outstanding, which means that Irish households
had €448 billion in housing equity.
€ m
illion
s
% P
DI
1995 1996 1997 1998 1999 2000 2001 2002 2003 2004 2005 2010(f)
2015(f)
0
100000
200000
300000
400000
500000
600000
700000
800000
900000
200
100
0
300
400
500
600
700
800
900
Residential housing stock and as a % of personal disposable income
Residential housing stock
7 The source of the data is from the Department of the Environment, Heritage and Local Government, where the stock of houses inIreland is multiplied by the average second house price in Ireland. In the stock of housing number, the Department accounts fordepreciation. The ESRI produced a lower estimate for the value of housing stock as they use a lower number for the stock of housingin Ireland and the permanent/tsb house price index as the price multiplier
irish residential property as a
perCentage of disposable income
stood at 659% at the end of 2005.
we expect this ratIO will decline
to 615% by 2010 and to 533% by 2015.
Source: Department of the Environment, Heritage and Local Government, and Bank of Ireland Private Banking Limited

45
Irish residential property as a percentage of disposable income stood at 659% at the end of 2005.
We believe that this is unsustainable and are factoring in a decline in residential property relative to
disposable income over the next 10 years. By 2010, the ratio is expected to have fallen to 615% and by
2015 it is expected to be 533%. This decline in relative importance can be achieved without a fall in
house prices. All that is necessary is that house prices will moderate over the next decade to achieve such
a result. The average growth in the gross value of residential property between 1996 and 2005 was 20%
(and 19.8% for the net value). The gross value for 2005 was €542 billion, an increase of 14% on 2004’s
estimate, while the net value increased to €447 billion. It is highly unlikely that this level of growth can
be sustained into the future especially on a net basis, as we would expect house prices to eventually moderate.
Implicit in our forecasts is that house price appreciation will moderate from low to mid single digit
growth rates. This should occur in line with a continued strong supply of housing of somewhere in the
region of 50,000 to 70,000 new houses per annum.
One trend that is becoming increasingly evident is the widening gap between the gross value and net
value of the residential housing stock. In 1995, the gross value exceeded the net value by 15% and by the
end of 2005 this value widened to 21%.
€ m
illion
s
1995 1996 1997 1998 1999 2000 2001 2002 2003 2004 2005
Gross value Net value
0
100000
200000
300000
400000
500000
600000
Gross and net values of the Irish residential housing stock
Gross and net values of housing stock
Source: Bank of Ireland Private Banking Limited

46
A1.3.2 Commercial property – an increasingly important componentCommercial property is becoming an increasingly important component of household balance sheets,
particularly at the upper end of the wealth spectrum. Unfortunately, there are no official estimates of the
size of the Irish commercial property market and therefore we have to use indirect methods of assessing
its size. One approach to take is that used by Prudential Real Estate Investors for estimating the size of
global commercial property markets.8 Using this approach, it is estimated that the size of the Irish
commercial market is somewhere in the region of €40 billion. We use this number and then assume that
Irish private investors hold 50% of the market, which works out at €20 billion. It should be noted that
this number excludes foreign property holdings. These numbers, however, are very tentative and should
be used with caution. The following chart illustrates our estimates of the evolution of the personal
sector’s holding of commercial property for the last 10 years and our forecasts for 2010 and 2015:
As a sense check on these numbers, the estimated €20 billion of commercial property assets amounts to
24% of personal disposable income and 8% of total household assets, excluding residential property.
These ratios appear reasonable and give some comfort in using the above estimates. In fact, if anything
they seem on the conservative side.
By 2010, we expect commercial property held by households to stand at €27 billion and to grow to €36
billion by 2015. We make the assumption that as a percentage of disposable income the overall ratio will
remain broadly unchanged over the next decade. We are of the view that commercial property values will
grow in line with the rate of growth of disposable income. This would be a very solid achievement given
the very strong boom in commercial property prices that has already occurred.
€ m
illion
s
% P
DI
1995 1996 1997 1998 1999 2000 2001 2002 2003 2004 2005 2010(f)
2015(f)
Commercial property stock Commercial property % PDI (r.h.s.)
0
5000
10000
15000
20000
25000
30000
35000
40000
10
0
15
20
25
Commercial property stock and as a % of personal disposable income
Personal sector’s commercial property holdings
8 The following formula is the one used by Prudential Real Estate to provide an approximation of the size of a country’s commercialreal estate market:
Real Estate for Country i = GDPi * US Real Estate to GDP Ratio * (GDHi / GDHUS)1/3
where real estate is the value of higher-grade commercial real estate; GDPi and GDHi are, respectively, GDP and GDP per capita forcountry i, measured by GDP per capita. However, we use GNP rather than GDP and also we use a slightly lower weighting factor toarrive at our €40 billion market cap estimate.
Source: Bank of Ireland Private Banking Limited

47
The flows into commercial real estate have also accelerated over recent years, with the UK benefiting themost. Last year, it is estimated that approximately €9 billion was invested in commercial real estate bothhere and abroad, the vast bulk of which was by private investors.
In 2000, the Irish investment spend in domestic commercial property was €450 million and rose to€1.5 billion by the end of last year. In the UK, total Irish investments grew from €700 million to anestimated €7 billion by the end of 2005. All these values include gearing and are for private andinstitutional investors.
A1.3.3 Business equity in household balance sheetsAgain there is no official data for the total value of privately owned businesses in the Irish economy.Consequently, we have to rely on our own estimates. We take two approaches:
1. International evidence would suggest that 15% of total assets, excluding residential property, areaccounted for by business equity. At the end of 2005, this approach produced an estimate of some€31 billion. Given the outsized gains residential property has made over the last decade and thenatural underweight households have allocated to other assets, we feel that this numberunderestimates the importance of business equity as an asset class. So some upward adjustment seemswarranted in our minds.
2. As an alternative method, we used Revenue data on corporation tax receipts for 2003 andextrapolated them to 2005 estimates. We assumed that all companies with net trading income up to€10 million are privately owned. We then aggregated up the total level of profits of these companiesand multiplied this number by a price earnings ratio of 6 to get an approximate market cap. Thisproduces an estimate of €73 billion. We assume the average balance sheet has a 60%/40%equity/debt split and the result in an estimate of €43 billion. We use this number for our analysis.
In nominal terms, we anticipate that business equity will increase to €64 billion by 2010 and to €96billion by 2015. As a percentage of disposable income, business equity stood at 52% at the end of 2005,and we expect this to increase in importance over the next decade to stand at 57%.
The following chart illustrates our historical estimates for households’ share of business equity and againour forecasts for 2010 and 2015:
€ m
illion
s
% P
DI
1995 1996 1997 1998 1999 2000 2001 2002 2003 2004 2010(f)
2015(f)
Business equity Business equity % PDI (r.h.s.)
0
20000
40000
60000
80000
100000
20
0
30
40
50
60
Business equity and as a % of personal disposable income
Households’ share of privately held business equity
Source: Bank of Ireland Private Banking Limited

48
A1.4 Households’ liabilities – the other side of the balance sheetHouseholds’ indebtedness approximately doubled during the 1990s and is now over 140% of personal
disposable income and is forecast to increase to 160% of personal disposable incomes within three years.9
In fact, we believe that household debt as a percentage of disposable income will increase to around
180% by 2010.
The value of outstanding personal sector credit has increased by almost six times since 1995 and stood at
€115 billion at the end of 2005. There has been a more modest growth in disposable income,
approximately two and a half times, during the same period. Personal sector credit was 71% of GDP at
the end of 2005. The corresponding estimate for the Euroarea is approximately 55%.
€ m
illion
s
% P
DI
1995 1996 1997 1998 1999 2000 2001 2002 2003 2004 2005 2010(f)
2015(f)
Household dept Household dept % PDI (r.h.s.)
0
50000
100000
150000
200000
250000
300000
0
50
100
150
200
Household debt and as a % of personal disposable income
Household debt
Source: The Central Bank of Ireland and Bank of Ireland Private Banking Limited
9 Goodbody Stockbrokers.
... we believe that household debt
as a perCentage of disposable
income will increase to around
180% by 2010.

49
The vast bulk of personal sector credit in Ireland is extended for housing-related purposes. Eighty-two
per cent of personal debt is housing related with a further 16 % non-housing related debt and two per
cent credit card debt.
Research has shown that the increase in housing wealth has not been used to fund personal
consumption.12 In essence, the growth in real incomes caused both the increase in consumption and house
prices and that the causation ran in one direction. Again, anecdotal evidence would suggest that the vast
bulk of any equity withdrawal that has occurred in the Irish market has been used for residential
investment purposes (e.g. providing house deposits for children, extensions to existing properties, etc.)
rather than for personal consumption purposes. Unfortunately, data are not published in Ireland that
identify the use of mortgage equity withdrawal and therefore it is difficult to be precise about its influence.
12 Consumption and House Prices in Ireland (2002) by Hogan and O’Sullivan.
...the vast bulk of equity
withdrawal that has occurred in
the irish market had been used
for residential investment purposes

50
Disclaimer
Bank of Ireland Private Banking Limited is authorised by the
Financial Regulator under the Investment Intermediaries Act 1995.

51

