the wealth of nations · web viewthe wealth of nations: a study of political institutions and...
TRANSCRIPT

Kathryn GotcherKyle MerinoGregory Moran
The Wealth of Nations: A Study of Political Institutions and Economic
Growth

Table of ContentsManagement Summary...............................................................................................................................1
Background and Description of Problem.....................................................................................................2
Analysis of the Situation..............................................................................................................................4
Technical Descriptions of Modeling Methods.............................................................................................7
Clustering Self-Organizing Maps..............................................................................................................7
Data Envelopment Analysis...................................................................................................................10
Analysis and Managerial Interpretation of Data........................................................................................16
Clustering Self Organizing Maps............................................................................................................16
Data Envelopment Analysis...................................................................................................................18
Comparison of DEA and Clustering Models...........................................................................................19
Multiple Regression Analysis.................................................................................................................21
Conclusion and Critique.............................................................................................................................25
Works Cited...............................................................................................................................................27
Appendix A: Self Organizing Map Software Documentation.....................................................................29
Appendix B: Clustering Data Set................................................................................................................31
Appendix C: DEA Pioneer Documentation.................................................................................................35
Appendix D: DEA Input Chart.....................................................................................................................62
Appendix E: DEA Model with 8 Inputs.......................................................................................................65
Appendix F: DEA Model Output.................................................................................................................71
Appendix G: DEA Ranking Model Inputs....................................................................................................82
Appendix H: DEA Ranking Model Output..................................................................................................89
Appendix I: Clusters of Countries..............................................................................................................95
Appendix J: Comparison Analysis Graphs for Clusters...............................................................................97
Appendix K: DEA Countries and Levels....................................................................................................103
Appendix L: DEA Country Ranking...........................................................................................................107
Appendix M: Multiple Regression Analysis Graphs.................................................................................110
Appendix N: Correlational Values of Modeling Variables........................................................................111
Appendix O: Scatter Plot Comparison Graphs for Modeling Variables vs. GDP per Capita......................112
Management Summary
In the present global economic state, finding ways to improve a nation’s economy is
vital to government leaders. The problem presented to us was to study various political
institutions and policies of the world’s nations and determine which measures, if any, are
accurate predictors of economic health and growth. In particular, we were interested in the
effect that measures of free trade would have upon the economy.
We used two modeling methods, Neural Network Clustering and Data Envelopment
Analysis to classify and study 126 of the world’s nations. Specifically self organizing maps were
used for clustering. We used eight individual data variables in our models and analyzed these
eight variables with multiple regression to determine statistical significance to the models.
Based on our findings, we believe that it is possible to reasonably predict economic
health based on variables of political institutions. In particular, we discovered that, of the eight
variables that we studied, perceived corruption and human development measures are vital to
stimulating the health of the economy. In order for economies to grow, it seems that corruption
must be kept down within the system and citizens must be provided with opportunities to be
educated, live long lives, and have good jobs. We also discovered a substantial link between a
strong legal system and these two necessary growth variables. We are unsure of the causal link
between the legal systems and corruption and human development, and this will require
further study. However, it does seem that one cannot exist without the other.
3

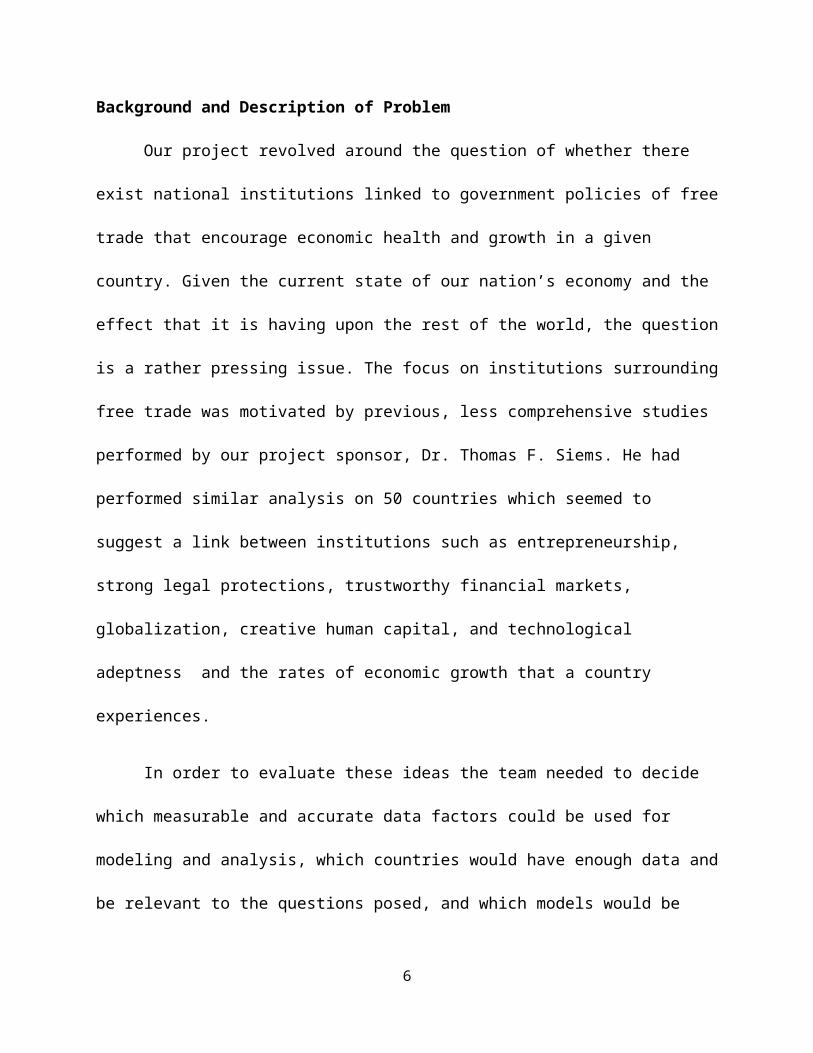
Background and Description of Problem
Our project revolved around the question of whether there exist national institutions
linked to government policies of free trade that encourage economic health and growth in a
given country. Given the current state of our nation’s economy and the effect that it is having
upon the rest of the world, the question is a rather pressing issue. The focus on institutions
surrounding free trade was motivated by previous, less comprehensive studies performed by
our project sponsor, Dr. Thomas F. Siems. He had performed similar analysis on 50 countries
which seemed to suggest a link between institutions such as entrepreneurship, strong legal
protections, trustworthy financial markets, globalization, creative human capital, and
technological adeptness and the rates of economic growth that a country experiences.
In order to evaluate these ideas the team needed to decide which measurable and
accurate data factors could be used for modeling and analysis, which countries would have
enough data and be relevant to the questions posed, and which models would be best suited
for the questions that we asked. The specific questions we addressed were:
1. Could we reasonably determine factors that determine the economic health of a
country?
2. Are there rational groups that our countries could be divided into in terms of economic
health?
3. Which factors weigh most heavily in determining the division of the groups of countries?
4. Are the results statistically significant?
4

This project differs from the others in our class in that the results can broadly affect
government officials in any country in the world. It is not narrowly defined to just one company
or organization. If our hypothesis proves to be true, the results would be extremely relevant to
government policies and the future health of the global economy.
5
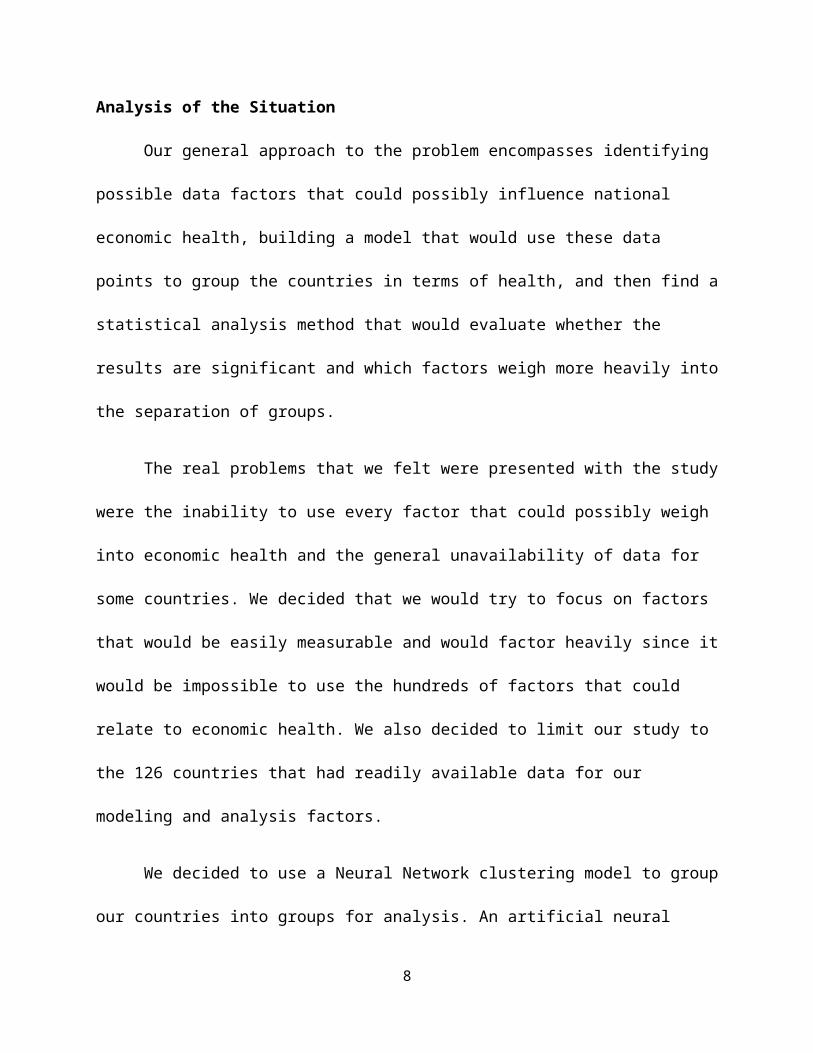
Analysis of the Situation
Our general approach to the problem encompasses identifying possible data factors that
could possibly influence national economic health, building a model that would use these data
points to group the countries in terms of health, and then find a statistical analysis method that
would evaluate whether the results are significant and which factors weigh more heavily into
the separation of groups.
The real problems that we felt were presented with the study were the inability to use
every factor that could possibly weigh into economic health and the general unavailability of
data for some countries. We decided that we would try to focus on factors that would be easily
measurable and would factor heavily since it would be impossible to use the hundreds of
factors that could relate to economic health. We also decided to limit our study to the 126
countries that had readily available data for our modeling and analysis factors.
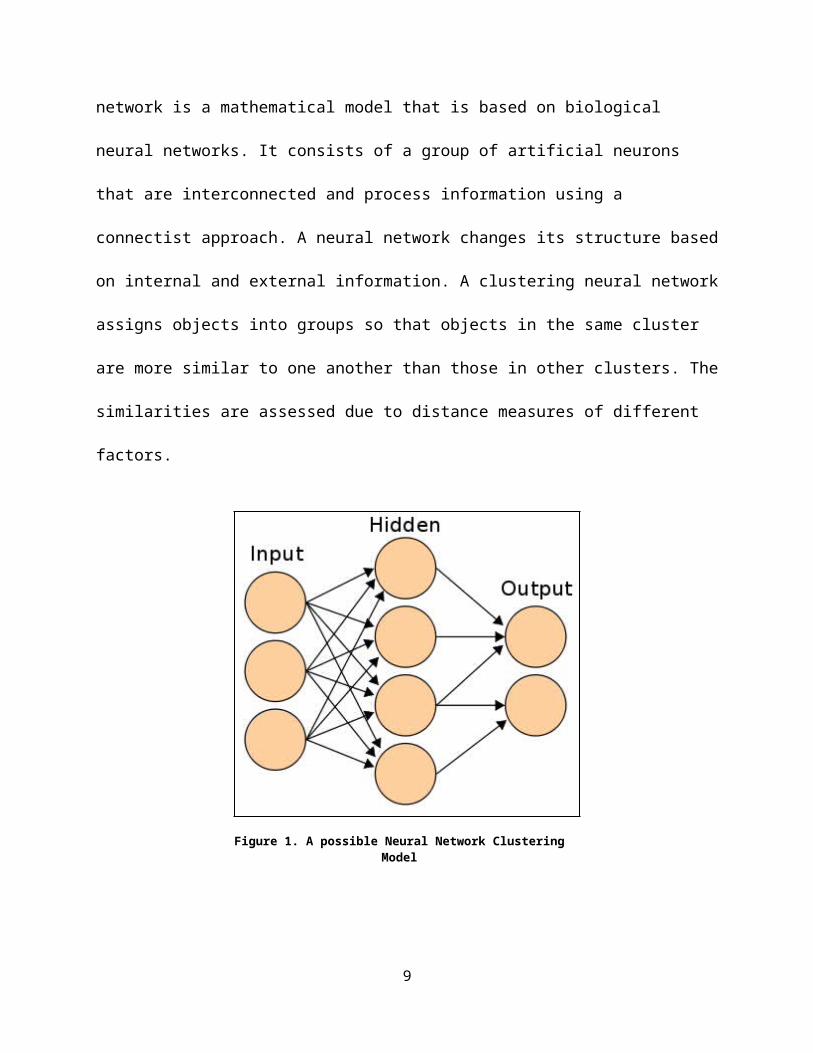
We decided to use a Neural Network clustering model to group our countries into
groups for analysis. An artificial neural network is a mathematical model that is based on
biological neural networks. It consists of a group of artificial neurons that are interconnected
and process information using a connectist approach. A neural network changes its structure
based on internal and external information. A clustering neural network assigns objects into
groups so that objects in the same cluster are more similar to one another than those in other
clusters. The similarities are assessed due to distance measures of different factors.
6

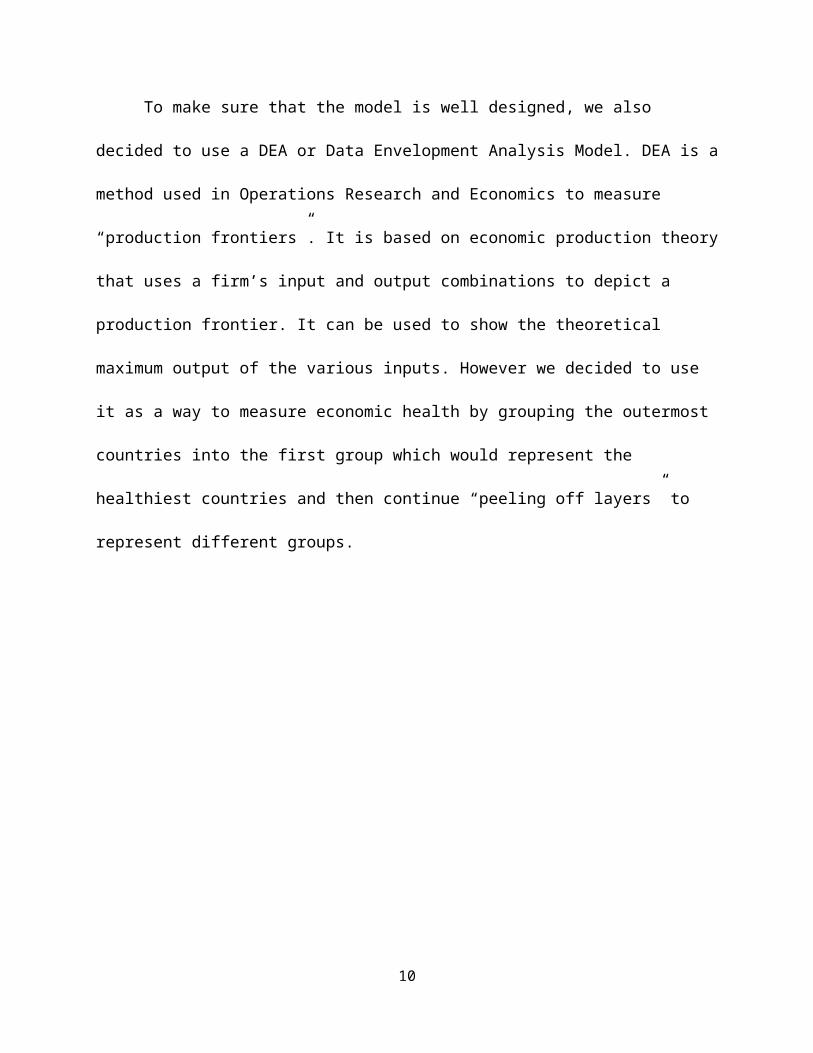
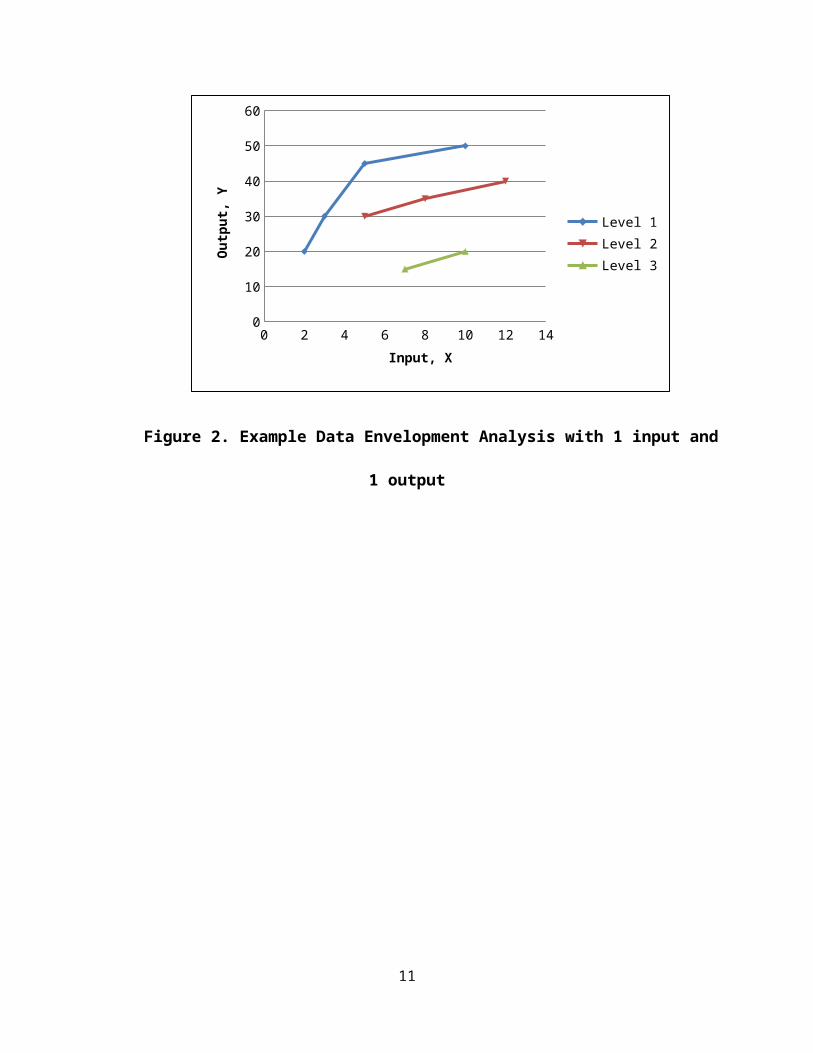
To make sure that the model is well designed, we also decided to use a DEA or Data
Envelopment Analysis Model. DEA is a method used in Operations Research and Economics to
measure “production frontiers”. It is based on economic production theory that uses a firm’s
input and output combinations to depict a production frontier. It can be used to show the
theoretical maximum output of the various inputs. However we decided to use it as a way to
measure economic health by grouping the outermost countries into the first group which would
represent the healthiest countries and then continue “peeling off layers” to represent different
groups.
7
Figure 1. A possible Neural Network Clustering Model
0 2 4 6 8 10 12 140
10
20
30
40
50
60
Level 1Level 2Level 3
Input, X
Out
put,
Y
Figure 2. Example Data Envelopment Analysis with 1 input and 1 output
8
Technical Descriptions of Modeling Methods
Clustering Self-Organizing Maps
As previously discussed in the Analysis section, the decision was made that a neural
network clustering model would be used to separate the countries into groups that could be
classified according to economic health. A self-organizing map was presented as the best
option.
Self-organizing maps are a type of unsupervised neural network developed by a Finnish
scientist Nuevo Kohonen. Self-organizing maps (hereafter referred to as SOMs) do not adapt to
a given desired output by the user, but rather adapt to the inputs alone.
Figure 3. Simplified Self-Organizing Map Model
This diagram gives a very simple depiction. The input data vectors are placed within the
two-dimensional array based on relative distance. Once the inputs are placed, the output area
can be divided into equal sections that represent the individual clusters.
SOMs consist of components called neurons or nodes that are associated with a weight
vector and a position in a rectangular grid. The nodes are initially regularly spaced in the grid.
During the training phase of the algorithm, data vectors are individually fed into the network
9
and their relative distance to the weight vectors is computed. The neuron associated with the
closest weight vector is called the Best Matching Unit. This neuron is then adjusted towards the
input vector with the update formula of:
Wv(t+1)=Wv(t) + Ω(v,t)α(t)(D(t)-Wv(t))
where α(t) is a decreasing learning coefficient, D(t) is the input vector, and Ω(v,t) is a function
dependent on the lattice or neighborhood distance between the Best Matching Unit and the
neuron v.
This process is repeated for a number of cycles selected by the user and when finished
the algorithm will move on to the actual mapping. During this phase a winning neuron will be
selected as the neuron whose weight vector lies closest to the input vector.
Figure 4. Map of Clustering Neurons
We used an excel-based program to model our clusters (See Appendix A). The model
included eight different variables for 126 countries, or observations (See Appendix B). We chose
10
n, or the square root of the number of neurons in the map, to be four so that there would be 16
neurons in our map. After playing with the number of clusters we selected the number of
training cycles to be 500. The learning parameter, α, had a start value of 0.92 which
exponentially decreased through the algorithm to an ending value of 0.1. The software used a
Gaussian function for the Ω neighborhood function with a value of σ that began at 50% and
ended at 5%. A Gaussian function is developed by applying an exponential function to a
quadratic function and provides a normal distribution on a bell curve. During modeling the α, σ,
and number of training cycles were varied in different combinations to give us the number of
clusters that were needed. To perform the analysis necessary to validate our hypothesis, we
needed approximately three to four clusters; some combinations of parameters gave too few
and some gave too many.
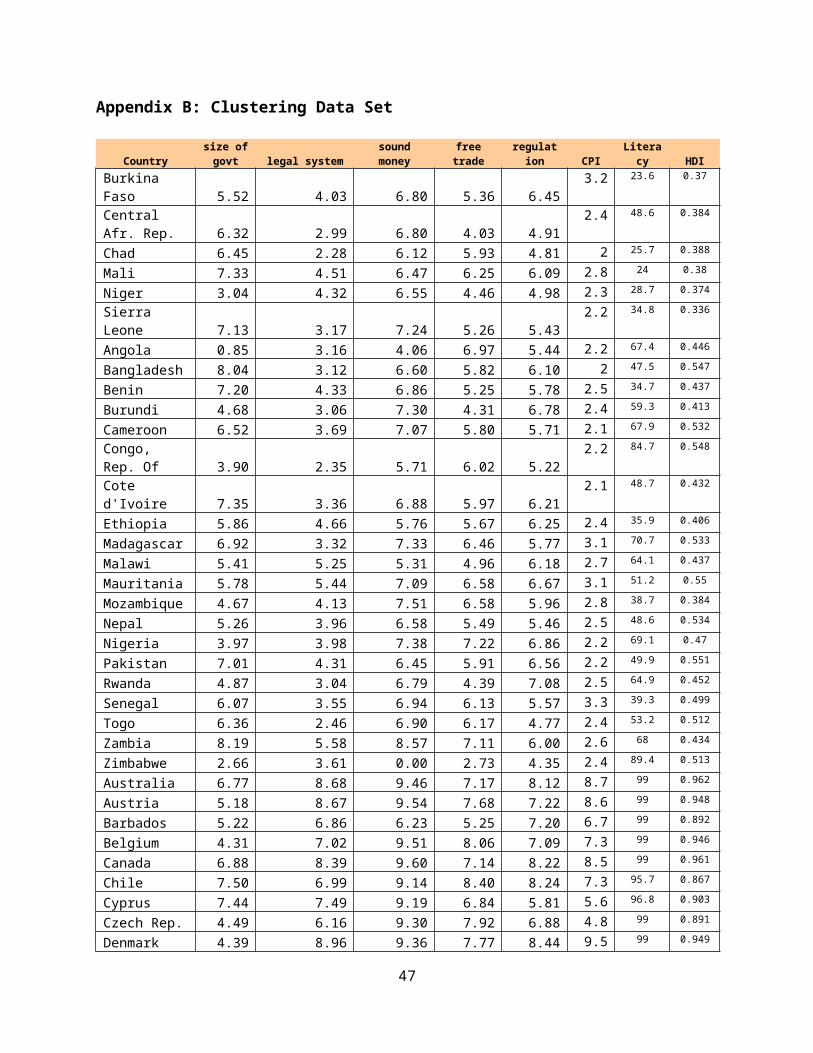
The size of government variable measures size and scope of government control over
the economy while the legal system variable tracks the strength of the legal system in
protecting individual rights and property. The access to sound money measure follows access to
stable currency as a means of exchange, and the free trade data measures policies promoting
fewer restrictions on international trade. The regulation variable surveys government
regulation of privately owned businesses, the Corruption Perceptions Index is an inverse
measure of corruption of government officials, and literacy measures the proportion of a
population that can read and write. The Human Development Index weighs factors
representing quality of life for citizens.
All sources of data were taken from 2006 historical data. No theoretical values were
assumed in the data set and no simplifying assumptions were made. Data to measure the size
11

of government, legal structure and property rights, access to sound money, freedom to trade
internationally, and regulation of business were taken from data for the Fraser Institute. The
information for the Corruption Index was obtained from Transparency International, and the
measures of literacy and Human Development Index were taken from data derived from
research by the United Nations.
Data Envelopment Analysis
Data Envelopment Analysis (DEA) is a method for determining the relative efficiency of a
Decision Making Unit (DMU) by determining the relationship between inputs and outputs. A
DMU can be any entity that makes decisions about inputs with the goal of influencing outputs.
Common DMUs include firms in the same industry, stores owned by a chain retailer, or in the
case of this study, countries.
Unlike regression methods, DEA is not concerned with the central tendencies of a
population. Instead, the most efficient DMUs are identified, and other DMUs are compared to
them. DEA can run through several iterations. For each iteration, a subset of the DMUs is
selected as most efficient. These DMUs are then removed from the analysis, and another
iteration begins. This process continues until there are no DMU’s left.
For this particular study, DEA is an abstract method of analysis. The inputs in this case
do not represent quantities of resources used to produce final products. Instead, the inputs are
ratings, on a scale of zero to ten, representing the goodness of certain policies of a country
relative to those policies of other countries. The output in this study, GDP per capita, is more
12

closely related to the actual quantity of finished product. Thus, better policies can be viewed as
a smaller number of inputs, and higher GDP per capita represents higher output.
DEA analysis identifies the most efficient DMUs as those with the highest ratio of
outputs to inputs. Thus, for a given output, lower input is better. For a given input, higher
output is better. Many of the ratings that are used as inputs in this study define ten as best and
0 as worst. In order to make these ratings consistent with the DEA model, they were replaced
with a value equal to ten minus the original rating, so that lower ratings would indicate better
policies.
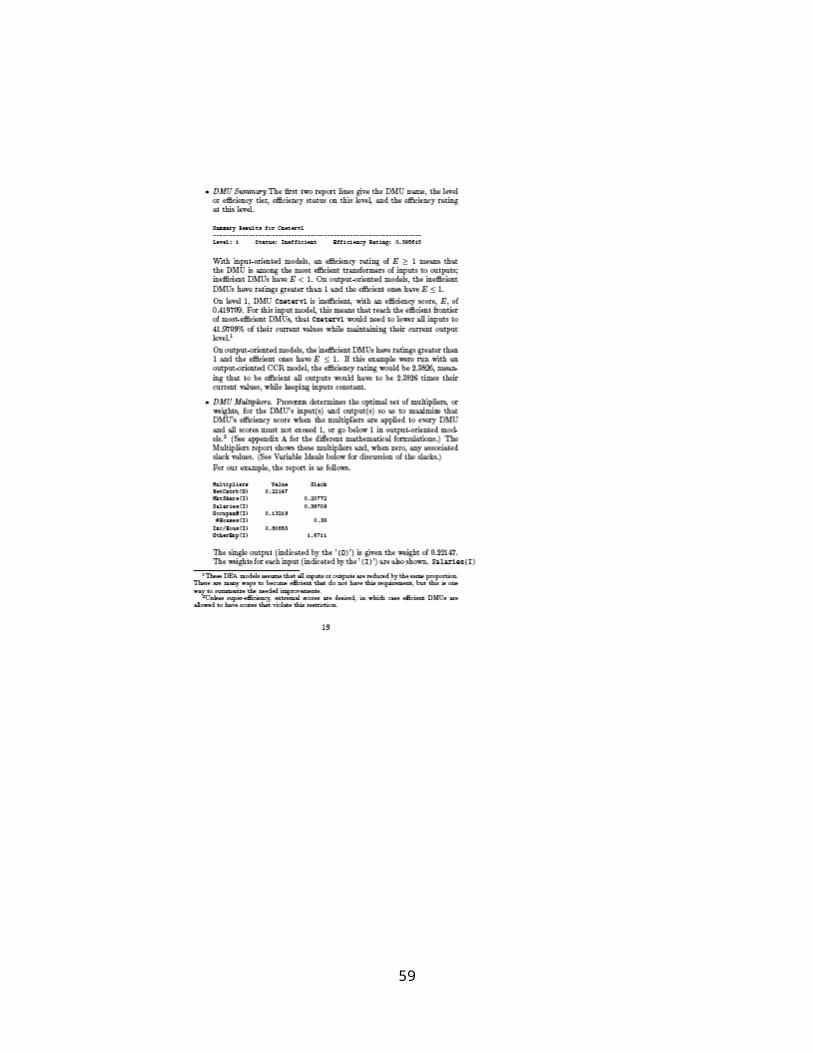
Formal Mathematical Statement
Maximize: Ek = (i wi yik ) / (j vj xjk )
subject to: (i wi yip ) / (j vj xjp ) <= 1, for each DMU p
E = efficiency rating
wi = weight of output i, > 0
yi = value of output i
vj = weight of input j, > 0
xj = rating of input j
i = 1,2,…,m; m = number of outputs in model
j = 1,2,…,q; q = number of inputs in model
For each DMU, an efficiency rating is calculated using the above formula. The output for
this model is the measure of economic health, GDP per capita. The inputs are the eight policy
ratings outlined below. Countries are placed into levels of economic health or ranked
13

individually based on their efficiency score relative to those of other countries. For a more
comprehensive mathematical statement, see Appendix C.
The DEA model used in this study consists of eight input variables: size of government
(sizGov), legal system (legSys), sound money (sound$), free trade (freeTr), regulation (reg),
Corruption Perceptions Index (CPI), literacy (lit), Human Development Index (humDev). All input
variables are ratings from zero (best) to ten (worst). Many of the input variables had to be
adjusted to fit this scale. Literacy was originally on a scale of zero to one hundred, so we divided
it by ten. Human Development was originally on a scale of zero to one, so we multiplied it by
ten. The following variables were originally on scales of zero (worst) to ten (best): legSys,
sound$, freeTr, reg, CPI, lit, humDev. These variables were adjusted by taking the difference of
ten and the original value of the variable. To see a list of countries and their input and output
values, see Appendix D.
The DEA model used in this study consists of one output variable, GDP per capita
(GDPcap). Unlike the inputs, the actual value of GDP per capita is used instead of a rating. No
special adjustments were made to these values. GDP per capita measures average income in a
country , and in this model, GDP per capita is measured in constant 2000 USD.
This model consists of 126 DMUs, each representing a different country. Each country
makes decisions in the form policies, which are represented by the input variables. These
decisions affect measures of economic health, which is represented by the output variable.
Constraints in DEA are used as bounds to the weights that can be assigned to separate
input and output variables in determining the total input and output values for each DMU. DEA
14
assigns weights to input and output variables in order to give each DMU the highest efficiency
possible. To avoid assigning unreasonable weights, the following constraint is used in this
model: each input variable may only carry a weight less than or equal to twenty percent of the
total input value.
vi / ( v1 + v2 + v3 + v4 + v5 + v6 + v7 + v8 ) <= 0.2; for all i = 1 – 8
For use in the model, this constraint must be rewritten. An example follows:
0.8v1 - 0.2v2 - 0.2v3 - 0.2v4 - 0.2v5 - 0.2v6 - 0.2v7 -0.2v8 <= 0
To see how these constraints are entered into the model, see Appendix E. An extra zero is
entered in place of the output variable to fill all fields.
Since there is only one output in this model, no constraint is placed on the weight that
output carries relative to the total output value. This output carries a weight of 100 percent.
DEA was run using the stated inputs, outputs, DMUs, and constraints in order to
establish levels of efficiency and indentify the countries at each level. The following settings
were used while running the model: Model set to BCC, Hierarchical Decomposition checked,
Use Defaults checked, Orientation set to Input, Scaling set to Geometric Mean, Extremal
unchecked, Levels set to fifteen. For information about these settings, see Appendix C. The
model was run with these settings to obtain a set of up to 15 levels with corresponding
countries for each level. See Appendix E for input and Appendix F for output of model.
DEA was not only useful for establishing levels of efficiency and identifying
corresponding countries, but also for ranking countries on an individual basis. Every time DEA is
15

run, each DMU that is not on the most efficient level is assessed a value representing its
distance from the efficient frontier. In order to rank countries individually, a set of hypothetical,
extremely efficient countries was introduced to the model. A list of those countries and their
input and output values follows (name – inputs; output):
Dummy1 – 0.1, 0.5, 0.5, 0.5, 0.5, 0.5, 0.5, 0.5; 40000
Dummy2 – 0.5, 0.1, 0.5, 0.5, 0.5, 0.5, 0.5, 0.5; 40000
Dummy3 – 0.5, 0.5, 0.1, 0.5, 0.5, 0.5, 0.5, 0.5; 40000
Dummy4 – 0.5, 0.5, 0.5, 0.1, 0.5, 0.5, 0.5, 0.5; 40000
Dummy5 – 0.5, 0.5, 0.5, 0.5, 0.1, 0.5, 0.5, 0.5; 40000
Dummy6 – 0.5, 0.5, 0.5, 0.5, 0.5, 0.1, 0.5, 0.5; 40000
Dummy7 – 0.5, 0.5, 0.5, 0.5, 0.5, 0.5, 0.1, 0.5; 40000
Dummy8 – 0.5, 0.5, 0.5, 0.5, 0.5, 0.5, 0.5, 0.1; 40000
The model was run to establish only a single, most efficient level. This level consisted of the
hypothetical countries, and all real countries were assessed values representing their distance
from this level. These values were then used to rank the real countries individually. Countries
with higher values were closer to the efficient level, so they were ranked higher. See Appendix
G for input and Appendix H for output of model.
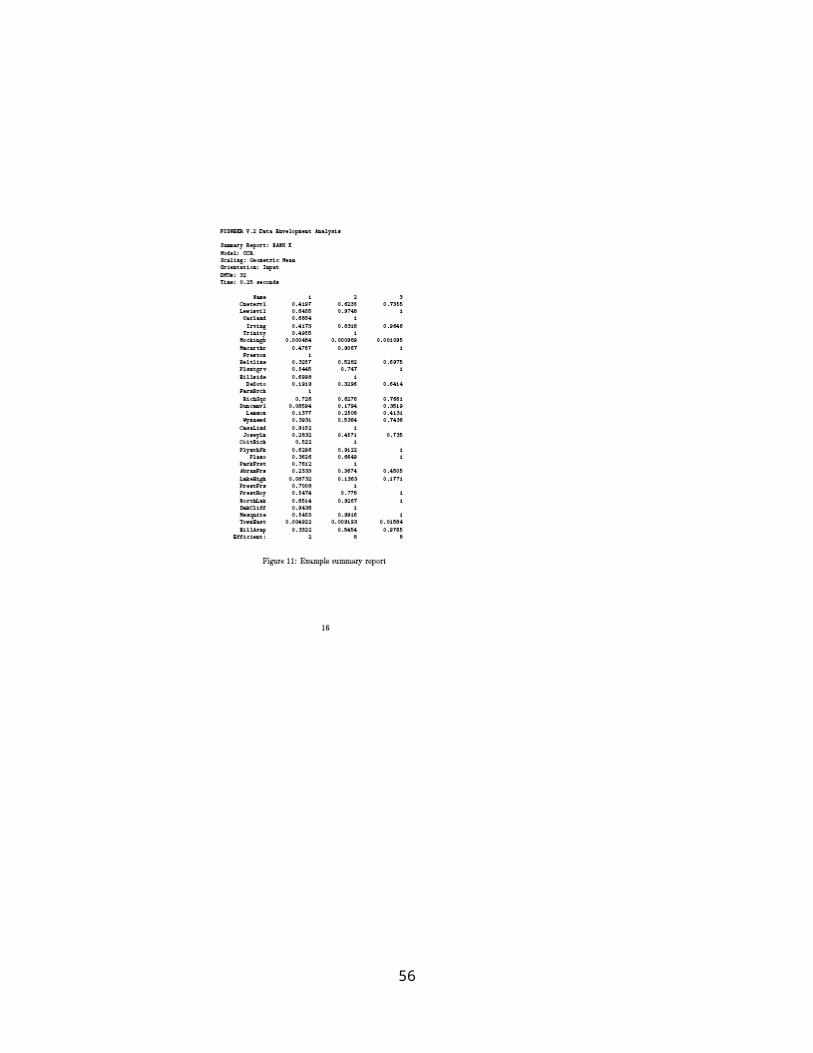
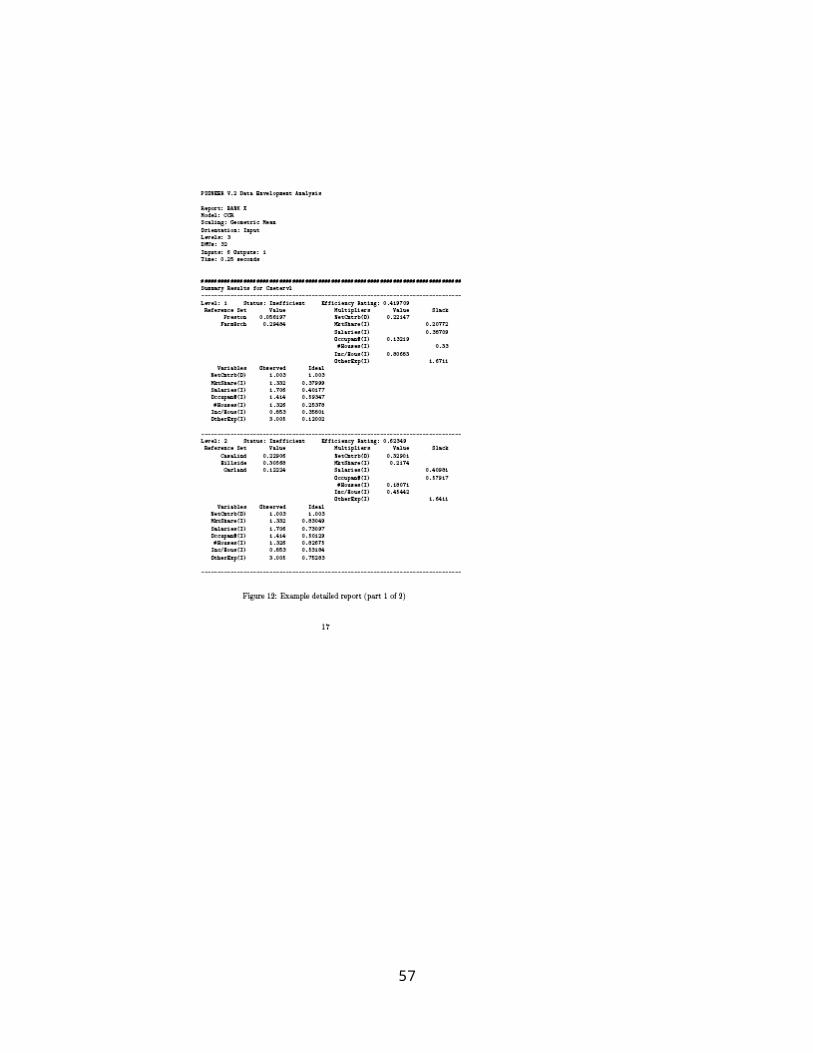
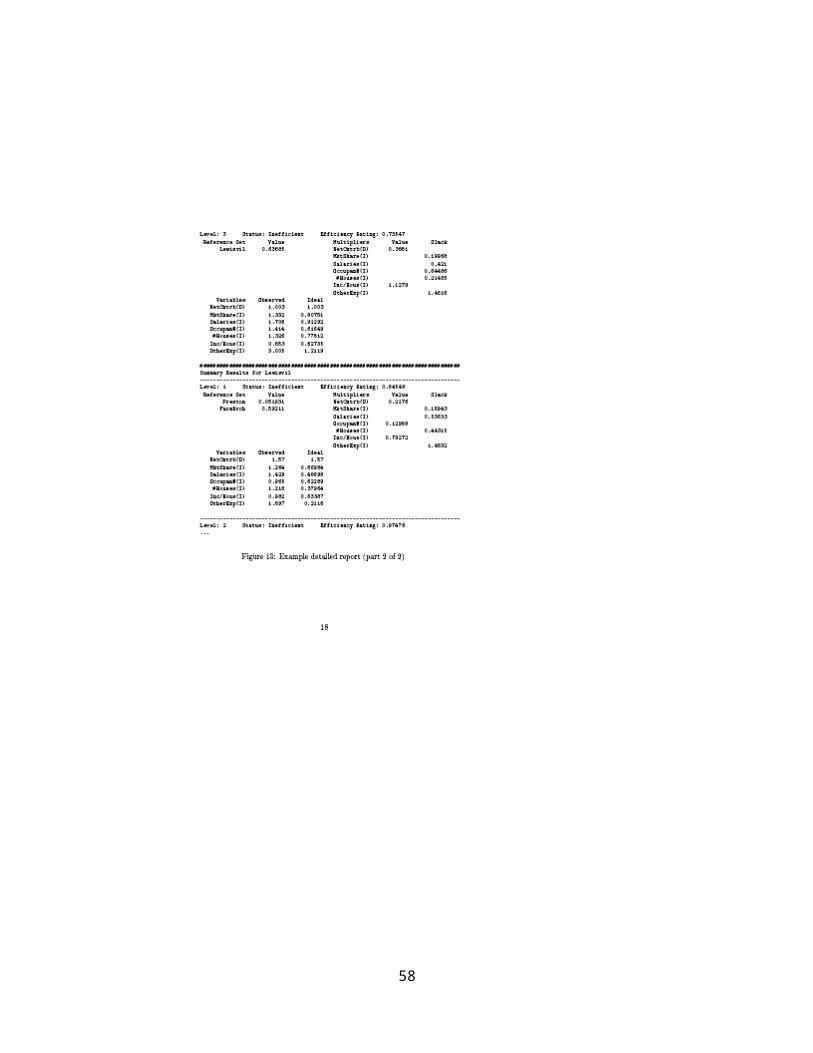
A program called PIONEER, Version 2.0, developed by Richard Barr and Thomas
McCloud, was used to perform DEA. It is a free, non-commercial DEA software tool. The
program was run on a Windows platform. Input files for the model must be in text form, and
16

the output is also viewed in text form. The program uses the Hierarchical Decomposition
(HDEA) algorithm and the Tiered DEA (TDEA) procedure.
17

Analysis and Managerial Interpretation of Data
Clustering Self Organizing Maps
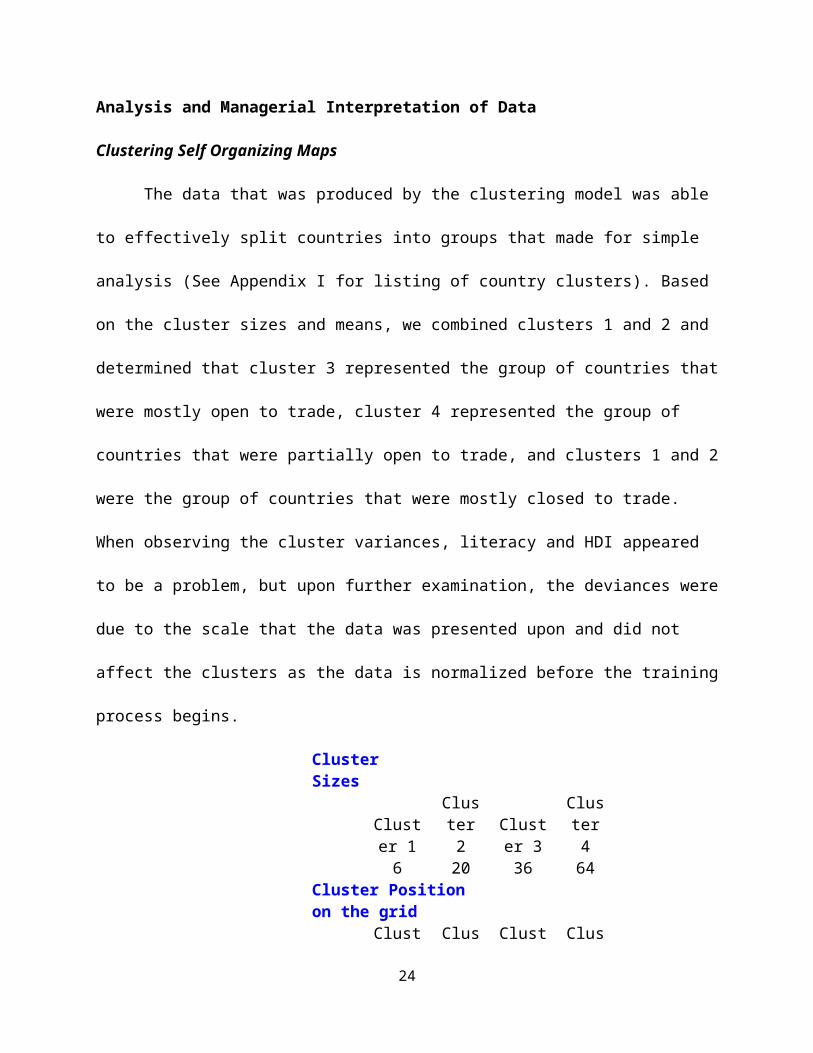
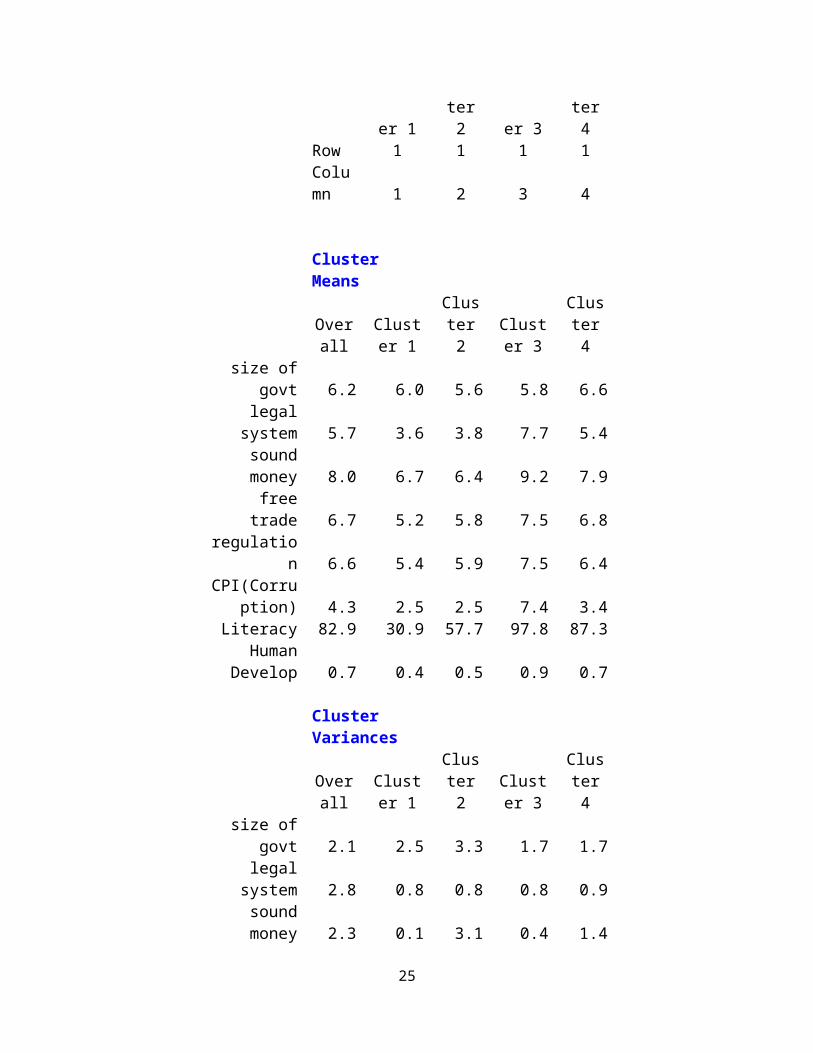
The data that was produced by the clustering model was able to effectively split
countries into groups that made for simple analysis (See Appendix I for listing of country
clusters). Based on the cluster sizes and means, we combined clusters 1 and 2 and determined
that cluster 3 represented the group of countries that were mostly open to trade, cluster 4
represented the group of countries that were partially open to trade, and clusters 1 and 2 were
the group of countries that were mostly closed to trade. When observing the cluster variances,
literacy and HDI appeared to be a problem, but upon further examination, the deviances were
due to the scale that the data was presented upon and did not affect the clusters as the data is
normalized before the training process begins.
Cluster SizesCluster
1Cluste
r 2Cluster
3Cluste
r 46 20 36 64
Cluster Position on the grid
Cluster 1
Cluster 2
Cluster 3
Cluster 4
Row 1 1 1 1Column 1 2 3 4
Cluster MeansOveral
lCluster
1Cluste
r 2Cluster
3Cluste
r 4size of govt 6.2 6.0 5.6 5.8 6.6
legal system 5.7 3.6 3.8 7.7 5.4sound money 8.0 6.7 6.4 9.2 7.9
free trade 6.7 5.2 5.8 7.5 6.8regulation 6.6 5.4 5.9 7.5 6.4
CPI(Corruptio 4.3 2.5 2.5 7.4 3.4
18

n)Literacy 82.9 30.9 57.7 97.8 87.3Human
Develop 0.7 0.4 0.5 0.9 0.7
Cluster VariancesOveral
lCluster
1Cluste
r 2Cluster
3Cluste
r 4size of govt 2.1 2.5 3.3 1.7 1.7
legal system 2.8 0.8 0.8 0.8 0.9sound money 2.3 0.1 3.1 0.4 1.4
free trade 1.0 0.7 1.2 0.6 0.3regulation 1.0 0.5 0.5 0.5 0.7
CPI(Corruption) 5.1 0.2 0.1 2.6 0.9
Literacy 412.4 92.3 238.3 8.5 128.5Human
Develop 0.0 0.0 0.0 0.0 0.0
Table 1 Clustering Model Output
Before we began comparing the clusters to other measures of data, we performed a
“sanity check” on the clusters. When we discussed the different countries and the groups that
they fell into, they seemed to make sense based on our limited economic knowledge. There
were some outliers presented that either fell into a lower group than expected like China, or
countries like Israel that ended up in the mostly open group. We then compared the clusters on
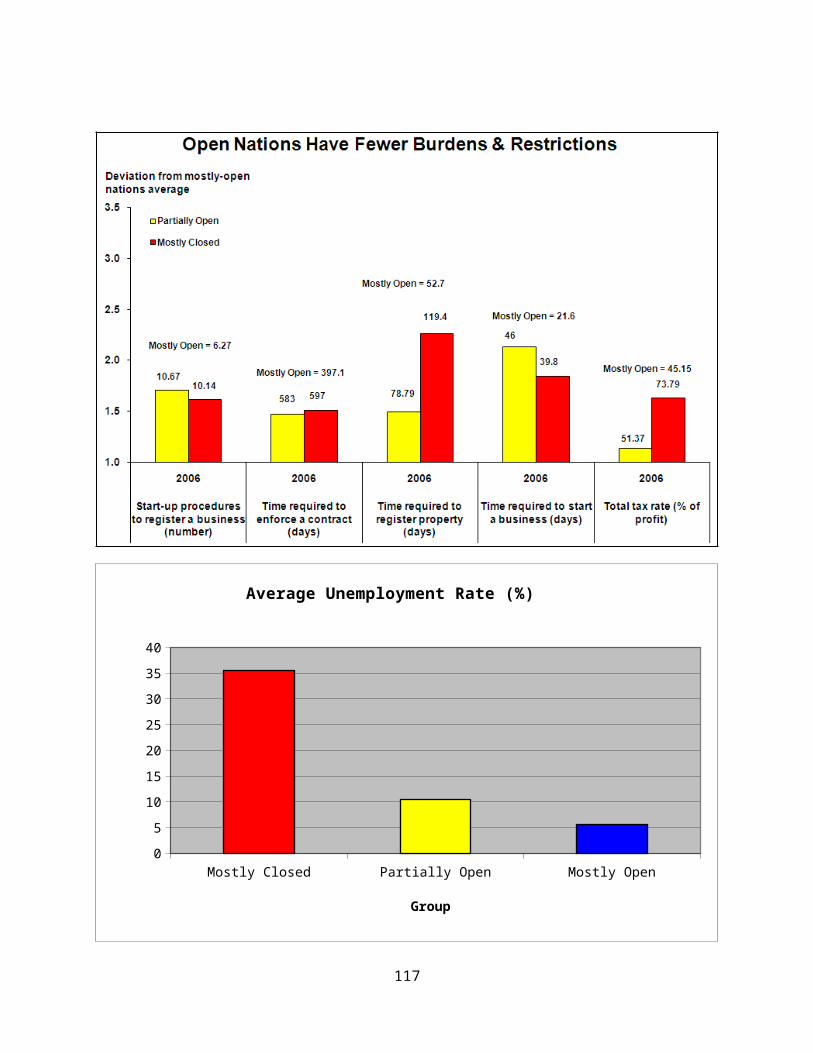
various other measures of a nation’s health (See Appendix J for these analysis graphs). When
compared on GDP per capita, GDP growth, GDP stability, economic sectors, burden and
regulation, unemployment, fertility, savings, and urbanization rates, the original classifications
were confirmed. The healthiest countries had highest GDP per capita, less agricultural
economies, lower burden and regulation, unemployment, fertility, and urbanization. The only
unpredicted result was that the mostly open nations had a lower savings rate than that of the
19

partially open nations. One possible explanation is the prevalent use of credit as a purchasing
power in the mostly open nations’ economies.
We then used each cluster group to perform another clustering and form “mini-
clusters” to help further rank the data. This idea proved more difficult to implement since the
data fields were already comparably close. The mini-clusters were formed, but did not compare
as well to other data as the original clusters had and the DEA ranking proved to be a much more
useful way to further classify the countries and will be discussed in greater depth later.
Data Envelopment Analysis
Data envelopment analysis effectively split the 126 countries into thirteen levels
consisting of a range of three to fourteen countries. Each level represents the economic health
of a group of countries relative to other levels. The higher levels consist of economically
healthier countries, which are highly concentrated in Western Europe and North America. The
lower levels consist of countries typically viewed as underdeveloped or unhealthy from an
economic perspective. Many of these countries are located in Africa and Asia as well as South
America. Countries that are currently in intermediate stages of development are found
throughout the middle levels, and their geographic locations vary widely.
The results of the DEA model indicate that those countries that promote policies of
economic freedom and openness have healthier economies than other countries. For instance,
Denmark is part of the highest level of economic health. This is because it has good policy
ratings for all of the input values in conjunction with a high output value, GDP per capita. Sierra
Leone, which has poor ratings for most input values and very low GDP per capita, is part of the
20
lowest level of economic health. For a full list of countries and the levels to which they are
assigned, see Appendix K.
By using DEA to rank countries individually, we were able to gain more insight
concerning the economic health of each country relative to all others. These rankings reflected
the levels established in the original DEA model very well, with economically healthy countries
ranked highly and less healthy countries ranked lower. These results indicate that the collection
of input variables in this study is useful as a predictor of the economic health of nations;
however, since the weights of these inputs used for each country are adjusted to maximize that
country’s level, DEA provides little insight into which of these variables are most significant as
predictors of economic health.
Because the DEA ranking system provides factors by which countries fall short of a
hypothetical economic health frontier, it allows for direct comparison between individual
countries. Luxembourg, the healthiest country, has a factor of 1, whereas Chad, the least
healthy country, has a factor of 0.07885. This means Luxembourg is about 12.68 times healthier
than Chad relative to the hypothetical frontier. For the full ranking of countries, see Appendix L.
Comparison of DEA and Clustering Models
Clustering and DEA were both useful tools for separating countries into groups reflecting
the economic health of each country; however, both methods also have limitations. The
clustering model served as a good method for dividing countries into three large groups, which
could then be analyzed for correlation between policies and institutions, and economic health.
Running cluster analysis on each of the three main clusters provided further breakdown into
21
smaller, more homogeneous groups. The neural network clustering model grouped countries
based on all eight input factors, but it did not show the relative importance of each factor.
Multiple regression analysis was used to gain further insight regarding the significance of these
factors. The clustering method grouped countries based on the similarity of their policies.
Further analysis was needed to establish correlation between these policies and economic
health. Although the results of this further analysis did indicate strong correlations between
health and some policies, no causal relationship could be drawn from it.
DEA was another useful method for grouping countries. One strength of this method
was that the weights placed on the input variables, or policy ratings, were allowed to vary. The
model assigned these weights to maximize the level of economic health for each country on an
individual basis. Thus, the economic health of each country was linked more closely to its own
policies. Although this characteristic allows for economic health via different policy routes, it
makes DEA less useful for determining the importance of the different policy inputs as they
relate to economic health in general. The DEA model included GDP per capita as a measure of
each country’s health, so correlation could be drawn without further analysis. Like the
clustering model, DEA does not provide a causal relationship between policies and economic
health.
The use of the DEA model solidified the findings of the clustering model and gave
additional insight regarding the relative economic health of each country. The levels and
corresponding countries established with the DEA model closely mirrored the results from the
original clustering model. Some correlation was lost when the clusters were divided into mini-
22
clusters, but it remained fairly strong. The individual rankings assigned by the DEA ranking
model further differentiate countries and makes cross-country comparison easier.
Multiple Regression Analysis
We started the multiple linear regression by including all eight of the variables used
during clustering and DEA analysis. Through six iterations, we removed the least relevant
variables with the lowest p-values in order to make the model as parsimonious as possible. This
also allowed us to identify which variables had the strongest correlation and influence on GDP
per capita. Free trade and regulation dropped out after the first iteration, as their correlation
to GDP per capita was very weak compared to the other variables. Sound money fell out after
the next iteration for the same reason, as did literacy. The last variable to drop from the
analysis was size of government, possibly due to its low level of correlation to the remaining
two variables. After the removal of these several variables our R squared value dropped, but
the reduction was not significant: because R squared drops automatically when variables are
removed, the fact that the drop was negligible told us that the variables left were highly
relevant. The corruption index and the human development index emerged as the two most
influential variables.
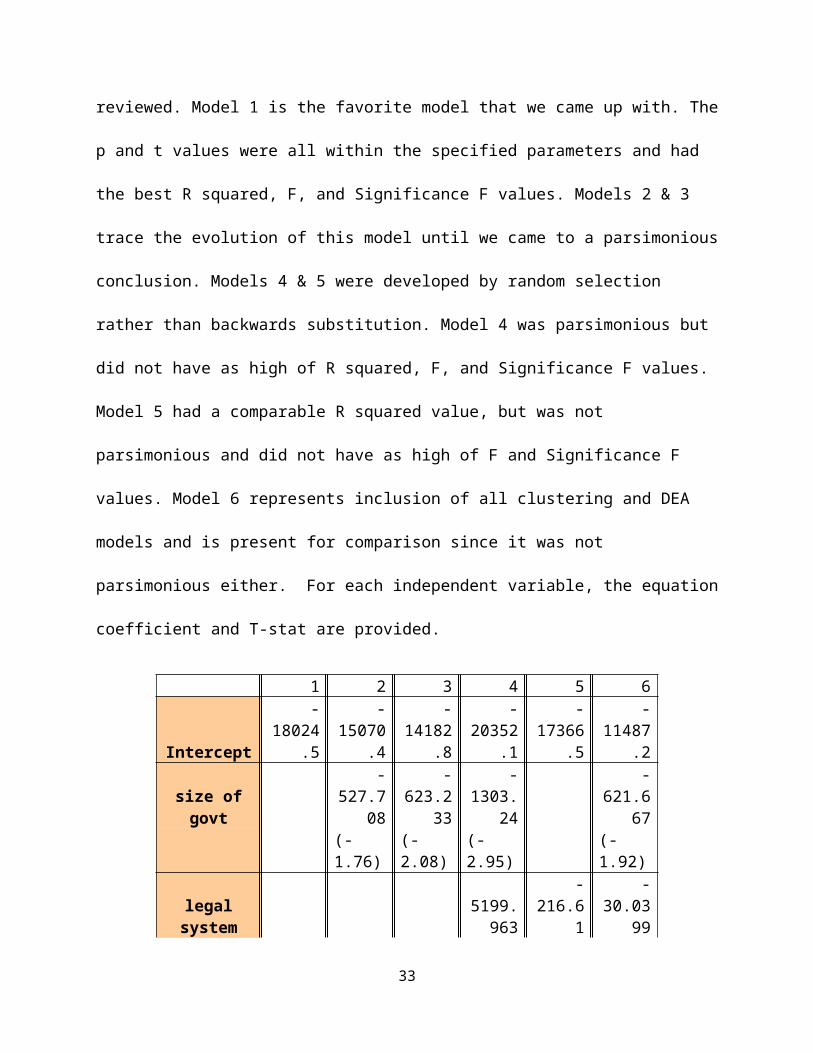
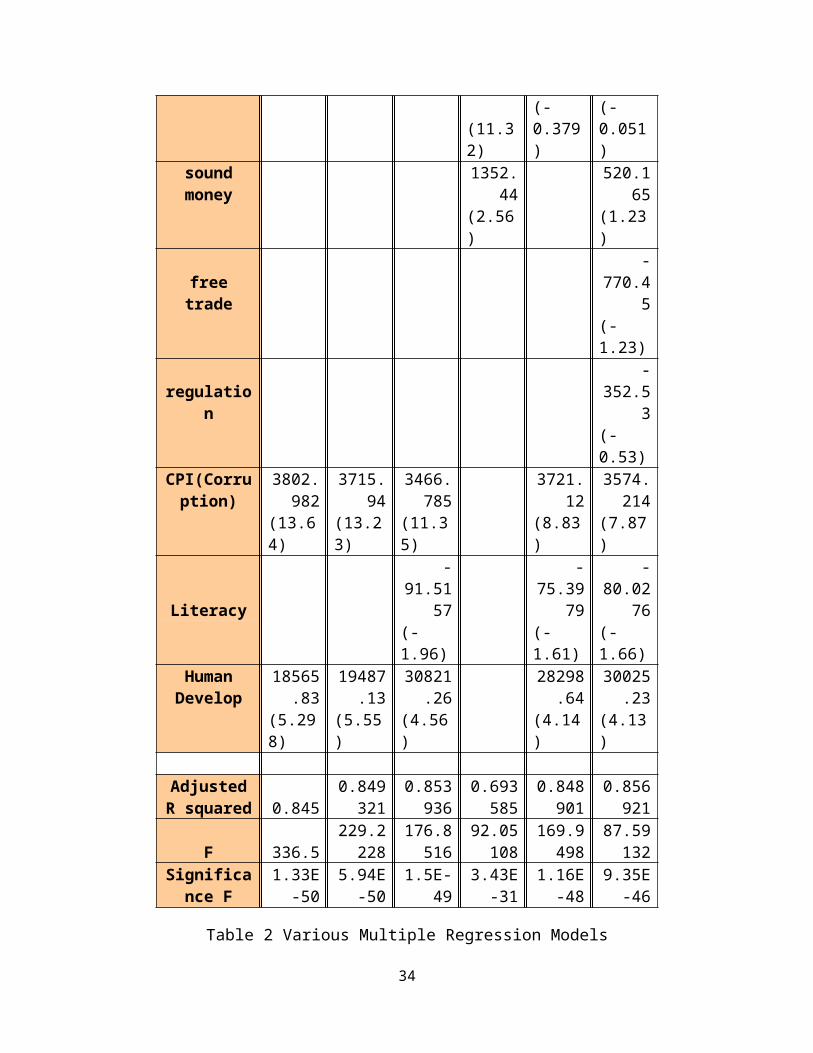
This chart tracks the multiple regression models that we reviewed. Model 1 is the
favorite model that we came up with. The p and t values were all within the specified
parameters and had the best R squared, F, and Significance F values. Models 2 & 3 trace the
evolution of this model until we came to a parsimonious conclusion. Models 4 & 5 were
developed by random selection rather than backwards substitution. Model 4 was parsimonious
but did not have as high of R squared, F, and Significance F values. Model 5 had a comparable R
23
squared value, but was not parsimonious and did not have as high of F and Significance F
values. Model 6 represents inclusion of all clustering and DEA models and is present for
comparison since it was not parsimonious either. For each independent variable, the equation
coefficient and T-stat are provided.
1 2 3 4 5 6
Intercept
-18024.
5
-15070.
4
-14182.
8
-20352.
1
-17366.
5
-11487.
2
size of govt
-527.70
8
-623.23
3
-1303.2
4
-621.66
7 (-1.76) (-2.08) (-2.95) (-1.92)
legal system 5199.9
63 -216.61
-30.039
9 (11.32) (-0.379) (-0.051)
sound money 1352.4
4 520.16
5 (2.56) (1.23)
free trade -770.45 (-1.23)
regulation -352.53 (-0.53)
CPI(Corruption)
3802.982
3715.94
3466.785
3721.12
3574.214
(13.64) (13.23) (11.35) (8.83) (7.87)
Literacy
-91.515
7
-75.397
9
-80.027
6 (-1.96) (-1.61) (-1.66)
Human Develop
18565.83
19487.13
30821.26
28298.64
30025.23
(5.298) (5.55) (4.56) (4.14) (4.13)
Adjusted R squared 0.845
0.849321
0.853936
0.693585
0.848901
0.856921
F 336.5229.22
28176.85
1692.051
08169.94
9887.591
32
24
Significance F1.33E-
505.94E-
50 1.5E-493.43E-
311.16E-
489.35E-
46
Table 2 Various Multiple Regression Models
The corruption index is an inverse variable; as the index increases, the amount of
corruption in a country decreases. Countries with higher corruption indices seemed to have
higher GDPs more often than not (See Appendix M for a scatter plot of Corruption vs. GDP per
capita). The corruption index is based on 16 expert polls and surveys and is therefore
inherently somewhat subjective. However, since only data from 2006 was used the subjectivity
of the variable is eliminated somewhat as the standards of evaluation within the same year are
constant. HDI is an aggregate metric made up of five different weighted parts: life expectancy,
adult literacy rate, the ratio of gross enrollment in secondary education, gross domestic product
per capita and purchasing power parity. At the beginning of our MLR analysis, we had not
looked at the aggregate parts of HDI individually, instead choosing to use the whole metric as a
general evaluation factor. Because literacy was a factor in addition to the HDI in the early MLR
analyses its coefficient came out negative due to the model compensating for its double
inclusion. However, in the final MLR analysis, literacy dropped from relevance, leaving only the
corruption index and the human development index as the major influencing variables.
This also raises the question: is the correlation between HDI and GDP purely because HDI
uses GDP per capita as an evaluating factor (see Appendix M for a scatter plot of HDI vs. GDP
per capita and Appendix N for a table of correlational values for each variable) ? The answer lies
in the calculation of the HDI metric: GDP per capita itself is not actually used in the final
calculation of the human development index: instead, the HDI is an average of three individual
25

indices: the life expectancy index, a function of life expectancy over an equalizing factor (Life
expectancy - 25 ÷ 85 – 25); the education index, a function of the adult literacy index and the
gross enrollment index (2/3 * adult literacy rate + 1/3 * gross enrollment ratio); and the GDP
index, a logarithmic function of GDP per capita over an equalizing factor (log(GDP per capita) –
log(100) ÷ log(40000) – log(100)). GDP per capita ends up being only a fractional part of the
overall human development index. Because of this we feel HDI is still a valid variable for use in
an MLR analysis.
The other variable that was highly correlative to GDP per capita was the legal system
index. Individually, its high correlation value of .815 indicates that it is highly influential on GDP
( See Appendix N). However, when looked at through multiple linear regression analysis, its low
p value indicated to us that it was not as significant an influence as originally thought. We
believe that this is the result of multi-colinearity and that the legal system index is made less
significant by the influences of the corruption index and the human development index. This
may be caused by the real-world interactions between these variables. We believe that a strong
legal system is a prerequisite for the eradication of corruption and a high human development
index, which lead to GDP growth and a healthy economy.
26
Conclusion and Critique
Our study consisted of 2 models, 126 countries, with 8 observation variables each. We
performed clustering and data envelopment analysis on this data set, and each produced
similar classifications of the country set. Further analysis was performed by comparison of
variables outside the data set and multiple regression analysis on each of the 8 variables and
their different combinations.
As a result of this study, we would conclude that it is possible to make a reasonable
prediction model of economic health based on political institutions and policies. Our models are
by no means perfect, as a topic as complex as economic health cannot be limited to so few
variables. The variables are also open to argument as there are many variables of economic
health that were not used in this study and could potentially be better predictors than the ones
we found.
Our recommendations to those in a position to affect economic change in government
would be to focus on limiting corruption within the system and on creating opportunities to
better the lives of the citizens of the country. One possible way to bring this about would be to
strengthen the legal system and put protections in place against corruption and unfair practices
that hurt the chances of citizens to succeed. When a good legal system is in place and
corruption is limited, entrepreneurial citizens feel free to pursue ideas that lead to growth
within the economy.
Some possible areas of further study include further analysis to determine a causal
relationship between corruption and human development and a strong legal system. Multiple
regression and correlational relationships are unable to determine which comes first: a strong
27
legal system or less corruption among officials and better opportunities for the masses. Another
future area of study would be the breakdown and analysis of the various data pieces that form
the Human Development Index. It is difficult to be sure which pieces of the function have the
greatest effect as a predictor.
With regards to DEA, more work could be conducted on the weight constraints on input
variables, such as using regression results to formulate new weights. Also, other variables
besides GDP per capita could be used to rank the countries. We also developed our own
ranking system by using hypothetically “perfect” countries in the model, but other ranking
systems could be explored.
With regards to critique of our work as a team and the tools that we used, there are
many areas that could be improved upon. A more thorough examination of variables at the
beginning of the modeling process would have saved us a great deal of effort later on. Also, we
struggled with the modeling of the project as none of us had any previous experience with
neural networks, data envelopment, or multiple regression before the project. The models that
we used were sufficient for our efforts and were helpful since they were open source. However,
they were unable to determine causal relationships between variables leading us to question
the effects of multi-colinearity. Also, the clustering model limits the number of variables that
can be used and is slow in comparison to other commercial options. Lastly data envelopment
analysis uses weight constraints that are completely arbitrary and provided by the user. There is
no objective method to select the right weight values.
Overall, we believe the project was a success, both in answering our initial questions
and in providing further areas of study for the field.
28

Works Cited
“2008 Corruptions Perceptions Index”. 2008 CPI Table. Transparency International. Retrieved 3
March 2009. <http://www.transparency.org/news_room/in_focus/2008/cpi2008/
cpi_2008_table>.
Barr, R., DEA Software Tools and Technology: A State-of-the-Art Survey, which appeared in
slightly different form in W.W. Cooper, L. M. Seiford, and J. Zhu, eds. Handbook on Data
Envelopment Analysis, Kluwer Academic Publishers, Boston, 2004, pp. 539-566,
<http://faculty.smu.edu/barr/pubs/tr04-05.pdf>.
Barr, Richard. Individual Lecture. “Benchmarking and Performance Data Analysis: Data
Envelopment Analysis (DEA) for Determining Best/Worst Performers.” Department of
Engineering Management, Information, and Systems; Southern Methodist University,
Dallas. 30 April 2009.
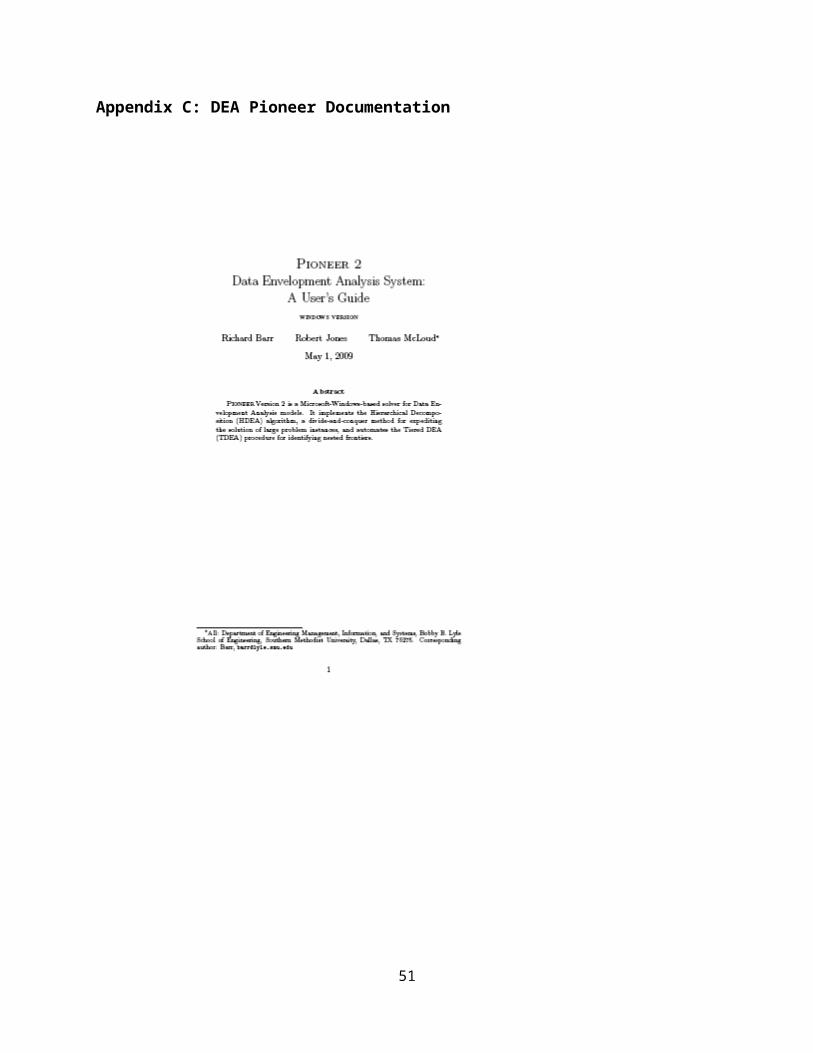
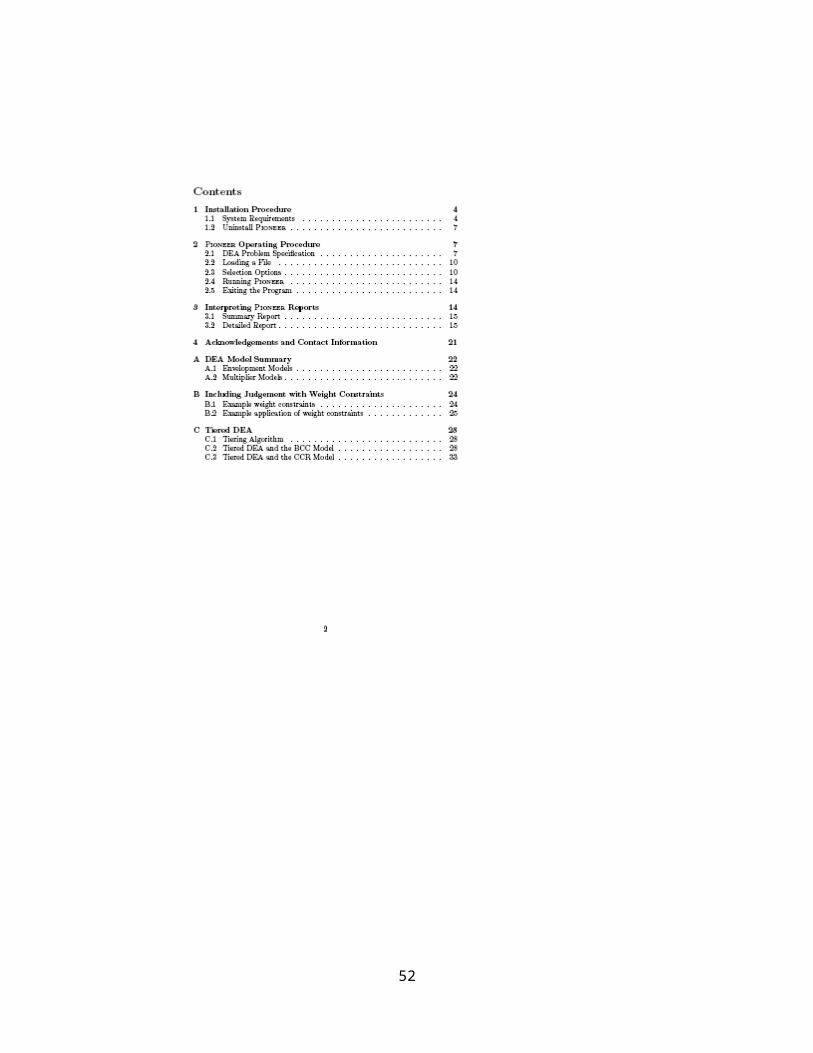
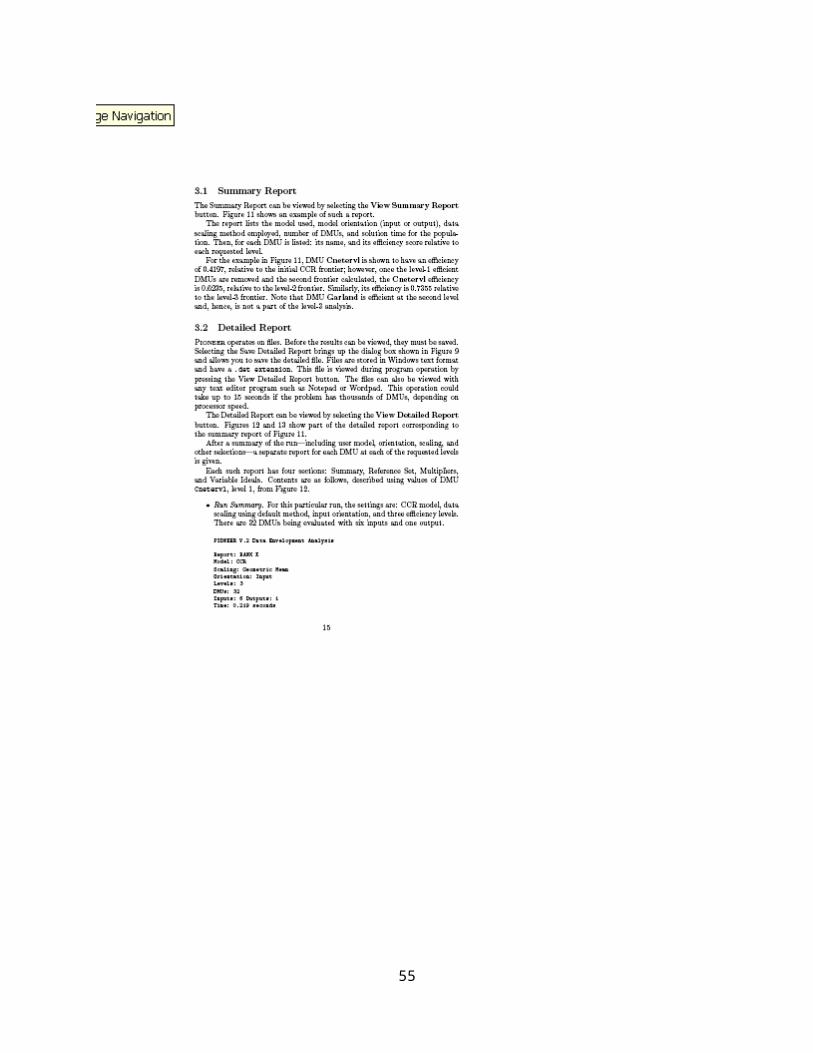
Barr, Richard, Robert Jones, Thomas McCloud. “Pioneer 2, Data Envelopment Analysis System:
A User’s Guide.” Department of Engineering Management, Information, and Systems;
Southern Methodist University, Dallas. 2009.
“Economic Freedom of the World 2008 Report.” FreetheWorld.com. Fraser Institute. Retrieved
2 March 2009. <http://www.freetheworld.com/release.html>.
Honkela, Timo. “Description of Kohonen’s Self Organizing Map”. 2 January 1998. Retrieved 2
April 2009. <http://mlab.taik.fi/~timo/som/thesis-som.html>.
“Indicator Tables HDI 2008”. Getting and Using the Data. Human Development Reports. UNDP.
Retrieved 3 March 2009. <http://hdr.undp.org/en/statistics/data/>.
29

“Neural Network Based Clustering using Self Organizing Map (SOM) in Excel”. Retrieved 26
March 2009. <http://www.geocities.com/adotsaha/NN/SOMinExcel.html>.
Siems, Thomas. Individual Interview. “Multiple Regression and Other Analysis Methods”.
Department of Engineering Management, Information, and Systems; Southern
Methodist University, Dallas. 1 May 2009.
Smith, Leslie. “An Introduction to Neural Networks”. 2 April 2003. Retrieved 5 April 2009.
<http://www.cs.stir.ac.uk/~lss/NNIntro/InvSlides.html#what>.
30
Appendix A: Self Organizing Map Software Documentation
Instructions on Using the tool
( Clustering using Self Organizing Maps)
Step 1: Enter Your Data(A) Enter your data in The Data worksheet, starting from the cell C13(B) The observations should be in rows and the variables should be in columns.(C) Above each column, choose appropriate Type (Use , Omit)
To drop a column from the clustering process - set the type = OmitTo use a column for clustering, set type = Use
You can use atmost 50 variables for Clustering. Application will automatically treat them all as continuous variables.
Make sure that the number variables entered in Input sheet exactly matches total no. of columns in your data with type = UseMake sure that the number of observations entered in Input sheet is <= no. of rows in your Data Sheet
(D) Please make sure that your data does not have blank rows or blank columns.(E) All the variables to be used in the Clustering needs to be necessarily numeric
Any non-number in the clustering variables will be treated as missing value.Application will replace it by the respective column mean
Step 2: Fill up the inputs in the Inputs page(A) Note that the SOM is a square grid of n-sqaure neurons, arranged in n rows and n columns
You need to specify n. n should be between 2 and 10
(B) Once cycle consists of presenting ALL the observation to the map - once.
You need to specify number of cycles
(C) In each cycle all the observations are presented to the map once. Order in which they are presented could be random - hence varies from cycle to cycleor could be in the original order in which you have entered the data in Data sheet. Select the option you want.(D) Make sure that the end value of the learning parameter is less than the start value and both the values are strictly between 0 and 1 (E) Make sure that the end value of Sigma is less than the start value and both the values are strictly between 0% and 100% (F) As the training of the map progreses, both Learning Parameter and Sigma is decreased from the start value to the end value
31

you may choose the rate of this decay as linear or exponential.
Step 3: Click on the Build Clusters button(A) While training the map actual variables in the data are scaled so that for each variable - values are between -1 and 1.This is called Normalization of data. Normalization takes a long time - specially for large data sets.If you are training the map same data set on two succesive runs - you may skip the normalization for the second run.Application will ask you whether to skip normalization or not. Skipping normalization saves a lot of time. However application only checks the number of rows and columns of your data to determine whether it has changed since last runIt does not check the individual values in the data set.So if you are not sure whether you have changed the data since last run - it's a better idea to normalize the data again.
(B) If you are training the map on same variables and the map size is same as that in the just previous runthe application will ask you whether to start with the weights obtained in the previous run.Starting with previous weights provide incremental learning.Using this option you can build upon what has been already learned by the map so far.However - if you have changed your data set or the variables or the ordering of the variable you should start with fresh weights
Step 4: Output of Clustering(A) Outputs will be generated in Output sheet. You can only see it but can't modify since the sheet is protected.(B) Application gives you an option of saving the results in a separate workbook where you can edit the output(C) In that new workbook, the data along with Cluster labels, cluster means and variances will be savedAlso, a Radar plot will be created to let you visually compare the means of the variables across different clusters.(D) In that Weights sheet a plot will be generated to visually depict which portion of the map captured how many data points.
32
Appendix B: Clustering Data Set
Countrysize of govt legal system
sound money free trade
regulation CPI
Literacy HDI
Burkina Faso 5.52 4.03 6.80 5.36 6.45 3.2 23.6 0.37
Central Afr. Rep. 6.32 2.99 6.80 4.03 4.91
2.4 48.6 0.384
Chad 6.45 2.28 6.12 5.93 4.81 2 25.7 0.388
Mali 7.33 4.51 6.47 6.25 6.09 2.8 24 0.38
Niger 3.04 4.32 6.55 4.46 4.98 2.3 28.7 0.374
Sierra Leone 7.13 3.17 7.24 5.26 5.43 2.2 34.8 0.336
Angola 0.85 3.16 4.06 6.97 5.44 2.2 67.4 0.446
Bangladesh 8.04 3.12 6.60 5.82 6.10 2 47.5 0.547
Benin 7.20 4.33 6.86 5.25 5.78 2.5 34.7 0.437
Burundi 4.68 3.06 7.30 4.31 6.78 2.4 59.3 0.413
Cameroon 6.52 3.69 7.07 5.80 5.71 2.1 67.9 0.532
Congo, Rep. Of 3.90 2.35 5.71 6.02 5.22 2.2 84.7 0.548
Cote d'Ivoire 7.35 3.36 6.88 5.97 6.21 2.1 48.7 0.432
Ethiopia 5.86 4.66 5.76 5.67 6.25 2.4 35.9 0.406
Madagascar 6.92 3.32 7.33 6.46 5.77 3.1 70.7 0.533
Malawi 5.41 5.25 5.31 4.96 6.18 2.7 64.1 0.437
Mauritania 5.78 5.44 7.09 6.58 6.67 3.1 51.2 0.55
Mozambique 4.67 4.13 7.51 6.58 5.96 2.8 38.7 0.384
Nepal 5.26 3.96 6.58 5.49 5.46 2.5 48.6 0.534
Nigeria 3.97 3.98 7.38 7.22 6.86 2.2 69.1 0.47
Pakistan 7.01 4.31 6.45 5.91 6.56 2.2 49.9 0.551
Rwanda 4.87 3.04 6.79 4.39 7.08 2.5 64.9 0.452
Senegal 6.07 3.55 6.94 6.13 5.57 3.3 39.3 0.499
Togo 6.36 2.46 6.90 6.17 4.77 2.4 53.2 0.512
Zambia 8.19 5.58 8.57 7.11 6.00 2.6 68 0.434
Zimbabwe 2.66 3.61 0.00 2.73 4.35 2.4 89.4 0.513
Australia 6.77 8.68 9.46 7.17 8.12 8.7 99 0.962
Austria 5.18 8.67 9.54 7.68 7.22 8.6 99 0.948
Barbados 5.22 6.86 6.23 5.25 7.20 6.7 99 0.892
Belgium 4.31 7.02 9.51 8.06 7.09 7.3 99 0.946
Canada 6.88 8.39 9.60 7.14 8.22 8.5 99 0.961
Chile 7.50 6.99 9.14 8.40 8.24 7.3 95.7 0.867
Cyprus 7.44 7.49 9.19 6.84 5.81 5.6 96.8 0.903
Czech Rep. 4.49 6.16 9.30 7.92 6.88 4.8 99 0.891
Denmark 4.39 8.96 9.36 7.77 8.44 9.5 99 0.949
Estonia 7.03 7.35 9.32 8.14 7.59 6.7 99.8 0.86
Finland 5.03 9.01 9.52 7.43 7.47 9.6 99 0.952
France 4.11 7.53 9.51 7.38 7.40 7.4 99 0.952
Germany 5.82 8.59 9.47 7.88 6.47 8 99 0.935
33
Hungary 5.70 6.68 9.48 8.24 7.18 5.2 99 0.874
Iceland 6.94 8.80 8.62 5.90 8.76 9.6 99 0.968
Ireland 6.38 7.89 9.52 8.31 7.49 7.4 99 0.959
Israel 3.83 6.22 9.14 7.56 6.38 5.9 97.1 0.932
Italy 5.99 6.26 9.42 7.24 6.84 4.9 98.4 0.941
Japan 6.23 7.90 9.72 5.87 7.69 7.6 99 0.953
Kuwait 6.63 7.43 9.51 6.73 7.81 4.8 93.3 0.891
Latvia 5.98 6.89 8.74 7.40 7.35 4.7 99.7 0.855
Lithuania 6.67 6.82 8.87 7.51 7.11 4.8 99.6 0.862
Luxembourg 4.93 8.11 8.99 8.16 7.72 8.6 99 0.944
Malta 5.91 7.75 9.53 7.43 7.02 6.4 87.9 0.878
Netherlands 4.06 8.49 9.69 8.33 7.69 8.7 99 0.953
New Zealand 6.70 8.90 9.35 7.79 8.65 9.6 99 0.943
Norway 5.80 8.91 8.90 6.62 7.48 8.8 99 0.968
Portugal 5.71 7.21 9.32 7.33 6.22 6.6 93.8 0.897
Singapore 7.86 8.43 8.99 9.35 8.22 9.4 92.5 0.922
Slovenia 2.48 6.05 8.94 7.23 7.20 6.4 99.7 0.917
Spain 6.69 6.71 9.49 7.16 6.86 6.8 99 0.949
Sweden 3.73 8.41 9.61 7.72 7.26 9.2 99 0.956
Switzerland 7.89 8.66 9.56 6.79 8.12 9.1 99 0.955
Unit. Arab Em. 6.21 6.96 8.32 8.51 7.45 6.2 88.7 0.868
United Kingdom 6.64 8.33 9.40 7.76 8.25
8.6 99 0.946
United States 7.13 7.58 9.66 7.53 8.31 7.3 99 0.951
Albania 8.07 4.94 9.57 5.93 5.80 2.6 98.7 0.801
Algeria 4.93 5.15 6.33 6.30 5.15 3.1 69.9 0.733
Argentina 7.48 4.35 6.17 6.32 4.94 2.9 97.2 0.869
Armenia 6.26 5.56 9.43 6.53 6.37 2.9 99.4 0.775
Azerbaijan 3.64 5.67 7.10 6.38 5.86 2.4 98.8 0.746
Bahrain 6.52 6.13 9.38 7.30 7.29 5.7 86.5 0.866
Belize 4.34 5.84 8.04 5.47 8.43 3.5 75.1 0.778
Bolivia 6.20 4.11 8.66 7.29 5.63 2.7 86.7 0.695
Bosnia and Herzegovina 6.09 3.46 7.99 5.81 6.61
2.9 96.7 0.803
Botswana 5.04 6.80 8.62 6.91 7.45 5.6 81.2 0.654
Brazil 6.65 5.19 7.77 6.51 4.69 3.3 88.6 0.8
Bulgaria 4.95 5.61 8.76 7.64 7.11 4 98.2 0.824
China 5.00 5.93 8.22 7.47 4.83 3.3 90.9 0.777
Colombia 4.44 4.49 7.85 6.05 6.05 3.9 92.8 0.791
Costa Rica 8.01 6.79 8.89 7.62 6.59 4.1 94.9 0.846
Croatia 4.34 5.74 8.32 6.73 6.64 3.4 98.1 0.85
Dominican Rep. 7.80 4.63 5.58 6.96 6.37
2.8 87 0.779
Ecuador 8.03 4.06 5.06 6.58 5.60 2.3 91 0.772
34

Egypt 7.29 5.66 8.74 6.63 4.93 3.3 71.4 0.708
El Salvador 8.96 4.83 9.37 7.18 7.23 4 80.6 0.735
Gabon 4.26 4.27 6.03 5.48 6.82 3 84 0.677
Georgia 7.42 4.95 9.07 7.44 7.55 2.8 100 0.754
Ghana 6.60 5.74 8.21 6.79 6.85 3.3 57.9 0.553
Greece 6.82 6.56 9.53 6.21 6.05 4.4 96 0.926
Guatemala 7.77 5.22 9.17 6.84 6.27 2.6 69.1 0.689
Honduras 8.94 4.85 8.94 7.23 6.79 2.5 80 0.7
India 7.14 6.12 6.70 6.82 6.17 3.3 61 0.619
Indonesia 6.36 3.93 7.18 7.29 5.83 2.4 90.4 0.728
Iran 6.79 6.11 8.24 6.42 4.76 2.7 82.4 0.759
Jamaica 8.51 5.36 8.86 7.05 6.87 3.7 79.9 0.736
Jordan 5.53 6.40 8.94 7.60 7.45 5.3 91.1 0.773
Kazakhstan 7.77 6.21 8.21 6.86 7.11 2.6 99.5 0.794
Kenya 7.85 5.07 8.49 6.61 6.80 2.2 73.6 0.521
Kyrgyz Republic 8.05 4.61 8.69 6.78 6.68
2.2 98.7 0.696
Lesotho 7.10 4.65 7.91 6.19 6.44 3.2 82.2 0.549
Macedonia 6.05 4.35 8.18 6.33 7.14 2.7 96.1 0.801
Malaysia 5.50 6.85 6.02 7.55 7.66 5 88.7 0.811
Mauritius 7.16 5.86 8.54 7.38 7.35 5.1 84.3 0.804
Mexico 7.33 5.45 8.24 7.14 6.72 3.3 91.6 0.829
Moldova 6.84 5.72 6.97 6.79 6.24 3.2 99.1 0.708
Mongolia 7.52 5.80 8.67 7.01 7.09 2.8 97.8 0.7
Morocco 6.68 6.10 6.89 5.87 5.64 3.2 52.3 0.646
Namibia 6.09 7.32 6.24 6.45 7.75 4.1 85 0.65
Nicaragua 7.52 4.32 9.06 7.09 6.98 2.6 76.7 0.71
Oman 5.51 7.05 9.33 7.13 7.56 5.4 81.4 0.814
Panama 8.37 5.21 9.11 7.41 6.98 3.1 91.9 0.812
Paraguay 7.50 3.43 8.20 7.72 5.14 2.6 93.5 0.755
Peru 8.27 5.00 8.76 7.31 6.44 3.3 87.9 0.773
Philippines 7.12 4.90 8.13 7.17 6.28 2.5 92.6 0.771
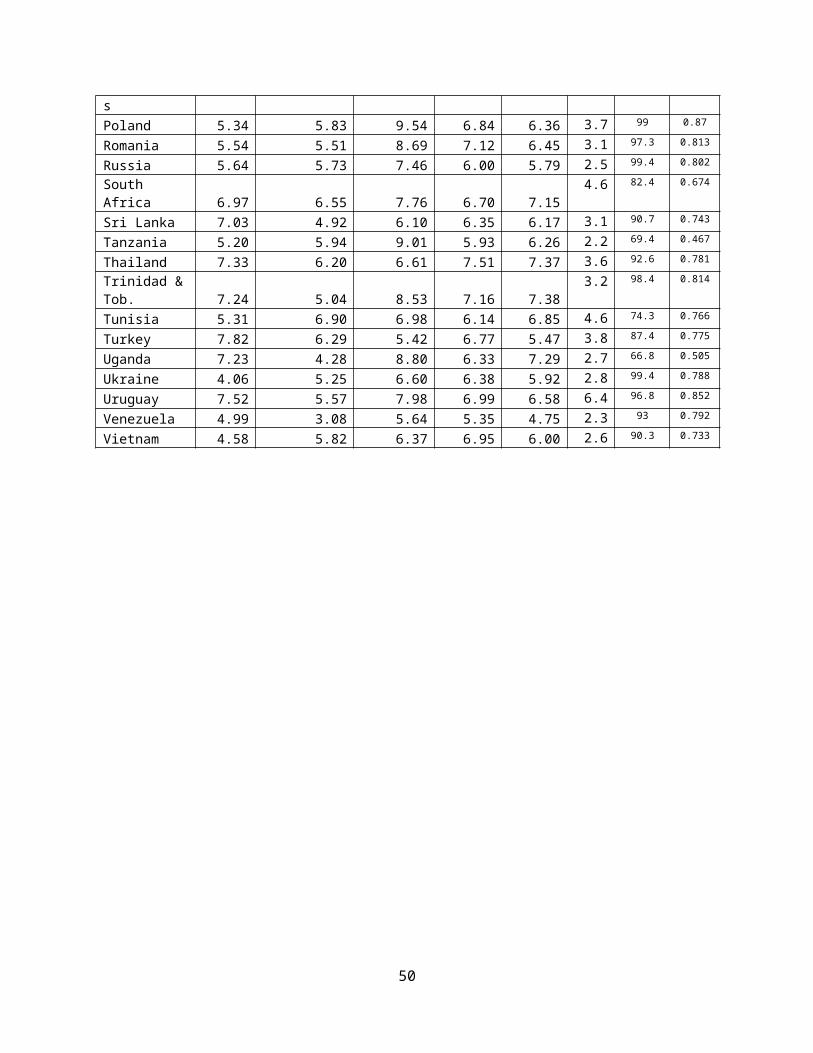
Poland 5.34 5.83 9.54 6.84 6.36 3.7 99 0.87
Romania 5.54 5.51 8.69 7.12 6.45 3.1 97.3 0.813
Russia 5.64 5.73 7.46 6.00 5.79 2.5 99.4 0.802
South Africa 6.97 6.55 7.76 6.70 7.15 4.6 82.4 0.674
Sri Lanka 7.03 4.92 6.10 6.35 6.17 3.1 90.7 0.743
Tanzania 5.20 5.94 9.01 5.93 6.26 2.2 69.4 0.467
Thailand 7.33 6.20 6.61 7.51 7.37 3.6 92.6 0.781
Trinidad & Tob. 7.24 5.04 8.53 7.16 7.38
3.2 98.4 0.814
Tunisia 5.31 6.90 6.98 6.14 6.85 4.6 74.3 0.766
Turkey 7.82 6.29 5.42 6.77 5.47 3.8 87.4 0.775
Uganda 7.23 4.28 8.80 6.33 7.29 2.7 66.8 0.505
35
Ukraine 4.06 5.25 6.60 6.38 5.92 2.8 99.4 0.788
Uruguay 7.52 5.57 7.98 6.99 6.58 6.4 96.8 0.852
Venezuela 4.99 3.08 5.64 5.35 4.75 2.3 93 0.792
Vietnam 4.58 5.82 6.37 6.95 6.00 2.6 90.3 0.733
36
Appendix C: DEA Pioneer Documentation
37
38

39
40
41

42

43

44

45

46
47

48

49
50
51
52

53

54
55
56
57
58
59
60
61
62
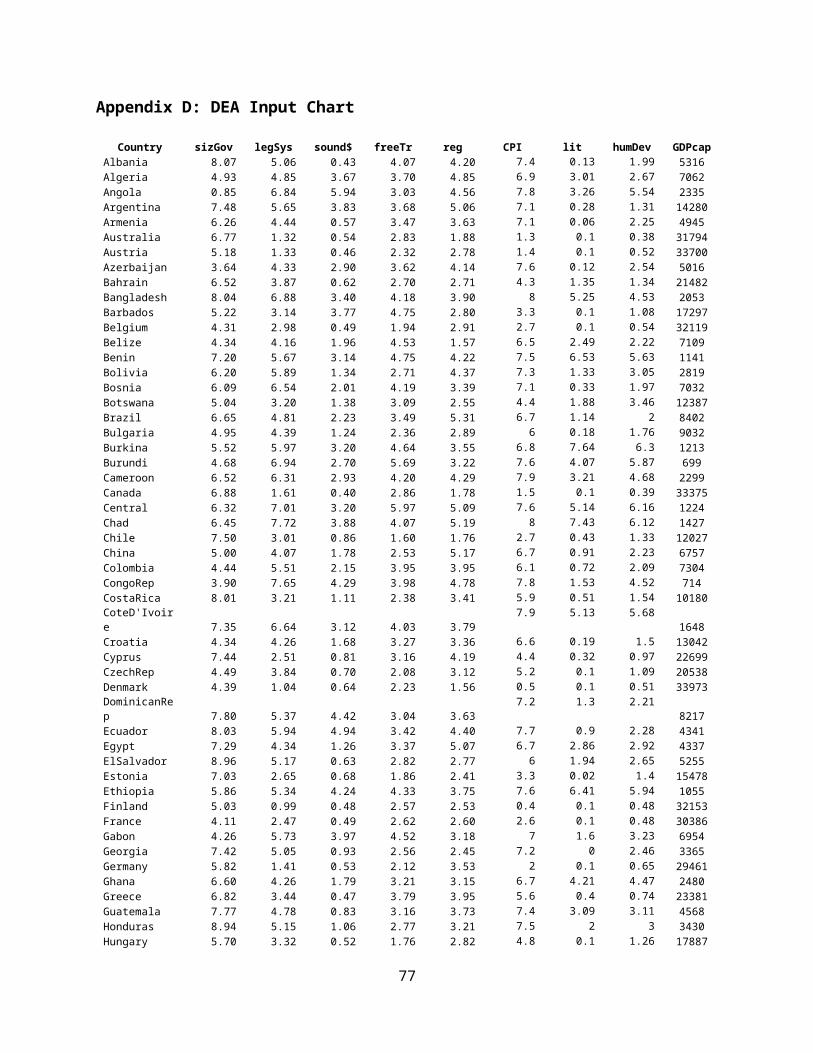
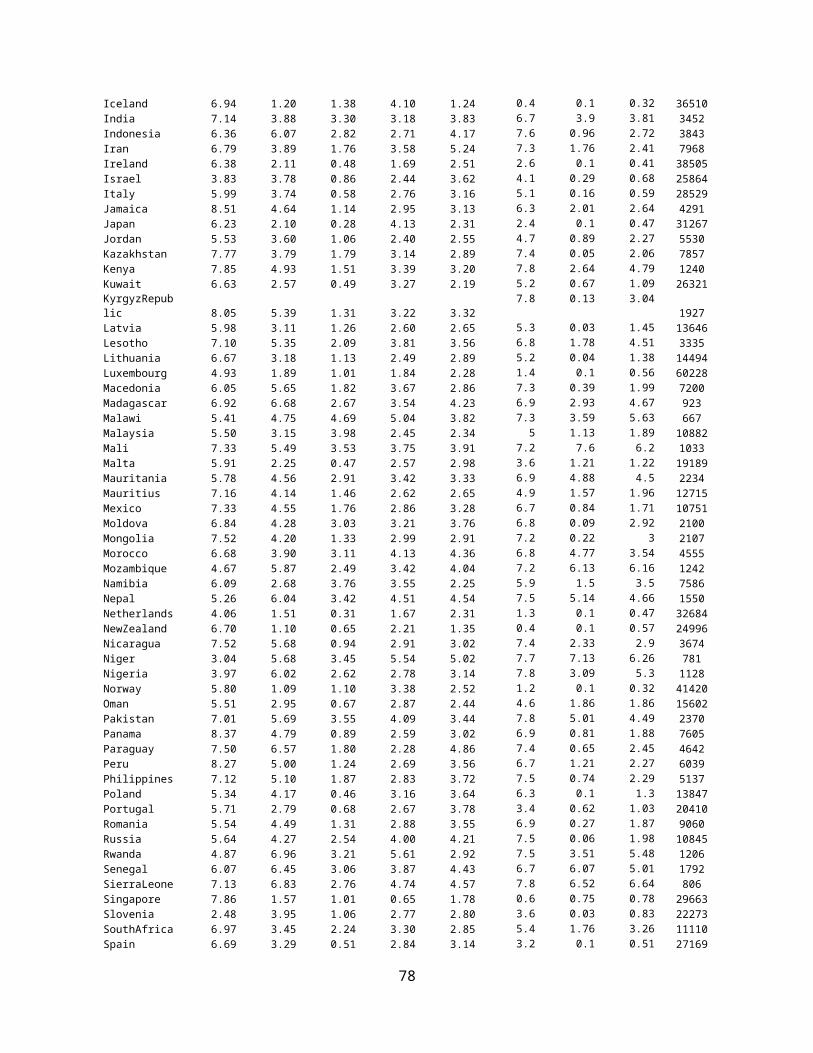
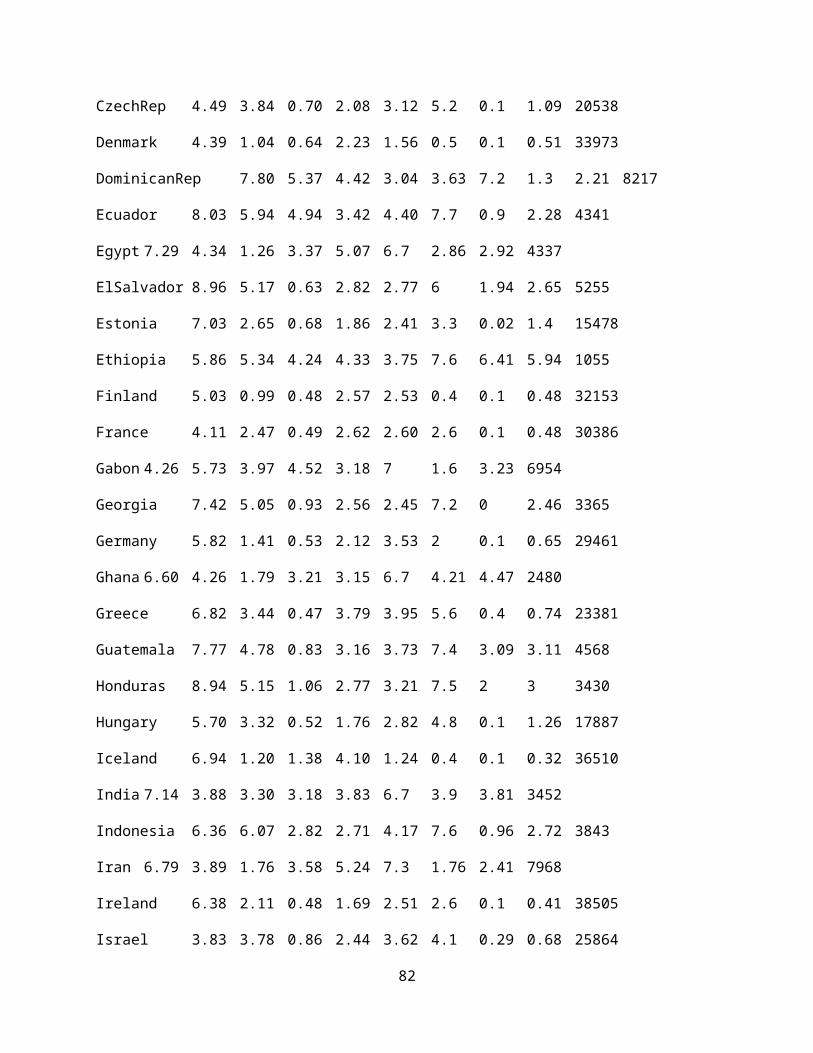
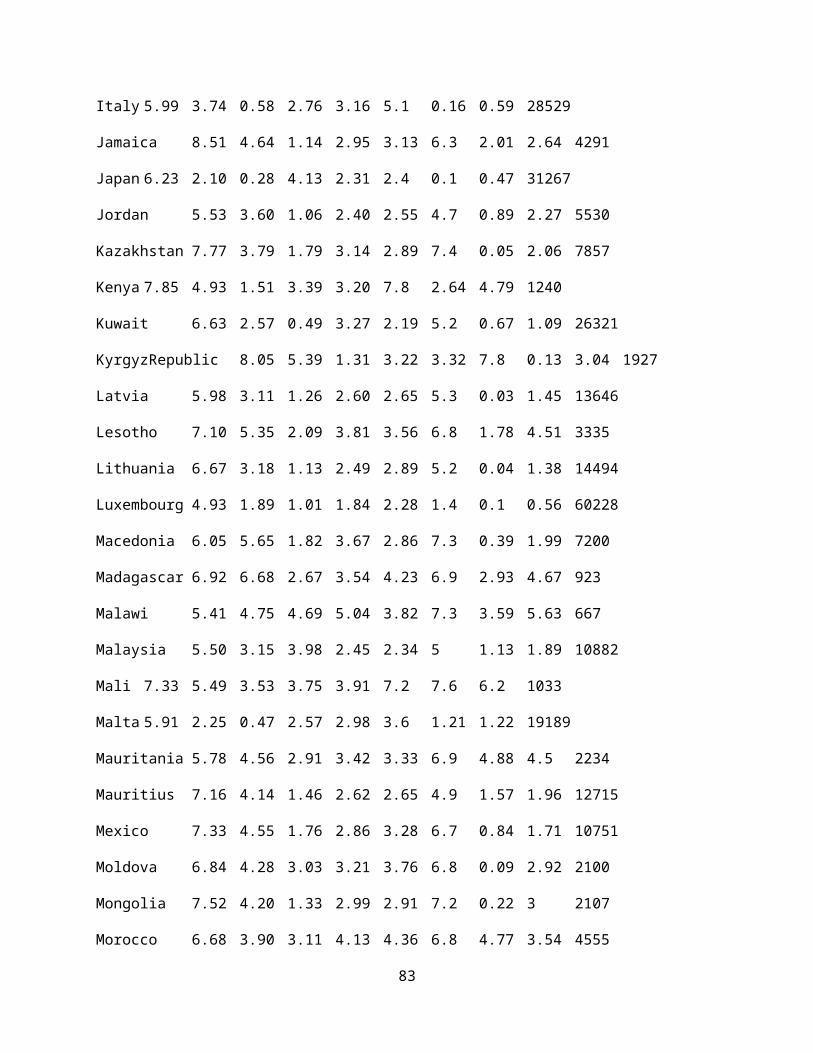
Appendix D: DEA Input Chart
Country sizGov legSys sound$ freeTr reg CPI lit humDev GDPcapAlbania 8.07 5.06 0.43 4.07 4.20 7.4 0.13 1.99 5316Algeria 4.93 4.85 3.67 3.70 4.85 6.9 3.01 2.67 7062Angola 0.85 6.84 5.94 3.03 4.56 7.8 3.26 5.54 2335Argentina 7.48 5.65 3.83 3.68 5.06 7.1 0.28 1.31 14280Armenia 6.26 4.44 0.57 3.47 3.63 7.1 0.06 2.25 4945Australia 6.77 1.32 0.54 2.83 1.88 1.3 0.1 0.38 31794Austria 5.18 1.33 0.46 2.32 2.78 1.4 0.1 0.52 33700Azerbaijan 3.64 4.33 2.90 3.62 4.14 7.6 0.12 2.54 5016Bahrain 6.52 3.87 0.62 2.70 2.71 4.3 1.35 1.34 21482Bangladesh 8.04 6.88 3.40 4.18 3.90 8 5.25 4.53 2053Barbados 5.22 3.14 3.77 4.75 2.80 3.3 0.1 1.08 17297Belgium 4.31 2.98 0.49 1.94 2.91 2.7 0.1 0.54 32119Belize 4.34 4.16 1.96 4.53 1.57 6.5 2.49 2.22 7109Benin 7.20 5.67 3.14 4.75 4.22 7.5 6.53 5.63 1141Bolivia 6.20 5.89 1.34 2.71 4.37 7.3 1.33 3.05 2819Bosnia 6.09 6.54 2.01 4.19 3.39 7.1 0.33 1.97 7032Botswana 5.04 3.20 1.38 3.09 2.55 4.4 1.88 3.46 12387Brazil 6.65 4.81 2.23 3.49 5.31 6.7 1.14 2 8402Bulgaria 4.95 4.39 1.24 2.36 2.89 6 0.18 1.76 9032Burkina 5.52 5.97 3.20 4.64 3.55 6.8 7.64 6.3 1213Burundi 4.68 6.94 2.70 5.69 3.22 7.6 4.07 5.87 699Cameroon 6.52 6.31 2.93 4.20 4.29 7.9 3.21 4.68 2299Canada 6.88 1.61 0.40 2.86 1.78 1.5 0.1 0.39 33375Central 6.32 7.01 3.20 5.97 5.09 7.6 5.14 6.16 1224Chad 6.45 7.72 3.88 4.07 5.19 8 7.43 6.12 1427Chile 7.50 3.01 0.86 1.60 1.76 2.7 0.43 1.33 12027China 5.00 4.07 1.78 2.53 5.17 6.7 0.91 2.23 6757Colombia 4.44 5.51 2.15 3.95 3.95 6.1 0.72 2.09 7304CongoRep 3.90 7.65 4.29 3.98 4.78 7.8 1.53 4.52 714CostaRica 8.01 3.21 1.11 2.38 3.41 5.9 0.51 1.54 10180CoteD'Ivoire 7.35 6.64 3.12 4.03 3.79 7.9 5.13 5.68 1648Croatia 4.34 4.26 1.68 3.27 3.36 6.6 0.19 1.5 13042Cyprus 7.44 2.51 0.81 3.16 4.19 4.4 0.32 0.97 22699CzechRep 4.49 3.84 0.70 2.08 3.12 5.2 0.1 1.09 20538Denmark 4.39 1.04 0.64 2.23 1.56 0.5 0.1 0.51 33973DominicanRep 7.80 5.37 4.42 3.04 3.63 7.2 1.3 2.21 8217Ecuador 8.03 5.94 4.94 3.42 4.40 7.7 0.9 2.28 4341Egypt 7.29 4.34 1.26 3.37 5.07 6.7 2.86 2.92 4337ElSalvador 8.96 5.17 0.63 2.82 2.77 6 1.94 2.65 5255Estonia 7.03 2.65 0.68 1.86 2.41 3.3 0.02 1.4 15478Ethiopia 5.86 5.34 4.24 4.33 3.75 7.6 6.41 5.94 1055Finland 5.03 0.99 0.48 2.57 2.53 0.4 0.1 0.48 32153France 4.11 2.47 0.49 2.62 2.60 2.6 0.1 0.48 30386Gabon 4.26 5.73 3.97 4.52 3.18 7 1.6 3.23 6954Georgia 7.42 5.05 0.93 2.56 2.45 7.2 0 2.46 3365Germany 5.82 1.41 0.53 2.12 3.53 2 0.1 0.65 29461Ghana 6.60 4.26 1.79 3.21 3.15 6.7 4.21 4.47 2480Greece 6.82 3.44 0.47 3.79 3.95 5.6 0.4 0.74 23381Guatemala 7.77 4.78 0.83 3.16 3.73 7.4 3.09 3.11 4568Honduras 8.94 5.15 1.06 2.77 3.21 7.5 2 3 3430Hungary 5.70 3.32 0.52 1.76 2.82 4.8 0.1 1.26 17887Iceland 6.94 1.20 1.38 4.10 1.24 0.4 0.1 0.32 36510India 7.14 3.88 3.30 3.18 3.83 6.7 3.9 3.81 3452
63
Indonesia 6.36 6.07 2.82 2.71 4.17 7.6 0.96 2.72 3843Iran 6.79 3.89 1.76 3.58 5.24 7.3 1.76 2.41 7968Ireland 6.38 2.11 0.48 1.69 2.51 2.6 0.1 0.41 38505Israel 3.83 3.78 0.86 2.44 3.62 4.1 0.29 0.68 25864Italy 5.99 3.74 0.58 2.76 3.16 5.1 0.16 0.59 28529Jamaica 8.51 4.64 1.14 2.95 3.13 6.3 2.01 2.64 4291Japan 6.23 2.10 0.28 4.13 2.31 2.4 0.1 0.47 31267Jordan 5.53 3.60 1.06 2.40 2.55 4.7 0.89 2.27 5530Kazakhstan 7.77 3.79 1.79 3.14 2.89 7.4 0.05 2.06 7857Kenya 7.85 4.93 1.51 3.39 3.20 7.8 2.64 4.79 1240Kuwait 6.63 2.57 0.49 3.27 2.19 5.2 0.67 1.09 26321KyrgyzRepublic 8.05 5.39 1.31 3.22 3.32
7.8 0.13 3.041927
Latvia 5.98 3.11 1.26 2.60 2.65 5.3 0.03 1.45 13646Lesotho 7.10 5.35 2.09 3.81 3.56 6.8 1.78 4.51 3335Lithuania 6.67 3.18 1.13 2.49 2.89 5.2 0.04 1.38 14494Luxembourg 4.93 1.89 1.01 1.84 2.28 1.4 0.1 0.56 60228Macedonia 6.05 5.65 1.82 3.67 2.86 7.3 0.39 1.99 7200Madagascar 6.92 6.68 2.67 3.54 4.23 6.9 2.93 4.67 923Malawi 5.41 4.75 4.69 5.04 3.82 7.3 3.59 5.63 667Malaysia 5.50 3.15 3.98 2.45 2.34 5 1.13 1.89 10882Mali 7.33 5.49 3.53 3.75 3.91 7.2 7.6 6.2 1033Malta 5.91 2.25 0.47 2.57 2.98 3.6 1.21 1.22 19189Mauritania 5.78 4.56 2.91 3.42 3.33 6.9 4.88 4.5 2234Mauritius 7.16 4.14 1.46 2.62 2.65 4.9 1.57 1.96 12715Mexico 7.33 4.55 1.76 2.86 3.28 6.7 0.84 1.71 10751Moldova 6.84 4.28 3.03 3.21 3.76 6.8 0.09 2.92 2100Mongolia 7.52 4.20 1.33 2.99 2.91 7.2 0.22 3 2107Morocco 6.68 3.90 3.11 4.13 4.36 6.8 4.77 3.54 4555Mozambique 4.67 5.87 2.49 3.42 4.04 7.2 6.13 6.16 1242Namibia 6.09 2.68 3.76 3.55 2.25 5.9 1.5 3.5 7586Nepal 5.26 6.04 3.42 4.51 4.54 7.5 5.14 4.66 1550Netherlands 4.06 1.51 0.31 1.67 2.31 1.3 0.1 0.47 32684NewZealand 6.70 1.10 0.65 2.21 1.35 0.4 0.1 0.57 24996Nicaragua 7.52 5.68 0.94 2.91 3.02 7.4 2.33 2.9 3674Niger 3.04 5.68 3.45 5.54 5.02 7.7 7.13 6.26 781Nigeria 3.97 6.02 2.62 2.78 3.14 7.8 3.09 5.3 1128Norway 5.80 1.09 1.10 3.38 2.52 1.2 0.1 0.32 41420Oman 5.51 2.95 0.67 2.87 2.44 4.6 1.86 1.86 15602Pakistan 7.01 5.69 3.55 4.09 3.44 7.8 5.01 4.49 2370Panama 8.37 4.79 0.89 2.59 3.02 6.9 0.81 1.88 7605Paraguay 7.50 6.57 1.80 2.28 4.86 7.4 0.65 2.45 4642Peru 8.27 5.00 1.24 2.69 3.56 6.7 1.21 2.27 6039Philippines 7.12 5.10 1.87 2.83 3.72 7.5 0.74 2.29 5137Poland 5.34 4.17 0.46 3.16 3.64 6.3 0.1 1.3 13847Portugal 5.71 2.79 0.68 2.67 3.78 3.4 0.62 1.03 20410Romania 5.54 4.49 1.31 2.88 3.55 6.9 0.27 1.87 9060Russia 5.64 4.27 2.54 4.00 4.21 7.5 0.06 1.98 10845Rwanda 4.87 6.96 3.21 5.61 2.92 7.5 3.51 5.48 1206Senegal 6.07 6.45 3.06 3.87 4.43 6.7 6.07 5.01 1792SierraLeone 7.13 6.83 2.76 4.74 4.57 7.8 6.52 6.64 806Singapore 7.86 1.57 1.01 0.65 1.78 0.6 0.75 0.78 29663Slovenia 2.48 3.95 1.06 2.77 2.80 3.6 0.03 0.83 22273SouthAfrica 6.97 3.45 2.24 3.30 2.85 5.4 1.76 3.26 11110Spain 6.69 3.29 0.51 2.84 3.14 3.2 0.1 0.51 27169SriLanka 7.03 5.08 3.90 3.65 3.83 6.9 0.93 2.57 4595Sweden 3.73 1.59 0.39 2.28 2.74 0.8 0.1 0.44 32525
64
Switzerland 7.89 1.34 0.44 3.21 1.88 0.9 0.1 0.45 35633Tanzania 5.20 4.06 0.99 4.07 3.74 7.8 3.06 5.33 744Thailand 7.33 3.80 3.39 2.49 2.63 6.4 0.74 2.19 8677Togo 6.36 7.54 3.10 3.83 5.23 7.6 4.68 4.88 1506TrinidadTob 7.24 4.96 1.47 2.84 2.62 6.8 0.16 1.86 14603Tunisia 5.31 3.10 3.02 3.86 3.15 5.4 2.57 2.34 8371Turkey 7.82 3.71 4.58 3.23 4.53 6.2 1.26 2.25 8407Uganda 7.23 5.72 1.20 3.67 2.71 7.3 3.32 4.95 1454Ukraine 4.06 4.75 3.40 3.62 4.08 7.2 0.06 2.12 6848UAE 6.21 3.04 1.68 1.49 2.55 3.8 1.13 1.32 25514UnitedKingdom 6.64 1.67 0.60 2.24 1.75 1.4 0.1 0.54 33238UnitedStates 7.13 2.42 0.34 2.47 1.69 2.7 0.1 0.49 41890Uruguay 7.52 4.43 2.02 3.01 3.42 3.6 0.32 1.48 9962Venezuela 4.99 6.92 4.36 4.65 5.25 7.7 0.7 2.08 6632Vietnam 4.58 4.18 3.63 3.05 4.00 7.4 0.97 2.67 3071Zambia 8.19 4.42 1.43 2.89 4.00 7.4 3.2 5.66 1023Zimbabwe 2.66 6.39 10.00 7.27 5.65 7.6 1.06 4.87 2038
65

Appendix E: DEA Model with 8 Inputs
Globalization
8
1
126
8
sizGov
legSys
sound$
freeTr
reg
CPI
lit
humDev
GDPcap
Albania 8.07 5.06 0.43 4.07 4.20 7.4 0.13 1.99 5316
Algeria 4.93 4.85 3.67 3.70 4.85 6.9 3.01 2.67 7062
Angola 0.85 6.84 5.94 3.03 4.56 7.8 3.26 5.54 2335
Argentina 7.48 5.65 3.83 3.68 5.06 7.1 0.28 1.31 14280
Armenia 6.26 4.44 0.57 3.47 3.63 7.1 0.06 2.25 4945
Australia 6.77 1.32 0.54 2.83 1.88 1.3 0.1 0.38 31794
Austria 5.18 1.33 0.46 2.32 2.78 1.4 0.1 0.52 33700
Azerbaijan 3.64 4.33 2.90 3.62 4.14 7.6 0.12 2.54 5016
Bahrain 6.52 3.87 0.62 2.70 2.71 4.3 1.35 1.34 21482
Bangladesh 8.04 6.88 3.40 4.18 3.90 8 5.25 4.53 2053
66
Barbados 5.22 3.14 3.77 4.75 2.80 3.3 0.1 1.08 17297
Belgium 4.31 2.98 0.49 1.94 2.91 2.7 0.1 0.54 32119
Belize 4.34 4.16 1.96 4.53 1.57 6.5 2.49 2.22 7109
Benin 7.20 5.67 3.14 4.75 4.22 7.5 6.53 5.63 1141
Bolivia 6.20 5.89 1.34 2.71 4.37 7.3 1.33 3.05 2819
Bosnia 6.09 6.54 2.01 4.19 3.39 7.1 0.33 1.97 7032
Botswana 5.04 3.20 1.38 3.09 2.55 4.4 1.88 3.46 12387
Brazil 6.65 4.81 2.23 3.49 5.31 6.7 1.14 2 8402
Bulgaria 4.95 4.39 1.24 2.36 2.89 6 0.18 1.76 9032
Burkina 5.52 5.97 3.20 4.64 3.55 6.8 7.64 6.3 1213
Burundi4.68 6.94 2.70 5.69 3.22 7.6 4.07 5.87 699
Cameroon 6.52 6.31 2.93 4.20 4.29 7.9 3.21 4.68 2299
Canada 6.88 1.61 0.40 2.86 1.78 1.5 0.1 0.39 33375
Central 6.32 7.01 3.20 5.97 5.09 7.6 5.14 6.16 1224
Chad 6.45 7.72 3.88 4.07 5.19 8 7.43 6.12 1427
Chile 7.50 3.01 0.86 1.60 1.76 2.7 0.43 1.33 12027
China 5.00 4.07 1.78 2.53 5.17 6.7 0.91 2.23 6757
Colombia 4.44 5.51 2.15 3.95 3.95 6.1 0.72 2.09 7304
Congo 3.90 7.65 4.29 3.98 4.78 7.8 1.53 4.52 714
CostaRica 8.01 3.21 1.11 2.38 3.41 5.9 0.51 1.54 10180
CoteD'Ivoire 7.35 6.64 3.12 4.03 3.79 7.9 5.13 5.68 1648
Croatia 4.34 4.26 1.68 3.27 3.36 6.6 0.19 1.5 13042
Cyprus 7.44 2.51 0.81 3.16 4.19 4.4 0.32 0.97 22699
CzechRep 4.49 3.84 0.70 2.08 3.12 5.2 0.1 1.09 20538
Denmark 4.39 1.04 0.64 2.23 1.56 0.5 0.1 0.51 33973
67

DominicanRep 7.80 5.37 4.42 3.04 3.63 7.2 1.3 2.21 8217
Ecuador 8.03 5.94 4.94 3.42 4.40 7.7 0.9 2.28 4341
Egypt 7.29 4.34 1.26 3.37 5.07 6.7 2.86 2.92 4337
ElSalvador 8.96 5.17 0.63 2.82 2.77 6 1.94 2.65 5255
Estonia 7.03 2.65 0.68 1.86 2.41 3.3 0.02 1.4 15478
Ethiopia 5.86 5.34 4.24 4.33 3.75 7.6 6.41 5.94 1055
Finland 5.03 0.99 0.48 2.57 2.53 0.4 0.1 0.48 32153
France 4.11 2.47 0.49 2.62 2.60 2.6 0.1 0.48 30386
Gabon 4.26 5.73 3.97 4.52 3.18 7 1.6 3.23 6954
Georgia7.42 5.05 0.93 2.56 2.45 7.2 0 2.46 3365
Germany 5.82 1.41 0.53 2.12 3.53 2 0.1 0.65 29461
Ghana 6.60 4.26 1.79 3.21 3.15 6.7 4.21 4.47 2480
Greece 6.82 3.44 0.47 3.79 3.95 5.6 0.4 0.74 23381
Guatemala 7.77 4.78 0.83 3.16 3.73 7.4 3.09 3.11 4568
Honduras 8.94 5.15 1.06 2.77 3.21 7.5 2 3 3430
Hungary 5.70 3.32 0.52 1.76 2.82 4.8 0.1 1.26 17887
Iceland 6.94 1.20 1.38 4.10 1.24 0.4 0.1 0.32 36510
India 7.14 3.88 3.30 3.18 3.83 6.7 3.9 3.81 3452
Indonesia 6.36 6.07 2.82 2.71 4.17 7.6 0.96 2.72 3843
Iran 6.79 3.89 1.76 3.58 5.24 7.3 1.76 2.41 7968
Ireland 6.38 2.11 0.48 1.69 2.51 2.6 0.1 0.41 38505
Israel 3.83 3.78 0.86 2.44 3.62 4.1 0.29 0.68 25864
Italy 5.99 3.74 0.58 2.76 3.16 5.1 0.16 0.59 28529
Jamaica8.51 4.64 1.14 2.95 3.13 6.3 2.01 2.64 4291
Japan 6.23 2.10 0.28 4.13 2.31 2.4 0.1 0.47 31267
68

Jordan 5.53 3.60 1.06 2.40 2.55 4.7 0.89 2.27 5530
Kazakhstan 7.77 3.79 1.79 3.14 2.89 7.4 0.05 2.06 7857
Kenya 7.85 4.93 1.51 3.39 3.20 7.8 2.64 4.79 1240
Kuwait 6.63 2.57 0.49 3.27 2.19 5.2 0.67 1.09 26321
KyrgyzRepublic 8.05 5.39 1.31 3.22 3.32 7.8 0.13 3.04 1927
Latvia 5.98 3.11 1.26 2.60 2.65 5.3 0.03 1.45 13646
Lesotho7.10 5.35 2.09 3.81 3.56 6.8 1.78 4.51 3335
Lithuania 6.67 3.18 1.13 2.49 2.89 5.2 0.04 1.38 14494
Luxembourg 4.93 1.89 1.01 1.84 2.28 1.4 0.1 0.56 60228
Macedonia 6.05 5.65 1.82 3.67 2.86 7.3 0.39 1.99 7200
Madagascar 6.92 6.68 2.67 3.54 4.23 6.9 2.93 4.67 923
Malawi 5.41 4.75 4.69 5.04 3.82 7.3 3.59 5.63 667
Malaysia 5.50 3.15 3.98 2.45 2.34 5 1.13 1.89 10882
Mali 7.33 5.49 3.53 3.75 3.91 7.2 7.6 6.2 1033
Malta 5.91 2.25 0.47 2.57 2.98 3.6 1.21 1.22 19189
Mauritania 5.78 4.56 2.91 3.42 3.33 6.9 4.88 4.5 2234
Mauritius 7.16 4.14 1.46 2.62 2.65 4.9 1.57 1.96 12715
Mexico 7.33 4.55 1.76 2.86 3.28 6.7 0.84 1.71 10751
Moldova 6.84 4.28 3.03 3.21 3.76 6.8 0.09 2.92 2100
Mongolia 7.52 4.20 1.33 2.99 2.91 7.2 0.22 3 2107
Morocco 6.68 3.90 3.11 4.13 4.36 6.8 4.77 3.54 4555
Mozambique 4.67 5.87 2.49 3.42 4.04 7.2 6.13 6.16 1242
Namibia 6.09 2.68 3.76 3.55 2.25 5.9 1.5 3.5 7586
Nepal 5.26 6.04 3.42 4.51 4.54 7.5 5.14 4.66 1550
Netherlands 4.06 1.51 0.31 1.67 2.31 1.3 0.1 0.47 32684
69

NewZealand 6.70 1.10 0.65 2.21 1.35 0.4 0.1 0.57 24996
Nicaragua 7.52 5.68 0.94 2.91 3.02 7.4 2.33 2.9 3674
Niger 3.04 5.68 3.45 5.54 5.02 7.7 7.13 6.26 781
Nigeria 3.97 6.02 2.62 2.78 3.14 7.8 3.09 5.3 1128
Norway 5.80 1.09 1.10 3.38 2.52 1.2 0.1 0.32 41420
Oman 5.51 2.95 0.67 2.87 2.44 4.6 1.86 1.86 15602
Pakistan 7.01 5.69 3.55 4.09 3.44 7.8 5.01 4.49 2370
Panama 8.37 4.79 0.89 2.59 3.02 6.9 0.81 1.88 7605
Paraguay 7.50 6.57 1.80 2.28 4.86 7.4 0.65 2.45 4642
Peru 8.27 5.00 1.24 2.69 3.56 6.7 1.21 2.27 6039
Philippines 7.12 5.10 1.87 2.83 3.72 7.5 0.74 2.29 5137
Poland 5.34 4.17 0.46 3.16 3.64 6.3 0.1 1.3 13847
Portugal 5.71 2.79 0.68 2.67 3.78 3.4 0.62 1.03 20410
Romania 5.54 4.49 1.31 2.88 3.55 6.9 0.27 1.87 9060
Russia 5.64 4.27 2.54 4.00 4.21 7.5 0.06 1.98 10845
Rwanda4.87 6.96 3.21 5.61 2.92 7.5 3.51 5.48 1206
Senegal 6.07 6.45 3.06 3.87 4.43 6.7 6.07 5.01 1792
SierraLeone 7.13 6.83 2.76 4.74 4.57 7.8 6.52 6.64 806
Singapore 7.86 1.57 1.01 0.65 1.78 0.6 0.75 0.78 29663
Slovenia 2.48 3.95 1.06 2.77 2.80 3.6 0.03 0.83 22273
SouthAfrica 6.97 3.45 2.24 3.30 2.85 5.4 1.76 3.26 11110
Spain 6.69 3.29 0.51 2.84 3.14 3.2 0.1 0.51 27169
SriLanka 7.03 5.08 3.90 3.65 3.83 6.9 0.93 2.57 4595
Sweden3.73 1.59 0.39 2.28 2.74 0.8 0.1 0.44 32525
Switzerland 7.89 1.34 0.44 3.21 1.88 0.9 0.1 0.45 35633
70

Tanzania 5.20 4.06 0.99 4.07 3.74 7.8 3.06 5.33 744
Thailand 7.33 3.80 3.39 2.49 2.63 6.4 0.74 2.19 8677
Togo 6.36 7.54 3.10 3.83 5.23 7.6 4.68 4.88 1506
TrinidadTob 7.24 4.96 1.47 2.84 2.62 6.8 0.16 1.86 14603
Tunisia 5.31 3.10 3.02 3.86 3.15 5.4 2.57 2.34 8371
Turkey 7.82 3.71 4.58 3.23 4.53 6.2 1.26 2.25 8407
Uganda 7.23 5.72 1.20 3.67 2.71 7.3 3.32 4.95 1454
Ukraine4.06 4.75 3.40 3.62 4.08 7.2 0.06 2.12 6848
UAE 6.21 3.04 1.68 1.49 2.55 3.8 1.13 1.32 25514
UnitedKingdom 6.64 1.67 0.60 2.24 1.75 1.4 0.1 0.54 33238
UnitedStates 7.13 2.42 0.34 2.47 1.69 2.7 0.1 0.49 41890
Uruguay 7.52 4.43 2.02 3.01 3.42 3.6 0.32 1.48 9962
Venezuela 4.99 6.92 4.36 4.65 5.25 7.7 0.7 2.08 6632
Vietnam 4.58 4.18 3.63 3.05 4.00 7.4 0.97 2.67 3071
Zambia 8.19 4.42 1.43 2.89 4.00 7.4 3.2 5.66 1023
Zimbabwe 2.66 6.39 10.00 7.27 5.65 7.6 1.06 4.87 2038
weight1 .8 -.2 -.2 -.2 -.2 -.2 -.2 -.2 0
weight2 -.2 .8 -.2 -.2 -.2 -.2 -.2 -.2 0
weight3 -.2 -.2 .8 -.2 -.2 -.2 -.2 -.2 0
weight4 -.2 -.2 -.2 .8 -.2 -.2 -.2 -.2 0
weight5 -.2 -.2 -.2 -.2 .8 -.2 -.2 -.2 0
weight6 -.2 -.2 -.2 -.2 -.2 .8 -.2 -.2 0
weight7 -.2 -.2 -.2 -.2 -.2 -.2 .8 -.2 0
weight8 -.2 -.2 -.2 -.2 -.2 -.2 -.2 .8 0
71
Appendix F: DEA Model Output
PIONEER V.2 Data Envelopment Analysis
Summary Report: Globalization
Model: BCC
Scaling: Geometric Mean
Orientation: Input
DMUs: 126
Time: 1.36 seconds
Name 1 2 3 4
5 6 7 8
9 10 11 12
13 14 15
Albania 0.5153 0.6225 0.7005 0.7983
0.9102 1
Algeria 0.4022 0.5031 0.5695 0.6329
0.7351 0.8246 0.8876 0.9689
1
Angola 0.3909 0.5245 0.5975 0.6574
0.7259 0.7529 0.823 0.9478
0.9793 1
Argentina 0.4561 0.5304 0.6188 0.6629
0.812 0.9592 1
Armenia 0.6093 0.733 0.8101 0.9341
72
1
Australia 0.9731 1
Austria 0.9027 1
Azerbaijan 0.5412 0.6797 0.7443 0.8132
0.9178 1
Bahrain 0.6105 0.7618 0.8767 0.9466
1
Bangladesh 0.3274 0.4225 0.4813 0.5328
0.5874 0.6423 0.7262 0.777
0.8237 0.8946 0.9695 1
Barbados 0.5908 0.7467 0.9483 1
Belgium 0.8691 1
Belize 0.5135 0.6326 0.707 0.8104
0.9112 1
Benin 0.3417 0.439 0.5001 0.5575
0.6101 0.6235 0.7352 0.7936
0.8337 0.8793 0.9579 1
Bolivia 0.4457 0.5507 0.6183 0.6852
0.7479 0.8622 0.9298 0.9913
1
Bosnia 0.4723 0.5525 0.6432 0.7085
0.8201 0.9168 1
Botswana 0.5826 0.7149 0.8085 0.9154
0.9875 1
Brazil 0.4042 0.502 0.5612 0.6372
73
0.7496 0.8402 0.9148 1
Bulgaria 0.6399 0.7885 0.8694 0.9844
1
Burkina 0.364 0.4792 0.5459 0.6068
0.666 0.6752 0.8018 0.8663
0.8998 0.9525 1
Burundi 0.3567 0.4444 0.506 0.5718
0.6182 0.6439 0.7859 0.8224
0.8782 0.9151 1
Cameroon 0.3504 0.4403 0.5016 0.5587
0.6124 0.6567 0.7532 0.8087
0.8542 0.9129 1
Canada 1
Central 0.3051 0.3903 0.4447 0.5
0.5429 0.5637 0.674 0.7166
0.7633 0.8047 0.8953 0.9843
1
Chad 0.3058 0.4052 0.4616 0.5092
0.5633 0.5915 0.6823 0.7349
0.763 0.8156 0.8693 0.9215
1
Chile 0.7026 0.8886 1
China 0.4662 0.5697 0.6337 0.7454
0.8506 0.9462 1
Colombia 0.4384 0.5387 0.6283 0.727
74

0.8367 0.9353 1
Congo 0.3297 0.4425 0.5041 0.5892
0.6377 0.7273 0.7628 0.8266
0.8926 0.972 1
CostaRica 0.5354 0.6604 0.7328 0.8824
0.9782 1
CoteD'Ivoire 0.3453 0.4393 0.5005 0.5564
0.611 0.6345 0.7486 0.7967
0.8238 0.8824 0.9666 1
Croatia 0.6005 0.716 0.8154 0.8801
1
Cyprus 0.5402 0.6606 0.7468 0.987
1
CzechRep 0.7625 0.9069 1
Denmark 1
DominicanRep 0.4162 0.5206 0.5819 0.6521
0.7415 0.8353 0.8771 1
Ecuador 0.379 0.4741 0.5325 0.6142
0.6963 0.782 0.8324 0.9108
0.989 1
Egypt 0.4336 0.5357 0.5944 0.6339
0.7133 0.8409 0.9423 0.9978
1
ElSalvador 0.5036 0.6229 0.7076 0.7705
0.8318 0.9835 1
75
Estonia 0.796 0.9491 1
Ethiopia 0.3559 0.4775 0.544 0.5985
0.6624 0.6729 0.767 0.863
0.8792 0.9418 0.998 1
Finland 1
France 0.8995 1
Gabon 0.3928 0.5096 0.5805 0.6685
0.7278 0.8225 0.879 0.9835
1
Georgia 0.6648 0.7907 0.8395 1
Germany 0.8154 0.9617 1
Ghana 0.4681 0.5783 0.6417 0.7134
0.7696 0.8089 0.974 1
Greece 0.5639 0.6863 0.8024 0.9261
1
Guatemala 0.4808 0.5941 0.6592 0.6908
0.7242 0.8764 0.9589 1
Honduras 0.4667 0.5766 0.6398 0.6755
0.7395 0.8671 0.9266 0.9816
1
Hungary 0.7919 0.9536 1
Iceland 1
India 0.3985 0.5346 0.609 0.67
0.7422 0.7998 0.8787 0.9748
1
76
Indonesia 0.4003 0.4988 0.5649 0.6659
0.733 0.8321 0.8816 0.9582
1
Iran 0.4164 0.5135 0.5698 0.6358
0.732 0.8197 0.9341 1
Ireland 0.9746 1
Israel 0.6976 0.8322 0.9867 1
Italy 0.6846 0.8086 0.9892 1
Jamaica 0.4771 0.5894 0.654 0.7023
0.7651 0.8966 0.9733 1
Japan 0.8753 1
Jordan 0.6135 0.758 0.8434 0.9532
1
Kazakhstan 0.556 0.6943 0.7611 0.823
0.9853 1
Kenya 0.4458 0.5507 0.6111 0.6455
0.6881 0.7726 0.9018 0.9334
0.9815 1
Kuwait 0.6655 0.8371 0.9344 1
KyrgyzRepublic 0.5111 0.6211 0.6608 0.7805
0.8567 0.9395 1
Latvia 0.6848 0.8436 0.9361 1
Lesotho 0.4046 0.497 0.5595 0.6375
0.691 0.7586 0.8636 0.9318
0.991 1
77
Lithuania 0.6565 0.8039 0.8965 1
Luxembourg 1
Macedonia 0.4962 0.5899 0.6743 0.7372
0.8363 0.9463 1
Madagascar 0.3629 0.4582 0.522 0.588
0.6386 0.6873 0.797 0.8493
0.8864 0.9649 1
Malawi 0.3581 0.4805 0.5474 0.6023
0.6663 0.6771 0.7572 0.8683
0.9033 0.9514 1
Malaysia 0.5853 0.7322 0.8239 0.9332
1
Mali 0.3544 0.4727 0.5385 0.5925
0.6565 0.6661 0.7761 0.8544
0.8705 0.9386 0.9976 1
Malta 0.696 0.8599 0.9542 1
Mauritania 0.4189 0.543 0.6185 0.6824
0.7542 0.7852 0.8937 0.9814
1
Mauritius 0.5179 0.6373 0.721 0.814
0.913 1
Mexico 0.4818 0.5917 0.6614 0.7442
0.8599 0.9434 1
Moldova 0.514 0.6455 0.7065 0.7808
0.8878 0.9927 1
78

Mongolia 0.5391 0.6629 0.7141 0.8288
0.9313 1
Morocco 0.3801 0.4987 0.5681 0.6294
0.6929 0.7724 0.8508 0.9308
0.9813 1
Mozambique 0.4067 0.5052 0.5749 0.6446
0.7022 0.7111 0.8715 0.9125
0.9583 1
Namibia 0.4836 0.649 0.7393 0.8324
0.9018 0.9859 1
Nepal 0.345 0.4524 0.5153 0.5709
0.6286 0.6716 0.758 0.8221
0.8665 0.922 1
Netherlands 1
NewZealand 1
Nicaragua 0.4842 0.5982 0.6646 0.718
0.7646 0.9235 0.9817 1
Niger 0.3432 0.4488 0.5113 0.5705
0.6237 0.6324 0.7474 0.8114
0.8622 0.8989 0.9725 1
Nigeria 0.4395 0.5443 0.6191 0.6921
0.7561 0.7712 0.934 0.9966
1
Norway 0.9175 1
Oman 0.6639 0.8203 0.9102 0.9539
79

1
Pakistan 0.3542 0.4666 0.5315 0.5854
0.6481 0.6959 0.7746 0.8436
0.8862 0.9439 1
Panama 0.5057 0.6348 0.7175 0.7929
0.8984 0.9927 1
Paraguay 0.4058 0.5025 0.5762 0.6469
0.7391 0.8337 0.9589 1
Peru 0.4624 0.5713 0.6413 0.7049
0.783 0.895 0.9536 1
Philippines 0.4408 0.5375 0.6056 0.7072
0.7779 0.8653 0.9437 1
Poland 0.6553 0.7866 0.917 1
Portugal 0.6082 0.76 0.8641 1
Romania 0.5453 0.6727 0.7403 0.8385
0.9 1
Russia 0.5052 0.626 0.6953 0.7688
0.8972 1
Rwanda 0.3488 0.4508 0.5135 0.5754
0.6269 0.6588 0.7689 0.8305
0.8815 0.9149 1
Senegal 0.3555 0.4634 0.5279 0.5861
0.6444 0.6817 0.7881 0.8448
0.8796 0.9433 1
SierraLeone 0.3318 0.4127 0.4698 0.5289
80

0.5739 0.5877 0.7166 0.748
0.7945 0.8279 0.9273 0.9886
1
Singapore 1
Slovenia 0.8801 1
SouthAfrica 0.4719 0.6049 0.6891 0.7677
0.8435 0.9037 1
Spain 0.7016 0.8325 1
SriLanka 0.4002 0.5006 0.5621 0.6724
0.7344 0.8234 0.8628 0.9714
1
Sweden 1
Switzerland 1
Tanzania 0.5015 0.6196 0.6875 0.7205
0.7553 0.8667 1
Thailand 0.4988 0.6239 0.6973 0.8265
0.9114 0.997 1
Togo 0.3266 0.4166 0.4746 0.5333
0.5797 0.6333 0.7265 0.7711
0.8138 0.8988 0.9629 1
TrinidadTob 0.5628 0.6832 0.7646 0.8489
0.9706 1
Tunisia 0.4834 0.6165 0.7023 0.7941
0.8725 1
Turkey 0.4209 0.5264 0.5887 0.6808
81
0.773 0.8645 0.9401 1
Uganda 0.4594 0.5675 0.6335 0.6855
0.7219 0.8071 0.9237 0.973
1
Ukraine 0.546 0.669 0.7497 0.8118
0.9339 1
UAE 0.6541 0.8182 0.9272 1
UnitedKingdom 0.9589 1
UnitedStates 1
Uruguay 0.5144 0.6238 0.7335 0.8906
1
Venezuela 0.3827 0.4577 0.5317 0.5922
0.7042 0.7931 0.8698 1
Vietnam 0.4543 0.5683 0.6352 0.7532
0.8172 0.9069 0.9437 1
Zambia 0.449 0.5547 0.6155 0.6522
0.6942 0.7759 0.9176 0.951
1
Zimbabwe 0.3029 0.3997 0.4553 0.5674
0.6278 0.7093 0.7442 0.8668
0.9277 1
Efficient: 11 9 6 11
10 13 14 13
12 7 10 7
3 0 0
82
Appendix G: DEA Ranking Model Inputs
Globalization
8
1
134
8
sizGov
legSys
sound$
freeTr
reg
CPI
lit
humDev
GDPcap
Albania 8.07 5.06 0.43 4.07 4.20 7.4 0.13 1.99 5316
Algeria 4.93 4.85 3.67 3.70 4.85 6.9 3.01 2.67 7062
Angola 0.85 6.84 5.94 3.03 4.56 7.8 3.26 5.54 2335
Argentina 7.48 5.65 3.83 3.68 5.06 7.1 0.28 1.31 14280
Armenia 6.26 4.44 0.57 3.47 3.63 7.1 0.06 2.25 4945
Australia 6.77 1.32 0.54 2.83 1.88 1.3 0.1 0.38 31794
Austria 5.18 1.33 0.46 2.32 2.78 1.4 0.1 0.52 33700
Azerbaijan 3.64 4.33 2.90 3.62 4.14 7.6 0.12 2.54 5016
Bahrain 6.52 3.87 0.62 2.70 2.71 4.3 1.35 1.34 21482
Bangladesh 8.04 6.88 3.40 4.18 3.90 8 5.25 4.53 2053
83

Barbados 5.22 3.14 3.77 4.75 2.80 3.3 0.1 1.08 17297
Belgium 4.31 2.98 0.49 1.94 2.91 2.7 0.1 0.54 32119
Belize 4.34 4.16 1.96 4.53 1.57 6.5 2.49 2.22 7109
Benin 7.20 5.67 3.14 4.75 4.22 7.5 6.53 5.63 1141
Bolivia 6.20 5.89 1.34 2.71 4.37 7.3 1.33 3.05 2819
Bosnia 6.09 6.54 2.01 4.19 3.39 7.1 0.33 1.97 7032
Botswana 5.04 3.20 1.38 3.09 2.55 4.4 1.88 3.46 12387
Brazil 6.65 4.81 2.23 3.49 5.31 6.7 1.14 2 8402
Bulgaria 4.95 4.39 1.24 2.36 2.89 6 0.18 1.76 9032
Burkina 5.52 5.97 3.20 4.64 3.55 6.8 7.64 6.3 1213
Burundi4.68 6.94 2.70 5.69 3.22 7.6 4.07 5.87 699
Cameroon 6.52 6.31 2.93 4.20 4.29 7.9 3.21 4.68 2299
Canada 6.88 1.61 0.40 2.86 1.78 1.5 0.1 0.39 33375
Central 6.32 7.01 3.20 5.97 5.09 7.6 5.14 6.16 1224
Chad 6.45 7.72 3.88 4.07 5.19 8 7.43 6.12 1427
Chile 7.50 3.01 0.86 1.60 1.76 2.7 0.43 1.33 12027
China 5.00 4.07 1.78 2.53 5.17 6.7 0.91 2.23 6757
Colombia 4.44 5.51 2.15 3.95 3.95 6.1 0.72 2.09 7304
Congo 3.90 7.65 4.29 3.98 4.78 7.8 1.53 4.52 714
CostaRica 8.01 3.21 1.11 2.38 3.41 5.9 0.51 1.54 10180
CoteD'Ivoire 7.35 6.64 3.12 4.03 3.79 7.9 5.13 5.68 1648
Croatia 4.34 4.26 1.68 3.27 3.36 6.6 0.19 1.5 13042
Cyprus 7.44 2.51 0.81 3.16 4.19 4.4 0.32 0.97 22699
CzechRep 4.49 3.84 0.70 2.08 3.12 5.2 0.1 1.09 20538
Denmark 4.39 1.04 0.64 2.23 1.56 0.5 0.1 0.51 33973
84

DominicanRep 7.80 5.37 4.42 3.04 3.63 7.2 1.3 2.21 8217
Ecuador 8.03 5.94 4.94 3.42 4.40 7.7 0.9 2.28 4341
Egypt 7.29 4.34 1.26 3.37 5.07 6.7 2.86 2.92 4337
ElSalvador 8.96 5.17 0.63 2.82 2.77 6 1.94 2.65 5255
Estonia 7.03 2.65 0.68 1.86 2.41 3.3 0.02 1.4 15478
Ethiopia 5.86 5.34 4.24 4.33 3.75 7.6 6.41 5.94 1055
Finland 5.03 0.99 0.48 2.57 2.53 0.4 0.1 0.48 32153
France 4.11 2.47 0.49 2.62 2.60 2.6 0.1 0.48 30386
Gabon 4.26 5.73 3.97 4.52 3.18 7 1.6 3.23 6954
Georgia7.42 5.05 0.93 2.56 2.45 7.2 0 2.46 3365
Germany 5.82 1.41 0.53 2.12 3.53 2 0.1 0.65 29461
Ghana 6.60 4.26 1.79 3.21 3.15 6.7 4.21 4.47 2480
Greece 6.82 3.44 0.47 3.79 3.95 5.6 0.4 0.74 23381
Guatemala 7.77 4.78 0.83 3.16 3.73 7.4 3.09 3.11 4568
Honduras 8.94 5.15 1.06 2.77 3.21 7.5 2 3 3430
Hungary 5.70 3.32 0.52 1.76 2.82 4.8 0.1 1.26 17887
Iceland 6.94 1.20 1.38 4.10 1.24 0.4 0.1 0.32 36510
India 7.14 3.88 3.30 3.18 3.83 6.7 3.9 3.81 3452
Indonesia 6.36 6.07 2.82 2.71 4.17 7.6 0.96 2.72 3843
Iran 6.79 3.89 1.76 3.58 5.24 7.3 1.76 2.41 7968
Ireland 6.38 2.11 0.48 1.69 2.51 2.6 0.1 0.41 38505
Israel 3.83 3.78 0.86 2.44 3.62 4.1 0.29 0.68 25864
Italy 5.99 3.74 0.58 2.76 3.16 5.1 0.16 0.59 28529
Jamaica8.51 4.64 1.14 2.95 3.13 6.3 2.01 2.64 4291
Japan 6.23 2.10 0.28 4.13 2.31 2.4 0.1 0.47 31267
85

Jordan 5.53 3.60 1.06 2.40 2.55 4.7 0.89 2.27 5530
Kazakhstan 7.77 3.79 1.79 3.14 2.89 7.4 0.05 2.06 7857
Kenya 7.85 4.93 1.51 3.39 3.20 7.8 2.64 4.79 1240
Kuwait 6.63 2.57 0.49 3.27 2.19 5.2 0.67 1.09 26321
KyrgyzRepublic 8.05 5.39 1.31 3.22 3.32 7.8 0.13 3.04 1927
Latvia 5.98 3.11 1.26 2.60 2.65 5.3 0.03 1.45 13646
Lesotho7.10 5.35 2.09 3.81 3.56 6.8 1.78 4.51 3335
Lithuania 6.67 3.18 1.13 2.49 2.89 5.2 0.04 1.38 14494
Luxembourg 4.93 1.89 1.01 1.84 2.28 1.4 0.1 0.56 60228
Macedonia 6.05 5.65 1.82 3.67 2.86 7.3 0.39 1.99 7200
Madagascar 6.92 6.68 2.67 3.54 4.23 6.9 2.93 4.67 923
Malawi 5.41 4.75 4.69 5.04 3.82 7.3 3.59 5.63 667
Malaysia 5.50 3.15 3.98 2.45 2.34 5 1.13 1.89 10882
Mali 7.33 5.49 3.53 3.75 3.91 7.2 7.6 6.2 1033
Malta 5.91 2.25 0.47 2.57 2.98 3.6 1.21 1.22 19189
Mauritania 5.78 4.56 2.91 3.42 3.33 6.9 4.88 4.5 2234
Mauritius 7.16 4.14 1.46 2.62 2.65 4.9 1.57 1.96 12715
Mexico 7.33 4.55 1.76 2.86 3.28 6.7 0.84 1.71 10751
Moldova 6.84 4.28 3.03 3.21 3.76 6.8 0.09 2.92 2100
Mongolia 7.52 4.20 1.33 2.99 2.91 7.2 0.22 3 2107
Morocco 6.68 3.90 3.11 4.13 4.36 6.8 4.77 3.54 4555
Mozambique 4.67 5.87 2.49 3.42 4.04 7.2 6.13 6.16 1242
Namibia 6.09 2.68 3.76 3.55 2.25 5.9 1.5 3.5 7586
Nepal 5.26 6.04 3.42 4.51 4.54 7.5 5.14 4.66 1550
Netherlands 4.06 1.51 0.31 1.67 2.31 1.3 0.1 0.47 32684
86

NewZealand 6.70 1.10 0.65 2.21 1.35 0.4 0.1 0.57 24996
Nicaragua 7.52 5.68 0.94 2.91 3.02 7.4 2.33 2.9 3674
Niger 3.04 5.68 3.45 5.54 5.02 7.7 7.13 6.26 781
Nigeria 3.97 6.02 2.62 2.78 3.14 7.8 3.09 5.3 1128
Norway 5.80 1.09 1.10 3.38 2.52 1.2 0.1 0.32 41420
Oman 5.51 2.95 0.67 2.87 2.44 4.6 1.86 1.86 15602
Pakistan 7.01 5.69 3.55 4.09 3.44 7.8 5.01 4.49 2370
Panama 8.37 4.79 0.89 2.59 3.02 6.9 0.81 1.88 7605
Paraguay 7.50 6.57 1.80 2.28 4.86 7.4 0.65 2.45 4642
Peru 8.27 5.00 1.24 2.69 3.56 6.7 1.21 2.27 6039
Philippines 7.12 5.10 1.87 2.83 3.72 7.5 0.74 2.29 5137
Poland 5.34 4.17 0.46 3.16 3.64 6.3 0.1 1.3 13847
Portugal 5.71 2.79 0.68 2.67 3.78 3.4 0.62 1.03 20410
Romania 5.54 4.49 1.31 2.88 3.55 6.9 0.27 1.87 9060
Russia 5.64 4.27 2.54 4.00 4.21 7.5 0.06 1.98 10845
Rwanda4.87 6.96 3.21 5.61 2.92 7.5 3.51 5.48 1206
Senegal 6.07 6.45 3.06 3.87 4.43 6.7 6.07 5.01 1792
SierraLeone 7.13 6.83 2.76 4.74 4.57 7.8 6.52 6.64 806
Singapore 7.86 1.57 1.01 0.65 1.78 0.6 0.75 0.78 29663
Slovenia 2.48 3.95 1.06 2.77 2.80 3.6 0.03 0.83 22273
SouthAfrica 6.97 3.45 2.24 3.30 2.85 5.4 1.76 3.26 11110
Spain 6.69 3.29 0.51 2.84 3.14 3.2 0.1 0.51 27169
SriLanka 7.03 5.08 3.90 3.65 3.83 6.9 0.93 2.57 4595
Sweden3.73 1.59 0.39 2.28 2.74 0.8 0.1 0.44 32525
Switzerland 7.89 1.34 0.44 3.21 1.88 0.9 0.1 0.45 35633
87

Tanzania 5.20 4.06 0.99 4.07 3.74 7.8 3.06 5.33 744
Thailand 7.33 3.80 3.39 2.49 2.63 6.4 0.74 2.19 8677
Togo 6.36 7.54 3.10 3.83 5.23 7.6 4.68 4.88 1506
TrinidadTob 7.24 4.96 1.47 2.84 2.62 6.8 0.16 1.86 14603
Tunisia 5.31 3.10 3.02 3.86 3.15 5.4 2.57 2.34 8371
Turkey 7.82 3.71 4.58 3.23 4.53 6.2 1.26 2.25 8407
Uganda 7.23 5.72 1.20 3.67 2.71 7.3 3.32 4.95 1454
Ukraine4.06 4.75 3.40 3.62 4.08 7.2 0.06 2.12 6848
UAE 6.21 3.04 1.68 1.49 2.55 3.8 1.13 1.32 25514
UnitedKingdom 6.64 1.67 0.60 2.24 1.75 1.4 0.1 0.54 33238
UnitedStates 7.13 2.42 0.34 2.47 1.69 2.7 0.1 0.49 41890
Uruguay 7.52 4.43 2.02 3.01 3.42 3.6 0.32 1.48 9962
Venezuela 4.99 6.92 4.36 4.65 5.25 7.7 0.7 2.08 6632
Vietnam 4.58 4.18 3.63 3.05 4.00 7.4 0.97 2.67 3071
Zambia 8.19 4.42 1.43 2.89 4.00 7.4 3.2 5.66 1023
Zimbabwe 2.66 6.39 10.00 7.27 5.65 7.6 1.06 4.87 2038
Dummy1 .1 .5 .5 .5 .5 .5 .5 .5 40000
Dummy2 .5 .1 .5 .5 .5 .5 .5 .5 40000
Dummy3 .5 .5 .1 .5 .5 .5 .5 .5 40000
Dummy4 .5 .5 .5 .1 .5 .5 .5 .5 40000
Dummy5 .5 .5 .5 .5 .1 .5 .5 .5 40000
Dummy6 .5 .5 .5 .5 .5 .1 .5 .5 40000
Dummy7 .5 .5 .5 .5 .5 .5 .1 .5 40000
Dummy8 .5 .5 .5 .5 .5 .5 .5 .1 40000
weight1 .8 -.2 -.2 -.2 -.2 -.2 -.2 -.2 0
88

weight2 -.2 .8 -.2 -.2 -.2 -.2 -.2 -.2 0
weight3 -.2 -.2 .8 -.2 -.2 -.2 -.2 -.2 0
weight4 -.2 -.2 -.2 .8 -.2 -.2 -.2 -.2 0
weight5 -.2 -.2 -.2 -.2 .8 -.2 -.2 -.2 0
weight6 -.2 -.2 -.2 -.2 -.2 .8 -.2 -.2 0
weight7 -.2 -.2 -.2 -.2 -.2 -.2 .8 -.2 0
weight8 -.2 -.2 -.2 -.2 -.2 -.2 -.2 .8 0
89
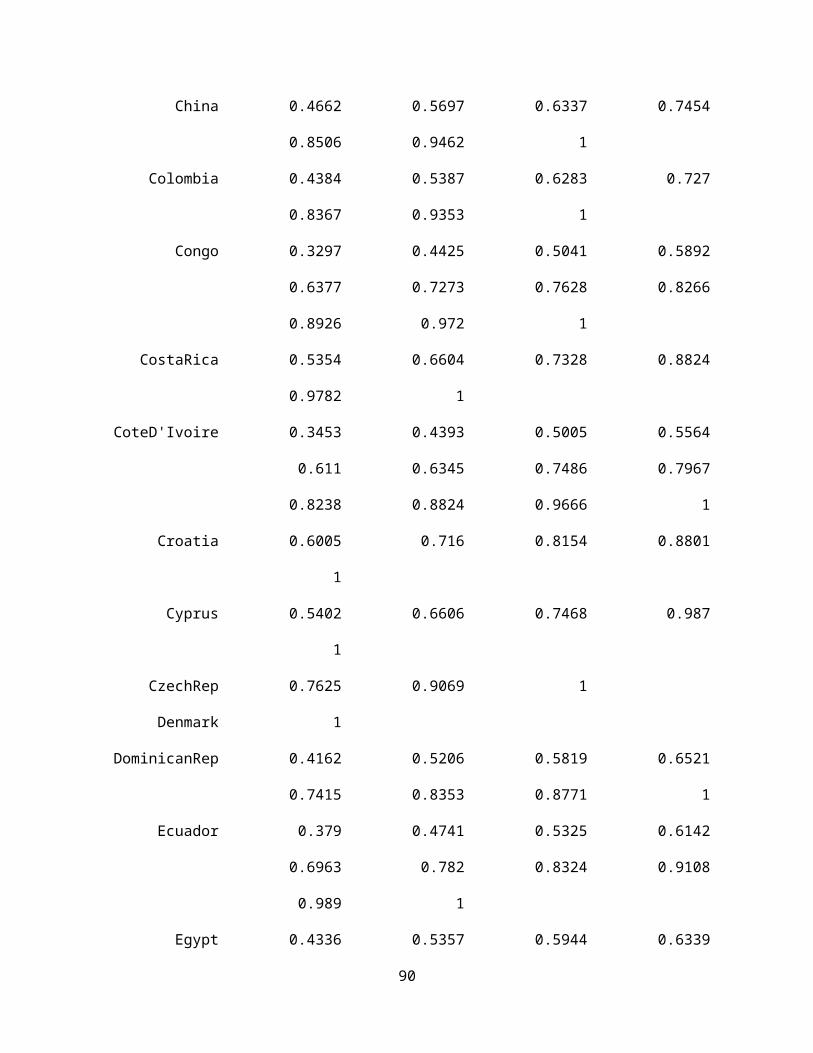
Appendix H: DEA Ranking Model Output
PIONEER V.2 Data Envelopment Analysis
Summary Report: Globalization
Model: BCC
Scaling: Geometric Mean
Orientation: Input
DMUs: 134
Time: 0.094 seconds
Name 1
Albania 0.2518
Algeria 0.1165
Angola 0.1006
Argentina 0.1638
Armenia 0.2682
Australia 0.7286
Austria 0.7054
Azerbaijan 0.1878
Bahrain 0.2436
Bangladesh 0.09154
Barbados 0.2538
Belgium 0.507
Belize 0.164
Benin 0.08697
90

Bolivia 0.1648
Bosnia 0.1996
Botswana 0.1712
Brazil 0.1577
Bulgaria 0.2861
Burkina 0.09015
Burundi 0.09647
Cameroon 0.1042
Canada 0.7097
Central 0.08063
Chad 0.07885
Chile 0.3566
China 0.1874
Colombia 0.1753
Congo 0.1109
CostaRica 0.2635
CoteD'Ivoire 0.09012
Croatia 0.2451
Cyprus 0.3201
CzechRep 0.3695
Denmark 0.8
DominicanRep 0.1345
Ecuador 0.1303
Egypt 0.1408
ElSalvador 0.1867
91

Estonia 0.4079
Ethiopia 0.08849
Finland 0.9178
France 0.4988
Gabon 0.1261
Georgia 0.3004
Germany 0.5912
Ghana 0.1199
Greece 0.2985
Guatemala 0.1476
Honduras 0.168
Hungary 0.4024
Iceland 0.7203
India 0.1148
Indonesia 0.1538
Iran 0.1551
Ireland 0.5716
Israel 0.3477
Italy 0.3709
Jamaica 0.1726
Japan 0.5849
Jordan 0.229
Kazakhstan 0.2466
Kenya 0.1319
Kuwait 0.3166
92
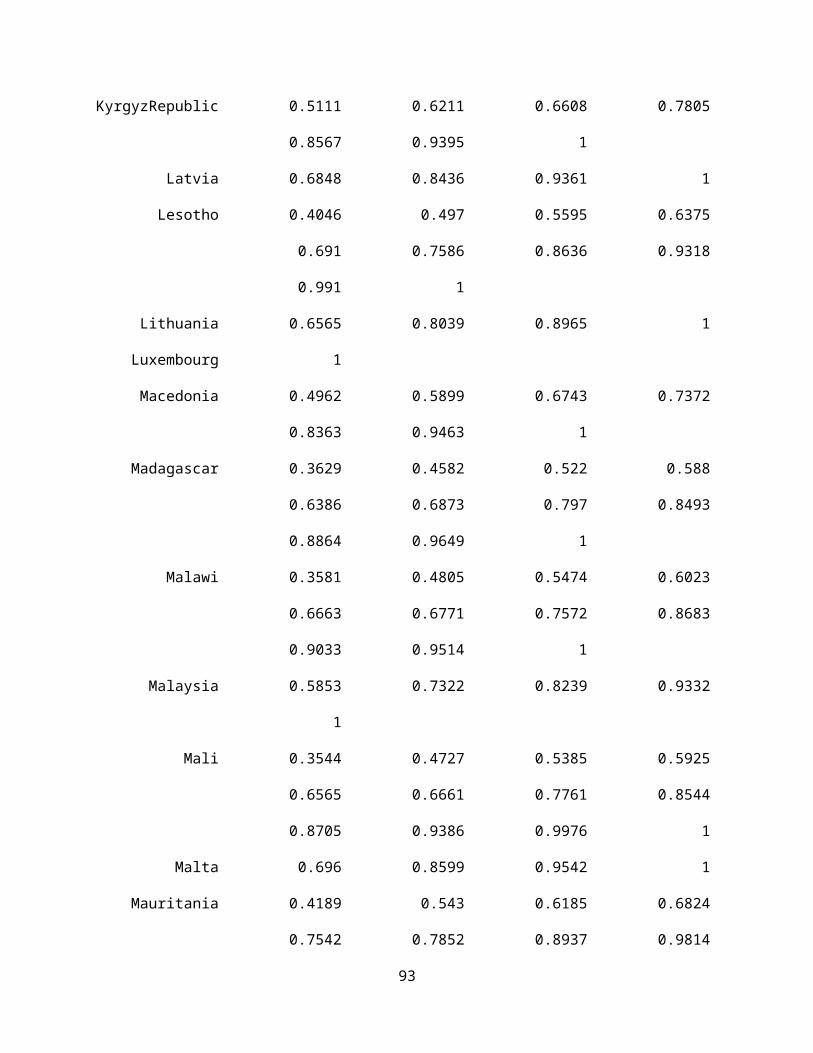
KyrgyzRepublic 0.2224
Latvia 0.3167
Lesotho 0.1306
Lithuania 0.3232
Luxembourg 1
Macedonia 0.2147
Madagascar 0.1105
Malawi 0.09452
Malaysia 0.1799
Mali 0.08844
Malta 0.2802
Mauritania 0.1087
Mauritius 0.1974
Mexico 0.2015
Moldova 0.1789
Mongolia 0.2266
Morocco 0.1063
Mozambique 0.0988
Namibia 0.1449
Nepal 0.09304
Netherlands 0.7591
NewZealand 0.7797
Nicaragua 0.1641
Niger 0.08622
Nigeria 0.1215
93
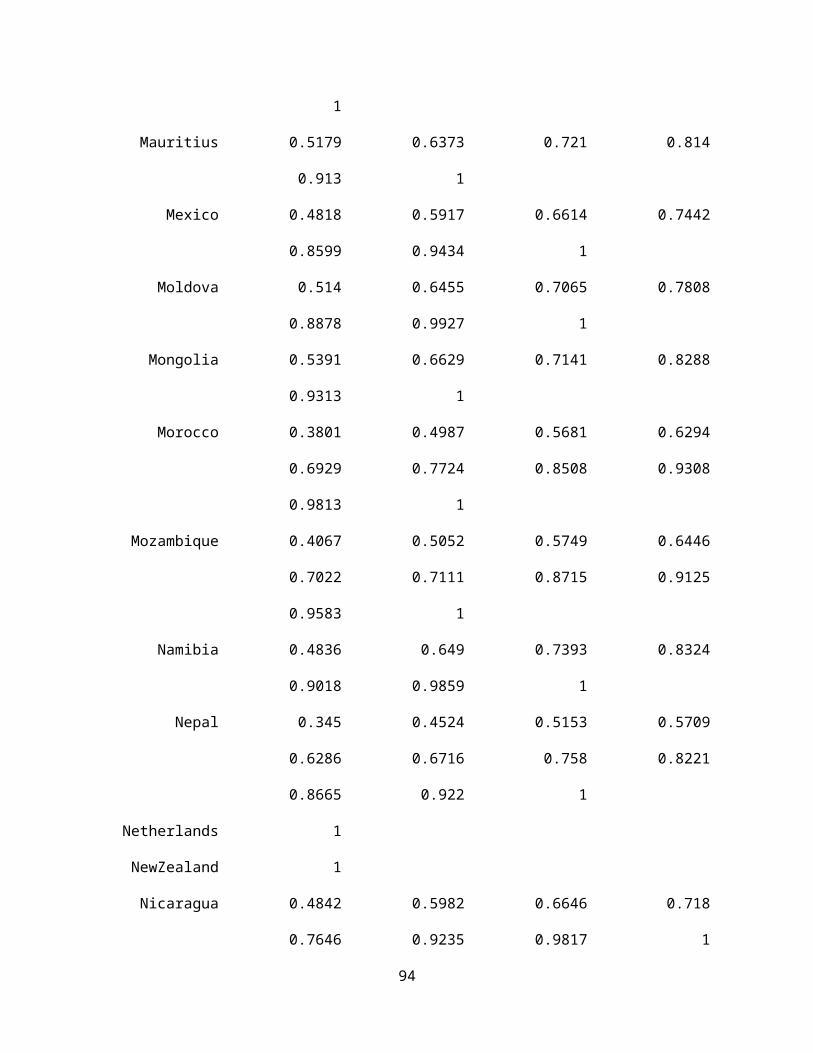
Norway 0.6539
Oman 0.2199
Pakistan 0.09684
Panama 0.2326
Paraguay 0.1855
Peru 0.1896
Philippines 0.1885
Poland 0.3167
Portugal 0.2952
Romania 0.2451
Russia 0.1958
Rwanda 0.09908
Senegal 0.09177
SierraLeone 0.08113
Singapore 0.4745
Slovenia 0.3895
SouthAfrica 0.1541
Spain 0.4206
SriLanka 0.1378
Sweden 0.7907
Switzerland 0.7956
Tanzania 0.1327
Thailand 0.1765
Togo 0.09285
TrinidadTob 0.2681
94

Tunisia 0.1428
Turkey 0.1354
Uganda 0.1247
Ukraine 0.1846
UAE 0.2454
UnitedKingdom 0.6183
UnitedStates 0.6319
Uruguay 0.2315
Venezuela 0.1334
Vietnam 0.1439
Zambia 0.1244
Zimbabwe 0.09776
Dummy1 0.982
Dummy2 1
Dummy3 1
Dummy4 1
Dummy5 1
Dummy6 1
Dummy7 1
Dummy8 1
Efficient: 8
95

Appendix I: Clusters of Countries
Less Developed(1&2) Emerging (4) Developed (3)
Burkina Faso Albania AustraliaCentral Afr. Rep. Algeria AustriaChad Argentina BarbadosMali Armenia BelgiumNiger Azerbaijan CanadaSierra Leone Bahrain ChileAngola Belize CyprusBangladesh Bolivia Czech Rep.
BeninBosnia and Herzegovina Denmark
Burundi Botswana EstoniaCameroon Brazil FinlandCongo, Rep. Of Bulgaria FranceCote d'Ivoire China GermanyEthiopia Colombia HungaryMadagascar Costa Rica IcelandMalawi Croatia IrelandMauritania Dominican Rep. IsraelMozambique Ecuador ItalyNepal Egypt JapanNigeria El Salvador KuwaitPakistan Gabon LatviaRwanda Georgia LithuaniaSenegal Ghana LuxembourgTogo Greece MaltaZambia Guatemala NetherlandsZimbabwe Honduras New Zealand
India NorwayIndonesia PortugalIran SingaporeJamaica SloveniaJordan SpainKazakhstan SwedenKenya SwitzerlandKyrgyz Republic Unit. Arab Em.Lesotho United KingdomMacedonia United StatesMalaysiaMauritiusMexicoMoldovaMongoliaMoroccoNamibiaNicaraguaOmanPanama
96
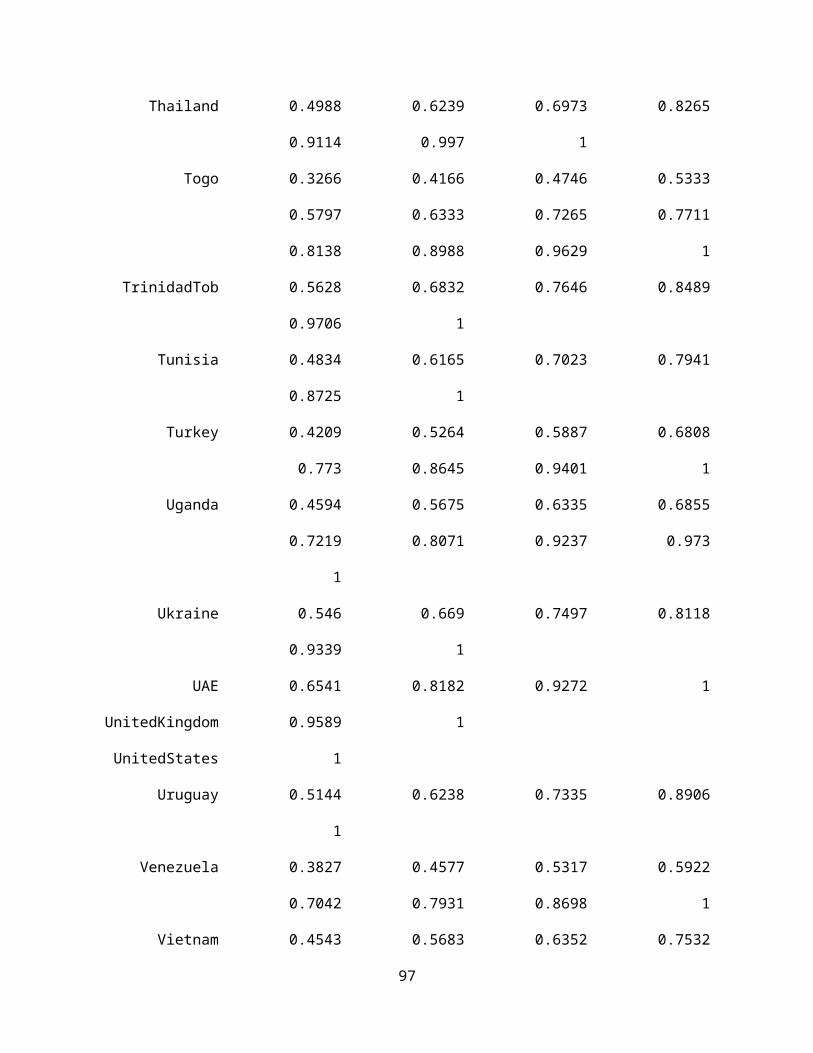
ParaguayPeruPhilippinesPolandRomaniaRussiaSouth AfricaSri LankaTanzaniaThailandTrinidad & Tob.TunisiaTurkeyUgandaUkraineUruguayVenezuelaVietnam
97
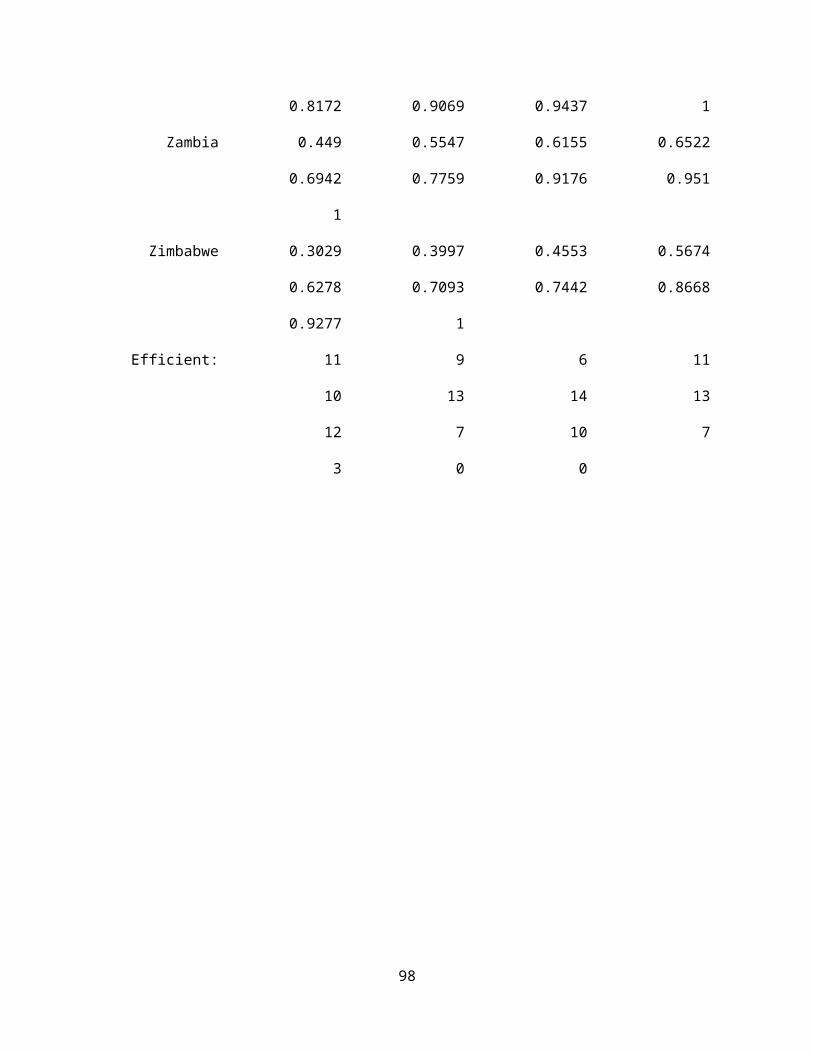
Appendix J: Comparison Analysis Graphs for Clusters
98

99
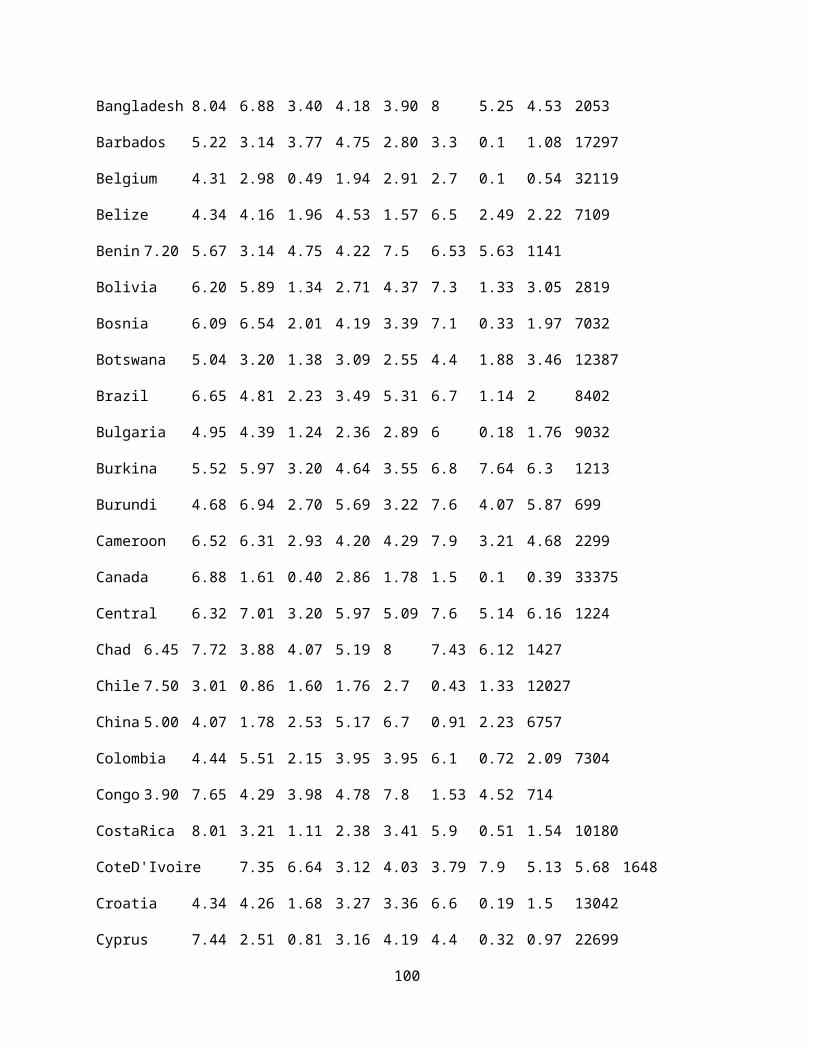
Mostly Closed Partially Open Mostly Open0
5
10
15
20
25
30
35
40
Average Unemployment Rate (%)
Group
100

Mostly Closed Partially Open Mostly Open0
5
10
15
20
25
Average Gross National Savings Rate (% of GDP)
Group
Mostly Closed Partially Open Mostly Open0
1
2
3
4
5
6
Average Total Fertility Rating
Group
101

Mostly Closed Partially Open Mostly Open0.0
5,000.0
10,000.0
15,000.0
20,000.0
25,000.0
30,000.0GDP per Capita in USD
Mostly Closed Partially Open Mostly Open0.0
10.0
20.0
30.0
40.0
50.0
60.0
70.0
80.0
90.0Urbanization Percentage
102
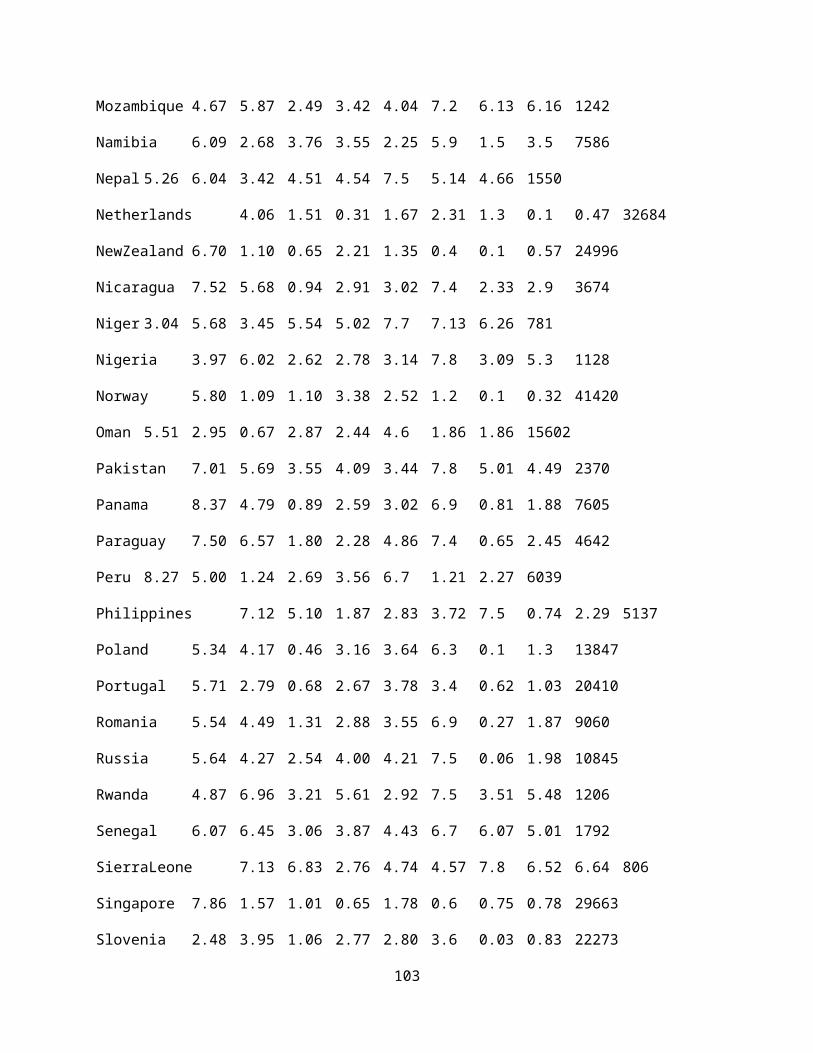
Mostly Closed Partially Open Mostly Open0.0
10.0
20.0
30.0
40.0
50.0
60.0
70.0
80.0
90.0
Life Expectancy
103

Appendix K: DEA Countries and Levels
Level Name 1 2 3 4 5 6 7 8 9 10 11 12 131 Canada 11 Denmark 11 Finland 11 Iceland 1
1Luxembourg 1
1Netherlands 1
1New Zealand 1
1 Singapore 11 Sweden 1
1Switzerland 1
1United States 1
2United Kingdom
0.9589 1
2 Australia0.973
1 1
2 Austria0.902
7 1
2 Belgium0.869
1 1
2 France0.899
5 1
2 Ireland0.974
6 1
2 Japan0.875
3 1
2 Norway0.917
5 1
2 Slovenia0.880
1 1
3 Chile0.702
60.888
6 1
3Czech Rep
0.7625
0.9069 1
3 Estonia 0.7960.949
1 1
3 Germany0.815
40.961
7 1
3 Hungary0.791
90.953
6 1
3 Spain0.701
60.832
5 1
4 Barbados0.590
80.746
70.948
3 1
4 Georgia0.664
80.790
70.839
5 1
4 Israel0.697
60.832
20.986
7 1
4 Italy0.684
60.808
60.989
2 1
4 Kuwait0.665
50.837
10.934
4 1
4 Latvia0.684
80.843
60.936
1 1
4 Lithuania0.656
50.803
90.896
5 1
4 Malta 0.6960.859
90.954
2 1
4 Poland0.655
30.786
6 0.917 1
104
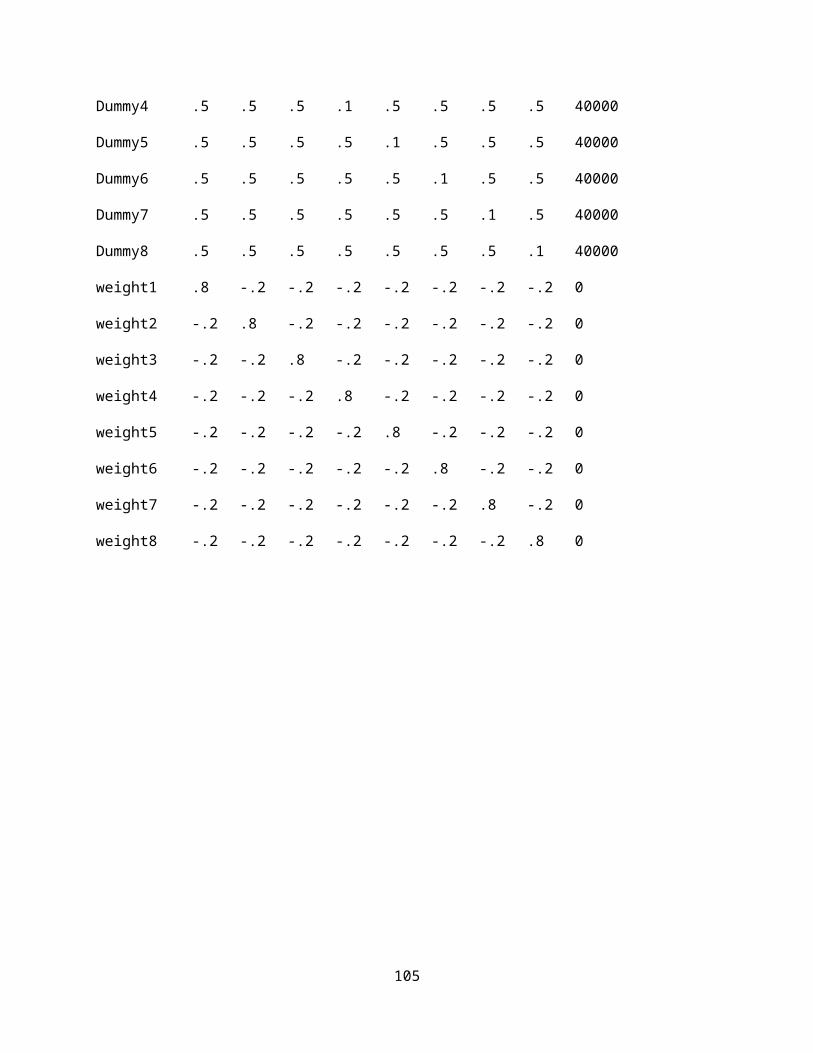
4 Portugal0.608
2 0.760.864
1 1
4 UAE0.654
10.818
20.927
2 1
5 Armenia0.609
3 0.7330.810
10.934
1 1
5 Bahrain0.610
50.761
80.876
70.946
6 1
5 Bulgaria0.639
90.788
50.869
40.984
4 1
5 Croatia0.600
5 0.7160.815
40.880
1 1
5 Cyprus0.540
20.660
60.746
8 0.987 1
5 Greece0.563
90.686
30.802
40.926
1 1
5 Jordan0.613
5 0.7580.843
40.953
2 1
5 Malaysia0.585
30.732
20.823
90.933
2 1
5 Oman0.663
90.820
30.910
20.953
9 1
5 Uruguay0.514
40.623
80.733
50.890
6 1
6 Albania0.515
30.622
50.700
50.798
30.910
2 1
6 Azerbaijan0.541
20.679
70.744
30.813
20.917
8 1
6 Belize0.513
50.632
6 0.7070.810
40.911
2 1
6 Botswana0.582
60.714
90.808
50.915
40.987
5 1
6Costa Rica
0.5354
0.6604
0.7328
0.8824
0.9782 1
6Kazakhstan 0.556
0.6943
0.7611 0.823
0.9853 1
6 Mauritius0.517
90.637
3 0.721 0.814 0.913 1
6 Mongolia0.539
10.662
90.714
10.828
80.931
3 1
6 Romania0.545
30.672
70.740
30.838
5 0.9 1
6 Russia0.505
2 0.6260.695
30.768
80.897
2 1
6Trinidad Tob
0.5628
0.6832
0.7646
0.8489
0.9706 1
6 Tunisia0.483
40.616
50.702
30.794
10.872
5 1
6 Ukraine 0.546 0.6690.749
70.811
80.933
9 1
7 Argentina0.456
10.530
40.618
80.662
9 0.8120.959
2 1
7 Bosnia0.472
30.552
50.643
20.708
50.820
10.916
8 1
7 China0.466
20.569
70.633
70.745
40.850
60.946
2 1
7 Colombia0.438
40.538
70.628
3 0.7270.836
70.935
3 1
7El Salvador
0.5036
0.6229
0.7076
0.7705
0.8318
0.9835 1
7Kyrgyz Republic
0.5111
0.6211
0.6608
0.7805
0.8567
0.9395 1
7Macedonia
0.4962
0.5899
0.6743
0.7372
0.8363
0.9463 1
7 Mexico0.481
80.591
70.661
40.744
20.859
90.943
4 1
7 Moldova 0.5140.645
50.706
50.780
80.887
80.992
7 1
7 Namibia0.483
6 0.6490.739
30.832
40.901
80.985
9 1
105
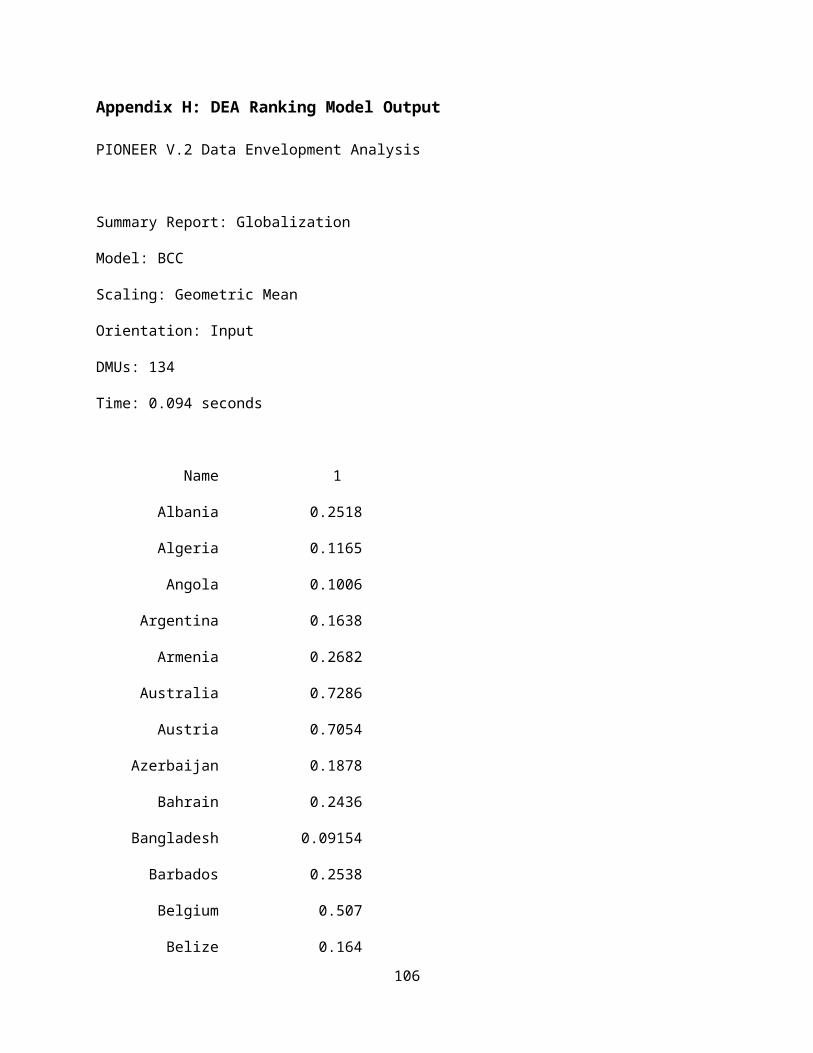
7 Panama0.505
70.634
80.717
50.792
90.898
40.992
7 1
7South Africa
0.4719
0.6049
0.6891
0.7677
0.8435
0.9037 1
7 Tanzania0.501
50.619
60.687
50.720
50.755
30.866
7 1
7 Thailand0.498
80.623
90.697
30.826
50.911
4 0.997 1
8 Brazil0.404
2 0.5020.561
20.637
20.749
60.840
20.914
8 1
8Dominican Rep
0.4162
0.5206
0.5819
0.6521
0.7415
0.8353
0.8771 1
8 Ghana0.468
10.578
30.641
70.713
40.769
60.808
9 0.974 1
8Guatemala
0.4808
0.5941
0.6592
0.6908
0.7242
0.8764
0.9589 1
8 Iran0.416
40.513
50.569
80.635
8 0.7320.819
70.934
1 1
8 Jamaica0.477
10.589
4 0.6540.702
30.765
10.896
60.973
3 1
8 Nicaragua0.484
20.598
20.664
6 0.7180.764
60.923
50.981
7 1
8 Paraguay0.405
80.502
50.576
20.646
90.739
10.833
70.958
9 1
8 Peru0.462
40.571
30.641
30.704
9 0.783 0.8950.953
6 1
8Philippines
0.4408
0.5375
0.6056
0.7072
0.7779
0.8653
0.9437 1
8 Turkey0.420
90.526
40.588
70.680
8 0.7730.864
50.940
1 1
8Venezuela
0.3827
0.4577
0.5317
0.5922
0.7042
0.7931
0.8698 1
8 Vietnam0.454
30.568
30.635
20.753
20.817
20.906
90.943
7 1
9 Algeria0.402
20.503
10.569
50.632
90.735
10.824
60.887
60.968
9 1
9 Bolivia0.445
70.550
70.618
30.685
20.747
90.862
20.929
80.991
3 1
9 Egypt0.433
60.535
70.594
40.633
90.713
30.840
90.942
30.997
8 1
9 Gabon0.392
80.509
60.580
50.668
50.727
80.822
5 0.8790.983
5 1
9 Honduras0.466
70.576
60.639
80.675
50.739
50.867
10.926
60.981
6 1
9 India0.398
50.534
6 0.609 0.670.742
20.799
80.878
70.974
8 1
9 Indonesia0.400
30.498
80.564
90.665
9 0.7330.832
10.881
60.958
2 1
9 Mauritania0.418
9 0.5430.618
50.682
40.754
20.785
20.893
70.981
4 1
9 Nigeria0.439
50.544
30.619
10.692
10.756
10.771
2 0.9340.996
6 1
9 SriLanka0.400
20.500
60.562
10.672
40.734
40.823
40.862
80.971
4 1
9 Uganda0.459
40.567
50.633
50.685
50.721
90.807
10.923
7 0.973 1
9 Zambia 0.4490.554
70.615
50.652
20.694
20.775
90.917
6 0.951 1
10 Angola0.390
90.524
50.597
50.657
40.725
90.752
9 0.8230.947
80.979
3 1
10 Ecuador 0.3790.474
10.532
50.614
20.696
3 0.7820.832
40.910
8 0.989 1
10 Kenya0.445
80.550
70.611
10.645
50.688
10.772
60.901
80.933
40.981
5 1
10 Lesotho0.404
6 0.4970.559
50.637
5 0.6910.758
60.863
60.931
8 0.991 1
10 Morocco0.380
10.498
70.568
10.629
40.692
90.772
40.850
80.930
80.981
3 1
10Mozambique
0.4067
0.5052
0.5749
0.6446
0.7022
0.7111
0.8715
0.9125
0.9583 1
106
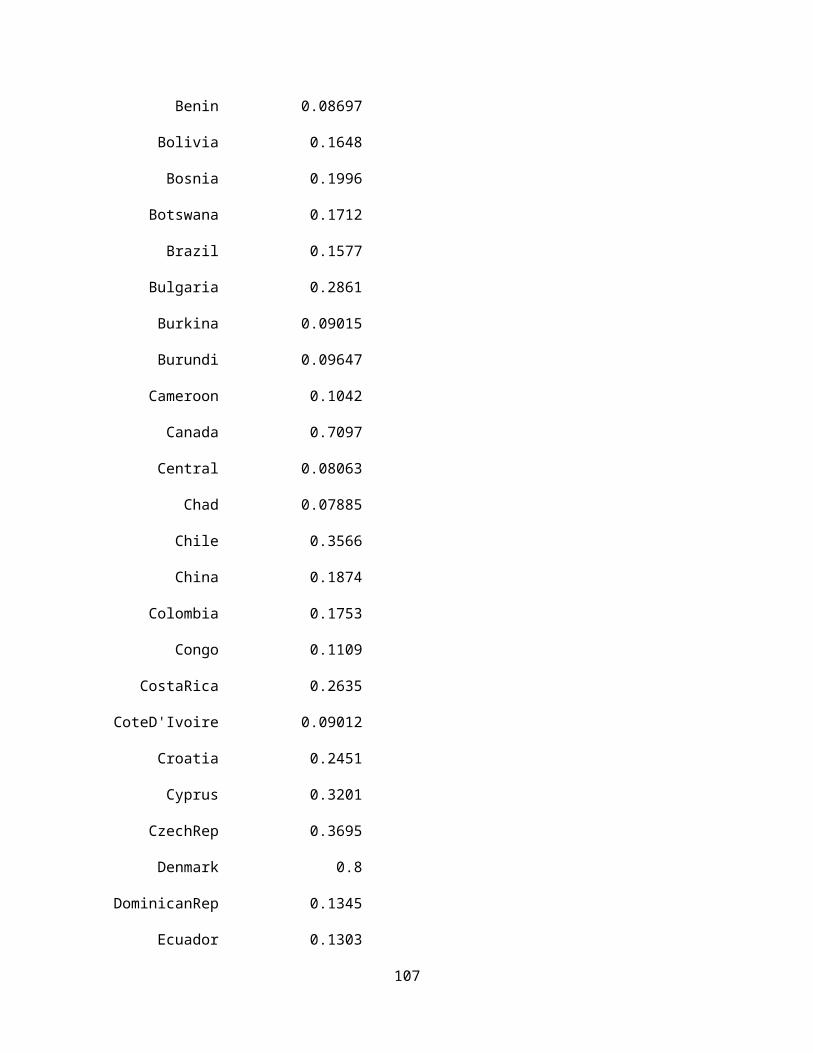
10 Zimbabwe0.302
90.399
70.455
30.567
40.627
80.709
30.744
20.866
80.927
7 1
11 Burkina 0.3640.479
20.545
90.606
8 0.6660.675
20.801
80.866
30.899
80.952
5 1
11 Burundi0.356
70.444
4 0.5060.571
80.618
20.643
90.785
90.822
40.878
20.915
1 1
11 Cameroon0.350
40.440
30.501
60.558
70.612
40.656
70.753
20.808
70.854
20.912
9 1
11 Congo0.329
70.442
50.504
10.589
20.637
70.727
30.762
80.826
60.892
6 0.972 1
11Madagascar
0.3629
0.4582 0.522 0.588
0.6386
0.6873 0.797
0.8493
0.8864
0.9649 1
11 Malawi0.358
10.480
50.547
40.602
30.666
30.677
10.757
20.868
30.903
30.951
4 1
11 Nepal 0.3450.452
40.515
30.570
90.628
60.671
6 0.7580.822
10.866
5 0.922 1
11 Pakistan0.354
20.466
60.531
50.585
40.648
10.695
90.774
60.843
60.886
20.943
9 1
11 Rwanda0.348
80.450
80.513
50.575
40.626
90.658
80.768
90.830
50.881
50.914
9 1
11 Senegal0.355
50.463
40.527
90.586
10.644
40.681
70.788
10.844
80.879
60.943
3 1
12Bangladesh
0.3274
0.4225
0.4813
0.5328
0.5874
0.6423
0.7262 0.777
0.8237
0.8946
0.9695 1
12 Benin0.341
7 0.4390.500
10.557
50.610
10.623
50.735
20.793
60.833
70.879
30.957
9 1
12Cote D'Ivoire
0.3453
0.4393
0.5005
0.5564 0.611
0.6345
0.7486
0.7967
0.8238
0.8824
0.9666 1
12 Ethiopia0.355
90.477
5 0.5440.598
50.662
40.672
9 0.767 0.8630.879
20.941
8 0.998 1
12 Mali0.354
40.472
70.538
50.592
50.656
50.666
10.776
10.854
40.870
50.938
60.997
6 1
12 Niger0.343
20.448
80.511
30.570
50.623
70.632
40.747
40.811
40.862
20.898
90.972
5 1
12 Togo0.326
60.416
60.474
60.533
30.579
70.633
30.726
50.771
10.813
80.898
80.962
9 1
13 Central0.305
10.390
30.444
7 0.50.542
90.563
7 0.6740.716
60.763
30.804
70.895
30.984
3 1
13 Chad0.305
80.405
20.461
60.509
20.563
30.591
50.682
30.734
9 0.7630.815
60.869
30.921
5 1
13Sierra Leone
0.3318
0.4127
0.4698
0.5289
0.5739
0.5877
0.7166 0.748
0.7945
0.8279
0.9273
0.9886 1
15 Efficient: 11 9 6 11 10 13 14 13 12 7 10 7 3
107
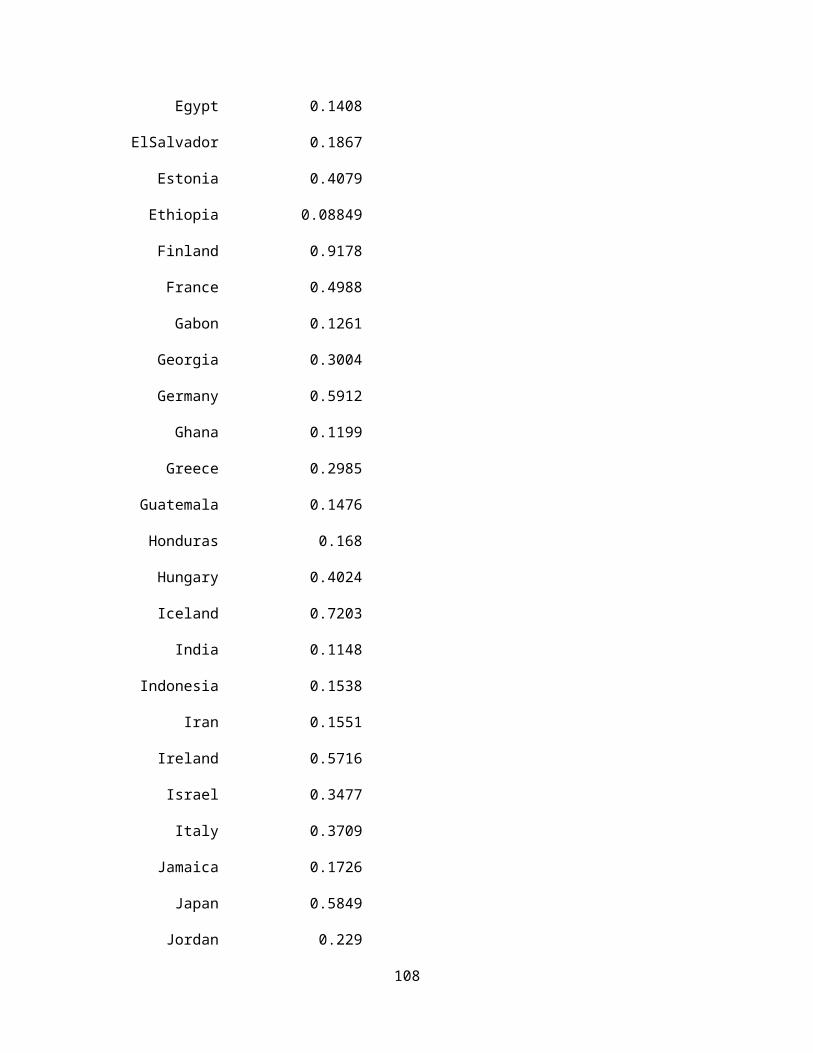
Appendix L: DEA Country Ranking
Ranking CountryEfficienc
y 1 Luxembourg 1.00002 Finland 0.91783 Denmark 0.80004 Switzerland 0.79565 Sweden 0.79076 NewZealand 0.77977 Netherlands 0.75918 Australia 0.72869 Iceland 0.720310 Canada 0.709711 Austria 0.705412 Norway 0.653913 UnitedStates 0.6319
14UnitedKingdom 0.6183
15 Germany 0.591216 Japan 0.584917 Ireland 0.571618 Belgium 0.507019 France 0.498820 Singapore 0.474521 Spain 0.420622 Estonia 0.407923 Hungary 0.402424 Slovenia 0.389525 Italy 0.370926 CzechRep 0.369527 Chile 0.356628 Israel 0.347729 Lithuania 0.323230 Cyprus 0.320131 Latvia 0.316732 Poland 0.316733 Kuwait 0.316634 Georgia 0.300435 Greece 0.298536 Portugal 0.295237 Bulgaria 0.286138 Malta 0.280239 Armenia 0.268240 TrinidadTob 0.268141 CostaRica 0.263542 Barbados 0.253843 Albania 0.251844 Kazakhstan 0.246645 UAE 0.245446 Croatia 0.245147 Romania 0.245148 Bahrain 0.243649 Panama 0.232650 Uruguay 0.231551 Jordan 0.229052 Mongolia 0.2266
108

53KyrgyzRepublic 0.2224
54 Oman 0.219955 Macedonia 0.214756 Mexico 0.201557 Bosnia 0.199658 Mauritius 0.197459 Russia 0.195860 Peru 0.189661 Philippines 0.188562 Azerbaijan 0.187863 China 0.187464 ElSalvador 0.186765 Paraguay 0.185566 Ukraine 0.184667 Malaysia 0.179968 Moldova 0.178969 Thailand 0.176570 Colombia 0.175371 Jamaica 0.172672 Botswana 0.171273 Honduras 0.168074 Bolivia 0.164875 Nicaragua 0.164176 Belize 0.164077 Argentina 0.163878 Brazil 0.157779 Iran 0.155180 SouthAfrica 0.154181 Indonesia 0.153882 Guatemala 0.147683 Namibia 0.144984 Vietnam 0.143985 Tunisia 0.142886 Egypt 0.140887 SriLanka 0.137888 Turkey 0.135489 DominicanRep 0.134590 Venezuela 0.133491 Tanzania 0.132792 Kenya 0.131993 Lesotho 0.130694 Ecuador 0.130395 Gabon 0.126196 Uganda 0.124797 Zambia 0.124498 Nigeria 0.121599 Ghana 0.1199100 Algeria 0.1165101 India 0.1148102 Congo 0.1109103 Madagascar 0.1105104 Mauritania 0.1087105 Morocco 0.1063106 Cameroon 0.1042107 Angola 0.1006108 Rwanda 0.0991
109

109 Mozambique 0.0988110 Zimbabwe 0.0978111 Pakistan 0.0968112 Burundi 0.0965113 Malawi 0.0945114 Nepal 0.0930115 Togo 0.0929116 Senegal 0.0918117 Bangladesh 0.0915118 Burkina 0.0902119 CoteD'Ivoire 0.0901120 Ethiopia 0.0885121 Mali 0.0884122 Benin 0.0870123 Niger 0.0862124 SierraLeone 0.0811125 Central 0.0806126 Chad 0.0789
110
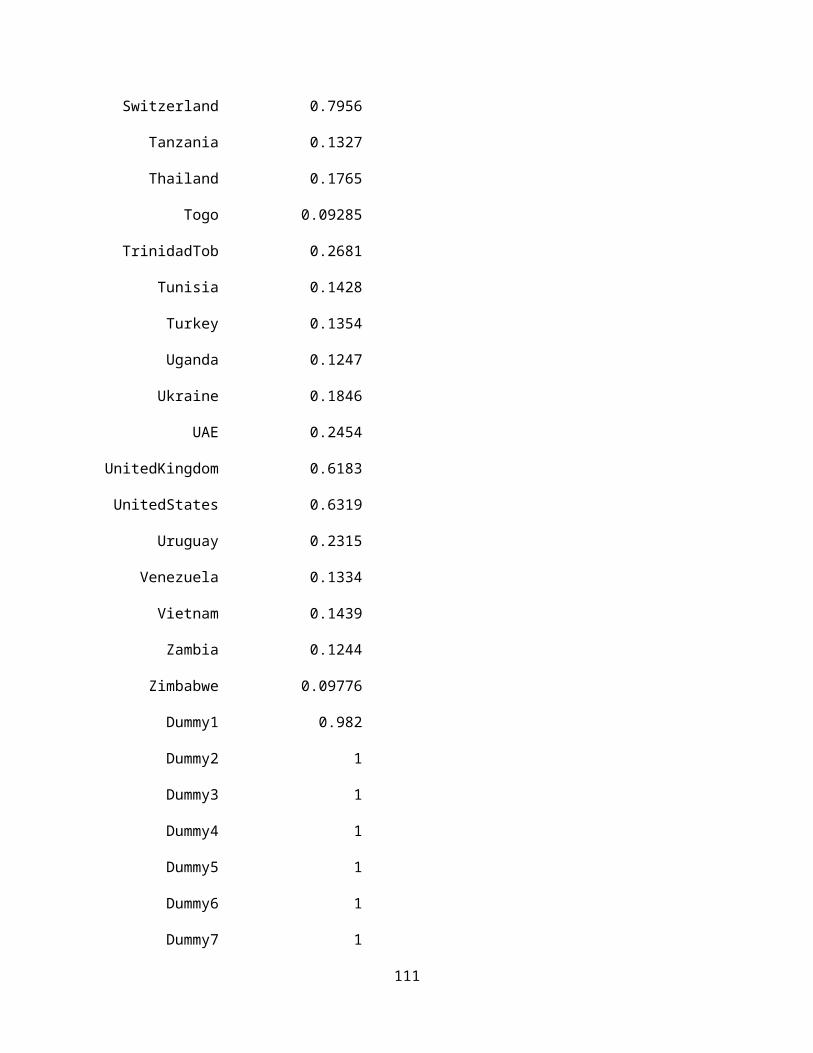
Appendix M: Multiple Regression Analysis Graphs
0 10000 20000 30000 40000 50000 60000 700000
2
4
6
8
10
12Corruption Index Scatter Plot
GDP Per Capita (in $)
Inve
rse
Corr
uptio
n In
dex
0 10000 20000 30000 40000 50000 60000 700000
0.2
0.4
0.6
0.8
1
1.2HDI Scatter Plot
GDP per Capita (in $)
Hum
an D
evel
opm
ent
Inde
x
111
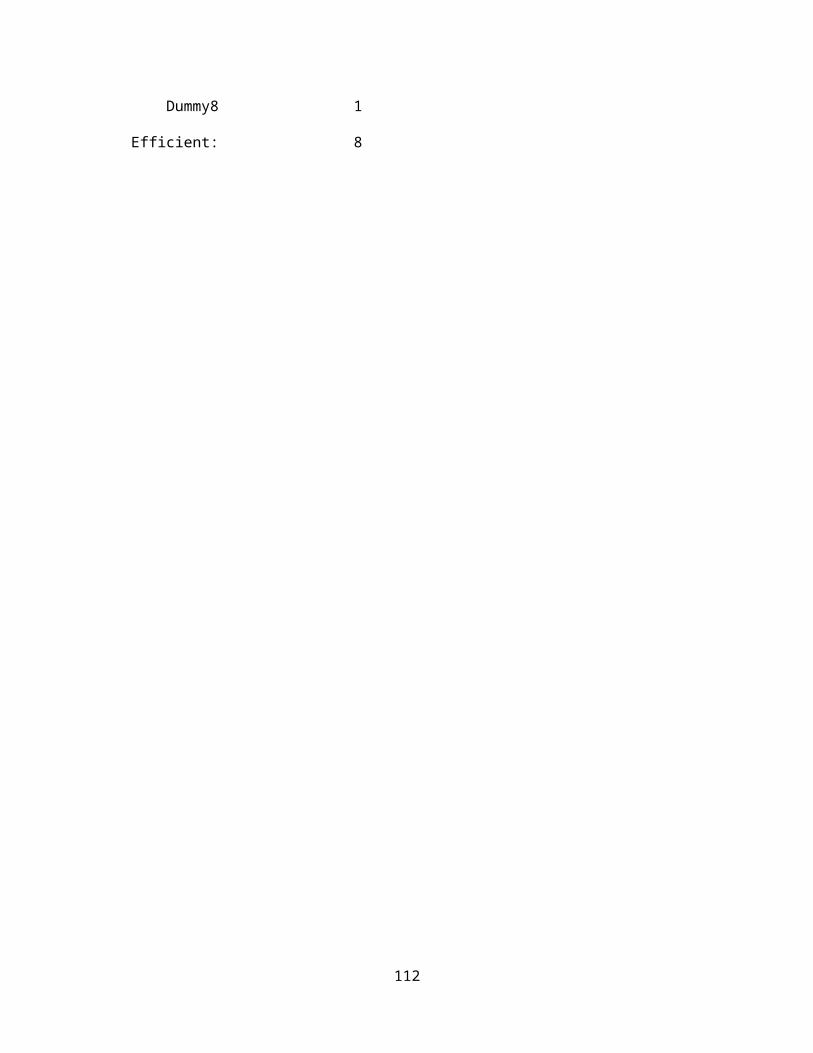
Appendix N: Correlational Values of Modeling Variables
Dependent Indep1 Indep2 Indep3 Indep4 Indep5 Indep6 Indep7 Indep8
Dependent 1
Indep1 -0.12262 1
Indep2 0.814955 -0.01053 1
Indep3 0.549806 0.242778 0.588516 1
Indep4 0.506073 0.174704 0.576864 0.638949 1
Indep5 0.595646 0.083707 0.685601 0.564401 0.492787 1
Indep6 0.900122 -0.09934 0.874807 0.547813 0.530208 0.68554 1
Indep7 0.561302 -0.01224 0.572224 0.441802 0.529322 0.419241 0.497638 1
Indep8 0.782126 0.029803 0.75888 0.587611 0.628514 0.523343 0.725291 0.870801 1
112
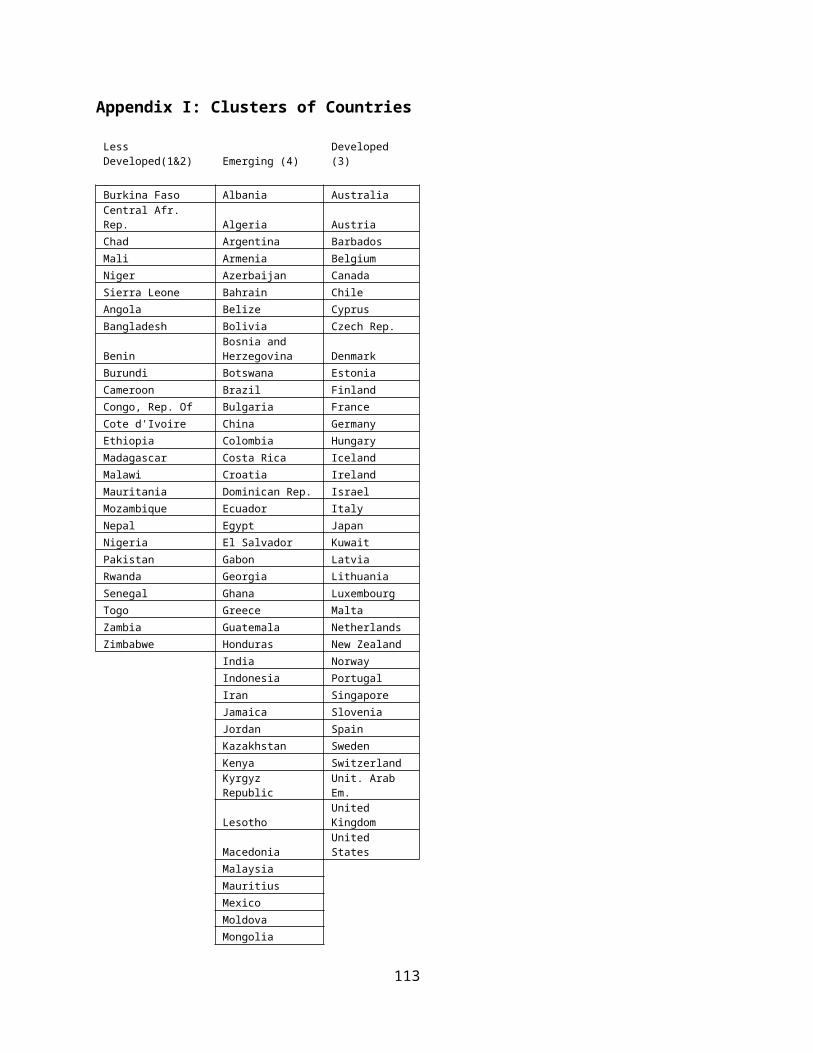
Appendix O: Scatter Plot Comparison Graphs for Modeling Variables vs. GDP per Capita
0.00 1.00 2.00 3.00 4.00 5.00 6.00 7.00 8.00 9.00 10.000
10000
20000
30000
40000
50000
60000
70000Size of Gov't
Size of Gov't
GD
P pe
r Ca
pita
1.00 2.00 3.00 4.00 5.00 6.00 7.00 8.00 9.00 10.000
10000
20000
30000
40000
50000
60000
70000Legal System
Legal System
GD
P pe
r Ca
pita
113

0.00 2.00 4.00 6.00 8.00 10.00 12.000
10000
20000
30000
40000
50000
60000
70000Sound Money
Sound Money
GD
P pe
r Ca
pita
2.00 3.00 4.00 5.00 6.00 7.00 8.00 9.00 10.000
10000
20000
30000
40000
50000
60000
70000Free Trade
Free Trade
GD
P pe
r Ca
pita
114
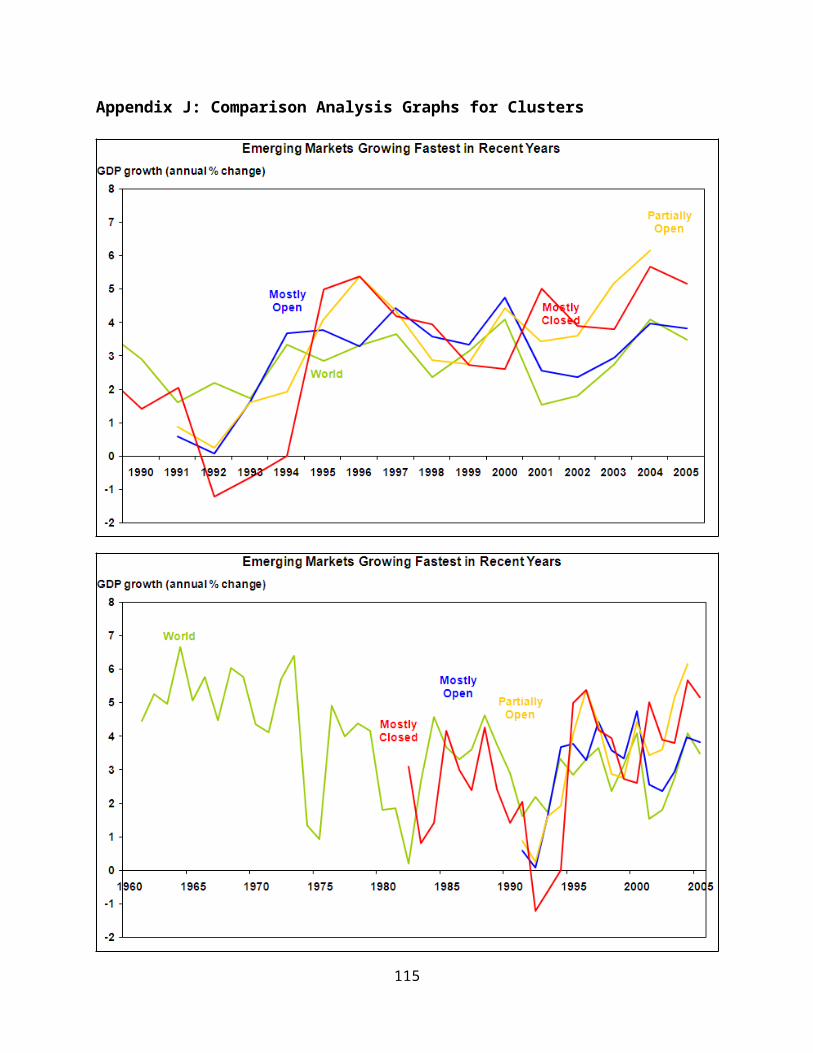
4.00 5.00 6.00 7.00 8.00 9.00 10.000
10000
20000
30000
40000
50000
60000
70000Regulation
Regulation
GD
P pe
r Ca
pita
1 2 3 4 5 6 7 8 9 10 110
10000
20000
30000
40000
50000
60000
70000Corruption
Corruption
GD
P pe
r Ca
pita
115

10 20 30 40 50 60 70 80 90 100 1100
10000
20000
30000
40000
50000
60000
70000Literacy
Literacy
GD
P pe
r Ca
pita
0.3 0.4 0.5 0.6 0.7 0.8 0.9 1 1.10
10000
20000
30000
40000
50000
60000
70000HDI
Human Development Index
GD
P pe
r Ca
pita
116