the virginia tech u.s. forest service december 2017...
TRANSCRIPT

The Virginia Tech – U.S. Forest Service December 2017
Housing Commentary: Section II
Delton Alderman
Forest Products Marketing Unit
Forest Products Laboratory
U.S. Forest Service
Madison, WI
304.431.2734
2018 Virginia Polytechnic Institute and State University VCE-CNRE-9NP
Virginia Cooperative Extension programs and employment are open to all, regardless of age, color, disability, gender, gender identity, gender expression, national origin, political affiliation, race, religion, sexual orientation, genetic information, veteran status, or any other basis protected by law. An equal opportunity/affirmative action employer. Issued in furtherance of Cooperative Extension work, Virginia Polytechnic Institute and State University, Virginia State University, and the U.S. Department of Agriculture cooperating. Edwin J. Jones, Director, Virginia Cooperative Extension, Virginia Tech, Blacksburg; M. Ray McKinnie, Administrator, 1890 Extension Program, Virginia State University, Petersburg.
Urs Buehlmann
Department of Sustainable Biomaterials
College of Natural Resources & Environment
Virginia Tech
Blacksburg, VA
540.231.9759

Table of Contents
Slide 3: Federal Reserve System Indicators
Slide 33: Private Indicators
Slide 78: Demographics
Slide 87: Economics
Slide 91: Virginia Tech Disclaimer
Slide 92: USDA Disclaimer
TOC

Federal Reserve System and Private Indicators
Return to TOC

U.S. Economic Indicators
Source: https://www.frbatlanta.org/economy-matters/regional-economics/data-digests; 2/14/18 Return to TOC
Atlanta Fed GDPNow™
Latest forecast: 3.2 percent — February 14, 2018
“The GDPNow model estimate for real GDP growth (seasonally adjusted annual rate) in the first
quarter of 2018 is 3.2 percent on February 14, down from 4.0 percent on February 9. The nowcast
of first-quarter real consumer spending growth fell from 3.0 percent to 2.0 percent after this
morning's retail sales report from the U.S. Census Bureau and this morning's Consumer Price Index
release from the U.S. Bureau of Labor Statistics.” – Pat Higgins, Economist, Federal Reserve Bank
of Atlanta

U.S. Economic Indicators
Source: https://www.frbatlanta.org/economy-matters/regional-economics/data-digests.aspx; 2/24/18 Return to TOC
The Federal Reserve Bank of Atlanta
Southeast Purchasing Managers Index
“The composite index measures the region's manufacturing sector based on key sector indicators; a
reading below 50 indicates manufacturing is contracting, while over 50 means the industry is
expanding.” – The Federal Reserve Bank of Atlanta
December 2018: 55.8

Return to TOC
Index Points to a pickup in economic growth in December The contribution from production-related indicators to the CFNAI rose to +0.25 in December from –0.02 in
November. Total industrial production increased 0.9 percent in December after moving down 0.1 percent in
November. The sales, orders, and inventories category made a contribution of +0.08 to the CFNAI in
December, up slightly from +0.04 in November. Employment-related indicators contributed +0.01 to the
CFNAI in December, down from +0.12 in November. Nonfarm payrolls increased by 148,000 in
December after increasing by 252,000 in November. The contribution of the personal consumption and
housing category to the CFNAI edged down to –0.07 in December from –0.03 in November. Housing
starts decreased to 1,192,000 annualized units in December from 1,299,000 in November.
… . The November monthly index value was revised to +0.11 from an initial estimate of +0.15, and the
October monthly index value was revised to +0.87 from last month’s estimate of +0.76. Revisions to the
monthly index can be attributed to two main factors: revisions in previously published data and differences
between the estimates of previously unavailable data and subsequently published data. The revisions to
both the November and October monthly index values were primarily due to the former.” – Laura
LaBarbera, Media Relations, Federal Reserve Bank of Chicago
Chicago Fed: National Activity Index
“Led by improvements in production-
related indicators, the Chicago Fed
National Activity Index (CFNAI) moved
up to +0.27 in December from +0.11 in
November. Two of the four broad
categories of indicators that make up the
index increased from November, and
three of the four categories made positive
contributions to the index in December.
The index’s three-month moving average,
CFNAI-MA3, ticked down to +0.42 in
December from +0.43 in November.
Source: https://www.chicagofed.org/publications/cfnai/index; 1/21/18

Return to TOC
Index Points to a Pickup in Midwest Economic Growth in December
The manufacturing sector’s contribution to the MEI increased to +0.39 in December from +0.30 in
November. The pace of manufacturing activity increased in Illinois, Indiana, Michigan, and Wisconsin, but
was unchanged in Iowa. Manufacturing’s contribution to the relative MEI increased to +0.36 in December
from +0.27 in November.
The construction and mining sector’s contribution to the MEI ticked up to –0.02 in December from –0.06 in
November. The pace of construction and mining activity was stronger in Illinois, Indiana, and Iowa, but
unchanged in Michigan and Wisconsin. Construction and mining made a contribution of –0.07 to the
relative MEI in December, up slightly from –0.11 in November.
The service sector contributed +0.05 to the MEI in December, up from a neutral contribution in November.
The pace of service sector activity was up in Illinois and Wisconsin, but unchanged in Indiana, Iowa, and
Michigan. The service sector’s contribution to the relative MEI edged up to –0.27 in December from –0.29
in November.
Consumer spending indicators made a contribution of +0.01 to the MEI in December, up from –0.07 in
November. Consumer spending indicators were, on balance, up in all five Seventh District states.
Consumer spending’s contribution to the relative MEI increased to –0.01 in December from –0.07 in
November.” – Laura LaBarbera, Media Relations, Federal Reserve Bank of Chicago
Chicago Fed: Midwest Economy Index
Midwest Economy Index
“The Midwest Economy Index (MEI) rose to +0.43 in
December from +0.17 in November. Contributions to
the December MEI from all four broad sectors of
nonfarm business activity and all five Seventh Federal
Reserve District states increased from November. The
relative MEI moved up to +0.02 in December from –
0.20 in November. Contributions to the December
relative MEI from all four sectors and all five states
increased from November.
Source: Source: https://www.chicagofed.org/publications/mei/2017/december2017; 1/31/18

Return to TOC
U.S. Economic Indicators
Texas Manufacturing Activity Shows Robust Growth
“Texas factory activity expanded strongly in December, according to business executives responding to
the Texas Manufacturing Outlook Survey. The production index, a key measure of state manufacturing
conditions, spiked 18 points to 32.8, reaching its highest level in more than 11 years.
Other measures of manufacturing activity also pointed to more rapid growth in December. The new
orders index jumped 10 points to 30.1, another 11-year high, and the growth rate of orders index moved
up to 21.4. The capacity utilization index increased nine points to 26.3, and the shipments index rose
from 16.7 to 21.5 this month.
Perceptions of broader business conditions were markedly more positive in December. The general
business activity index and the company outlook index posted double-digit increases, coming in at 29.7
and 31.5, respectively. Both represent highs last seen in 2006.” – Emily Kerr, Business Economist, The
Federal Reserve Bank of Dallas
Source: https://www.dallasfed.org/research/surveys/tmos/2018/181.aspx; 1/26/18
Federal Reserve Bank of Dallas

Return to TOC
U.S. Economic Indicators
Texas Service Sector Activity Remains Solid
“Texas service sector activity continued to increase in December, according to business executives
responding to the Texas Service Sector Outlook Survey. The revenue index, a key measure of state
service sector conditions, was unchanged at 24.4 in December.
Labor market indicators reflected faster employment growth and longer workweeks this month. The
employment index rose from 9.8 to 15.3. The hours worked index edged up to 9.2.
Perceptions of broader economic conditions continued to reflect optimism in December. The general
business activity index edged down two points to 18.1. The company outlook index moved up to 19.6,
its highest reading this year, with 26 percent of respondents reporting that their outlook improved from
last month and 7 percent noting it worsened.” – Amy Jordan, Assistant Economist, The Federal Reserve
Bank of Dallas
Source: https://www.dallasfed.org/research/surveys/tssos/2018/181.aspx; 1/27/18
Federal Reserve Bank of Dallas

Return to TOC
U.S. Economic Indicators
Retail Sales Expand but at a Slower Pace
“Retail sales increased in December, albeit at a slower pace than last month, according to business
executives responding to the Texas Retail Outlook Survey. The sales index fell from 30.4 in December
to 25.6 in December. Inventories increased at a similar pace as last month.
Labor market measures indicated faster retail employment growth and markedly longer workweeks this
month. The employment index jumped 11 points to 13.1. The hours worked index rose sharply from 5.6
to 15.8, its highest reading in over 10 years.
Retailers’ perceptions of broader economic conditions continued to reflect optimism in December. The
general business activity index fell from 25.4 to 20.9. The company outlook index was similar to last
month at 24.7, with 29 percent of respondents reporting that their outlook improved from last month
and 5 percent noting it worsened.” – Amy Jordan, Assistant Economist, The Federal Reserve Bank of
Dallas
Federal Reserve Bank of Dallas
Source: https://www.dallasfed.org/research/surveys/tssos/2018/181.aspx; 1/27/18
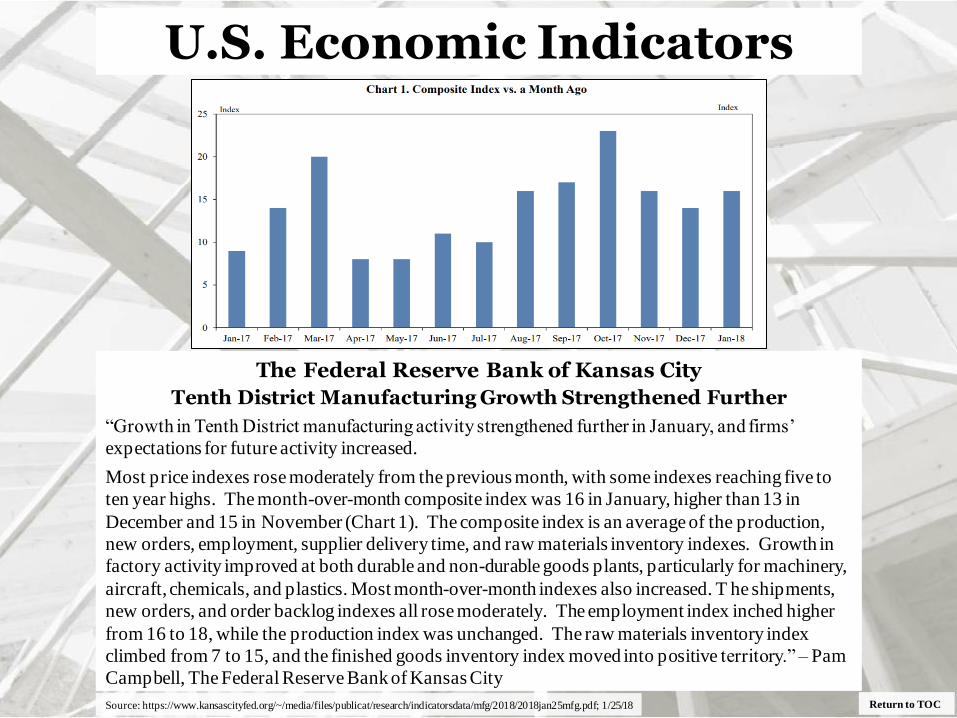
The Federal Reserve Bank of Kansas City
Tenth District Manufacturing Growth Strengthened Further
“Growth in Tenth District manufacturing activity strengthened further in January, and firms’
expectations for future activity increased.
Most price indexes rose moderately from the previous month, with some indexes reaching five to
ten year highs. The month-over-month composite index was 16 in January, higher than 13 in
December and 15 in November (Chart 1). The composite index is an average of the production,
new orders, employment, supplier delivery time, and raw materials inventory indexes. Growth in
factory activity improved at both durable and non-durable goods plants, particularly for machinery,
aircraft, chemicals, and plastics. Most month-over-month indexes also increased. T he shipments,
new orders, and order backlog indexes all rose moderately. The employment index inched higher
from 16 to 18, while the production index was unchanged. The raw materials inventory index
climbed from 7 to 15, and the finished goods inventory index moved into positive territory.” – Pam
Campbell, The Federal Reserve Bank of Kansas City
Return to TOC
U.S. Economic Indicators
Source: https://www.kansascityfed.org/~/media/files/publicat/research/indicatorsdata/mfg/2018/2018jan25mfg.pdf; 1/25/18

Return to TOC
U.S. Economic Indicators The Federal Reserve Bank of Kansas City
“We saw faster growth this month despite some firms noting negative effects from extremely cold
weather, and several price indexes rose considerably.
Most year-over-year factory indexes were slightly higher in January. The composite index rose
from 30 to 35, and the production, order backlog, and new orders for exports indexes also
increased. The shipments and new order indexes were unchanged, while the employment and
capital expenditures indexes fell slightly. The raw materials inventory index jumped from 15 to 38,
and the finished goods inventory index also increased.
Future factory activity expectations improved moderately over the previous month. The future
composite index increased from 23 to 29, and the future production, shipments, new orders, and
order backlog indexes also rose. The future capital expenditures index jumped from 22 to 38, while
the future employment index edged lower. The future raw materials inventory index increased from
7 to 15, and the future finished goods inventory index moved slightly higher.
Most price indexes increased moderately in January. The month-over-month finished goods price
index climbed from 11 to 21, and the raw materials price index rose considerably, with both
reaching their highest level in approximately six years. The year-over-year finished goods price
index increased from 37 to 49, its highest level since July 2011, and the year-over-year raw
materials price index moved moderately higher. The future finished goods price index jumped from
31 to 44, reaching a ten-year high, and the future raw materials price index also increased.” – Chad
Wilkerson, Vice President and Economist, The Federal Reserve Bank of Kansas City
Source: https://www.kansascityfed.org/~/media/files/publicat/research/indicatorsdata/mfg/2018/2018jan25mfg.pdf; 1/25/18

Return to TOC
U.S. Economic Indicators The Federal Reserve Bank of Kansas City
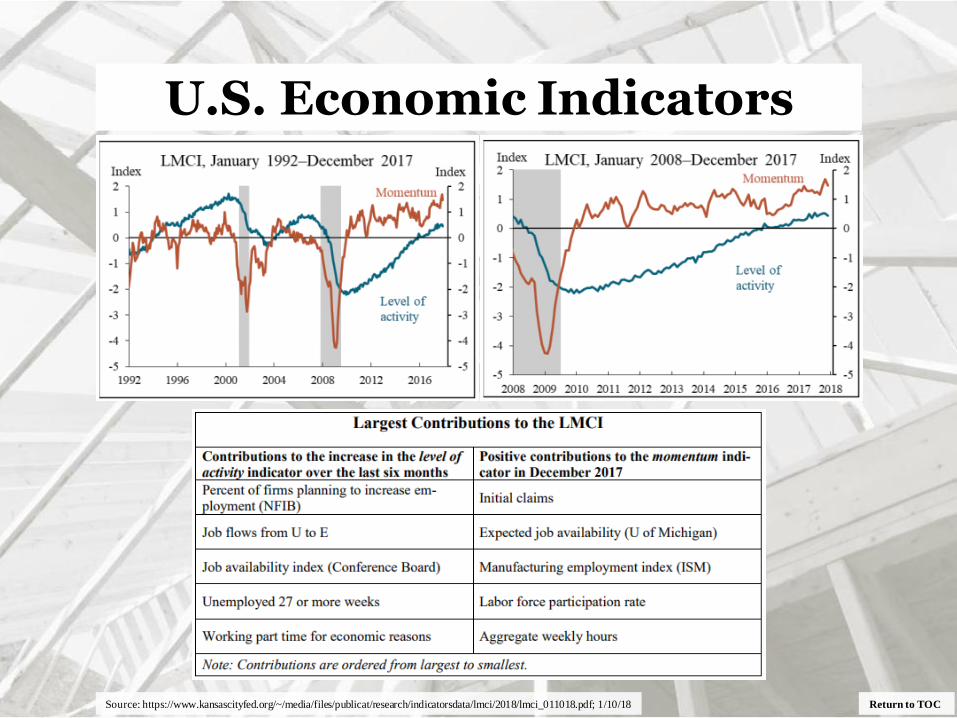
The KC Fed LMCI suggest the level of activity declined modestly
and momentum remained high in December.
“The Kansas City Fed Labor Market Conditions Indicators (LMCI) suggest the level of
activity declined modestly and momentum remained high in December. The level of activity
indicator declined modestly in December from 0.51 to 0.44, while the momentum indicator
decelerated from 1.68 to 1.46.
The table on the following page shows the five labor market variables that made the largest
contributions to the increase in the activity indicator over the last six months and the five
variables that made the largest positive contributions to the momentum indicator in
December 2017. The activity indicator increased 0.07 over the last six months. The largest
contribution came from an increase in the percent of firms planning to increase employment
(NFIB). Fifteen variables made a positive contribution, one variable made no contribution,
and eight variables made a negative contribution. The momentum indicator was 1.46 in
December, where the largest contributor to momentum was initial claims. Eighteen variables
made a positive contribution, and six variables made a negative contribution.” – Bill Medley,
Director, Public Affairs, The Federal Reserve Bank of Kansas City
Source: https://www.kansascityfed.org/~/media/files/publicat/research/indicatorsdata/lmci/2018/lmci_011018.pdf; 1/10/18
Return to TOC
U.S. Economic Indicators
Source: https://www.kansascityfed.org/~/media/files/publicat/research/indicatorsdata/lmci/2018/lmci_011018.pdf; 1/10/18

Return to TOC
Empire State Manufacturing Survey
Conditions Remain Favorable
“Business activity continued to grow at a solid clip in New York State, according to firms
responding to the January 2018 Empire State Manufacturing Survey. The headline general business
conditions index, at 17.7, was little changed from last month’s level. The new orders index and the
shipments index both showed ongoing growth, although at a slower pace than in December.
Unfilled orders and delivery times increased slightly, and inventory levels were higher. Labor
market conditions pointed to a modest increase in employment and steady workweeks. Both input
prices and selling prices increased at a faster pace than last month. Firms remained very optimistic
about future business conditions, and capital spending plans were robust.
Manufacturing firms in New York State reported that business activity continued to expand
strongly. The general business conditions index was little changed at 17.7. Thirty-two percent of
respondents reported that conditions had improved over the month, while 15 percent reported that
conditions had worsened. The new orders index moved down seven points to 11.9, and the
shipments index declined nine points to 14.4 – readings that indicated ongoing growth in orders and
shipments, although at a slower pace than last month. The unfilled orders index climbed into
positive territory and, at 4.3, indicated a small increase in unfilled orders. The delivery time index
was 3.6, indicating that delivery times lengthened somewhat, and the inventories index rose to 13.8,
a sign that inventory levels grew moderately.” – The Federal Reserve Bank of New York
U.S. Economic Indicators
Source: https://www.newyorkfed.org/survey/empire/empiresurvey_overview.html; 1/16/18

Return to TOC
U.S. Economic Indicators
Source: https://www.newyorkfed.org/survey/empire/empiresurvey_overview.html; 1/16/18

Return to TOC
Empire State Manufacturing Survey
Price Increases Pick Up for a Second Consecutive Month
“The index for number of employees fell nineteen points to 3.8, a level suggesting only a small
increase in employment levels. The average workweek index fell to a level near zero, indicating
that hours worked were unchanged. Price increases continued to pick up. The prices paid index
climbed seven points to 36.2, and the prices received index moved up ten points to 21.7.
Firms Remain Optimistic about Future Conditions
Looking ahead, firms remained optimistic about the six-month outlook. The index for future
business conditions edged up two points to 48.6. The index for future inventories rose to 20.3, a
record high, indicating that firms expect to build up inventories significantly in the months ahead.
The index for future number of employees rose three points to 26.9, a multiyear high. The capital
expenditures index edged up to 34.8, also a multiyear high, suggesting capital spending plans were
solid.” – The Federal Reserve Bank of New York
U.S. Economic Indicators
Source: https://www.newyorkfed.org/survey/empire/empiresurvey_overview.html; 1/15/18

Return to TOC
Business Leaders Survey (Services)
Business Climate Remains Positive for a Second Consecutive Month “Activity in the region’s service sector continued to grow at a solid pace, according to firms responding
to the Federal Reserve Bank of New York’s January 2018 Business Leaders Survey. The survey’s
headline business activity index was little changed at 18.1. The business climate index rose seven
points to 16.4, its highest level in more than a decade, signaling that firms, on balance, regarded the
business climate as better than normal. The employment index held steady at 10.5, indicating that
employment continued to increase moderately. The wages index moved up eleven points to 37.1,
suggesting that wages grew at a faster pace than last month. The indexes for input prices and selling
prices edged higher, a sign that prices increased at a somewhat faster pace. Indexes for the six-month
outlook suggested that firms were very optimistic about future conditions.” – The Federal Reserve
Bank of New York
U.S. Economic Indicators
Source: https://www.newyorkfed.org/survey/business_leaders/bls_overview.html; 1/17/18

Return to TOC
Business Leaders Survey
“Business activity in the region’s service sector continued to grow strongly. The headline business
activity index was little changed at 18.1. Thirty-six percent of respondents reported that conditions
improved over the month, while 18 percent said that conditions worsened. The business climate
index advanced seven points to 16.4, its highest level in more than ten years, signaling that, on
balance, firms viewed the business climate as better than normal.
Wages and Prices Increase at a Faster Clip
The employment index remained close to last month’s level at 10.5, indicating that employment
levels continued to increase moderately. The wages index climbed eleven points to 37.1, a sign that
wages increased at a faster pace than in December. The prices paid index edged up four points to
49.3 and the prices received index rose five points to 16.6, indicating that prices increased at a
faster pace than last month. The capital spending index advanced to 14.8, suggesting that capital
spending increased moderately.
Optimism More Widespread
Businesses were very optimistic about the six-month outlook. The index for future business
activity increased fourteen points to 47.2, and the index for future business climate moved up
twelve points to 35.4. The index for future employment suggested that respondents expected
employment to increase in the months ahead, and the index for future wages held steady at 55.8,
pointing to an expectation that wages would grow. The index for planned capital spending was
little changed at 26.1.” – The Federal Reserve Bank of New York
U.S. Economic Indicators
Source: https://www.newyorkfed.org/survey/business_leaders/bls_overview.html; 1/17/18

The Federal Reserve Bank of New York Nowcast
Return to TOC
U.S. Economic Indicators
February 9, 2018: Highlights
• “The New York Fed Staff Nowcast for 2018:Q1 stands at 3.3%.
• News from this week's data releases increased the nowcast by 0.1 percentage point.
• Positive surprises from imports and exports data accounted for most of the increase.” – The
Federal Reserve Bank of New York
Source: https://www.newyorkfed.org/research/policy/nowcast; 2/9/18
Notes: We start reporting the Nowcast for a reference quarter about one month before the quarter begins; we stop updating it about one month after the
quarter closes.
Colored bars reflect the impact of each broad category of data on the Nowcast; the impact of specific data releases is shown in the accompanying table.
Source: Authors' calculations, based on data accessed through Haver Analytics.
Source: https://www.philadelphiafed.org/research-and-data/regional-economy/business-outlook-survey/2018/bos0118; 1/18/18
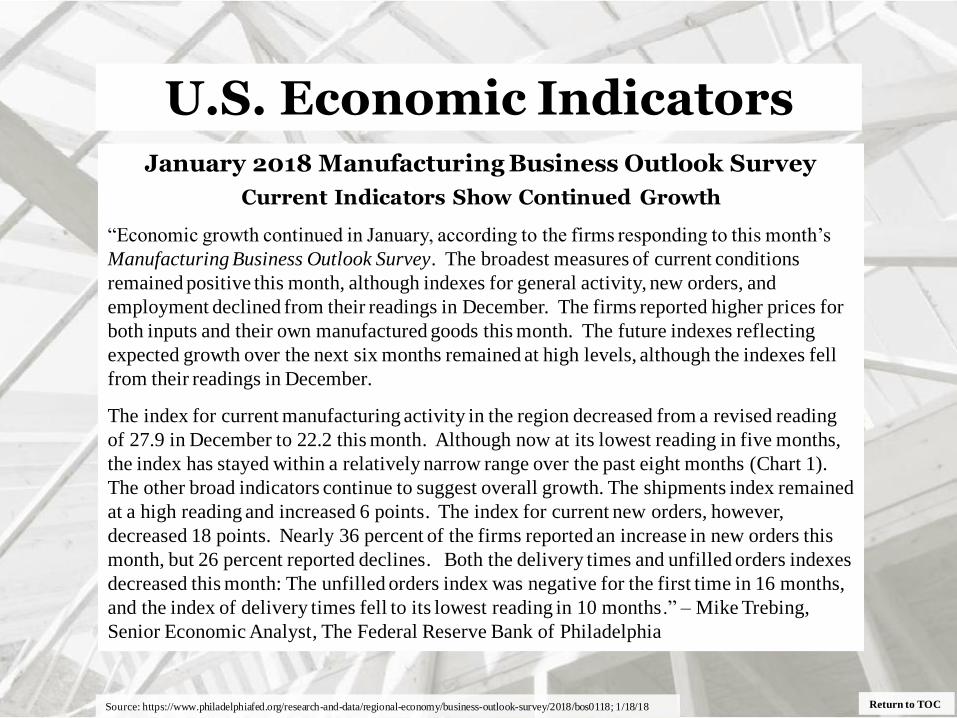
January 2018 Manufacturing Business Outlook Survey
Current Indicators Show Continued Growth
“Economic growth continued in January, according to the firms responding to this month’s
Manufacturing Business Outlook Survey. The broadest measures of current conditions
remained positive this month, although indexes for general activity, new orders, and
employment declined from their readings in December. The firms reported higher prices for
both inputs and their own manufactured goods this month. The future indexes reflecting
expected growth over the next six months remained at high levels, although the indexes fell
from their readings in December.
The index for current manufacturing activity in the region decreased from a revised reading
of 27.9 in December to 22.2 this month. Although now at its lowest reading in five months,
the index has stayed within a relatively narrow range over the past eight months (Chart 1).
The other broad indicators continue to suggest overall growth. The shipments index remained
at a high reading and increased 6 points. The index for current new orders, however,
decreased 18 points. Nearly 36 percent of the firms reported an increase in new orders this
month, but 26 percent reported declines. Both the delivery times and unfilled orders indexes
decreased this month: The unfilled orders index was negative for the first time in 16 months,
and the index of delivery times fell to its lowest reading in 10 months.” – Mike Trebing,
Senior Economic Analyst, The Federal Reserve Bank of Philadelphia
Return to TOC
U.S. Economic Indicators
Source: https://www.philadelphiafed.org/research-and-data/regional-economy/business-outlook-survey/2018/bos0118; 1/18/18
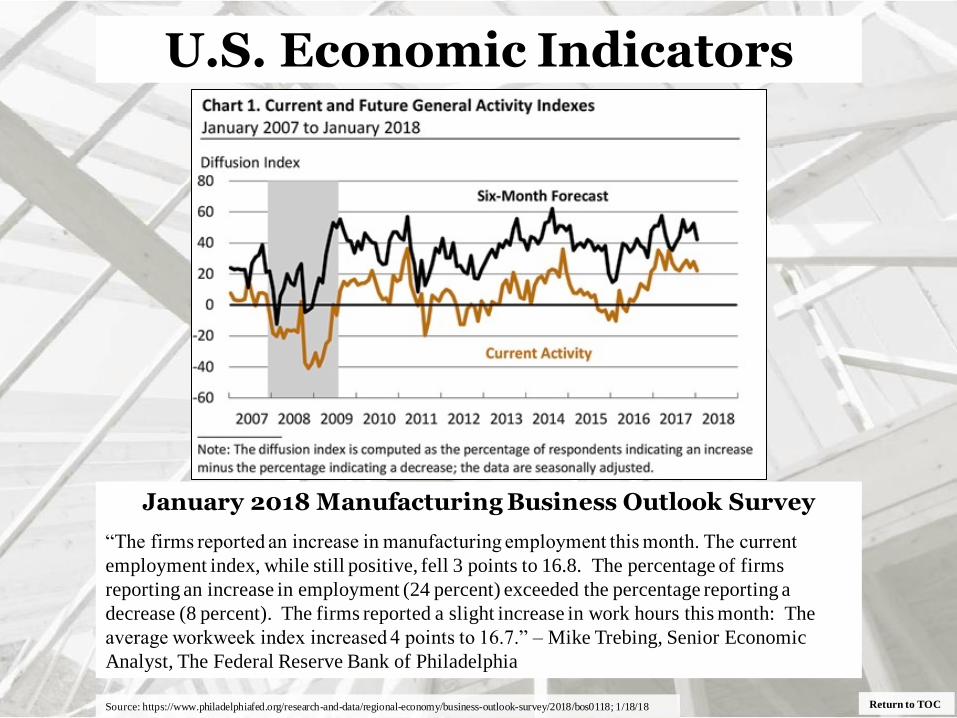
January 2018 Manufacturing Business Outlook Survey
“The firms reported an increase in manufacturing employment this month. The current
employment index, while still positive, fell 3 points to 16.8. The percentage of firms
reporting an increase in employment (24 percent) exceeded the percentage reporting a
decrease (8 percent). The firms reported a slight increase in work hours this month: The
average workweek index increased 4 points to 16.7.” – Mike Trebing, Senior Economic
Analyst, The Federal Reserve Bank of Philadelphia
Return to TOC
U.S. Economic Indicators

Philadelphia Fed: GDPplus
Return to TOC Source: https://philadelphiafed.org/research-and-data/real-time-center/gdpplus/; 1/26/18
“As of December 21 Q3 2018 GDPplus = 2.2%; Real GDP = 3.1%; and
Real GDI = 2.0%.” – The Federal Reserve Bank of Philadelphia

Philadelphia Fed
Return to TOC Source: https://philadelphiafed.org/-/media/research-and-data/regional-economy/indexes/coincident/2017/coincidentindexes1217.pdf; 1/26/18
“The Federal Reserve Bank of Philadelphia has released the coincident indexes for the 50 states for
December 2017. Over the past three months, the indexes increased in 42 states and decreased in eight, for a
three-month diffusion index of 68. In the past month, the indexes increased in 37 states, decreased in 10,
and remained stable in three, for a one-month diffusion index of 54. For comparison purposes, the
Philadelphia Fed has also developed a similar coincident index for the entire United States. The
Philadelphia Fed’s U.S. index rose 0.7 percent over the past three months and 0.2 percent in December.” –
Daniel Mazone, The Federal Reserve Bank of Philadelphia

The Federal Reserve Bank of Richmond
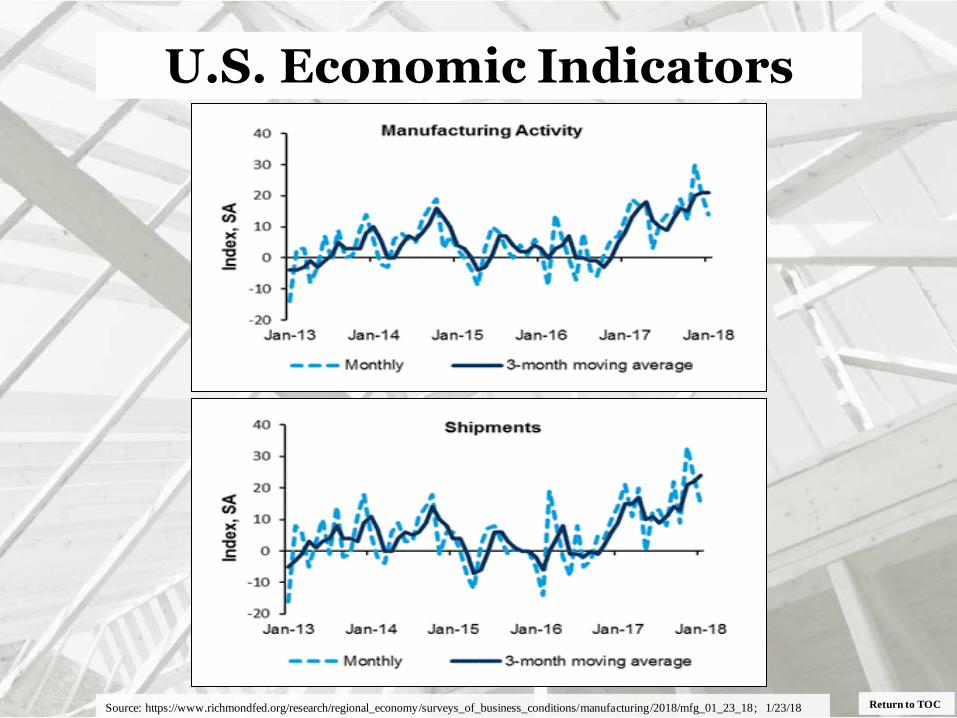
Fifth District Manufacturing Firms Reported Slowing Growth in January
“According to the latest survey by the Federal Reserve Bank of Richmond, Fifth
District manufacturing firms saw slower growth in January, even as each of the
expansion metrics remained positive. The composite index moved down from 20 to
14. This decrease resulted from a decline in the metrics for both shipments and
employment. The third component, new orders, held steady. However, manufacturing
firms saw an increase in backlogs in January, after a decrease in December, as the
index rose from −4 to 5. Firms reported that they expect growth to strengthen in the
coming months.
District manufacturing firms saw continued price increases in January. However,
prices received grew at a slower rate than they had in December, while increases in
prices paid was unchanged. Firms expect prices to rise at a faster rate in the next six
months, although expectations of price growth were below their December values.” –
Jeannette Plamp, Economic Analyst, The Federal Reserve Bank of Richmond
Return to TOC
U.S. Economic Indicators
Source: https://www.richmondfed.org/research/regional_economy/surveys_of_business_conditions/manufacturing/2018/mfg_01_23_18; 1/23/18
Return to TOC
U.S. Economic Indicators
Source: https://www.richmondfed.org/research/regional_economy/surveys_of_business_conditions/manufacturing/2018/mfg_01_23_18; 1/23/18

Return to TOC
U.S. Economic Indicators
Source: https://www.richmondfed.org/research/regional_economy/surveys_of_business_conditions/manufacturing/2018/mfg_01_23_18; 1/23/18

Return to TOC
U.S. Economic Indicators
Source: https://www.richmondfed.org/research/regional_economy/surveys_of_business_conditions/manufacturing/2018/mfg_01_23_18; 1/23/18

Return to TOC
U.S. Economic Indicators The Federal Reserve Bank of San Francisco
FRBSF FedViews
• “Real GDP grew at an annual rate of 3.2% in the third quarter, according to the final estimate of
the Bureau of Economic Analysis. We forecast that GDP growth averaged 2.5% for 2017. The
momentum in GDP growth reflects strong gains in personal income and consumer confidence,
supported by continued strength in the labor and financial markets. As monetary policy
continues to normalize over the next two to three years, we expect growth to gradually fall back
to our trend growth estimate of about 1.7%.
• We continue to see strengthening in labor market conditions. Nonfarm payroll employment
increased by 148,000 jobs in December, a bit below expectations. Over the past six months, job
gains have averaged close to 166,000, well above the amount needed to absorb the flow of new
workers into the labor force.
• Inflation remains below the FOMC’s target of 2%. In November, the personal consumption
expenditure (PCE) price index rose 1.8% over the past 12 months, and the core PCE price
index, which removes volatile food and energy prices, rose 1.5%. Transitory developments for
a few categories of goods and services held down inflation in 2017. As these developments
loosen their hold, we expect continued tightness in the labor market will push inflation up in the
coming year.
• Various factors can influence cost pressures independently of economic strength. For example,
labor market frictions, such as changes in bargaining power, labor force participation, or long-
term unemployment can push up the natural rate of unemployment. Oil prices, the strength of
the US dollar, or import prices can similarly affect cost pressures in the economy.” – Vasco
Curdia, Research Advisor, The Federal Reserve Bank of San Francisco
Source: https://www.frbsf.org/economic-research/publications/fedviews/2018/january/january-11-2018; 1/11/18

Return to TOC
U.S. Economic Indicators
Source: https://www.frbsf.org/economic-research/publications/fedviews/2018/january/january-11-2018; 1/11/18

FHFA House Price Index
FHFA House Price Index Up 0.4 Percent in November
“U.S. house prices rose in November, up 0.4 percent from the previous month, according to the
Federal Housing Finance Agency (FHFA) seasonally adjusted monthly House Price Index (HPI). The
previously reported 0.5 percent increase in October was revised upward to 0.6 percent. ” – Stefanie
Johnson and Corinne Russell, FHFA
Return to TOC
U.S. Economic Indicators
Source: https://www.fhfa.gov/AboutUs/Reports/ReportDocuments/MonthlyHPI_Jan242018.pdf; 1/24/18
Source: FHFA
Return to TOC
U.S. Global Economic Indicators
Source: https://www.dallasfed.org/institute/update/2018/int1801.aspx; 2/6/18
Global Growth Outlook Reflects Sustained Recovery
“Global growth accelerated in 2017, supported by strengthening labor markets and external
demand. Although inflation concerns among advanced countries abated, risks remain and are
mostly tilted to the downside.
Concerns are centered on trade policy changes and entrenched protectionist attitudes, uncertainty
about shifting U.S. policy and its global spillovers, and the consequences of tighter global financial
conditions and asset volatility. High levels of public and private indebtedness, political and geo-
political risks, and uncertainty about the strength of the cyclical recovery also weigh on the outlook.
Global Growth to Remain Solid in 2018–19
The world is expected to reach 3.1 percent annual growth in 2018, slipping to 3.0 percent in 2019.
Those forecasts follow on the heels of solid 3.4 percent year-over-year growth in third quarter 2017.
The ongoing improvement – expected to continue into 2018 – is partly driven by a broadening
cyclical rebound in major advanced economies, notably in the euro area and Japan. Advanced
economies’ expansion has firmed since early 2016, with annual growth projected to be 2.1 percent
in 2018 and 1.8 percent in 2019.
Emerging economies are anticipated to expand around 4.3 percent during 2018–19. Tailwinds from
firming commodity prices aiding key exporters (Russia, Brazil) as well as better-than-anticipated
strength in China are expected to offset weakness elsewhere (Venezuela, South Africa). Growth in
India is on course to outpace growth in China despite the lingering effects of the Indian banknote
demonetization in November 2016 and implementation of the goods-and-services tax in July 2017.”
– Enrique Martínez-García, Senior Research Economist and Arthur Hinojosa, Research Analyst;
The Federal Reserve Bank of Dallas

Return to TOC
U.S. Global Economic Indicators
Source: https://www.dallasfed.org/research/update/mex/2018/1801.aspx; 2/9/18
Mexico Economic Growth Rebounds in Fourth Quarter
“Mexico’s economic output recovered sharply in the fourth quarter, rising 4.1 percent after falling
in the third quarter as a result of the September earthquakes. Mexico’s gross domestic product
(GDP) grew 1.6 percent in 2017 (four-quarter change), below last year’s forecast and the slowest
annual growth in four years. The consensus GDP growth forecast for 2018 calls for a slight
acceleration in activity to 2.2 percent (annual average growth).
Despite robust GDP growth in the fourth quarter, other recent data are mixed. Exports and
employment posted positive growth, but industrial production and retail sales fell. Inflation ticked
up, but the peso recovered some ground against the dollar in January.
Fourth-Quarter Output Surges
Mexico GDP expanded at a 4.1 percent annualized rate in the fourth quarter (Chart 1). Goods-
producing industries (manufacturing, construction, utilities and mining) ticked up 0.4 percent.
Service-related activities (wholesale and retail trade, transportation and business services) gained
4.9 percent. Agricultural output spiked 13 percent.
Export Growth Continues in December After Strong November Total exports increased 0.5 percent in December after jumping 5.6 percent in November. December
manufactured goods exports fell 1.2 percent, while oil exports surged 22.4 percent. All three-month
moving averages increased (Chart 2). In 2017, total exports grew 7.5 percent, manufacturing
exports rose 6.4 percent and oil exports climbed 23.8 percent. The rise in oil exports last year
stemmed largely from higher oil prices, not increased volume of exports.” – Jesus Cañas, Senior
Research Economist and Alexander Abraham, Research Assisstant; The Federal Reserve Bank of
Dallas

Return to TOC
U.S. Global Economic Indicators
Source: https://www.dallasfed.org/research/update/mex/2018/1801.aspx; 2/9/18

Return to TOC
Markit Canada Manufacturing PMI™
“The seasonally adjusted IHS Markit Canada
Manufacturing Purchasing Managers’
Index® (PMI™) picked up to 55.9 in January
from 54.7 in December, to remain well above
the 50.0 no-change threshold. Moreover, the
latest PMI reading signalled the joint-strongest
improvement in business conditions since April
2011.
Manufacturing PMI signals resurgent growth at the start of 2018
Canadian manufacturers reported a strong start to 2018, underpinned by faster rises in output
volumes, new business intakes and staff recruitment. There were also signs that the resurgence in
production schedules would continue in the months ahead, with incomplete workloads
accumulating at the fastest pace since the survey began in October 2010. Improved demand
conditions and sharp input cost inflation meanwhile led to the largest increase in factory gate prices
for almost seven years.
January data signalled an impressive start to 2018 for the Canadian manufacturing sector, with the
latest upturn in business conditions among the fastest seen over the past seven years. Strong
momentum was recorded for both domestic and export sales, helped by the improving economic
backdrop and greater spending by US clients in particular.” – Tim Moore, Associate Director at
Survey Compilers, IHS Markit
Private Indicators: Global
Source: https://www.markiteconomics.com/Survey/PressRelease.mvc/29eaa2f3c4af4a189a6de9343e2bb83e; 2/1/18
Source: IHS Markit; StatCan.

Return to TOC
Caixin China General Manufacturing PMI™
Output growth hits 13-month high
in January “The seasonally adjusted Purchasing Managers’ Index™
(PMI™) – a composite indicator designed to provide a
single-figure snapshot of operating conditions in the
manufacturing economy – was unchanged from
December’s reading of 51.5 in January, to signal a further
modest improvement in overall operating conditions. The
health of the sector has now strengthened in each of the
past eight months, while the pace of improvement was
slightly stronger than the long-run trend.
China’s manufacturing sector continued to expand at the start of 2018, with production rising to the
greatest extent in just over a year. Growth was supported by further, albeit slightly softer, increases
in total new work and new export sales. Higher production requirements led firms to increase their
buying activity, while employment fell at the weakest pace for nearly three years. Capacity
pressures meanwhile persisted, with backlogs of work rising to the greatest extent since early -2011.
Prices data showed that input cost inflation eased to a five-month low and factory gate charges rose
only slightly.
The Caixin China General Manufacturing Purchasing Managers’ Index came in at 51.5 in January,
unchanged from the previous month, suggesting that operating conditions continued to improve at a
modest pace. … The manufacturing industry had a good start to 2018. Going forward, we should
keep a close eye on the stability of the demand side.” – Dr. Zhengsheng Zhong, Director of
Macroeconomic Analysis, CEBM Group
Private Indicators: Global
Source: https://www.markiteconomics.com/Survey/PressRelease.mvc/38d74846b4a44131b807260cc000c8c8; 2/1/18
Source: IHS Markit, Caixin.

Return to TOC
Markit Eurozone Manufacturing PMI®
“The final IHS Markit Eurozone
Manufacturing PMI® posted a three-
month low of 59.6 in January, down from
December’s record high of 60.6 and
identical to the earlier flash estimate. The
PMI has signaled expansion in each of the
past 55 months.
Eurozone manufacturing stays close to record high in January
The eurozone manufacturing sector made a strong start to 2018. Although January saw rates of
growth in output and new orders ease from near-record highs at the end of last year, they remained
among the best seen since the survey began in 1997.
Sector data signalled solid growth across the consumer, intermediate and investment goods
categories, with the steepest rates of expansion in the latter two. This was despite consumer goods
being the only category to see growth accelerate during the latest survey month.
The eurozone’s manufacturing boom continued in full swing in January. Output grew at one of the
fastest rates recorded over the survey’s 20-year history, matched by a further near-record surge in new
orders. Employment likewise showed one of the largest gains yet recorded by the survey as firms
expanded capacity in line with rising demand.
The extent to which demand has surged in recent months nevertheless continued to run ahead of
capacity, leading to near-record increases in both backlogs of uncompleted orders and suppliers’
delivery times” – Chris Williamson, Chief Business Economist, Markit®
Private Indicators: Global
Source: https://www.markiteconomics.com/Survey/PressRelease.mvc/c87041a529044afaae1cd114bc3222a1; 2/118
Source: IHS Markit.

Return to TOC
Markit Eurozone Composite PMI®
“The final IHS Markit Eurozone PMI®
Composite Output Index posted 58.8 in
January, its highest level since June 2006
and above the earlier flash estimate of 58.6.
The headline index has signalled expansion
for 55 successive months.
Eurozone economic growth nears 12-year high in January
The start of 2018 saw the eurozone economy continue its recent advance. Output growth
accelerated to a near 12-year high, underpinned by solid inflows of new business and accompanied
by the strongest phase of job creation since late-2000.
Growth of manufacturing production continued to outpace that of service sector activity in January.
Although easing over the month, the rate of expansion in manufacturing output stayed close to
December’s near-record high. The performance of the service sector continued to strengthen, with
business activity growth accelerating to its best since August 2007.
The strong upturn is also broad-based, which adds to the potential for the growth to become more
self-sustaining as demand rises across the single currency area, feeding through to higher job
creation as spare capacity is increasingly eroded. The survey data are therefore indicating that the
eurozone has started 2018 with very good growth momentum, and that price pressures are building
commensurately. If such impressive numbers continue to be seen in coming months, expect
policymakers to sound increasingly hawkish.” – Chris Williamson, Chief Business Economist,
Markit®
Private Indicators: Global
Source: https://www.markiteconomics.com/Survey/PressRelease.mvc/d6318e46d6f44baf9d5a22199091592f; 2/5/18
Sources: IHS Markit, Eurostat..

Return to TOC
Markit/BME Germany Manufacturing PMI®
“The final IHS Markit/BME Germany
Manufacturing PMI …registered 61.1 in
January, down from a survey-record high of
63.3 in December but still signalling one the
greatest improvements in overall business
conditions since the survey began in 1996.
Manufacturing sector shows sustained strong growth at start of 2018
Germany’s manufacturing sector enjoyed a strong start to 2018, despite seeing a softer pace of
growth than the record performance in December, according to the latest PMI® survey data from
IHS Markit and BME. Price pressures were meanwhile shown to be the highest since early-2011,
driven by rising commodity prices and capacity constraints in supply chains.
The Manufacturing PMI remains in very positive territory in the context of the survey’s history,
notwithstanding the downtick from December’s record high. Factories continue to ramp up
production at a pace rarely seen over the past two decades of collection, and the sustained strong
rate of job creation suggests there’s appetite for further capacity expansion amid a positive outlook
for the year ahead.
A key insight from the latest survey was a pick-up in price pressures to the highest seen since early-
2011, as a continued supply-side squeeze inflated purchasing costs and prices charged at the factory
gate. It remains to be seen whether the record high at the end of 2017 represents the peak of the
current cycle, but the intensification of price pressures will inevitably cause some drag on demand,
while the euro’s recent gain against the dollar may weigh on exports.” – Phil Smith, Principal
Economist, IHSMarkit®
Private Indicators: Global
Source: https://www.markiteconomics.com/Survey/PressRelease.mvc/709a3480736e4294884ddeba97be1bbe; 2/1/18
Source: IHS Markit, Budesbank

Return to TOC
JP Morgan Global Manufacturing PMI™
“The global manufacturing sector made a
positive start to 2018, with rates of growth in
output and new orders staying close to highs
reached before the turn of the year. At 54.4
in January, the J.P. Morgan Global
Manufacturing PMI™ – a composite index
produced by J.P. Morgan and IHS Markit
with ISM and IFPSM – was only a tick
below December’s near seven-year record.
Global manufacturing growth remains solid at start of 2018
The upturn remained broad-based, with growth signalled in the consumer, intermediate and
investment goods industries and across almost all of the nations covered by the survey. The sole
exception was Indonesia, where operating conditions were broadly stagnant during January.
The euro area remained the principal growth engine of global manufacturing expansion during
January. Although the eurozone PMI slipped to a three-month low, from December’s record high,
solid expansions were still registered across all of the nations within the currency union covered by
the survey.
The start of 2018 saw a continuation of the solid upturn in global manufacturing performance, with
rates of growth in production and new orders remaining close to December’s highs. With business
confidence still robust and further job creation reported, the sector is on course to sustain its current
solid pace of expansion into the coming months.” – David Hensley, Global Economist, J.P. Morgan
Private Indicators: Global
Source: https://www.markiteconomics.com/Survey/PressRelease.mvc/cfe31b1e1f424d4ba54db08af4f30a36; 2/1/18
Source: IHS Markit

Return to TOC
JP Morgan Global Services PMI™
“The J.P. Morgan Global All-Industry
Output Index – which is produced by J.P.
Morgan and IHS Markit with ISM and
IFPSM – posted 54.6 in January, up from
54.3 in December. The headline index
has signalled expansion in each of the
past 64 months.
Global economic growth at 40-month high in January
The start of 2018 saw a further solid and broad-based expansion of global economic activity, with
growth rising to a 40-month high. Output increased across the six categories of manufacturing and
service sector activity tracked and in almost all of the national PMI surveys available at the time of
publication.
Manufacturing production increased at a pace matching December 2017’s near seven-year high,
while output growth in the service sector improved to the fastest in three months. Economic
activity increased at faster rates in four of the six sub-sectors covered by the survey (consumer and
intermediate goods as well as consumer and financial services). Output also expanded in the
business services and intermediate goods categories.
The world economy sustained its strong upturns in output and new business at the start of 2018, as
manufacturers and service providers benefitted from a synchronised upswing in global market
conditions and growth. Forward-looking indicators such as new orders, backlogs of work and
business confidence also suggest that this solid phase of expansion will be maintained in coming
months.” – David Hensley, Global Economist, J.P. Morgan
Private Indicators: Global
Source: https://www.markiteconomics.com/Survey/PressRelease.mvc/80938f80eb214ddbaa6735167e8fabb9; 2/5/18
Sources: IHS Markit, JPMorgan

Return to TOC
Markit/CIPS UK Manufacturing PMI™
“The start of 2018 saw a further easing in the rate
of expansion of the UK manufacturing sector. At
55.3 in January, the seasonally adjusted IHS
Markit/CIPS Purchasing Managers’ Index®
(PMI®) was down further from November’s 51-
month high and at its lowest level since June last
year. That said, the PMI remained well above its
long-run average of 51.7. The latest survey was
conducted from 12-26 January.
UK manufacturing growth slows at start of 2018 as price pressures intensify
Manufacturing output continued to rise at a solid pace, although the rate of expansion eased to a
six-month low. Higher production reflected rising new order intakes, albeit the slowest in seven
January saw the trend in new export order inflows strengthen. Foreign demand improved at one of
the quickest rates over the past four years. There were reports of increased sales to clients in North
America, China, mainland Europe, the Middle East and Japan.
The UK manufacturing sector reported an unwelcome combination of slower growth and rising
prices at the start of 2018. Encouragingly, despite the slowdown, the latest survey is consistent with
production rising at a solid quarterly rate of around 0.6% in January, with jobs also being added at a
faster pace. However, output growth has slowed sharply since last November’s high, and the more
forward-looking new orders index has slipped to a seven-month low. The trend in demand will
need to strengthen in the near-term to prevent further growth momentum being lost in the coming
months.” – Rob Dobson, Director & Senior Economist, IHS Markit
Private Indicators: Global
Source: https://www.markiteconomics.com/Survey/PressRelease.mvc/bf2ab87f08504cf08b3c63b3d61535b7; 2/1/18
Sources: IHS Markit

Private Indicators American Institute of Architects (AIA)
December Architecture Billings Index
Architecture billings end year on positive note
Fourth quarter activity strongest of 2017
“The Architecture Billings Index (ABI) concluded the year in positive terrain, with the December
reading capping off three straight months of growth in design billings. The American Institute of
Architects (AIA) reported the December ABI score was 52.9, down from a score of 55.0 in the
previous month. This score still reflects an increase in design services provided by U.S.
architecture firms. The year 2017 ended with architecture firms continuing to report strong firm
billings. An Architecture Billings Index (ABI) score of 52.9 for December meant that, for 10 of the
year's 12 months, architecture firms saw increases in billings (any score above 50 indicates an
increase in billings). The new projects inquiry index was 61.9, up from a reading of 61.1 the
previous month, while the new design contracts index decreased slightly from 53.2 to 52.7.
Firms also continued to report strong backlogs of about six months in December — as they had
throughout the year — and inquiries into new projects and the value of newly signed design
contracts also remained robust, serving as additional indicators of plenty of work remaining in the
pipeline for the coming months.
Overall, 2017 turned out to be a strong year for architecture firms. All but two months saw ABI
scores in positive territory. Additionally, the overall strength of the fourth quarter lays a good
foundation for healthy growth in construction activity in 2018.” – Kermit Baker, Chief Economist,
AIA , Honorable AIA
Return to TOC Source: https://www.aia.org/; 1/25/18

Private Indicators American Institute of Architects
Return to TOC Source: https://www.aia.org/; 1/25/18

Private Indicators: AIA
Region
“Firms located in the South continued to report billings growth every month of the year in 2017, the
fifth year in a row without any decline in billings for the region. Firms located in the West saw
business conditions continue to improve in December, after starting the year with some soft
conditions and following a modest slowdown in August. Firms located in the Midwest saw billings
growth every month of the year except September, and growth remained strong through the end of
the year. Firms located in the Northeast were the only ones to end the year with a modest decrease
in billings, and generally saw softer conditions throughout 2017 than those in other areas.” – Kermit
Baker, Chief Economist, AIA , Honorable AIA
Return to TOC Source: https://www.aia.org/pages/162606-abi-December-2018-growth-returning-to-firm-b; 1/24/18
Private Indicators: AIA
Return to TOC
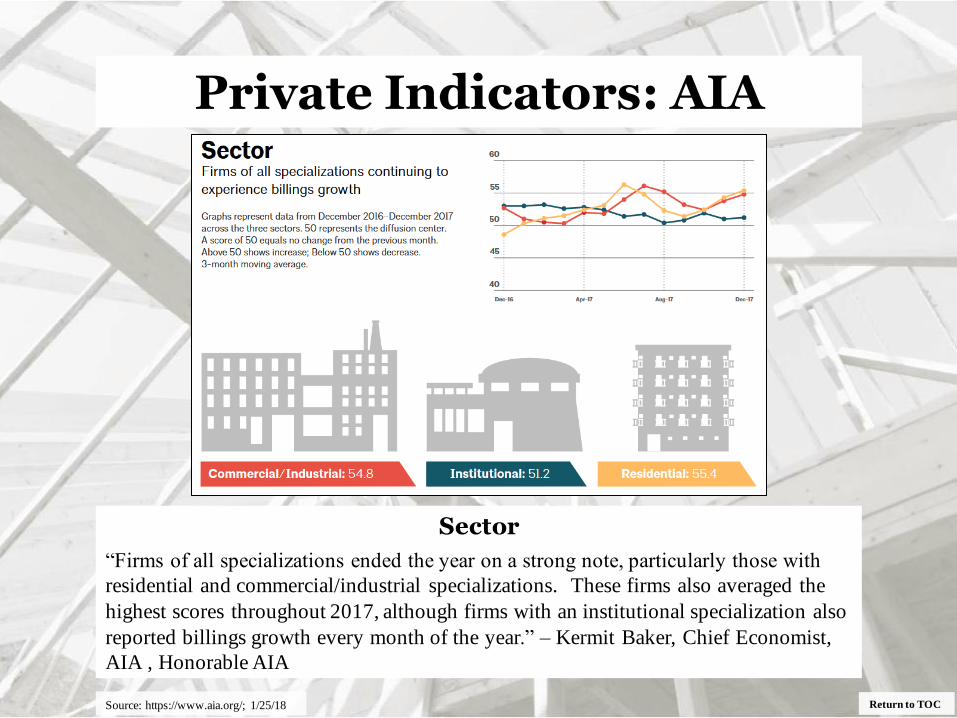
Sector
“Firms of all specializations ended the year on a strong note, particularly those with
residential and commercial/industrial specializations. These firms also averaged the
highest scores throughout 2017, although firms with an institutional specialization also
reported billings growth every month of the year.” – Kermit Baker, Chief Economist,
AIA , Honorable AIA
Source: https://www.aia.org/; 1/25/18

Private Indicators
Dodge Data & Analytics
New Construction Starts in December Rebound 12 Percent; Annual Total for 2017 Advances 3 Percent to $745.9 Billion
“New construction starts in December climbed 12% to a seasonally adjusted annual
rate of $733.3 billion, bouncing back following November’s 12% decline, according to
Dodge Data & Analytics. December’s gain for total construction reflected varied
improvement by each of the three main construction sectors. Nonbuilding construction
(public works and electric utilities/gas plants) jumped 43%, lifted by the start of the
$2.3 billion I-66 Corridor Improvements Project in northern Virginia. Nonresidential
building rose 10%, aided by the start of two large data center projects, while residential
building edged up 1%. For all of 2017, total construction starts grew 3% to $745.9
billion, which followed the 6% increase reported for 2016. The full year 2017 gain
was dampened by a 35% downturn for the electric utility/gas plant category. If electric
utilities and gas plants are excluded, total construction starts for 2017 would be 5%
higher than the corresponding amount for 2016.
The December statistics produced a reading of 155 for the Dodge Index (2000=100),
up from November’s 138. For the full year 2017, the Dodge Index averaged 158.” –
Benjamin Gorelick, Spector & Associates
Return to TOC Source: https://www.construction.com/news/new-construction-starts-december-rebound-12-percent-total-2017-advances-3-percent-745.9-billion-jan-2018; 1/25/18

Private Indicators
Dodge Data & Analytics
New Construction Starts in December Rebound 12 Percent
“After weaker activity was reported in both October and November, the December rebound for total
construction starts eased the extent of the decline that took place during the fourth quarter. On a
quarterly basis, growth in 2017 was reported during the first and third quarters, while activity
retreated during the second and fourth quarters, continuing the up-and-down pattern around an
upward trend that was present during 2016. On the positive side for 2017, institutional building
assumed a leading role in keeping the nonresidential building expansion going, reflecting elevated
activity for transportation terminal starts and further improvement by educational facilities.
Manufacturing plant construction starts strengthened, ending a two-year decline, and commercial
building was able to stay close to its heightened 2016 amount. Residential building in 2017 showed
more growth for single family housing, offsetting a downturn for multifamily housing. And, public
works construction in 2017 was able to strengthen, helped by the start of several very large pipeline
projects and a moderate gain for highway and bridge construction.
The construction industry over the past two years has made the transition to a more mature stage of
expansion, characterized by slower rates of growth for total construction compared to the 11% to
13% yearly gains during the 2012-2015 period. For 2018, the construction expansion is anticipated
to continue at a modest pace. The tax reform package is expected to provide a near term lift to
overall economic growth, and the likely beneficiaries would be commercial building and
multifamily housing. Funding support for institutional building will come from the state and local
bond measures passed in recent years. Passage of a new infrastructure program at the federal level
could be a plus for public works, although the impact at the construction site is likely to be felt
more in 2019 than in 2018, as the program would feature incentives to boost funding from state,
local, and private sources.” – Robert A. Murray, Chief Economist, Dodge Data & Analytics
Return to TOC Source: https://www.construction.com/news/new-construction-starts-december-rebound-12-percent-total-2017-advances-3-percent-745.9-billion-jan-2018; 1/25/18

Private Indicators
Dodge Data & Analytics
New Construction Starts in December Rebound 12 Percent
“Residential building in December was $308.1 billion (annual rate), up 1%. The single family
side of the housing market rose 1%, continuing to show the modest improvement that’s been
present during the second half of 2017 after the slight loss of momentum reported last spring.
Multifamily housing in December was unchanged from its November pace. December featured
groundbreaking for four large multifamily projects valued each at $100 million or more – … .
The 2017 amount for residential building was $302.0 billion, a 2% gain that followed a 9% increase
in 2016. Single family housing maintained its moderate upward track, rising 8% which matched its
rate of growth in dollar terms for 2016. By geography, single family housing in 2017 showed this
pattern for the five major regions – the South Atlantic, up 12%; the South Central and West, each up
8%; the Midwest, up 5%; and the Northeast, down 2%.
Multifamily housing in 2017 headed in the opposite direction, falling 12% after seven straight years
of expansion. New York NY, the nation’s leading multifamily market by dollar volume, registered a
relatively modest 4% decline in 2017, after sliding a substantial 27% in 2016. However, the
pullback for multifamily housing broadened on a geographic basis during 2017, as 7 of the
remaining 9 metropolitan markets in the top ten showed weaker activity, with only San Francisco
CA and Atlanta GA reporting gains. Rounding out the top five multifamily markets by the 2017
dollar volume, with their percent change from 2016, were the following – Los Angeles CA, down
17%; Washington DC, down 23%; Chicago IL, down 24%; and San Francisco CA, up 3%.
Multifamily markets ranked 6 through 10 showed this performance – Boston MA, down 29%;
Atlanta GA, up 26%; Miami FL, down 50%; Seattle WA, down 10%; and Dallas-Ft. Worth TX,
down 26%.” – Robert A. Murray, Chief Economist, Dodge Data & Analytics
Return to TOC Source: https://www.construction.com/news/new-construction-starts-december-rebound-12-percent-total-2017-advances-3-percent-745.9-billion-jan-2018; 1/25/18

Private Indicators
Return to TOC Source: https://www.construction.com/news/new-construction-starts-december-rebound-12-percent-total-2017-advances-3-percent-745.9-billion-jan-2018; 1/25/18

Return to TOC
Private Indicators MNI Chicago
January Chicago Business Barometer Falls to 65.7
“The MNI Chicago Business Barometer
fell 2.1 points to 65.7 in January from a
previously revised 67.8 in December.
Three of the five components that
comprise the Barometer fell on the
month, with only Employment and
Supplier Deliveries notching up gains in
January.
Employment Up to Near-6-Year High; Prices Paid Highest Since Sep
Despite losing some ground in January, the Barometer continued in the same vein of form it
displayed in the second half of 2017, making for an encouraging start to the New Year. The
Barometer was up 28.3% on last January and at 65.7, stands above the H2 2017 average of 63.7.
Firms reported a moderately slower pace of both incoming orders and output in January. The New
Orders indicator fell to a five-month low, contributing most to the Barometer’s decline, while the
Production indicator also fell in January, albeit to a lesser extent. With less activity on these fronts
it gave firms the chance to target their backlog of unfilled orders. The Order Backlogs indicator fell
to its lowest level since May.
Official data in Q1 tends to come in weaker than in reality, but our survey suggests that despite
softening a little, sentiment among businesses remains robust. This was the best January result in
seven years, capped off by the Employment indicator rising to its highest level in almost 6 years.” –
Jamie Satchi, Economist, MNI Indicators
Source: https://www.ism-chicago.org/index.cfm; 1/28/18

Private Indicators
Return to TOC
The Conference Board Leading Economic Index® (LEI) for the U.S. increased 0.6 percent in December to 107.0 (2016 = 100),
following a 0.5 percent increase in November, and a 1.3 percent increase in October.
Source: https://www.conference-board.org/data/bcicountry.cfm; 1/25/18
Economic Growth to Continue Through First Half of 2018
“The U.S. LEI continued rising rapidly in
December, pointing to a continuation of strong
economic growth in the first half of 2018. The
passing of the tax plan is likely to provide even
more tailwind to the current expansion. The
gains among the leading indicators have been
widespread, with most of the strength
concentrated in new orders in manufacturing,
consumers’ outlook on the economy, improving
stock markets and financial conditions.” –
Ataman Ozyildirim, Director of Business
Cycles and Growth Research, The Conference
Board
“The Conference Board Coincident Economic Index® (CEI) for the U.S. increased 0.3 percent in
December to 102.8 (2016 = 100), following a 0.1 percent increase in November, and a 0.4 percent
increase in October.
The Conference Board Lagging Economic Index® (LAG) for the U.S. increased 0.7 percent in
December to 104.0 (2016 = 100), following a 0.1 percent increase in November and a 0.3 percent
increase in October.” – The Conference Board
U.S. Composite Economic Indexes (2016 = 100)

Private Indicators
Return to TOC
The Conference Board Help Wanted OnLine® (HWOL)
Online Job Ads Increased 1,200 in January
• “January was essentially unchanged, following a December increase
• States and MSAs saw little movement
Online advertised vacancies increased 1,200 to 4,903,300 in January, according to The Conference
Board Help Wanted OnLine® (HWOL) Data Series. The December Supply/Demand rate stands at
1.34 unemployed for each advertised vacancy, with a total of 1.7 million more unemployed workers
than the number of advertised vacancies. The number of unemployed was approximately 6.6 million in
December
The Professional occupational category saw changes in Education, Training, and Library (-60.4),
Computer and mathematical science (23.2) and Healthcare practitioners and technical (-12.9). The
Services/Production occupational category saw gains in Sales and related (30.8), Transportation (10.7),
and Installation, maintenance, and repair (8.1).” – Carol Courter, The Conference Board
Source: https://www.conference-board.org/data/helpwantedonline.cfm; 1/31/18
Source: The Conference Board

Private Indicators
Return to TOC
Equipment Leasing and Finance Association
Equipment Leasing and Finance Industry Confidence At All-Time High in January
“The Equipment Leasing & Finance Foundation (the Foundation) releases the January
2018 Monthly Confidence Index for the Equipment Finance Industry (MCI-EFI).
Designed to collect leadership data, the index reports a qualitative assessment of both
the prevailing business conditions and expectations for the future as reported by key
executives from the $1 trillion equipment finance sector. Overall, confidence in the
equipment finance market is 75.3 in January, an increase from 69.4 in December, and
the highest level since the index was launched in 2009.” – Anneliese DeDiemar,
Author, Equipment Leasing & Finance Association
“Activity has picked up since the midpoint of the fourth quarter and 2017 closed on a
very positive note. The year is off to a great start even with some of the weather issues
plaguing the country. I'm hoping the new tax laws will keep this optimism in full
gear.” – Valerie Hayes Jester, President, Brandywine Capital Associates
Source: https://www.elfaonline.org/news/press-room/press-releases/details/2018/01/18/equipment-leasing-and-finance-industry-confidence-at-all-time-high-in-january; 1/18/18
Private Indicators
Return to TOC
Equipment Leasing and Finance Association
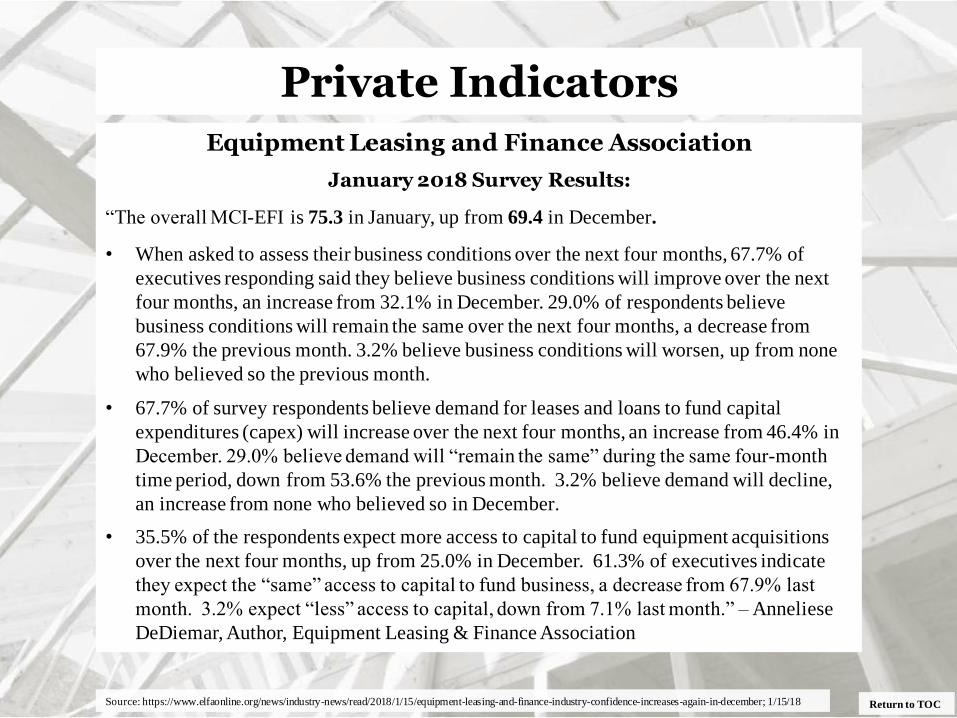
January 2018 Survey Results:
“The overall MCI-EFI is 75.3 in January, up from 69.4 in December.
• When asked to assess their business conditions over the next four months, 67.7% of
executives responding said they believe business conditions will improve over the next
four months, an increase from 32.1% in December. 29.0% of respondents believe
business conditions will remain the same over the next four months, a decrease from
67.9% the previous month. 3.2% believe business conditions will worsen, up from none
who believed so the previous month.
• 67.7% of survey respondents believe demand for leases and loans to fund capital
expenditures (capex) will increase over the next four months, an increase from 46.4% in
December. 29.0% believe demand will “remain the same” during the same four-month
time period, down from 53.6% the previous month. 3.2% believe demand will decline,
an increase from none who believed so in December.
• 35.5% of the respondents expect more access to capital to fund equipment acquisitions
over the next four months, up from 25.0% in December. 61.3% of executives indicate
they expect the “same” access to capital to fund business, a decrease from 67.9% last
month. 3.2% expect “less” access to capital, down from 7.1% last month.” – Anneliese
DeDiemar, Author, Equipment Leasing & Finance Association
Source: https://www.elfaonline.org/news/industry-news/read/2018/1/15/equipment-leasing-and-finance-industry-confidence-increases-again-in-december; 1/15/18

Private Indicators
Return to TOC
Equipment Leasing and Finance Association
January 2018 Survey Results:
• “When asked, 41.9% of the executives report they expect to hire more employees over
the next four months, a decrease from 53.6% in December. 54.8% expect no change in
headcount over the next four months, an increase from 46.4% last month. 3.2% expect to
hire fewer employees, an increase from none in December.
• 25.8% of the leadership evaluate the current U.S. economy as “excellent,” up from 10.7%
last month. 74.2% of the leadership evaluate the current U.S. economy as “fair,” a
decrease from 89.3% in December. None evaluate it as “poor,” unchanged from last
month.
• 61.3% of the survey respondents believe that U.S. economic conditions will get “better”
over the next six months, an increase from 42.9% in December. 38.7% of survey
respondents indicate they believe the U.S. economy will “stay the same” over the next six
months, a decrease from 57.1% the previous month. None believe economic conditions
in the U.S. will worsen over the next six months, unchanged from December.
• In January, 61.3% of respondents indicate they believe their company will increase
spending on business development activities during the next six months, an increase from
57.1% in December. 35.5% believe there will be “no change” in business development
spending, a decrease from 42.9% the previous month. 3.2% believe there will be a
decrease in spending, an increase from none last month.” – Anneliese DeDiemar, Author,
Equipment Leasing & Finance Association
Source: https://www.elfaonline.org/news/industry-news/read/2018/1/15/equipment-leasing-and-finance-industry-confidence-increases-again-in-december; 1/15/18

Private Indicators
Return to TOC
Equipment Leasing and Finance Association
Monthly Leasing & Finance Index: December 2017
“The Equipment Leasing and Finance Association’s (ELFA) Monthly Leasing and
Finance Index (MLFI-25), which reports economic activity from 25 companies representing
a cross section of the $1 trillion equipment finance sector, showed their overall new business
volume for December was $12.8 billion, up 6 percent year-over-year from new business
volume in December 2016. Volume was up 71 percent month-to-month from $7.5 billion in
November in a typical end-of-year spike. Cumulative new business volume for 2017 was up
5 percent from 2016.
Receivables over 30 days were 1.50 percent, unchanged from the previous month and up
from 1.40 percent the same period in 2016. Charge-offs were 0.48 percent, up from 0.42
percent the previous month, and up from 0.42 percent in the year-earlier period.
Credit approvals totaled 77.6 percent in December, up from 73.6 percent in November. Total
headcount for equipment finance companies was up 15.1 percent year over year, largely
attributable to continued acquisition activity at an MLFI reporting company.
Separately, the Equipment Leasing & Finance Foundation’s Monthly Confidence Index
(MCI-EFI) in January is at an all-time high of 75.3, up from 69.4 in December.” – Anneliese
DeDiemar, Author, Equipment Leasing & Finance Association
Source: https://www.elfaonline.org/data/mlfi-25-monthly-leasing-and-finance-index/view-mlfi/monthly-leasing-finance-index-december-2017; 1/25/18

Private Indicators
Return to TOC
Equipment Leasing and Finance Association
Monthly Leasing & Finance Index: December 2017
“December new business volume registered the typical end-of-quarter, end-of-year spike as
member companies scrambled to close out the year. While 2017 was a good year, overall, for
the equipment finance industry, most industry observers look for even stronger business
activity in 2018. The reasons for this optimistic outlook? A continued healthy and growing
economy, an abundance of liquidity, strong capex demand buoyed by recent tax law changes,
and a sense of confidence by the business community not seen since just after the 2016
election. Absent a wild card event or external shock of some sort, we are bullish about
2018.” – Ralph Petta, President and CEO, ELFA
“The equipment finance industry finished 2017 with a strong uptick in new business volume.
This was due in large part to renewed optimism for future economic performance as well as
improving industry conditions in key capital-intensive industries such as energy and
transportation. Industry participants are very bullish on the prospects for 2018 as evidenced
by the record high in the Monthly Confidence Index. With lower corporate taxes and
favorable interest rates and credit environment, as well as an economy poised to breakout
from its pattern of modest growth, I believe these dynamics will create the perfect storm to
accelerate growth in the equipment finance industry in 2018.” – Thomas M. Jaschik,
President, BB&T Equipment Finance
Source: https://www.elfaonline.org/data/mlfi-25-monthly-leasing-and-finance-index/view-mlfi/monthly-leasing-finance-index-december-2017; 1/25/18

Private Indicators
Return to TOC Source: https://www.elfaonline.org/data/mlfi-25-monthly-leasing-and-finance-index/view-mlfi/monthly-leasing-finance-index-december-2017; 1/25/18

Private Indicators
Return to TOC Source: https://www.elfaonline.org/data/mlfi-25-monthly-leasing-and-finance-index/view-mlfi/monthly-leasing-finance-index-december-2017; 1/25/18

Private Indicators
Return to TOC Source: https://www.elfaonline.org/data/mlfi-25-monthly-leasing-and-finance-index/view-mlfi/monthly-leasing-finance-index-december-2017; 1/25/18

Return to TOC
January 2018 Manufacturing ISM® Report On Business®
January PMI® at 59.1%
New Orders, Production, and Employment Continue Growing
Supplier Deliveries Slowing at Faster Rate; Backlog Growing Raw Materials Inventories Growing, Customers’ Inventories Too Low
Prices Increasing at Faster Rate
“Economic activity in the manufacturing sector expanded in January, and the overall economy
grew for the 105th consecutive month, say the nation's supply executives in the latest
Manufacturing ISM® Report On Business®. The January PMI® registered 59.1 percent, a
decrease of 0.2 percentage point from the seasonally adjusted December reading of 59.3 percent.
The New Orders Index registered 65.4 percent, a decrease of 2 percentage points from the seasonally
adjusted December reading of 67.4 percent.
The Production Index registered 64.5 percent, a 0.7 percentage point decrease compared to the seasonally
adjusted December reading of 65.2 percent.
The Employment Index registered 54.2 percent, a decrease of 3.9 percentage points from the seasonally
adjusted December reading of 58.1 percent.
The Supplier Deliveries Index registered 59.1 percent, a 1.9 percentage point increase from the seasonally
adjusted December reading of 57.2 percent.
The Inventories Index registered 52.3 percent, an increase of 3.8 percentage points from the December
reading of 48.5 percent.
The Prices Index registered 72.7 percent in January, a 4.4 percentage point increase from the December
reading of 68.3 percent, indicating higher raw materials prices for the 23rd consecutive month.
Comments from the panel reflect expanding business conditions, with new orders and production
maintaining high levels of expansion; employment expanding at a slower rate; order backlogs expanding at
a faster rate; and export orders and imports continuing to grow faster in January. Supplier deliveries
continued to slow (improving) at a faster rate. Price increases occurred across all industry sectors. The
Customers’ Inventories Index indicates levels are still too low. Capital expenditure lead times increased 8
percent during the month of January.” – Timothy R. Fiore, CPSM, CPSD, Chair of the ISM®
Manufacturing Business Survey Committee
Source: Source: https://www.instituteforsupplymanagement.org/ISMReport/MfgROB.cfm; 2/1/18

Return to TOC Source: https://www.instituteforsupplymanagement.org/ISMReport/NonMfgROB.cfm; 1/5/18
January 2018 Non-Manufacturing ISM® Report On Business®
January NMI® at 59.9%
Business Activity Index at 59.8%; New Orders Index at 62.7%; Employment Index at 61.6%
“Economic activity in the non-manufacturing sector grew in January for the 96th consecutive month,
say the nation's purchasing and supply executives in the latest Non-Manufacturing ISM® Report On
Business®. The NMI® registered 59.9 percent, which is 3.9 percentage points higher than the
seasonally adjusted December reading of 56 percent. This represents continued growth in the non-
manufacturing sector at a faster rate
The Non-Manufacturing Business Activity Index increased to 59.8 percent, 2 percentage points higher
than the seasonally adjusted December reading of 57.8 percent, reflecting growth for the 102nd
consecutive month, at a faster rate in January.
The New Orders Index registered 62.7 percent, 8.2 percentage points higher than the seasonally
adjusted reading of 54.5 percent in December.
The Employment Index increased 5.3 percentage points in January to 61.6 percent from the seasonally
adjusted December reading of 56.3 percent.
The Prices Index increased by 2 percentage points from the seasonally adjusted December reading of
59.9 percent to 61.9 percent, indicating that prices increased in January for the 23rd consecutive month.
According to the NMI®, 15 non-manufacturing industries reported growth. The non-manufacturing
sector reflected strong growth in January after two consecutive months of pullback. Overall, the
majority of respondents’ comments are positive about business conditions and the economy. They also
indicated that recent tax changes have had a positive impact on their respective businesses.” – Anthony
Nieves, CPSM, C.P.M., CFPM, Chair of the Institute for Supply Management® (ISM®) Non-
Manufacturing Business Survey Committee
Private Indicators
Return to TOC
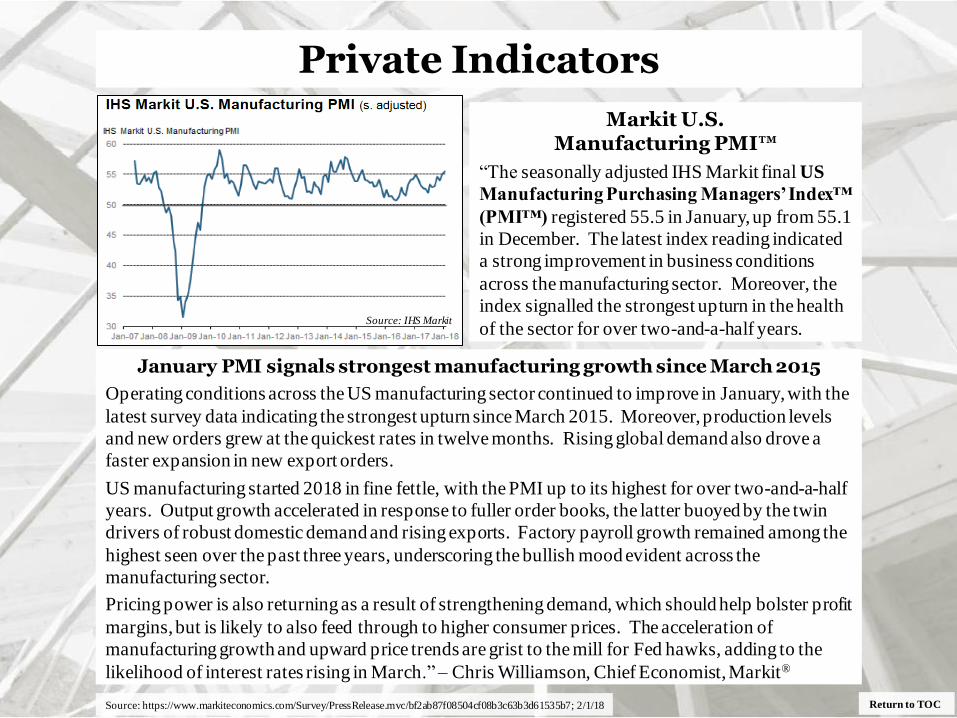
Markit U.S. Manufacturing PMI™
“The seasonally adjusted IHS Markit final US
Manufacturing Purchasing Managers’ Index™
(PMI™) registered 55.5 in January, up from 55.1
in December. The latest index reading indicated
a strong improvement in business conditions
across the manufacturing sector. Moreover, the
index signalled the strongest upturn in the health
of the sector for over two-and-a-half years.
January PMI signals strongest manufacturing growth since March 2015
Operating conditions across the US manufacturing sector continued to improve in January, with the
latest survey data indicating the strongest upturn since March 2015. Moreover, production levels
and new orders grew at the quickest rates in twelve months. Rising global demand also drove a
faster expansion in new export orders.
US manufacturing started 2018 in fine fettle, with the PMI up to its highest for over two-and-a-half
years. Output growth accelerated in response to fuller order books, the latter buoyed by the twin
drivers of robust domestic demand and rising exports. Factory payroll growth remained among the
highest seen over the past three years, underscoring the bullish mood evident across the
manufacturing sector.
Pricing power is also returning as a result of strengthening demand, which should help bolster profit
margins, but is likely to also feed through to higher consumer prices. The acceleration of
manufacturing growth and upward price trends are grist to the mill for Fed hawks, adding to the
likelihood of interest rates rising in March.” – Chris Williamson, Chief Economist, Markit®
Private Indicators
Source: https://www.markiteconomics.com/Survey/PressRelease.mvc/bf2ab87f08504cf08b3c63b3d61535b7; 2/1/18
Source: IHS Markit

Return to TOC
U.S. business activity growth eases to nine-month low
January survey data indicated a solid rise in U.S. service sector business activity, though the rate of
growth eased for a third month running to reach a nine-month low. That said, new business
continued to expand strongly, with the upturn accelerating to the fastest since last September.
A slowdown in the service sector comes as a disappointment, though was partially offset by faster
manufacturing growth during the month. Combined, the two PMI surveys point to the economy
expanding at a reasonably solid, albeit not exciting, 2-2.5% annualised rate at the start of the first
quarter.
Beneath the headline numbers, the survey findings are more encouraging, and suggest the pace of
economic growth could accelerate in coming months. Most importantly, growth of new orders
jumped higher in both sectors in January, registering the largest upturn in new work since last
August and one of the biggest gains seen over the past three years.
This upturn in client demand was a key factor behind another month of strong hiring, but also
encouraged firms to hike prices. Selling price inflation accelerated in both manufacturing and
services as pricing power continued to return.” – Chris Williamson, Chief Economist, Markit®
Markit U.S. Services PMI™
“The seasonally adjusted final IHS Markit U.S.
Services Business Activity Index registered
53.3 in January, down from 53.7 in December.
The latest index reading signalled a solid
expansion in business activity among service
providers, albeit the slowest since April 2017.
Anecdotal evidence linked the latest upturn to
more favourable economic conditions.
Private Indicators
Source: https://www.markiteconomics.com/Survey/PressRelease.mvc/442f04ec15444e7a8257437bdcf8f39d; 2/5/18
Source: IHS Markit

Private Indicators
Return to TOC
National Association of Credit Management –
Credit Managers’ Index
“After a record-setting December, credit managers are reporting a slight step back in the latest
Credit Managers’ Index (CMI). The drop in the performance of the favorable factors was
dramatic and not the least expected given the patterns that have been noted for the last several
months.
The overall score in December was 56.6 and has fallen to 54.2 – the lowest reading since May.
More distressing is the reason for the decline, as the biggest drop was in the favorable factors.
They fell from an overall score of 65.7 to 59.4, the first time this category has dropped out of the
60s in well over a year. The unfavorable category was the bright spot this month, as it scarcely
changed – increasing from 50.4 to 50.8.
All of the favorable measures suffered this month. Some dropped like a stone. Sales fell hard
from 68.3 to 59.2 – nearly a 10-point decline – hitting a low point not reached since December
2016. The new credit applications also fell from the 60s to 57.3. The dollar collections category
slipped out of the 60s by the narrowest of margins (63.1 to 59.1). Only amount of credit
extended managed to stay in the 60s, with a reading of 61.8 after December’s 67.8.
There was considerably less movement in the unfavorable categories, which is a good thing this
month. There were even some minor improvements. The rejections of credit applications
stayed in the 50s, but slid slightly from 52.4 to 51.4. Accounts placed for collection fell out of
the 50s again by slipping to 49.8 from December’s 50.5. This category has been slipping back
and forth across the barrier between expansion (over 50) and contraction (under 50) all year.
The disputes category increased a little, but still stayed in the contraction zone – 49.7 as
compared to the 48.3 notched in December.” – Adam Fusco, Associate Editor, NACM
Source: http://web.nacm.org/CMI/PDF/CMIcurrent.pdf; 1/31/18

Private Indicators
Return to TOC
National Association of Credit Management –
Credit Managers’ Index
“In December, the sense was that real progress was ahead and many people have been
speaking of 2018 with great expectations . It may yet work out that way. This month may be
written off as an anomaly, but it may also signal that some of those weaknesses that had been
warned about are manifesting.
The dollar amount beyond terms has been a challenge all year as the slow pays show up one
month and not so much the next. This time the reading was better than it was the month
before, but still hovers in the 40s.
It begs the question – which of these is the anomaly? Is it the good growth that has been
showing up in the GDP numbers or is this month an oddity for the credit managers? Both the
manufacturing and service sectors have seen this decline, so it isn’t a matter of one part of the
economy struggling. This is the point that demands some attention to the pattern that has
been established with the CMI in the past. Given that credit activity precedes a great deal of
the business cycle, the CMI often serves as an early warning system. Still, even with the big
declines, the overall score is comfortably above the line and in expansion territory. The
favorable categories have been near record levels much of the year. Perhaps it was time for
them to come back to earth. It is hoped that this is not the beginning of a more serious slide.”
– Dr. Chris Kuehl, Economist, NACM
Source: http://web.nacm.org/CMI/PDF/CMIcurrent.pdf; 1/31/18

Private Indicators
Return to TOC Source: http://web.nacm.org/CMI/PDF/CMIcurrent.pdf; 1/31/18

Private Indicators January 2018 Report:
Expansion reading sets a 45-year high in the NFIB Optimism Index
“The Small Business Optimism Index
jumped two points to 106.9 in January and
set a record with the number of small
business owners saying Now Is a Good
Time to Expand, according to NFIB’s
Small Business Economic Trends Survey,
released today.” – Holly Wade, NFIB
Return to TOC
Record Number of Small Business Owners Say ‘Now is Good Time to Expand’
“Main Street is roaring. Small business owners are not only reporting better profits, but they’re also
ready to grow and expand. The record level of enthusiasm for expansion follows a year of record-
breaking optimism among small businesses.” – Juanita Duggan, NFIB President and CEO, NFIB
“The historically high index readings over the last year tell us small business owners have never
been more positive about the economy. This is in large response to the new management in
Washington tackling the biggest concerns of small business owners – high taxes and regulations.” –
William C. Dunkelberg, Chief Economist, NFIB
“Now Is a Good Time to Expand registered at 32 percent, the highest level in the history of the
NFIB survey, which began in 1973. Actual Earnings climbed up 11 points from December, the
highest level reported since 1988. Plans to make Capital Outlays jumped up two points, and Plans
to Increase Inventories gained four points.” – Holly Wade, NFIB
Source: http://www.nfib.com/surveys/small-business-economic-trends/; 2/13/18

Private Indicators
Return to TOC
Commentary
“The historically high index readings over the last year tell us small business owners
have never been more positive about the economy.” – William C. Dunkelberg, Chief
Economist, NFIB
“As small business owners struggle to find qualified workers for open positions,
reports of higher worker compensation rose four percentage points to a net 31 percent,
the highest reading since 2000 and among the highest in the 45 years of NFIB’s survey.
Plans to raise compensation also rose one point to a net 24 percent, the highest reading
since 1989.” – Holly Wade, NFIB
“Finding qualified workers now exceeds taxes and regulations as the top concern for
small businesses. ” – Juanita Duggan, NFIB President and CEO, NFIB
Source: http://www.nfib.com/surveys/small-business-economic-trends/; 2/13/18

Private Indicators
Source: https://www.paychex.com/employment-watch; 2/2/18 Return to TOC
The Paychex | IHS Small Business Jobs Index
National Jobs Index
• “At 99.70 in December, the Paychex | IHS Market Small Business Jobs Index has fallen a full
percentage point from its February level, 100.78.
• After moderating just below 100 for several months, the national index dropped more in
December (0.16 percent) than the past four months combined (0.1 percent).” – James Diffley,
Chief Regional Economist, IHS Markit
1/2018
Index: 99.7

Private Indicators
Return to TOC
The Paychex | IHS Small Business Jobs Index
Regional Jobs Index
• “At 100.37, the South is the only
region with an index above 100, and
has ranked first every month in 2018.
• All four regions declined from last
month and last year. At the division
level, only the West South Central,
with the oil recovery, and New
England improved the pace of small
business job growth year-over-year.”
– James Diffley, Chief Regional
Economist, IHS Markit
Note: Percentages displayed in the regional heat map
reflect 1-month changes.
Source: https://www.paychex.com/employment-watch; 2/2/18
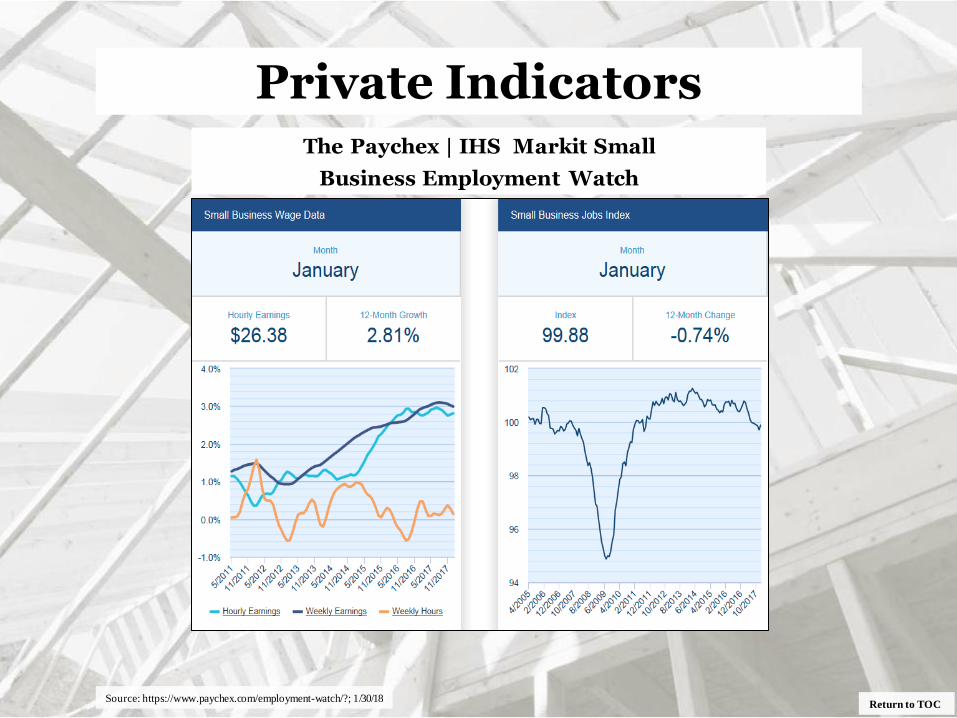
Private Indicators
Return to TOC
The Paychex | IHS Markit Small
Business Employment Watch
Source: https://www.paychex.com/employment-watch/?; 1/30/18

Private Indicators
Return to TOC
Cities In The West: Seattle, Las Vegas And San Francisco Lead Gains In S&P CoreLogic Case-Shiller Home Price Indices
Home prices continue to rise three times faster than the rate of inflation. The S&P CoreLogic Case-
Shiller National Index year-over-year increases have been 5% or more for 16 months; the 20-City
index has climbed at this pace for 28 months. Given slow population and income growth since the
financial crisis, demand is not the primary factor in rising home prices. Construction costs, as
measured by National Income and Product Accounts, recovered after the financial crisis, increasing
between 2% and 4% annually, but do not explain all of the home price gains. From 2010 to the
latest month of data, the construction of single family homes slowed, with single family home starts
averaging 632,000 annually. This is less than the annual rate during the 2007-2009 financial crisis
of 698,000, which is far less than the long-term average of slightly more than one million annually
from 1959 to 2000 and 1.5 million during the 2001-2006 boom years. Without more supply, home
prices may continue to substantially outpace inflation.
Looking across the 20 cities covered here, those that enjoyed the fastest price increases before the
2007-2009 financial crisis are again among those cities experiencing the largest gains. San Diego,
Los Angeles, Miami and Las Vegas, price leaders in the boom before the crisis, are again seeing
strong price gains. They have been joined by three cities where prices were above average during
the financial crisis and continue to rise rapidly – Dallas, Portland OR, and Seattle.” – David Blitzer,
Managing Director and Chairman of the Index Committee, S&P Dow Jones
“The S&P CoreLogic Case-Shiller U.S. National Home Price NSA Index, covering all nine U.S.
census divisions, reported a 6.2% annual gain in November, up from 6.1% in the previous month.
The 10-City Composite annual increase came in at 6.1%, up from 5.9% the previous month. The
20-City Composite posted a 6.4% year-over-year gain, up from 6.3% the previous month.
Source: http://us.spindices.com/index-family/real-estate/sp-corelogic-case-shiller; 1/30/18

Private Indicators
Return to TOC
S&P/Case-Shiller Home Price Indices
Source: http://us.spindices.com/index-family/real-estate/sp-corelogic-case-shiller; 1/30/18
213.9
204.2
195.9
0
25
50
75
100
125
150
175
200
225
250
20-City Composite 10-City Composite U.S. National Home Price Index
Sources: S&P Dow Jones Indices and CoreLogic; Data through August 2018
“The indices have a base value of 110 in January 2000; thus, for example, a current index value of 150 translates to
a 50% appreciation rate since January 2000 for a typical home located within the subject market.” – S&P CoreLogic

Private Indicators
Return to TOC
Wells Fargo Small Business Survey: Q1-2018
“Small business owners began 2018 feeling very positive about the overall economy and outlook
for their businesses. The Wells Fargo/Gallup Small Business Index rose 4 points in the first quarter
to 107. The survey was taken just after the start of the New Year and comes on the heels of a solid
holiday shopping season and very strong fourth quarter. Most of the increase came in the more
forward looking components of the survey. The future expectations series, which reflects how
optimistic business owners are about the economy and their business for the coming year, rose 5
points in the first quarter to 65, which is the highest it has been since December 2006. Business
owners’ assessment of current conditions was little changed, with the present situation series
slipping one point to 42 in the first quarter. The slight drop left the present situation series roughly
in line with its average for the previous four quarters and well above levels in the years prior to
that.” – Mark Vitner, Senior Economist, Wells Fargo Securities Economics Group
Source: http://image.mail1.wf.com/lib/fe8d13727664027a7c/m/2/wf-small-business-20180125.pdf; 1/25/18

Private Indicators
Return to TOC
Business Owners Are Expecting More Growth This Year
“The persistent improvement in small business confidence and notable increase in expectations for
the coming year suggest that more business owners are likely to expand their operations this year,
which means increased investment in plants and equipment. The proportion of business owners
expecting to increase capital spending rose 5 points to 38, which ties the all-time high for this
series, last hit in December 2003. Moreover, the proportion of firms stating they plan to increase
capital spending ‘a lot’ rose to 10 percent, which is the highest ever seen. Capital spending plans
have been rising for the better part of a year and actual capital spending, which includes outlays for
computers, machinery, facilities, or other long-term investments, has also increased. The
proportion of business owners noting that they had increased capital spending over the past year
was unchanged in the first quarter at 30 percent. Fifty-four percent of firms said that capital
spending remained at the same level, while just 15 percent of business owners noted a drop in
capital outlays.” – Mark Vitner, Senior Economist, Wells Fargo Securities Economics Group
Source: http://image.mail1.wf.com/lib/fe8d13727664027a7c/m/2/wf-small-business-20180125.pdf; 1/25/18

Return TOC
Demographics
Source: https://www.stlouisfed.org/on-the-economy/2018/january/older-workers-account-almost-all-job-growth-2000; 1/15/18
Older Workers Account for All Net Job Growth Since 2000
“Prime-age workers” are those between 25 and 54.1 Numbering almost 100 million in
December 2017, this age group is both the largest and most productive set of
workers.2” – William Emmons, Lead Economist, Center for Household Financial
Stability, The Federal Reserve Bank of St. Louis

Return TOC
Demographics
Source: https://www.stlouisfed.org/on-the-economy/2018/january/older-workers-account-almost-all-job-growth-2000; 1/15/18
Older Workers Account for All Net Job Growth Since 2000
“One important consideration on this topic is that the rapid aging of our workforce is
unlikely to continue at this pace. Two important trends contributed to the rapid
increase in the share of employment of older workers shown in the chart:
• A rapid increase in the share of older people in the population
• Diverging employment-to-population ratios by age group
The share of the U.S. adult population aged 55 or older increased from 27 to 36 percent
between 2000 and 2017. This rapid change, due to the aging of the baby boomers, is
unprecedented and is not expected to continue.
At the same time, the employment-to-population ratio of people aged 55 or older
increased from 31 to 39 percent, while the ratio declined from 77 to 72 percent among
people under 55. It seems unlikely, although not impossible, that these trends will
continue to diverge so significantly.” – William Emmons, Lead Economist, Center for
Household Financial Stability, The Federal Reserve Bank of St. Louis

Return TOC
Demographics
Source: https://www.stlouisfed.org/on-the-economy/2018/january/older-workers-account-almost-all-job-growth-2000; 1/15/18
Older Workers Account for All Net Job Growth Since 2000
Future Share of Older Workers
“It is possible to forecast future employment shares by age group using Census Bureau
population projections of detailed age groups and assumptions about future
employment-to-population ratios.
For simplicity, I assumed that the age-specific employment-to-population ratios in the
fourth quarter of 2017 will remain constant in the future. The results for employment
by age group are shown in the table below for two break points — age 55 and age 65.
The first table shows that workers 55 and older are likely to become a slightly larger
share of the workforce by 2027, but the share likely will decline after that. The second
table shows that workers 65 and older are likely to become a larger share of the
workforce over the next 20 years.” – William Emmons, Lead Economist, Center for
Household Financial Stability, The Federal Reserve Bank of St. Louis

Return TOC
Demographics
Source: https://www.stlouisfed.org/on-the-economy/2018/january/older-workers-account-almost-all-job-growth-2000; 1/15/18

Return TOC
Demographics
Source: https://www.stlouisfed.org/on-the-economy/2018/january/older-workers-account-almost-all-job-growth-2000; 1/15/18
Older Workers Account for All Net Job Growth Since 2000
Long-Term Workforce Changes
“The figures below show long-range projections of cumulative increases in
employment for older and younger workers, using first age 55 and then age 65 as break
points.
As the results in the tables suggested, the figures also show that the rapid increase in
workers age 55 and older (or 65 and older) likely will not continue to outstrip younger
workers for long. Within a decade or so, growth of younger workers (however
defined) will once again begin to outstrip the growth of older workers.
A Silver Lining to the Graying of the Workforce
If it’s true that our aging workforce has held back economic growth in recent years,
then the likely return to more normal patterns of job growth by age group is a reason to
be optimistic. The Census Bureau expects the age structure of the population to shift
permanently toward an older population, but the most rapid changes relevant for the
workforce will have occurred within the next decade or so.” – William Emmons, Lead
Economist, Center for Household Financial Stability, The Federal Reserve Bank of St.
Louis

Return TOC
Demographics
Source: https://www.stlouisfed.org/on-the-economy/2018/january/older-workers-account-almost-all-job-growth-2000; 1/15/18
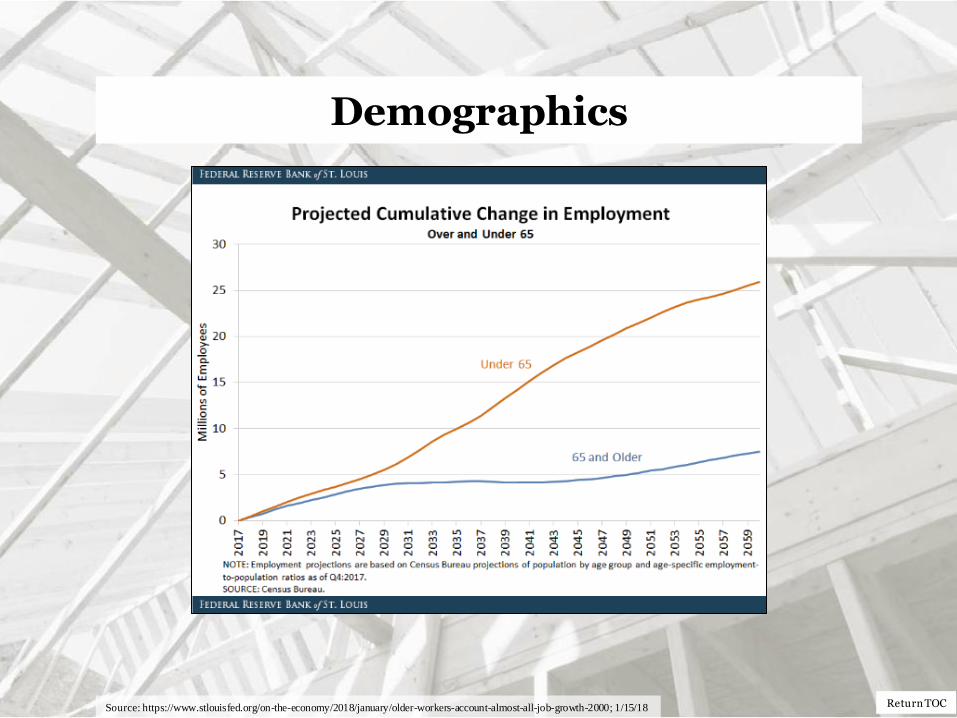
Return TOC
Demographics
Source: https://www.stlouisfed.org/on-the-economy/2018/january/older-workers-account-almost-all-job-growth-2000; 1/15/18

Return TOC
Demographics
Source: http://www.globest.com/sites/jenniferleclaire/2018/01/12/watch-for-the-rise-of-suburbia-and-more-in-2018/?; 1/12/18
Watch for the Rise of Suburbia and More in 2018
There are two “interesting shifts” at hand.
“Aging Millennials will move back to the suburbs, reversing the previous tide of urban living and
working. So says David Rabin, managing director of Private Real Estate at CenterSquare
Investment Management.
“This is an interesting shift in suburban demographics that will increase demand for suburban
multifamily, which will outperform the high-end urban multifamily market, where rents have
peaked due to excess supply and affordability challenges,” Rabin tells GlobeSt.com. “Well-located
and properly amenitized suburban office will be another beneficiary as Millennials seek an
urbanesque environment in the suburbs.”
Rabin also predicts shifting perceptions in big box industrial. As was the case with the enthusiasm
that surrounded urban multifamily, he expects the appeal of big box industrial investment will
begin to soften in late 2018. (Here’s how lenders are targeting multifamily sector gaps.)
“With prices already beginning to exceed replacement cost, further development occurring and a
growing pipeline, the market will either meet its equilibrium or become oversaturated,” predicts
Rabin. “Higher supply and lack of optimal locations for the new product will impact the ability to
achieve occupancy and rent targets therefore providing headwinds to valuations going into 2019 .” –
Jennifer LeClaire, Journalist, GlobeSt.com

Return TOC
Demographics
Source: http://www.globest.com/sites/jenniferleclaire/2018/01/12/watch-for-the-rise-of-suburbia-and-more-in-2018/?; 1/12/18
Watch for the Rise of Suburbia and More in 2018
There are two “interesting shifts” at hand.
“Clearly, the market for big box industrial is inherently limited, with fewer companies
existing to serve as end users of such large spaces. Rabin says rent levels face ceilings as
well with supply being less constrained as developers move further out to find cheaper land
combined and big users who will move to save a penny in rent.
A broader demand pool exists for companies targeting mid-size and smaller spaces at infill
locations that can help them access and service their customer base,” he says. “Furthermore,
supply in the smaller, infill industrial space is limited as high land prices and obsolete
functionality have made new development uneconomical in the face of declining inventory.
Collectively, these demand and supply forces should provide support for strong fundamental
performance in this sector.” – Jennifer LeClaire, Journalist, GlobeSt.com

Return TOC
Economics
Source: https://www.philadelphiafed.org/research-and-data/real-time-center/survey-of-professional-forecasters/2018/survq118; 1/12/18
The Federal Reserve Bank of Philadelphia
First Quarter 2018 Survey of Professional Forecasters
Stronger Output Growth and Brighter Labor Market
“The U.S. economy looks stronger now than it did three months ago, according to 36
forecasters surveyed by the Federal Reserve Bank of Philadelphia. The forecasters predict
real GDP will grow at an annual rate of 3.0 percent this quarter and 2.9 percent next quarter.
On an annual-average over annual-average basis, the forecasters predict real GDP growing
2.8 percent in 2018, 2.5 percent in 2019, and 2.0 percent in 2020. The forecasts for 2018,
2019, and 2020 are higher than the estimates of three months ago. For 2021, real GDP is
estimated to grow 1.7 percent.
A brighter outlook for the labor market accompanies the outlook for stronger output growth.
The forecasters predict the unemployment rate will average 4.0 percent in 2018, 3.8 percent
in 2019, 3.9 percent in 2020, and 4.0 percent in 2021. The projections for 2018, 2019, and
2020 are below those of the last survey, indicating a brighter outlook for unemployment.
The panelists also predict an improvement in employment for 2018. The projections for the
annual-average level of nonfarm payroll employment suggest job gains at a monthly rate of
175,100 in 2018, up from the previous estimate of 163,400. (These annual-average estimates
are computed as the year-to-year change in the annual-average level of nonfarm payroll
employment, converted to a monthly rate.)” – Tom Stark, The Federal Reserve Bank of
Philadelphia

Return TOC
Economics
Source: https://www.philadelphiafed.org/research-and-data/real-time-center/survey-of-professional-forecasters/2018/survq118; 1/12/18

Return TOC
Economics
Source: http://www.globest.com/sites/erikamorphy/2018/02/12/roundtable-sentiment-index-suggests-some-qualms-about-the-future/?; 2/12/18
Roundtable Sentiment Index Suggests Some Qualms About The Future
“Participants in our Q1 Index survey also report that current market conditions may not last throughout next year.”
“The Real Estate Roundtable’s Q1 2018 Sentiment Index inched up one point from
the last quarter of 2017 to register at a solid 54. The score was a reflection of
commercial real estate executives’ anticipation of “strong near term asset values and
capital availability,” according to Roundtable CEO Jeff DeBoer. “Strong, growing
commercial real estate markets go hand in hand with overall positive economic
growth,” he said in a prepared statement.” – Erika Morphy, Writer, GlobeST.com

Return TOC
Economics
Source: http://www.globest.com/sites/erikamorphy/2018/02/12/roundtable-sentiment-index-suggests-some-qualms-about-the-future/?; 2/12/18
Roundtable Sentiment Index Suggests
“However executives are less confident about future conditions, as evidenced by the
score of 51 for the Future Conditions Index — a decrease by one point from the
previous quarter. Moreover, there is a noticeable gap between the scores for current
conditions (57) and future conditions (51). “Participants in our Q1 Index survey also
report that current market conditions may not last throughout next year,” DeBoer said.
Indeed the Roundtable noted in its report that while responders are feeling comfortable
about the stability of the real estate market in 2018, many have expressed concerns
about what the market may look like in 2019.” – Erika Morphy, Writer, GlobeST.com

Return TOC Return to TOC
Virginia Tech Disclaimer
Disclaimer of Non-endorsement
Reference herein to any specific commercial products, process, or service by trade name, trademark, manufacturer, or
otherwise, does not constitute or imply its endorsement, recommendation, or favoring by Virginia Tech. The views and
opinions of authors expressed herein do not necessarily state or reflect those of Virginia Tech, and shall not be used for
advertising or product endorsement purposes.
Disclaimer of Liability
With respect to documents sent out or made available from this server, neither Virginia Tech nor any of its employees,
makes any warranty, expressed or implied, including the warranties of merchantability and fitness for a particular
purpose, or assumes any legal liability or responsibility for the accuracy, completeness, or usefulness of any information,
apparatus, product, or process disclosed, or represents that its use would not infringe privately owned rights.
Disclaimer for External Links
The appearance of external hyperlinks does not constitute endorsement by Virginia Tech of the linked web sites, or the
information, products or services contained therein. Unless otherwise specified, Virginia Tech does not exercise any
editorial control over the information you December find at these locations. All links are provided with the intent of
meeting the mission of Virginia Tech’s web site. Please let us know about existing external links you believe are
inappropriate and about specific additional external links you believe ought to be included.
Nondiscrimination Notice
Virginia Tech prohibits discrimination in all its programs and activities on the basis of race, color, national origin, age,
disability, and where applicable, sex, marital status, familial status, parental status, religion, sexual orientation, genetic
information, political beliefs, reprisal, or because all or a part of an individual's income is derived from any public
assistance program. Persons with disabilities who require alternative means for communication of program information
(Braille, large print, audiotape, etc.) should contact the author. Virginia Tech is an equal opportunity provider and
employer.

Return TOC
U.S. Department of Agriculture Disclaimer
Disclaimer of Non-endorsement
Reference herein to any specific commercial products, process, or service by trade name, trademark, manufacturer, or
otherwise, does not necessarily constitute or imply its endorsement, recommendation, or favoring by the United States
Government. The views and opinions of authors expressed herein do not necessarily state or reflect those of the United
States Government, and shall not be used for advertising or product endorsement purposes.
Disclaimer of Liability
With respect to documents available from this server, neither the United States Government nor any of its employees,
makes any warranty, express or implied, including the warranties of merchantability and fitness for a particular purpose,
or assumes any legal liability or responsibility for the accuracy, completeness, or usefulness of any information,
apparatus, product, or process disclosed, or represents that its use would not infringe privately owned rights.
Disclaimer for External Links
The appearance of external hyperlinks does not constitute endorsement by the U.S. Department of Agriculture of the
linked web sites, or the information, products or services contained therein. Unless otherwise specified, the Department
does not exercise any editorial control over the information you December find at these locations. All links are provided
with the intent of meeting the mission of the Department and the Forest Service web site. Please let us know about
existing external links you believe are inappropriate and about specific additional external links you believe ought to be
included.
Nondiscrimination Notice
The U.S. Department of Agriculture (USDA) prohibits discrimination in all its programs and activities on the basis of
race, color, national origin, age, disability, and where applicable, sex, marital status, familial status, parental status,
religion, sexual orientation, genetic information, political beliefs, reprisal, or because all or a part of an individual's
income is derived from any public assistance program. (Not all prohibited bases apply to all programs.) Persons with
disabilities who require alternative means for communication of program information (Braille, large print, audiotape,
etc.) should contact USDA's TARGET Center at 202.110.21100 (voice and TDD). To file a complaint of discrimination
write to USDA, Director, Office of Civil Rights, 1400 Independence Avenue, S.W., Washington, D.C. 20250-11411 or
call 1100.11115.3211 (voice) or 202.110.11311 (TDD). The USDA is an equal opportunity provider and employer.
Return to TOC