the view from below - superdata kids mobile presentation at casual connect usa 2015
TRANSCRIPT

THE VIEW FROM BELOW
CASUAL CONNECT USA 2015
MOBILE GAMES FOR THE NEXT GENERATIONSTEPHANIE LLAMAS, DIRECTOR OF RESEARCH
@STEPHINANERS @_SUPERDATA #CASUALCONNECTUSA

2THE VIEW FROM BELOW | © 2015 SuperData Research | www.superdataresearch.com
| Playable media & games market research
Stephanie Llamas
Director, Research & Consumer Insights
SuperData Research

Relevant market data and insight on digital games and playable media
| Playable media & games market research
3THE VIEW FROM BELOW | © 2015 SuperData Research | www.superdataresearch.com

Relevant market data and insight on digital games and playable media
Monthly analyses and industry reports using digital point-of-sale data
| Playable media & games market research
4THE VIEW FROM BELOW | © 2015 SuperData Research | www.superdataresearch.com
Relevant market data and insight on digital games and playable media
Monthly analyses and industry reports using digital point-of-sale data
Understand what people play, connect to and spend on
| Playable media & games market research
5THE VIEW FROM BELOW | © 2015 SuperData Research | www.superdataresearch.com
Relevant market data and insight on digital games and playable media
Monthly analyses and industry reports using digital point-of-sale data
Understand what people play, connect to and spend on
A next gen approach for next gen entertainment
| Playable media & games market research
6THE VIEW FROM BELOW | © 2015 SuperData Research | www.superdataresearch.com
| Playable media & games market research
7THE VIEW FROM BELOW | © 2015 SuperData Research | www.superdataresearch.com

8
| Playable media & games market research
LANDSCAPE
THE VIEW FROM BELOW | © 2015 SuperData Research | www.superdataresearch.com
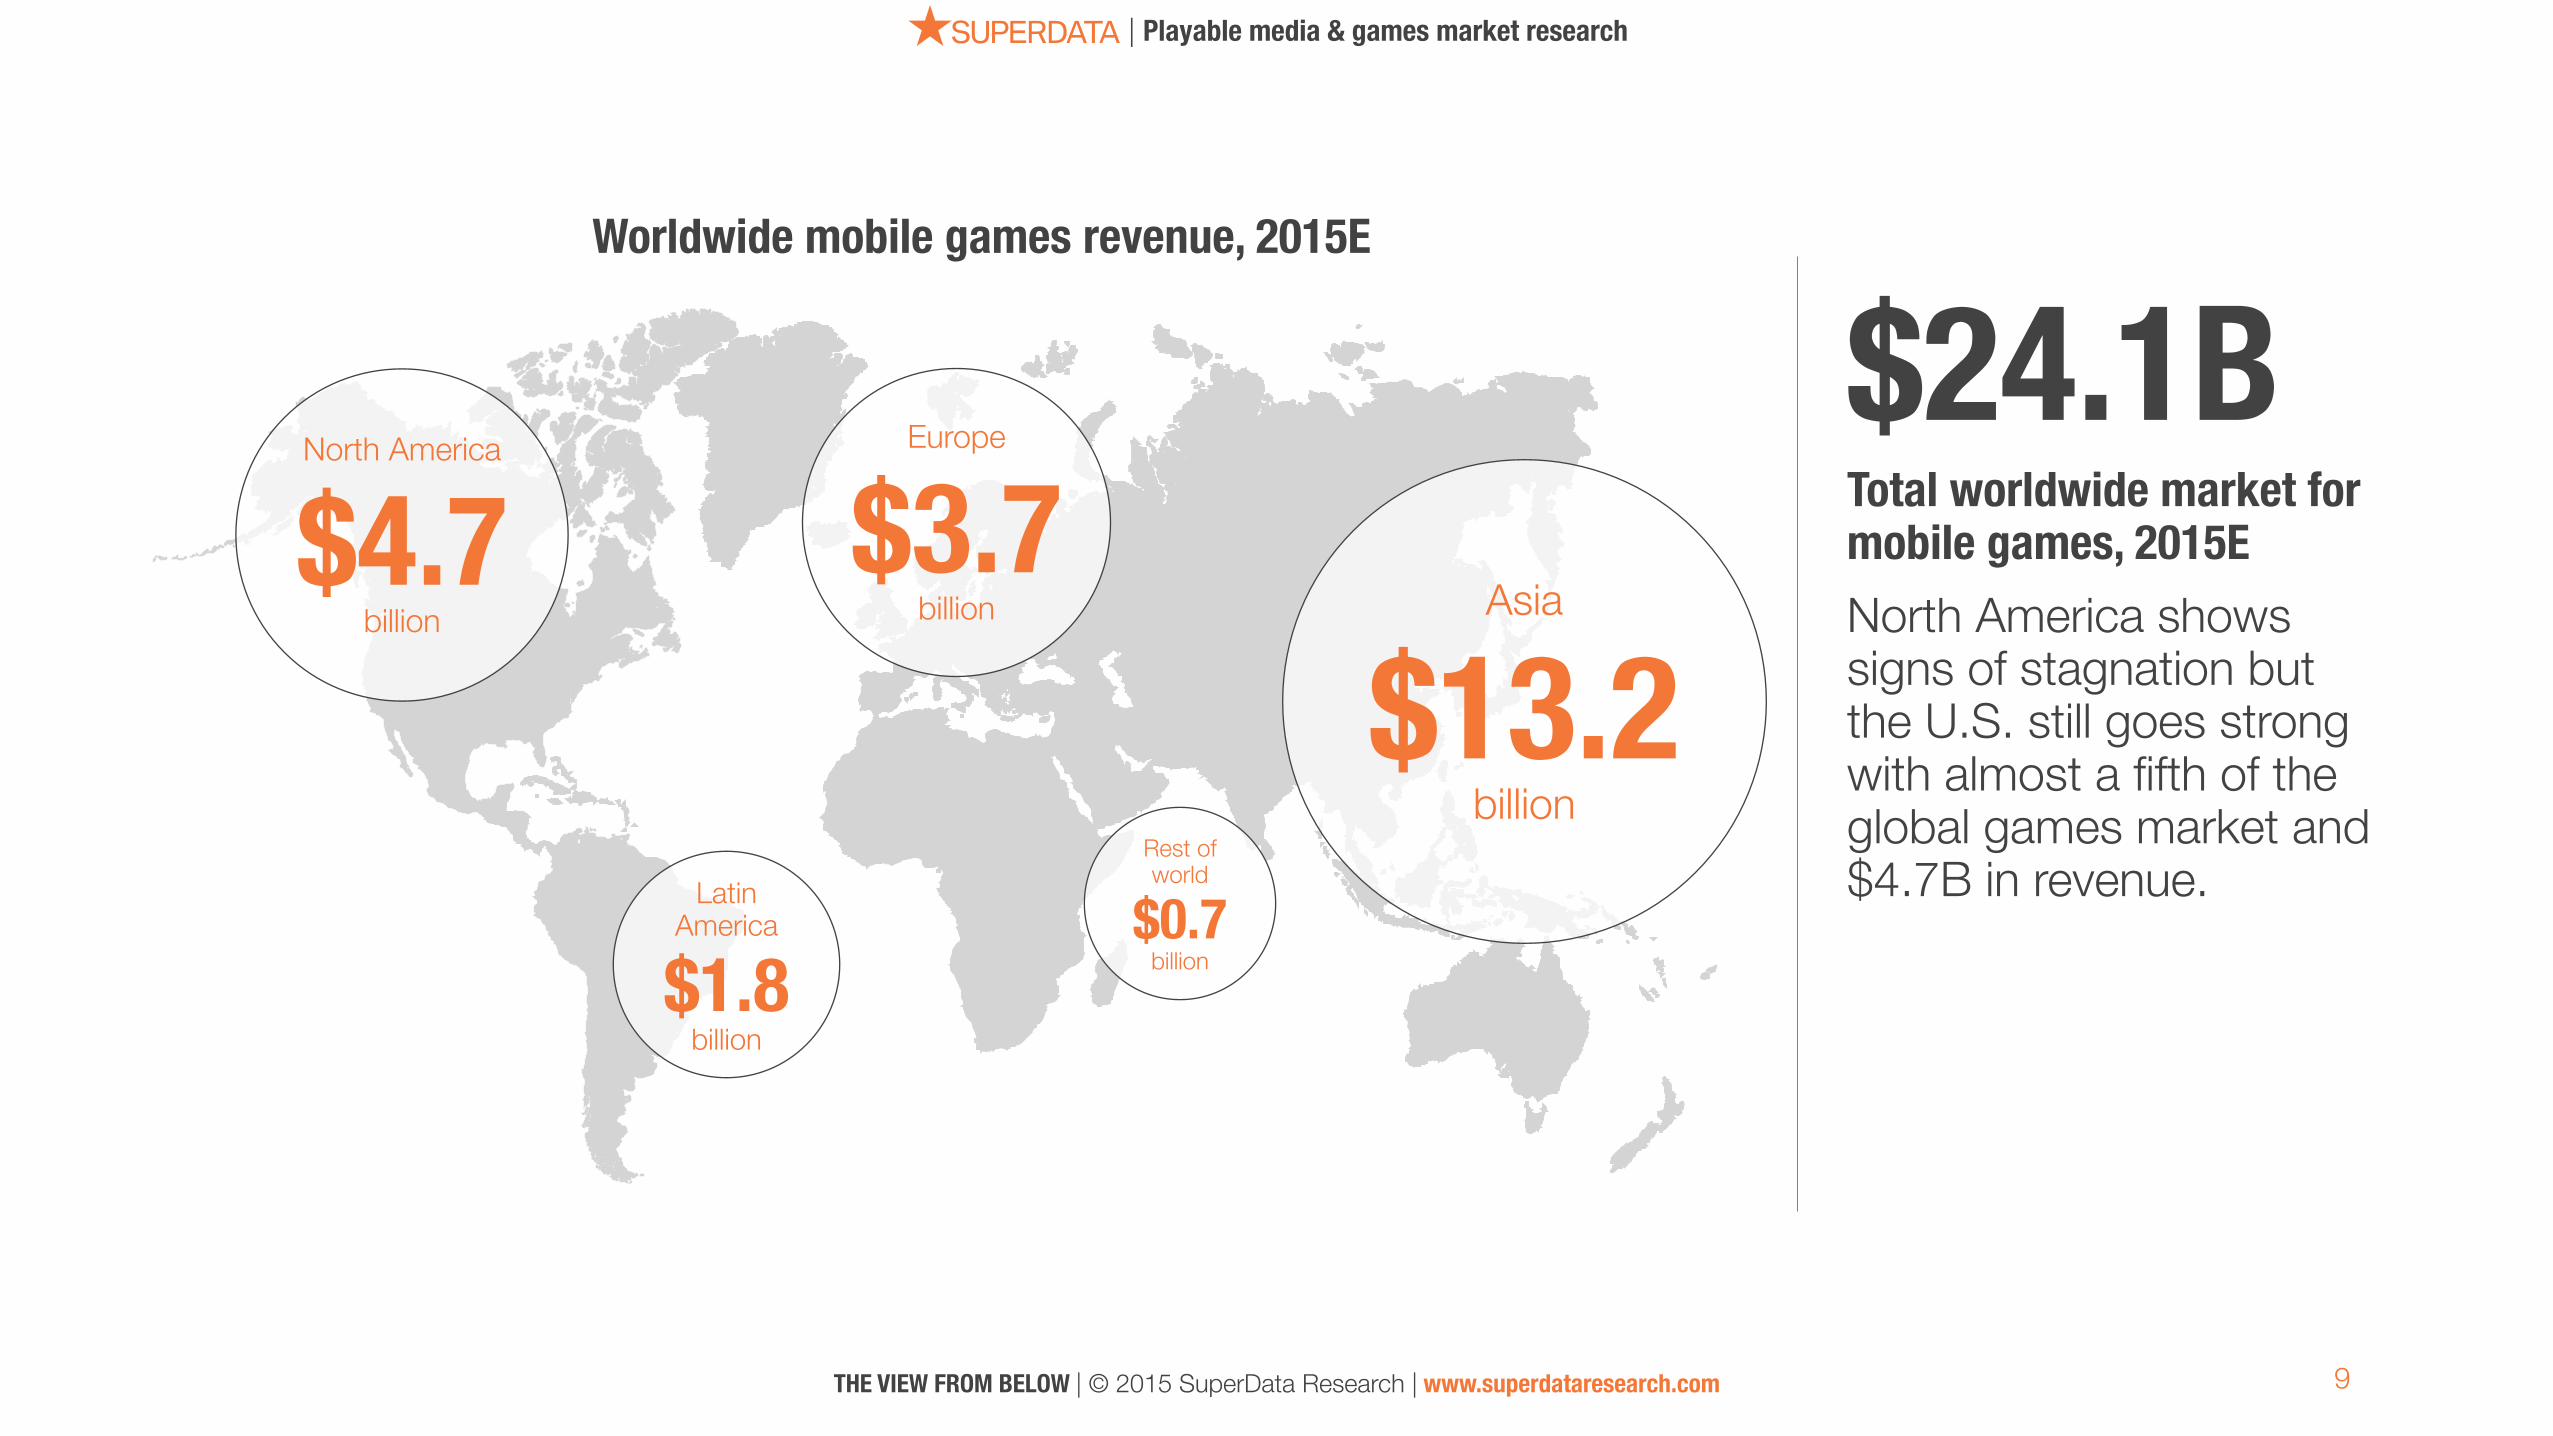
Worldwide mobile games revenue, 2015E
$24.1B Total worldwide market for mobile games, 2015E North America shows signs of stagnation but the U.S. still goes strong with almost a fifth of the global games market and $4.7B in revenue.
9
| Playable media & games market research
North America
$4.7 billion
Latin America
$1.8 billion
Asia
$13.2 billion
Europe
$3.7 billion
Rest of world
$0.7 billion
THE VIEW FROM BELOW | © 2015 SuperData Research | www.superdataresearch.com
10
| Playable media & games market research
THE VIEW FROM BELOW | © 2015 SuperData Research | www.superdataresearch.com
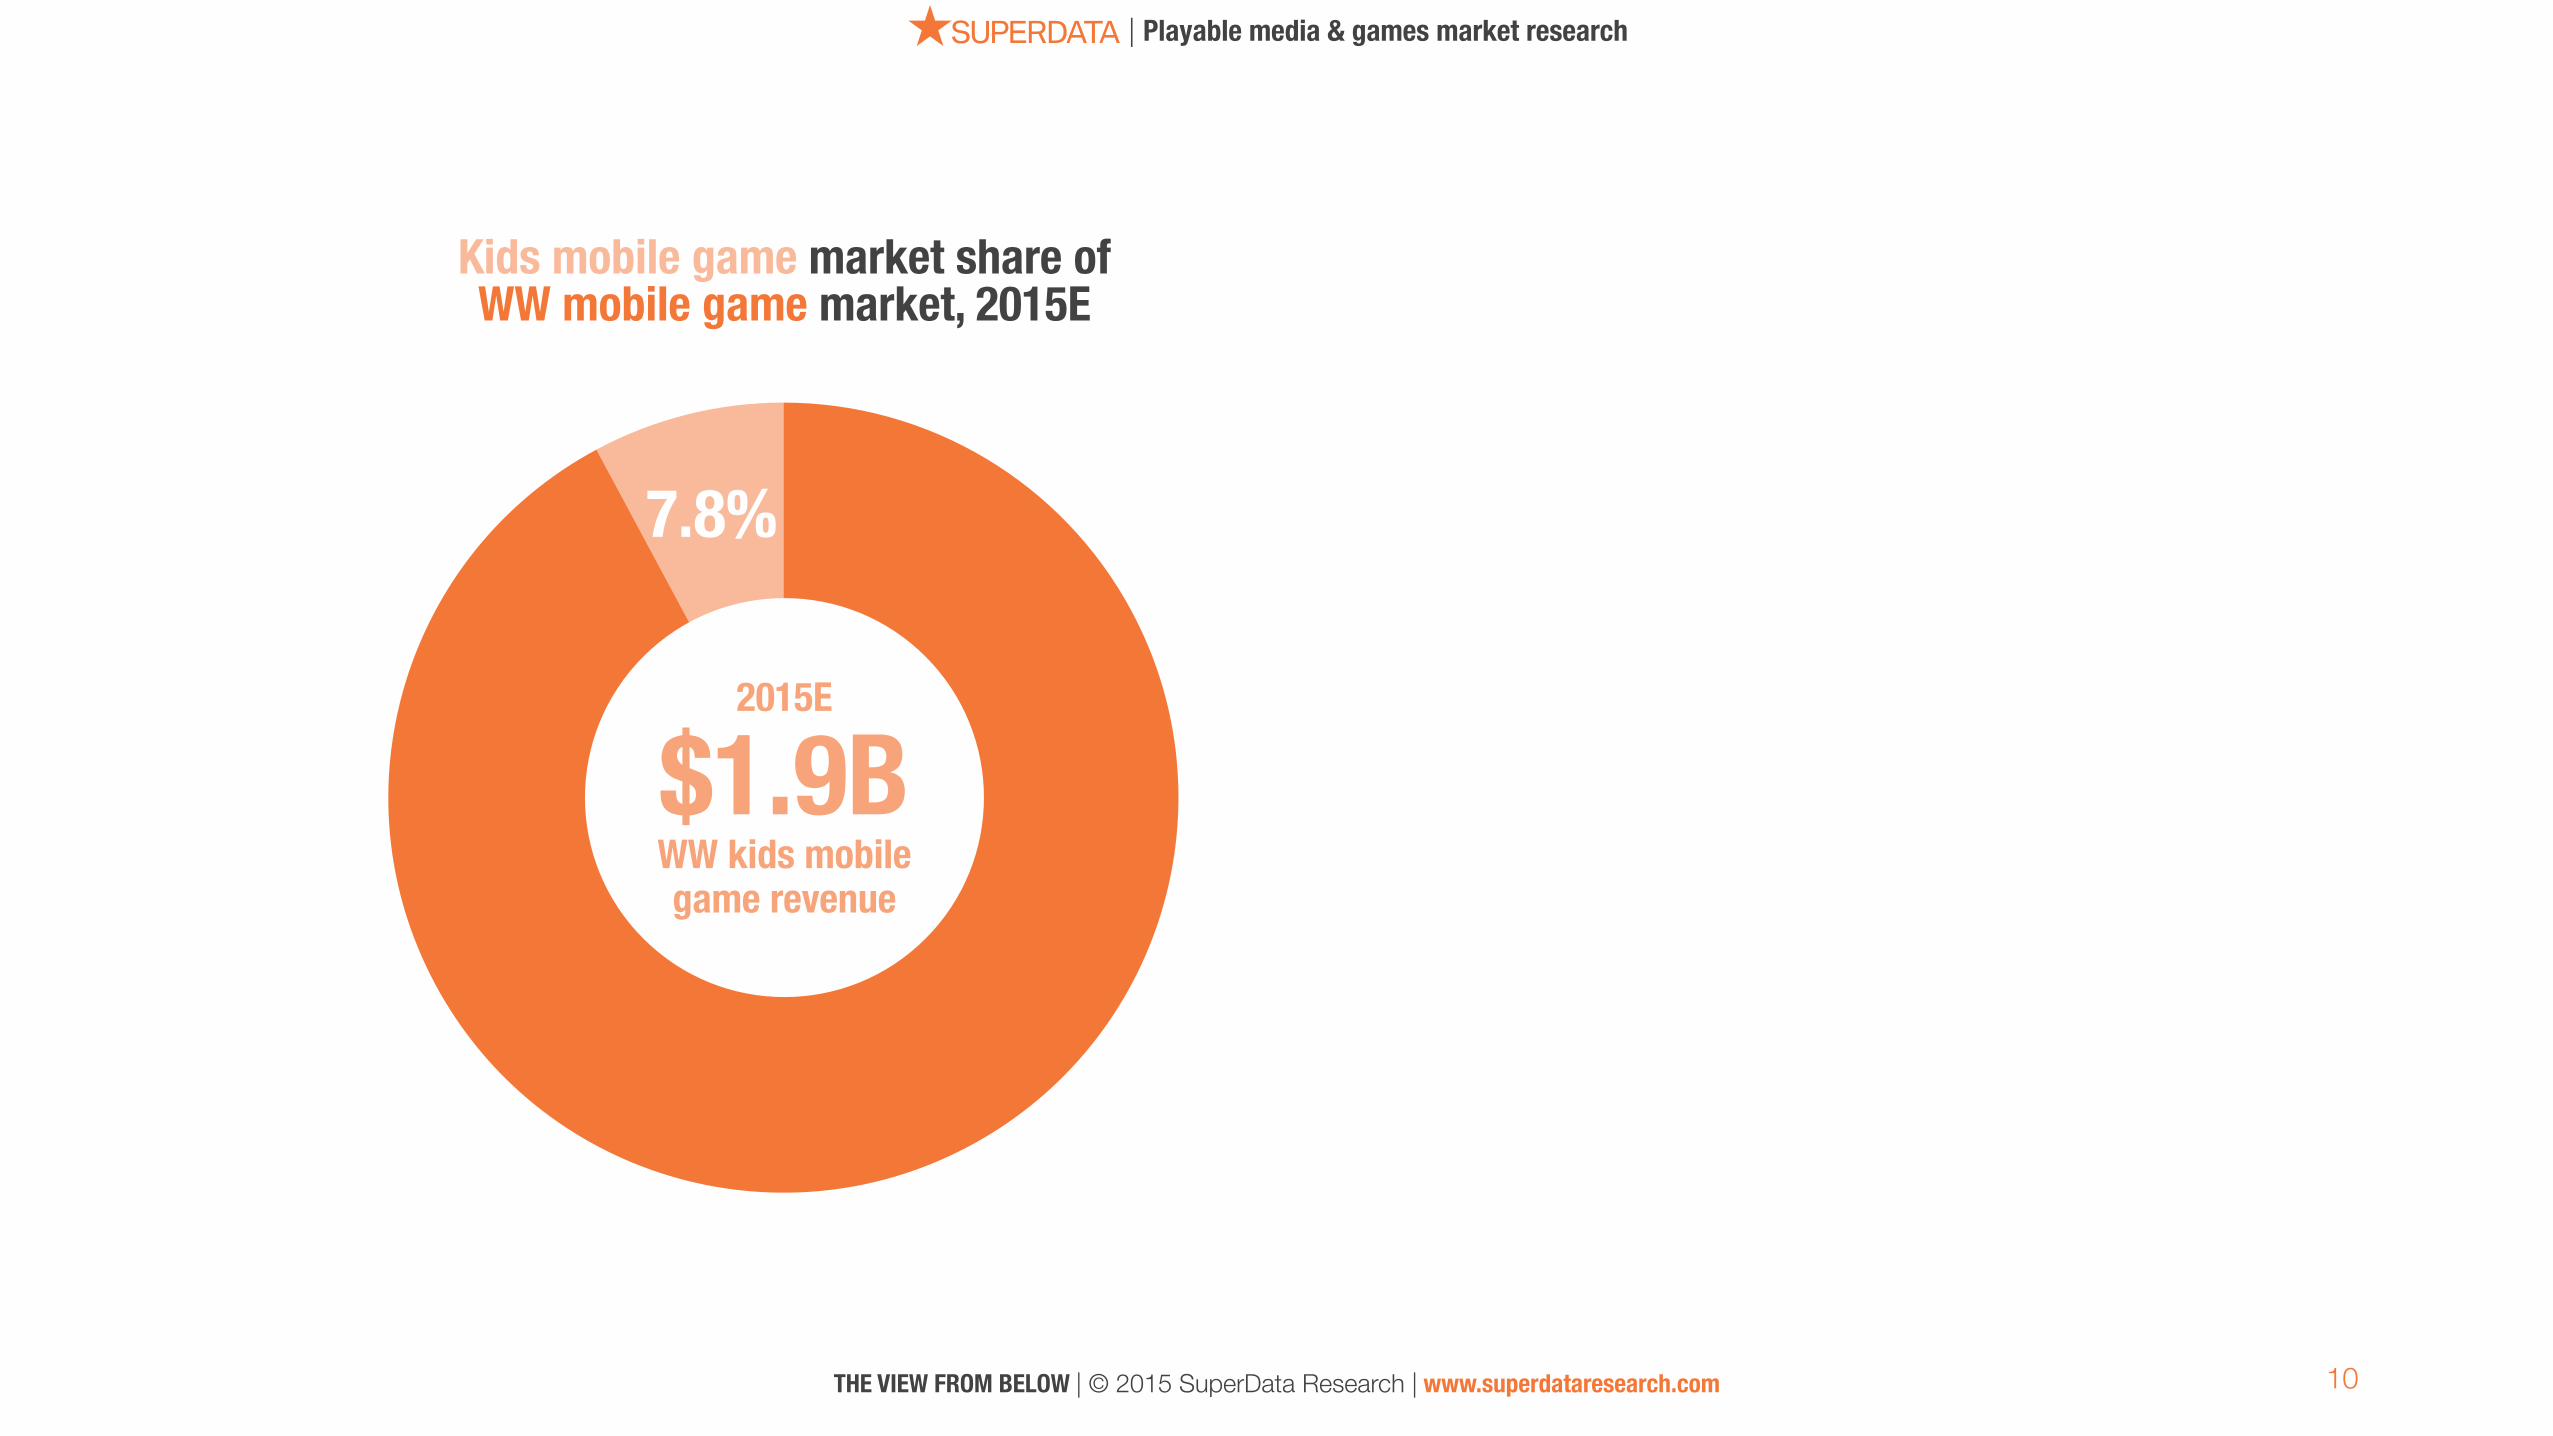
Kids mobile game market share of WW mobile game market, 2015E
7.8%
2015E
$1.9B WW kids mobile game revenue
11
| Playable media & games market research
THE VIEW FROM BELOW | © 2015 SuperData Research | www.superdataresearch.com
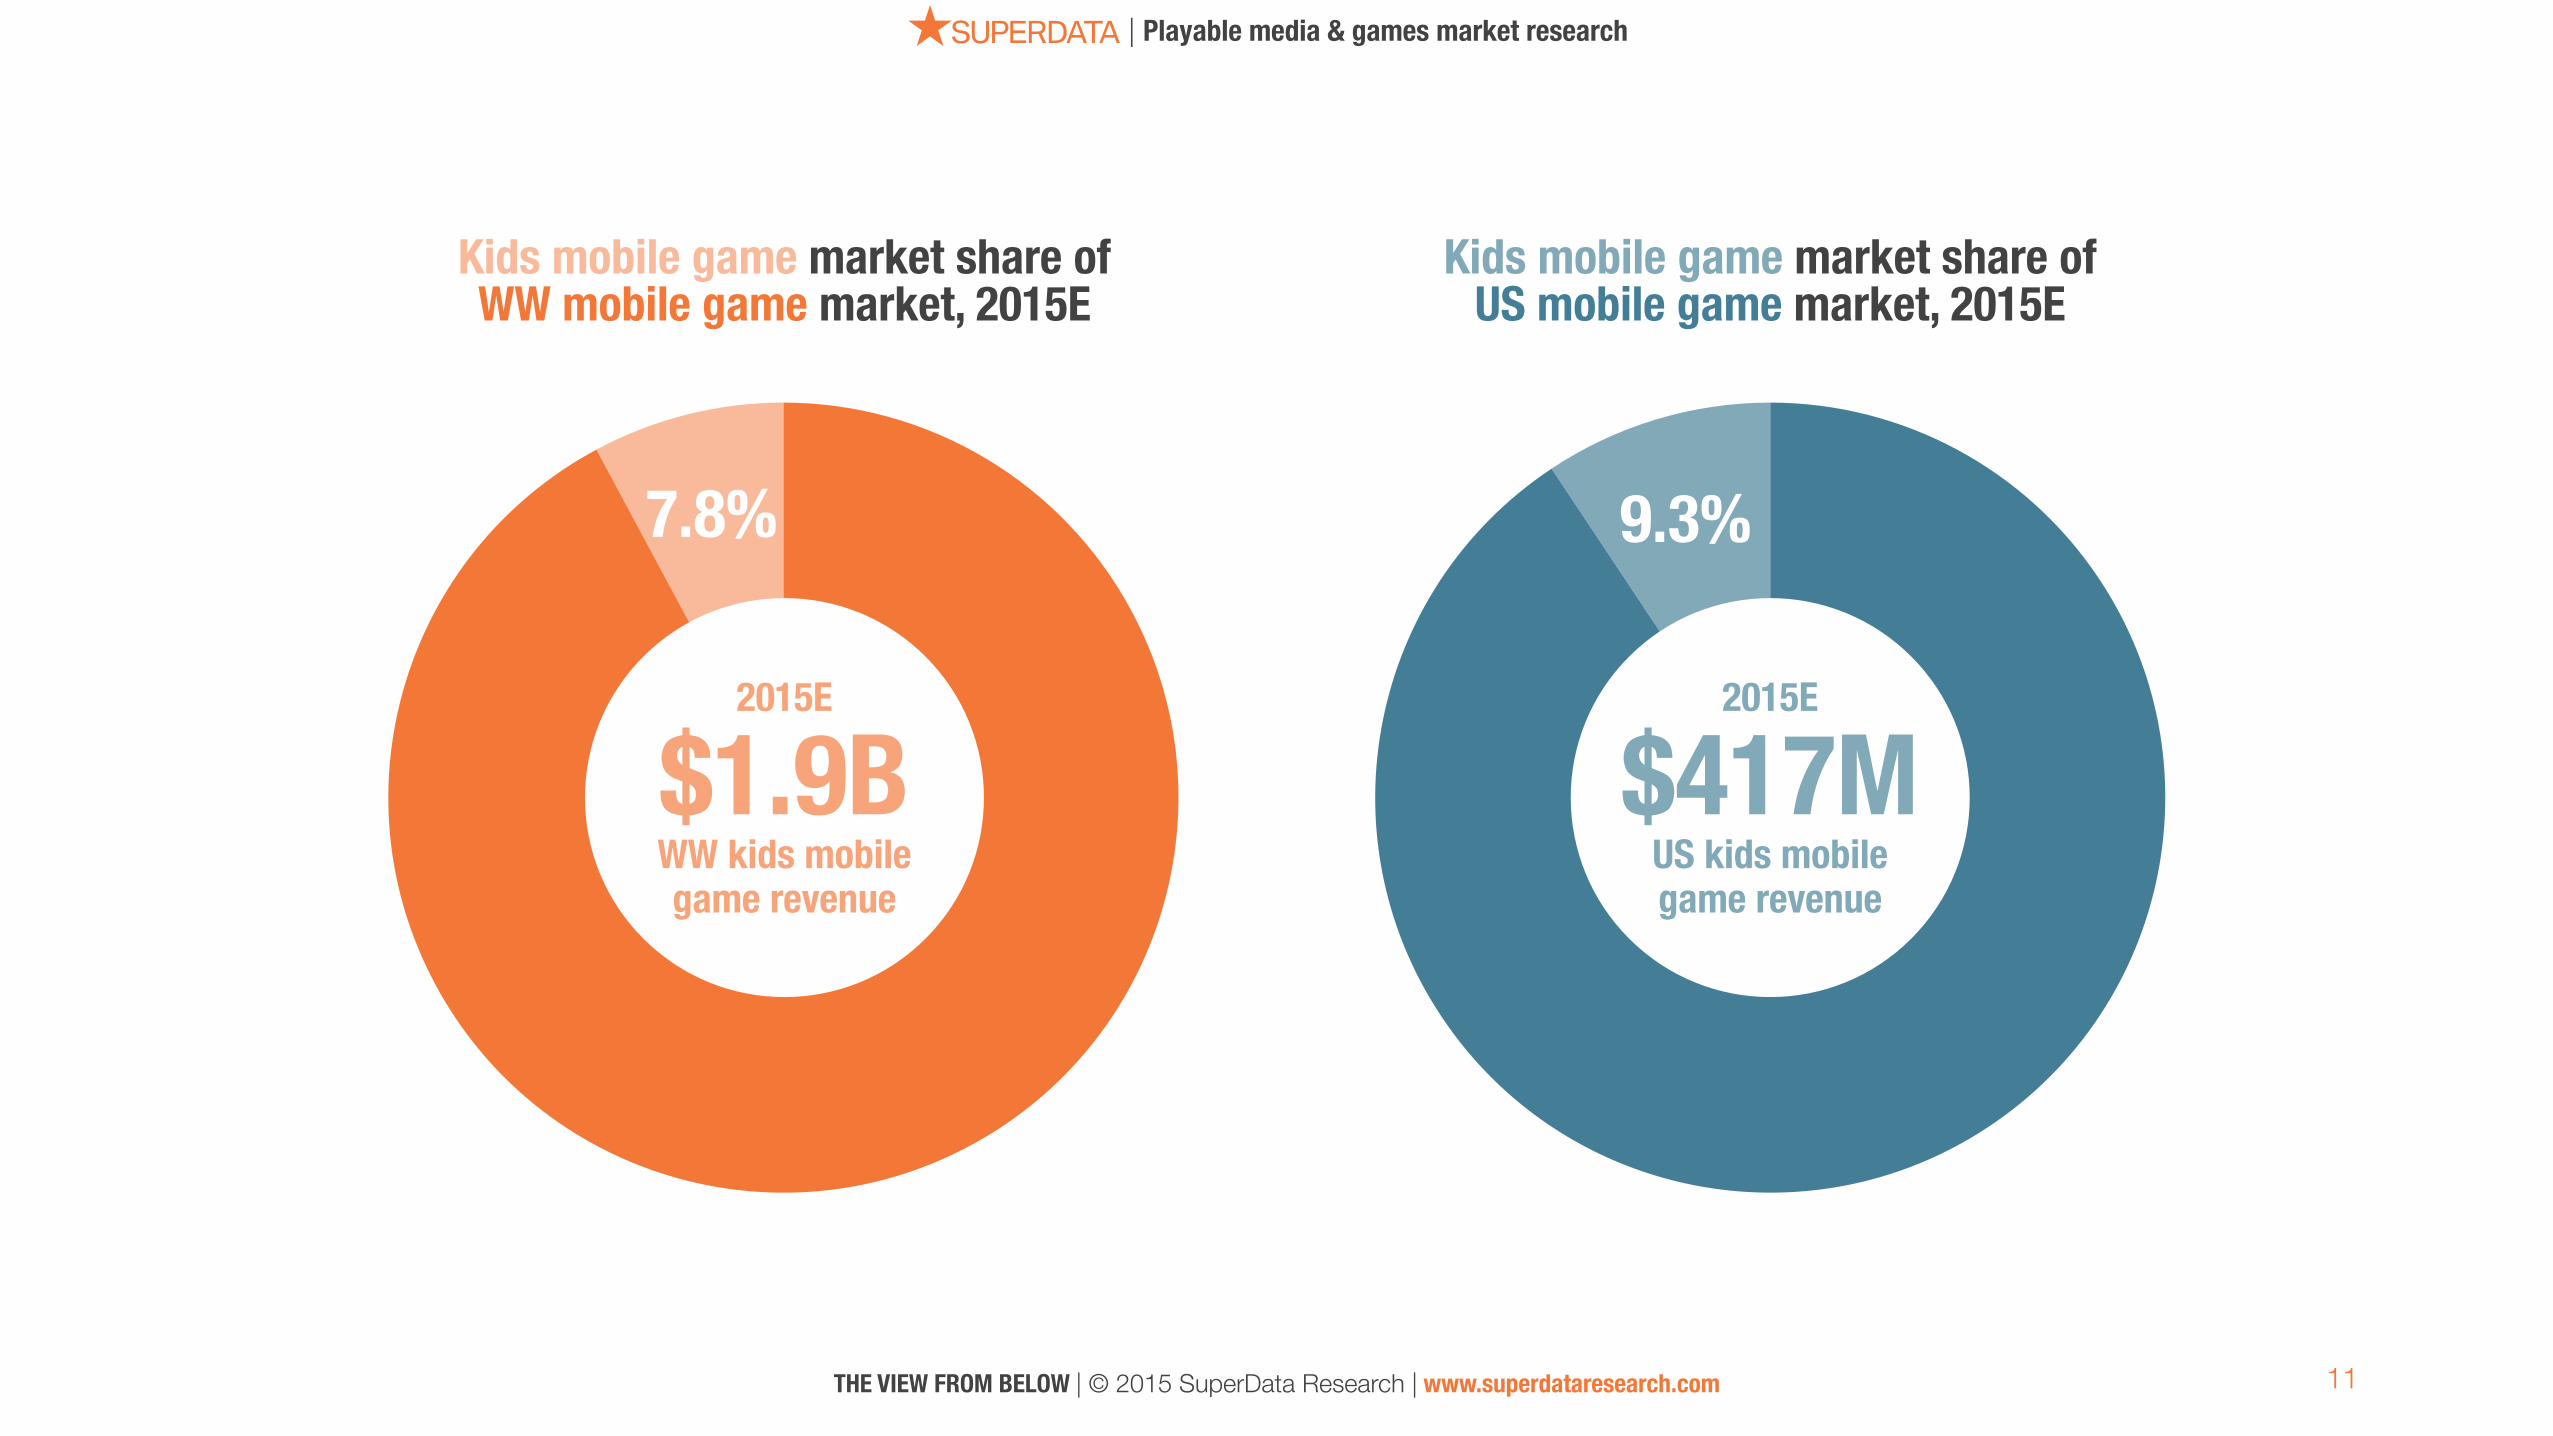
7.8% 9.3%
Kids mobile game market share of WW mobile game market, 2015E
Kids mobile game market share of US mobile game market, 2015E
2015E
$417M US kids mobile game revenue
2015E
$1.9B WW kids mobile game revenue
12
| Playable media & games market research
THE VIEW FROM BELOW | © 2015 SuperData Research | www.superdataresearch.com
75
100
125
150
175
J F M A M J J A S O N D J F M A M J
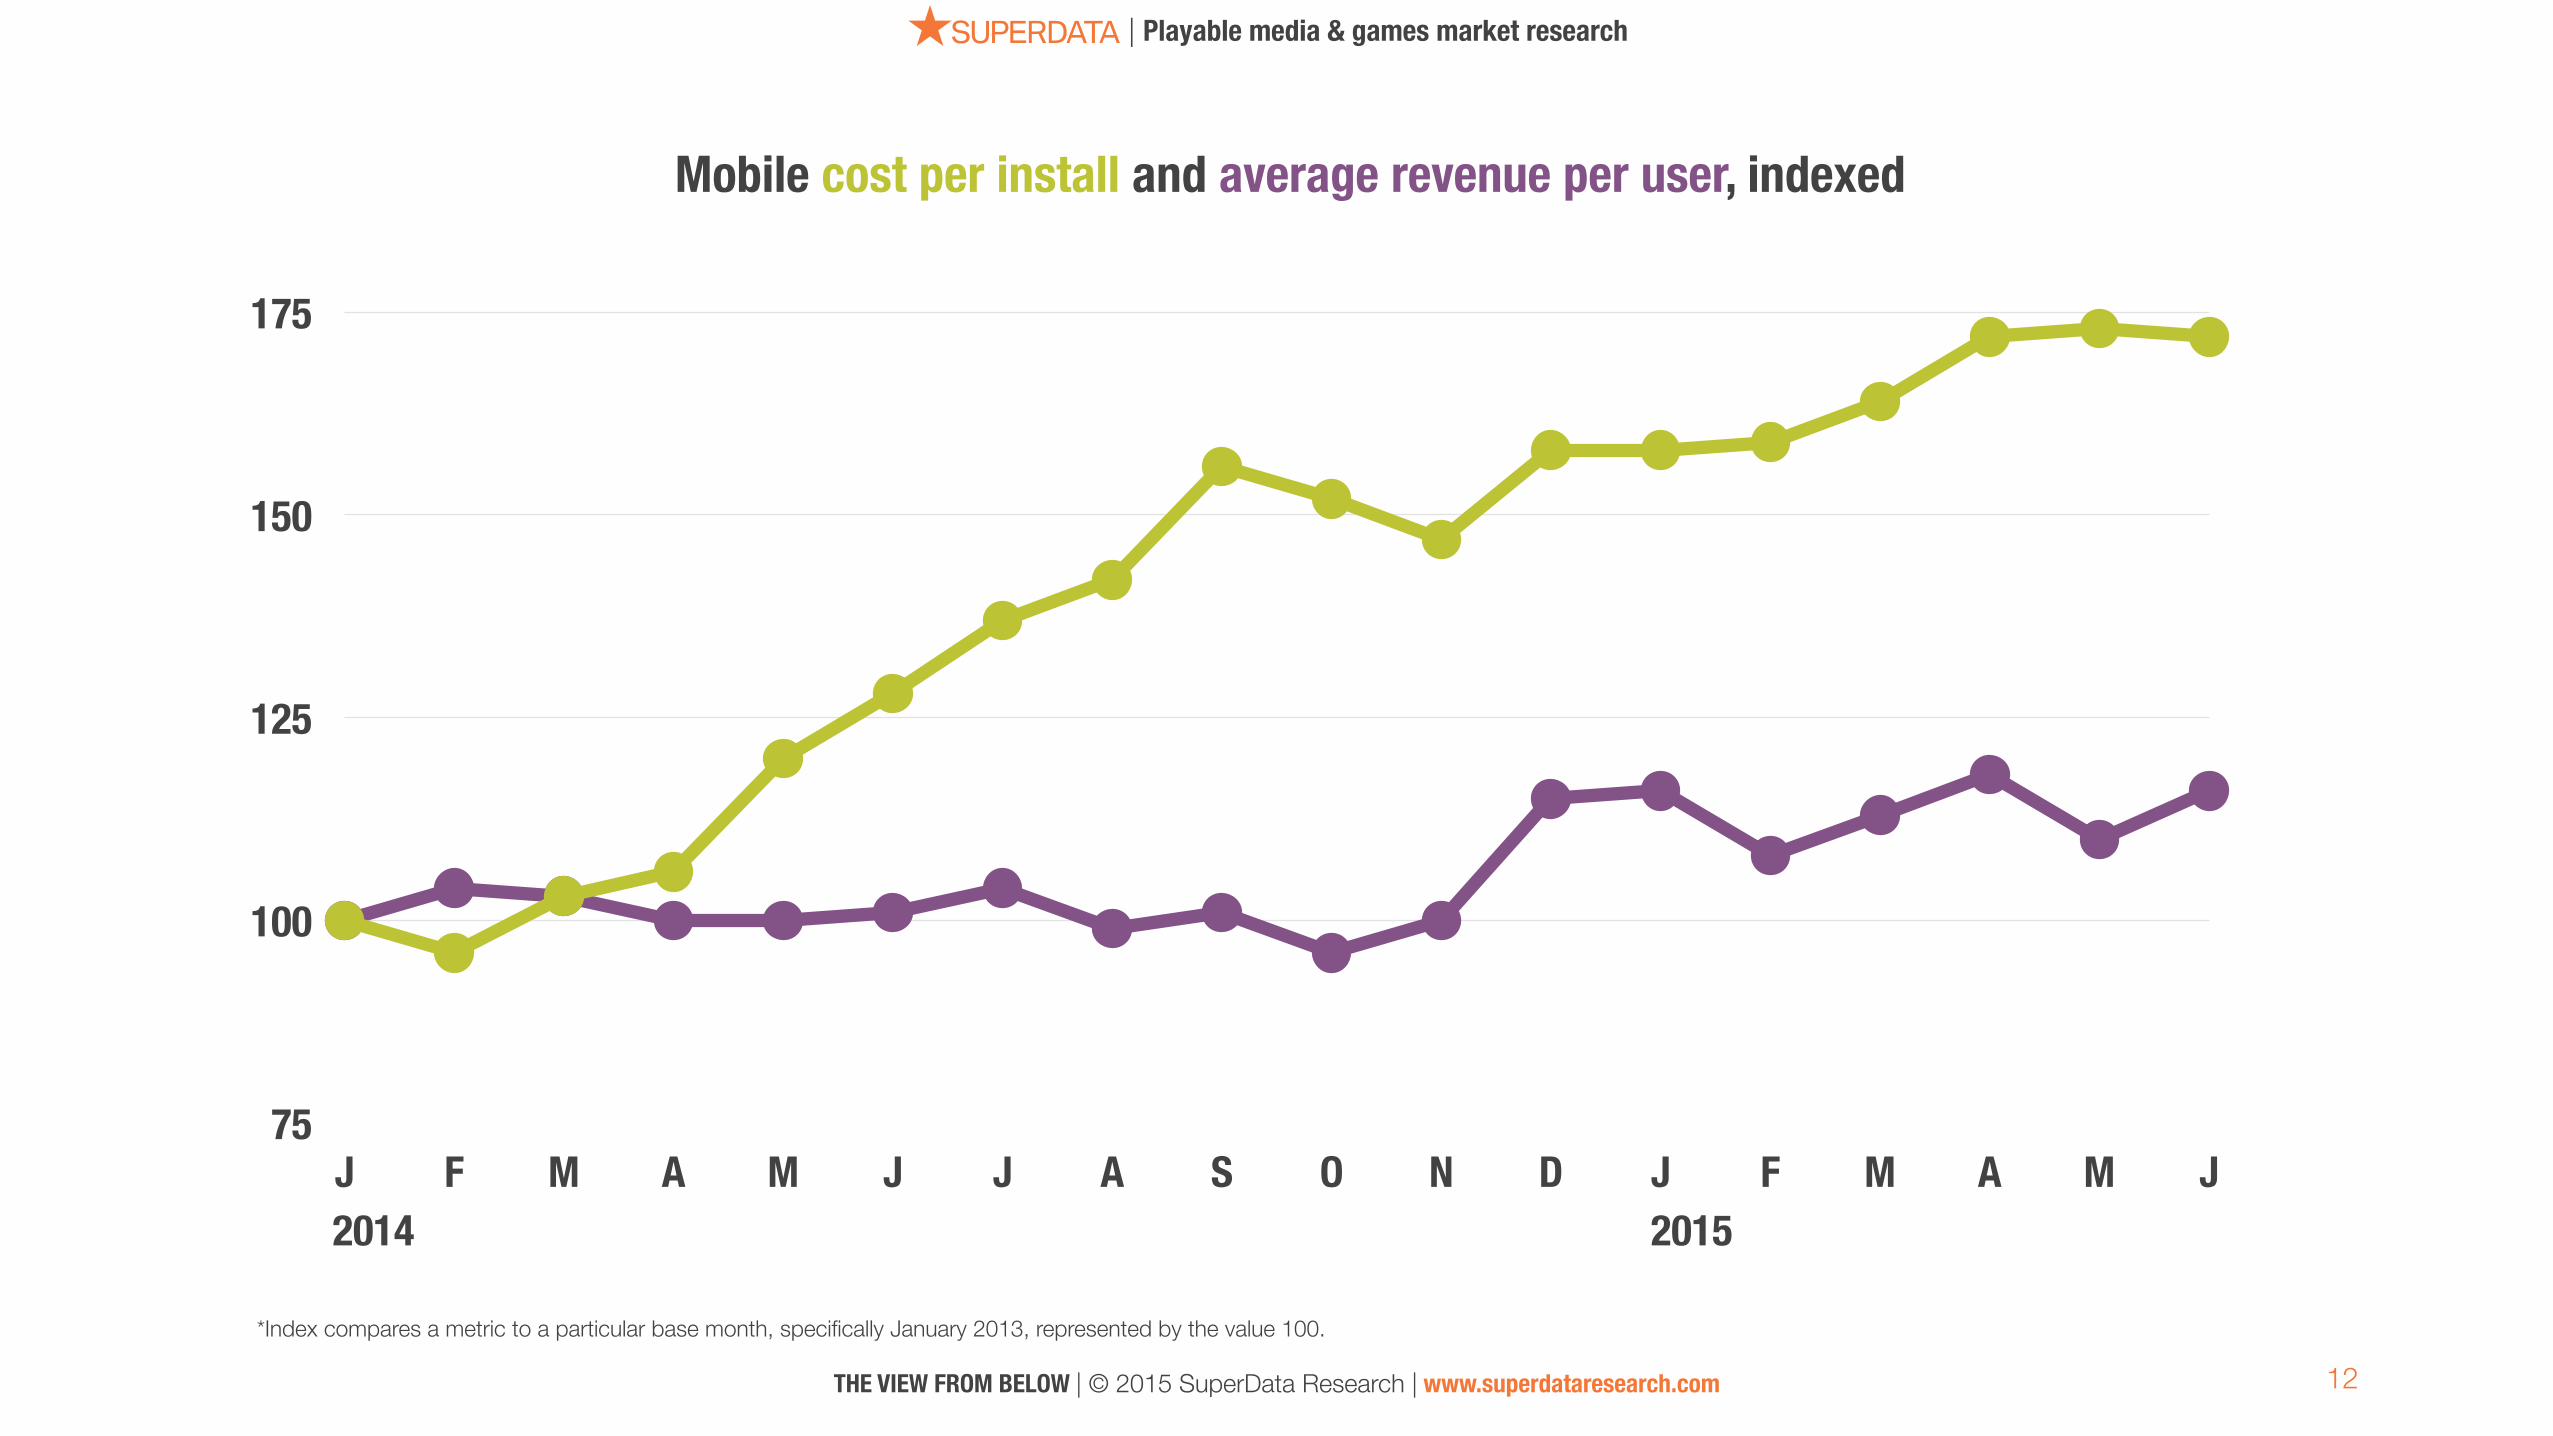
Mobile cost per install and average revenue per user, indexed
*Index compares a metric to a particular base month, specifically January 2013, represented by the value 100.
2014 2015
13
| Playable media & games market research
THE VIEW FROM BELOW | © 2015 SuperData Research | www.superdataresearch.com
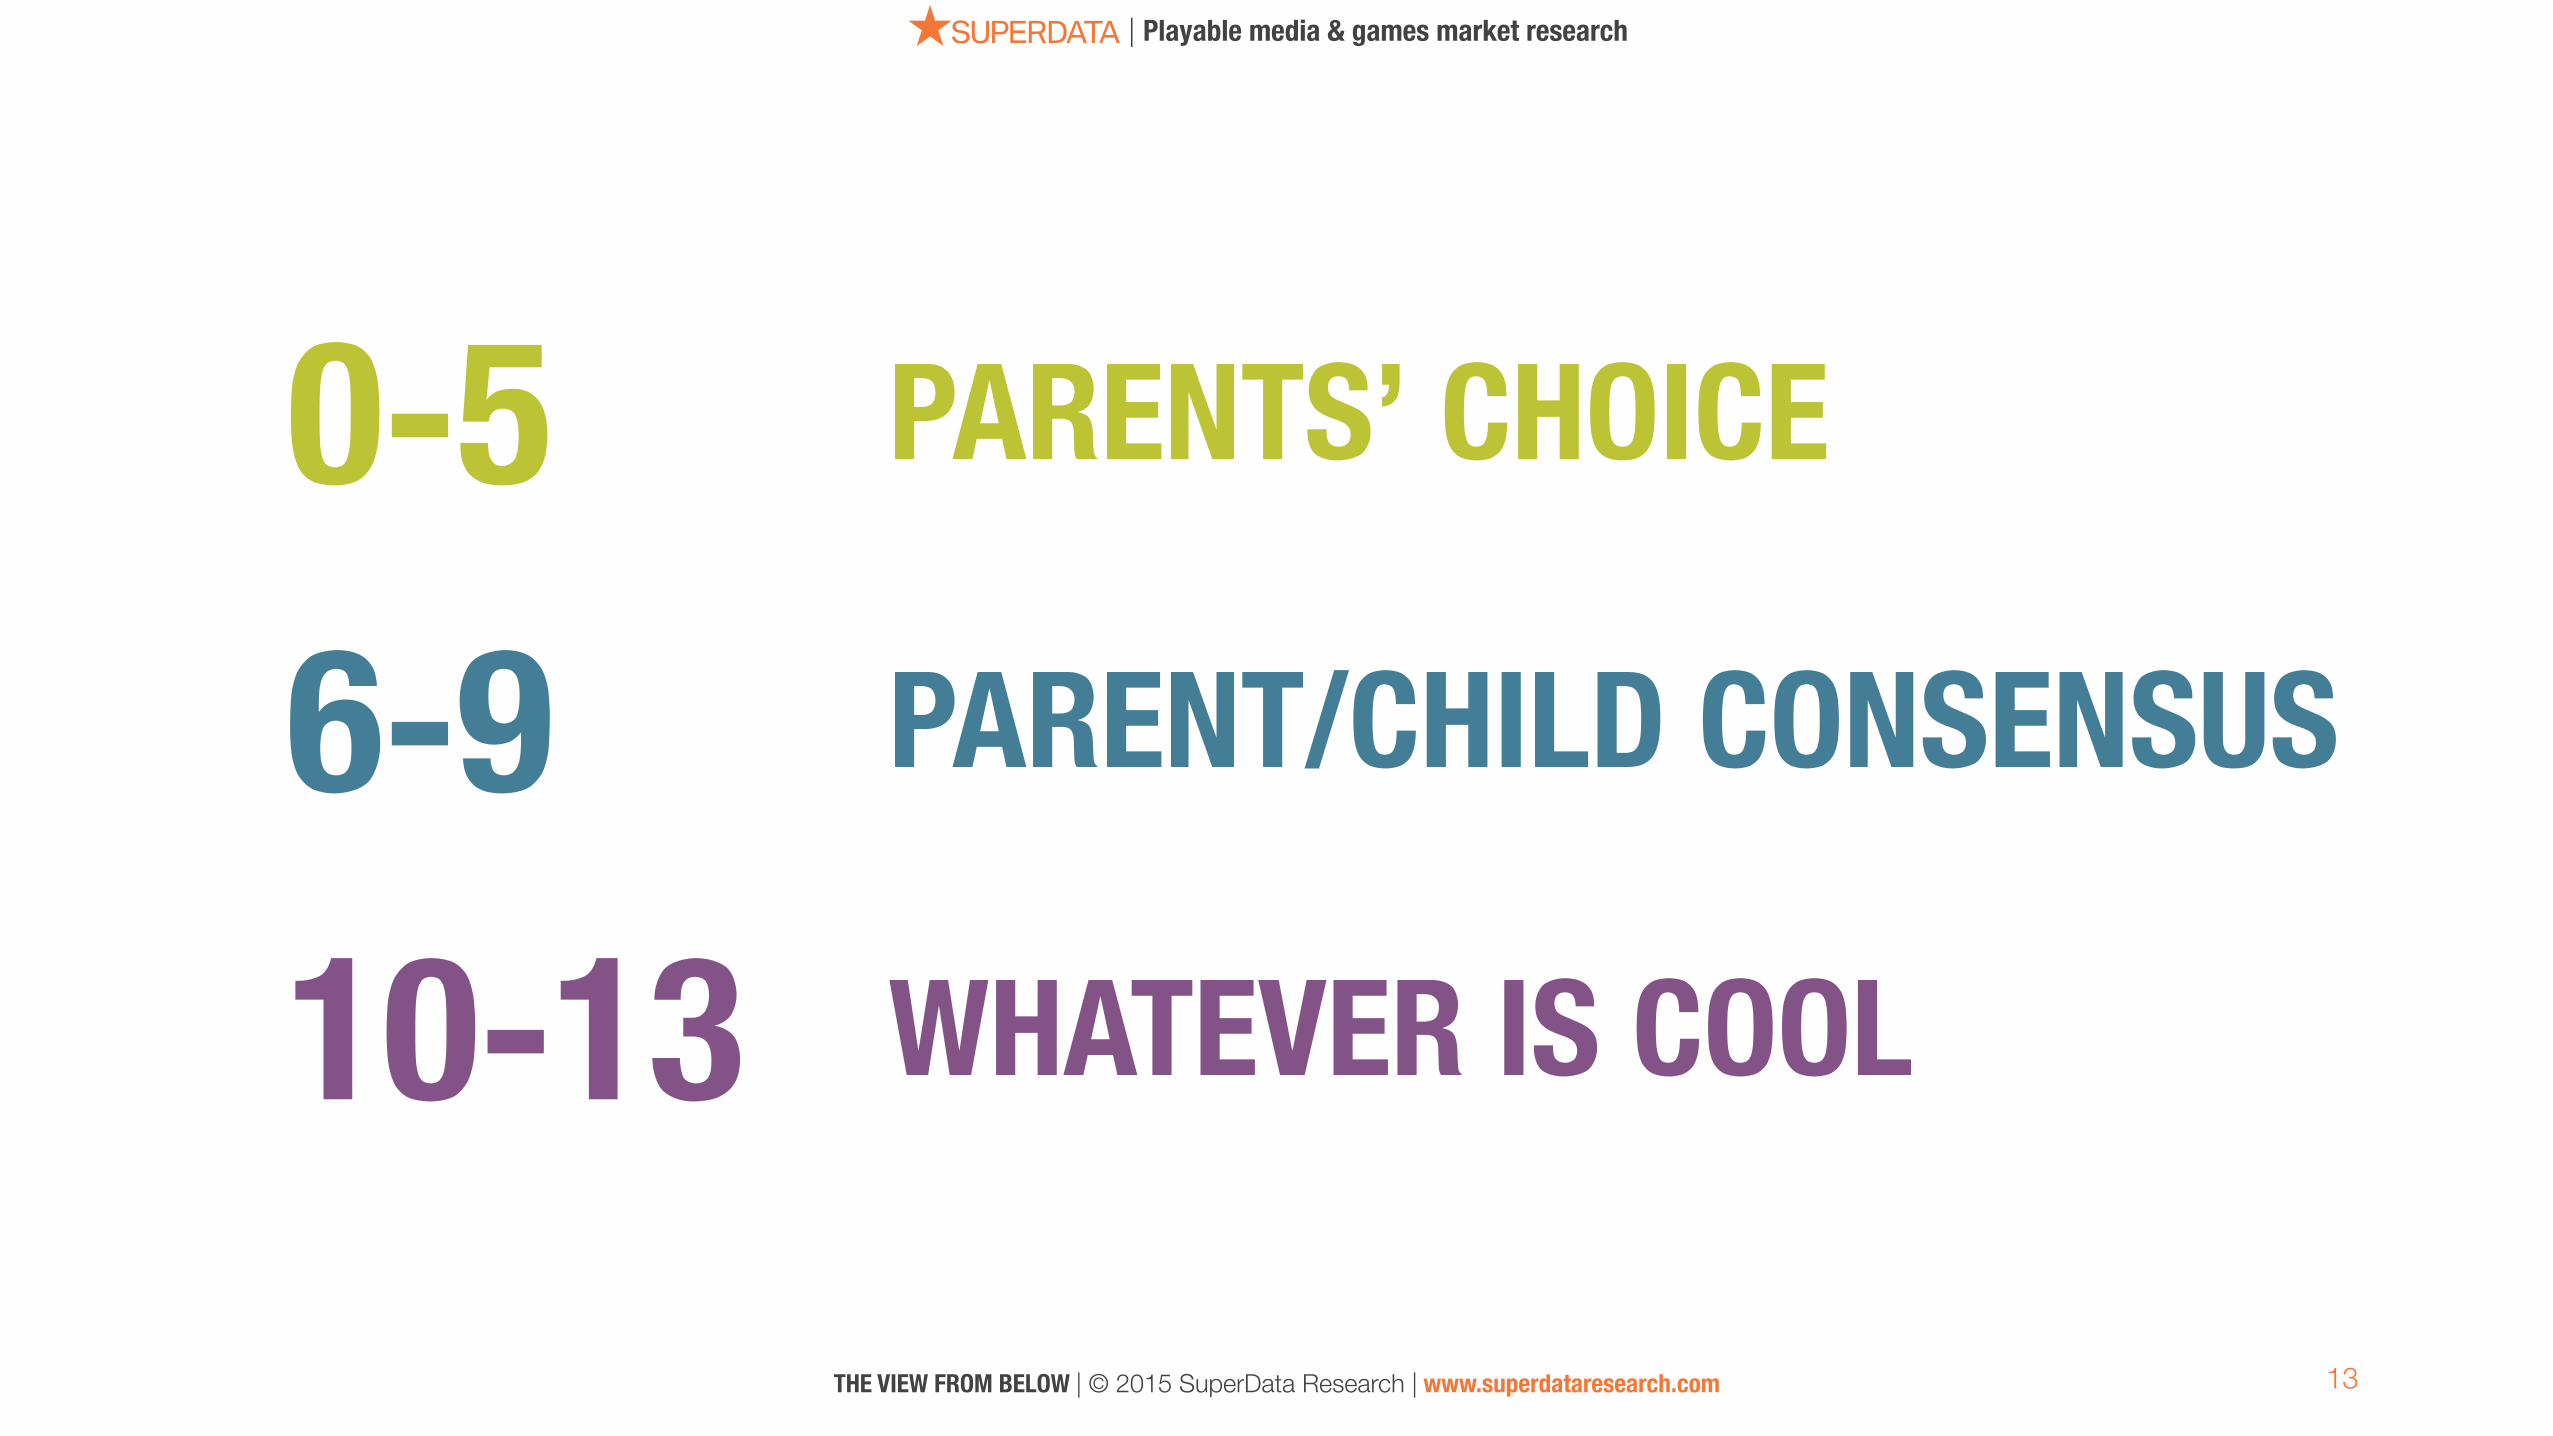
0-56-910-13
PARENTS’ CHOICE
PARENT/CHILD CONSENSUS
WHATEVER IS COOL
14
| Playable media & games market research
THE VIEW FROM BELOW | © 2015 SuperData Research | www.superdataresearch.com
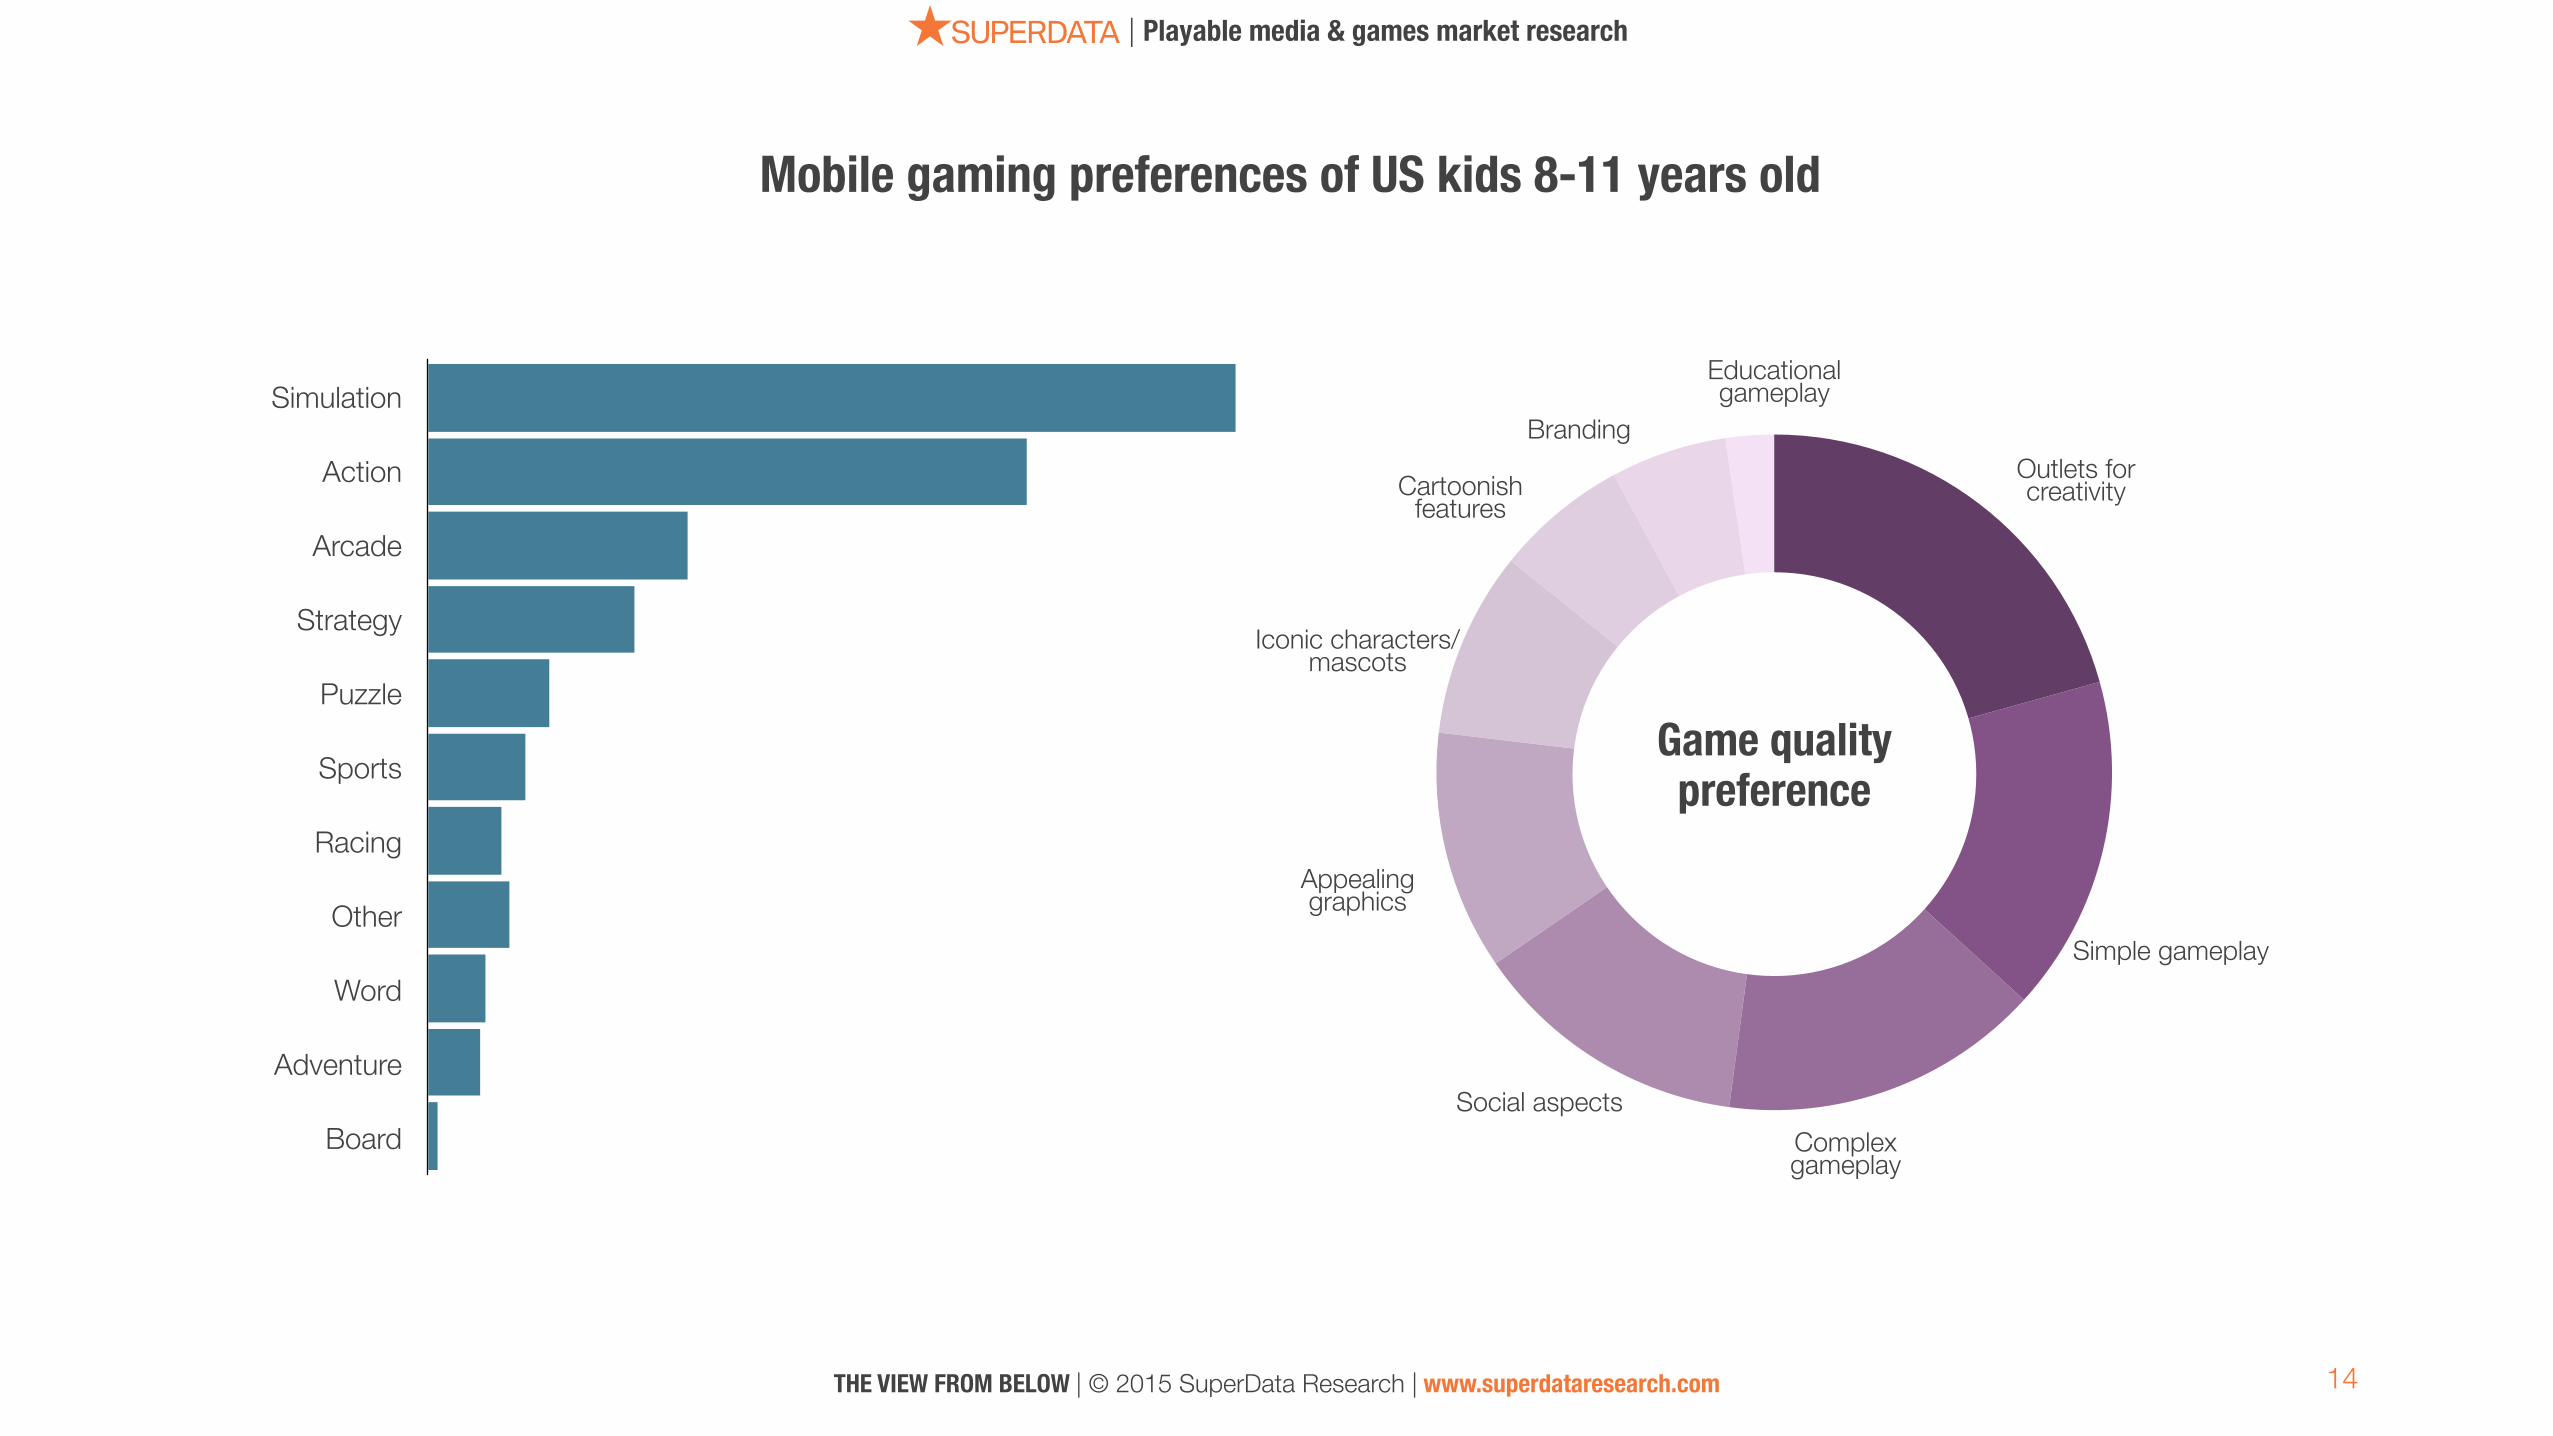
Outlets for creativity
Simple gameplay
Complex gameplay
Social aspects
Appealing graphics
Iconic characters/mascots
Cartoonish features
Branding
Educational gameplay
Game quality preference
Simulation
Action
Arcade
Strategy
Puzzle
Sports
Racing
Other
Word
Adventure
Board
Mobile gaming preferences of US kids 8-11 years old

15
| Playable media & games market research
US TRENDS
THE VIEW FROM BELOW | © 2015 SuperData Research | www.superdataresearch.com
16
| Playable media & games market research
THE VIEW FROM BELOW | © 2015 SuperData Research | www.superdataresearch.com
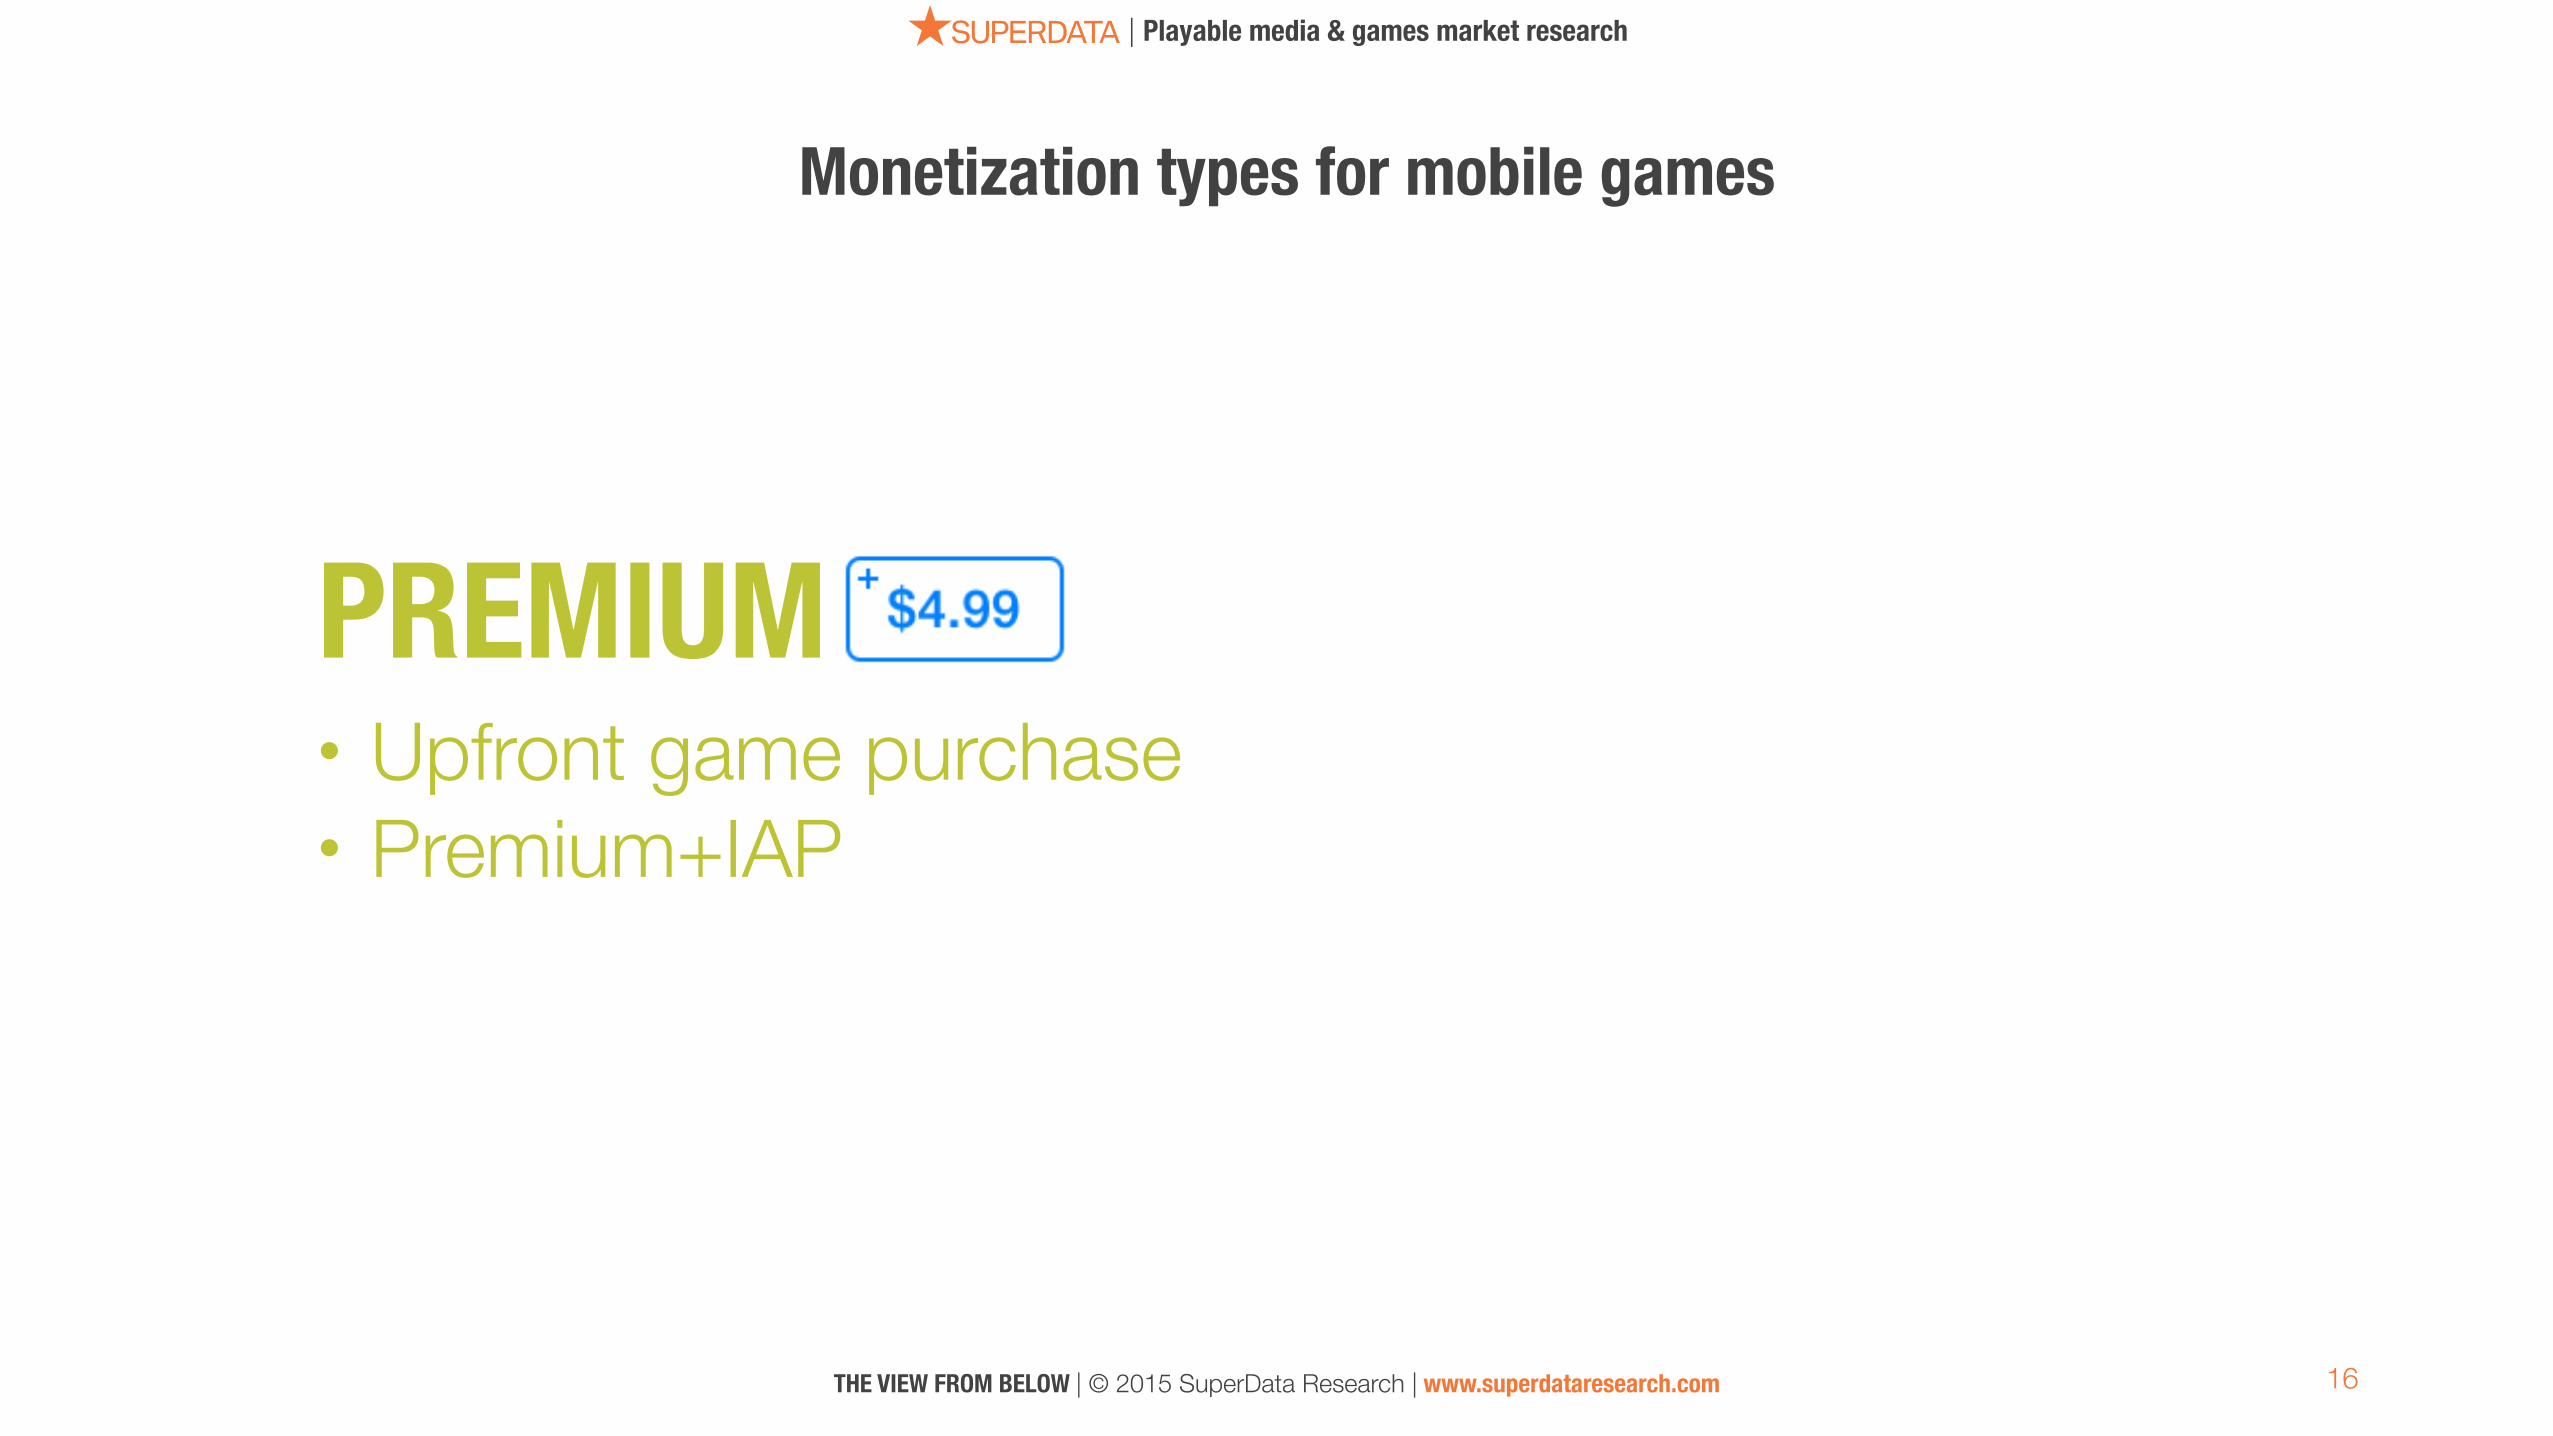
PREMIUM
Monetization types for mobile games
• Upfront game purchase • Premium+IAP
17
| Playable media & games market research
THE VIEW FROM BELOW | © 2015 SuperData Research | www.superdataresearch.com
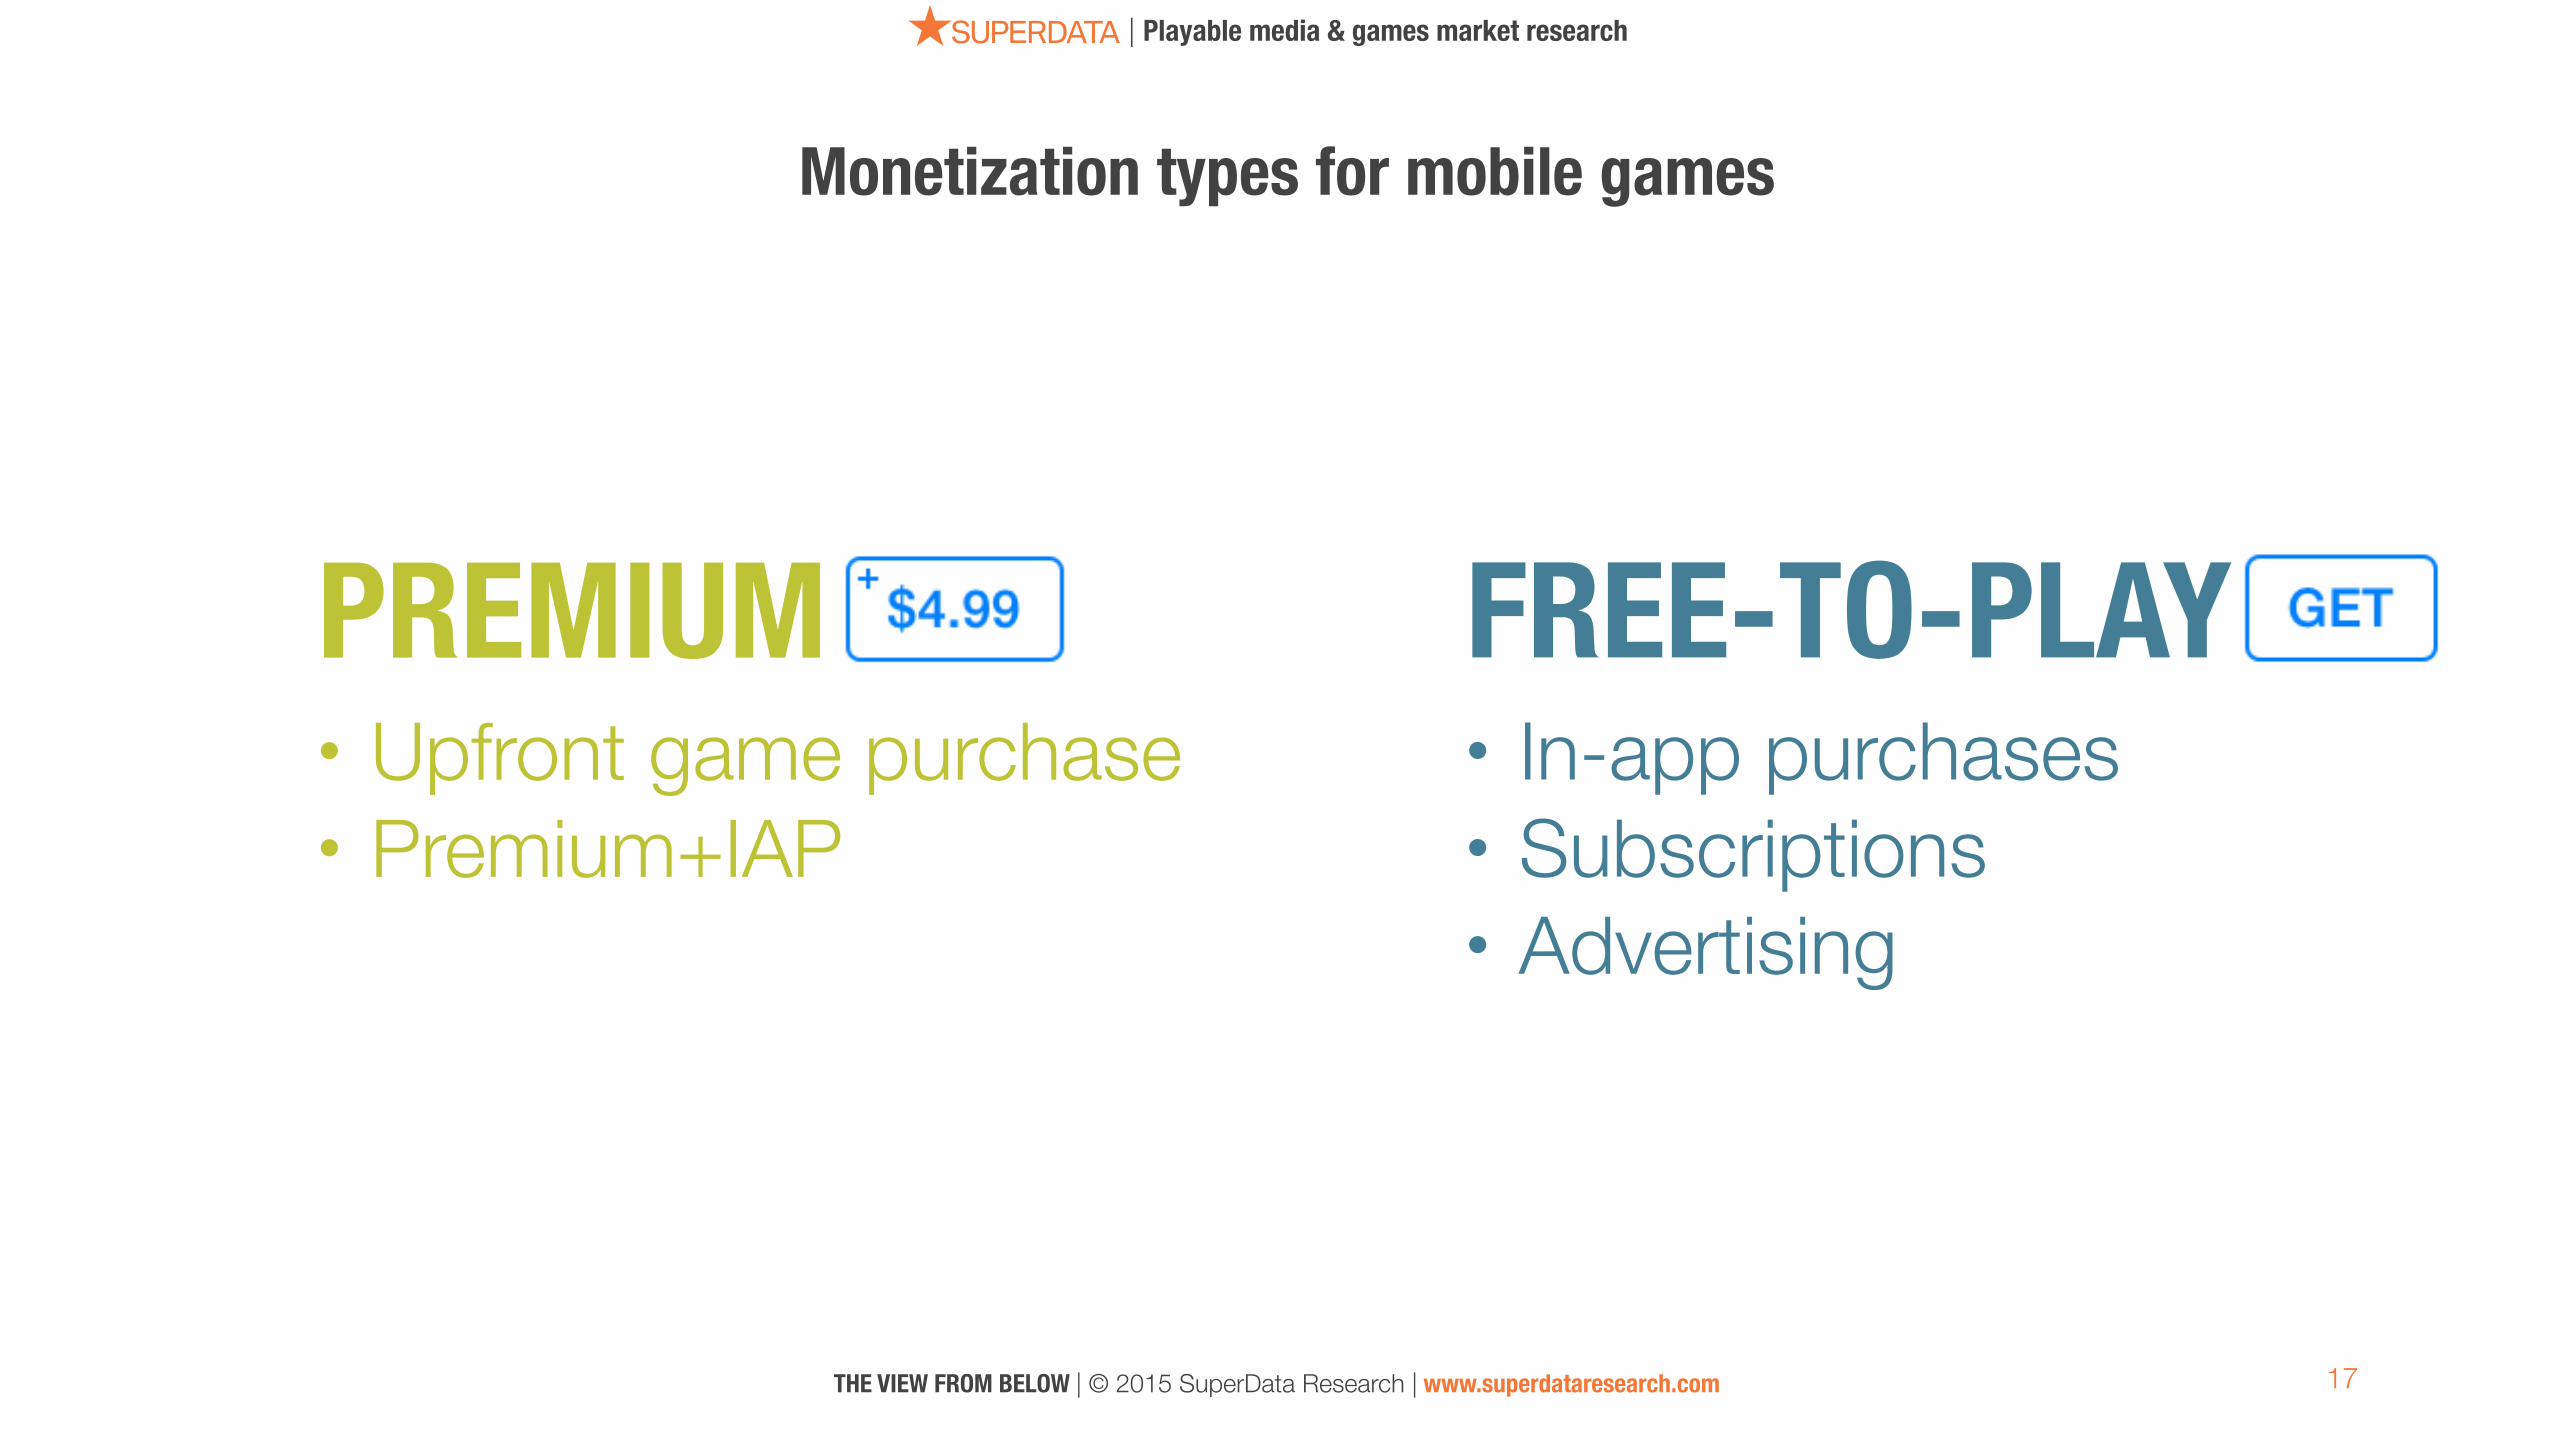
PREMIUM FREE-TO-PLAY
Monetization types for mobile games
• In-app purchases • Subscriptions • Advertising
• Upfront game purchase • Premium+IAP
18
| Playable media & games market research
THE VIEW FROM BELOW | © 2015 SuperData Research | www.superdataresearch.com
0
40
80
120
160
2014 2015E 2016E 2017E
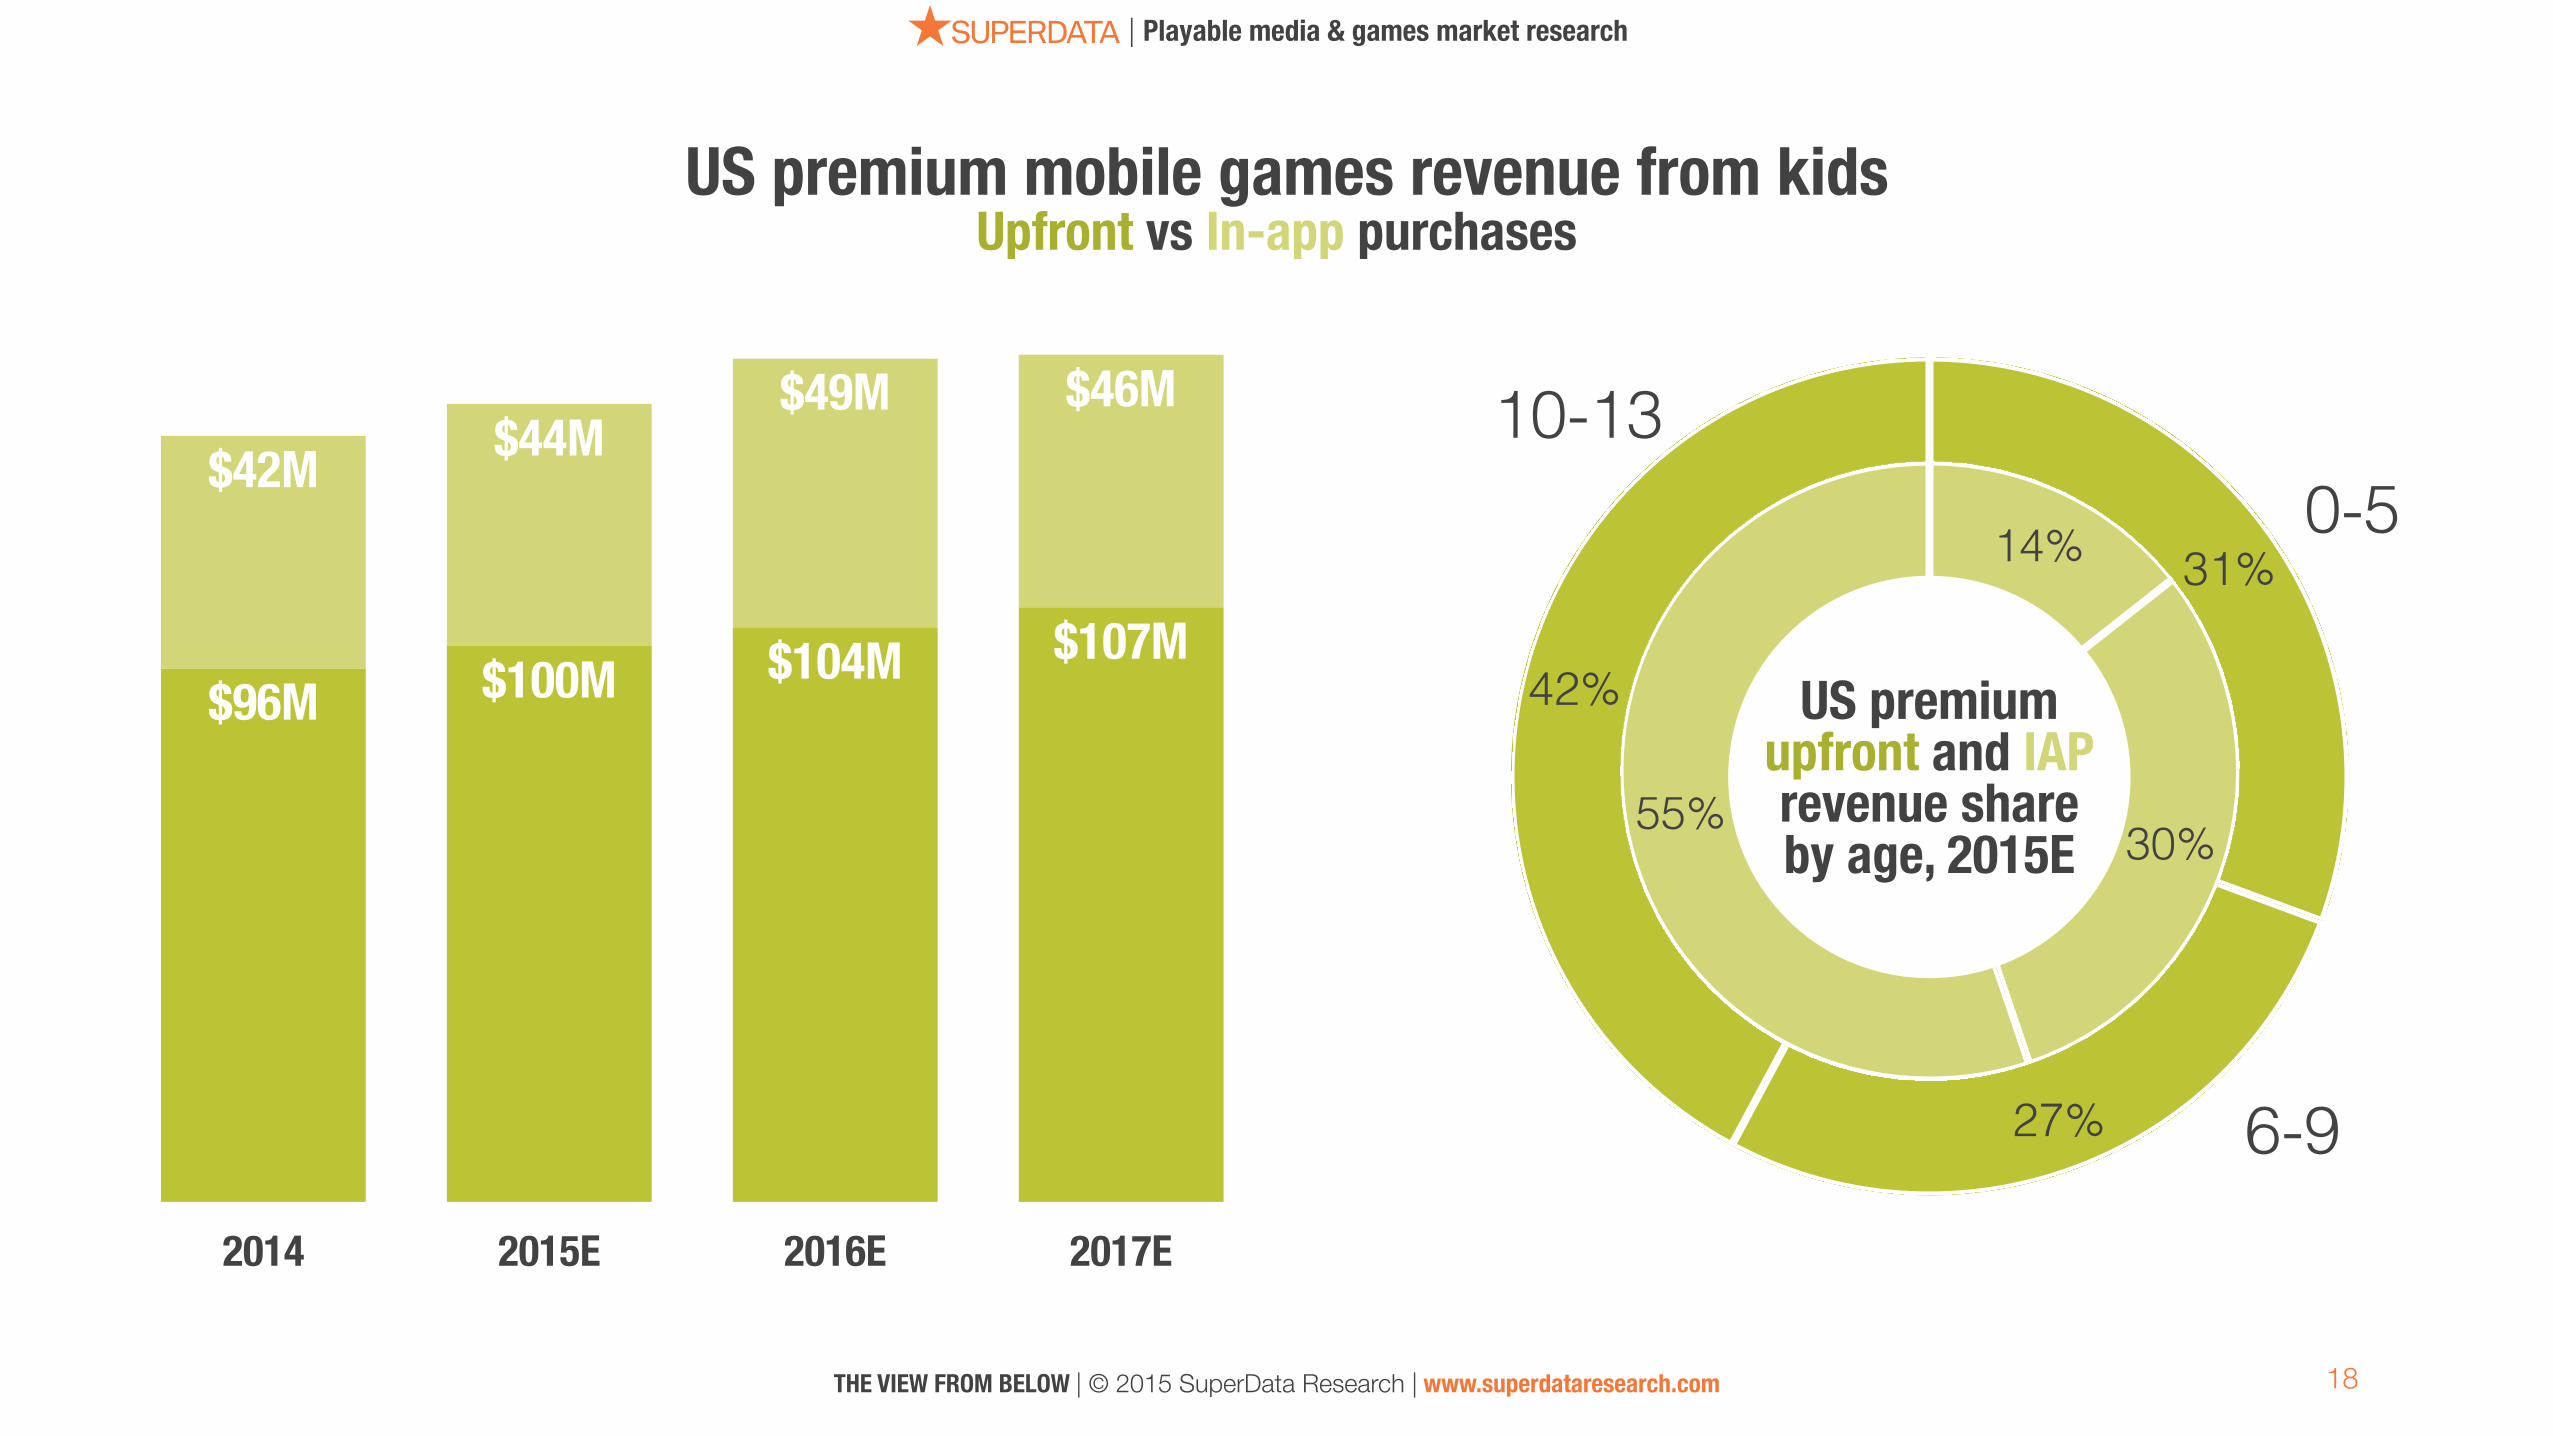
$46M$49M$44M$42M
$107M$104M$100M$96M 42%
27%
31%
55% 30%
14%
US premium upfront and IAP revenue share by age, 2015E
US premium mobile games revenue from kids
0-5
6-9
10-13
Upfront vs In-app purchases
19
| Playable media & games market research
THE VIEW FROM BELOW | © 2015 SuperData Research | www.superdataresearch.com
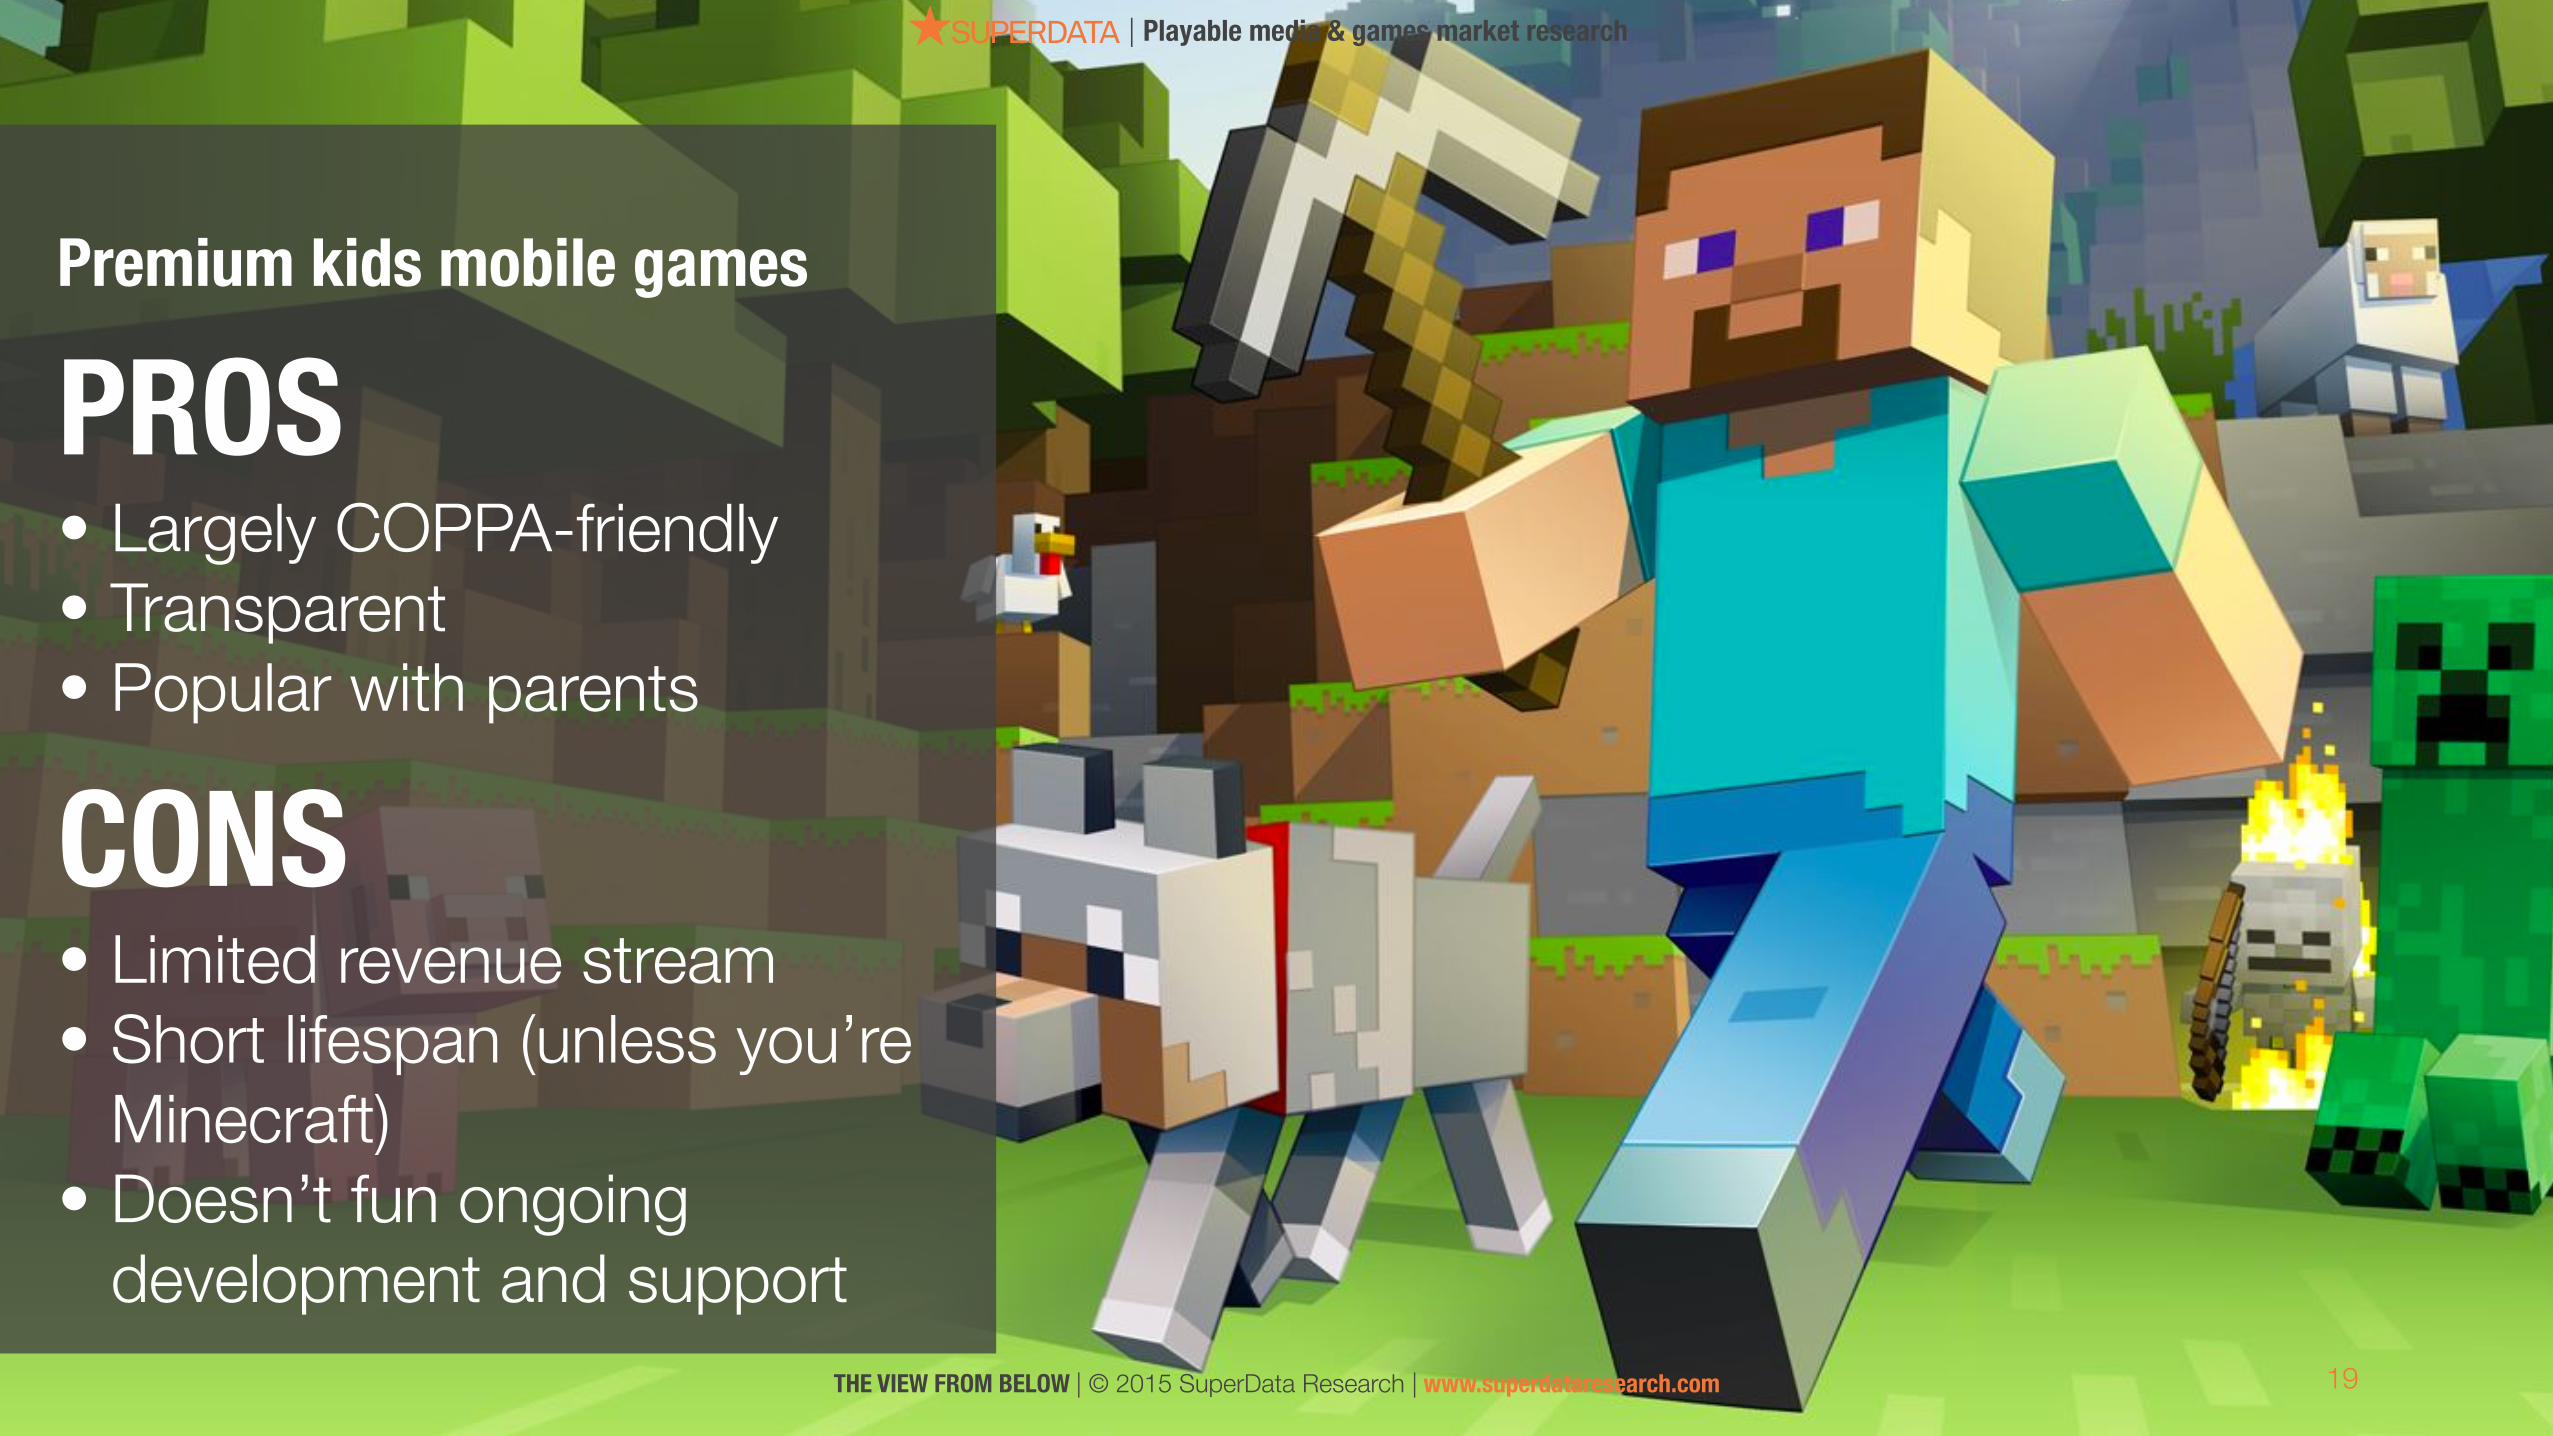
CONS • Limited revenue stream • Short lifespan (unless you’re
Minecraft) • Doesn’t fun ongoing
development and support
PROS • Largely COPPA-friendly • Transparent • Popular with parents
Premium kids mobile games
20
| Playable media & games market research
THE VIEW FROM BELOW | © 2015 SuperData Research | www.superdataresearch.com
0
100
200
300
400
2014 2015E 2016E 2017E
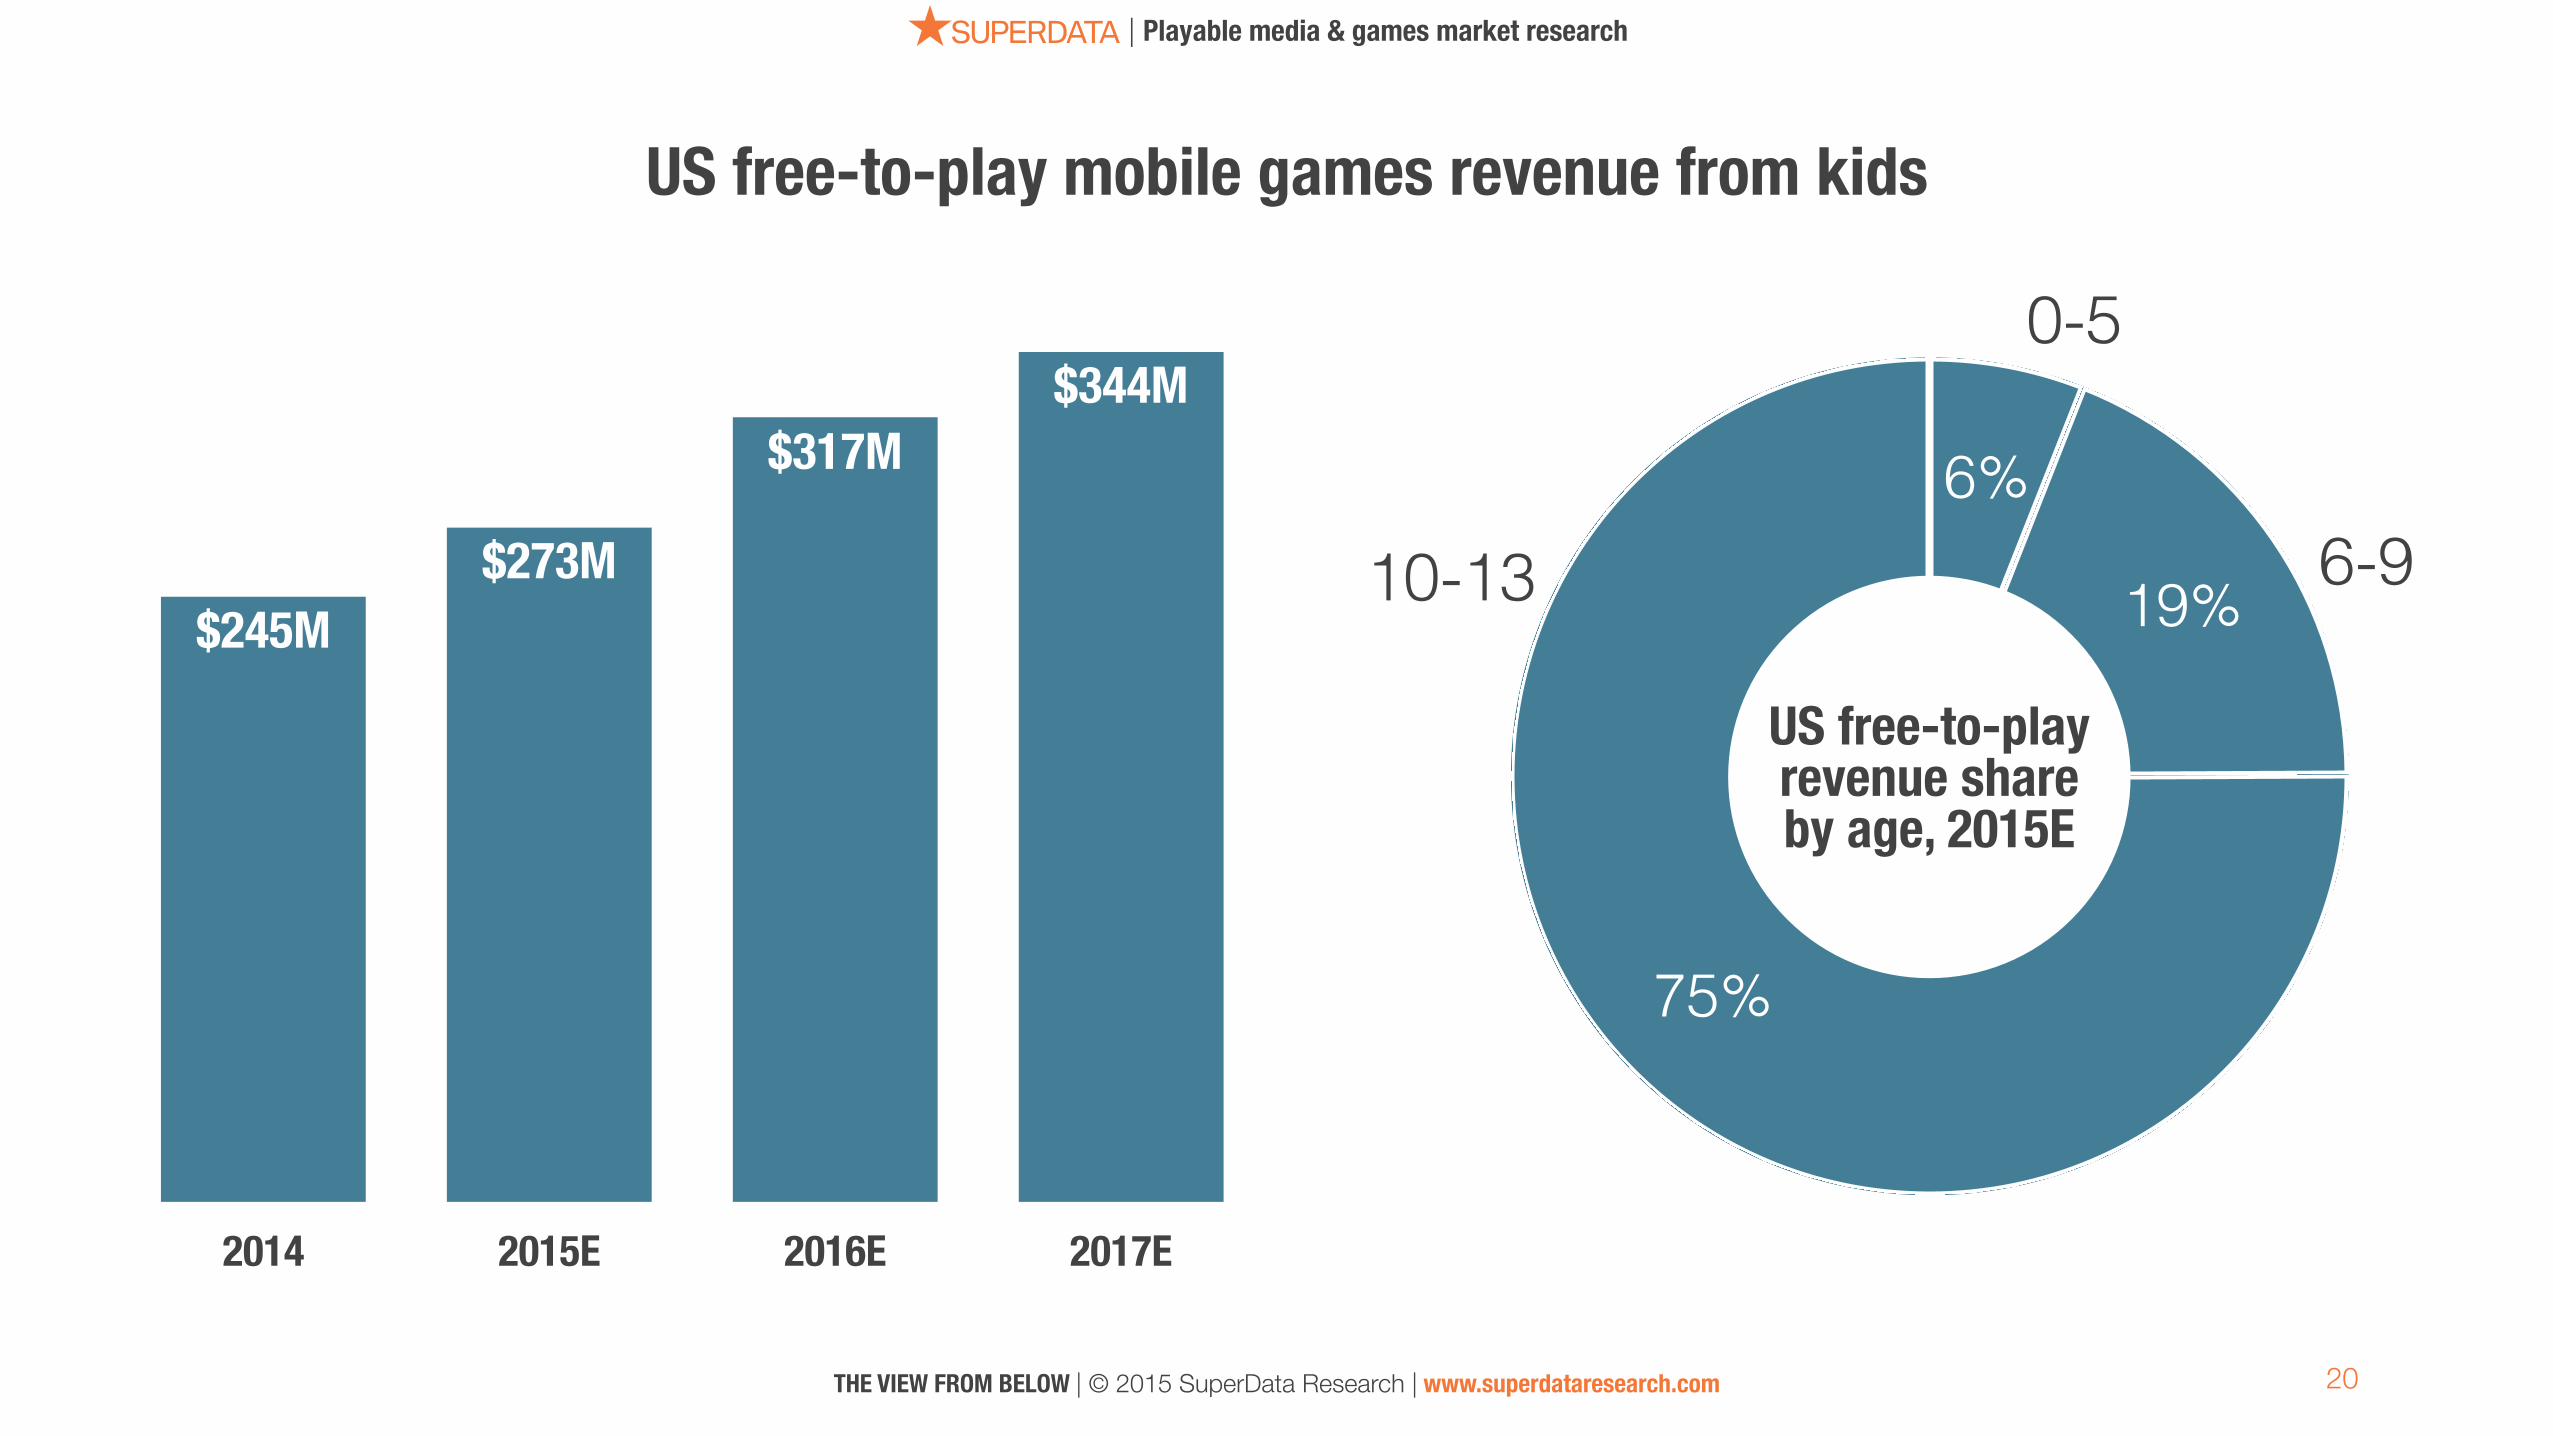
$344M$317M
$273M$245M
75%
19%
6%
US free-to-play revenue share by age, 2015E
US free-to-play mobile games revenue from kids
0-5
6-910-13

21
| Playable media & games market research
THE VIEW FROM BELOW | © 2015 SuperData Research | www.superdataresearch.com
CONTENT • Easier to follow regulations • Transparent • Hard to make money • Needs constant content
updates
CONSUMABLE • Highest potential for spending • Ethical gray area • Highly regulated • Competing with big studio
games
Free-to-play kids mobile gamesCONSUMABLE vs. CONTENT IAP
75%
19%
6%
22
| Playable media & games market research
THE VIEW FROM BELOW | © 2015 SuperData Research | www.superdataresearch.com
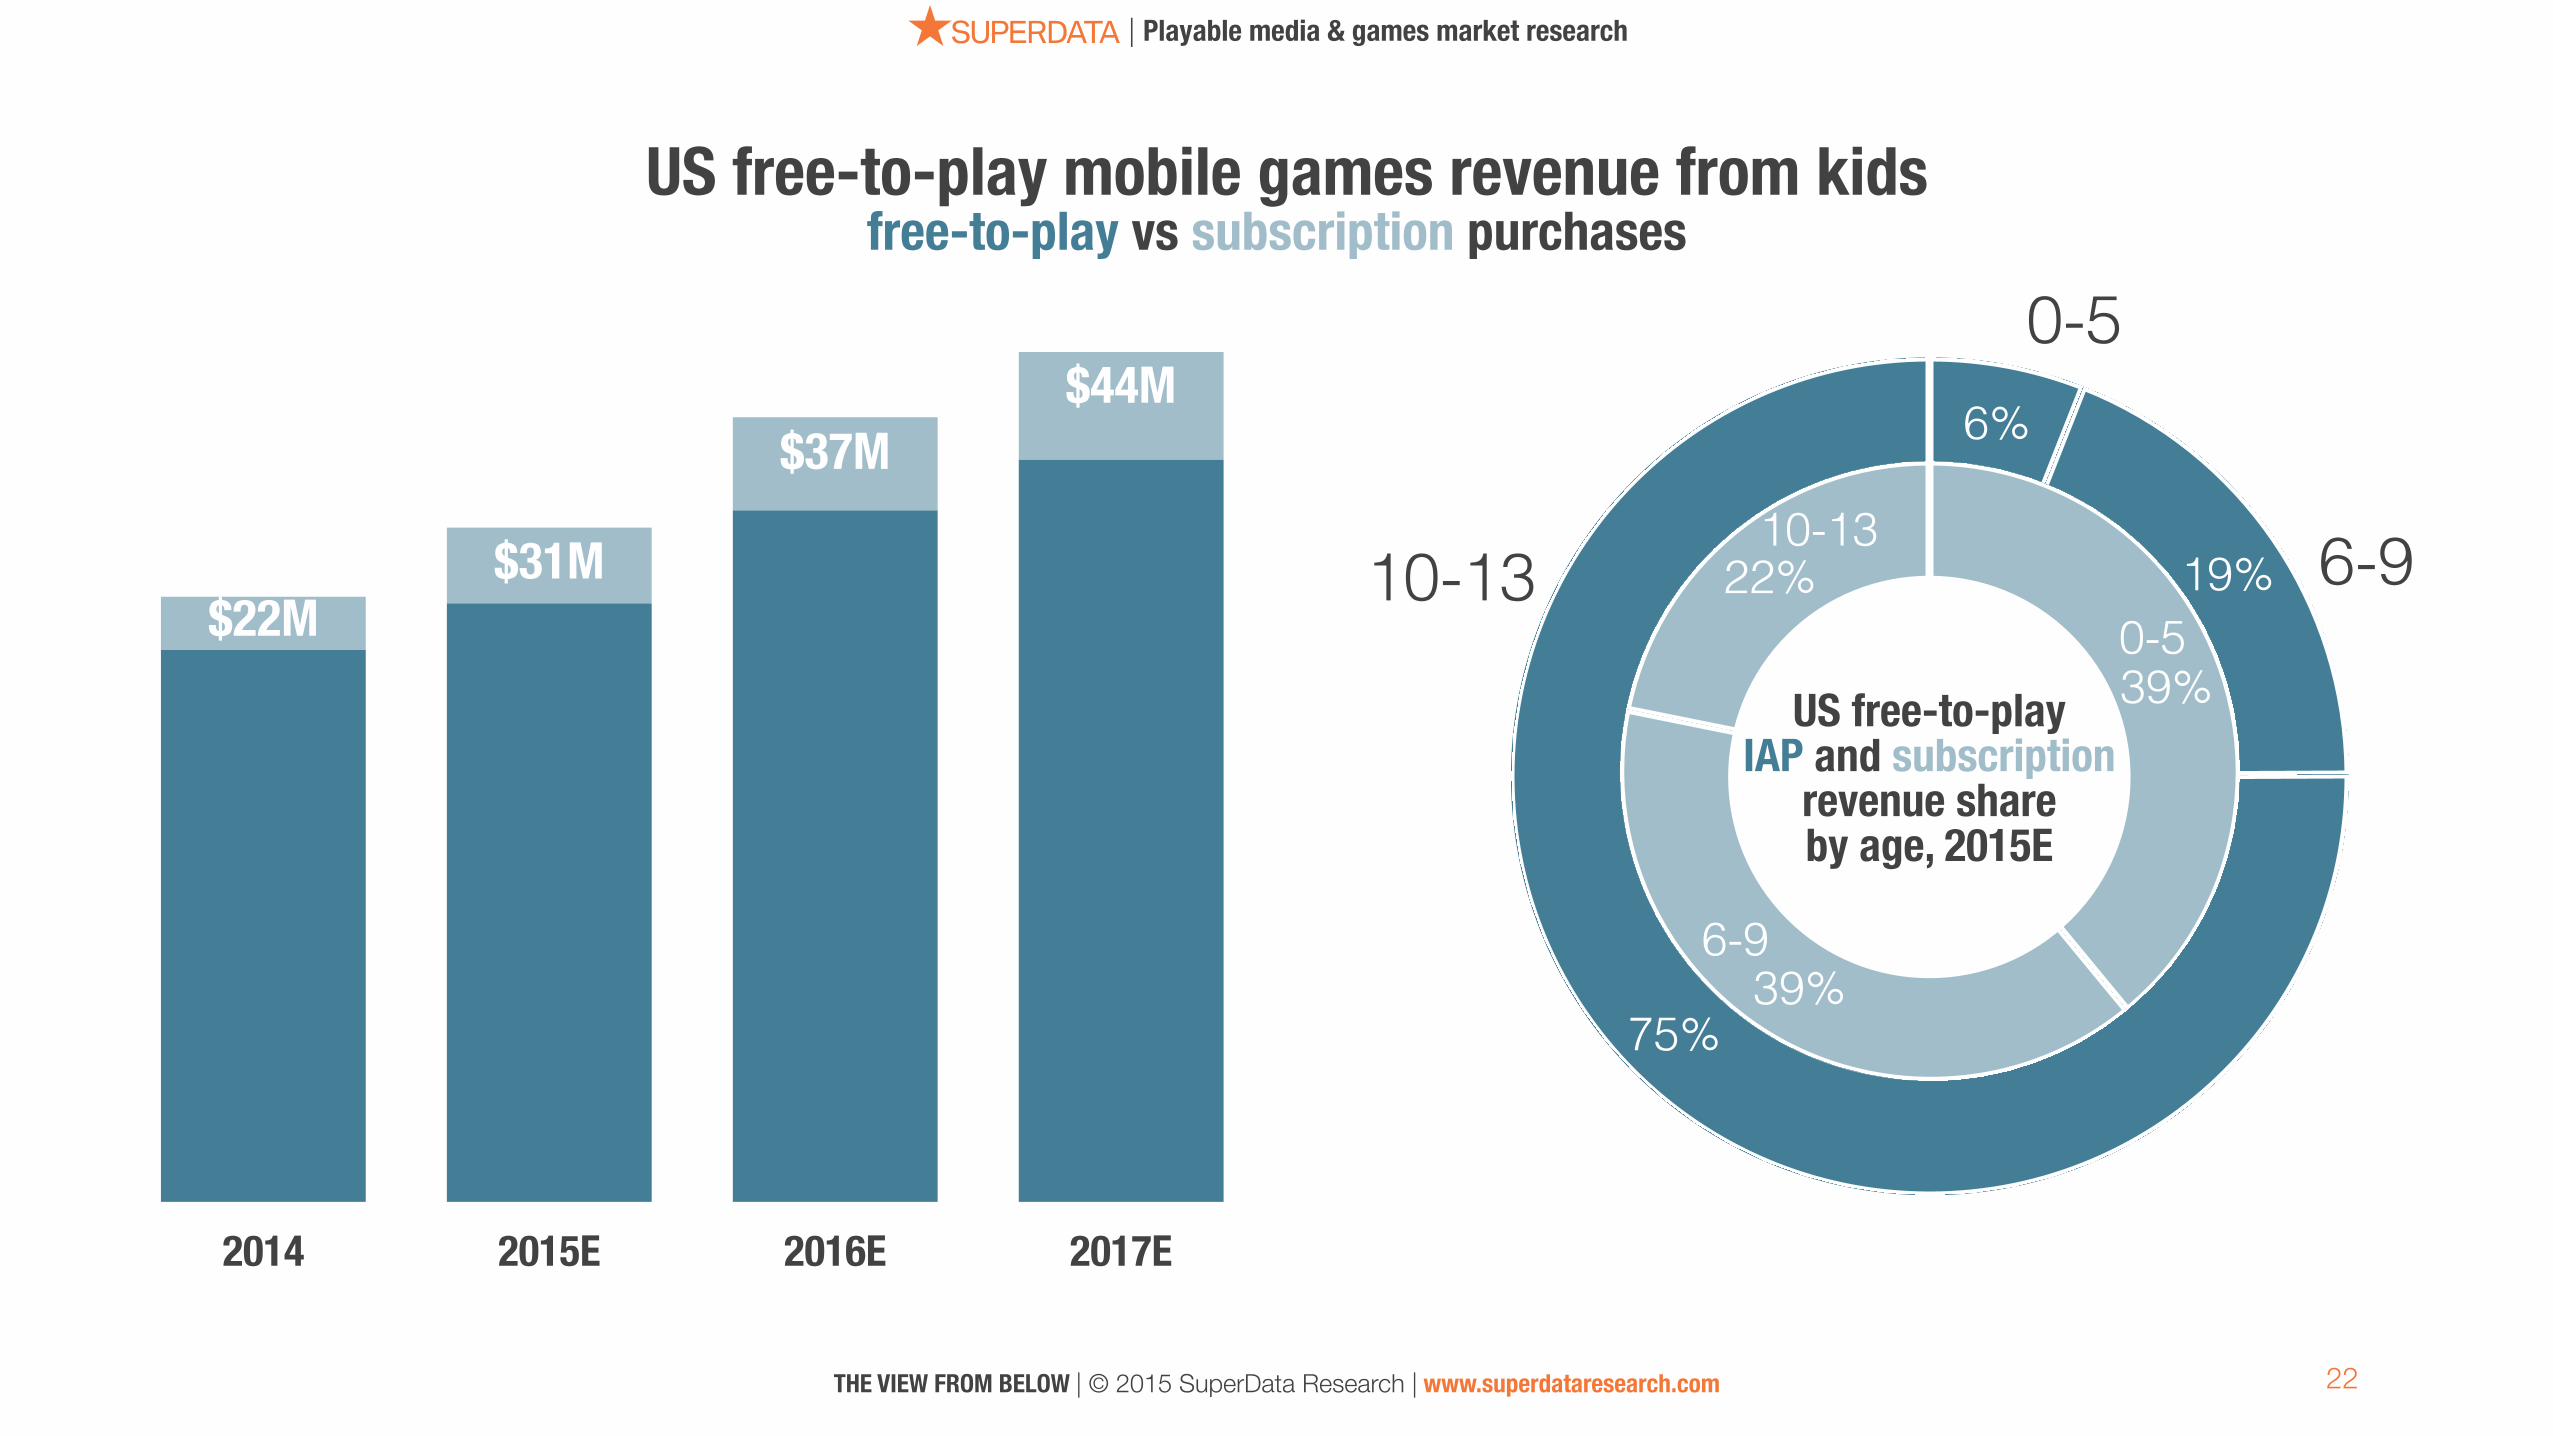
22%
39%
39%US free-to-play IAP and subscription
revenue share by age, 2015E
US free-to-play mobile games revenue from kids
0-5
6-910-13
0
100
200
300
400
2014 2015E 2016E 2017E
$44M$37M
$31M$22M
$300M$280M
$242M$223M
free-to-play vs subscription purchases
0-5
6-9
10-13
23
| Playable media & games market research
THE VIEW FROM BELOW | © 2015 SuperData Research | www.superdataresearch.com
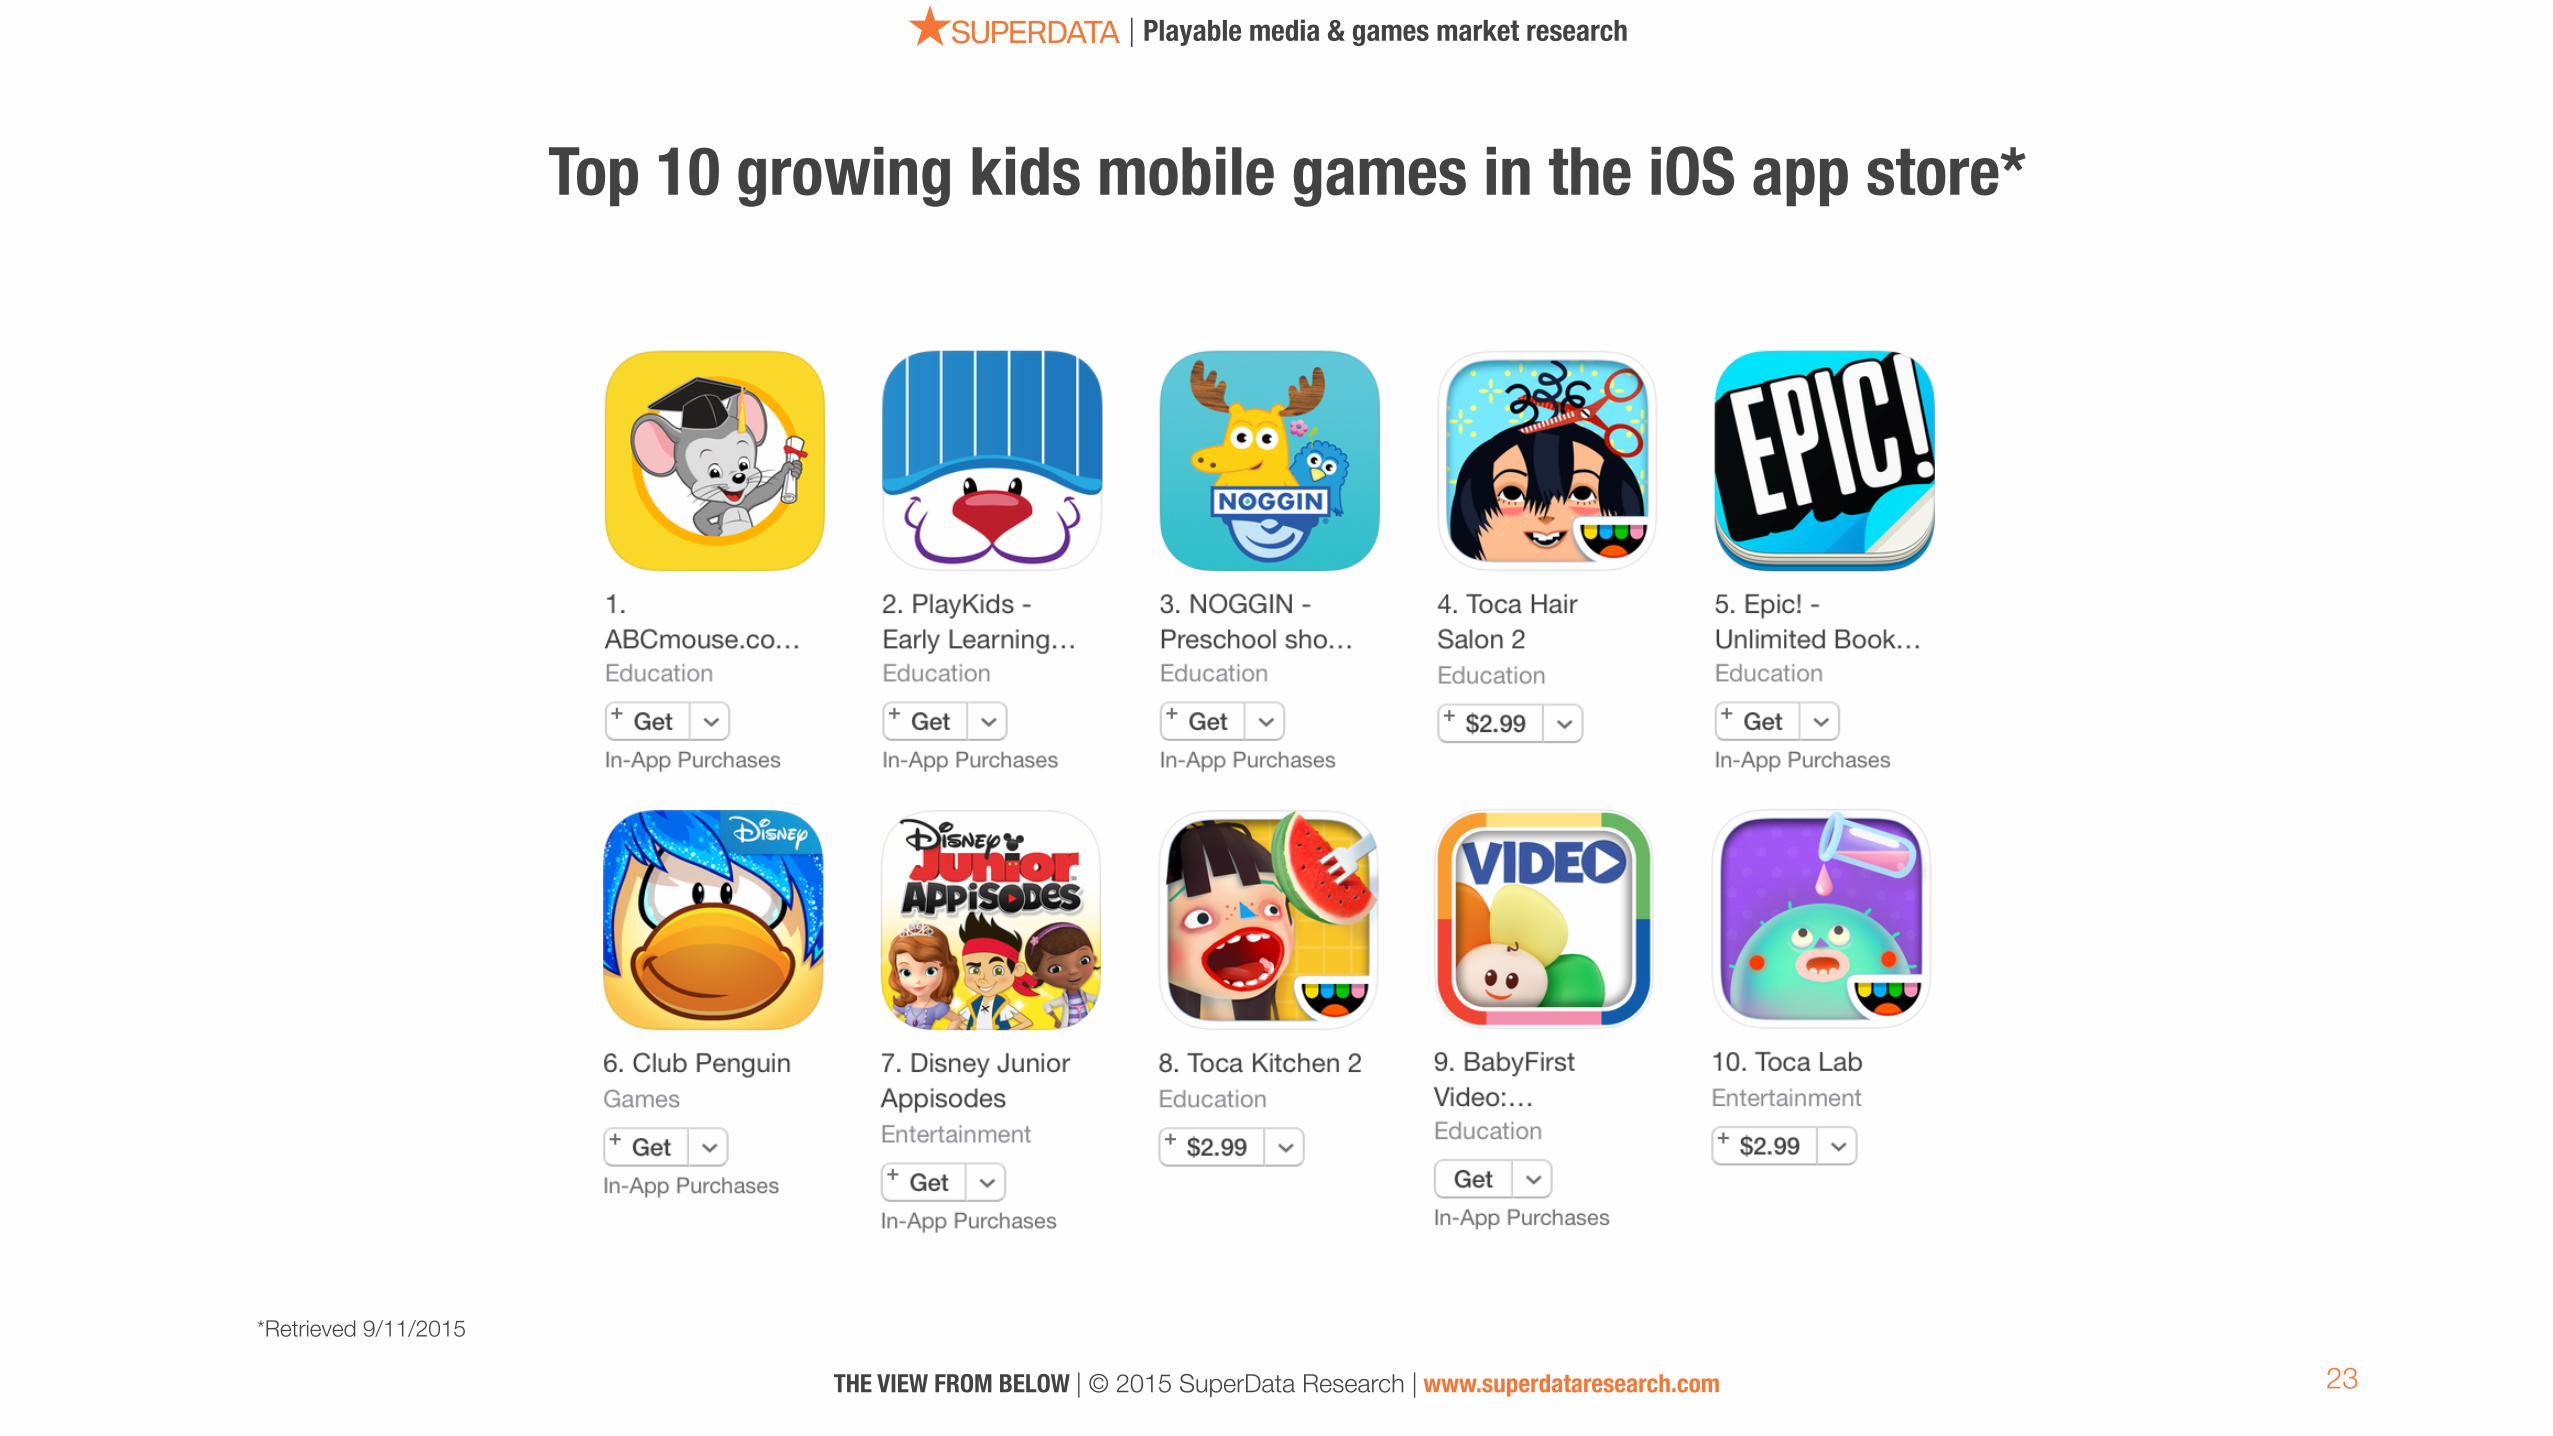
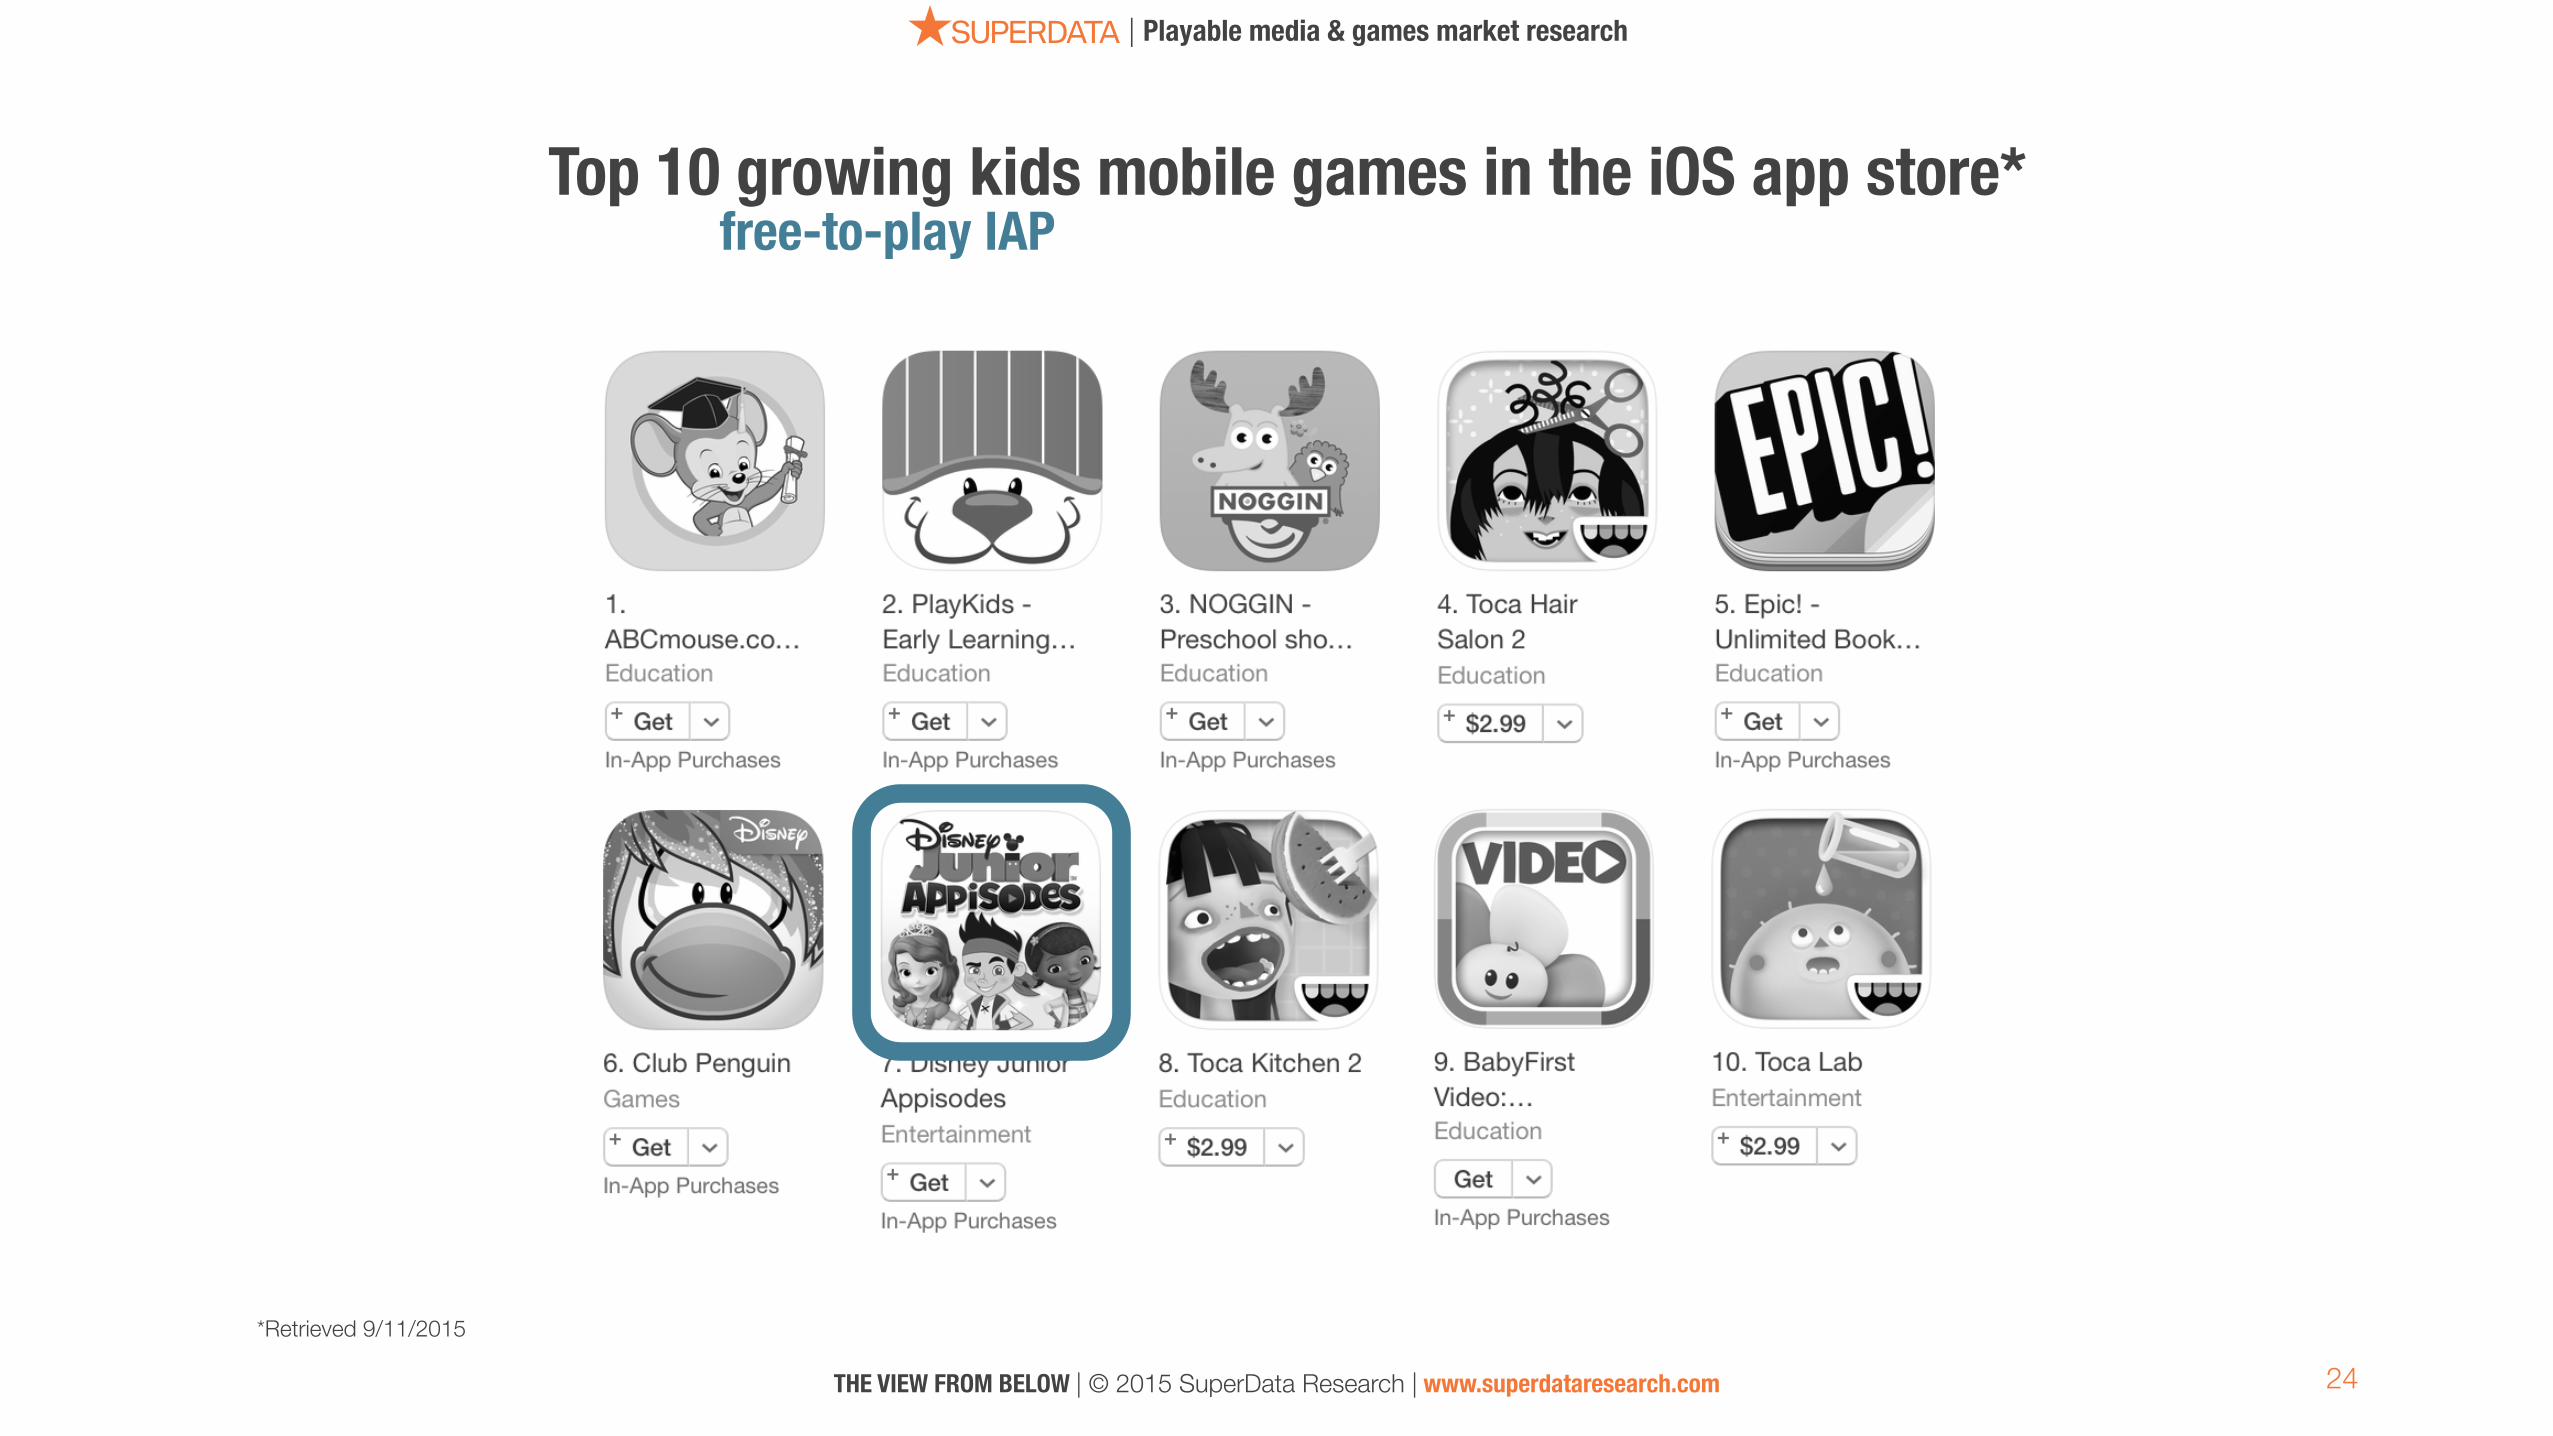
Top 10 growing kids mobile games in the iOS app store*
*Retrieved 9/11/2015
24
| Playable media & games market research
THE VIEW FROM BELOW | © 2015 SuperData Research | www.superdataresearch.com
Top 10 growing kids mobile games in the iOS app store*
*Retrieved 9/11/2015
free-to-play IAP
25
| Playable media & games market research
THE VIEW FROM BELOW | © 2015 SuperData Research | www.superdataresearch.com
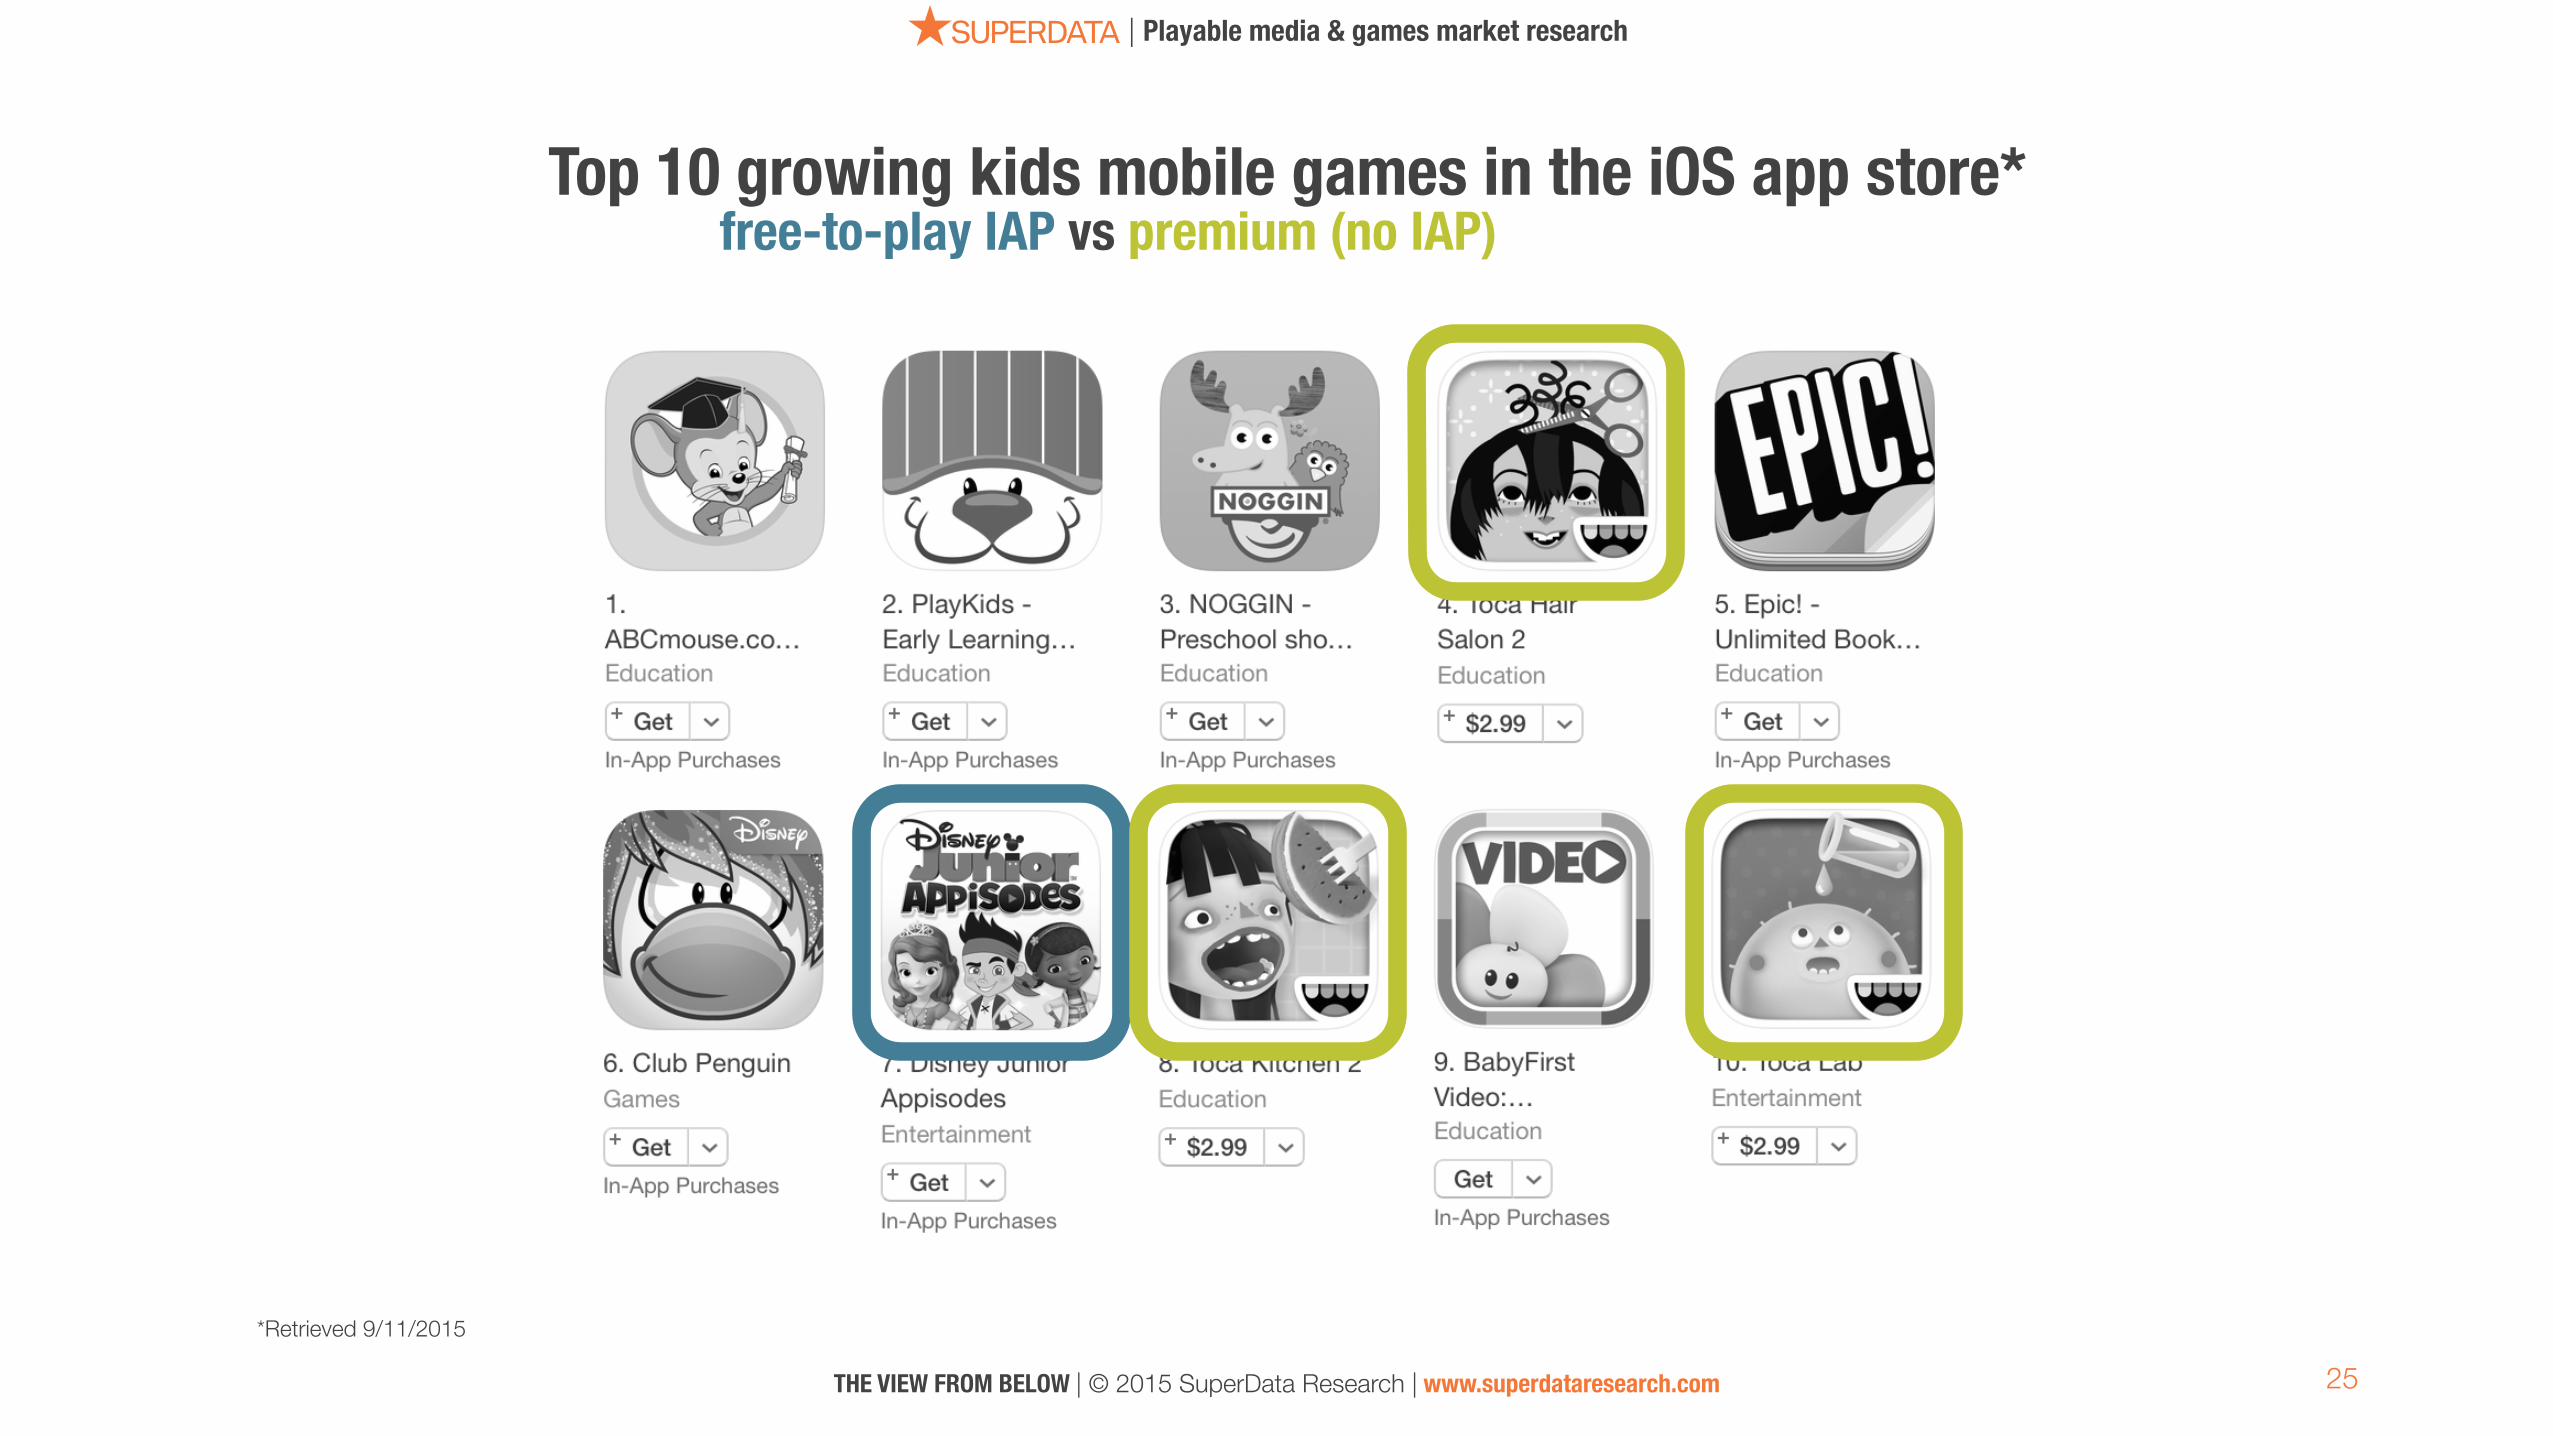
Top 10 growing kids mobile games in the iOS app store*
*Retrieved 9/11/2015
free-to-play IAP vs premium (no IAP)
26
| Playable media & games market research
THE VIEW FROM BELOW | © 2015 SuperData Research | www.superdataresearch.com
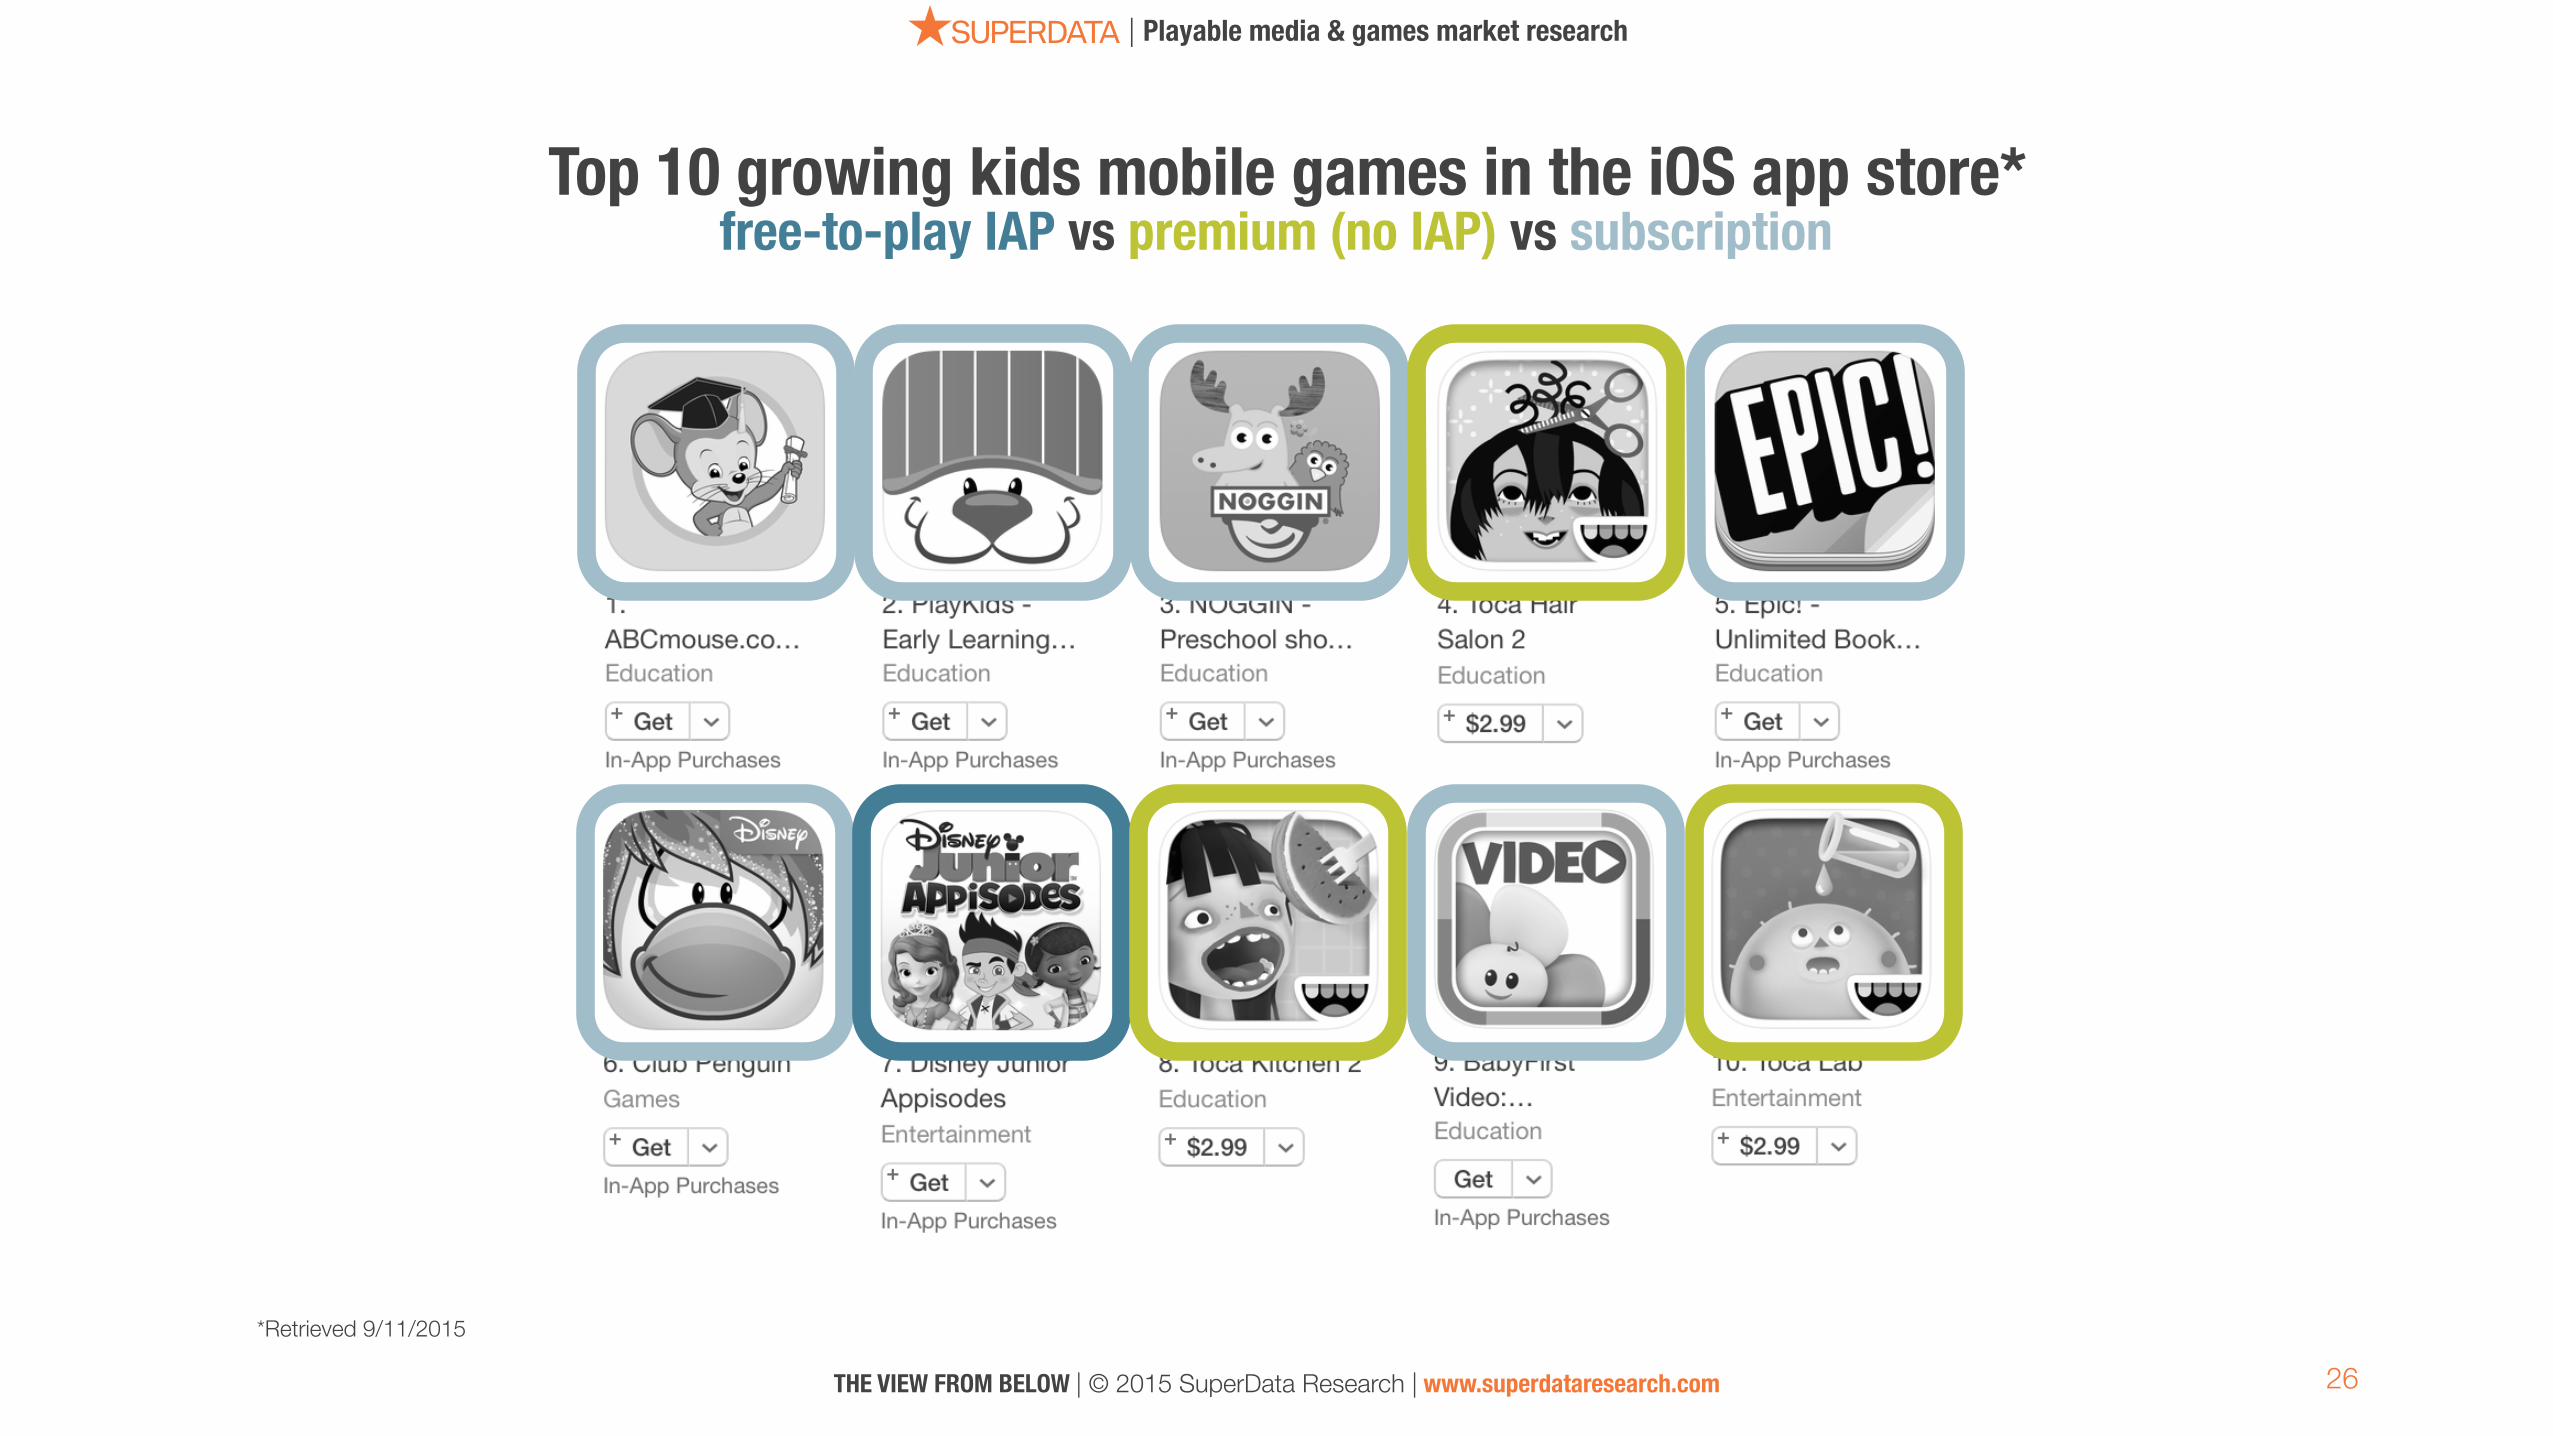
Top 10 growing kids mobile games in the iOS app store*
*Retrieved 9/11/2015
free-to-play IAP vs premium (no IAP) vs subscription
27
| Playable media & games market research
THE VIEW FROM BELOW | © 2015 SuperData Research | www.superdataresearch.com
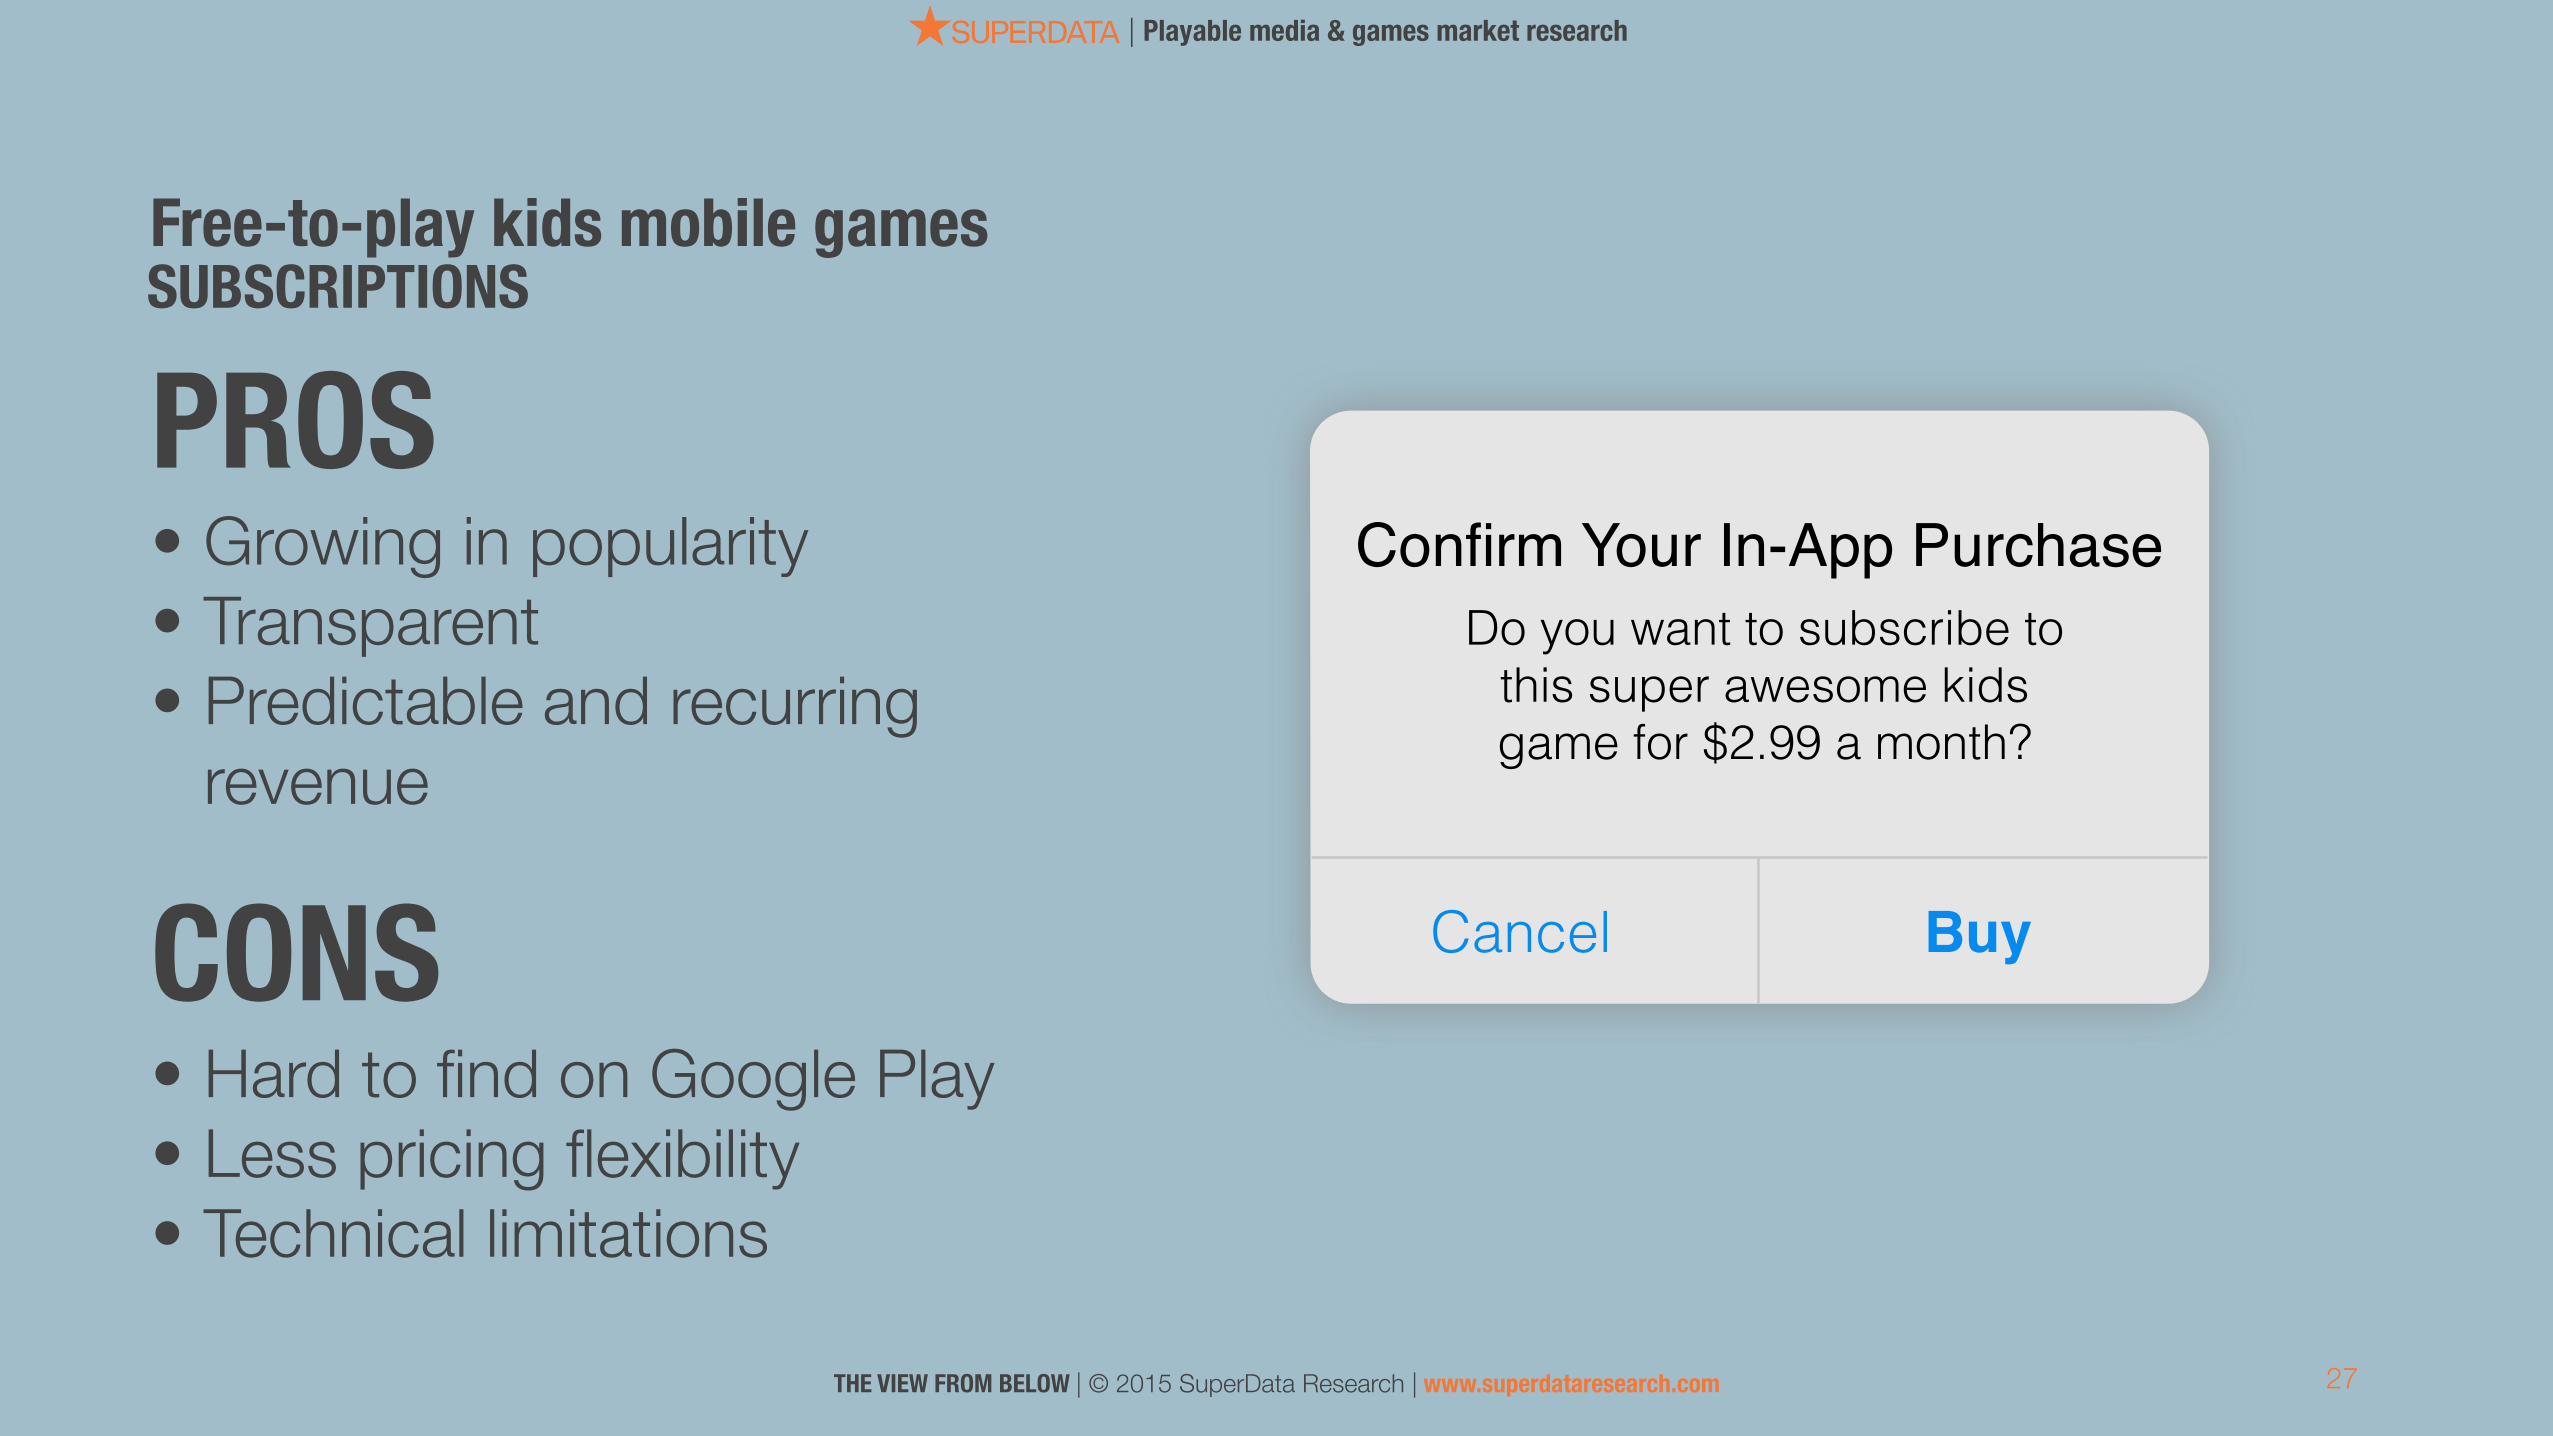
Free-to-play kids mobile gamesSUBSCRIPTIONS
CONS • Hard to find on Google Play • Less pricing flexibility • Technical limitations
PROS • Growing in popularity • Transparent • Predictable and recurring
revenue
Confirm Your In-App PurchaseDo you want to subscribe to
this super awesome kids game for $2.99 a month?
Cancel Buy

| Playable media & games market research
28
OUTLOOK
THE VIEW FROM BELOW | © 2015 SuperData Research | www.superdataresearch.com
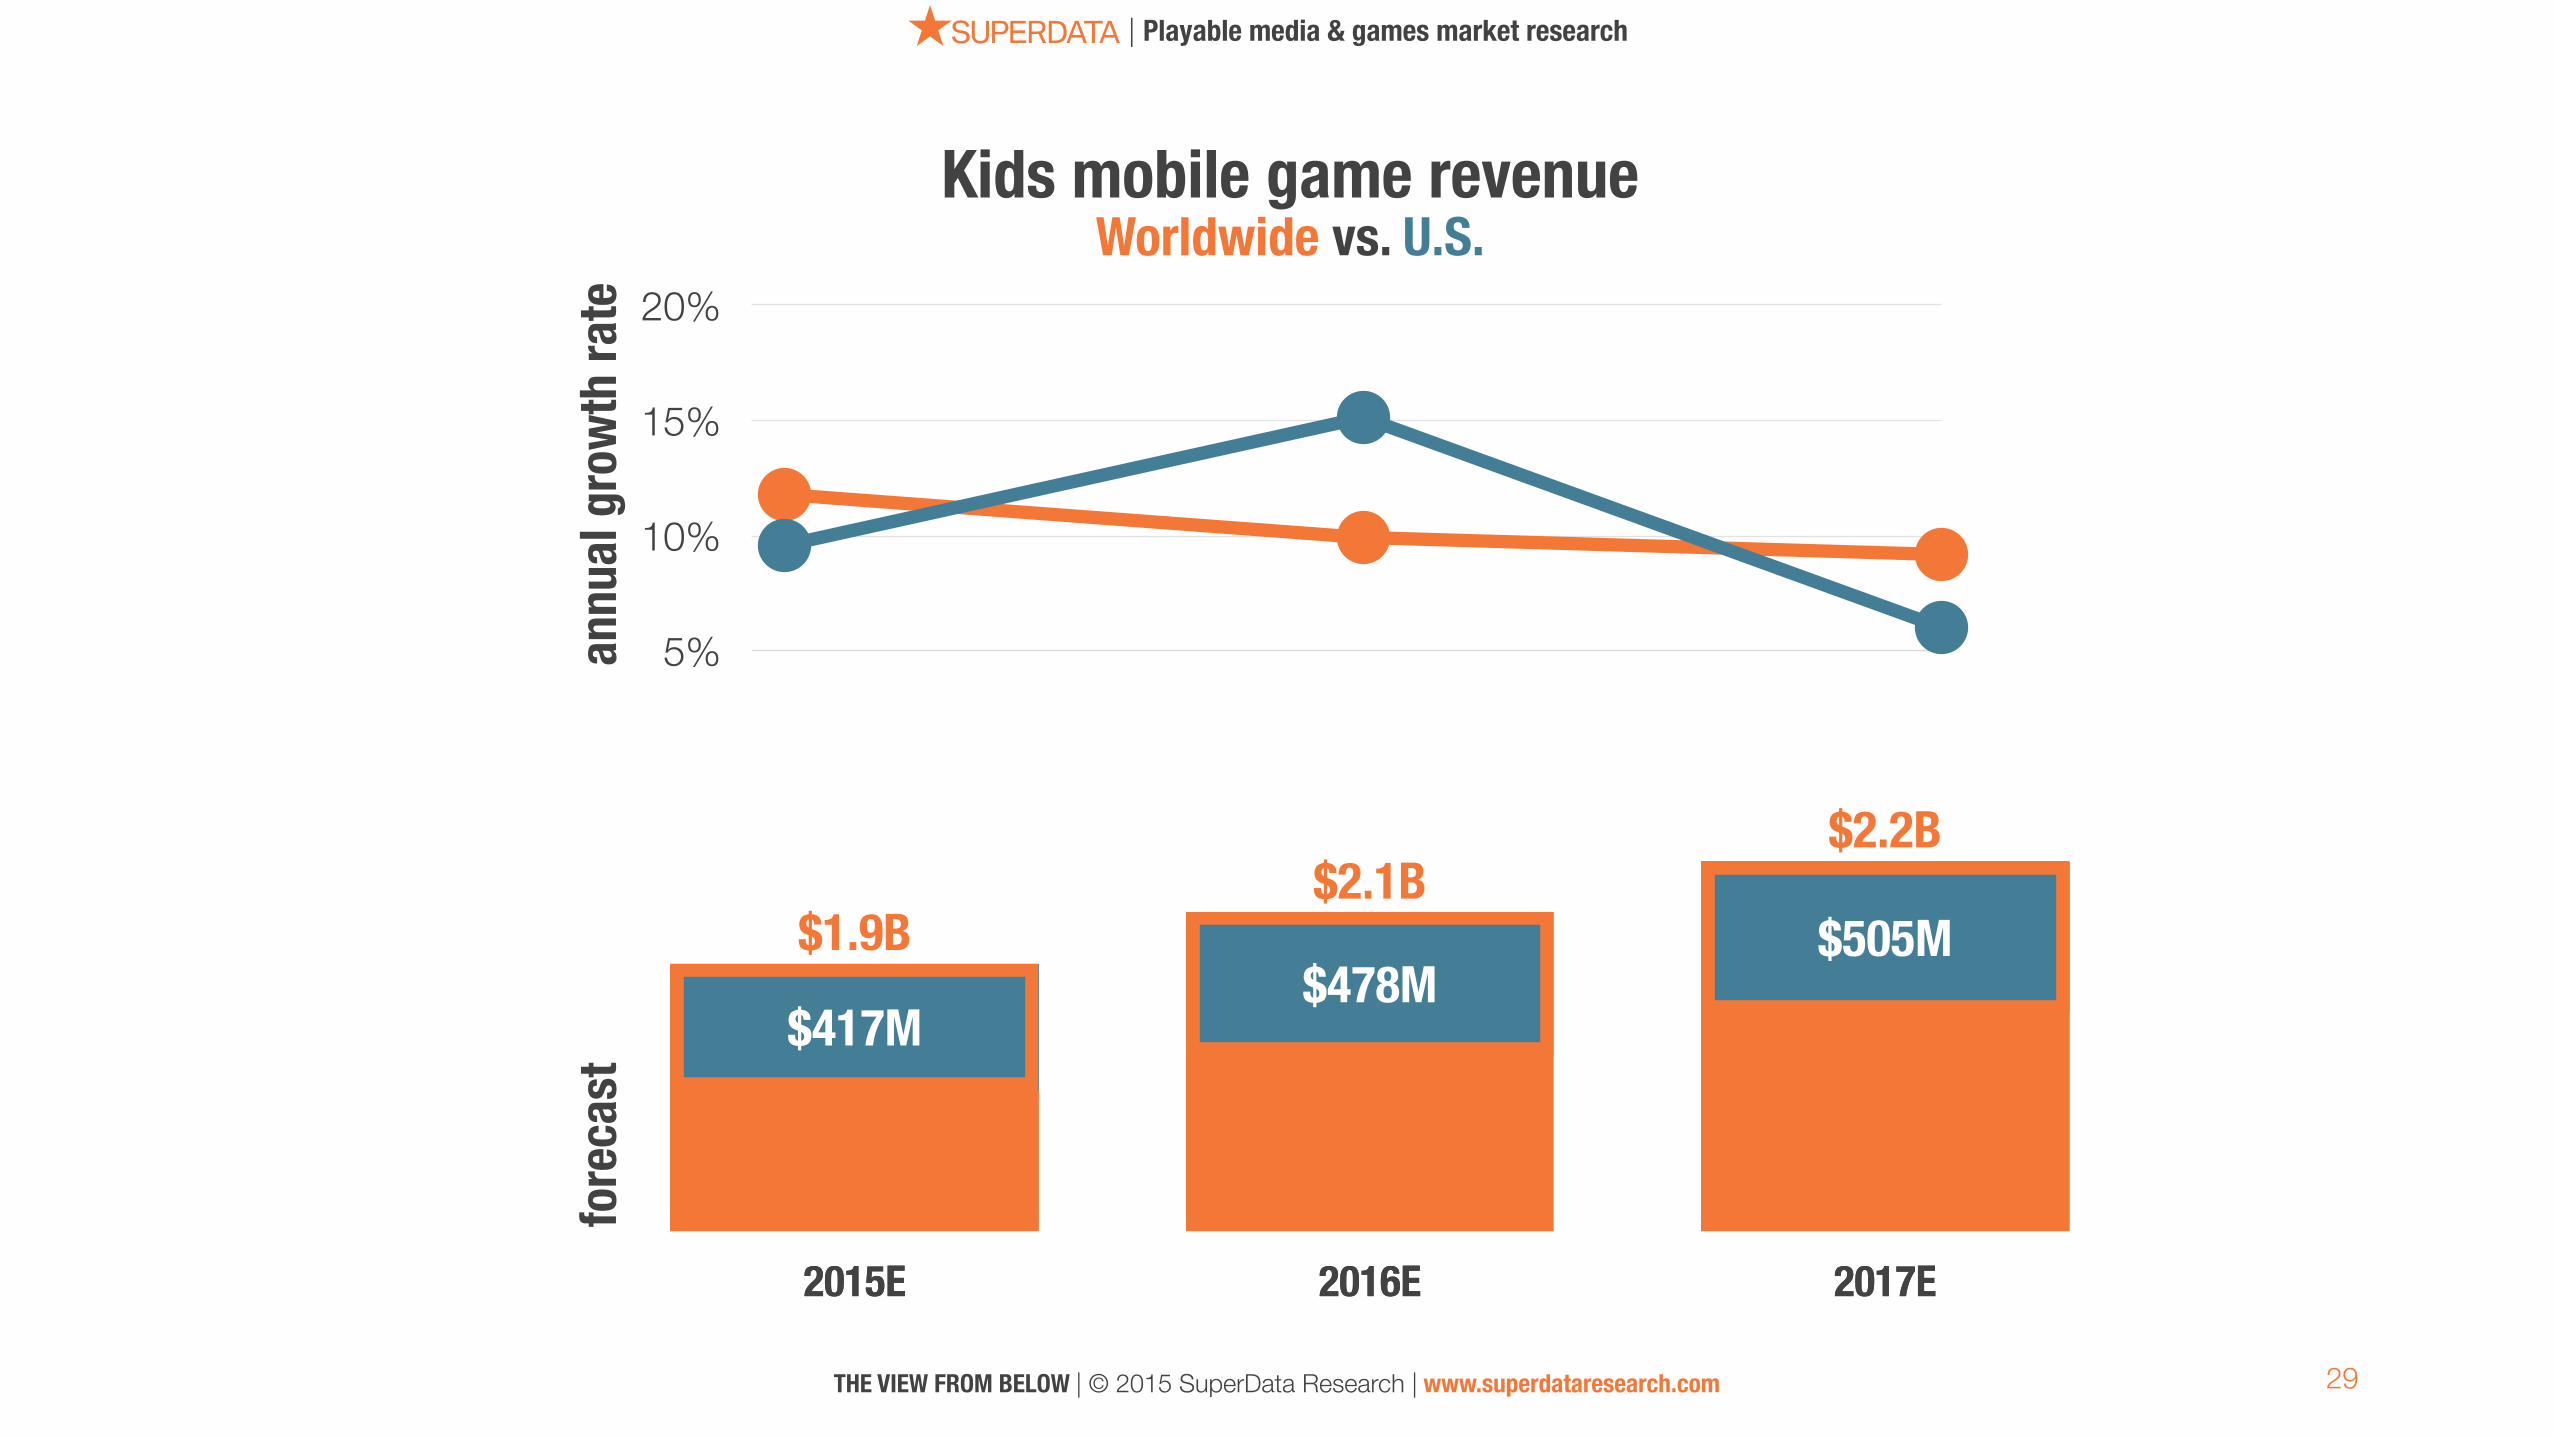
5%
10%
15%
20%
1
1.55
2.1
2.65
3.2
2015E 2016E 2017E
$2.2B$2.1B
$1.9B
1000000000
1550000000
2100000000
2650000000
3200000000
2015E 2016E 2017E
$505M$478M
$417M
29
| Playable media & games market research
THE VIEW FROM BELOW | © 2015 SuperData Research | www.superdataresearch.com
fore
cast
annu
al gr
owth
rate
Worldwide vs. U.S.Kids mobile game revenue
0
75
150
225
300
2015E 2016E 2017E
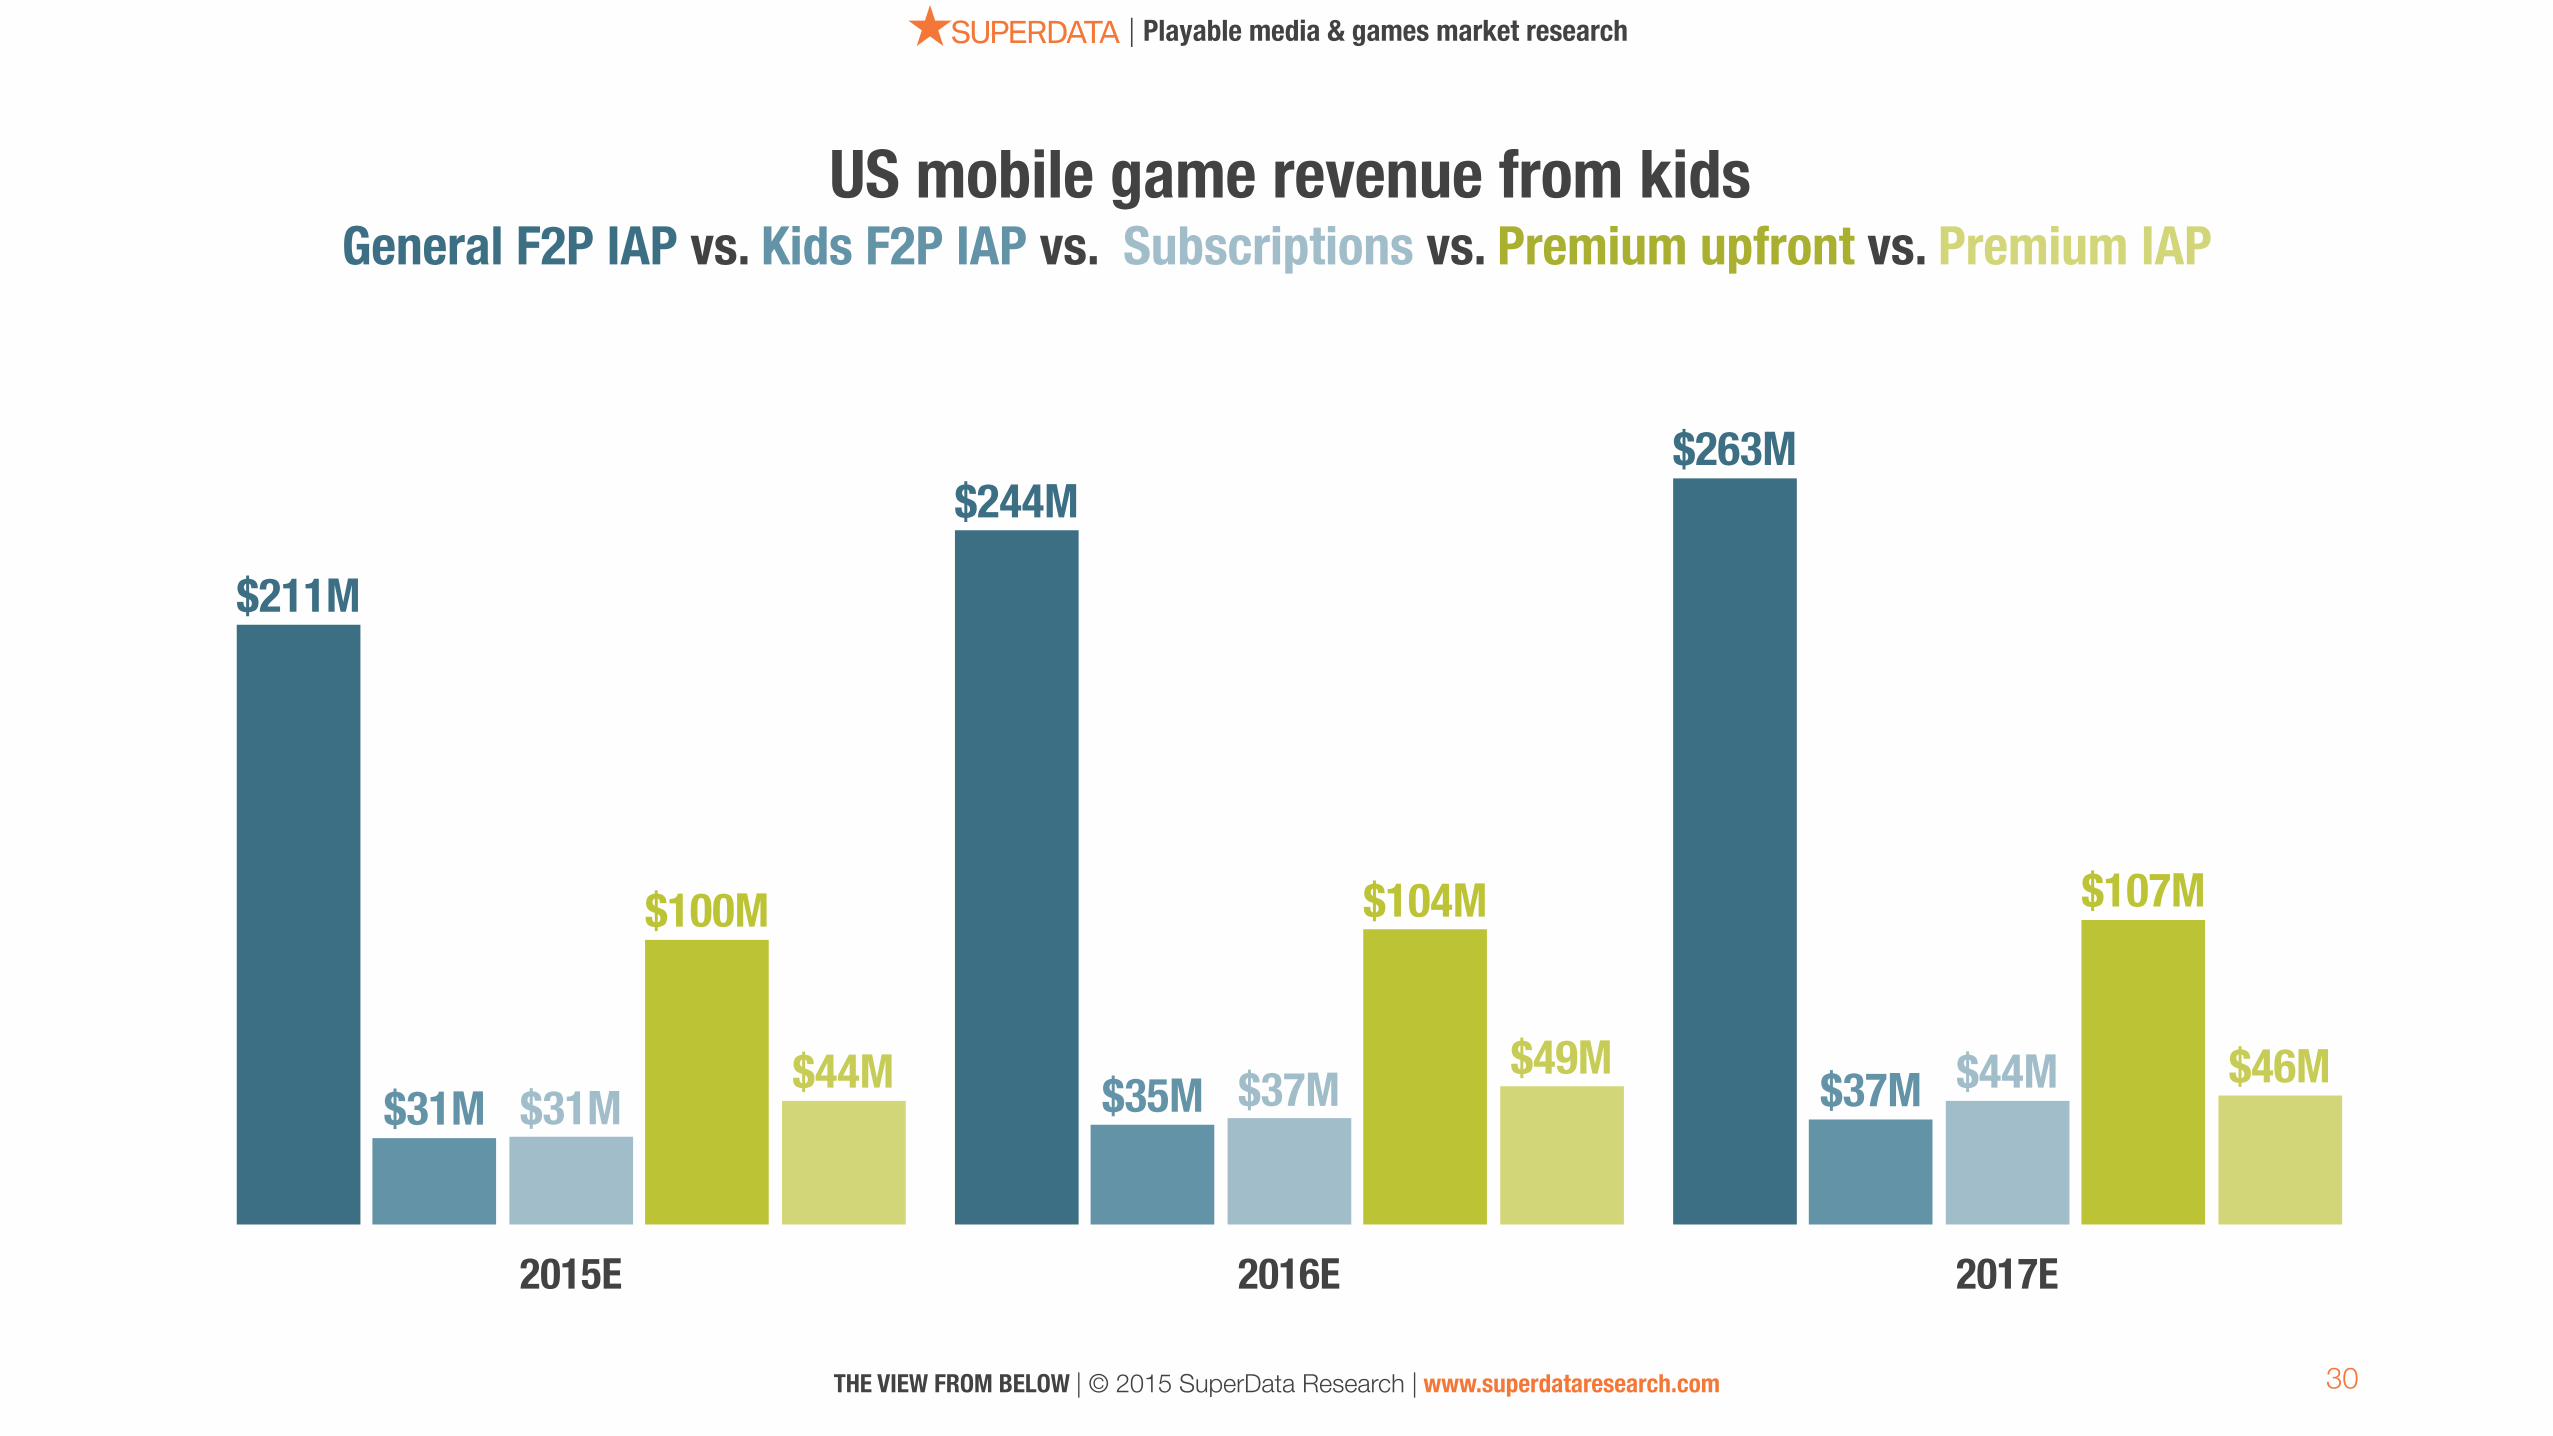
$46M$49M$44M
$107M$104M$100M
$44M$37M$31M $37M$35M$31M
$263M$244M
$211M
30
| Playable media & games market research
THE VIEW FROM BELOW | © 2015 SuperData Research | www.superdataresearch.com
General F2P IAP vs. Kids F2P IAP vs. Subscriptions vs. Premium upfront vs. Premium IAPUS mobile game revenue from kids
31
| Playable media & games market research
THE VIEW FROM BELOW | © 2015 SuperData Research | www.superdataresearch.com
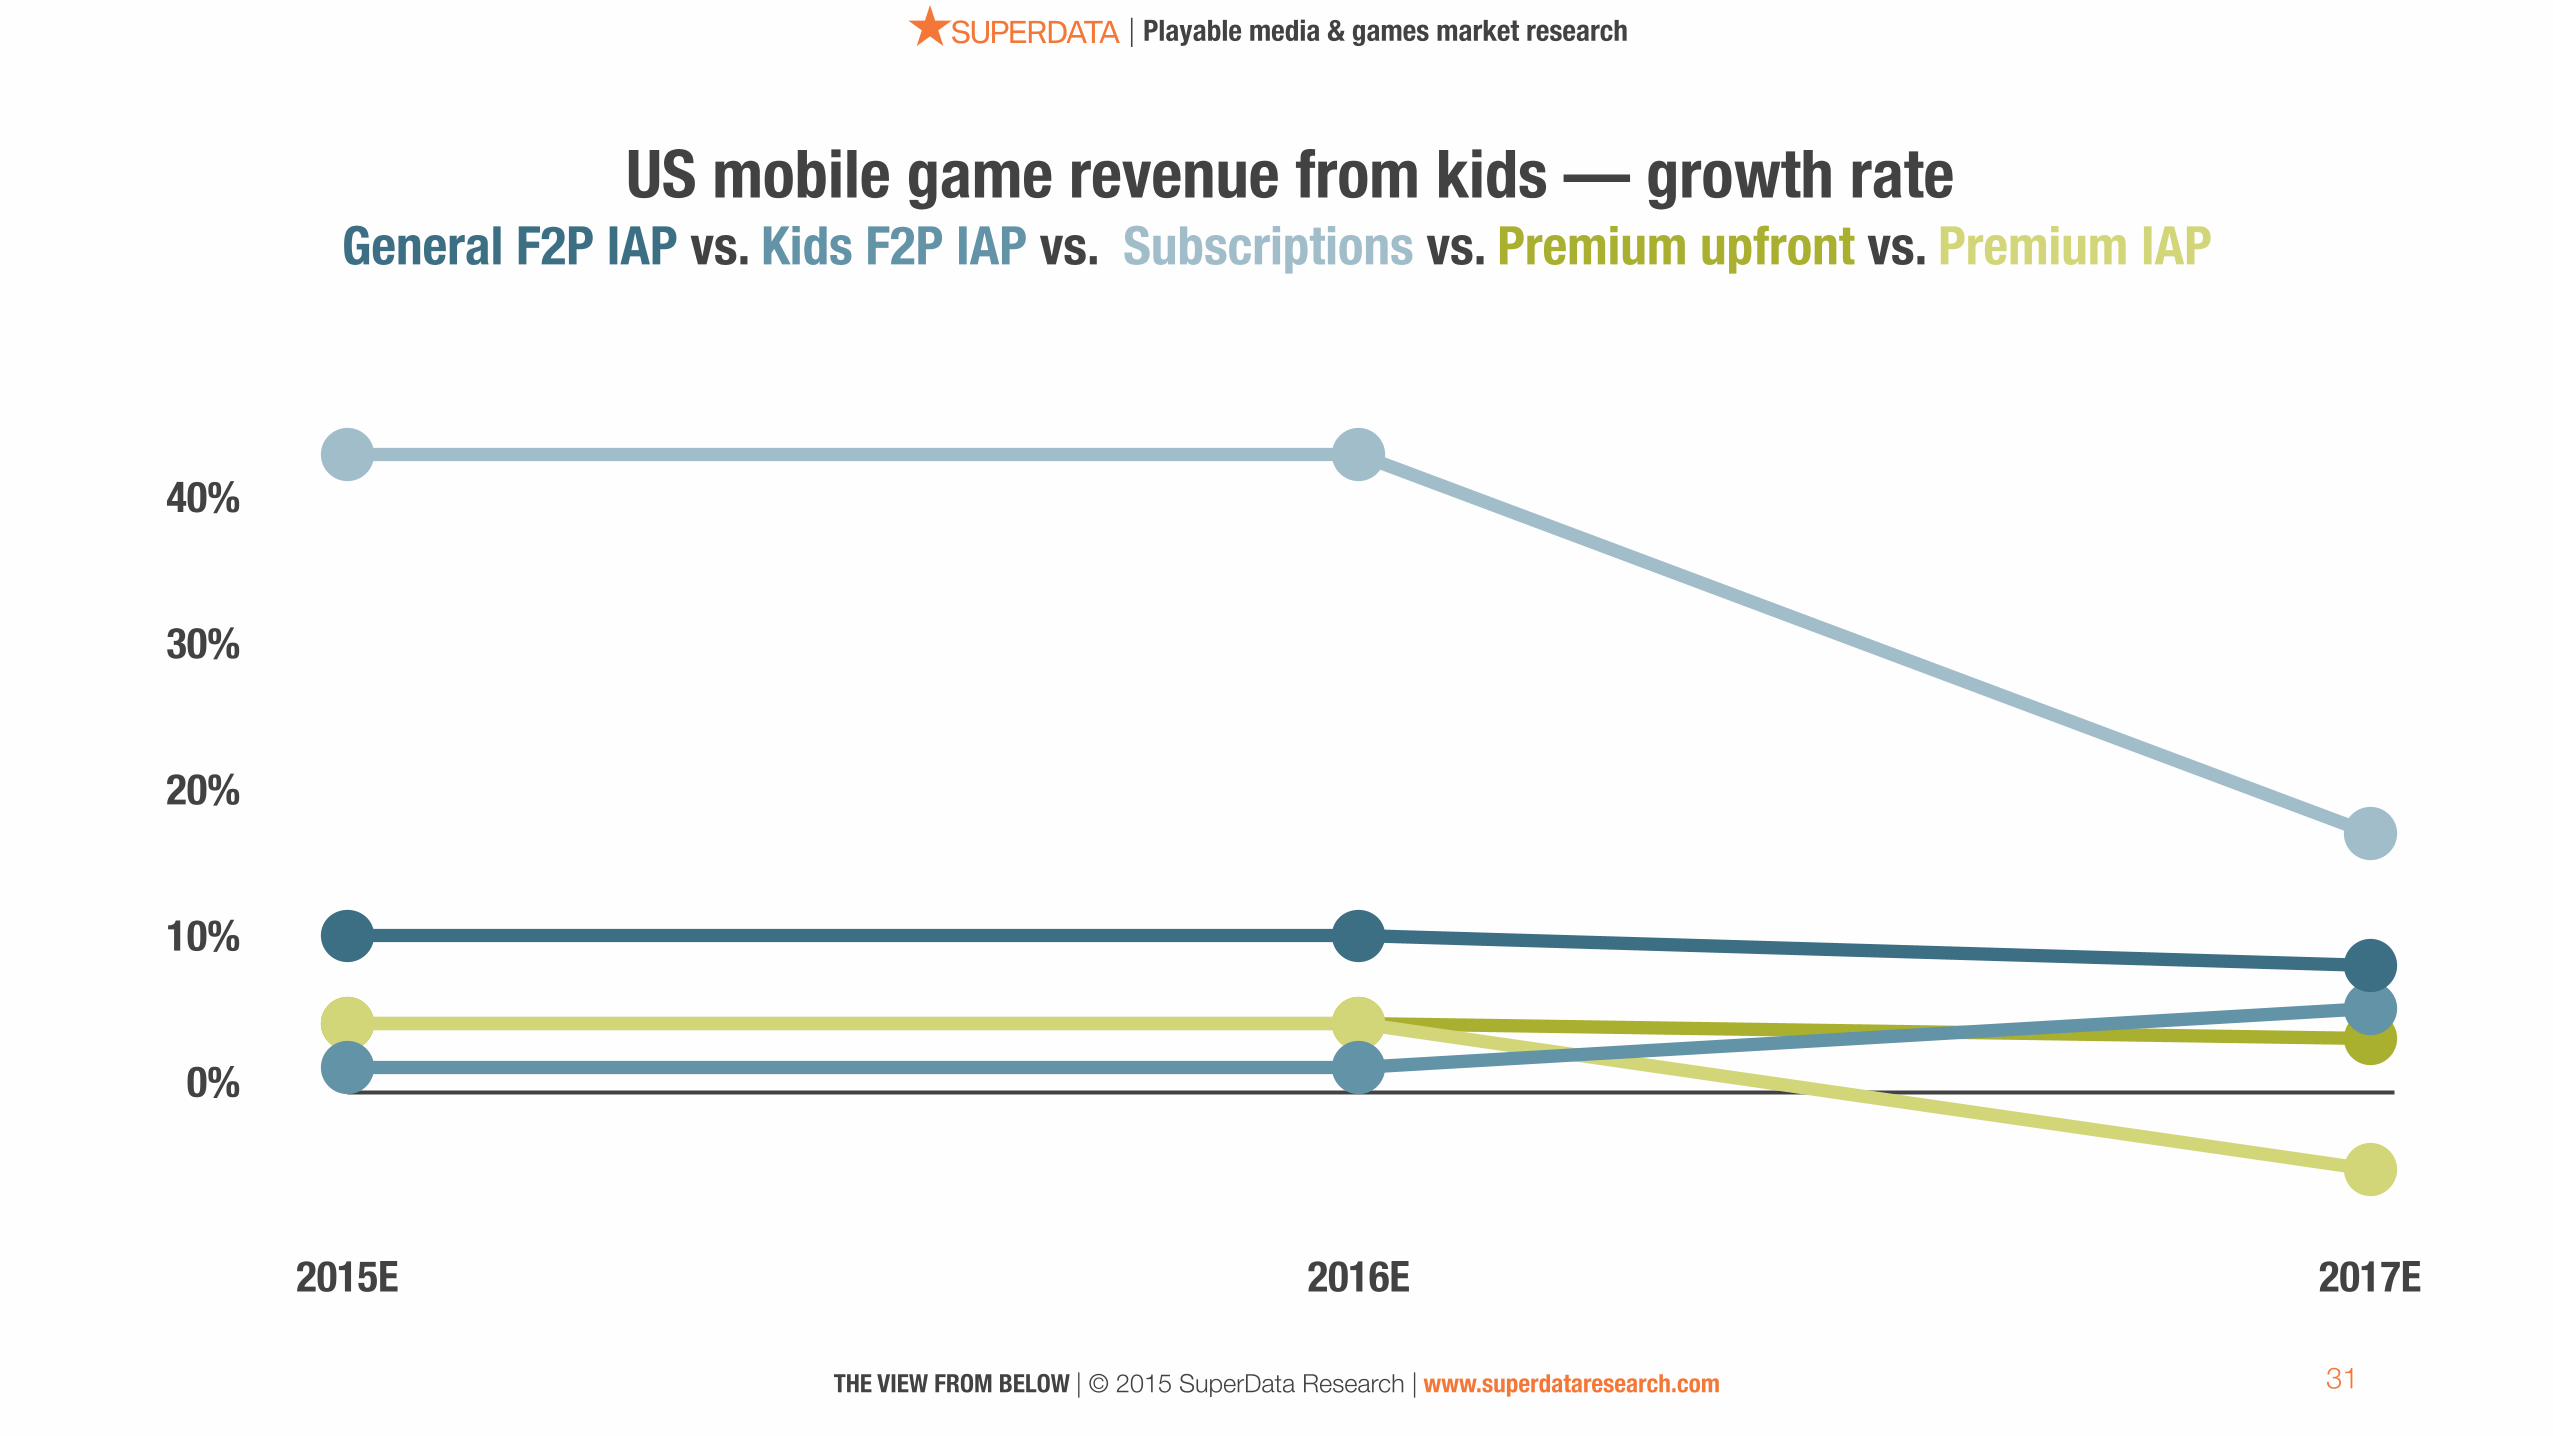
US mobile game revenue from kids — growth rate
2015E 2016E 2017E
0%
10%
20%
30%
40%
General F2P IAP vs. Kids F2P IAP vs. Subscriptions vs. Premium upfront vs. Premium IAP
32
| Playable media & games market research
THE VIEW FROM BELOW | © 2015 SuperData Research | www.superdataresearch.com
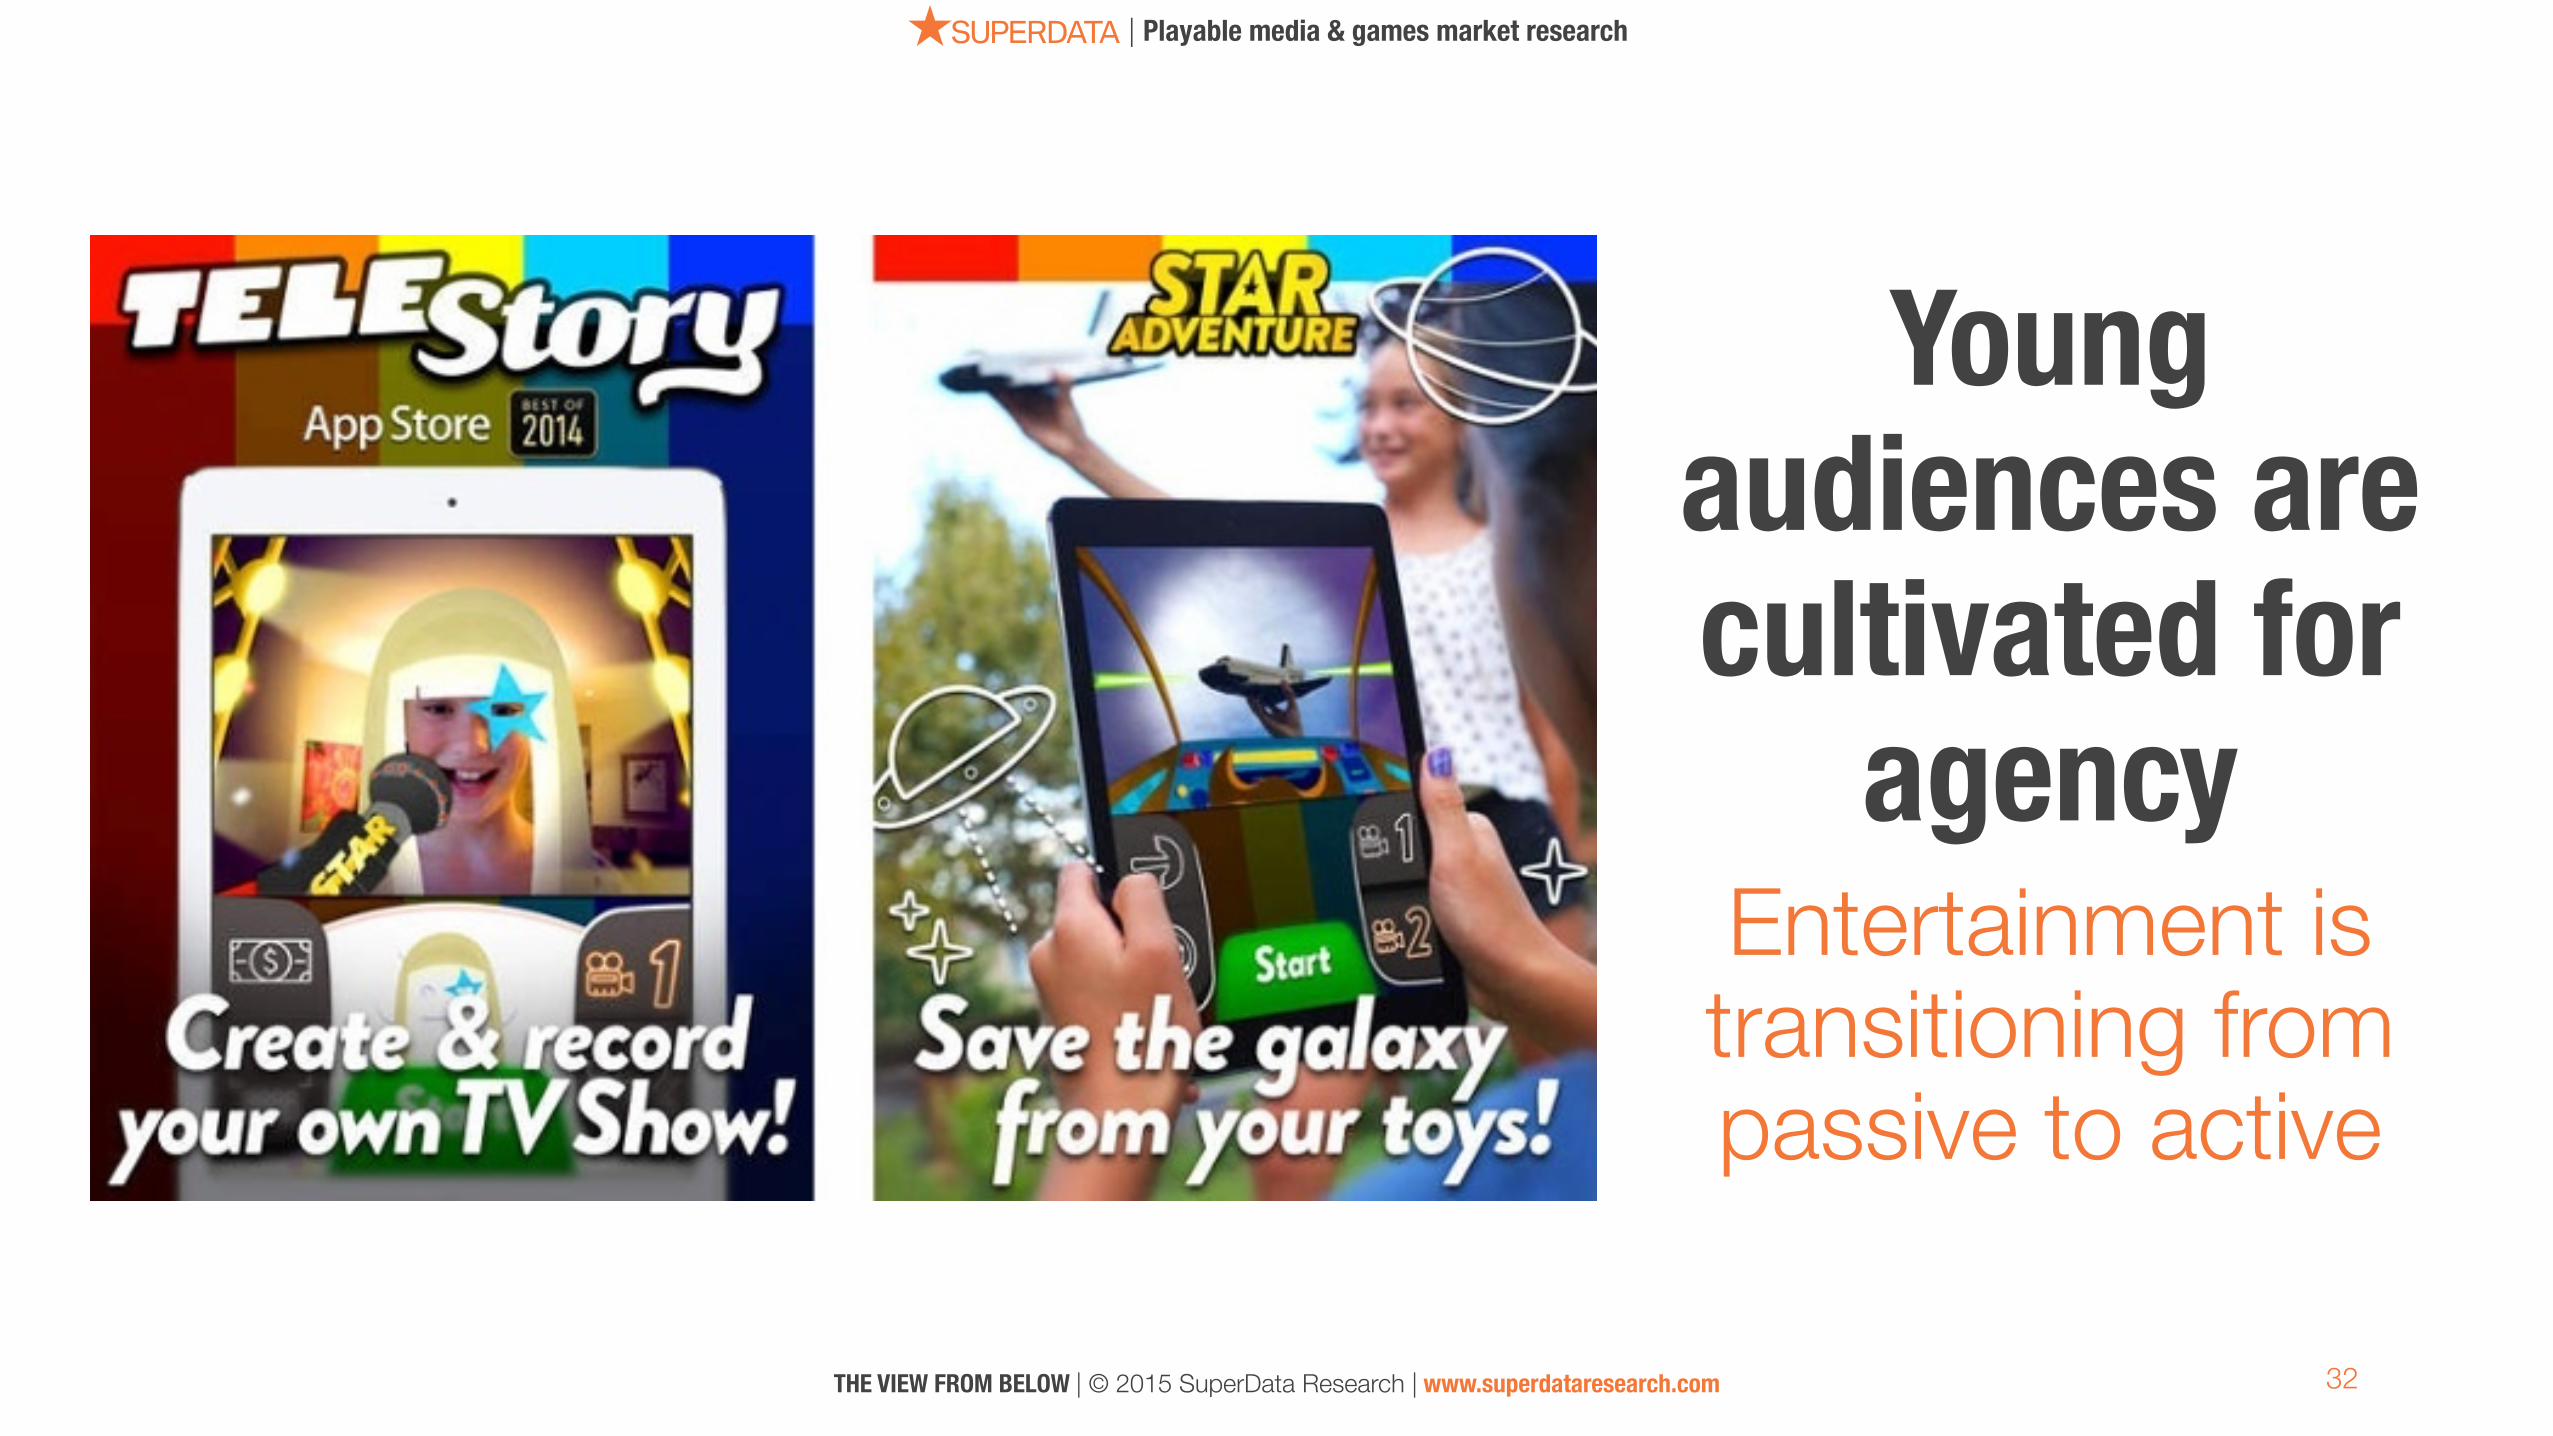
Young audiences are cultivated for
agency Entertainment is transitioning from passive to active

33
| Playable media & games market research
THE VIEW FROM BELOW | © 2015 SuperData Research | www.superdataresearch.com
THANK YOU!
Director, Research & Consumer Insights Stephanie Llamas [email protected]
www.superdataresearch.com @_SuperData @Stephinaners #CasualConnectUSA