the viability of stocktwits and google trends to predict the stock market · predict the stock...
TRANSCRIPT
The Viability of StockTwits and Google Trends to Predict the Stock Market
By Chris Loughlin
and Erik Harnisch
Spring 2013

Introduction
Investors are always looking to gain an edge on the rest of the market. Traditional market theory
tells us trying to predict future stock market movements is a wasted effort. The earliest forms of
this concept focuses primarily on the random walk hypothesis, which asserts that stock market
prices are random and day-to-day price movements are independent of one another. Fama
expanded upon this theory, developing what is now commonly referred to as the Efficient-
Market Hypothesis (EMH). The EMH states that it is impossible to ‘beat the market’ as market
efficiency ensures that all security prices always ‘fully reflect’ all available information [1]. In
short, an investor cannot reasonably expect to consistently beat the stock market through superior
stock selections and market timing.
The expansion of the Internet in the past decade has given researchers new avenues to explore
the art of prediction. First, online forums and blogs allowed individuals to share thoughts,
opinions and information with one another on any imaginable subject. Dhar and Chang examined
the predictive ability of Internet chatter from user-generated content on blogs and forums and its
impact on music album sales [2]. Their research concluded that that online chatter is predictive
of album sales during the first two weeks following the album release and the week preceding
the album release. Mishne and Glance took a similar approach with movies and found correlation
between references to movies in weblog posts—both before and after their release—and the
movies’ financial success [3]. The growth in size and popularity of social media sites like
Facebook and Twitter gave researchers investigating the science of prediction another source of
data. Asur and Huberman examined tweets from the site Twitter and made predictions about the

financial success of various movies [4]. Using only tweets that preceded the release of a movie,
they found a strong correlation between the amount of attention a movie is given and its future
financial success. While this research doesn’t pertain specifically to the stock market, their
conclusions remain important as they show the predictive ability of blogs and social media.
The rapid expansion of social media in the past few years has changed the way people
communicate information, ideas and opinions to one another. Twitter in particular has become a
popular website, allowing its 500 million members to send an average of 340 million tweets
daily, all of which contain 140 characters or less [5] [6]. In recent years stock market investors
have increasingly turned to Twitter as an investment tool. Twitter’s appeal as an investment tool
lies in the users ability to relay company information, investment ideas and market sentiment in a
short, concise manner. Nowadays, investors turn to the website StockTwits to share information.
Developed in 2008, StockTwits boasts 300,000 investors, market professionals and public
companies that use the site to share ideas and information about the market and individual stocks
[7]. StockTwits is an investor focused platform like Twitter which operates in a similar manner.
Users share short messages about a particular stock or index applying a $ symbol before the
ticker symbol which allows StockTwits to organize streams of information about a particular
stock or index.1 StockTwits allows for a significant amount of information to be aggregated in
one place, researchers have begun to examine the relationship between social media websites and
the stock market.
1 Ex.) $AAPL earnings tomorrow. Expecting a miss due to low Iphone sales and high expectations.
Bollen et al. (2010) used Twitter as a means to aggregate public sentiment and then test the
correlation between the collective mood of Twitter and the movements of the Dow Jones
Industrial Average over time [8]. Their research concluded that 86.7% of the time there was a
positive correlation between public sentiment and the upward/downward movement of the Dow
Jones. This conclusion, while significant, strays from the goals of our research. Unlike Bollen et
al., we will focus only on StockTwits messages that pertain to specific stocks or stock market
indices. Additionally, we will not utilize Twitter as a whole, but will focus solely on messages
sent through StockTwits.
Sprenger and Welpe went into further detail with their research, analyzing the volume of stock
related StockTwits messages and their impact on next day price movements [9]. Their research
concluded that the sentiment of messages (i.e. bullish or bearish) associated with abnormal stock
returns and next day trading volume. Our research will investigate whether a high volume of
messages is a leading or lagging indicator of stock market returns.
This research will aim to further understand if StockTwits messages are leading or lagging
indicators of stock market returns. Unlike Bollen et al., we will not focus on the entire Twitter
user base when collecting data, but will focus specifically on messages collected from
StockTwits.com. Our research will be similar to that of Sprenger and Welpe, but we will only
examine individual stocks. More formally, we will aggregate data relating to a particular
company using StockTwits “Cashtag” handle system (which tags company stocks by using the
dollar sign, $, along with the company stock symbol) and Google Trends index and then test the
significance of the StockTwits and Google Trends betas in explaining daily stock returns. If the

StockTwits and Google Trends betas are significant we will test if they are a significant leading
or lagging predictor of daily stock returns.
Literature Review
In recent years, researchers have in increasingly looked towards sentiment analysis as a tool for
making predictions. The evolution of the “Web 2.0” in the early 2000’s allowed researchers easy
access to large amounts of data on online blogs and forums. Dhar and Chang [2] examined the
usefulness of user-generated content consisting of data from blogs and forums to examine its
predictive capability of music album sales. Mishne and Glance [3], using a similar tactic, applied
their results to the box office performances of various movies. With the evolution of social
networking, Asur and Huberman [4] used Twitter messages to once again examine the
relationship between community chatter and the financial performance of movies. In all three
above cases, the research concluded that there was a positive relation to online “chatter” and the
financial performance of albums or movies.
During the dot-com bubble of the late 1990’s, online blogs and message boards focused on stock
market information and speculation became popular. Wysocki’s 1998 paper tested whether
variation in message posting volume is just noise or if it is related to the underlying
characteristics of a firm and stock market activity [10]. Wysocki’s research was significant in
that it found a high level of correlation between messages posted after regular stock market hours
(i.e. between 4:00 p.m. and 9:00 a.m. the following trading day) and the following trading day’s
volume and returns.
Tumarkin and Whitellaw, using methods similar to Wysocki, focused their research using chatter
only from the once popular website RagingBull.com [11]. Unlike previous research, they
concluded that the message board activity of RagingBull.com did not have any predictive
capabilities but did, however, show correlation between message volume and next day trading
volume.
Antweiler and Frank examined 1.5 million messages focused on 45 companies that were posted
on Yahoo! Finance and RagingBull.com [12]. Their research concluded that stock market
messages help to predict market volatility and that while economically small; stock market
message boards do affect stock market returns in a statistically significant manner.
Das and Chen added to previous research by developing a formal sentiment analysis tool and
applying it to stock market message boards [13]. When applied to individual stocks they found
no significant correlation between sentiment and stock price movements. They acknowledge this
in their research and attribute it to the large amount of noise in stock market message boards as
well as the lack of market power that many investors participating in online message boards
have.
Previous research has primarily used online message boards as a mean to aggregate investor
sentiment. Recent research has taken advantage of the emergence of social media and applied
this towards financial markets. Bollen et al. [8] aggregated “tweets” from Twitter as a whole,
choosing not to focus stock market specific “tweets,” and examined the “mood” states of Twitter

users and corresponding stock market movements. Signaling six different mood types that would
reflect the mood of an individual (Calm, Alert, Sure, Vital, Kind and Happy), the research of
Bollen et al. showed the collective “mood” of Twitter users successfully predicted the upward
and downward movement of the stock market 86.7% of the time.
Sprenger and Welpe [9] used a more direct approach to examine the relation between Twitter
messages and stock market movement by filtering out all non-market related “tweets.” The did
this by using messages only pulled from StockTwits.com. Using the S&P 100 as the market
index for analysis, their research suggests that public sentiment conveyed through
StockTwits.com aligns itself with the movement of the S&P 100 and is positively related to the
volume of trading.
The quality of the information of Twitter has also been researched. Twitter allows people to “re-
tweet” (or re-share) previous tweets and to follow others, naturally isolating and emphasizing
accurate information and eliminating poor information. Evangelopoulos et al. found that Twitter
is actually a leading indicator of stock performance, rather than a lagging indicator [14].

Methodology
To prove the significance of StockTwits and Google Trends, we will use a linear model to
predict daily stock returns. The StockTwits data is comprised of a daily Bear index and a daily
Bull index. StockTwits collects sentiment from users who tag their messages either “bullish” or
“bearish”, messages not tagged are assumed “neutral”. The index is simply the number of
messages relating to a particular stock each day. The Google Trend data is an index of specific
search terms relating to a particular company.
Our first model will include three estimators, the Bear index, the Bull index, and the Google
Trend index. If these estimators prove to be statistically significant, we will create a Cross-
Correlation function to determine if one of the estimators is a good leading predictor of stock
returns.
Data Collection
The StockTwits index has automatically been labeled either a Bearish or Bullish message. For
sample size purposes, we compiled three months of messages, starting on January 1,2013 and
ending on March 31, 2013. With over 19,000 messages, the law of large numbers should crowd
out uninformed, inaccurate messages.

The Google Trends data was compiled and aggregated directly from the Google Trend website.
Our index includes search terms relating to a particular company, like the company name and
company products and services.
Our data will be focusing on four companies, Apple, Google, Microsoft, and Facebook. We hope
to model the fast movement in technology stocks with a fast estimator, like StockTwits and
Google Trends.
Model
For our first model, we will be using a linear model in R to predict stock returns. The LM
function in R uses a least squares parameterization:
min𝑆
𝑠. 𝑡. ∶ 𝛽 𝑆 = 𝑟!!
!
!!!
𝑟! = 𝑦! − 𝑓(𝑥! ,𝛽)
If the betas are statistically significant, we will create a new model with the lagged data,
depending on the Cross-Correlation function, which shows significant correlation in lagged data.
If the lagged beta coefficients are statistically significant, then the betas will be leading
predictors of stock returns.
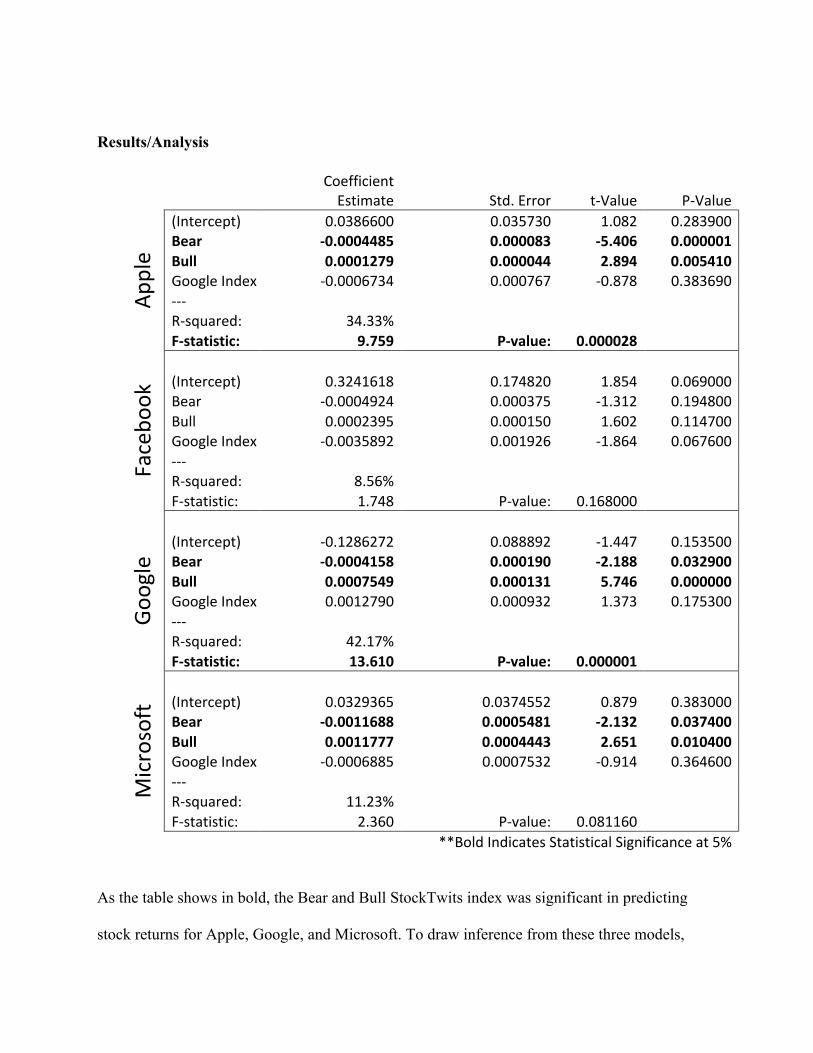
Results/Analysis
Coefficient Estimate Std. Error t-‐Value P-‐Value
Apple
(Intercept) 0.0386600 0.035730 1.082 0.283900 Bear -‐0.0004485 0.000083 -‐5.406 0.000001 Bull 0.0001279 0.000044 2.894 0.005410 Google Index -‐0.0006734 0.000767 -‐0.878 0.383690 -‐-‐-‐
R-‐squared: 34.33%
F-‐statistic: 9.759 P-‐value: 0.000028
Facebo
ok
(Intercept) 0.3241618 0.174820 1.854 0.069000 Bear -‐0.0004924 0.000375 -‐1.312 0.194800 Bull 0.0002395 0.000150 1.602 0.114700 Google Index -‐0.0035892 0.001926 -‐1.864 0.067600 -‐-‐-‐
R-‐squared: 8.56%
F-‐statistic: 1.748 P-‐value: 0.168000
(Intercept) -‐0.1286272 0.088892 -‐1.447 0.153500 Bear -‐0.0004158 0.000190 -‐2.188 0.032900 Bull 0.0007549 0.000131 5.746 0.000000 Google Index 0.0012790 0.000932 1.373 0.175300 -‐-‐-‐
R-‐squared: 42.17%
F-‐statistic: 13.610 P-‐value: 0.000001
Microsoft
(Intercept) 0.0329365 0.0374552 0.879 0.383000 Bear -‐0.0011688 0.0005481 -‐2.132 0.037400 Bull 0.0011777 0.0004443 2.651 0.010400 Google Index -‐0.0006885 0.0007532 -‐0.914 0.364600 -‐-‐-‐
R-‐squared: 11.23%
F-‐statistic: 2.360 P-‐value: 0.081160
**Bold Indicates Statistical Significance at 5%
As the table shows in bold, the Bear and Bull StockTwits index was significant in predicting
stock returns for Apple, Google, and Microsoft. To draw inference from these three models,

autocorrelation and heteroskedasticity must not exist in the model. Below are autocorrelation,
partial autocorrelation plots, and heteroskedasticity plots that will show significant lags (lags
beyond the blue-dotted line):
0 5 10 15
-0.2
0.2
0.6
1.0
Lag
ACF
Autocorrelation of Apple Model
5 10 15
-0.2
0.0
0.2
Lag
Par
tial A
CF
Partial Autocorrelation of Apple Model
5 10 15
-0.2
0.0
0.2
Lag
Par
tial A
CF
Heteroskedasticity of Apple Model

0 5 10 15
-0.4
0.0
0.4
0.8
Lag
ACF
Autocorrelation of Google Model
5 10 15
-0.3
-0.1
0.1
Lag
Par
tial A
CF
Partial Autocorrelation of Google Model
5 10 15
-0.2
0.0
0.2
Lag
Par
tial A
CF
Heteroskedasticity of Google Model
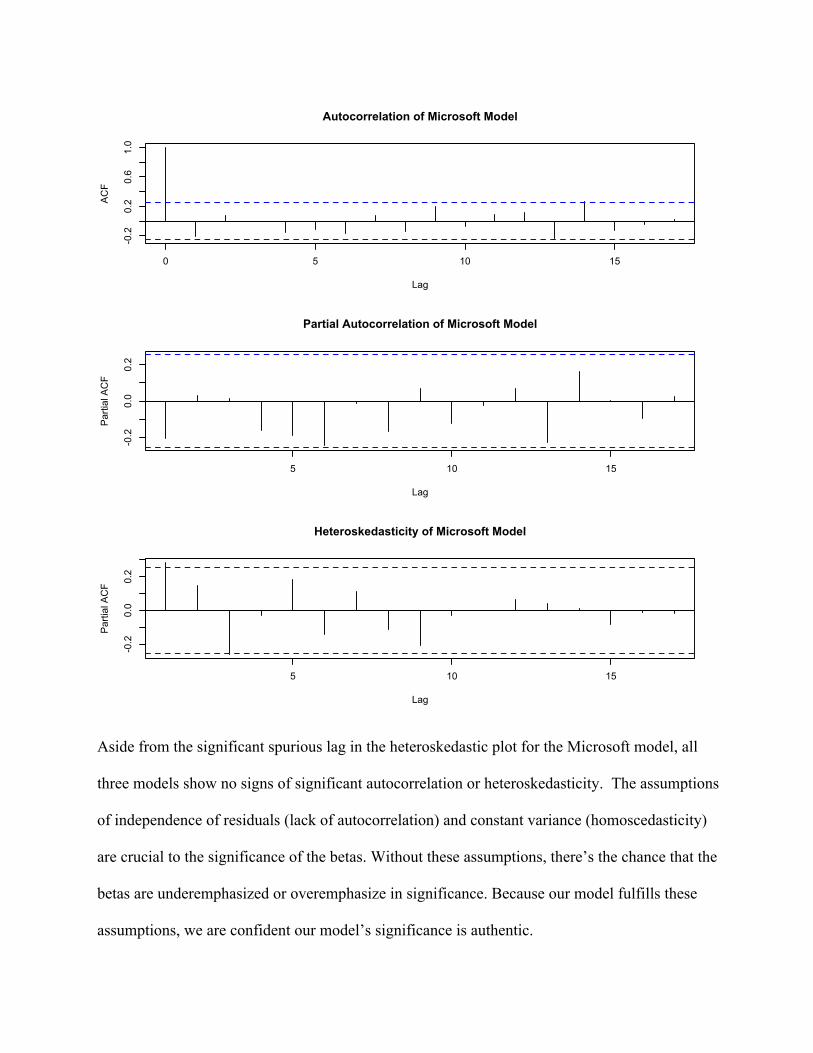
Aside from the significant spurious lag in the heteroskedastic plot for the Microsoft model, all
three models show no signs of significant autocorrelation or heteroskedasticity. The assumptions
of independence of residuals (lack of autocorrelation) and constant variance (homoscedasticity)
are crucial to the significance of the betas. Without these assumptions, there’s the chance that the
betas are underemphasized or overemphasize in significance. Because our model fulfills these
assumptions, we are confident our model’s significance is authentic.
0 5 10 15
-0.2
0.2
0.6
1.0
Lag
ACF
Autocorrelation of Microsoft Model
5 10 15
-0.2
0.0
0.2
Lag
Par
tial A
CF
Partial Autocorrelation of Microsoft Model
5 10 15
-0.2
0.0
0.2
Lag
Par
tial A
CF
Heteroskedasticity of Microsoft Model

To get an idea of the leading or lagging performance, a cross-correlation function between the
stock’s returns and the bear and bull index are below. Lags beyond the dotted-blue line are
significantly correlated:
-15 -10 -5 0 5 10 15
-0.4
0.00.2
Lag
ACF
Cross-Correlation between Apple Returns and Bear Index
-15 -10 -5 0 5 10 15-0.3
-0.1
0.1
Lag
ACF
Cross-Correlation between Apple Returns and Bull Index
-15 -10 -5 0 5 10 15
-0.3
-0.1
0.1
Lag
ACF
Cross-Correlation between Google Returns and Bear Index
-15 -10 -5 0 5 10 15
-0.2
0.2
0.6
Lag
ACF
Cross-Correlation between Google Returns and Bull Index
-15 -10 -5 0 5 10 15
-0.3
-0.1
0.1
Lag
ACF
Cross-Correlation between Microsoft Returns and Bear Index
-15 -10 -5 0 5 10 15
-0.2
0.0
0.2
Lag
ACF
Cross-Correlation between Microsoft Returns and Bull Index

Most of the significant lags are around lag zero or greater, meaning a there are significant
lagging predictors or stock returns. However, there are some significant leading predictors once
modeled.
Coefficient Estimate Std. Error t-‐Value P-‐Value
Apple
(Intercept) 0.0148800 0.012500 1.191 0.24050 Bear -‐0.0004864 0.000097 -‐5.001 0.00001 Bear, lag=-‐1 -‐0.0000988 0.000102 -‐0.966 0.33970 Bear, lag=-‐2 -‐0.0000463 0.000104 -‐0.445 0.65880 Bear, lag=-‐3 0.0002177 0.000108 2.021 0.04970 Bear, lag=-‐4 -‐0.0001054 0.000112 -‐0.945 0.34990 Bear, lag=-‐5 -‐0.0000137 0.000103 -‐0.133 0.89450 Bull 0.0001210 0.000055 2.201 0.03330 Bull, lag=-‐1 0.0000622 0.000060 1.033 0.30740 Bull, lag=-‐2 -‐0.0000129 0.000059 -‐0.218 0.82850 Bull, lag=-‐3 -‐0.0001264 0.000059 -‐2.127 0.03930 Bull, lag=-‐4 0.0000410 0.000062 0.659 0.51340 Bull, lag=-‐5 0.0000329 0.000057 0.573 0.56950 -‐-‐-‐
R-‐squared: 43.26%
F-‐statistic: 2.668 P-‐value: 0.00933
(Intercept) 0.0045700 0.007415 0.616 0.54090 Bear -‐0.0006513 0.000320 -‐2.033 0.04820 Bear, lag=-‐1 0.0004700 0.000336 1.397 0.16950 Bear, lag=-‐2 0.0000169 0.000331 0.051 0.95960 Bear, lag=-‐3 -‐0.0000960 0.000328 -‐0.293 0.77110 Bear, lag=-‐4 0.0002155 0.000328 0.657 0.51480 Bear, lag=-‐5 -‐0.0001882 0.000302 -‐0.623 0.53640 Bull 0.0008008 0.000163 4.909 0.00001 Bull, lag=-‐1 0.0001225 0.000185 0.661 0.51210 Bull, lag=-‐2 0.0000175 0.000196 0.089 0.92930 Bull, lag=-‐3 -‐0.0000159 0.000221 -‐0.072 0.94310 Bull, lag=-‐4 0.0002382 0.000221 1.079 0.28670 Bull, lag=-‐5 -‐0.0003629 0.000207 -‐1.756 0.08620 -‐-‐-‐
R-‐squared: 19.57%
F-‐statistic: 0.951 P-‐Value: 0.50320
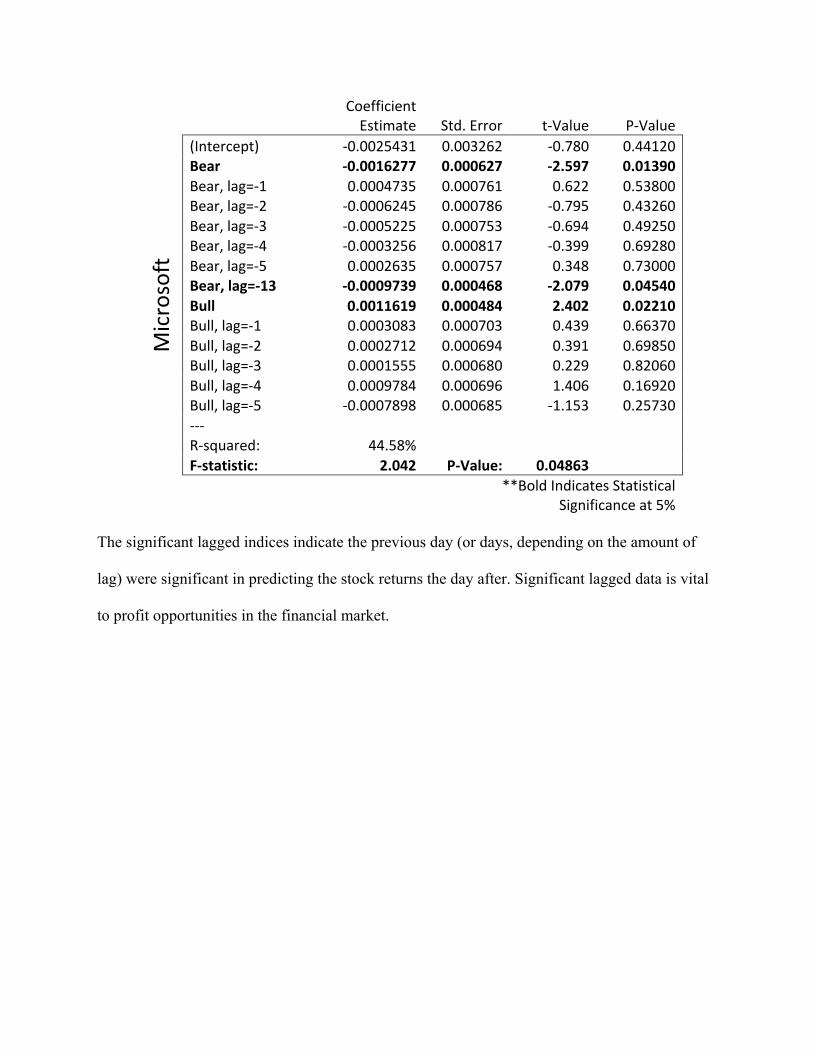
Coefficient Estimate Std. Error t-‐Value P-‐Value
Microsoft
(Intercept) -‐0.0025431 0.003262 -‐0.780 0.44120 Bear -‐0.0016277 0.000627 -‐2.597 0.01390 Bear, lag=-‐1 0.0004735 0.000761 0.622 0.53800 Bear, lag=-‐2 -‐0.0006245 0.000786 -‐0.795 0.43260 Bear, lag=-‐3 -‐0.0005225 0.000753 -‐0.694 0.49250 Bear, lag=-‐4 -‐0.0003256 0.000817 -‐0.399 0.69280 Bear, lag=-‐5 0.0002635 0.000757 0.348 0.73000 Bear, lag=-‐13 -‐0.0009739 0.000468 -‐2.079 0.04540 Bull 0.0011619 0.000484 2.402 0.02210 Bull, lag=-‐1 0.0003083 0.000703 0.439 0.66370 Bull, lag=-‐2 0.0002712 0.000694 0.391 0.69850 Bull, lag=-‐3 0.0001555 0.000680 0.229 0.82060 Bull, lag=-‐4 0.0009784 0.000696 1.406 0.16920 Bull, lag=-‐5 -‐0.0007898 0.000685 -‐1.153 0.25730 -‐-‐-‐
R-‐squared: 44.58%
F-‐statistic: 2.042 P-‐Value: 0.04863
**Bold Indicates Statistical Significance at 5%
The significant lagged indices indicate the previous day (or days, depending on the amount of
lag) were significant in predicting the stock returns the day after. Significant lagged data is vital
to profit opportunities in the financial market.

Conclusion
From our analysis, Google Trends data was not significant in predicting stock returns. But
StockTwits data was significant in predicting Apple, Google, and Microsoft stock returns. When
the data was lagged, the Bear and Bull indices were significant in predicting Apple and
Microsoft stock returns. Because this data was lagged, StockTwits data is significant as a leading
predictor of stock returns.
Because we only covered four companies, this isn’t a foolproof investment tool. It was merely an
investigation and exploration into using alternative information sources. However, StockTwits
data can serve as a trust-worthy supplemental source of information to an investor.
Contributions
Erik Harnisch was responsible for the data mining, aggregation and modeling. Chris Loughlin
was responsible for the research and analysis of previous economic work. Together we examined
the results and formed our economic conclusions.

References
1 Fama EF. Efficient Capital Markets: A Review of Theory and Empirical Work. The Journal
of Finance. 1970 December 28-‐30;25(02):383-‐417.
2 Dhar V, Chang EA. Does Chatter Matter? The Impact of User-‐Generated Content on Music
Sales. Journal of Interactive Marketing. 2009 November;23(4):300-‐307.
3 Mishne G, Glance N. Predicting Movie Sales from Blogger Sentiment. AAAI 2006 Spring
Symposium on Computational Approaches to Analysing Weblogs. Spring 2006 1-‐4.
4 Asur S, Huberman BA. Predicting the Future With Social Media. In: 2010
IEEE/WIC/ACM International Conference on Web Intelligence and Intelligent Agent
Technology; 2010; Toronto, ON. p. 492 -‐ 499.
5 Lunden I. Analyst: Twitter Passed 500M Users In June 2012, 140M Of Them In US;
Jakarta ‘Biggest Tweeting’ City. [Internet]. 2012 [cited 2013 June 3]. Available from:
http://techcrunch.com/2012/07/30/analyst-‐twitter-‐passed-‐500m-‐users-‐in-‐june-‐2012-‐
140m-‐of-‐them-‐in-‐us-‐jakarta-‐biggest-‐tweeting-‐city/.
6 Twitter. Twitter turns six. [Internet]. 2012 [cited 2013 June 3]. Available from:
https://blog.twitter.com/2012/twitter-‐turns-‐six.
7 StockTwits. About StockTwits. [Internet]. [cited 2013 June 3]. Available from:
http://stocktwits.com/about.
8 Bollen J, Mao H, Zeng X. Twitter mood predicts the stock market. Journal of
Computational Science. 2011 March;2(1):1-‐8.

9 Sprenger TO, Welpe IM. Tweets and Trades: The Information Content of Stock
Microblogs. 2010 November 1.
10 Wysocki P. Cheap Talk on the Web-‐ The Determinants of Postings on Stock Message
Boards. University of Michigan Business School Working Paper No. 98025. 1998
November.
11 Tumarkin R, Whitelaw RF. News or Noise? Internet Postings and Stock Prices. Financial
Analysts Journal. 2001 May-‐June;57(3):41-‐51.
12 Antweiler W, Frank MZ. Is All That Talk Just Noise? The Information Content of Internet
Stock Message Boards. The Journal Of Finance. 2004 June;59(3):1259-‐1294.
13 Das SR, Chen MY. Yahoo! for Amazon: Sentiment Extraction from Small Talk on the Web.
Management Science. 2007 September;53(9):1375–1388.
14 Evangelopoulos , Magro MJ, Sidorova A. The Dual Micro/Macro Informing Role of Social
Network Sites: Can Twitter Macro Messages Help Predict Stock Prices?. Informing
Science: the International Journal of an Emerging Transdiscipline. 2012;15:247-‐268.