the vermont legislative research servicevlrs/energy/net metering.pdf · the vermont legislative...
TRANSCRIPT

Page 1 of 22
The Vermont Legislative Research Service http://www.uvm.edu/~vlrs/
Contact: Professor Jack (Anthony) Gierzynski [email protected]
517 Old Mill, Burlington, VT 05405-4110
Net Metering in Vermont Net metering, also known as net energy metering (NEM) is a program that allows for electric utility customers to generate their own energy, using small-scale renewable energy systems.1 The energy generated from NEM can be used by a customer in lieu of energy generated from traditional utility companies. Surplus power generated by the renewable energy system that is not used by the customer can be fed back into the electric grid through an electric meter. This power acts as credit that the customer can use on days when their renewable energy system is not generating enough energy to power the whole building.2 In this report we examine the costs and incentives of NEM and the distinctions between different NEM sectors and types. We also examine regional aspects of NEM and how renewable energy can be transferred throughout New England.
Types of Net Metering
NEM is categorized into four main types: conventional, virtual, aggregated and community. The National Conference for State Legislatures describes how each of these systems operates. Conventional NEM, also referred to as individual NEM, “connects a generating source to a single meter, such as a house or a building.”3 Aggregated NEM allows for a property owner with multiple meters on a single property, or adjacent properties, to implement NEM. Popular examples of aggregated NEM include adjacent agricultural buildings and universities that own multiple buildings. Virtual NEM, an expanded aggregated NEM system, refers to having several customers net meter the output of a single
1 State of Vermont Department of Public Service, “Net Metering,” Montpelier, VT: State of Vermont Department of Public Service, 2016, accessed March 22, 2016, http://publicservice.vermont.gov/renewable_energy/net_metering. 2 Renewable Energy Vermont, "Vermont Solar Consumer Guide: Solar Photovoltaic," Montpelier VT: Renewable Energy Vermont, 2015, accessed March 20, 2016, http://www.revermont.org/go-renewable/photovoltaic/. 3 Jocelyn Durkay, "Net Metering: Policy Overview and State Legislature Updates," Washington DC: National Conference of State Legislatures, 2014, accessed March 15, 2016, http://www.ncsl.org/research/energy/net-metering-policy-overview-and-state-legislative-updates.aspx#virtual.
Page 2 of 22
system. Customers that are, “tenants in a multi-family property or condominium owners” can use virtual NEM to divide energy credit between separate accounts.4 Along with virtual NEM are buy-all sell-all systems.5 According to the U.S. Department of Energy, “in a buy-all, sell-all arrangement, the subscriber to a project sells all of the energy produced at a price (value of solar, standard offer, etc.) and buys all of their energy from the utility.”6 Power purchase agreements, described below, are a common example of these systems.7 In virtual NEM a subscriber buys or leases a portion of a system and then receives credit for the energy that is produced by the system. Community net metering, more commonly known as group net metering, allows individuals within a community to construct a renewable energy project and distribute NEM credits to participants who are individual account holders. In group NEM, the group as a whole receives an itemized electricity bill from their local utility, and the individual participants decide how to divide the generation credits among themselves.8
Recent Developments in Vermont In 2014, the Vermont Legislature raised the net metering cap for each utility in Vermont from 4% to 15% of the utility’s peak load of the prior year. The peak load is the maximum amount of demand a utility has for electricity in a year.9 The 15% NEM cap was met in 2015, six years before what had been expected by the Vermont Legislature.10 Vermont’s largest utility company, Green Mountain Power, and other smaller utilities including Washington Electric Company, Hyde Park Electric Company, and Hardwick Electric Company have all reported being near or already meeting the 15% cap.11,12 Until the Public Service Board finalizes its new rule for NEM, several utilities are reducing their NEM
4 Jocelyn Durkay, "Net Metering: Policy Overview and State Legislature Updates.” 5 Jocelyn Durkay, "Net Metering: Policy Overview and State Legislature Updates.” 6 U.S. Department of Energy Solar Market Pathways Program, “Vermont Solar Deployment Plan,” Burlington VT: Vermont Energy Investment Corporation, 2015, accessed March 20, 2016, https://portal.veic.org/sunshot/SiteAssets/SitePages/Home/Net Metering and Focus Area Briefs.pdf. 7 Vermont League of City and Towns, “Template for Group Net Metering Agreements for Vermont Municipal and School District Solar Projects,” Montpelier, VT: Vermont League of Cities and Towns, 2015, accessed April, 12, 2016, http://vlct.org/assets/Resource/Models/2015-solar-group-net-metering-agreements-template.pdf. 8 Michael Dworkin, Dan Ingold, Ralph Meima, Carey Rosser, Jonathan Voegele and Mary Westervelt, "Vermont Group Net Metering Information and Guidelines," Vermont's Clean Energy Development Fund and Powersmith Farm, 2010, accessed March 15, 2016, http://www.vecan.net/wp-content/uploads/GNM-Information-Guidelines-r2-1.pdf. 9 State of Vermont Department of Public Service, “Net Metering.” 10 Ed Mcnamara, “Vermont Distributed Generation 2016-2025 Expectations,” Montpelier, VT: Vermont Department of Public Service, 2015, accessed April 12, 2016, http://www.iso-ne.com/static-assets/documents/2015/12/vermont_dgfwg_12082015.pdf 11 Distributed Generation Forecast Working Group, “Vermont Distributed Generation 2016-2025 Expectations,” Montpelier, VT: State of Vermont Department of Public Service, 2015, accessed March 22, 2016, http://www.iso-ne.com/static-assets/documents/2015/12/vermont_dgfwg_12082015.pdf. 12 State of Vermont Department of Public Service, “Net Metering.”
Page 3 of 22
programs, only accepting applications for systems less than 150 kW, which are except from the utility cap.13,14
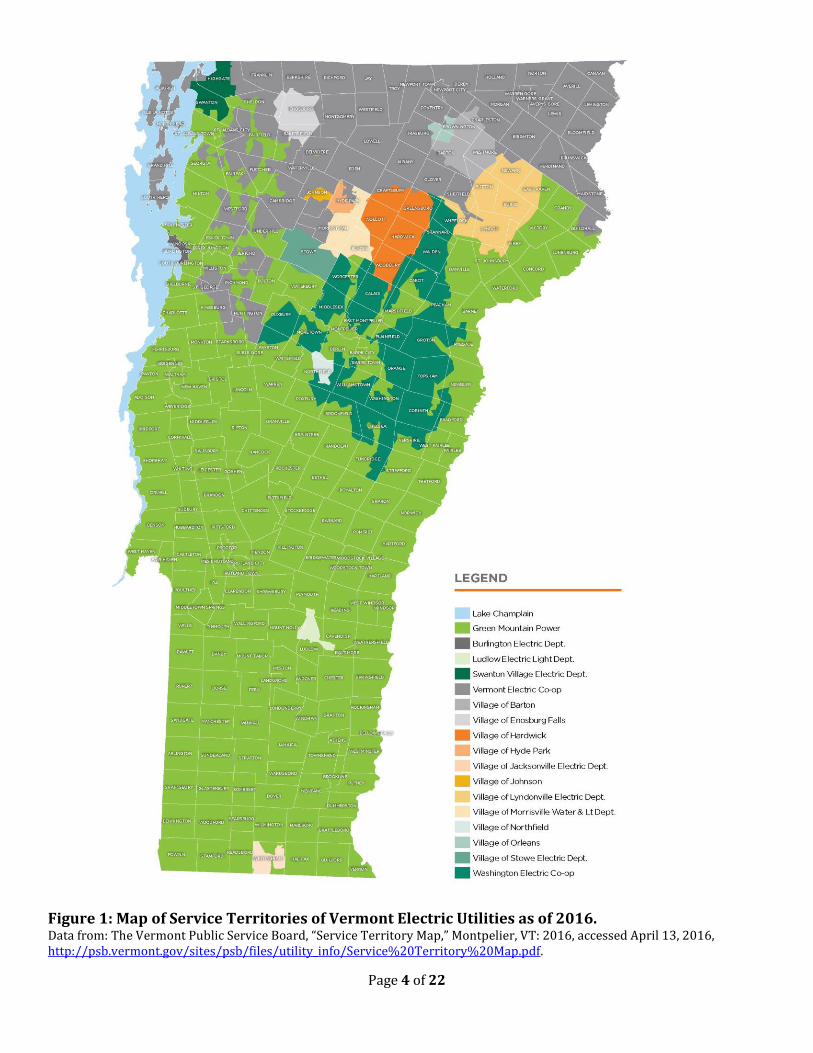
Vermont’s electricity is provided by sixteen municipal or cooperative utilities and one investor-owned distribution utility. Figure 1 shows the coverage of Vermont’s electric utilities. Vermont used 27.9% of its electricity from renewable sources in 2014 including: hydroelectric power, biomass, wind and solar. In 2014, hydroelectric accounted for 16.7% of renewable energy produced, biomass power accounted for 6.4%, wind accounted for 4.4% and solar accounted for 0.4%.15 With the shutdown of Vermont Yankee Nuclear Power Plant in 2014, the State lost 55% of its electrical generating capacity.16 In 2015, renewable sources accounted for 99.9% of the total electricity generated in Vermont; 65.7% was hydroelectricity and 34.2% were other renewable sources including solar, wind and biomass.17 Act 99 (H.702), amended in 2014, outlines the rules and regulations for NEM in Vermont. In April 2016, the Vermont Public Service Board drafted a new proposal for Vermont’s NEM system, which is to be updated by 2017. The proposal would utilize price to encourage siting of renewable energy systems in developed settings such as “roofs, parking lots, landfills, and gravel pits and on town-preferred sites.”18 Currently all solar photovoltaic (PV) systems over 15 kW are priced identically regardless of location.19
13 Kristin Carlson, “Green Mountain Power Proposes Strategic Extension of Net Metering for Vermont Homeowners & Businesses,” Colchester, VT: Green Mountain Power, 2015, accessed April 25, 2016, http://news.greenmountainpower.com/manual-releases/Green-Mountain-Power-Proposes-Strategic-Extension-?feed=d51ec270-a483-4f6c-a55e-8e5fbe2238c2. 14 Vermont Electric Cooperative, “Statement about VEC's Net Metering Program,” Johnson, VT: Vermont Electric Cooperative, 2015, accessed April 25, 2016, http://www.vermontelectric.coop/important-notices/611-statement-about-vecs-net-metering-program. 15 U.S. Energy Information Administration, “Net Generation by State” Washington DC: U.S. Energy Information Administration, 2014, accessed April 16, 2016, https://www.eia.gov/electricity/data/state/. 16 U.S. Energy Information Administration, “Vermont State Profile and Energy Estimates,” Washington DC: U.S. Energy Information Administration, 2015, accessed March 22, 2016, http://www.eia.gov/state/?sid=VT#tabs-1. 17 U.S. Energy Information Administration, “Vermont State Profile and Energy Estimates.” 18 State of Vermont Public Service Board, “Vermont Public Service Board Proposes Changes to Net Metering,” Montpelier, VT: State of Vermont Public Service Board, 2016, accessed April 7, 2016, “http://psb.vermont.gov/sites/psb/files/Net%20Metering%20Press%20Release.pdf” 19 State of Vermont Public Service Board, “Vermont Public Service Board Proposes Changes to Net Metering.”
Page 4 of 22
Figure 1: Map of Service Territories of Vermont Electric Utilities as of 2016. Data from: The Vermont Public Service Board, “Service Territory Map,” Montpelier, VT: 2016, accessed April 13, 2016, http://psb.vermont.gov/sites/psb/files/utility_info/Service%20Territory%20Map.pdf.
Page 5 of 22
Vermont NEM Sectors
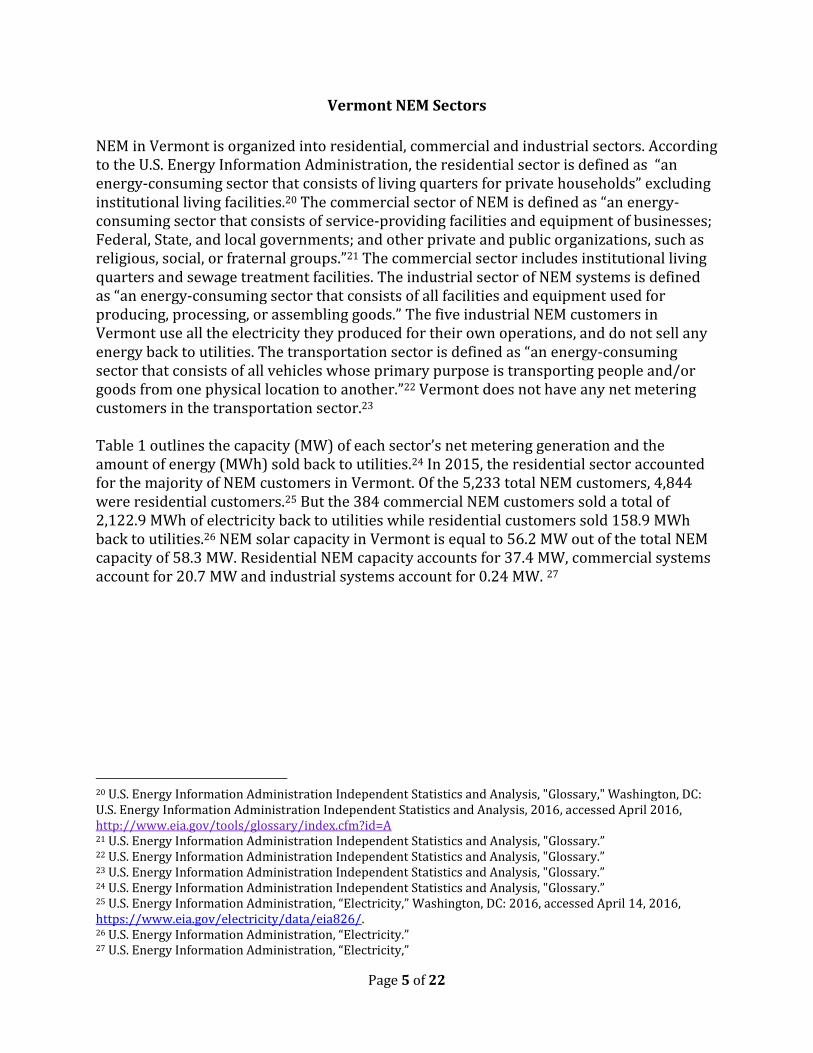
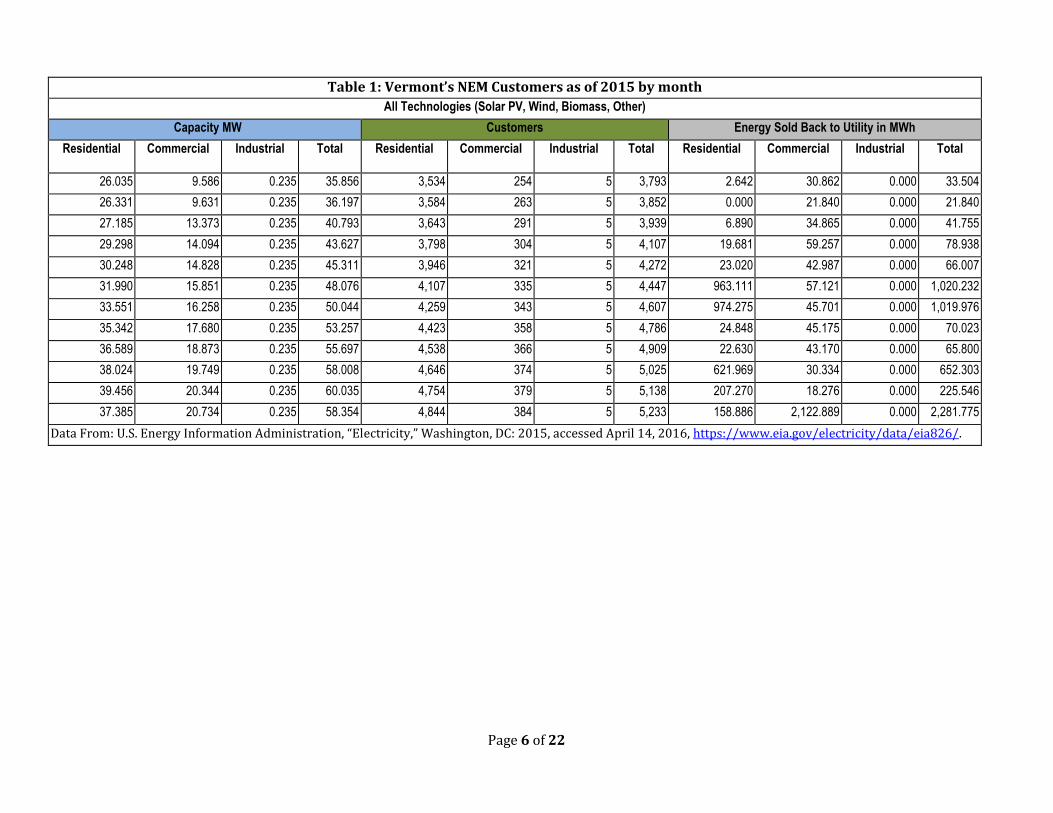
NEM in Vermont is organized into residential, commercial and industrial sectors. According to the U.S. Energy Information Administration, the residential sector is defined as “an energy-consuming sector that consists of living quarters for private households” excluding institutional living facilities.20 The commercial sector of NEM is defined as “an energy-consuming sector that consists of service-providing facilities and equipment of businesses; Federal, State, and local governments; and other private and public organizations, such as religious, social, or fraternal groups.”21 The commercial sector includes institutional living quarters and sewage treatment facilities. The industrial sector of NEM systems is defined as “an energy-consuming sector that consists of all facilities and equipment used for producing, processing, or assembling goods.” The five industrial NEM customers in Vermont use all the electricity they produced for their own operations, and do not sell any energy back to utilities. The transportation sector is defined as “an energy-consuming sector that consists of all vehicles whose primary purpose is transporting people and/or goods from one physical location to another.”22 Vermont does not have any net metering customers in the transportation sector.23 Table 1 outlines the capacity (MW) of each sector’s net metering generation and the amount of energy (MWh) sold back to utilities.24 In 2015, the residential sector accounted for the majority of NEM customers in Vermont. Of the 5,233 total NEM customers, 4,844 were residential customers.25 But the 384 commercial NEM customers sold a total of 2,122.9 MWh of electricity back to utilities while residential customers sold 158.9 MWh back to utilities.26 NEM solar capacity in Vermont is equal to 56.2 MW out of the total NEM capacity of 58.3 MW. Residential NEM capacity accounts for 37.4 MW, commercial systems account for 20.7 MW and industrial systems account for 0.24 MW. 27
20 U.S. Energy Information Administration Independent Statistics and Analysis, "Glossary," Washington, DC: U.S. Energy Information Administration Independent Statistics and Analysis, 2016, accessed April 2016, http://www.eia.gov/tools/glossary/index.cfm?id=A 21 U.S. Energy Information Administration Independent Statistics and Analysis, "Glossary.” 22 U.S. Energy Information Administration Independent Statistics and Analysis, "Glossary.” 23 U.S. Energy Information Administration Independent Statistics and Analysis, "Glossary.” 24 U.S. Energy Information Administration Independent Statistics and Analysis, "Glossary.” 25 U.S. Energy Information Administration, “Electricity,” Washington, DC: 2016, accessed April 14, 2016, https://www.eia.gov/electricity/data/eia826/. 26 U.S. Energy Information Administration, “Electricity.” 27 U.S. Energy Information Administration, “Electricity,”
Page 6 of 22
Table 1: Vermont’s NEM Customers as of 2015 by month
All Technologies (Solar PV, Wind, Biomass, Other)
Capacity MW Customers Energy Sold Back to Utility in MWh
Residential Commercial Industrial Total Residential Commercial Industrial Total Residential Commercial Industrial Total
26.035 9.586 0.235 35.856 3,534 254 5 3,793 2.642 30.862 0.000 33.504
26.331 9.631 0.235 36.197 3,584 263 5 3,852 0.000 21.840 0.000 21.840
27.185 13.373 0.235 40.793 3,643 291 5 3,939 6.890 34.865 0.000 41.755
29.298 14.094 0.235 43.627 3,798 304 5 4,107 19.681 59.257 0.000 78.938
30.248 14.828 0.235 45.311 3,946 321 5 4,272 23.020 42.987 0.000 66.007
31.990 15.851 0.235 48.076 4,107 335 5 4,447 963.111 57.121 0.000 1,020.232
33.551 16.258 0.235 50.044 4,259 343 5 4,607 974.275 45.701 0.000 1,019.976
35.342 17.680 0.235 53.257 4,423 358 5 4,786 24.848 45.175 0.000 70.023
36.589 18.873 0.235 55.697 4,538 366 5 4,909 22.630 43.170 0.000 65.800
38.024 19.749 0.235 58.008 4,646 374 5 5,025 621.969 30.334 0.000 652.303
39.456 20.344 0.235 60.035 4,754 379 5 5,138 207.270 18.276 0.000 225.546
37.385 20.734 0.235 58.354 4,844 384 5 5,233 158.886 2,122.889 0.000 2,281.775
Data From: U.S. Energy Information Administration, “Electricity,” Washington, DC: 2015, accessed April 14, 2016, https://www.eia.gov/electricity/data/eia826/.

Page 7 of 22
Costs of Net Metering State data available regarding the average costs of biomass, wind, hydroelectric and solar PV residential small-scale renewable energy systems is limited. Nationally, small-scale biomass electric plants have a mean installment price of $5,792/kWh capacity.28 Solar and wind energy installment become more cost effective as generation capacity increases. A wind grid-connected system generally 1-10 kW in size has a mean cost of $7,645 /kWh in capacity, while a system ranging from 10-100 kW in size has a mean cost of $6,118 /kWh capacity.29 A solar PV system ranging from 1-10 kW in size has a mean cost of $3,897 /kWh in capacity, while a system ranging from 10-100 kW in size has a mean cost of $3,463 /kWh in capacity.30 The National Renewable Energy Laboratory updated this information (shown below) in February 2016.31
$0
$1,000
$2,000
$3,000
$4,000
$5,000
$6,000
$7,000
$8,000
$9,000
PV<10kW PV10–100kW Wind<10kW Wind10–100kW
MeanInstalledCost($/kWh)
Figure 2: Average installation cost for solar and wind systems of varying capacities Data From: National Renewable Energy Laboratory, “Distributed Generation Renewable Energy Estimate of Costs,” Washington, DC: U.S. Department of Energy, 2016, accessed April 5, 2016, http://www.nrel.gov/analysis/tech_lcoe_re_cost_est.html.
Renewable Energy Credits (RECs)
In addition to electricity, renewable energy generation also produces a bundle of environmental benefits, such as avoided mercury, carbon dioxide, and other environmentally harmful emissions.32 These benefits can be packaged into renewable
28 National Renewable Energy Laboratory, “Distributed Generation Renewable Energy Estimate of Costs,” Washington, DC: U.S. Department of Energy, 2016, accessed April 5, 2016, http://www.nrel.gov/analysis/tech_lcoe_re_cost_est.html. 29 National Renewable Energy Laboratory, “Distributed Generation Renewable Energy Estimate of Costs.” 30 National Renewable Energy Laboratory, “Distributed Generation Renewable Energy Estimate of Costs.” 31 National Renewable Energy Laboratory, “Distributed Generation Renewable Energy Estimate of Costs.” 32 U.S. Department of Energy, “A Guide to Community Shared Solar,” Washington, DC: U.S. Department of Energy, 2012, accessed April 5, 2016, http://www.nrel.gov/docs/fy12osti/54570.pdf.

Page 8 of 22
energy credits (RECs) and sold separately from the produced electricity.33 Each State must recognize RECs as a tradable environmental attributes, currently 36 states and territories recognize RECs.34 At the federal level, RECs are recognized as tradable attributes by the Department of Energy’s Federal Management Energy Program.35 RECs are a method used to “label” and differentiate energy generated by renewable sources from conventional/non-renewable energy.36 One REC certificate represents one megawatt-hour of renewable energy. This allows for the environmental benefits associated with renewable generation to be carried with the energy even after being blended with conventional energy by utility companies.37 RECs can be included with the electricity they represent (bundled) or sold separately (unbundled).38 With bundled RECs, the electricity customer receives both the electricity and related RECs. Under this arrangement, the consumer is utilizing renewable energy and retires the associated RECs on consumption. When RECs are unbundled from electricity, one consumer can purchase the electricity (now classified as non-renewable) and another customer can purchase the remaining RECs.39 These RECs can be used by the customer to foster a “green” public image or to help them comply with a mandatory renewable standard.40 Renewable Portfolio Standards (RPSs) are regulatory requirements, created by a legislature other state regulator, that force a utility to purchase a certain percentage of its energy from qualifying renewable sources by a certain date.41 In New England, RECs are monitored by the New England Power Pool Generation Information System (GIS).42 GIS creates, tracks and retires RECs to ensure that they are accounted for and used correctly.43
33 U.S. Department of Energy, “A Guide to Community Shared Solar.” 34 Todd Jones, Robin Quarrier and Maya Kelty, “The Legal Basis for Renewable Energy Certificates,” San Francisco, CA: Center for Resource Solutions, 2015, accessed April 25, 2016, http://resource-solutions.org/site/wp-content/uploads/2015/07/The-Legal-Basis-for-RECs.pdf. 35 Todd Jones, Robin Quarrier and Maya Kelty, “The Legal Basis for Renewable Energy Certificates.” 36 Gregg Freeman, Heather Huebner and Aaron Kelly, “An Analysis of Renewable Energy Credits in Vermont,” South Royalton, VT: Vermont Law School Institute for Energy and Environment, 2016, accessed April 5, 2016, http://www-assets.vermontlaw.edu/Assets/iee/VLS%20Energy%20Cinic%20Report%20on%20RECs%20Final%20for%20SNRE.pdf. 37 Freeman, Huebner and Kelly “An Analysis of Renewable Energy Credits in Vermont.” 38 U.S. Environmental Protection Agency (EPA), U.S Department of Energy (DOE), the World Resources Institute and the Center for Resource Solutions, “Guide to Purchasing Green Power,” Washington DC: U.S Environmental Protection Agency, 2010, accessed April 8, 2016, https://www.epa.gov/sites/production/files/2016-01/documents/purchasing_guide_for_web.pdf. 39 EPA, DOE, World Resources Institute and the Center for Resource Solutions, “Guide to Purchasing Green Power.” 40 EPA, DOE, World Resources Institute and the Center for Resource Solutions, “Guide to Purchasing Green Power.” 41 Environmental Tracking Network of North America, “The Intersection Between Carbon, RECs, and Tracking: Accounting and Tracking the Carbon Attributes of Renewable Energy,” San Francisco, CA: Environmental Tracking Network of North America, 2010, accessed April 5, 2016, http://etnna.org/images/PDFs/Intersection%20btwn%20Carbon%20RECs%20and%20Tracking.pdf. 42 New England Power Pool Generation Information System, “NEPOOL GIS System,” San Jose, CA: New England Power Pool Generation Information System, 2014, accessed April 5, 2016, http://www.nepoolgis.com/contact-us/. 43 New England Power Pool Generation Information System, “NEPOOL GIS System.”

Page 9 of 22
Under Vermont’s NEM laws, there are several options for how renewable energy generators can utilize their RECs. The most common option used by small scale NEM (under 100kW) is to keep the RECs bundled with the produced electricity. When the customers use the energy, they can also claim the environmental benefits, such as greenhouse gas (GHG) reduction associated with RECs.44 When NEM customers use and retire their own RECs, it increases the overall consumption of renewable energy statewide and contributes to GHG reduction initiatives.45 Another option for NEM generators is to sell their RECs to their utility company.46 This allows the generator to profit from the sale of RECs and the utility to insure that it is in compliance with the State’s renewable energy standard.47 Because the RECs and energy are unbundled, the generator cannot claim the environmental benefits associated with their energy production, as these benefits have been transferred to the utility.48 Instead, the energy used by a consumer is considered to be the part of the utility’s average fuel mix, which contains energy from conventional sources.49 When a utility purchases RECs to comply with a renewable energy standard, it increases both the utility’s and State’s renewable energy consumption.50 Act 56 sets the renewable energy standard for Vermont.51 NEM customers can also sell their RECs to buyers other than their own utility. These other buyers are typically out of state utilities attempting to comply with their own state’s renewable energy standard.
Power Purchase Agreements NEM agreements also known as Power Purchase Agreements (PPA) allow for a solar array’s owner to sell generated power and RECs to a 3rd party power consumer.52 Under these agreements the facility owner is granted permission to install and operate a solar system on the energy consumer's land.53 In return, the energy consumer is guaranteed 100% of the produced energy at a long-term, reduced rate.54 These programs are often utilized by towns or schools to obtain low-cost energy without having to raise the upfront
44 Green Power Network, “Community Renewable Energy,” Washington DC: Office of Energy Efficiency & Renewable Energy, 2015, accessed April 8, 2016, http://apps3.eere.energy.gov/greenpower/community_development/community_solar_faq.html. 45 Green Power Network, “On-site Renewable Energy,” Washington DC: Office of Energy Efficiency & Renewable Energy, 2014, accessed April 8, 2016, http://apps3.eere.energy.gov/greenpower/onsite/index.shtml. 46 Green Power Network, “Community Renewable Energy.” 47 Green Power Network, “Community Renewable Energy.” 48 U.S. Environmental Protection Agency, U.S Department of Energy, the World Resources Institute and the Center for Resource Solutions, “Guide to Purchasing Green Power.” 49 Green Power Network, “Community Renewable Energy.” 50 Green Power Network, “Community Renewable Energy.” 51 VT LEG #309802 v.1, Vermont State Legislature, “No. 56 An act relating to establishing a renewable energy standard,” H, 2015, accessed April 5, 2016, http://legislature.vermont.gov/assets/Documents/2016/Docs/ACTS/ACT056/ACT056%20As%20Enacted.pdf. 52 National Renewable Energy Laboratory, “Power Purchase Agreement Checklist for State and Local Governments,” Golden CO: U.S. Department of Energy, 2009, accessed April 7, 2016, http://www.nrel.gov/docs/fy10osti/46668.pdf. 53 National Renewable Energy Laboratory, “Power Purchase Agreement Checklist.” 54 National Renewable Energy Laboratory, “Power Purchase Agreement Checklist.”
Page 10 of 22
costs to construct the solar array.55 The owners of the solar system are often able to take advantage of tax credits that would not be available to tax-exempt organizations such as government agencies.56 Like other renewable generation, the energy generated by these arrays can be unbundled and the RECs can be sold separately.57 Depending on the contract between the owner and consumer, the RECs can be either be retained by the owner for sale to another party or sold with the energy to the consumer. If the consumers do not purchase the RECs with the energy then they cannot claim they are consuming renewable energy.58
Vermont Net Metering Incentives
Vermont has several programs offering tax credits, “buy-downs” including direct grants and rebates, and loan programs. These incentives are available for the following NEM technologies: “photovoltaic, wind turbines, anaerobic digestion of agricultural products, by-products or waste, biomass, and fuel cells (when fueled by renewable sources).”59 During the 2015 fiscal year the Clean Energy Development Fund (CEDF) allocated $5,458,310 to renewable energy projects.60 Table 2 shows the amounts allocated by grants and incentive programs to renewable electrical generation projects in 2015 by the CEDF. In June 2015, the Clean Energy Development Board approved changes to the allocation of funds from the CEDF. The Small-Scale Renewable Energy Incentive Program (SSREIP) was discontinued at the end of June 2015.61 As of FY16 the CEDF will continue funding for the Windham County Solar Finance Program, Community Solar Finance Program, and Interest Rate Buy-Down Funds including Residential Property Assessed Clean Energy “PACE” and NeighborWorks of Western Vermont.62 In addition to allocations for solar PV funding, the Food Waste Pilots Program will continue to be funded in 2016. This program allows for food waste collected by Casella Waste Management and Grow Compost to be converted to energy via the Vermont Technical College’s anaerobic digester facility.63
55 Vermont League of City and Towns, “Template for Group Net Metering Agreements.” 56 Vermont Energy and Climate Action Network (VECAN), “Going Solar,” Montpelier, VT: VECAN, 2016, accessed April, 14, 2016, http://www.vecan.net/power-purchase-agreements-group-net-metering/. 57 EPA, DOE, World Resources Institute and the Center for Resource Solutions, “Guide to Purchasing Green Power.” 58 Vermont League of City and Towns, “Template for Group Net Metering Agreements.” 59 State of Vermont Department of Public Service, “Net Metering.” 60 Vermont Clean Energy Development Fund Public Service Department, “Clean Energy Development Fund Annual Report to the Vermont Legislature,” Montpelier, VT: Vermont Clean Energy Development Fund Public Service Department, 2016, accessed March 27, 2016, http://publicservice.vermont.gov/sites/dps/files/documents/Renewable_Energy/CEDF/Reports/CEDF%20Annual%20Report_FY%202015.pdf. 61 Vermont Clean Energy Development Fund Public Service Department, “Clean Energy Development Fund Annual Report to the Vermont Legislature,” 62 Vermont Clean Energy Development Fund Public Service Department, “Clean Energy Development Fund Annual Report to the Vermont Legislature,” 63 Vermont Clean Energy Development Fund Public Service Department, “Clean Energy Development Fund Annual Report to the Vermont Legislature,”

Page 11 of 22
GRANTS Award
Recipient
Technology, Capacity or Type of
Activity
Funds
Awarded
Total Project
Cost Estimated
Upon Award
Estimated Annual
Energy Production
Franklin NE
Supervisory
Union
(Richford High
School)
• 54 kW Solar PV System $45,500 $130,000 52,623 kWh/yr
Shrewsbury
Mountain School
• 22.5 kW Solar PV System $31,250 $98,350 29,486 kWh/yr
Strafford Energy
LLC
• 55 kW Solar PV System $32,250 $238,500 76,000 kWh/yr
Thetford School
Board
• 120 kW Solar PV System $125,000 $470,000 170,000 kWh/yr
Town of
Waitsfield
• 85 kW Solar PV System $80,000 $306,609 102,106 kWh/yr
Town of Warren • 126 kW Solar PV System $80,000 $462,829 165,304 kWh/yr
Casella Waste
Management
• Food Waste Pilot $139,000 $179,500
Grow Compost • Food Waste Pilot $131,549 $172,349
VSECU • Windham Co. Solar Finance Program $300,000 $300,000
• Community Solar Finance Program $125,000 $125,000
NeighborWorks
of
Western
• Interest Rate Buy-Down Fund $255,167 $255,167
Vermont Energy
Investment Corp
• PACE Interest Rate Buy- Down Fund $200,000 $200,000
INCENTIVES Solar PV
SSREIP
Installations
1014 6,526 kW (AC) $1,755,123 $29,099,945 7971 MWh/yr
1014 Electric 6.99 MW (AC) $3,299,839 $32,038,249 Electric 8,566.5
MWh/yr
CEDF Awards for FY15
7971 MWh/yr
Solar PV
BIOMASS
FINANCE
PROGRAMS
TOTAL
Table 2: CEDF Allocated Resources to Renewable Energy Projects 2015 Data from: Vermont Clean Energy Development Fund Public Service Department, “Clean Energy Development Fund Annual Report to the Vermont Legislature,” Montpelier, VT: Vermont Clean Energy Development Fund Public Service Department, 2016, accessed March 27, 2016, http://publicservice.vermont.gov/sites/dps/files/documents/Renewable_Energy/CEDF/Reports/CEDF%20Annual%20Report_FY%202015.pdf.

Page 12 of 22
Vermont also offers a sales tax and property tax incentive for NEM systems. The Vermont Sales Tax Incentive originally introduced as part of the Miscellaneous Tax Reduction Act of 1999 (H.B. 0548) only applied to NEM systems, but now applies to systems up to 500 kilowatts (kW) in capacity that generate electricity using eligible renewable energy resources.64 “Renewable energy” resources as defined under 30 V.S.A § 8002 include “energy produced using a technology that relies on a resource that is being consumed at a harvest rate at or below its natural regeneration rate” or micro-combined heat and power (CHP) systems up to 20 kW. 65 Under this definition, solar PV, wind, biomass, anaerobic digestion and fuel cells using renewable fuels are eligible to qualify for the 100% of sales tax for purchase. In addition to the Vermont sales tax, there is a Vermont Investment Tax Credit. According to the Database of State Incentives for Renewables and Efficiency, the investment tax credit for Vermont is equal to 7.2% for solar, fuel cells and small wind placed in service on or before December 31, 2016 and 2.4% for geothermal and microturbines.66 Small wind includes systems up to 100 kW, fuel cells in systems .5 kW or greater and microturbines include systems 2 megawatts (MW) or less.67
The Vermont Uniform Capacity Tax offers a 100% property tax exemption for solar PV systems up to and including 50 kW. For systems greater than 50 kW, the state assesses a uniform $4.00 /kW property tax payment.68 The Vermont Solar Adder was introduced into the Vermont Energy Act of 2011 (H.56) creating a statewide solar customer benefit. It requires utilities to issue an additional credit on top of their base residential per kWh credit to customers to make a total of $0.20/kWh.69 A system under 15 kW in capacity receives a $0.20 adder sum per kWh, while systems over 15 kW receive $0.19/kWh.70 As well as statewide NEM incentives for solar PV, certain individual towns and utilities in Vermont offer incentives per kWh of electricity produced (see Table 4).
64 Database of State Incentives for Renewables and Efficiency, “Renewable Energy Systems Sales Tax Exemption,” Raleigh, NC: N.C. Clean Energy Technology Center, 2016, accessed March 27, 2016, http://programs.dsireusa.org/system/program/detail/44 65 VT LEG #298503 v.1, Vermont State Legislature, “No. 99 An act relating to self-generation and net metering,” H702, 2014, accessed March 31, 2016, http://legislature.vermont.gov/assets/Documents/2014/Docs/ACTS/ACT099/ACT099%20As%20Enacted.pdf. 66 Database of State Incentives for Renewables and Efficiency, “Investment Tax Credit” Raleigh, NC: N.C. Clean Energy Technology Center, 2016, accessed March 27, 2016, http://programs.dsireusa.org/system/program/detail/3428 67 Database of State Incentives for Renewables and Efficiency, “Investment Tax Credit.” 68 Database of State Incentives for Renewables and Efficiency, “Uniform Capacity Tax and Exemption for Solar” Raleigh, NC: N.C. Clean Energy Technology Center, 2016, accessed March 27, 2016, http://programs.dsireusa.org/system/program/detail/5209 69 Renewable Energy Vermont, "Vermont Solar Consumer Guide: Solar Photovoltaic.” 70 VT LEG #298503 v.1, Vermont State Legislature, “No. 99 An act relating to self-generation and net metering,” H702, 2014, accessed March 31, 2016, http://legislature.vermont.gov/assets/Documents/2014/Docs/ACTS/ACT099/ACT099%20As%20Enacted.pdf.
Page 13 of 22
Vermont Standard Offer Program
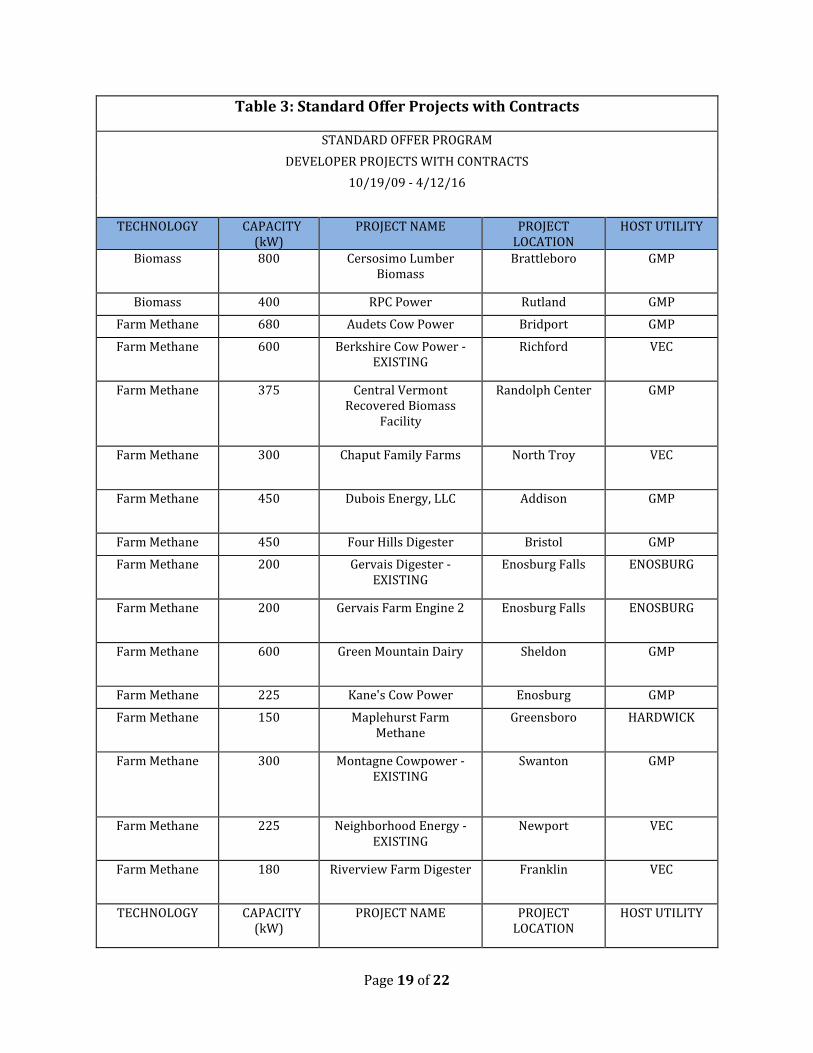
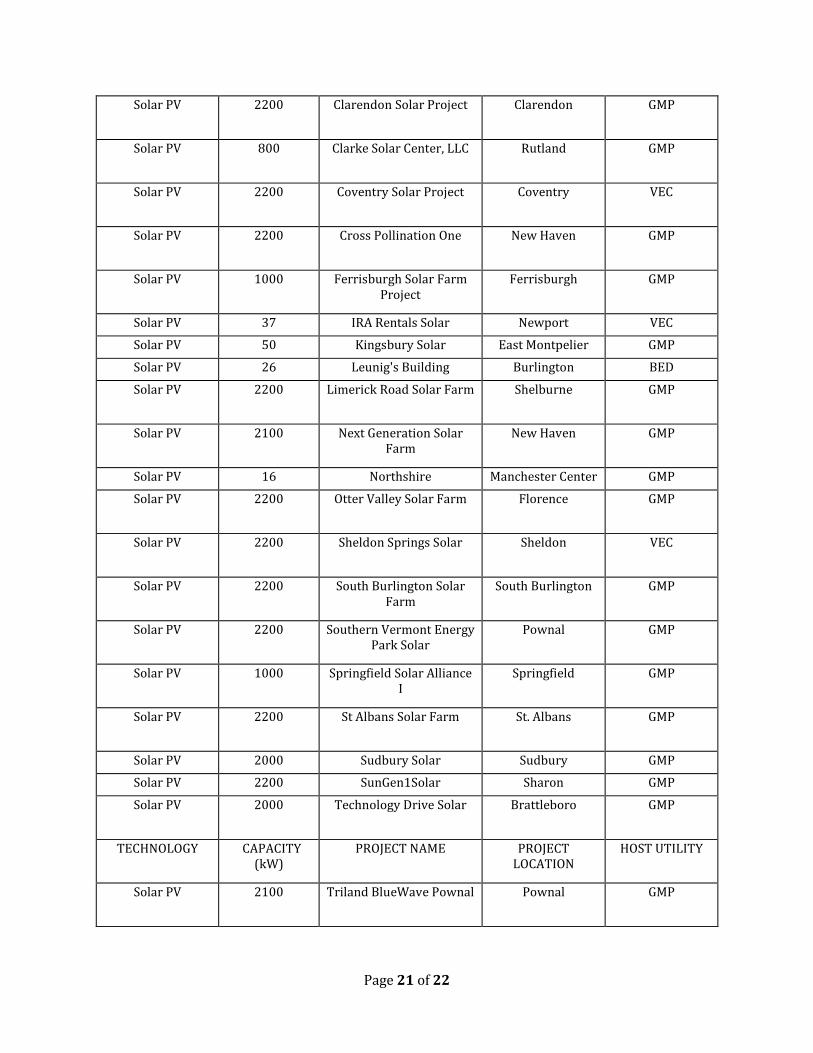
The Sustainably Priced Energy Enterprise Development (SPEED) Program was Vermont's alternative to a RPS program. However, “In 2015, Act 56 established a Renewable Energy Standard (RES), repealing the SPEED program except for the standard offer program. The RES established a goal of 55% renewable by 2017.”71 The Standard Offer Program is a feed-in tariff (FIT), designed to provide a reasonable return on investment to renewable energy facility developers in order to increase the development of renewable energy. The Standard Offer Program is available to solar PV, wind, biomass, hydroelectric, and anaerobic digestion. The minimum capacity per project is 150 kW and the maximum system capacity of 2.2 MW.72 In May 2012, Act 170 increased the program’s maximum capacity to 127.5 MW by 2022.73,74 The Standard Offer Program allows Vermont utilities to sell RECs to utilities and companies in other New England states though the GIS system.75 Out of state utilities and companies buy RECs to comply with their own RES. When RECs are sold out of state, the environmental benefits associated with them are also transferred out of state, therefore, Vermont’s conventional energy consumption increases. Under Act 56 (H.40), all RECs are required to be retired in Vermont with the exception of systems with Standard Offer Program contracts.76 Table 3 at the end of this report shows the current Standard Offer Projects with contacts in Vermont.
71 U.S. Energy Information Administration, “Hawaii and Vermont Set High Renewable Portfolio Standard Targets,” Washington, DC: U.S. Energy Information Administration, 2015, accessed March 31, 2016, http://www.eia.gov/todayinenergy/detail.cfm?id=21852 72 Vermont Electric Power Producers, “Renewable Energy Credits (RECs),” Manchester, VT: Vermont Electric Power Producers, 2016, accessed April 14, 2016, http://www.vermontstandardoffer.com/recs/. 73 VT LEG #309802 v.1, Vermont State Legislature, “No. 56 An act relating to establishing a renewable energy standard.” 74 VT LEG 281076.1, Vermont State Legislature, “No. 170 An act relating to the Vermont energy act of 2012,” H, 2012, accessed April 5, 2016, http://www.leg.state.vt.us/docs/2012/Acts/ACT170.pdf. 75 Vermont Electric Power Producers, “Renewable Energy Credits (RECs).” 76 VT LEG #309802 v.1, Vermont State Legislature, “No. 56 An act relating to establishing a renewable energy standard.”

Page 14 of 22
Table 4: Vermont Utility Net-Metering Incentives
Utility Solar Non-Solar
Capacity (residential, commercial, industrial, transportation)
City of Burlington Electric77
$0.052265
X Total Capacity .833 MW
Green Mountain Power78
$0.053 (less than 15 kW) $0.043 (greater than 15
kW)
X Total Capacity 25.309 MW
Town of Hardwick Electric Company79
$0.02115 (less than 15 kW) $0.01115 (greater than 15
kW)
X Residential Capacity .242 MW
Town of Stowe80 $0.1564 X Commercial .255 MW
Village of Morrisville81 $0.04642/kWh (less than 15 kW)
$0.03642/kWh (greater than 15 kW)
X Residential and Commercial .216 MW
Village of Swanton82,83 Commercial $0.08184/kWh Residential 15 kW or under
$0.08072/kWh Residential 15 kW or over
$0.07072
X Commercial .056 MW
Residential any kW size system
Vermont Electric Cooperative, Inc84
$0.0238/kWh X Residential and Commercial 3.162 MW
Washington Electric Coop85
$0.0957 X Residential and Commercial 1.473 MW
77 City of Burlington Electric Department, “Net Metering,” Burlington, VT: City of Burlington Electric Department, accessed March 29, 2016, https://www.burlingtonelectric.com/my-home/my-bill/net-metering-0 78 Database of State Incentives for Renewables and Efficiency, “GMP Solar Power” Raleigh, NC: N.C. Clean Energy Technology Center, 2016, accessed March 27, 2016, http://programs.dsireusa.org/system/program/detail/3015 79 Town of Hardwick Electric Department, “Net Metering,” Hardwick, VT: Town of Hardwick Electric Department, 2014, accessed March 29, 2016, http://www.hardwickelectric.com/images/pdf/hardwick_nm-1_050814-clean.pdf 80 Stowe Town Electric Department, “Stowe Electric Department Small Commercial Rate 20,” Stowe, VT: Stowe Town Electric Department, 2015, accessed April 14, 2016, http://www.stoweelectric.com/images/rates/FINAL_-_20_-_Small_Comm._-_CLEAN.pdf. 81 Village of Morrisville Water and Light Department, “Net Metering,” Morrisville, VT, 2014, accessed April 14, 2016, http://www.mwlvt.com/Net%20Metering%20Tariff.pdf. 82 Swanton Village Electric Department, “Industrial and Large Commercial Service,” Swanton, VT: Swanton Village Electric Department, 2014, accessed April 14, 2016, http://www.swanton.net/publicworks/wp-content/uploads/Industrial-sched-D.pdf. 83 Swanton Village Electric Department, “Net Metering,” Swanton, VT: Swanton Village Electric Department, 2014, accessed April 14, 2016, http://www.swanton.net/publicworks/wp-content/uploads/Net-Metering.pdf. 84 Vermont Electric Cooperative, “Net Metering Information and FAQ,” Johnson, VT: 2013, accessed April 14, 2016, http://www.vermontelectric.coop/programs-services/renewable-energy/net-metering#incentives. 85 Patty Richards, “Washington Electric Cooperative Net Metering Program,” Montpelier, VT: Vermont Public Service Board, 2015, accessed April 16, 2016,
Page 15 of 22
Federal Net Metering Incentives The U.S. Department of Agriculture’s Rural Energy for America Program (REAP) provides financial assistance to agricultural and small-businesses with renewable energy systems. The Renewable Energy Systems and Energy Efficiency Improvement Guaranteed Loan and Grant Program distributed by REAP is available for wind, solar, biomass, and geothermal.86 The grant is for up to 25% of total eligible project costs; the guaranteed load and the combined grant and loan funding is available up to 75% of total eligible project costs.87 The Modified Accelerated Cost-Recovery System (MACRS) is a federal corporate depreciation. It allows businesses to recover some investments through certain property depreciation deductions.88 “The Consolidated Appropriations Act, signed in December 2015, extended the "placed in service" deadline for bonus depreciation. Equipment placed in service before January 1, 2018 can qualify for 50% bonus depreciation. Equipment placed in service during 2018 can qualify for 40% bonus depreciation, and equipment placed in service during 2019 can qualify for 30% bonus depreciation.”89 MACRS is available for properties with solar, fuel cells, geothermal, and small wind (up to 100 kW).90
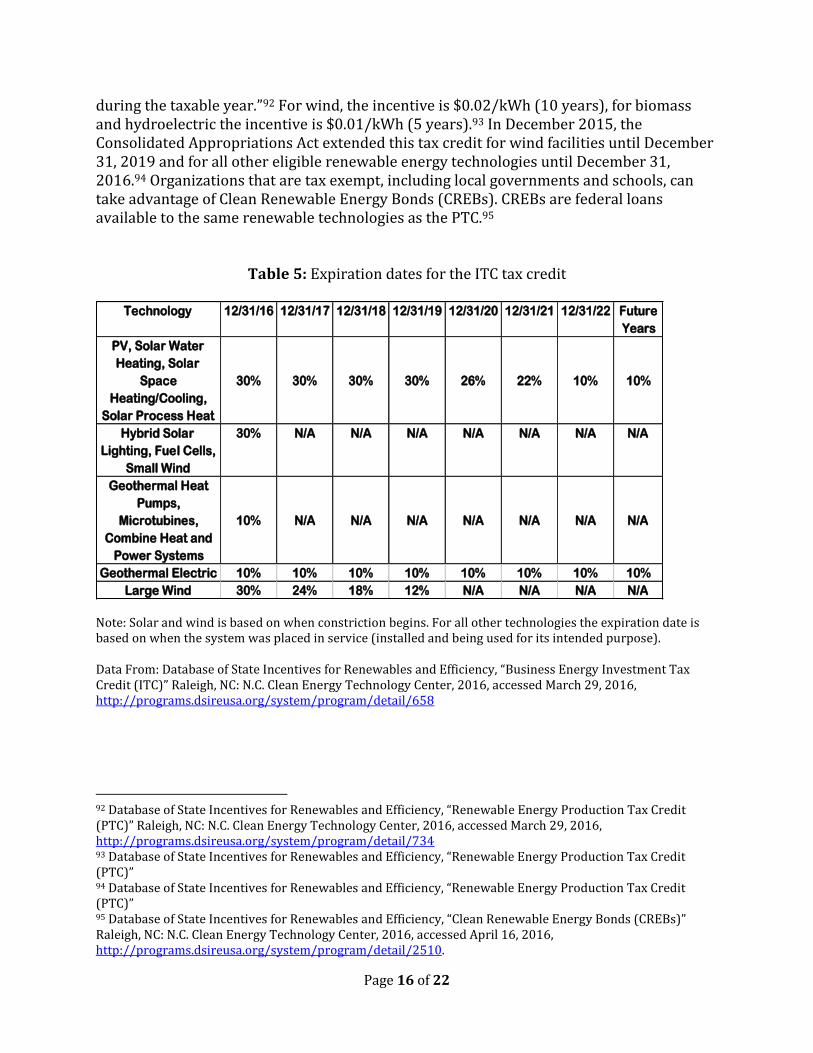
The Business Energy Investment Tax Credit (ITC) is a federal tax credit available to all sectors of net metering. The tax credit amount is equal to 30% for solar and small wind with no maximum credit, 30% for fuel cells capped at $1,500 per 0.5 kW and 10% for geothermal and microturbines capped at $200 per kW of capacity.91 Table 5 shows tax credit amounts by year. Eligible systems of the ITC tax include small wind turbines up to 100 kW in capacity and microturbine systems 2 MW or less. As of January 1st 2015, wind energy systems are only eligible to claim the ITC in lieu of the Production Tax Credit (PTC). The PTC “is an inflation-adjusted per-kilowatt-hour (kWh) tax credit for electricity generated by qualified energy resources and sold by the taxpayer to an unrelated person
http://psb.vermont.gov/sites/psb/files/WEC%20Net%20Metering%20PSB%20Workshop%203-19-2015.pdf. 86 United States Department of Agriculture Rural Development, “Rural Energy for America Program Renewable Energy Systems and Energy Efficiency Improvement Loans and Grants,” Washington, DC: United States Department of Agriculture Rural Development, 2015, accessed March 31, 2016, http://www.rd.usda.gov/programs-services/rural-energy-america-program-renewable-energy-systems-energy-efficiency. 87 United States Department of Agriculture Rural Development, “Rural Energy for America Program.” 88 Database of State Incentives for Renewables and Efficiency, “Modified Accelerated Cost-Recovery System (MACRS)” Raleigh, NC: N.C. Clean Energy Technology Center, 2016, accessed March 31, 2016, http://programs.dsireusa.org/system/program/detail/676 89 Database of State Incentives for Renewables and Efficiency, “Modified Accelerated Cost-Recovery System (MACRS).” 90 Database of State Incentives for Renewables and Efficiency, “Modified Accelerated Cost-Recovery System (MACRS).” 91 Database of State Incentives for Renewables and Efficiency, “Business Energy Investment Tax Credit (ITC)” Raleigh, NC: N.C. Clean Energy Technology Center, 2016, accessed March 29, 2016, http://programs.dsireusa.org/system/program/detail/658
Page 16 of 22
during the taxable year.”92 For wind, the incentive is $0.02/kWh (10 years), for biomass and hydroelectric the incentive is $0.01/kWh (5 years).93 In December 2015, the Consolidated Appropriations Act extended this tax credit for wind facilities until December 31, 2019 and for all other eligible renewable energy technologies until December 31, 2016.94 Organizations that are tax exempt, including local governments and schools, can take advantage of Clean Renewable Energy Bonds (CREBs). CREBs are federal loans available to the same renewable technologies as the PTC.95
Table 5: Expiration dates for the ITC tax credit
Note: Solar and wind is based on when constriction begins. For all other technologies the expiration date is based on when the system was placed in service (installed and being used for its intended purpose). Data From: Database of State Incentives for Renewables and Efficiency, “Business Energy Investment Tax Credit (ITC)” Raleigh, NC: N.C. Clean Energy Technology Center, 2016, accessed March 29, 2016, http://programs.dsireusa.org/system/program/detail/658
92 Database of State Incentives for Renewables and Efficiency, “Renewable Energy Production Tax Credit (PTC)” Raleigh, NC: N.C. Clean Energy Technology Center, 2016, accessed March 29, 2016, http://programs.dsireusa.org/system/program/detail/734 93 Database of State Incentives for Renewables and Efficiency, “Renewable Energy Production Tax Credit (PTC)” 94 Database of State Incentives for Renewables and Efficiency, “Renewable Energy Production Tax Credit (PTC)” 95 Database of State Incentives for Renewables and Efficiency, “Clean Renewable Energy Bonds (CREBs)” Raleigh, NC: N.C. Clean Energy Technology Center, 2016, accessed April 16, 2016, http://programs.dsireusa.org/system/program/detail/2510.
Technology 12/31/16 12/31/17 12/31/18 12/31/19 12/31/20 12/31/21 12/31/22 Future
Years
PV, Solar Water
Heating, Solar
Space
Heating/Cooling,
Solar Process Heat
30% 30% 30% 30% 26% 22% 10% 10%
Hybrid Solar
Lighting, Fuel Cells,
Small Wind
30% N/A N/A N/A N/A N/A N/A N/A
Geothermal Heat
Pumps,
Microtubines,
Combine Heat and
Power Systems
10% N/A N/A N/A N/A N/A N/A N/A
Geothermal Electric 10% 10% 10% 10% 10% 10% 10% 10%
Large Wind 30% 24% 18% 12% N/A N/A N/A N/A
Page 17 of 22
Conclusion The NEM program in Vermont is rapidly expanding. The majority of growth has occurred in the residential sector. Additionally, solar PV continues to grow at the fastest pace of all NEM renewable energy system types. Under the new NEM guidelines currently under review by the Vermont Public Service Board, RECs will be required to be retired in state with the exception of current Standard Offer Program contracts. Currently the majority of incentives are geared toward solar NEM at both the state and federal level. Furthermore, collaborations between private and public sectors such as PPAs allow for further savings though “combining” incentives available to each individual sector. Additionally as the State’ largest utilities reach the NEM cap, it is likely that new project development will slow as NEM programs are scaled back. 96,97
Glossary Anaerobic digestion: Decomposition in the absence of oxygen, as in an anaerobic lagoon or digester, which produces CO2 and CH4.98 Biomass: Organic non-fossil material of biological origin constituting a renewable energy source.99 Conventional energy: electricity generated from non-renewable sources such as coal, oil, natural gas, and nuclear.100 Kilowatt (kW): One thousand watts.101 Kilowatthour (kWh): A measure of electricity defined as a unit of work or energy, measured as 1 kilowatt (1,000watts) of power expended for 1 hour.102 Megawatt (MW): One million watts of electricity.103
96 Kristin Carlson, “Green Mountain Power Proposes Strategic Extension of Net Metering for Vermont Homeowners & Businesses,” Colchester, VT: Green Mountain Power, 2015, accessed April 25, 2016, http://news.greenmountainpower.com/manual-releases/Green-Mountain-Power-Proposes-Strategic-Extension-?feed=d51ec270-a483-4f6c-a55e-8e5fbe2238c2. 97 Vermont Electric Cooperative, “Statement about VEC's Net Metering Program,” Johnson, VT: Vermont Electric Cooperative, 2015, accessed April 25, 2016, http://www.vermontelectric.coop/important-notices/611-statement-about-vecs-net-metering-program. 98 U.S. Energy Information Administration, “Glossary,” Washington DC: U.S. Energy Information Administration, 2016, accessed April 16, 2016, http://www.eia.gov/tools/glossary/. 99 U.S. Energy Information Administration, “Glossary.” 100 EPA, DOE, World Resources Institute and the Center for Resource Solutions, “Guide to Purchasing Green Power.” 101 U.S. Energy Information Administration, “Glossary.” 102 U.S. Energy Information Administration, “Glossary.” 103 U.S. Energy Information Administration, “Glossary.”

Page 18 of 22
Megawatthour (MWh): One thousand kilowatt-hours or 1million watt-hours.104 Renewable Energy Credit (REC): a market-based instrument that represents the property rights to the environmental, social and other non-power attributes of renewable electricity generation. RECs are issued when one megawatt-hour (MWh) of electricity is generated and delivered to the electricity grid from a renewable energy resource.105 _____________________________________________ This report was completed on April 26, 2016 by Frances Workman, Christopher Thomas and Jackson Berman under the supervision of Professors Jack Gierzynski, Robert Bartlett and Eileen Burgin in response to a request from Senator Bray and Senator Rogers. Contact: Professor Anthony Gierzynski, 517 Old Mill, The University of Vermont, Burlington, VT 05405, phone 802-656-7973, email [email protected]. Disclaimer: This report has been compiled by undergraduate students at the University of Vermont under the supervision of Professor Anthony Jack Gierzynski, Professor Robert Bartlett and Professor Eileen Burgin. The material contained in the report does not reflect the official policy of the University of Vermont.
104 U.S. Energy Information Administration, “Glossary.” 105 U.S. Environmental Protection Agency, “Renewable Energy Certificates (RECs),” Washington DC: U.S. Environmental Protection Agency, 2016, accessed April 16, 2016, https://www.epa.gov/greenpower/renewable-energy-certificates-recs.
Page 19 of 22
Table 3: Standard Offer Projects with Contracts
STANDARD OFFER PROGRAM
DEVELOPER PROJECTS WITH CONTRACTS
10/19/09 - 4/12/16
TECHNOLOGY CAPACITY (kW)
PROJECT NAME PROJECT LOCATION
HOST UTILITY
Biomass 800 Cersosimo Lumber Biomass
Brattleboro GMP
Biomass 400 RPC Power Rutland GMP
Farm Methane 680 Audets Cow Power Bridport GMP
Farm Methane 600 Berkshire Cow Power - EXISTING
Richford VEC
Farm Methane 375 Central Vermont Recovered Biomass
Facility
Randolph Center GMP
Farm Methane 300 Chaput Family Farms North Troy VEC
Farm Methane 450 Dubois Energy, LLC Addison GMP
Farm Methane 450 Four Hills Digester Bristol GMP
Farm Methane 200 Gervais Digester - EXISTING
Enosburg Falls ENOSBURG
Farm Methane 200 Gervais Farm Engine 2 Enosburg Falls ENOSBURG
Farm Methane 600 Green Mountain Dairy Sheldon GMP
Farm Methane 225 Kane's Cow Power Enosburg GMP
Farm Methane 150 Maplehurst Farm Methane
Greensboro HARDWICK
Farm Methane 300 Montagne Cowpower - EXISTING
Swanton GMP
Farm Methane 225 Neighborhood Energy - EXISTING
Newport VEC
Farm Methane 180 Riverview Farm Digester Franklin VEC
TECHNOLOGY CAPACITY (kW)
PROJECT NAME PROJECT LOCATION
HOST UTILITY

Page 20 of 22
Farm Methane 450 Westminster Energy Group - EXISTING
Westminster GMP
Hydroelectric 2200 Ball Mountain Hydroelectric Project
Jamaica GMP
Hydroelectric 150 Factory Falls Springfield GMP
Hydroelectric 138 North Hartland Hartland GMP
Hydroelectric 960 Townshend Dam Hydroelectric
Townshend GMP
Hydroelectric 816 Troy Hydro Project Troy VEC
Hydroelectric 675 West Charleston Hydro West Charleston VEC
Landfill Methane 560 BCH Landfill Gas to Energy
Brattleboro GMP
Solar PV 50 100 Bobbin Mill Road Newport VEC
Solar PV 32 Advance Transit Building Expansion
White River Junction
GMP.
Solar PV 2000 Apple Hill Solar Project Bennington GMP
Solar PV 1800 Barton Solar Farm Barton VEC
Solar PV 2000 Bridport West Solar Farm Bridport GMP
Solar PV 100 Butternut Mountain Farm Solar
Morrisville MORRISVILLE
Solar PV 2000 Champlain Valley Solar Farm
Middlebury GMP
Solar PV 2200 Charlotte Hinesburg Rd Project
Charlotte GMP
Solar PV 2000 Chelsea Solar Project Bennington GMP
Solar PV 2200 Chester Solar Farm Chester GMP
TECHNOLOGY CAPACITY (kW)
PROJECT NAME PROJECT LOCATION
HOST UTILITY
Solar PV 2200 Claire Solar Farm South Burlington GMP
Page 21 of 22
Solar PV 2200 Clarendon Solar Project Clarendon GMP
Solar PV 800 Clarke Solar Center, LLC Rutland GMP
Solar PV 2200 Coventry Solar Project Coventry VEC
Solar PV 2200 Cross Pollination One New Haven GMP
Solar PV 1000 Ferrisburgh Solar Farm Project
Ferrisburgh GMP
Solar PV 37 IRA Rentals Solar Newport VEC
Solar PV 50 Kingsbury Solar East Montpelier GMP
Solar PV 26 Leunig's Building Burlington BED
Solar PV 2200 Limerick Road Solar Farm Shelburne GMP
Solar PV 2100 Next Generation Solar Farm
New Haven GMP
Solar PV 16 Northshire Manchester Center GMP
Solar PV 2200 Otter Valley Solar Farm Florence GMP
Solar PV 2200 Sheldon Springs Solar Sheldon VEC
Solar PV 2200 South Burlington Solar Farm
South Burlington GMP
Solar PV 2200 Southern Vermont Energy Park Solar
Pownal GMP
Solar PV 1000 Springfield Solar Alliance I
Springfield GMP
Solar PV 2200 St Albans Solar Farm St. Albans GMP
Solar PV 2000 Sudbury Solar Sudbury GMP
Solar PV 2200 SunGen1Solar Sharon GMP
Solar PV 2000 Technology Drive Solar Brattleboro GMP
TECHNOLOGY CAPACITY (kW)
PROJECT NAME PROJECT LOCATION
HOST UTILITY
Solar PV 2100 Triland BlueWave Pownal Pownal GMP

Page 22 of 22
Solar PV 2100 Triland BlueWave Williamstown
Williamstown WEC
Solar PV 2200 Whitcomb Farm Solar Essex Junction GMP
Solar PV 2200 White River Junction Solar Farm
Hartford GMP
Solar PV 2000 Williamstown Solar Project
Williamstown WEC
Small Wind 100 Highgate Wind 1 Project Highgate Center VEC
Small Wind 100 Highgate Wind 2 Project Highgate Center VEC
Small Wind 100 Highgate Wind 3 Project Highgate Center VEC
Small Wind 100 Highgate Wind 4 Project Highgate Center VEC
Small Wind 24 Baily Hill Wind Readsboro GMP
Small Wind 96 Hedgehog Hill Wind B Mount Holly GMP
UTILITY PROJECTS WITH CONTRACTS
Solar PV 485 Lyndonville Solar 1 Lyndonville LED
Solar PV 500 Lyndonville Solar 2 Lyndonville LED
Data from: Vermont Electric Power Producers, “Standard Offer Projects with Contracts,” Manchester Center, VT: Vermont Electric Power Producers, 2016, accessed April 16, 2016, http://vermontspeed.squarespace.com/storage/projects-with-contracts/STANDARD%20OFFER%20PROJECTS%20WITH%20CONTRACTS%204-12-16.xlsx.