the variability of motor evoked potential latencies in ... · dred brain tumor patients underwent...
TRANSCRIPT

Sollmann et al. BMC Neurosci (2017) 18:5 DOI 10.1186/s12868-016-0321-4
RESEARCH ARTICLE
The variability of motor evoked potential latencies in neurosurgical motor mapping by preoperative navigated transcranial magnetic stimulationNico Sollmann1,2, Lucia Bulubas1,2, Noriko Tanigawa3, Claus Zimmer2,4, Bernhard Meyer1 and Sandro M. Krieg1,2*
Abstract
Background: Recording of motor evoked potentials (MEPs) is used during navigated transcranial magnetic stimula-tion (nTMS) motor mapping to locate motor function in the human brain. However, factors potentially underlying MEP latency variability in neurosurgical motor mapping are vastly unknown. In the context of this study, one hun-dred brain tumor patients underwent preoperative nTMS-based motor mapping of the tumor hemisphere between 2010 and 2013. Fourteen predefined predictor variables were recorded, and MEP latencies of abductor pollicis brevis muscle (APB), abductor digiti minimi muscle (ADM), and flexor carpi radialis muscle (FCR) were analyzed using linear mixed-effect multiple regression analysis with the forward step-wise model comparison approach.
Results: Common factors (relevant to APB, ADM, and FCR) for MEP latency variability were gender, most likely due to body height, and antiepileptic drug (AED) intake. Muscle-specific factors (relevant to APB, ADM, or FCR) for MEP latency variability were resting motor threshold (rMT), tumor side, and tumor location.
Conclusions: Based on a large cohort of neurosurgical patients, this study provides data on a wide range of clinical factors that may underlie MEP latency variability. The factors that significantly contributed to MEP latency variability should be standardly recorded and taken into consideration during neurosurgical motor mapping.
Keywords: Brain tumor, Cortical mapping, Electromyography, Motor evoked potentials, Navigated transcranial magnetic stimulation, Presurgical motor mapping
© The Author(s) 2017. This article is distributed under the terms of the Creative Commons Attribution 4.0 International License (http://creativecommons.org/licenses/by/4.0/), which permits unrestricted use, distribution, and reproduction in any medium, provided you give appropriate credit to the original author(s) and the source, provide a link to the Creative Commons license, and indicate if changes were made. The Creative Commons Public Domain Dedication waiver (http://creativecommons.org/publicdomain/zero/1.0/) applies to the data made available in this article, unless otherwise stated.
BackgroundTranscranial magnetic stimulation (TMS) is a noninva-sive tool that can be applied to systematically map the human cortex with the aim of localizing specific function. Thanks to the combination of precise navigation systems and TMS, navigated TMS (nTMS) becomes possible, which can be used for reliable cortical motor mapping in the context of presurgical planning among patients with brain tumors [1–3]. In this context, it has already been shown that nTMS-based motor maps correlate well with intraoperative direct cortical stimulation (DCS) mapping,
especially when compared to other common preop-erative mapping modalities such as functional magnetic resonance imaging (fMRI) or magnetoencephalography (MEG) [4–7]. Furthermore, recent data provided the first evidence that patients with brain tumors might benefit from nTMS in terms of clinical outcome and survival, thus potentially expanding the initial role of nTMS as a mere preoperative planning tool [8–10].
During neurosurgical nTMS-based motor mapping, the functional motor area is typically identified and spa-tially enclosed by separating cortical areas that gave rise to motor evoked potentials (MEPs) during stimulation (motor-positive spots) from those for which no ade-quate responses were detected (motor-negative spots). However, to be able to achieve accurate motor maps
Open Access
BMC Neuroscience
*Correspondence: [email protected] 1 Department of Neurosurgery, Klinikum rechts der Isar, Technische Universität München, Ismaninger Str. 22, 81675 Munich, GermanyFull list of author information is available at the end of the article

Page 2 of 15Sollmann et al. BMC Neurosci (2017) 18:5
that facilitate reliable preoperative planning, improved clinical outcome, and perioperative risk stratification, precise definitions of criteria that allow for distinguish-ing between motor-positive and motor-negative spots are required. Among others, MEP amplitudes and MEP latencies are most commonly used for this purpose [4–6]. Whereas MEP latencies have principally shown to remain comparatively stable, MEP amplitudes vary considerably from stimulus to stimulus in patients with pathologies of the nervous system as well as in healthy subjects [11–14]. Although MEP latencies are considered more robust and, therefore, presumably even more reliable for sepa-rating motor-positive from motor-negative stimulation points, data on normative MEP latency values and fac-tors underlying MEP latency variability in neurosurgical patients have only been provided by one study so far [14]. However, this study primarily revealed negative results in the sense that no factors except gender were identi-fied for MEP latency variability [14]. Furthermore, the overall topic of MEP amplitudes, latency variability, and influencing factors has been primarily addressed by non-navigated TMS studies with only a few exceptions so far [11, 12, 15–17]. However, non-navigated TMS does not allow for precise control of coil angulation, orientation, and localization of the stimulation with respect to indi-vidual cortical anatomy. Yet, only slight variations in coil placement can already lead to different responses, which demonstrates the need for updated values of MEP char-acteristics by the use of nTMS [18]. Taking these aspects into account, the current study addresses the following topics:
1. While there is some literature available on MEP characteristics derived from nTMS among healthy subjects [13, 19], data derived from neurosurgical patients are rare. Thus, the present study aims to pro-vide further evidence on MEP latency distributions among patients with brain tumors.
2. Except for one study, factors that might interfere with MEP characteristics during neurosurgical motor mapping have not been assessed [14]. Thus, the pre-sent study examines clinical factors that may underlie MEP variability while expanding the range of factors that have been taken into account previously. Most of these factors are specific to brain tumors and are not examinable in healthy cohorts.
MethodsPatients and proceduresThe present study was conducted among 100 patients in our neurosurgical department. The same cohort has been investigated with a different purpose in previous studies [20, 21].
According to our study protocol, inclusion criteria included individuals above age 18, with written informed consent, and with brain lesions affecting motor areas according to anatomical magnetic resonance imaging (MRI). Exclusion criteria included individuals below 18 years old, general TMS exclusion criteria (e.g., coch-lear implant, pacemaker, deep brain stimulation elec-trodes), and plegia.
Regarding the experimental setup, the enrolled patients first underwent detailed clinical examinations including assessment of motor strength according to a standardized protocol with respect to the British Medical Research Council (BMRC) scale. Then, cranial MRI followed by nTMS-based motor mapping was conducted. All nTMS mapping sessions were systematically analyzed to be able to provide data on MEP latency distributions and char-acteristics among neurosurgical patients. Moreover, vari-ous patient-related, tumor-related, and mapping-related characteristics were systematically recorded for later regression analysis to identify factors that may underlie MEP latency variability.
Cranial imagingAmong other clinical sequences, our scanning protocol consisted of a three-dimensional gradient echo sequence (TR/TE: 9/4 ms, 1 mm3 isovoxel covering the whole head, 6 min 58 s acquisition time) with and without intrave-nous contrast administration for navigation purposes during nTMS. Imaging was done on a 3 Tesla scanner by use of an 8-channel phased array head coil (Achieva 3T, Philips Medical Systems, The Netherlands B.V.).
Motor mappingMotor mapping by nTMS was performed with the Nex-stim eXimia NBS system, version 3.2 or 4.3 (Nexstim Oy, Helsinki, Finland). A biphasic figure-of-eight magnetic coil was used for all mappings, and an integrated infra-red tracking system allowed for real-time navigation during stimulation. Motor responses were continuously monitored using the integrated electromyography (EMG) system with six channels in total. All examinations were conducted according to a validated stimulation protocol by experienced investigators [5, 10, 20–22].
During nTMS, the patients sat in an adjustable chair with armrests, and pregelled surface electrodes were placed over the abductor pollicis brevis muscle (APB), abductor digiti minimi muscle (ADM), flexor carpi radia-lis muscle (FCR), biceps brachii muscle (BCS), tibialis anterior muscle (TA), and gastrocnemius muscle (GCN) contralateral to the brain lesion (Neuroline 720, Ambu, Ballerup, Denmark). EMG recording of each muscle was derived from a pair of electrodes with the first elec-trode being placed on the respective muscle belly and

Page 3 of 15Sollmann et al. BMC Neurosci (2017) 18:5
the second electrode being placed on a nearby bony or tendinous part according to the recommendations of the system’s manufacturer. The second electrode was always placed distal to the first electrode for each muscle, and the inter-electrode distance was in the range of few centimeters.
Then, the resting motor threshold (rMT) as the low-est stimulation intensity that elicits MEPs over 50 µV in amplitude in at least 50% of stimulation trials in a relaxed muscle was determined by motor mapping of the corti-cal representation of the APB [23]. Subsequent to rMT determination, motor mapping of the hemisphere with the brain tumor was performed. In this context, we chose 110% rMT for mapping of upper extremity (UE) muscles, while the lower extremity (LE) was assessed with at least 130% rMT according to previous reports [5, 10, 20–22]. Mapping was performed with a distance of less than 1 cm between single stimulation points, and the electric field induced by the stimulating nTMS coil was oriented perpendicular to the mapped gyrus for UE mapping. During the whole stimulation procedure, patients were advised to relax, and mapping was only performed when preinnervation levels of all recorded muscles were clearly below 50 µV in amplitude, thus avoiding false-positive stimulation spots.
After each mapping session, post hoc analysis was done as described earlier [4–6, 14]. In this context, only map-ping points with MEP amplitudes greater than or equal to 50 µV were taken into account for further analysis, and, consequently, this criterion was used to distinguish between motor-positive (MEP amplitudes ≥50 µV) and motor-negative stimulation points (MEP amplitudes <50 µV). Again, this approach follows the procedures established during earlier investigations on motor map-ping in patients with brain tumors [5, 10, 20–22]. Hence, only motor-positive stimulation spots of each patient were further considered during MEP latency analyses of the present study.
Patient data collectionTo identify factors that may underlie MEP latency vari-ability, 14 predefined predictor variables were recorded. These variables were collected from the medical charts or assessed by a standardized questionnaire subsequent to the mappings.
In this context, patient-related parameters contained gender (male = M, female = F), age at exam, antiepilep-tic drug intake (AEDs: no AED = NA, levetiracetam = L, other specified AEDs = SA, AED status not known = NK, unspecified AEDs = UA), and presence of motor deficits (no deficit = ND, deficit = D). Furthermore, tumor-related factors included tumor location (Rolandic = RO, frontal = FR, parietal = PA, postcentral gyrus = PoG, or
temporal = TE), tumor side (left hemisphere = LH, right hemisphere = RH), dominancy of the tumor hemisphere (non-dominant = NDO, dominant = DO), tumor-related edema (no edema = NE, edema = E), tumor entity (astrocytoma WHO grade II = II, astrocytoma WHO grade III = III, astrocytoma WHO grade IV = IV, metas-tasis = ME, other entities = X), tumor recurrence (no recurrence = NR, recurrence = R), and tumor volume. Additionally, a predefined set of mapping-related param-eters was taken into account, which consisted of the rMT intensity, mapped muscles (APB, ADM, FCR), and year of mapping (2010–2013 = Y10, Y11, Y12, Y13). The year of mapping can be regarded as an important external fac-tor related to the skills of the investigators, because lower MEPs might potentially arise when some coil operators were more experienced than others.
Statistical analysisAll statistical data analysis was performed by using R, version 3.1.1, in combination with the MASS package and the effects package [24, 25] (The R Foundation for Statistical Computing, Vienna, Austria).
For documentation and reporting of basic patient and mapping characteristics, absolute frequen-cies, means ± standard deviation (SD), and ranges were calculated. Regarding MEP latency data, Shapiro–Wilk normality test was initially performed to assess whether MEP latency data were normally distributed. In case of non-normal data distribution, descriptive statistics were summarized by percentile rank scores (minimum, median, maximum, and quartile scores), and ex-Gauss-ian measures were calculated and used for further MEP latency analyses. The ex-Gaussian distribution is a math-ematical convolution of the normal (Gaussian) and expo-nential distributions and has three parameters: mu and sigma, representing the mean and SD of the Gaussian distribution, and tau, representing the mean and SD of the exponential distribution. In this context, mu repre-sents the mode of the normally distributed part, whereas sigma is the measure of dispersion in the normally dis-tributed part.
Since previous data among neurosurgical patients have shown gender-dependent significant differences in MEP latencies [14], the initial analyses for MEP distributions were done separately for males and females. Further-more, to investigate the factors underlying the variability in MEP latency, linear mixed-effect multiple regression analysis with the forward step-wise model comparison approach was performed. To test for statistical signifi-cance, a Chi-squared test was applied, and p < 0.05 was defined as the level of significance.
For initial assessment and illustration of MEP latency distributions, line graphs and boxplots were generated.

Page 4 of 15Sollmann et al. BMC Neurosci (2017) 18:5
Concerning factors that proved to significantly con-tribute to MEP latency variability, effect plots including confidence intervals (CIs) were prepared subsequent to linear regression analysis.
ResultsPatient and mapping characteristicsOverall, 100 patients were enrolled in the present inves-tigation, and nTMS-based motor mapping was achieved successfully in all subjects. During stimulation, no adverse events occurred. Relevant patient details, map-ping parameters, and the set of predefined clinical fac-tors are displayed in Table 1. The same patient cohort has been investigated with a different purpose in previous studies [20, 21].
MEP latency distributionAccording to the Shapiro–Wilk normality test, MEP latencies were non-normally distributed in both genders. Importantly, the non-normal distribution of the MEP latencies was not adjusted by natural logarithmic trans-formation. The non-normally distributed MEP laten-cies for all mapped muscles of both genders are shown in Table 2 and Fig. 1. Furthermore, the differences in MEP latency distributions are compared in Table 2 and Fig. 2 for all mapped muscles. For both genders, median MEP latency values were the highest for GCN and TA, followed by APB and ADM (Table 2; Fig. 2). Accord-ingly, median MEP latencies derived from FCR and BCS mapping were the lowest when compared to the other mapped muscles (Table 2; Fig. 2).
MEP latency variabilitySince MEP latencies showed non-normal distribu-tion, they were adjusted by calculating the ex-Gaussian measures (mu, sigma, and tau) for each mapped muscle and for each patient when the number of MEPs was at least three. The Shapiro–Wilk normality test confirmed that mu was normally distributed for FCR, BCS, TA, and GCN for both genders (Fig. 3). Though normal distribu-tion was not achieved for APB or ADM, outlying scores decreased for these muscles. Thus, linear mixed-effect multiple regression analysis with the forward step-wise model comparison approach was suitable to investigate the factors underlying the variability in MEP latency.
Only motor-positive stimulation spots were taken into account for MEP latency analyses. In total, there were 197 observations from APB-mapped gyri, 192 observa-tions from ADM-mapped gyri, and 157 observations from FCR-mapped gyri. These numbers all exceeded the minimum sample size required for medium effect size (0.15), power (0.80), and α level (0.01) [26–30]. With this constraint, observations from BCS-mapped, TA-mapped,
and GCN-mapped gyri were not further assessed to investigate the factors underlying the variability in MEP latencies because they did not have the minimum num-ber of observations required. In this context, MEPs derived from mapping of LE muscles were not available in 66 patients due to missing responses during nTMS with respect to the applied stimulation protocol.
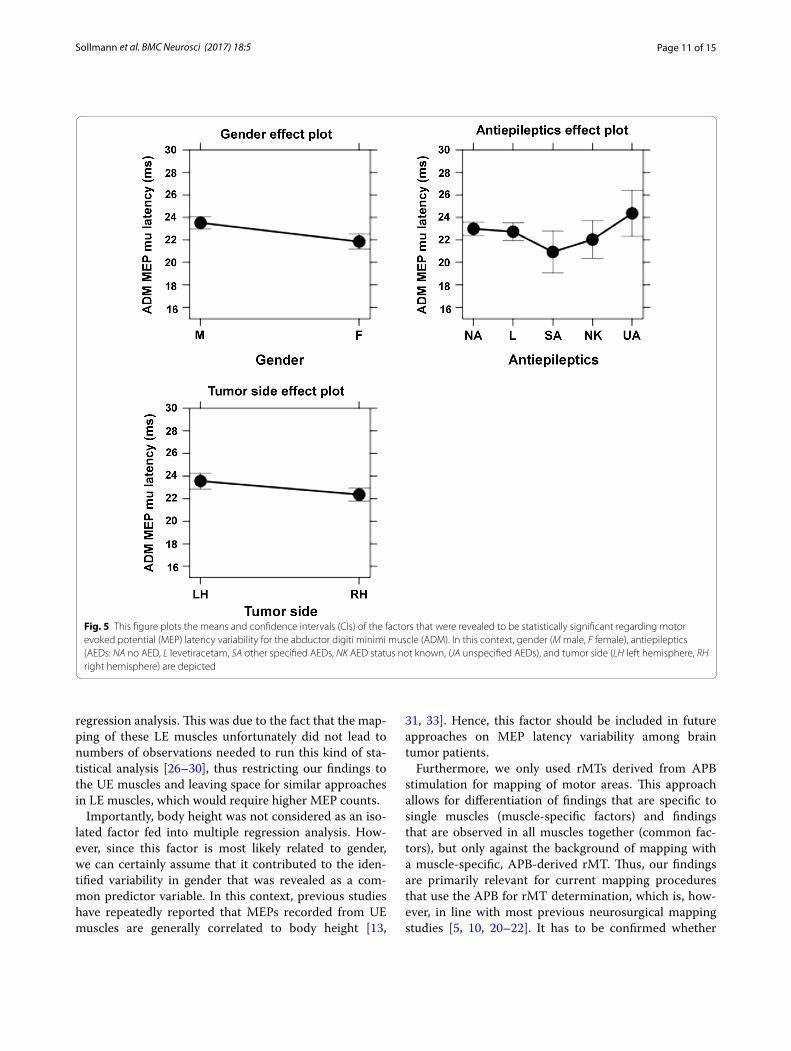
As a result of the multiple regression analysis, common factors (relevant to APB, ADM, and FCR) and muscle-specific factors (relevant to APB, ADM, or FCR) were identified (Table 3). When the individual differences were partialled out by the random intercept for partici-pants, gender and AED intake were revealed to be com-mon factors underlying MEP latency variability (Table 3). Muscle-specific factors were rMT for APB (mu of the MEP latency was predicted to be longer for patients with higher rMT than for those with lower rMT), tumor side for ADM (mu of the MEP latency was predicted to be longer for patients with left-sided tumors than for those with right-sided tumors), and tumor location for FCR (mu of the MEP latency was predicted to be longer for patients with tumors in the central or temporal regions when compared to patients suffering from tumors within frontal regions or the PoG). The results for significant common and muscle-specific factors underlying the MEP latency variability of the considered muscles are shown in effect plots (Figs. 4, 5, 6).
DiscussionnTMS-based motor mapping provides multiple neuro-physiological variables, out of which mostly MEP ampli-tude and MEP latency are commonly used to distinguish between motor-positive and motor-negative spots in the clinical setting [4–6]. In numerous studies, MEP latency was shown to remain comparatively stable within indi-viduals, whereas MEP amplitude showed a high intra-individual and inter-individual variability [11–14]. In this context, the present study identified significant fac-tors contributing to MEP latency variability, which were divided into common factors (relevant to APB, ADM, and FCR) and muscle-specific factors (relevant to APB, ADM, or FCR). In the following, we discuss our results on MEP latency variability in patients with brain tumors with regards to the latest literature.
Common factors underlying MEP latency variabilityGenderIn our cohort of 100 patients with brain tumors, we iden-tified gender as a common factor underlying MEP mu latency variability in all analyzed muscles (APB, ADM, and FCR). MEP mu latency was predicted to be signifi-cantly higher in male than in female patients (Table 3; Figs. 4, 5, 6). However, it is important to mention that

Page 5 of 15Sollmann et al. BMC Neurosci (2017) 18:5
Table 1 Patient and mapping characteristics
Overview on patient and mapping characteristics by gender, including age at exam, antiepileptics (AEDs: NA no AED, L levetiracetam, SA other specified AEDs, NK AED status not known, UA unspecified AEDs), and presence of motor deficits (ND no deficit, D deficit). Furthermore, tumor location (RO Rolandic, FR frontal, PA parietal, PoG postcentral gyrus, TE temporal), tumor side (LH left hemisphere, RH right hemisphere), dominancy of the tumor hemisphere (NDO non-dominant, DO dominant), tumor-related edema (NE no edema, E edema), tumor entity (II astrocytoma WHO grade II, III astrocytoma WHO grade III, IV astrocytoma WHO grade IV, ME metastasis, X other entities), tumor recurrence (NR no recurrence, R recurrence), and tumor volume are displayed. In addition, resting motor threshold (rMT) values and year of mapping (Y10 exam year 2010, Y11 exam year 2011, Y12 exam year 2012, Y13 exam year 2013) are shown. All values are presented as number of patients, mean ± standard deviation (SD), or ranges. Dominancy data do not add up to 100 patients since it was not assessed in five patients
Male Female All
Number of patients 57 43 100
Age at exam (in years) 54.0 ± 13.9(20–83)
54.2 ± 15.7(19–84)
54.1 ± 14.7(19–84)
AEDs
NA 26 27 53
L 19 11 30
SA 4 1 5
NK 5 3 8
UA 3 1 4
Motor deficit
ND 41 31 72
D 16 12 28
Tumor location
RO 19 16 35
FR 15 9 24
PA 11 8 19
PoG 11 6 17
TE 1 4 5
Tumor side
LH 23 17 40
RH 34 26 60
Dominancy
NDO 28 25 53
DO 26 16 42
Edema
NE 37 31 68
E 20 12 32
Tumor entity
II 8 6 14
III 4 6 10
IV 21 17 38
ME 14 11 25
X 10 3 13
Tumor recurrence
NR 44 34 78
R 13 9 22
Tumor volume (in cm3) 27.2 ± 5.4 (19.9–42.9) 26.1 ± 5.0 (20.3–39.9) 26.7 ± 5.2 (19.9–42.9)
rMT (in %) 31.9 ± 7.5 (20–59) 36.4 ± 10.6 (22–72) 33.8 ± 9.3 (20–72)
Year of mapping
Y10 13 16 29
Y11 14 6 20
Y12 10 5 15
Y13 20 16 36

Page 6 of 15Sollmann et al. BMC Neurosci (2017) 18:5
body height was not explicitly recorded in the present study, which might confound our findings.
Accordingly, studies on healthy volunteers showed that mean MEP latencies correlate with subjects’ gender, height, and age, respectively [13, 31–33]. After adjust-ing MEP latencies to height or UE length, no significant differences between men and women were observed. Resulting from that, the gender-related differences in MEP latencies in our study are most likely due to height differences between the genders. Picht et al. reported on similar findings in a cohort of brain tumor patients undergoing preoperative nTMS-based motor mapping:
they observed shorter median MEP latencies in the tumorous hemispheres of women than in men [14]. Con-trary to Saisanen et al., they did not report any findings of MEP latency influenced by age [13]. In our study, we also could not determine age as an influencing factor, which might be caused by our cohort’s age distribution with mostly middle-aged patients (Table 1).
AED intakeIn the present study, AED intake was identified as a com-mon factor underlying MEP mu latency variability in all three of the analyzed muscles (APB, ADM, and FCR).
Table 2 Motor evoked potential (MEP) latency by mapped muscle and gender
This table shows the minimum (Min), first quartile (1st Qu.), median, third quartile (3rd Qu.), and maximum (Max) values for motor evoked potential (MEP) latencies by mapped muscle and gender (in ms). In the present study, the abductor pollicis brevis muscle (APB), abductor digiti minimi muscle (ADM), flexor carpi radialis muscle (FCR), biceps brachii muscle (BCS), tibialis anterior muscle (TA), and gastrocnemius muscle (GCN) were mapped
Gender Muscle Min 1st Qu. Median 3rd Qu. Max
Male APB 19.14 22.18 23.29 24.56 30.76
ADM 18.94 22.00 23.20 24.19 32.50
FCR 13.66 16.60 18.00 19.22 22.12
BCS 12.93 14.06 15.69 17.56 20.40
TA 28.81 31.27 31.83 32.47 34.90
GCN 28.35 31.11 32.99 35.22 38.27
Female APB 18.07 20.80 21.63 22.26 32.09
ADM 17.76 20.44 21.47 22.79 22.79
FCR 12.75 14.88 16.15 17.19 19.68
BCS 10.51 12.28 14.15 15.77 15.77
TA 24.10 28.00 29.68 31.59 34.09
GCN 28.09 30.04 30.66 32.53 39.50
Fig. 1 Boxplots showing non-normally distributed motor evoked potential (MEP) latencies for mapped muscles of both genders. In the present study, the abductor pollicis brevis muscle (APB), abductor digiti minimi muscle (ADM), flexor carpi radialis muscle (FCR), biceps brachii muscle (BCS), tibialis anterior muscle (TA), and gastrocnemius muscle (GCN) were mapped

Page 7 of 15Sollmann et al. BMC Neurosci (2017) 18:5
During analyses, no AED intake was compared against levetiracetam, other specified AEDs, unspecified AEDs, and unknown AED status (Table 1). In this context, MEP latency was predicted to be slightly higher for unspeci-fied AED intake and lower for specified AEDs. No clear difference was observed for predictions of unknown AED status or levetiracetam, in addition to no AED intake (Table 3; Figs. 4, 5, 6).
In past studies, levetiracetam was described as a potentially beneficial alternative to conventional AEDs in patients with brain tumors, which is based on com-paratively rare drug interactions and side effects [34, 35]. Therefore, this drug is increasingly used in the neu-rosurgical context, allowing formation of a subgroup large enough for statistically meaningful analysis in the present study (Table 1). This was not the case for other AEDs, thus only allowing categorization in other speci-fied or unspecified AEDs. These two groups are inhomo-geneous with low numbers of observations, which does not allow attribution of MEP latency variability to a sin-gle drug. However, our study raises awareness that AED intake in general has to be considered regarding MEP latencies. More importantly, it is able to show that lev-etiracetam intake does not predict higher or lower MEP latencies when compared to no AED intake, which has not been investigated previously. This finding indicates that, besides rare drug interactions and side effects, lev-etiracetam seems to be a favorable drug when it comes to nTMS-based motor mapping because it is not associated with significant alteration in MEP latencies according to our regression analysis.
In this context, the distinct effects of levetiracetam on cortical excitability are not fully understood, which is reflected by a comparatively limited amount of studies that at least partially arrived at opposing results [36–38]. Whereas the excitability in healthy volunteers was not
significantly changed after a single oral dose of leveti-racetam in one of these studies, the other two approaches described statistically significant rMT increases due to levetiracetam delivery, suggesting a drug-dependent decrease of neuronal excitability [36–38]. Regarding its way of functioning, it is assumed that levetiracetam pri-marily decreases potassium currents and increases the decay of calcium currents, which is expressed by excit-ability changes in the context of levetiracetam intake [39, 40]. As revealed by the present study, levetiracetam intake does not seem to predict higher or lower MEP latencies when compared to no AED intake. Hence, changes in excitability might still be present within rMT values or MEP amplitudes, but interestingly, MEP latency does not seem to be significantly affected by this kind of drug intake.
Muscle‑specific factors underlying MEP latency variabilityrMT for APBStudies comparing stimulation at threshold level with supra-threshold stimulation of one hemisphere showed that an increase in stimulation intensity leads to a stronger response with increased MEP amplitudes and decreased MEP latencies [23, 32]. On the contrary, we observed that in APB only, higher rMT was associated with an increase of MEP mu latencies. Therefore, our results do not represent changes in MEP latency due to mere stimulation intensity increase, but rather identify the rMT as an APB-specific factor for MEP latency vari-ability (Table 3; Figs. 4, 5, 6).
In healthy volunteers, higher threshold intensities are actually related to longer MEP latencies [19, 32]. Studies assumed that direct corticospinal tracts with faster con-nections have the lowest thresholds, whereas higher rMT stimulates predominantly indirect or polysynaptic con-nections and therefore leads to longer MEP latencies. A
Fig. 2 Graphs showing motor evoked potential (MEP) latencies as a function of the distance from the brain. The abductor pollicis brevis muscle (APB), abductor digiti minimi muscle (ADM), flexor carpi radialis muscle (FCR), biceps brachii muscle (BCS), tibialis anterior muscle (TA), and gastroc-nemius muscle (GCN) were mapped in the present study

Page 8 of 15Sollmann et al. BMC Neurosci (2017) 18:5
Fig. 3 Boxplots showing the distribution of ex-Gaussian measures (mu, sigma, and tau) by mapped gyrus and gender. Again, the results are shown separately for each mapped muscle (APB abductor pollicis brevis muscle, ADM abductor digiti minimi muscle, FCR flexor carpi radialis muscle, BCS biceps brachii muscle, TA tibialis anterior muscle, GCN gastrocnemius muscle), depending on gender

Page 9 of 15Sollmann et al. BMC Neurosci (2017) 18:5
study on stroke patients presented that in lesioned hemi-spheres, compared to healthy hemispheres, there are longer MEP latencies and higher rMTs [41]. A study on brain tumor patients also showed that differences in rMT between healthy and impaired hemispheres in tumor patients indeed can be found, although not in all—or even most—patients [14]. In our cohort, we accordingly assume that the higher rMT is an indicator for impair-ment of motor pathways, which leads to recruitment of indirect connections and therefore a prolonged MEP mu latency. Still, these results have to be considered carefully, as this effect was seen only for one of the three stimulated muscles (APB). Further studies with higher MEP counts for each muscle are necessary to support our current results regarding rMT, and they might reveal the reason why this factor was identified as muscle-specific rather than common.
Tumor side for ADMInterhemispheric differences in neurophysiological parameters are a controversial subject in the literature. As an example, for rMT, there are studies reporting dif-ferences between the RH and LH [42], studies reporting differences between DO and NDO hemispheres [43], and studies reporting no interhemispheric difference [18]. For MEP latency, there are many studies on healthy volun-teers, which showed no correlation between hemispheres (LH vs. RH nor DO vs. NDO hemispheres), especially not after correction of UE lengths [13, 18, 31, 32]. A study on patients with brain tumors confirmed these findings [14].
Considering our results, we observed that, for ADM only, MEP mu latencies were predicted to be longer in LHs with brain tumors than in RHs with brain tumors according to our multiple regression approach (Table 3;
Figs. 4, 5, 6). Although one would assume this is due to the dominancy of the LH, we did not observe this effect in the analysis of DO versus NDO hemispheres. With regards to our patients’ characteristics, gender distribu-tion is not likely to cause this effect either, as both groups are similar (Table 1).
One possible explanation for why the tumor side was an underlying factor of variability in MEP latency while the hemisphere dominancy was not, might be that in left-handed patients we assumed the RH to be the motor-dominant hemisphere. Of course, this is very reductive, as there are different gradations of handedness instead of just-right- or just-left-handedness. Still, this effect might not be of importance, as only 8% of our patients in total were left-handed. In any case, this interpretation remains speculative, and further studies might aim to clarify the finding that tumor side is a relevant factor—a result that has not yet been described in previous investigations. Upcoming studies should also distinctly explore why the tumor side was revealed to be a muscle-specific but not common factor.
Tumor location for FCRIn patients with eloquent brain tumors, the lesion fre-quently impairs the functional connectivity of the brain—either directly due to interaction with the cortical area or the corticospinal tract or indirectly due to a mass effect or edema—and can result in a loss of motor function. The worst deficits are expected when the primary motor cor-tex is impaired directly by the tumor. This is in accord-ance with our cohort, as patients with RO tumors tend to suffer from motor deficits most often compared to the other groups (motor deficit: RO 37%, FR 17%, PA 21%, PoG 35%, TE 20%).
We did not identify motor deficit as a significant pre-dictor for MEP mu latency, but for FCR, MEP mu latency in patients with a tumor located in RO or TE regions was predicted to be longer than in those with tumors in PoG or FR areas, whereas MEP mu latencies of PA tumors ranged in the middle (Table 3; Figs. 4, 5, 6). It seems logi-cal that tumors located in RO areas, other than in any other location, induce the largest changes in functional representation as they are situated directly within the pri-mary motor cortex. We are currently aware of only one study researching the variability of MEP latency in brain tumor patients, which did not show any major differ-ence in MEP latency between the healthy and impaired hemisphere [14]. Yet, there is a study on stroke patients showing longer MEP latencies after TMS of affected hemispheres when compared to healthy hemispheres [41]. As for the TE tumor group, these patients tended to have the largest tumor volumes out of all groups, and we assume the longer MEP mu latencies are due to the
Table 3 Significant predictor variables for motor evoked potential (MEP) latency by mapped muscle
This table shows the predictor variables for MEP latencies that were statistically significant. In this context, common factors (gender and antiepileptics = AED) and muscle-specific factors (resting motor threshold = rMT, tumor side, tumor location) were revealed for abductor pollicis brevis muscle (APB), abductor digiti minimi muscle (ADM), and flexor carpi radialis muscle (FCR)
Muscle Predictors p
APB MEP latency (mu) (n = 197) Plus gender <0.001
Plus AED 0.012
Plus rMT 0.008
ADM MEP latency (mu) (n = 192) Plus gender 0.001
Plus AED 0.016
Plus tumor side 0.009
FCR MEP latency (mu) (n = 157) Plus gender <0.001
Plus AED 0.012
Plus tumor location 0.016

Page 10 of 15Sollmann et al. BMC Neurosci (2017) 18:5
subcortical spatial relation of tumor tissue to the corti-cospinal tract and its compression [19].
It is of interest to discern whether these variables are directly associated with motor deficits of contralateral limbs or with mere changes in structural anatomy. The analysis of our cohort indicates the latter, but as these results were significant only for one of three analyzed muscles, further studies with higher MEP counts and dif-ferent muscles (not solely UE muscles) are crucial.
LimitationsDespite that this study successfully identified significant common and muscle-specific predictors regarding MEP latency variability in nTMS-based motor mapping, some important shortcomings have to be reported. In this
context, we only investigated the lesioned hemisphere, which makes comparisons between diseased and healthy hemispheres within the same patients impossible. How-ever, such interhemispheric comparisons might be useful for assessing the functional status of the motor system with later implications for risk stratification, as demon-strated in a previous study [14]. Although the lack of data analysis among healthy hemispheres in the present study should not restrict the significance of our data per se, such interhemispheric comparison might be considered during upcoming investigations.
Furthermore, our multiple regression analysis solely included a set of UE muscles (APB, ADM, FCR), whereas LE muscles were only initially mapped and recorded by EMG (TA, GCN) but not taken into account during
Fig. 4 This figure plots the means and confidence intervals (CIs) of the factors that were revealed to be statistically significant regarding motor evoked potential (MEP) latency variability for the abductor pollicis brevis muscle (APB). In this context, gender (M male, F female), antiepileptics (AEDs: NA no AED, L levetiracetam, SA other specified AEDs, NK AED status not known, UA unspecified AEDs), and resting motor threshold (rMT, in % of the system’s maximum output) are depicted
Page 11 of 15Sollmann et al. BMC Neurosci (2017) 18:5
regression analysis. This was due to the fact that the map-ping of these LE muscles unfortunately did not lead to numbers of observations needed to run this kind of sta-tistical analysis [26–30], thus restricting our findings to the UE muscles and leaving space for similar approaches in LE muscles, which would require higher MEP counts.
Importantly, body height was not considered as an iso-lated factor fed into multiple regression analysis. How-ever, since this factor is most likely related to gender, we can certainly assume that it contributed to the iden-tified variability in gender that was revealed as a com-mon predictor variable. In this context, previous studies have repeatedly reported that MEPs recorded from UE muscles are generally correlated to body height [13,
31, 33]. Hence, this factor should be included in future approaches on MEP latency variability among brain tumor patients.
Furthermore, we only used rMTs derived from APB stimulation for mapping of motor areas. This approach allows for differentiation of findings that are specific to single muscles (muscle-specific factors) and findings that are observed in all muscles together (common fac-tors), but only against the background of mapping with a muscle-specific, APB-derived rMT. Thus, our findings are primarily relevant for current mapping procedures that use the APB for rMT determination, which is, how-ever, in line with most previous neurosurgical mapping studies [5, 10, 20–22]. It has to be confirmed whether
Fig. 5 This figure plots the means and confidence intervals (CIs) of the factors that were revealed to be statistically significant regarding motor evoked potential (MEP) latency variability for the abductor digiti minimi muscle (ADM). In this context, gender (M male, F female), antiepileptics (AEDs: NA no AED, L levetiracetam, SA other specified AEDs, NK AED status not known, UA unspecified AEDs), and tumor side (LH left hemisphere, RH right hemisphere) are depicted

Page 12 of 15Sollmann et al. BMC Neurosci (2017) 18:5
comparable results are also present for mapping with rMTs derived from other muscles (e.g., ADM or FCR).
Clinical implications and significanceThis is one of the first studies that uses nTMS to system-atically explore MEP latency distributions and, in a sec-ond step, identifies clinical factors that may underlie MEP latency variability. In this context, there is only a limited amount of literature on MEP characteristics derived from nTMS, which primarily reports results derived from healthy subjects [13, 19]. To the best of our knowledge, there is only one comparable approach among neuro-surgical patients available while the use of this technique for neurosurgical mapping strongly increases [14]. Thus, more data on the matter seems to be mandatory for further successful and reliable application of nTMS in
neurosurgery. Consequently, the specific need for data on MEP characteristics among neurosurgical patients has already been pointed out in one of the previous investiga-tions in healthy volunteers [19]. Therefore, the results of the present study add knowledge to the limited amount of data on the matter.
While there is a comparatively large body of literature on MEP amplitudes and latency variability and influenc-ing factors derived from stimulation with non-navigated TMS systems [11, 12, 15–17], only a few studies thus far have used nTMS [13, 14, 19]. This situation is of high importance since it is known that only slight variations in coil placement and angulation can lead to different responses [18]. Thus, although previous non-navigated TMS approaches heavily contributed to the knowl-edge about MEP characteristics, we can assume that
Fig. 6 This figure plots the means and confidence intervals (CIs) of the factors that were revealed to be statistically significant regarding motor evoked potential (MEP) latency variability for the flexor carpi radialis muscle (FCR). In this context, gender (M male, F female), antiepileptics (AEDs: NA no AED, L levetiracetam, SA other specified AEDs, NK AED status not known, UA unspecified AEDs), and tumor location (RO Rolandic, FR frontal, PA parietal, PoG postcentral gyrus, TE temporal) are depicted

Page 13 of 15Sollmann et al. BMC Neurosci (2017) 18:5
non-navigated stimulation might have been confounded by non-optimal coil adjustments, which can limit the validity and reproducibility of such data. In this context, the spatial extent of motor maps, MEP amplitudes at cer-tain mapping points, and MEP latencies might be insuf-ficient due to non-optimal coil placement; a factor that can be controlled during nTMS [3]. While data on the extent of nTMS-based motor maps were not the topic of the present study and have already been published [20], an update on MEP characteristics and influencing factors by the use of nTMS seemed to be necessary in the neuro-surgical context.
Regarding influencing factors, at least some of the parameters investigated are specific to brain tumors, which make their assessment impossible in nTMS-based studies among healthy volunteers. In this context, data on tumor-specific factors have solely been investigated in one study so far [14]. Whereas this study predomi-nantly revealed negative results in the sense that no fac-tors except gender were identified as underlying variables of MEP latency variability [14], the present approach revealed more common and muscle-specific factors as significant while considering a larger set of predefined variables.
Nevertheless, the present study only revealed two sig-nificant common factors and three muscle-specific fac-tors for MEP latency variability out of a predefined set consisting of 14 clinical factors. This can be regarded as beneficial regarding neurosurgical motor mapping since it demonstrates that only a few variables interfere with MEP latency and, therefore, should be documented and controlled, if possible. However, it is interesting that at least some significant factors have been revealed since MEP latencies have principally shown to be among the most stable parameters during TMS applications, whereas MEP amplitudes, for instance, can considerably vary from stimulus to stimulus due to rather unspecific reasons [11–14].
Despite that nTMS-based mapping in neurosurgery is primarily used for preoperative planning, its application is increasingly expanded to delineation of plastic reshap-ing in the context of brain tumors. Such plastic changes can occur to different extents, but they have repeatedly been demonstrated by nTMS and intraoperative stimula-tion [44–47]. Delineation of plastic changes commonly requires follow-up mappings to compare the spatial characteristics of the motor maps. However, some of the significant factors identified in the present study may change during the interval between initial and follow-up mapping (e.g., AED doses), and because they have shown to underlie MEP latency variability, they should be care-fully documented and considered to prevent confound-ing of results when MEP latency is, among others, used
as a parameter to distinguish between motor-positive and motor-negative stimulation spots. Such confounding could be due to different mapping hotspots and numbers of motor-positive stimulation points between initial and follow-up mapping, which might be wrongly attributed to plasticity while being rather related to different motor maps due to changed clinical factors. Consequently, the factors identified in the present study should facilitate better control and understanding of nTMS mapping parameters in neurosurgery.
In addition to distinguishing between motor-positive and motor-negative spots, neurophysiological nTMS criteria, such as MEP latency, might be used to assess the functional status of the motor system in the course of a disease like brain tumors, for instance. While first approaches have been made in the context of neurosur-gery by interhemispheric comparison of such values [14], they cannot yet be regarded as routine, and more studies are needed to clarify applicability. The present study can be seen as another step that might lead to individual risk stratification based on nTMS characteristics in the long run.
Furthermore, information regarding subcortical tracts can be provided by nTMS when combined with diffusion tensor imaging fiber tracking (DTI FT), as demonstrated in recent studies [48–51]. In this context, MEP latency maps could be used to refine the nTMS-based DTI FT approach in the sense that stimulation spots with the shortest MEP latencies could be used as seed regions to improve motor pathway tracking [51]. In contrast, stim-ulation points with rather long MEP latencies might be indicative of pathways under stress in the context of tract compressions due to space-occupying brain lesions, as suggested in a recent approach [19]. Again, knowledge about the factors contributing to MEP latency variability is essential for accurate mapping and DTI FT, and it helps to understand underlying neurophysiologic mechanisms. To increasingly exploit these neurophysiological nTMS characteristics in patients with brain tumors that could be supplementary to preoperative motor mapping, fur-ther studies are needed.
ConclusionsBased on a large cohort of neurosurgical patients, this study provides data on MEP latency distributions and a wide range of clinical factors that may underlie MEP latency variability in nTMS-based motor mapping of brain tumor patients. We were able to reveal significant, common factors (gender, associated with height, and AED) as well as muscle-specific factors (rMT, tumor side, tumor location) for MEP latency variability. Whereas the common factors can easily be discussed against the background of previous research (mainly acquired with

Page 14 of 15Sollmann et al. BMC Neurosci (2017) 18:5
non-navigated stimulation), some of the findings on significant muscle-specific factors cannot be distinctly clarified by the data of the present or previous studies. Nevertheless, the results of our approach might further refine nTMS-based motor mapping, and they should be taken as a basis for specific research on single, significant muscle-specific factors in the future.
AbbreviationsII: astrocytoma WHO grade II; III: astrocytoma WHO grade III; IV: astrocytoma WHO grade IV; ADM: abductor digiti minimi muscle; AED: antiepileptic drug; APB: abductor pollicis brevis muscle; BCS: biceps brachii muscle; BMRC: British Medical Research Council; CI: confidence interval; D: deficit; DCS: direct corti-cal stimulation; DO: dominant; DTI FT: diffusion tensor imaging fiber tracking; E: edema; EMG: electromyography; F: female; FCR: flexor carpi radialis muscle; fMRI: functional magnetic resonance imaging; FR: frontal; GCN: gastrocnemius muscle; L: levetiracetam; LE: lower extremity; LH: left hemisphere; M: male; ME: metastasis; MEG: magnetoencephalography; MEP: motor evoked potential; MRI: magnetic resonance imaging; NA: no AED; ND: no deficit; NDO: non-dominant; NE: no edema; NK: AED status not known; NR: no recurrence; nTMS: navigated transcranial magnetic stimulation; PA: parietal; PoG: postcentral gyrus; R: recurrence; RH: right hemisphere; rMT: resting motor threshold; RO: rolandic; SA: specified AED; SD: standard deviation; TA: tibialis anterior muscle; TE: temporal; TMS: transcranial magnetic stimulation; UA: unspecified AED; UE: upper extremity; X: other entities; Y10: exam year 2010; Y11: exam year 2011; Y12: exam year 2012; Y13: exam year 2013.
Authors’ contributionsNS, LB: manuscript preparation, data acquisition, data handling, data analysis, statistics, literature review. NT: data handling, data analysis, statistics. CZ: data acquisition, data handling, data analysis. BM: data acquisition, data handling, data analysis, study supervision. SK: manuscript preparation, data acquisition, data handling, data analysis, literature review, study supervision, statistics, literature review. All authors read and approved the final manuscript.
Authors’ informationNS is a Ph.D. student and medical doctor at the Department of Neurosurgery. LB is a medical doctor and lab intern. NT is a statistician and Ph.D. student. SK is an attending neurosurgeon. CZ is chief of the Section of Neuroradiology, Department of Radiology. BM is chief of the Department of Neurosurgery.
Author details1 Department of Neurosurgery, Klinikum rechts der Isar, Technische Universität München, Ismaninger Str. 22, 81675 Munich, Germany. 2 TUM-Neuroimaging Center, Klinikum rechts der Isar, Technische Universität München, Munich, Ger-many. 3 Faculty of Linguistics, Philology, and Phonetics, University of Oxford, Walton Street, Oxford OX1 2HG, UK. 4 Section of Neuroradiology, Department of Radiology, Klinikum rechts der Isar, Technische Universität München, Isma-ninger Str. 22, 81675 Munich, Germany.
AcknowledgementsNS and LB gratefully acknowledge the support of the graduate school of our university.
Competing interestsSK is consultant for BrainLAB AG (Feldkirchen, Germany) and Nexstim Oy (Hel-sinki, Finland). All other authors declare that they have no competing interests.
Availability of data and materialsThe datasets analyzed during the current study are available from the cor-responding author on reasonable request.
Ethics approval and consent to participateThe experimental protocol was approved by the ethical committee of our university (Registration Number: 2793/10) in accordance with the Declara-tion of Helsinki. All patients provided written informed consent prior to the examinations.
Received: 23 July 2016 Accepted: 9 December 2016
References 1. Picht T. Current and potential utility of transcranial magnetic stimu-
lation in the diagnostics before brain tumor surgery. CNS Oncol. 2014;3(4):299–310.
2. Ottenhausen M, Krieg SM, Meyer B, Ringel F. Functional preoperative and intraoperative mapping and monitoring: increasing safety and efficacy in glioma surgery. Neurosurg Focus. 2015;38(1):E3.
3. Ruohonen J, Karhu J. Navigated transcranial magnetic stimulation. Neuro-physiol Clin. 2010;40(1):7–17.
4. Tarapore PE, Tate MC, Findlay AM, Honma SM, Mizuiri D, Berger MS, Naga-rajan SS. Preoperative multimodal motor mapping: a comparison of mag-netoencephalography imaging, navigated transcranial magnetic stimula-tion, and direct cortical stimulation. J Neurosurg. 2012;117(2):354–62.
5. Krieg SM, Shiban E, Buchmann N, Gempt J, Foerschler A, Meyer B, Ringel F. Utility of presurgical navigated transcranial magnetic brain stimula-tion for the resection of tumors in eloquent motor areas. J Neurosurg. 2012;116(5):994–1001.
6. Picht T, Schmidt S, Brandt S, Frey D, Hannula H, Neuvonen T, Karhu J, Vajkoczy P, Suess O. Preoperative functional mapping for rolandic brain tumor surgery: comparison of navigated transcranial magnetic stimulation to direct cortical stimulation. Neurosurgery. 2011;69(3):581–8 (discussion 588).
7. Forster MT, Hattingen E, Senft C, Gasser T, Seifert V, Szelenyi A. Navigated transcranial magnetic stimulation and functional magnetic resonance imaging: advanced adjuncts in preoperative planning for central region tumors. Neurosurgery. 2011;68(5):1317–24 (discussion 1324–1315).
8. Krieg SM, Sabih J, Bulubasova L, Obermueller T, Negwer C, Janssen I, Shiban E, Meyer B, Ringel F. Preoperative motor mapping by navigated transcranial magnetic brain stimulation improves outcome for motor eloquent lesions. Neuro Oncol. 2014;16(9):1274–82.
9. Frey D, Schilt S, Strack V, Zdunczyk A, Rosler J, Niraula B, Vajkoczy P, Picht T. Navigated transcranial magnetic stimulation improves the treatment outcome in patients with brain tumors in motor eloquent locations. Neuro Oncol. 2014;16(10):1365–72.
10. Krieg SM, Sollmann N, Obermueller T, Sabih J, Bulubas L, Negwer C, Moser T, Droese D, Boeckh-Behrens T, Ringel F, et al. Changing the clinical course of glioma patients by preoperative motor mapping with navigated transcranial magnetic brain stimulation. BMC Cancer. 2015;15:231.
11. Wassermann EM. Variation in the response to transcranial magnetic brain stimulation in the general population. Clin Neurophysiol. 2002;113(7):1165–71.
12. Kiers L, Cros D, Chiappa KH, Fang J. Variability of motor potentials evoked by transcranial magnetic stimulation. Electroencephalogr Clin Neuro-physiol. 1993;89(6):415–23.
13. Saisanen L, Julkunen P, Niskanen E, Danner N, Hukkanen T, Lohioja T, Nurkkala J, Mervaala E, Karhu J, Kononen M. Motor potentials evoked by navigated transcranial magnetic stimulation in healthy subjects. J Clin Neurophysiol. 2008;25(6):367–72.
14. Picht T, Strack V, Schulz J, Zdunczyk A, Frey D, Schmidt S, Vajkoczy P. Assessing the functional status of the motor system in brain tumor patients using transcranial magnetic stimulation. Acta Neurochir (Wien). 2012;154(11):2075–81.
15. Darling WG, Wolf SL, Butler AJ. Variability of motor potentials evoked by transcranial magnetic stimulation depends on muscle activation. Exp Brain Res. 2006;174(2):376–85.
16. Fadiga L, Fogassi L, Pavesi G, Rizzolatti G. Motor facilitation during action observation: a magnetic stimulation study. J Neurophysiol. 1995;73(6):2608–11.
17. Cueva AS, Galhardoni R, Cury RG, Parravano DC, Correa G, Araujo H, Cecilio SB, Raicher I, Toledo D, Silva V, et al. Normative data of cortical excitability measurements obtained by transcranial magnetic stimulation in healthy subjects. Clin Neurophysiol. 2016;46(1):43–51.
18. Bashir S, Perez JM, Horvath JC, Pascual-Leone A. Differentiation of motor cortical representation of hand muscles by navigated mapping of optimal TMS current directions in healthy subjects. J Clin Neurophysiol. 2013;30(4):390–5.

Page 15 of 15Sollmann et al. BMC Neurosci (2017) 18:5
• We accept pre-submission inquiries
• Our selector tool helps you to find the most relevant journal
• We provide round the clock customer support
• Convenient online submission
• Thorough peer review
• Inclusion in PubMed and all major indexing services
• Maximum visibility for your research
Submit your manuscript atwww.biomedcentral.com/submit
Submit your next manuscript to BioMed Central and we will help you at every step:
19. Kallioniemi E, Pitkanen M, Saisanen L, Julkunen P. Onset latency of motor evoked potentials in motor cortical mapping with neuronavigated tran-scranial magnetic stimulation. Open Neurol J. 2015;9:62–9.
20. Bulubas L, Sabih J, Wohlschlaeger A, Sollmann N, Hauck T, Ille S, Ringel F, Meyer B, Krieg SM. Motor areas of the frontal cortex in patients with motor eloquent brain lesions. J Neurosurg. 2016;125(6):1431–42.
21. Sollmann N, Tanigawa N, Bulubas L, Sabih J, Zimmer C, Ringel F, Meyer B, Krieg SM. Clinical factors underlying the inter-individual variability of the resting motor threshold in navigated transcranial magnetic stimulation motor mapping. Brain Topogr. 2016. doi:10.1007/s10548-016-0536-9.
22. Krieg SM, Shiban E, Buchmann N, Meyer B, Ringel F. Presurgical navigated transcranial magnetic brain stimulation for recurrent gliomas in motor eloquent areas. Clin Neurophysiol. 2013;124(3):522–7.
23. Rossini PM, Barker AT, Berardelli A, Caramia MD, Caruso G, Cracco RQ, Dimitrijevic MR, Hallett M, Katayama Y, Lucking CH, et al. Non-invasive electrical and magnetic stimulation of the brain, spinal cord and roots: basic principles and procedures for routine clinical application. Report of an IFCN committee. Electroencephalogr Clin Neurophysiol. 1994;91(2):79–92.
24. Venables WN, Ripley BD. Modern applied statistics with S. 4th ed. New York: Springer; 2002.
25. Fox J. Effects displays in R for generalized linear models. J Stat Soft. 2003;8(15):1–27.
26. Abramowitz M, Stegun IA. Handbook of mathematical functions. 1st ed. New York: Dover Publications; 1965.
27. Cohen J. Statistical power analysis for the behavioral sciences. 2nd ed. Hillsdale: Lawrence Earlbaum Associates; 1988.
28. Cohen J, Cohen P, West SG, Aiken LS. Applied multiple regression/cor-relation analysis for the behavioral sciences. 3rd ed. Mahwah: Lawrence Earlbaum Associates; 2003.
29. Raudenbush S, Bryk A. Hierarchical linear models. 2nd ed. Thousand Oaks: Sage Publications; 2002.
30. A priori sample size calculator for hierarchical multiple regression. http://danielsoper.com/statcalc3/calc.aspx?id=16/.
31. Livingston SC, Goodkin HP, Ingersoll CD. The influence of gender, hand dominance, and upper extremity length on motor evoked potentials. J Clin Monit Comput. 2010;24(6):427–36.
32. van der Kamp W, Zwinderman AH, Ferrari MD, van Dijk JG. Cortical excit-ability and response variability of transcranial magnetic stimulation. J Clin Neurophysiol. 1996;13(2):164–71.
33. Livingston SC, Friedlander DL, Gibson BC, Melvin JR. Motor evoked poten-tial response latencies demonstrate moderate correlations with height and limb length in healthy young adults. Neurodiagn J. 2013;53(1):63–78.
34. Iuchi T, Kuwabara K, Matsumoto M, Kawasaki K, Hasegawa Y, Sakaida T. Levetiracetam versus phenytoin for seizure prophylaxis during and early after craniotomy for brain tumours: a phase II prospective, randomised study. J Neurol Neurosurg Psychiatry. 2015;86(10):1158–62.
35. Fonkem E, Bricker P, Mungall D, Aceves J, Ebwe E, Tang W, Kirmani B. The role of levetiracetam in treatment of seizures in brain tumor patients. Front Neurol. 2013;4:153.
36. Reis J, Wentrup A, Hamer HM, Mueller HH, Knake S, Tergau F, Oertel WH, Rosenow F. Levetiracetam influences human motor cortex excitability mainly by modulation of ion channel function—a TMS study. Epilepsy Res. 2004;62(1):41–51.
37. Sohn YH, Kaelin-Lang A, Jung HY, Hallett M. Effect of levetiracetam on human corticospinal excitability. Neurology. 2001;57(5):858–63.
38. Solinas C, Lee YC, Reutens DC. Effect of levetiracetam on cortical excitability: a transcranial magnetic stimulation study. Eur J Neurol. 2008;15(5):501–5.
39. Madeja M, Margineanu DG, Gorji A, Siep E, Boerrigter P, Klitgaard H, Speckmann EJ. Reduction of voltage-operated potassium currents by levetiracetam: a novel antiepileptic mechanism of action? Neuropharma-cology. 2003;45(5):661–71.
40. Niespodziany I, Klitgaard H, Margineanu DG. Levetiracetam inhibits the high-voltage-activated Ca(2+) current in pyramidal neurones of rat hip-pocampal slices. Neurosci Lett. 2001;306(1–2):5–8.
41. Cakar E, Akyuz G, Durmus O, Bayman L, Yagci I, Karadag-Saygi E, Gunduz OH. The relationships of motor-evoked potentials to hand dexterity, motor function, and spasticity in chronic stroke patients: a transcranial magnetic stimulation study. Acta Neurol Belg. 2016;116(4):481–7.
42. Koski L, Schrader LM, Wu AD, Stern JM. Normative data on changes in transcranial magnetic stimulation measures over a ten hour period. Clin Neurophysiol. 2005;116(9):2099–109.
43. Triggs WJ, Calvanio R, Macdonell RA, Cros D, Chiappa KH. Physiological motor asymmetry in human handedness: evidence from transcranial magnetic stimulation. Brain Res. 1994;636(2):270–6.
44. Forster MT, Senft C, Hattingen E, Lorei M, Seifert V, Szelenyi A. Motor cor-tex evaluation by nTMS after surgery of central region tumors: a feasibility study. Acta Neurochir (Wien). 2012;154(8):1351–9.
45. Robles SG, Gatignol P, Lehericy S, Duffau H. Long-term brain plasticity allowing a multistage surgical approach to World Health Organization Grade II gliomas in eloquent areas. J Neurosurg. 2008;109(4):615–24.
46. Southwell DG, Hervey-Jumper SL, Perry DW, Berger MS. Intraoperative mapping during repeat awake craniotomy reveals the functional plastic-ity of adult cortex. J Neurosurg. 2016;124(5):1460–69.
47. Takahashi S, Jussen D, Vajkoczy P, Picht T. Plastic relocation of motor cortex in a patient with LGG (low grade glioma) confirmed by NBS (navi-gated brain stimulation). Acta Neurochir (Wien). 2012;154(11):2003–8 (discussion 2008).
48. Krieg SM, Buchmann NH, Gempt J, Shiban E, Meyer B, Ringel F. Diffusion tensor imaging fiber tracking using navigated brain stimulation—a feasibility study. Acta Neurochir (Wien). 2012;154(3):555–63.
49. Conti A, Raffa G, Granata F, Rizzo V, Germano A, Tomasello F. Navigated transcranial magnetic stimulation for “somatotopic” tractography of the corticospinal tract. Neurosurgery. 2014;10(Suppl 4):542–54 (discussion 554).
50. Frey D, Strack V, Wiener E, Jussen D, Vajkoczy P, Picht T. A new approach for corticospinal tract reconstruction based on navigated transcranial stimulation and standardized fractional anisotropy values. NeuroImage. 2012;62(3):1600–9.
51. Weiss C, Tursunova I, Neuschmelting V, Lockau H, Nettekoven C, Oros-Peusquens AM, Stoffels G, Rehme AK, Faymonville AM, Shah NJ, et al. Improved nTMS- and DTI-derived CST tractography through anatomical ROI seeding on anterior pontine level compared to internal capsule. Neuroimage Clin. 2015;7:424–37.