the value relevance of accounting figures in the oil & gas …€¦ · · 2018-05-04the value...
TRANSCRIPT
The Value Relevance of Accounting Figures in the Oil
& Gas Industry: Cash Flow or Accruals?
Bård Misund*
University of Stavanger Business School
Petter Osmundsen
Department of Industrial Economics, Faculty of Science and Technology,
University of Stavanger
[Published in Petroleum Accounting and Financial Management Journal 34(2),
(Summer 2015), 90-110]
*Corresponding author: Bård Misund, Associate Professor, University of
Stavanger Business School, N-4036 Stavanger, Norway, phone: +47 51 83 19 08,
fax: 51 83 17 54, email: [email protected].

1
The Value Relevance of Accounting Figures in the Oil
& Gas Industry: Cash Flow or Accruals?
Abstract
This paper studies financial statement information from the largest oil and gas
companies and evaluates their relation to firm market value. The accounting
literature states that an important feature of financial statements and, in particular
net income, is the usefulness for predicting future cash flows. However, financial
analysts covering this sector prefer a number of alternative non-GAAP income
measures to disclosed net income. Using a dataset of 72 largest integrated and
exploration and production companies (E&Ps) during 1993-2013, we examine the
relative value-relevance of net income versus eight alternative profitability
measures. Despite the analyst preference for non-GAAP measures, our results
suggest that net income is the most value relevant earnings measure for integrated
oil & gas companies. By contrast, cash flow measures dominate for exploration and
production companies. However, we find that free cash flow, which many oil
company analysts refer to these days, has low value relevance.
Keywords: Company Valuation, Value-relevance, Financial Analysts, Oil & Gas
Industry
JEL codes: M21, M40, G12, Q49

2
1. Introduction
This paper studies the value-relevance of GAAP and non-GAAP accounting
measures commonly used by oil company financial analysts. This is important since
the accounting literature states that an important role of financial statements and
earnings is usefulness for predicting future cash flows (Lev 1989). However, the
relevance of historical cost accounting for the oil and gas sector has long been
questioned:
An important quality of information that is useful in making rational
investment, credit, and similar decisions is its predictive value -
specifically, its usefulness in assessing the amounts, timing, and
uncertainty of prospective net cash inflows to the enterprise. Historical
cost based financial statements for oil and gas producing enterprises
have limited predictive value. Their usefulness is further reduced
because a uniform accounting method is not required to be used for
costs incurred in oil and gas producing activities (FASB 1982).
Several reasons have been put forward, including industry specific traits and
accounting method discretion. According to Wright & Gallun (2005), exploration
and production has certain characteristics that distinguish them from other
operations involving asset acquisition and use. The authors list the following
defining features:
3
1. Risks are high and often there is a low probability of discovering
commercial reserves
2. There is often a long time lag between acquiring permits and
licenses and the ultimate production of reserves
3. There is no necessary correlation between expenditures and results
4. The underlying value of the reserves (which represent the major
economic worth of a company) cannot be valued reliably enough to
be recorded on the balance sheet.
5. The discovery of new reserves, which cannot be valued reliably
enough to be recorded as income, is a major future income-earning
event.
6. High costs and risks often result in joint operations.
These complexities make standard setting for the petroleum industry quite
challenging. An issue widely discussed in the accounting literature is the topic of
capitalization of pre-discovery expenses for oil and gas producers. For around 50
years, oil and gas companies have been using two competing methods for
capitalizing exploration expenses (Zeff 1978). Under the full cost (FC) method, oil
and gas explorers can capitalize all expenses, both from dry wells and successful
oil and gas discoveries. According to the alternative method, the successful efforts
method (SE), only expenses from successful well discoveries are allowed to be
capitalized. The literature suggests that the value-relevance of oil & gas company
accounting information is affected by accounting method choice (Collins, Rozeff

4
& Dhaliwal, 1981; Harris & Ohlson 1987; Bandyopadhyay 1994; Bryant 2003;
Misund, Osmundsen & Sikveland 2015). This effect can be explained by the
negative effect that accounting heterogeneity can have on comparability of
company profitability (DeFond & Hung 2003). Moreover, if the management use
their discretion to opportunistically manipulate accruals; this will have an adverse
effect on earnings as a reliable measure of firm performance (Dechow 1994). The
consequence is that investors could prefer cash flows, or even construe their own
performance measures. Survey evidence suggests that analysts covering the
petroleum sector do in fact rely on alternative performance measures (Quirin, Berry
& O’Brien 2000). Moreover, the extant literature do suggest that cash flow from
operations is more value relevant than earnings (Quirin, Berry & O’Brien 2000;
Cormier & Magnan 2002; Misund, Asche & Osmundsen 2008; Misund 2015).
However, the limitation of these studies is that they only compare two metrics,
namely earnings and cash flow from operations. However, industry analysts seem
to use other metrics, such as NOPAT (which is used in return on average capital
employed calculations) and DACF (USB 2003; Osmundsen, Asche, Misund &
Mohn 2006). Moreover, these studies do not separate between integrated and E&P
companies. It is possible that investors may have more confidence in the accounting
information of the integrated oil and gas firms.
We posit that the existence of multiple methods of accounting for oil and gas assets,
coupled with particular operating characteristics inherent in oil and gas activities
may explain why analysts covering the petroleum sector typically do not consider
5
Net Income (NI) to be the preferred accounting profit measure. In fact, one of the
accounting figures they prefer to net income is Net Operating Profit After Tax
(NOPAT), which is used as the numerator in the performance measure Return On
Average Capital Employed (ROACE) (UBS Warburg, 2003; Osmundsen, Asche,
Misund & Mohn 2006; Osmundsen, Mohn, Misund & Asche 2007). Moreover,
analysts in this sector have constructed a unique cash flow measure, Debt-Adjusted
Cash Flow (DACF) most probably due to lack of confidence in other measures
(UBS Warburg 2003). These accounting figures have several applications; for
example, they are used in performance measures, such as return on average capital
employed (RoACE), in valuation multiples, such as the Enterprise Value to debt
adjusted cash flow (EV/DACF), and presumably to facilitate in predicting future
cash flows. Most likely, these accounting measures are chosen because they are
thought to be relevant to performance measurement, and especially to valuation.
Hence, the case may be that certain non-GAAP accounting amounts are in fact more
value relevant than net income, and should therefore be the preferred choice among
analysts. In fact, there are indications that operating cash flow (Cormier & Magnan
2002; Misund, Asche & Osmundsen 2008; Misund 2015) and discretionary cash
flow (Quirin, Berry & O’Brien 2000) may be more value relevant than accounting
earnings in the oil and gas industry, which is the opposite from findings in cross-
sectional studies (Dechow 1994). However, there has been little academic research
to substantiate the relative value-relevance of accounting measures commonly used
by analysts. This is what this study seeks to shed some light on. Since there might

6
be differences between integrated and exploration and production companies
(E&Ps), we also compare these two types of oil and gas companies.
We expand Quirin, Berry & O’Brien’s (2000) and Cormier & Magnan’s (2002)
study by examining variables commonly used by financial analysts covering the
largest international oil companies. Furthermore, we apply statistical methodology
(the Vuong test: Vuong 1989) to specifically uncover whether certain accounting
measures are significantly more value relevant than others.
We apply value-relevance methodology based on the Ohlson (1995) residual
income valuation model to contrast the value-relevance of GAAP vs non-GAAP
figures. Using a dataset of 72 integrated and exploration and production companies
over 1991-2013, we examine the relative value-relevance of net income vs. seven
alternative accounting figures. These alternative measures include profit and cash
flow figures that are typically found in financial analysts’ reports: (1) GAAP
measures such as earnings before interest and taxes (EBIT) and Cash Flow from
Operations (CFO); and (2) non-GAAP measures that are constructed by analysts
such as Earnings before Interest, Taxes, Depreciation and Amortization (EBITDA),
NOPAT, DACF, and Funds from Operations (FFO).
We extend the literature by also examining integrated international oil and gas
companies, whereas previous studies have largely concentrated on US companies
whose primary business involves exploration, development and production (E&P)

7
of oil and gas (e.g. Quirin, Berry & O’Brien 2000; Berry & Wright 2001; Bryant
2003). Studies of the value-relevance of accounting information from US E&P
companies typically consider a large number of companies for periods of 2-4 years
(e.g. Quirin, Berry & O’Brien 2000; Berry & Wright 2001; Bryant 2003). By
contrast, our data set (1993-2013), allows us to investigate market and company
behaviour over 20 years, covering a least one full oil price cycle. This enables us to
take advantage of additional information in the time-series dimension.
Our results suggest that net income is the most value relevant earnings measure for
integrated oil & gas companies. By contrast, cash flow measures dominate for
exploration and production companies. Hence, our findings provide support for the
use of non-accrual profitability measures for only a subset of oil & gas companies.
The remainder of the paper is organized as follows. In the next section we provide
an overview of the literature. In Section 3 we describe the research design,
econometric specification and hypothesis development. Section 4 describes the data
and in Section 5 we present the results and discussion. In the last section we
conclude our findings.
2. Literature review
According to the accounting literature, financial statements and earnings serve a
key role in predicting future cash flows (Lev 1989). In fact, the FASB Statement of
Financial Accounting Concepts No.1. states that:

8
The primary focus of financial reporting is information about an
enterprise’s performance provided by measures of earnings and its
components. Investors, creditors, and others who are concerned
with assessing the prospects for enterprise net cash inflows are
especially interested in that information. Their interest in an
enterprise’s future cash flows leads primarily to an interest in
information about its earnings (FASB 1978).
Moreover,
…information about enterprise earnings and its components
measured by accrual accounting generally provides a better
indication of enterprise performance than does information about
current cash receipts and payments (FASB 1978).
Prior studies often find that earnings are more value-relevant than operating cash
flow (Dechow 1994, Biddle, Seow & Siegel 1995; Rayburn 1986; Sloan 1996).
According to Dechow (1994) cash flows are predicted to suffer more from timing
and matching problems that reduce their ability to reflect firm performance under
certain circumstances, such as a short performance measurement interval, under
conditions of increased volatility of the firm’s working capital requirements and
investment and financing activities, and if the operating cycle is extended.

9
Other studies find that earnings quality has actually decreased in recent years
(Francis & Schipper 1999; Bradshaw & Sloan 2002, Hodge 2003). Moreover, the
comparative value-relevance of earnings versus cash flow might vary with industry
affiliation (see e.g. Biddle, Seow & Siegel 1995; Aharony, Falk & Yehuda 2003).
In fact, the extant literature has suggested that this is the case for the oil and gas
industry. For instance, the value-relevance of earnings has been found to be lower
than cash flows in the oil and gas industry (Quirin, Berry & O’Brien 2000; Cormier
& Magnan 2002; Misund, Asche & Osmundsen 2008; Misund 2015).
Using variables identified by the oil and gas industry financial analysts, Quirin,
Berry & O’Brien (2002) investigate the relationship between fundamentals and
both the market value equity and cumulative stock returns. They find that the
fundamentals provide investors with incremental information beyond earnings,
change in earnings, and book value of equity.
Cormier & Magnan (2002) compare the value relevance of earnings and cash flow
from operations for a sample of Canadian oil and gas firms. Their findings suggest
that cash flow is the performance metric most closely associated with share market
valuation.
Misund, Asche & Osmundsen (2008) investigate if the value-relevance of earnings
and cash flow from operations is affected by industry upheavals and restructuring.

10
While their results suggest that there is a higher value relevance for cash flow
compared to earnings, they find that the value-relevance of cash flows decreased
after the oil & gas industry restructuring of the late 1990s and early 2000s.
Recently, Misund (2015) compares the value relevance of earnings versus cash flow
for a large sample of both U.S., Canadian and international oil and gas firms, both
integrated and E&Ps. He finds evidence that investors place more emphasis on cash
flows than earnings in the oil and gas sector.
The conclusion we can draw from the literature is twofold. First, industry-specific
value-relevance studies can provide important insights into the relation between
accounting figures and market value of equity. Secondly, the findings strongly
suggest that cash flows are more value relevance than earnings in the oil and gas
sector.
3. Research design, econometric specification and hypothesis development
We use standard value-relevance methodology for investigating the relative
importance for valuation of various profitability measures. The theoretical point of
departure is the Ohlson (1995) model which describes how market value is related
to abnormal earnings, book value, and other information
𝑀𝑉𝐸𝑡 = 𝐵𝑉𝑡 + 𝛼1𝑁𝐼𝑡𝑎 + 𝛼2𝒗𝑡, (1)

11
where 𝑀𝑉𝐸𝑡 is the market value of equity at time t, 𝐵𝑉𝑡 is the book value of equity,
𝑁𝐼𝑡𝑎 is abnormal earnings at time t, and 𝑣𝑡 is a vector of ‘other’ relevant information.
The latter are ‘value-relevant event that have yet to have an impact on the financial
statements’ (Ohlson, 1995).
In the value-relevance literature Eq. (1) is typically operationalized as
𝑀𝑉𝐸𝑖𝑡 = 𝛽0 + 𝛽1𝐵𝑉𝑖𝑡 + 𝛽2𝑁𝐼𝑖𝑡 + 𝛽3𝑶𝑰𝒊𝒕 + 𝑢𝑖𝑡, (2)
where 𝑀𝑉𝐸𝑖𝑡, 𝐵𝑉𝑖𝑡, 𝑁𝐼𝑖𝑡 are the market value of equity, book value of equity, and
net income for firm i at time t, respectively. Other information for company i at
time t is represented by the vector 𝑶𝑰𝑖𝑡, while 𝑢𝑖𝑡is the error term.
This approach of operationalization of the Ohlson (1995) model has been critized
in the accounting literature (Holthausen & Watts 2001; Barth, Beaver & Landsman
2001; Kothari 2001). In particular, two issues have been raised. The first relates to
the adverse effects of scale (Ota 2003; Easton & Sommers 2003; Lo 2004; Akbar
& Stark 2003; Barth & Clinch 2009). The literature suggests applying an
appropriate measure of scale to deflate the variables prior to the regressions. The
second issue pertains to the use of a proxy for ‘other information’. Proxies for other
information are sometimes included, other times ignored in the extant value
relevance literature. Several authors have discussed the negative effects of
excluding proxies for ‘other information’ (Ohlson 2001; Liu & Ohlson 1999; Hand

12
2001). Excluding important explanatory variables can lead to the omitted variable
bias in the empirical model, creating problems in terms of the interpretation of the
regression coefficients. Fortunately, panel data models are an approach commonly
used in econometrics to capture the effects of unobserved variables. We follow
studies such as Boone (2002) and Misund (2015) which have applied fixed effects
model to control for unobserved variables in oil & gas accounting studies.
Furthermore, we control for the presence of heteroskedasticity and serial correlation
in the residuals from fixed effects models using the approach suggested by Arellano
(1987). Fixed effects can be applied both in the time and firm dimension. Including
fixed effects in our analysis results in the following empirical model
𝑀𝑉𝐸𝑖𝑡 = 𝛽0 + 𝛽1𝐵𝑉𝑖𝑡 + 𝛽2𝑁𝐼𝑡 + 𝛽3𝑂𝐼𝑖𝑡 + 𝑭𝑬𝒕 + 𝑭𝑬𝒊 + 𝜖𝑖𝑡, (3)
where 𝑭𝑬𝒕 are time fixed effects and 𝑭𝑬𝒊 which are firm fixed effects, and 𝜖𝑖𝑡 is
the error term. Model (3) represents our benchmark model, which will be tested
against alternative value-relevance models.
The value-relevance of accounting information: alternative models
To contrast the value relevance of alternative accounting figures to that of net
income, we substitute NI in Equation (3) with Xi, where Xi represents the seven
other accounting measures:
𝑀𝑉𝐸𝑖𝑡 = 𝛽0 + 𝛽1𝐵𝑉𝑖𝑡 + 𝛽2𝑋𝑡 + 𝛽3𝑂𝐼𝑖𝑡 + 𝑭𝑬𝒕 + 𝑭𝑬𝒊 + 𝜀𝑖𝑡, (4)

13
This equation gives the alternative version of the model in equation (3). In the
empirical analysis, we will estimate Eq. (3) and several regression of Eq. (4) using
the alternative accounting figures.
Choice of accounting figures
We consider the following seven financial statement figures (in addition to book
value of equity) in our analysis:
1. Net income (NI): We use net income from continuing operations as NI in our
study. In this manner we exclude all extraordinary profit/losses as well as the impact
of non-continuing operations.
2. Net Operating Profit After Tax (NOPAT): Net operating profit after taxes
(NOPAT) is calculated as NI adjusted for after tax interest expense, i.e. we add back
after tax net interest expense. We use the recurring tax rate on earnings before tax
as the tax rate.
3. Earnings Before Interest, Taxes, Depreciation and Amortization (EBITDA): To
calculate Earnings before interest, taxes, depreciation and amortization (EBITDA)
we start with net income before income taxes, and add back net interest expenses
and depreciation and amortization charges.

14
4. Earnings Before Interest and Taxes (EBIT): Earnings before interest and taxes is
calculated as EBITDA less depreciation and amortization charges.
5. Funds From Operations (FFO): Funds from operations is calculated as NI plus
depreciation and amortization.
6. Debt-Adjusted Cash Flow (DACF): Debt-adjusted cash flow is calculated as FFO
plus after tax interest expense, i.e. we add back after tax net interest expense. We
use the recurring tax rate on earnings before tax as the relevant tax rate.
7. Cash Flow from Operations (CFO): We use net cash provided by operating
activities as CFO
Hypotheses
In order to ascertain whether the value-relevance of one of the alternative
accounting figures is higher than for net income we apply the Vuong test (Vuong
1989). This is a conventional approach in the extant value-relevance literature (see
e.g. Dechow 1994). We use the Vuong likelihood ratio statistic to assess the
statistical significance of the differences in R2 between the benchmark model and
the alternative models.
The null hypothesis is that two competing models equally fit the data. The Vuong
Z-statistic is directional; a significant and positive Z-statistic will indicate that our
15
benchmark model fits the data better than the alternative model. Hence, this will
indicate that net income is more value-relevant than an alternative accounting
measure. Conversely, a negative Z-statistic indicates that the alternative accounting
figure is more value-relevant than net income.
4. Sample data
The sample consists of 72 of the largest international oil and gas companies for the
years 1991-2013. Accounting data and the amounts of proven oil and gas reserves
were retrieved from the J.S. Herold database (www.ihs.com/herold). As a measure
of market value we use market capitalization as at year-end. Market value of equity,
accounting figures and book equity are all scaled by year-end values of amount of
oil and gas reserves, and are denoted in US$/barrels of oil equivalent (US$/boe).
Our data set includes a total of 1007 firm-years. Descriptive statistics for the
variables in our models are reported in Tables 1 and 2.

16
Table 1
Descriptive statistics for integrated oil and gas companies
Mean St.dev 25 percentile Median 75 percentile
MVE 13.07 12.50 5.23 10.21 16.07
BVE 7.45 8.77 2.83 4.72 8.94
EBITDA 2.98 2.97 1.10 2.11 3.89
EBIT 2.04 2.16 0.72 1.32 2.71
NI 1.13 1.26 0.41 0.79 1.39
NOPAT 1.29 1.44 0.49 0.90 1.54
FFO 2.11 2.17 0.81 1.54 2.58
DACF 2.22 2.29 0.88 1.62 2.72
CFO 2.11 2.17 0.82 1.53 2.53
FCFF 0.43 1.30 0.01 0.28 0.76
Note: MVE is the market value of equity, BVE is the book value of equity, EBITDA is earnings
before interest, taxes, depreciation and amortization, EBIT is earnings before interest and taxes, NI
is net income, NOPAT is net operating profit after tax, FFO is funds from operations, DACF is debt
adjusted cash flow, CFO is cash flow from operations, and FCFF is free cash flow to the firm. All
variables are scales by the amount of oil and gas reserves (in barrels of oil equivalent).
17
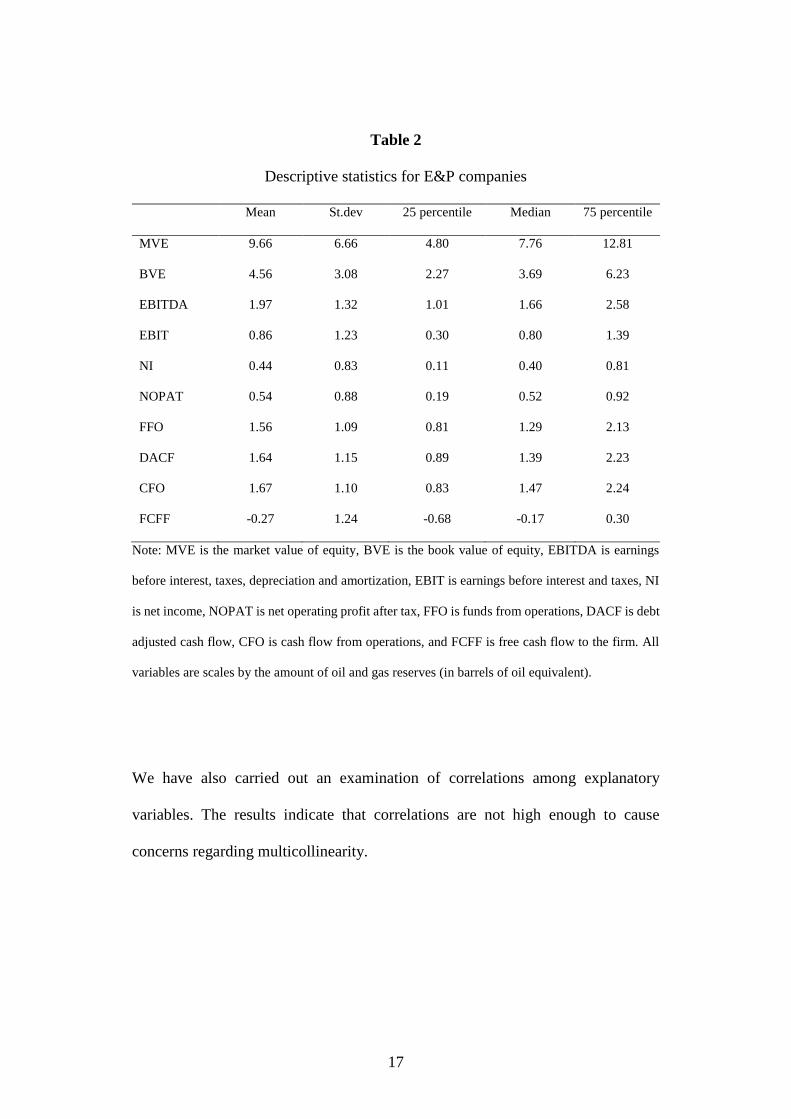
Table 2
Descriptive statistics for E&P companies
Mean St.dev 25 percentile Median 75 percentile
MVE 9.66 6.66 4.80 7.76 12.81
BVE 4.56 3.08 2.27 3.69 6.23
EBITDA 1.97 1.32 1.01 1.66 2.58
EBIT 0.86 1.23 0.30 0.80 1.39
NI 0.44 0.83 0.11 0.40 0.81
NOPAT 0.54 0.88 0.19 0.52 0.92
FFO 1.56 1.09 0.81 1.29 2.13
DACF 1.64 1.15 0.89 1.39 2.23
CFO 1.67 1.10 0.83 1.47 2.24
FCFF -0.27 1.24 -0.68 -0.17 0.30
Note: MVE is the market value of equity, BVE is the book value of equity, EBITDA is earnings
before interest, taxes, depreciation and amortization, EBIT is earnings before interest and taxes, NI
is net income, NOPAT is net operating profit after tax, FFO is funds from operations, DACF is debt
adjusted cash flow, CFO is cash flow from operations, and FCFF is free cash flow to the firm. All
variables are scales by the amount of oil and gas reserves (in barrels of oil equivalent).
We have also carried out an examination of correlations among explanatory
variables. The results indicate that correlations are not high enough to cause
concerns regarding multicollinearity.

18
5. Results and discussion
In this section we present the results from the value-relevance regressions of 7
different measures of profitability. We analyse E&P and integrated companies
separately, as well as the pooled sample. Vuong tests allow us to assess whether
one of the profitability measures is more value relevant than the others.
Table 3 provides the result of the econometric estimation for the entire sample of
oil and gas firms. Significant parameters on nearly all the investigated accounting
variables provide evidence that they are value-relevant. This result does not provide
support for the claim that accruals have limited value for evaluating oil and gas
company profitability. Our results do suggest that historical cost accounting
provides value-relevant information to the financial community. The only
exception is the FCFF measure. This latter variable is free cash flow metric, i.e.
after investments, indicating that the investors are sceptical to oil and gas
companies’ investment ability. This is the topic of Jensen’s (1986; 1988) seminal
work on the free cash flow theory for dividend policy.
Table 4 presents the results from the Vuong test, allowing us to distinguish between
the variables in terms of their value-relevance. The tests show that all profitability
measures are more value-relevant than FCFF. Moreover, EBITDA seems to
outperform the cash flow measures (except CFO). However, the tests do not reveal
any other differences between the metrics.

19
Table 3
Regression results (entire oil&gas sample)
EBITDA EBIT NI NOPAT FFO DACF CFO FCFF
BVE 0.330*** 0.565*** 0.613*** 0.620*** 0.478*** 0.516*** 0.419*** 0.807***
X 1.835*** 1.392*** 2.075*** 1.720*** 1.826*** 1.507*** 1.817*** 0.273
R2-adj
(within)
0.347 0.334 0.340 0.364 0.331 0.324 0.335 0.288
Note: X refers to the following 7 profitability measures: EBITDA is earnings before interest, taxes,
depreciation and amortization, EBIT is earnings before interest and taxes, N is net income, NOPAT
is net operating profit after tax, FFO is funds from operations, DACF is debt adjusted cash flow,
CFO is cash flow from operations, and FCFF is free cash flow to the firm. BVE is book value of
equity. All variables are scales by the amount of oil and gas reserves (in barrels of oil equivalent).
Table 4
Results from the Vuong test (entire oil&gas sample)
EBITDA EBIT NI NOPAT FFO DACF CFO FCFF
EBITDA 0.748 0.368 0.772 1.716** 2.312** 0.308 2.526***
EBIT -0.748 -0.670 0.192 0.151 0.510 -0.029 2.441***
NI -0.368 0.670 1.027 0.399 0.748 0.158 2.193**
NOPAT -0.772 -0.192 -1.027 0.067 0.458 -0.085 1.988**
FFO -1.716 -0.151 -0.299 -0.067 1.218 -0.142 1.741**
DACF -2.312 -0.510 -0.748 -0.458 -1.281 -0.400 1.594*
CFO -0.308 0.029 -0.158 0.085 0.142 0.400 1.795**
FCFF -2.526 -2.441 -2.193 -1.988 -1.741 -1.594 -1.795
Note: EBITDA is earnings before interest, taxes, depreciation and amortization, EBIT is earnings
before interest and taxes, N is net income, NOPAT is net operating profit after tax, FFO is funds
from operations, DACF is debt adjusted cash flow, CFO is cash flow from operations, and FCFF is
20
free cash flow to the firm. All variables are scales by the amount of oil and gas reserves (in barrels
of oil equivalent).
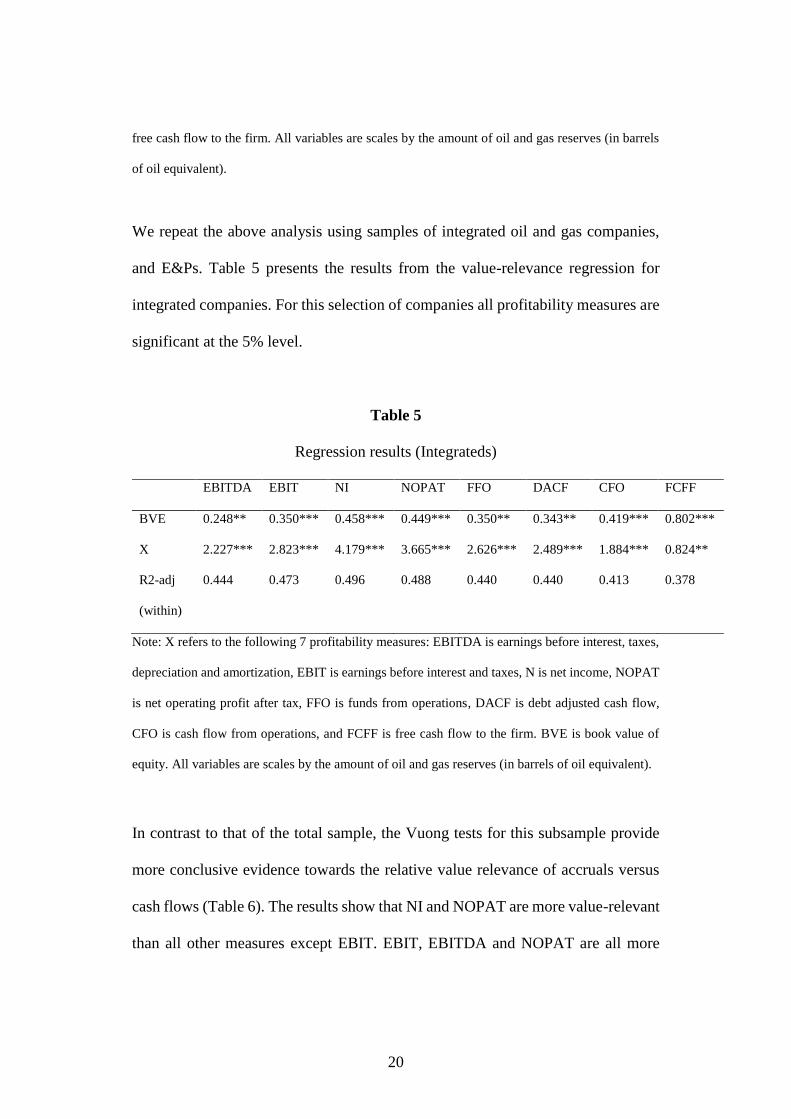
We repeat the above analysis using samples of integrated oil and gas companies,
and E&Ps. Table 5 presents the results from the value-relevance regression for
integrated companies. For this selection of companies all profitability measures are
significant at the 5% level.
Table 5
Regression results (Integrateds)
EBITDA EBIT NI NOPAT FFO DACF CFO FCFF
BVE 0.248** 0.350*** 0.458*** 0.449*** 0.350** 0.343** 0.419*** 0.802***
X 2.227*** 2.823*** 4.179*** 3.665*** 2.626*** 2.489*** 1.884*** 0.824**
R2-adj
(within)
0.444 0.473 0.496 0.488 0.440 0.440 0.413 0.378
Note: X refers to the following 7 profitability measures: EBITDA is earnings before interest, taxes,
depreciation and amortization, EBIT is earnings before interest and taxes, N is net income, NOPAT
is net operating profit after tax, FFO is funds from operations, DACF is debt adjusted cash flow,
CFO is cash flow from operations, and FCFF is free cash flow to the firm. BVE is book value of
equity. All variables are scales by the amount of oil and gas reserves (in barrels of oil equivalent).
In contrast to that of the total sample, the Vuong tests for this subsample provide
more conclusive evidence towards the relative value relevance of accruals versus
cash flows (Table 6). The results show that NI and NOPAT are more value-relevant
than all other measures except EBIT. EBIT, EBITDA and NOPAT are all more
21
value-relevant than CFO and FCFF. The results clearly suggest that accruals are
value-relevant for integrated oil and gas companies. There might be several reasons
for this finding. First, the integrated firms without exception apply a uniform
accounting method for pre-exploration costs, i.e. successful efforts. This facilitates
the comparison of profitability across firms. Secondly, the integrated companies are
also the largest. Consequently, they are followed by a larger community of analysts,
providing a larger amount of analysis and earnings estimates. Finally, Return on
average capital employed is a popular performance measure for oil and gas majors
(UBS Warburg 2003; Osmundsen, Asche, Misund & Mohn 2006; Osmundsen,
Mohn, Asche & Misund 2007). Our results suggest that the numerator in this
performance indicator is one of the most value-relevant of the seven accounting
measures investigated.

22
Table 6
Results from the Vuong test (Integrateds)
EBITDA EBIT NI NOPAT FFO DACF CFO FCFF
EBITDA -1.257 -1.923 -1.606 0.247 0.194 0.861 1.646**
EBIT 1.257 -1.234 -0.735 0.986 0.963 1.462* 2.411***
NI 1.923** 1.234 0.783 1.925** 1.909** 1.713** 2.487***
NOPAT 1.606* 0.735 -0.783 1.680** 1.757** 1.506* 2.339***
FFO -0.247 -0.986 -1.925 -1.680 -0.102 0.594 1.281*
DACF -0.194 -0.963 -1.909 -1.757 0.102 0.601 1.301*
CFO -0.861 -1.462 -1.713 -1.506 -0.594 -0.601 0.862
FCFF -1.646 -2.411 -2.487 -2.339 -1.281 -1.301 -0.862
Note: EBITDA is earnings before interest, taxes, depreciation and amortization, EBIT is earnings
before interest and taxes, N is net income, NOPAT is net operating profit after tax, FFO is funds
from operations, DACF is debt adjusted cash flow, CFO is cash flow from operations, and FCFF is
free cash flow to the firm. All variables are scales by the amount of oil and gas reserves (in barrels
of oil equivalent).
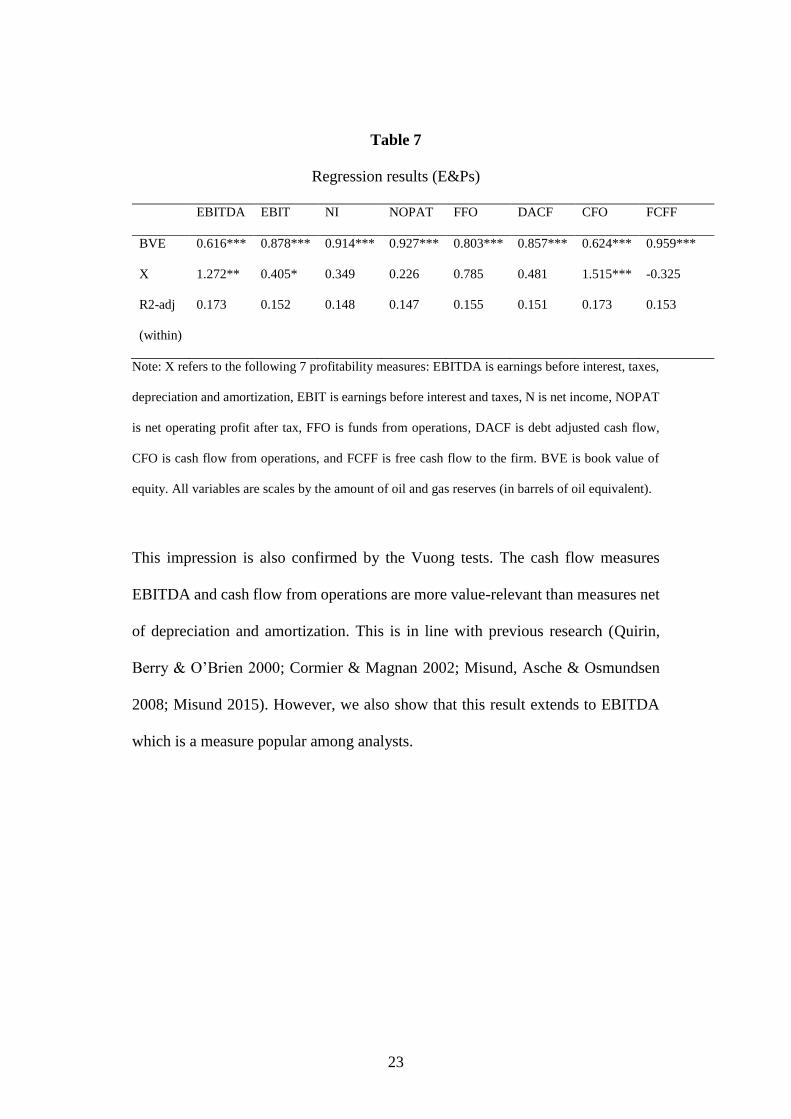
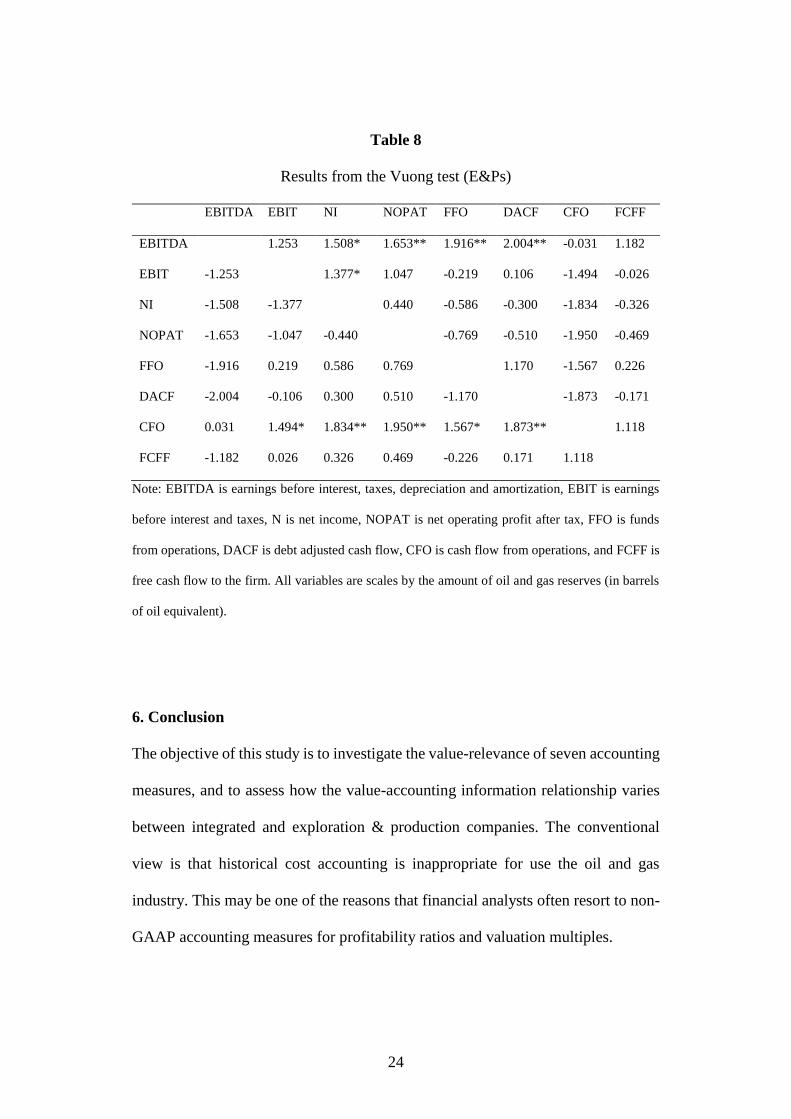
Next we turn to the E&Ps. The regression results are presented in Table 7 and the
Vuong tests in Table 8. In contrast to the integrated companies, accruals do not
seem to be value-relevant for E&Ps. Only EBITDA and CFO are significant at the
5% level.
23
Table 7
Regression results (E&Ps)
EBITDA EBIT NI NOPAT FFO DACF CFO FCFF
BVE 0.616*** 0.878*** 0.914*** 0.927*** 0.803*** 0.857*** 0.624*** 0.959***
X 1.272** 0.405* 0.349 0.226 0.785 0.481 1.515*** -0.325
R2-adj
(within)
0.173 0.152 0.148 0.147 0.155 0.151 0.173 0.153
Note: X refers to the following 7 profitability measures: EBITDA is earnings before interest, taxes,
depreciation and amortization, EBIT is earnings before interest and taxes, N is net income, NOPAT
is net operating profit after tax, FFO is funds from operations, DACF is debt adjusted cash flow,
CFO is cash flow from operations, and FCFF is free cash flow to the firm. BVE is book value of
equity. All variables are scales by the amount of oil and gas reserves (in barrels of oil equivalent).
This impression is also confirmed by the Vuong tests. The cash flow measures
EBITDA and cash flow from operations are more value-relevant than measures net
of depreciation and amortization. This is in line with previous research (Quirin,
Berry & O’Brien 2000; Cormier & Magnan 2002; Misund, Asche & Osmundsen
2008; Misund 2015). However, we also show that this result extends to EBITDA
which is a measure popular among analysts.
24
Table 8
Results from the Vuong test (E&Ps)
EBITDA EBIT NI NOPAT FFO DACF CFO FCFF
EBITDA 1.253 1.508* 1.653** 1.916** 2.004** -0.031 1.182
EBIT -1.253 1.377* 1.047 -0.219 0.106 -1.494 -0.026
NI -1.508 -1.377 0.440 -0.586 -0.300 -1.834 -0.326
NOPAT -1.653 -1.047 -0.440 -0.769 -0.510 -1.950 -0.469
FFO -1.916 0.219 0.586 0.769 1.170 -1.567 0.226
DACF -2.004 -0.106 0.300 0.510 -1.170 -1.873 -0.171
CFO 0.031 1.494* 1.834** 1.950** 1.567* 1.873** 1.118
FCFF -1.182 0.026 0.326 0.469 -0.226 0.171 1.118
Note: EBITDA is earnings before interest, taxes, depreciation and amortization, EBIT is earnings
before interest and taxes, N is net income, NOPAT is net operating profit after tax, FFO is funds
from operations, DACF is debt adjusted cash flow, CFO is cash flow from operations, and FCFF is
free cash flow to the firm. All variables are scales by the amount of oil and gas reserves (in barrels
of oil equivalent).
6. Conclusion
The objective of this study is to investigate the value-relevance of seven accounting
measures, and to assess how the value-accounting information relationship varies
between integrated and exploration & production companies. The conventional
view is that historical cost accounting is inappropriate for use the oil and gas
industry. This may be one of the reasons that financial analysts often resort to non-
GAAP accounting measures for profitability ratios and valuation multiples.
25
Our results indicate that the value relevance of the various measures of profitability
varies between integrated and E&Ps. The results from the total sample are not
convincing for comparing the relative value-relevance of the various measures.
However, the two subsamples provide some interesting insights. While cash flow
measures such as cash flow from operations or EBITDA dominate for E&Ps, net
income and NOPAT dominate for integrated companies.
Our results have some relevant implications. Firstly, analyses of profitability for
E&Ps and integrateds should apply different accounting measures in performance
measures. Secondly, our results also have implications for choice of valuation
multiples. For integrated companies a valuation multiple such as price/earnings is
relevant, while meaningful multiples for E&Ps could be enterprise value/EBITDA
or price/CFO. Finally, the lack of investor confidence in accruals for E&Ps is of
concern. A possible reason is that there is more accounting method heterogeneity
among this group of oil and gas companies. Despite standard setters’ efforts to
arrive at a uniform accounting method, oil and gas company management still have
the discretion to choose between full cost and successful efforts methods, both in
the U.S. and internationally. The result seems to be an adverse effect on value
relevance compared to the integrated companies which apply a uniform accounting
method.
It is worth noting that free cash flow - which many oil company analysts refer to
these days as it signals potential to pay dividends - has low value relevance. The
26
reason is probably that this figure is too short-sighted. A company, for example,
can have an extremely high free cash flow in part because it is putting off necessary
capital expenditures. Similarly, a good company that makes some major capital
investments one year may see its free cash flow take a hit, but may well benefit over
the longer haul. Thus, analysts using free cash flow measures should supplement
them with measures that illustrate the long term potential of the company.
There are also measurement issues to be handled for the free cash flow measure..
The expenditures for maintenances of assets is only part of the capex reported on
the Statement of Cash Flows. It must be separated from the expenditures for growth
purposes. This split is not a requirement under GAAP, and is not audited.
Management is free to disclose maintenance capex or not. Therefore this input to
the calculation of free cash flow may be subject to manipulation, or require
estimation. Since it may be a large number, maintenance capex's uncertainty is the
basis for some people's dismissal of 'free cash flow'.
A second problem with the maintenance capex measurement is its intrinsic
'lumpiness'. By their nature, expenditures for capital assets that will last decades
may be infrequent, but costly when they occur. 'Free cash flow', in turn, will be very
different from year to year. No particular year will be a 'norm' that can be expected
to be repeated. For companies that have stable capital expenditures, free cash flow
will (over the long term) be roughly equal to earnings. For oil companies in a

27
cyclical business, the stability requirement is not satisfied. Thus, free cash flow in
a given year may not have high information value.
Our results should be of interest to oil companies, financial analysts, investors and
financial accounting standard setters.

28
References
Aharony, J., Falk, H., & Yehuda, N., (2003). Corporate Life Cycle and the Value-
relevance of Cash Flow Versus Accrual Financial Information (Working Paper,
Bolzano School of Economics and Management).
Akbar, S. & Stark, A.W. (2003). Discussion of scale and the scale effect in market-
based accounting research. Journal of Business Finance and Accounting (30):
57-72.
Arellano, M. (1987). Computing Robust Standard Errors for Within-groups
Estimators. Oxford Bulletin of Economics and Statistics (49): 431-434.
Bandyopadhyay, S.P. (1994). Market reactions to earnings announcements of
successful efforts and full cost firms in the oil and gas industry. The Accounting
Review (69): 657-674.
Barth, M.E., Beaver, W.H. & Landsman, W.R. (2001). The relevance of the value
relevance literature for financial accounting standard setting. Another view.
Journal of Accounting and Economics (31): 77-104.
Barth, M.E. & Clinch, G. (2009). Scale effects in capital markets-based accounting
research. Journal of Business Finance and Accounting (36): 253-288.
Berry, K.T. & Wright, C.J., (2001). Disclosures: an assessment of the market’s
perception of firms’ effort and ability to discover reserves. Journal of Business
Finance and Accounting (28): 741-769.
Biddle, G.C., Seow, G.S. & Siegel, A. (1995). Relative versus incremental
information content. Contemporary Accounting Research (12): 1-23.
29
Boone J.P. (2002). Revisiting the reportedly weak value-relevance of oil and gas
asset present values: The roles of measurement error, model misspecification,
and time period idiosyncrasy. The Accounting Review (77): 73-106.
Bradshaw, M. & Sloan, R. (2002). GAAP versus the Street: an empirical assessment
of two alternative definitions of earnings. Journal of Accounting Research (40):
41-66.
Bryant, L. (2003). Relative value-relevance of the Successful Efforts and Full Cost
Accounting methods in the oil and gas industry. Review of Accounting Studies
(8): 5-28.
Collins, D.W., Rozeff, M.S. & Dhaliwal, D.S. (1981). The economic determinants
of the market reaction to proposed mandatory accounting changes in the oil and
gas industry: A cross-sectional analysis. Journal of Accounting and Economics
(3): 37-71.
Cormier, D. & Magnan, M. (2002). Performance reporting by oil and gas firms:
contractual and value implications. Journal of International Accounting,
Auditing and Taxation (11): 131-153.
Dechow, P. (1994). Accounting earnings and cash flows as measures of firm
performance: the tole of accounting accruals. Journal of Accounting and
Economics (17): 3-42.
DeFond, M.L. & Hung, M. (2003). An empirical analysis of analysts’ cash flow
forecasts. Journal of Accounting and Economics (35): 73-100.

30
Barth, M.E., Beaver, W.H. & Landsman, W.R. (2001). The relevance of the value
relevance literature for financial accounting standard setting. Another view.
Journal of Accounting and Economics (31): 77-104.
Barth, M.E. & Clinch, G. (2009). Scale effects in capital markets-based accounting
research. Journal of Business Finance and Accounting (36): 253-288.
Financial Accounting Standards Board (1978). Statement of Financial Accounting
Concepts No.1: Objectives of Financial Reporting by Business Enterprises.
Stamford: FASB.
Financial Accounting Standards Board 1982. Statement of financial accounting
standards no. 69: Disclosures about oil and gas producing activities. Stamford:
FASB.
Francis, J. & Schipper, K. (1999). Have financial statements lost their relevance?
Journal of Accounting Research (37): 319-352.
Hand, J.R.M (2001). A discussion of “Earnings, book values, and dividends in
equity valuation. An empirical perspective”. Contemporary Accounting
Research (18): 121-130.
Harris, T. & Ohlson, J.A. (1987). Accounting disclosures and the market’s
valuation of oil and gas properties. The Accounting Review (62): 651-670.
Hodge, F. (2003). Investors’ perceptions of earnings quality, auditor independence,
and the usefulness of audited financial information. Accounting Horizons (17):
37-48.
31
Holthausen, R.W. & Watts, R.L. (2001). The relevance of the value-relevance
literature for financial accounting standard setting. Journal of Accounting and
Economics (31): 3-75.
Jensen, M.C. (1986). Agency Costs of Free Cash Flow, Corporate Finance and
Takeovers. The American Economic Review (76): 323-329.
Jensen, M.C. (1988). The Takeover Controversy: Analysis and Evidence. In
Knights, Raiders and Targets: The Impact of the Hostile Takeover, J. Coffee, L.
Lowenstein and S. Rose-Ackerman (eds.). Oxford: Oxford University Press.
Kothari, S.P. (2001). Capital markets research in accounting. Journal of Accounting
and Economics (31): 105-231.
Lev, B. (1989). On the usefulness of earnings and earnings research: lessons and
directions from two decades of empirical research. Journal of Accounting
Research (27): 153-192.
Liu, J. & Ohlson, J.A. (1999). The Feltham-Ohlson (1995) model: Empirical
implications. Journal of Accounting, Auditing & Finance (15): 321-331.
Misund, B. (2015). Accounting for oil and gas exploration activities: A triumph of
economics over politics. (University of Stavanger Working Paper).
Misund, B., P. Osmundsen & Sikveland, M. (2015). International oil company
valuation: The effect of accounting method and vertical integration. Petroleum
Accounting and Financial Management Journal (): 1-19.
Misund, B., F.Asche & Osmundsen, P. (2008). Industry Upheaval and Valuation:
Empirical Evidence from the International Oil and Gas Industry. The
International Journal of Accounting (43): 398-424.
32
Ohlson, J.A. (1995). Earnings, book values, and dividends in equity valuation.
Contemporary Accounting Research (11): 661-687.
Ohlson, J.A. (2001). Earnings, book values, and dividends in equity valuation: An
empirical perspective. Contemporary Accounting Research (18): 107-120.
Osmundsen, P., Asche, F., Misund, B. & Mohn, K. (2006). Valuation of
international oil companies. The Energy Journal (27): 49-64.
Osmundsen, P., Mohn, K, Misund, B. & Asche, F. (2007). Is oil supply choked by
financial market pressures? Energy Policy (35): 467-474.
Ota, K. (2003). The impact of price and return models on value relevance studies:
A review of theory and evidence. Accounting Research Journal (16): 6-20.
Quirin, J. J., Berry, K.T. & O’Brien, D. (2000). A fundamental analysis approach
to oil and gas firm valuation. Journal of Business Finance and Accounting (27):
785-820.
Rayburn, J. (1986). The association of operating cash flow and accruals with
security returns. Journal of Accounting Research (24): 112-137.
Sloan, R.G. (1996). Do stock prices fully reflect information in accruals and cash
flows about future earnings? The Accounting Review (71): 289-315.
UBS Warburg (2003). Global Integrated Oil Analyzer, Quarterly assessment of the
strategies and valuation of the world’s largest integrated oil companies.
Vuong, Q.H. (1989). Likelihood ratio tests for model selection and non-nested
hypotheses, Econometrica (57): 307-333.
Wright, C.J. & Gallun, R.A. (2005). International Petroleum Accounting. Tulsa,
Oklahoma: PennWell.

33
Zeff, S.A. (1978). The risk of ‘economic’ consequences. Journal of Accountancy
(146): 56-63.