the value of community technology workers in lpg adoption
TRANSCRIPT

The Value of Community Technology Workers inLPG Adoption: A pilot in Shirati, TanzaniaAnnelise Marie Wiehl ( [email protected] )
University of California Berkeley https://orcid.org/0000-0002-3908-7903Sara Sievers
University of Notre DameDaniel Kammen
University of California Berkeley
Original article
Keywords: clean cooking, community infrastructure, sustainable development, LPG, CommunityTechnology Worker
Posted Date: September 2nd, 2020
DOI: https://doi.org/10.21203/rs.3.rs-69387/v1
License: This work is licensed under a Creative Commons Attribution 4.0 International License. Read Full License

1
The Value of Community Technology Workers in 1
LPG Adoption: A pilot in Shirati, Tanzania 2
Annelise Gill-Wieh𝑙,𝑎,𝑐,𝑑 3
Sara Siever𝑠𝑐,𝑑 4
& Daniel M. Kamme𝑛𝑎,𝑏 5
6 𝒍𝐚Energy and Resources Group, University of California, Berkeley, CA, 94720 7 𝒍𝐛Goldman School of Public Policy, University of California, Berkeley, CA, 94720 8 𝒍cKellogg Institute for International Studies, University of Notre Dame Notre Dame, IN, 46556 9 𝒍dKeough School of Global Affairs, University of Notre Dame, Notre Dame, IN 46556 10
11
Corresponding Author: 12 Annelise Gill-Wiehl 13
310 Barrows Hall 14
University of California, Berkeley 15
94720 16
Phone: (314) 808 6441; email: [email protected] 17
18
Abstract: 19 Background: The issue of clean cooking lies at the nexus of environmental engineering, 20
environmental health, pollution, energy access, gender and household dynamics, behavioral 21
sciences and international development. In Tanzania, approximately 96% of the population 22
relies on polluting or “unclean” fuels for cooking. Moving away from firewood and charcoal has 23
proven challenging due to low adoption of clean stoves. Here we investigate the application of 24
community health workers, an existing community engagement model for health systems, to 25
clean cooking adoption. We implemented a pilot study with Community Technology Workers as 26
a means to overcome maintenance, education, and behavioral barriers. We evaluated the training, 27
work, and impact of a CTW on stove adoption on a sample of 30 households over a one-year 28
period. Technically trained local CTWs educated thirty families on the Liquefied Petroleum Gas 29
(LPG) stove and conducted weekly check-in surveys. 30

2
Results: The results from the mixed methodology approach show that families initially have 31
very high rates (100%) of adoption, but as the issues of poverty, other obligations, and sickness 32
arise, roughly 70% of families present sustained, regular refilling of LPG cylinders. 33
Conclusions: The findings imply the feasibility of this type of community infrastructure model 34
to promote and facilitate adoption, but also supports the need to couple this local support with 35
financial mechanisms (e.g. a savings bank). The support from these community trainers paired 36
with these high rates of adoption have large implications for this model’s use in rural, poor areas 37
to increase LPG use and adoption. 38
39
Key Words: clean cooking, community infrastructure, sustainable development, LPG, 40
Community Technology Worker 41
42
Background 43 Globally, 3 billion people rely on traditional or unimproved fuels such as firewood, 44
charcoal, and other forms of biomass, in order to cook and provide for their families. In 45
Tanzania, 96% of the population [1], rely on polluting or “unclean” fuels, which leads to 20,000 46
Tanzanian deaths per year attributed to indoor air pollution [1] . The combustion byproducts 47
from unimproved stoves are harmful for human health as particulate matter is retained in the 48
lungs and is linked to respiratory infections, COPD, and lung cancer. Overcoming barriers to 49
clean fuel adoption is critical for helping to prevent these illnesses and untimely deaths. 50
Research suggests that clean fuel programs should focus on measures that reduce average 51
exposure to below 2000𝜇𝑔𝑚3 [2]. The World Health Organization (WHO) established tiers for 52
cooking stoves based on standards for thermal efficiency, CO emissions, Fine PM emissions, 53

3
safety, and durability. Tier 4 is considered the standard for a truly ‘clean’ stove, and only the 54
“BLEN” fuels (biofuels, LPG, electricity, and piped natural gas)[3] and firewood pellet stoves[4] 55
meet this criteria. Modeling has also shown that even partial LPG or fossil fuel cooking fuel 56
adoption could prevent 1.3 million deaths annually across sub-Saharan Africa [5]. Research 57
coupling satellite data of particulate matter (less than 2.5𝜇𝑚 PM) and infant mortality rates in 58
Africa found that even an increase in 10 𝜇𝑔𝑚3 of PM is associated with a 9% (4-14%) rise in infant 59
mortality, regardless of income [6]. 60
Despite the vital need to even partially reduce emission exposure, moving away from 61
firewood and charcoal is challenging due to low adoption of new technologies and the 62
availability and cost of BLEN stoves. In rural North-East Tanzania, households have the option 63
of firewood, charcoal, gas, or electric. Electric cooking options require either household battery 64
storage, a minigrid [7], or the national grid, neither of which are available to the poor in these 65
rural settings [8]. Additionally, electricity for cooking has also been found to outstrip demand at 66
peak hours. Countries such as South Africa have tried to transition families to LPG from 67
electricity to avoid this issue [9]. LPG is a biproduct of oil and natural gas refining, thus 68
producing a global surplus [3]. The US EPA carried out a life cycle assessment of different 69
cooking fuels in China and India which found that LPG has a lower Global Climate Change 70
Potential than charcoal and lower black carbon emissions than firewood[10]. The UN 71
Sustainable Energy for all Initiative launched the Global LPG Partnership under the premise that 72
LPG was the preferred solution for the next 15-20 years [3]. 73
There is increasing research into the health impacts of LPG while countries globally set 74
targets for LPG. The Household Air Pollution Intervention Network (HAPIN) has trials in India, 75

4
Guatemala, Peru, and Rwanda which focus directly on the health impacts by providing pregnant 76
women LPG stoves for free and an 18-month supply of LPG (HAPIN) [11]. Members of the 77
Economic Community of West African States and the Central African Economic and Monetary 78
Community, as well as Kenya, Uganda, and Tanzania have all set national LPG expansion 79
targets[3]. In 2015, Tanzania announced a goal to increase the population with access to modern 80
cooking fuels to greater than 75% by 2030 [3]. 81
Despite a wave of many African countries setting goals for increased or exclusive LPG 82
use, LPG programs faced common barriers to adoption of the clean fuel. Previous LPG studies in 83
Ghana, Peru, and India have focused on the barrier of the high initial cost by providing the initial 84
stove for free or free refill vouchers[12] [13] [14], yet still observed low rates of exclusive use or 85
even partial adoption [13, 15]. Kopa Gas in Tanzania offer pay-as-you-go LPG that allows the 86
customer to obtain a gas cylinder, single burner, and a smart meter to address the challenge to 87
purchase the initial cylinder and even the subsequent refills[16]. There is not yet information on 88
adoption rates with Kopa Gas technology. The International Growth Centre conducted a 89
randomized control trial in Tanzania that showed subsidies reduced charcoal use more than 90
access to credit, but still did not reach exclusive use [17]. Kenya is piloting Bottled Gas for a 91
Better Life, which is a microfinance loan program for LPG stoves, which increased consumption 92
of LPG; however, benefiting households still used dirty fuels for 11.2 hours of cooking over 7 93
cooking events[18]. The low rates of adoption that the field has observed is due to identified 94
barriers such as a the high upfront cost, but also the lack of education/need for household 95
training [3, 4, 9, 12, 15, 19], household safety concerns [3, 8, 19–22], and cultural issues [23, 96
24]. 97

5
This work focuses on overcoming these barriers that go beyond economics and 98
affordability of LPG—education on use and safety, maintenance, and social issues. For example, 99
Indonesia has pursued a strong LPG program to end the use of kerosene, which was largely 100
successful. In the initial 500 household market trial, the program noted the need for education on 101
proper LPG handling and use[25]. LPG cylinder explosions occurred daily due to the consumer 102
not using the stove properly[25], and accidents increased annually from 2007-2010. The media 103
coverage of these accidents led households to mistrust LPG and choose unclean fuels[25]. South 104
Africa also pursued a national LPG intervention, which Kimemia and Annegarn found would 105
have been more successful if there was a long-term maintenance plan and safety education. In 106
South Africa, there were only minor non-fatal LPG accidents, but the perception in the 107
community was that LPG was dangerous [9]. An evaluation of the project noted “an apparent 108
need to impart household energy safety knowledge to the local population” [9]. The program in 109
South Africa explained that a maintenance plan for common problems with flame control knobs 110
or the rubber hose would have led to higher rates of adoption as only 11% of the households had 111
used LPG before[9]. The households reported disliking the lack of community education and 112
maintenance within the LPG rollout. Providing this training in the form of cooking 113
demonstrations was found to increase demand for LPG in Sudan[26]. Finally, USAID and the 114
World Bank found that cultural factors such as the preference for food tasting of smoke affected 115
LPG update in Mozambique and Nicaragua [23, 24]. These barriers of lack of education, safety 116
issues, maintenance, and cultural issues are not unique to LPG, but the majority of BLEN 117
interventions [8]. 118

6
Community involvement has often been suggested as a way to mitigate these barriers. 119
Ronzi and co-authors respectively identified the need for community perspective in LPG 120
adoption and utilized community participatory research to investigate barriers and awareness of 121
LPG [20]. In Peru, Holada even suggested that prominent community members should become 122
early adopters to encourage mass local adoption of LPG [14]. Inyenyeri in Rwanda employed 123
Customer Service Representatives (CSRs) t0 visit the households during the first and fourth 124
weeks after initial adoption of their firewood pellet stove. Jagger and Das found that these in 125
person household visits were very important to adoption and that considerable training for the 126
family was crucial for sustained use [4], yet only 22% of the households’ they approached with 127
their finance package (a pay-as-you-go price plan with no initial startup cost and free stove 128
distribution) adopted and continued their contracts with the company[27]. Envirofit delivers LPG 129
in a pay-as-you-go technology and each visit is an opportunity to check stove performance and to 130
help customers, but there has been no investigation of the adoption rates of their customer base 131
[28]. Finally, in Sudan, providing educational training in the form of cooking demonstrations 132
was found to increase demand for LPG [26]. The literature speaks to the viability of community 133
engagement to increase LPG adoption, but also suggests that it is not sufficient at the current 134
levels being pursued. 135
There is a vital need to overcome these barriers in their entirety to improve health 136
outcomes. Smith and Sagar [29] argue for the reduction in barriers to LPG adoption stating that 137
as a development community, we need to “make the clean available, instead of trying to make 138
the available clean [29]. Smith also acknowledges that making the available clean is still worth 139
pursuing [30] but offers this critique to encourage practitioners and the research community to 140
7
investigate how to overcome barriers to LPG adoption (or other Tier 4 fuels) for both urban 141
populations and rural households. A common theme in the above literature is the importance of 142
community participation in methods to promote clean cooking. This research hypothesizes based 143
off of this literature that providing increased training, safety information, maintenance support, 144
and local mentors for LPG adoption would be a way of making the “clean available.” 145
146
Community Technology Workers 147
In this study, we looked for analogies in other international development fields that 148
overcame barriers in behavior change and need for community transitions. Specifically, this 149
research turned to the literature on Community Health Workers, local workers who link their 150
underserved communities to health systems. Weak health infrastructure [31] combined with the 151
global shortage of 4.3 million health care professionals and the high cost of training doctors and 152
health professionals [32], presented a need for a local worker to fill this health care void. The 153
Community Health Worker (CHW) was implemented at the village level to provide individual 154
care that was both effective, culturally appropriate, and cost effective. The World Health 155
Organization, WHO, defines CHWs as “members of the communities where they work, [who 156
are] selected by the communities, answerable to the communities for their activities, [and are] 157
supported by the health system, but not necessarily a part of the organization, and have shorter 158
training than professional workers” [33]. An in-depth review of eight CHW programs by the 159
WHO found that trained, supervised and supported CHWs [33] can increase health outcomes 160
through maternal and child health services, case management of uncomplicated illnesses, and 161
through education on malaria, Tuberculosis (TB), HIV/AIDS and Noncommunicable Diseases 162
(NCDs) [34]. 163

8
Tanzania has attempted to expand its national CHW programming and has deployed 164
different types of CHWs who received various training ranging from 5 days to 9 months, 165
depending on their responsibilities [35]. In 2014, a Community Based Health Program was 166
approved by the Tanzanian Ministry of Health, which called for locally trained and selected 167
CHWs that would work on Reproductive, Maternal, Newborn, Child and Adolescent Health 168
(RMNCAH), connect households to facility services, engage in preventive and curative services, 169
and provide disease surveillance[36]. In a typical 8-hour workday, CHWs in Tanzania were 170
found to spend 27.8% of their time traveling house to house, 33.1% on health education, 9.9% on 171
health promotion, 12.3% on direct patient care, and the rest on documentation and supervision 172
[35]. An ethnographic study of CHWs in Morogoro Region, Tanzania found that although 173
initially motivated by altruism, CHWs need transportation, communication devices, and financial 174
incentives to effectively do their jobs [36]. The gender of the CHW also affected how a 175
community member received the CHWs and their services [37] in Tanzania, a very patriarchal 176
society. 177
Understanding the range of training lengths, responsibilities, and program challenges, but 178
also observing the success of CHWs, this project considered the model for the technology 179
adoption of gas stoves to achieve clean cooking. A pilot study in Rwanda utilized CHWs to 180
inform, encourage, and trouble shoot problems for a cookstove intervention [27]. The health 181
implications of clean cooking lead to the logical extension that CHWs could cover this work as 182
well. However, USAID in their reference guide for program managers and practitioners warns 183
“there is a tendency to add tasks to CHWs as the program progresses, resulting in overworked 184
CHWs, a lack of programmatic focus, and too many functions for a CHW to be effective” [38]. 185

9
Integrating cooking assistance, or any other technical assistance, into the CHW role could 186
compromise their success in improving the health outcomes that they currently directly address. 187
Therefore, we investigated the creation of another trained worker, a Community Technology 188
Worker, in parallel with Tanzania’s Community Health Worker program. This study addresses 189
the feasibility of this worker, the CTW, to provide support for LPG adoption, but ultimately this 190
role could be expanded to more technologies in rural areas. However, within the scope of LPG 191
adoption, we first defined the position and evaluated the economics compared to other models. 192
193
Definition of a CTW. 194
Community Technology Workers provide vital local infrastructure for 195
technology adoption in rural villages. Technology infrastructure is as equally 196
fragmented and weak as the health systems in many developing countries. The role 197
and responsibility of the CTW was built off the duties of a Community Health 198
Worker. The study defines a Community Technology Worker (CTW) as an 199
individual with background knowledge and local expertise who has strong ties to a 200
specific community to which they will be assigned. CTWs assist households to adopt 201
new technology through the following actions. The workers conduct outreach to the 202
households to deliver the technology and navigate the repair of the technology. 203
The workers provide training for the family in the technology’s use and safety 204
measures. They are a constant resource for education about the technology, 205
maintenance, and optimization of welfare acquired from the technology. This expertise 206
consists of, but is not limited to, evaluation of broken technology, understanding the 207
general mechanism of the technology, understanding usual or expected maintenance, 208

10
and connecting to networks for efficient replacement of parts. The worker report back 209
detailing the households’ struggles and successes in LPG adoption. The CTW also 210
holds the household accountable to adopt the technology and provide the individuals the 211
resources to continue the adoption. 212
Economics of a CTW 213
In order to evaluate the cost/benefit assessment of the CTWs, we compare LPG/higher 214
tech stoves to other fields such as lighting, improved stoves, and healthcare. All of these fields 215
require social infrastructure to assist participants to have access to the service and ensure high 216
rates of adoption. The CTW model is based on physical visits, which are more costly and 217
logistically intensive compared to other models. M-KOPA is a solar company that targets the 218
poorest by offering a home solar system for 35 USD upfront and then 45 cents a day for a year 219
[39]. The payments are made through a mobile phone, and the sim card can be shut off remotely 220
if the payments are not made [39]. Lighting however is not as culturally entrenched in the 221
communities compared to cooking. There is a larger behavior change associated with the switch 222
of cooking fuel than the switch from kerosene to solar. Without physical visiting, reach and scale 223
are easily and quickly attainable; however, lighting does not have the adoption issues that health 224
and cooking pose. Even companies like Envirofit, who pursue large scale cookstove deployment 225
mostly through IT-based communication [28], admit that “while investing in training resources 226
increases costs, it also increases adoption” [28]. 227
The advantage of this model for cooking over an IT-based solution (i.e. text message 228
education or reminders) is that human workers can respond and adapt to the specific issues of the 229
11
household and provide helpful advice. Particularly, the behavioral change and social aspects of 230
technology adoption require the in-person visits to overcome these barriers as opposed to 231
telephone conversations or text messages, even if specific focused feedback. A review of 232
programs that promoted mobile phones to improve community health workers’ performance 233
never replaced the physical visits but augmented the visits [40]. The success of community 234
health worker programs is rooted in the relationships and trust of the local professional[33, 37]. 235
This taps into the fact that a telephone conversation cannot adequately substitute for an in-person 236
visit, especially when behavior change is necessary. A study in India found that households are 237
more likely to adopt improved stoves if they have had prior exposure to a trusted organization 238
promoting the product [41]. Additionally, these local trainers could also be utilized to solve other 239
community problems, such as water and sanitation technology or mini-grids. Finally, adopting a 240
model resembling the CHWs may allow for “closer integration of health in energy management” 241
[42]. Although physical visiting is time and cost intensive, the CTW model is well suited for 242
reach and scale because the individuals are locally sourced and trusted within the villages. Each 243
village could adjust the model slightly to fit their community dynamics and needs. This role 244
could not be filled by the local retail hardware dealer who sells the stoves and fuel as the in-245
person visits and hands on education are beyond the scope of their job. 246
In order to address this array of barriers and test the flexibility of a human centered 247
model, this study, “Pilot of Community Technology Workers in Shirati, Tanzania” investigated 248
whether or not the presence of a locally trained expert, a CTW, checking in on families would be 249
feasible and effective at increasing technology adoption. 250

12
251
Methods and Materials 252 253
Study Design 254
As part of her Senior Capstone, the first author implemented the CTW project in Shirati, 255
Tanzania in May of 2018 through a grant from the University of Notre Dame to both implement 256
this feasibility study and conduct the research on the effect on LPG adoption. Before expanding 257
this model at scale, this work intended to investigate the practicality of the model and scope out 258
possibilities and necessary adaptions for a program at scale. If successful, this pilot could lead to 259
future investigation and longer (2-3 years) research. 260
261
CTW Selection & Training 262
Each village was assigned a CTW, who the local non-profit, ReachShirati, helped 263
identify. ReachShirati runs a local primary school, whose director is well known throughout the 264
community. This director identified two women who were trustworthy, highly respected, 265
interested in community development projects, and available for the entirety of the year-long 266
study. They live in the villages that they represented in the study. One has lived in Shirati her 267
whole life except for her years at university in Dar es Salaam, and the other moved to Shirati 268
with her family roughly a decade ago. No previous technical experience was required as all 269
necessary training could come from the program. We did not insist on female CTWs; however, 270
as gender affected CHW program, it proved to be beneficial as women were more likely to listen 271
to other women on cooking practice, as women are traditionally the main cooks in Tanzanian 272
society. The role of CTW would be a part-time job for the women, who also cared for their 273
households and ran a hair salon respectively. The first author interviewed the proposed CTWs, 274
explained the role, and the work that would be expected. The CTWs were then offered contracts 275

13
for a year, which outlined their salary and discussed expectations. The local gas company, Mihan 276
Gas Co., sent a regional manager to Shirati to train the CTWs on the LPG stove. Additionally, 277
the first author prepared a safety manual which the CTWs studied and then practiced teaching 278
individuals at ReachShirati how to use the LPG stove, before entering the field to teach the 279
households in the study. We trained the CTWs on data collection and research etiquette. 280
Throughout study, the research team monitored data collection on a weekly basis and held 281
weekly meetings to discuss research findings throughout the study to ensure data quality. We 282
ensured that the two women did not have any relation to the households in the study and no other 283
conflicts of interest. Finally, we stressed that neither they (nor the family) received any benefit 284
for higher rates of adoption. 285
286
Data Collection and Analysis 287
Surveys and Interviews. 288
We conducted baseline energy surveys, which collected demographic information, the 289
poverty probability index questions, energy consumption data, and gauged household’s energy 290
preferences. Figure 1 gives a sample of the survey, which was all translated into Swahili or 291
KiLuo, the tribal language. It also collected demographic information, asked questions about the 292
national grid, generators, etc, and their view/preference for the grid and cooking fuels. 293

14
294 Figure 1. Sample of the initial survey that gauged the family’s energy consumption in 295
regard to cooking, lighting, and other appliances. 296
297
A full copy of this household energy survey can be found in Appendix A. The CTWs and 298
the first author then conducted initial household visits in which the CTW trained the household 299
on how to use the stove and provided additional safety and maintenance information. A week 300
after this initial visit the CTW returned to check-in with the family and conduct a shorter survey 301
to gauge gas/charcoal/firewood consumption, stove issues, and report any problems or concerns 302
to adopting gas (Appendix B). The CTWs conducted this survey weekly from Mid-June until the 303

15
end of December, the period of initial adoption. After six months, the first author conducted hour 304
long interviews with all heads of the households regarding the program, their comfort level with 305
the CTW, and the challenges to adopting gas. She also conducted hour long interviews with both 306
CTWs regarding the benefits/drawbacks of the program and their assessment of the feasibility of 307
the project and areas for improvement and adjustment. Finally, the CTWs and the first author 308
held a two-hour long focus group with six of the families from the program to address similar 309
program evaluation. 310
Based on the recommendations from these preliminary results in the first six months, we 311
were interested in studying why the families were refilling their gas cylinders and discerning 312
how often the CTW needed to visit. Over the course of two and half weeks in January of 2019, 313
we conducted 29 household interviews with the families and the CTWs (Appendix C). All 314
interviews were conducted guided by the grounded theory approach. We followed the open 315
coding method, which allowed for the creation of generative and comparative questions that we 316
could return to the field within further expansion of this work[43]. The results of these 317
interviews led to us adjusting the check-in survey to every two weeks, as opposed to weekly, in 318
the final four months (Appendix D), which we will refer to as subsequent monitoring. 319
All quantitative data from the surveys were exported from Qualtrics and analyzed in 320
Microsoft Excel. All qualitative data was recorded, transcribed, and then open coded[43] for 321
themes by hand. 322
323
Location/Fuel Context 324
Shirati, Tanzania is a town of ~50,000 on the edge of Lake Victoria near the Kenyan 325
border. Within Shirati, there are sub-villages including Kubwana and Michire. Kubwana is a 326
16
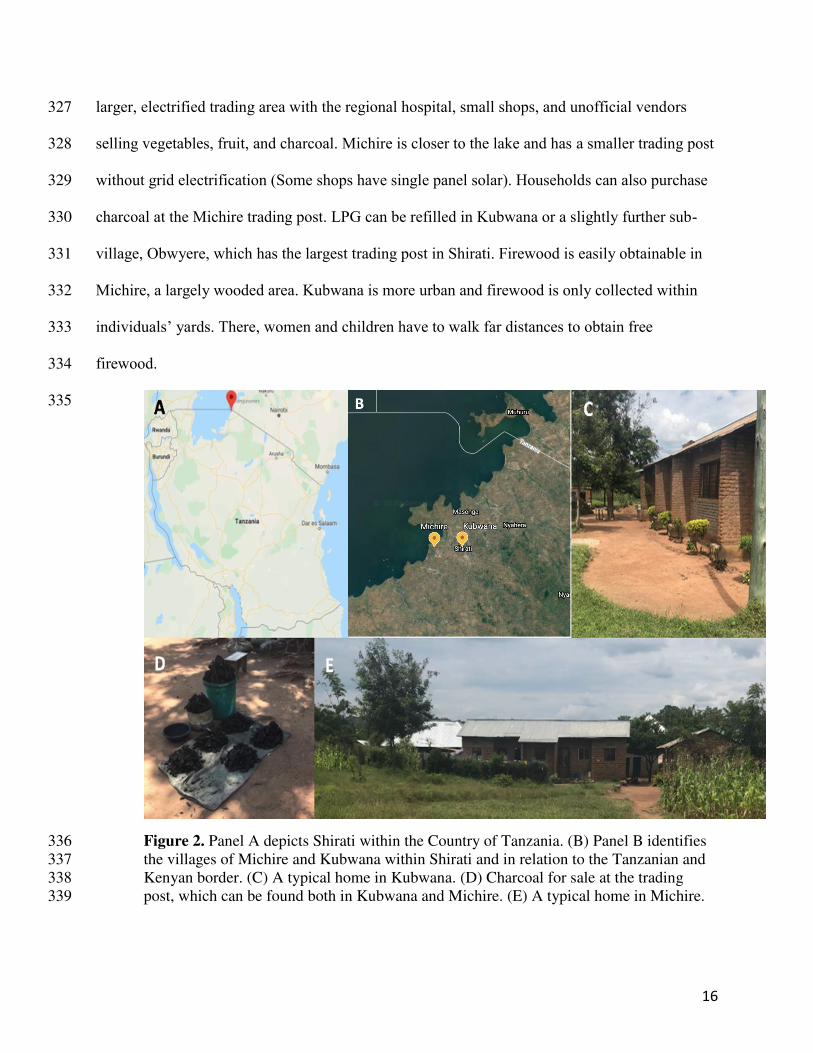
larger, electrified trading area with the regional hospital, small shops, and unofficial vendors 327
selling vegetables, fruit, and charcoal. Michire is closer to the lake and has a smaller trading post 328
without grid electrification (Some shops have single panel solar). Households can also purchase 329
charcoal at the Michire trading post. LPG can be refilled in Kubwana or a slightly further sub-330
village, Obwyere, which has the largest trading post in Shirati. Firewood is easily obtainable in 331
Michire, a largely wooded area. Kubwana is more urban and firewood is only collected within 332
individuals’ yards. There, women and children have to walk far distances to obtain free 333
firewood. 334
335
Figure 2. Panel A depicts Shirati within the Country of Tanzania. (B) Panel B identifies 336
the villages of Michire and Kubwana within Shirati and in relation to the Tanzanian and 337
Kenyan border. (C) A typical home in Kubwana. (D) Charcoal for sale at the trading 338
post, which can be found both in Kubwana and Michire. (E) A typical home in Michire. 339

17
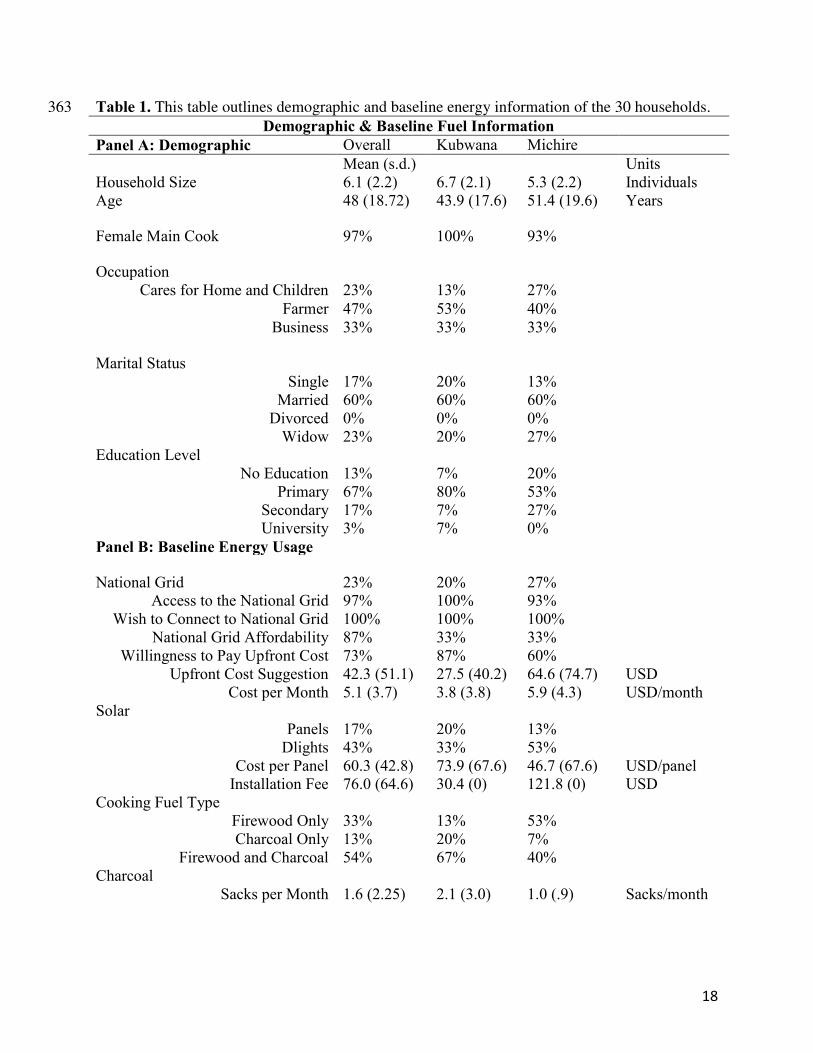
340 Household Demographic Results. 341
Table 1 provides information on household level baseline demographic characteristics 342
and current energy use. It should be noted that no families in the pilot used LPG, Natural Gas, or 343
a generator. Only one household had a main cook who was male. Household size ranged from 1 344
to 10 with an average of 6. 1. Main cooks ranged in age as well as occupation (Table 1). The age 345
range (Table 1) ensures that the pilot is indicative of both young and old cooks’ response to 346
adoption. The occupation of each family proved important as those with businesses reported a 347
higher confidence in refilling due to the steady income. The connection to the main grid (Table 348
1) alludes to proximity to the main road, overall income and the possibility of electric as a fuel 349
source. Fuel stacking is the practice of using more than one fuel type [44], instead of replacing a 350
type entirely. Thus, it is challenging to gauge how many meals are cooked with gas or with an 351
unclean fuel. If the family is stacking, they may cook the vegetables of a meal with gas, but the 352
ugali—water and cornmeal, which is a staple of Tanzanian cuisine—with firewood. Finally, the 353
majority use both charcoal and firewood (54% in Table 1), suggesting a willingness to diversify 354
fuel source, but also reflects proximity to free fuel within the forests. The method by which each 355
family obtained firewood is important as collecting is a free source of fuel, and therefore the 356
family may not have any budget for cooking fuel. Households struggled to answer how many 357
hours per day and how many days per month they used the national grid. They were unable to 358
estimate the outage frequency and length. They struggled to quantify how much firewood they 359
used, often reporting that they used as much as they could carry on their heads. The only other 360
fuels that two individuals used was agricultural waste called magoonzi and one individual 361
purchased a dollar worth of batteries for a flashlight every 4 days. 362
18
Table 1. This table outlines demographic and baseline energy information of the 30 households. 363
Demographic & Baseline Fuel Information
Panel A: Demographic Overall Kubwana Michire
Mean (s.d.) Units
Household Size 6.1 (2.2) 6.7 (2.1) 5.3 (2.2) Individuals
Age 48 (18.72) 43.9 (17.6) 51.4 (19.6) Years
Female Main Cook 97% 100% 93%
Occupation
Cares for Home and Children 23% 13% 27%
Farmer 47% 53% 40%
Business 33% 33% 33%
Marital Status
Single 17% 20% 13%
Married 60% 60% 60%
Divorced 0% 0% 0%
Widow 23% 20% 27%
Education Level
No Education 13% 7% 20%
Primary 67% 80% 53%
Secondary 17% 7% 27%
University 3% 7% 0%
Panel B: Baseline Energy Usage
National Grid 23% 20% 27%
Access to the National Grid 97% 100% 93%
Wish to Connect to National Grid 100% 100% 100%
National Grid Affordability 87% 33% 33%
Willingness to Pay Upfront Cost 73% 87% 60%
Upfront Cost Suggestion 42.3 (51.1) 27.5 (40.2) 64.6 (74.7) USD
Cost per Month 5.1 (3.7) 3.8 (3.8) 5.9 (4.3) USD/month
Solar
Panels 17% 20% 13%
Dlights 43% 33% 53%
Cost per Panel 60.3 (42.8) 73.9 (67.6) 46.7 (67.6) USD/panel
Installation Fee 76.0 (64.6) 30.4 (0) 121.8 (0) USD
Cooking Fuel Type
Firewood Only 33% 13% 53%
Charcoal Only 13% 20% 7%
Firewood and Charcoal 54% 67% 40%
Charcoal
Sacks per Month 1.6 (2.25) 2.1 (3.0) 1.0 (.9) Sacks/month
19
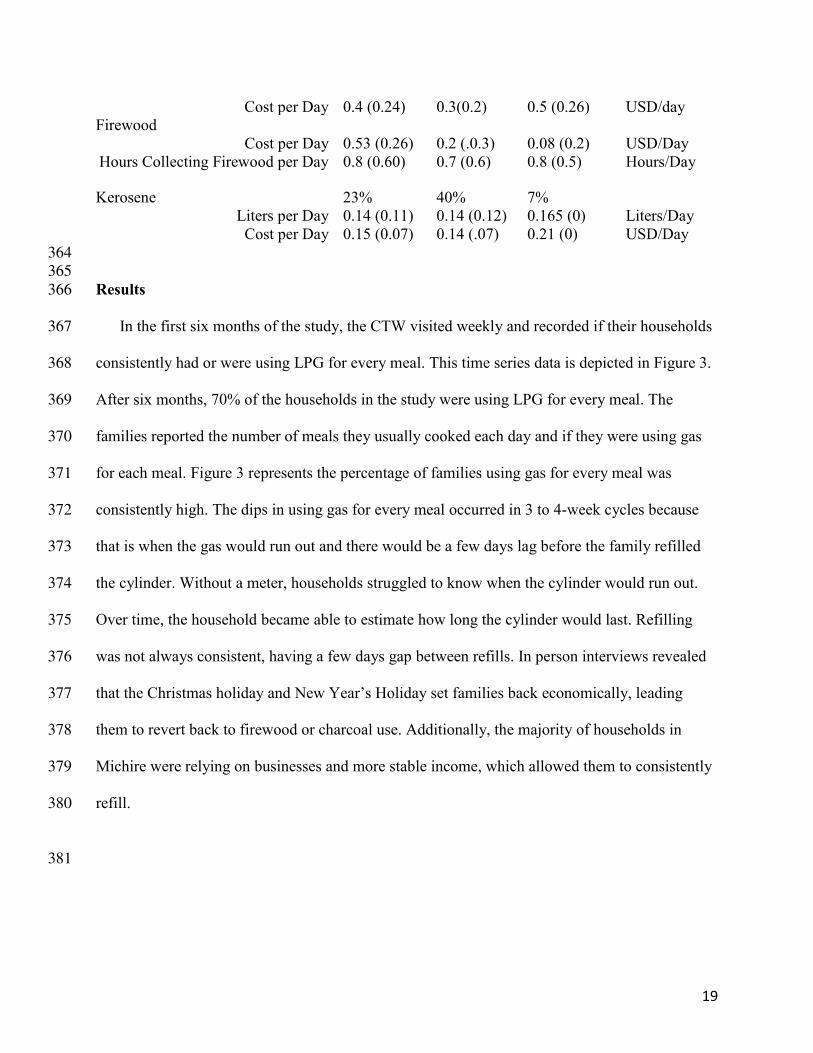
Cost per Day 0.4 (0.24) 0.3(0.2) 0.5 (0.26) USD/day
Firewood
Cost per Day 0.53 (0.26) 0.2 (.0.3) 0.08 (0.2) USD/Day
Hours Collecting Firewood per Day 0.8 (0.60) 0.7 (0.6) 0.8 (0.5) Hours/Day
Kerosene 23% 40% 7%
Liters per Day 0.14 (0.11) 0.14 (0.12) 0.165 (0) Liters/Day
Cost per Day 0.15 (0.07) 0.14 (.07) 0.21 (0) USD/Day
364
365
Results 366
In the first six months of the study, the CTW visited weekly and recorded if their households 367
consistently had or were using LPG for every meal. This time series data is depicted in Figure 3. 368
After six months, 70% of the households in the study were using LPG for every meal. The 369
families reported the number of meals they usually cooked each day and if they were using gas 370
for each meal. Figure 3 represents the percentage of families using gas for every meal was 371
consistently high. The dips in using gas for every meal occurred in 3 to 4-week cycles because 372
that is when the gas would run out and there would be a few days lag before the family refilled 373
the cylinder. Without a meter, households struggled to know when the cylinder would run out. 374
Over time, the household became able to estimate how long the cylinder would last. Refilling 375
was not always consistent, having a few days gap between refills. In person interviews revealed 376
that the Christmas holiday and New Year’s Holiday set families back economically, leading 377
them to revert back to firewood or charcoal use. Additionally, the majority of households in 378
Michire were relying on businesses and more stable income, which allowed them to consistently 379
refill. 380
381

20
382
Figure 3. Trends in using gas for every meal. The x-axis is the number of weeks after the 383
receival of the stove and initial household visit; the y-axis is percent of households (30 total, 15 384
in Kubwana, and 15 in Michire). 385
386
Figure 4. Trends in using gas for every meal. The x-axis is the number of weeks after the 387
receival of the stove and initial household visit, but in the second period of the study; the y-axis 388
is percent of households (30 total, 15 in Kubwana, and 15 in Michire). 389
390
0
10
20
30
40
50
60
70
80
90
100
1 2 3 4 5 6 7 8 9 10 11 12 13 14 15 16 17 18 19 20 21 22 23 24 25 26 27
June July August September October November December
% o
f H
ou
seh
old
s
Week
% of Households Using Gas for Every Meal
Kubwana Michire All
0
10
20
30
40
50
60
70
80
90
100
27 28 29 30 31 32 33 34 35 36 37 38 39 40 41 42 43
January February March April
% o
f H
ou
seh
old
s
Week
% of Households Using Gas for Every Meal
Kubwana Michire All

21
In the subsequent refilling period from January to April, Kubwana households using LPG 391
for every meal ranged from 33% to 66%, while Michire ranged from 80 to 100% (Figure 4). 392
Households in Kubwana never recovered from the economic holiday hardship and exhibited 393
lower rates of LPG use at every meal for the remainder of the study. The small sample size 394
allowed us to follow individual households. At the end of a year, 3 households had stopped 395
refilling after 6 months of consistently refilling due to sickness, loss of a parent (who provided 396
the income), and loss of a business. Twenty-four families are consistently refilling the gas stove 397
each month. The other three families are in consistent refillers due to economic setbacks from 398
school fees or slow business but eventually returned to the gas stove. Thus, 90% of families were 399
able to refill most months and 80% every month. However, this fluctuated slightly and both the 400
initial adoption period (first six months) and the subsequent refilling period (last 4 months) 401
ended with 70% of households having used LPG for every meal. 402

22
0
10
20
30
40
50
60
70
80
90
100
2 3 4 5 6 7 8 9 10 11 12 13 14 15 16 17 18 19 20 21 22 23 24 25 26 27
July August September October November December
% o
f H
ou
seh
old
s U
sin
g B
iom
ass
Week
Kubwana Michire All Linear (Kubwana) Linear (Michire) Linear (Al l)
Although families were adopting gas, we tracked families primarily for their continued 403
use of firewood or charcoal (see Figure 5 &6). This fuel stacking fluctuated but ended with 53% 404
in both Michire and Kubwana using unclean fuels by the final week of the pilot (Figure 5). The 405
village of Michire experienced higher continued biomass use, but consistently refilled their gas, 406
suggesting a partial transition to gas. Kubwana typically had a lower percentage still using 407
biomass in the first six months, with the exception of the final week due to the holidays. 408
Figure 5. Trends in the continued use of firewood or charcoal after receipt of LPG stove and 409
education from the CTW. The x-axis is the number of weeks after the receipt of the stove and 410
initial household visit; the y-axis is percent of households (30 total, 15 in Kubwana, and 15 in 411
Michire). 412
In the final four months, Kubwana had lower rates of using biomass (Figure 6) and using 413
LPG for every meal (Figure 4), suggesting that households in Kubwana either completely 414
abandoned unclean fuels or were unable to refill the gas stove. By contrast in Michire, a higher 415
percentage of households were using biomass on average, but also using LPG for every meal. By 416
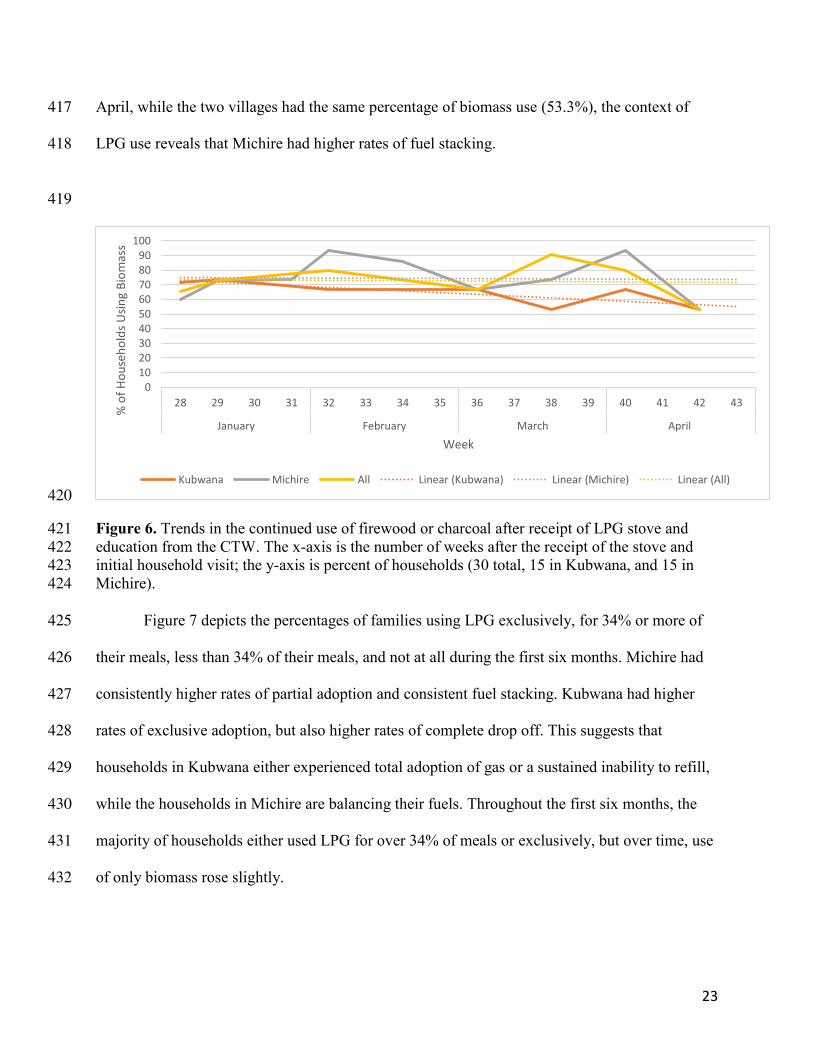
23
April, while the two villages had the same percentage of biomass use (53.3%), the context of 417
LPG use reveals that Michire had higher rates of fuel stacking. 418
419
420
Figure 6. Trends in the continued use of firewood or charcoal after receipt of LPG stove and 421
education from the CTW. The x-axis is the number of weeks after the receipt of the stove and 422
initial household visit; the y-axis is percent of households (30 total, 15 in Kubwana, and 15 in 423
Michire). 424
Figure 7 depicts the percentages of families using LPG exclusively, for 34% or more of 425
their meals, less than 34% of their meals, and not at all during the first six months. Michire had 426
consistently higher rates of partial adoption and consistent fuel stacking. Kubwana had higher 427
rates of exclusive adoption, but also higher rates of complete drop off. This suggests that 428
households in Kubwana either experienced total adoption of gas or a sustained inability to refill, 429
while the households in Michire are balancing their fuels. Throughout the first six months, the 430
majority of households either used LPG for over 34% of meals or exclusively, but over time, use 431
of only biomass rose slightly. 432
0
10
20
30
40
50
60
70
80
90
100
28 29 30 31 32 33 34 35 36 37 38 39 40 41 42 43
January February March April
% o
f H
ou
seh
old
s U
sin
g B
iom
ass
Week
Kubwana Michire All Linear (Kubwana) Linear (Michire) Linear (All)

24
433
Figure 7. Trends in levels of LPG adoption from exclusive use to only biomass. Panel A 434
represents Kubwana households in Kubwana (n=15); Panel B is Michire households (n=15); 435
Panel C is all study households (n=30). The x-axis is the time since the initial intervention up 436
until December 2018, while the y-axis is the percent of households. 437

25
438
In the final four months of the study, most households in Michire had a trend of 439
consistent LPG use of over 34%, while households in Kubwana were either exclusive 440
users or only relying on biomass (Figure 8). Overall, at the end of the study, 47% of all 441
households were exclusive LPG users, while 23% were using LPG for over 34% of their 442
meals. 7% were using LPG, but for less than 34% and 17% of households were only 443
using biomass (Figure 8 Panel C). It is important to understand the percentage of meals 444
cooked with LPG, as it is not enough to simply have a refilled cylinder to combat the 445
health risks. The higher level of LPG use correlates with decreased exposure to 446
emissions. Any LPG use, even if for a third of meals, lowers the main cook’s emission 447
exposure; however, exclusive adoption of clean fuels is the goal. 448

26
449
Figure 8. Trends in levels of LPG adoption from exclusive to only biomass. Panel A 450
represents Kubwana households (n=15); Panel B is Michire households (n=15); Panel C 451
is all study households (n=30). The x-axis is the time since the study switched to bi-452
weekly visits in January 2019, while the y-axis is the percent of households. 453

27
454
Compared to the 1.8 meals a week the evaluation of an improved cookstove program in 455
India [45] found, the 22% adoption rate found by the biomass pellet company, Inyeyeri, the 456
63.7% partial adoption found in a study in Rwanda in conjunction with water filters [27], and 8% 457
refilling LPG rate found at 18 months in Ghana [13], our study demonstrates high rates of 458
adoption with ~70% using LPG for every meal and 47% exclusive LPG use. Without income 459
data, we are unable to speak to the relative poverty between our sample and the other studies, as 460
income is a factor in the ability to refill. However, as all low-middle income countries, the ~70% 461
LPG adoption rate still stands out in the literature. 462
To further understand why this study observed higher refilling among the poor, 463
qualitative interviews were conducted with the households. The themes that arose in these 464
interviews are outlined in Table 2. Families noted that they had adjusted to the gas stove and 465
were not refilling to please the CTW, but rather refilling for their own benefit. One woman posed 466
the question, “How can [the CTW] pressure me when the gas helps me not the CTW?” The 467
families discussed how the gas stove eases the work and allows them to finish the cooking faster 468
and continue with other activities. The majority of families claimed that it was their 469
responsibility to refill the cylinder as it was benefiting their family. One family noted that ‘it is 470
my responsibility to refill it even without being monitored because I know how valuable it is.” A 471
few families additionally mentioned that smoke was no longer associated with cooking, but only 472
two discussed health effects of charcoal and firewood. 473
474
28
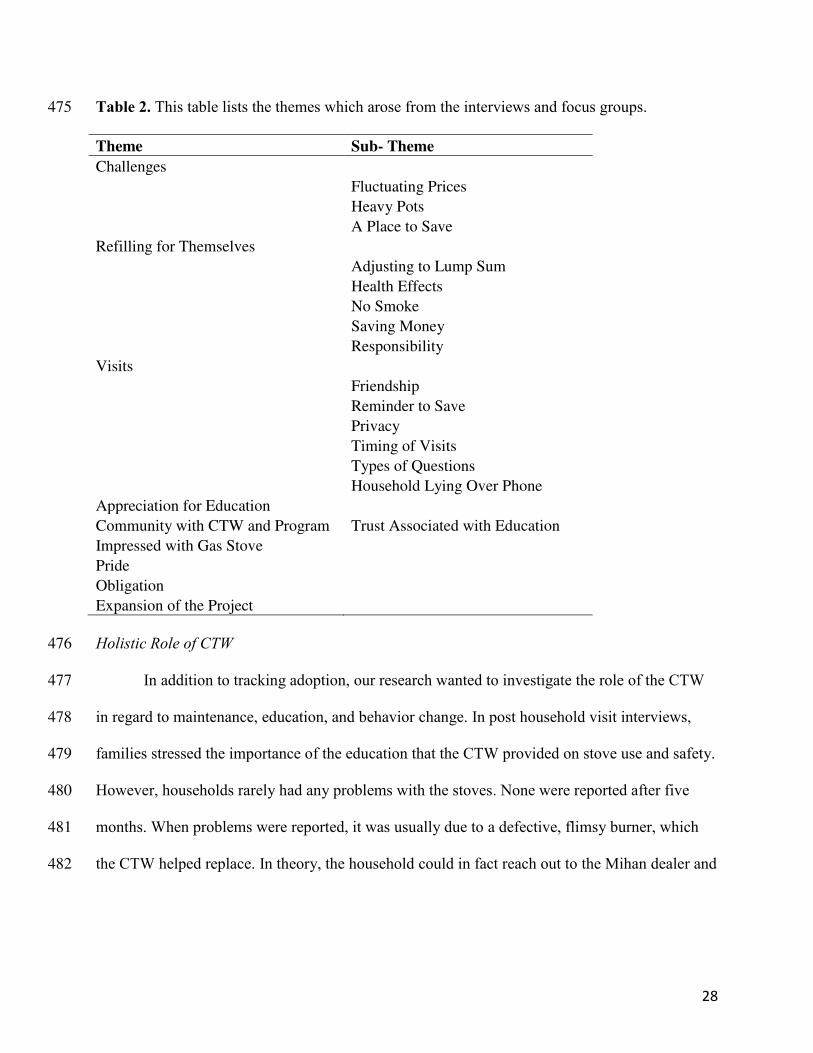
Table 2. This table lists the themes which arose from the interviews and focus groups. 475
Theme Sub- Theme
Challenges
Fluctuating Prices
Heavy Pots
A Place to Save
Refilling for Themselves
Adjusting to Lump Sum
Health Effects
No Smoke
Saving Money
Responsibility
Visits
Friendship
Reminder to Save
Privacy
Timing of Visits
Types of Questions
Household Lying Over Phone
Appreciation for Education
Community with CTW and Program Trust Associated with Education
Impressed with Gas Stove
Pride
Obligation
Expansion of the Project
Holistic Role of CTW 476
In addition to tracking adoption, our research wanted to investigate the role of the CTW 477
in regard to maintenance, education, and behavior change. In post household visit interviews, 478
families stressed the importance of the education that the CTW provided on stove use and safety. 479
However, households rarely had any problems with the stoves. None were reported after five 480
months. When problems were reported, it was usually due to a defective, flimsy burner, which 481
the CTW helped replace. In theory, the household could in fact reach out to the Mihan dealer and 482

29
purchase another burner; however, the CTW provided a level of convenience and speed to 483
minimize the number of meals cooked with unclean fuels in the interim of getting the new part. 484
On occasion, the CTW would review stove use and safety training again with the household. 485
There were no serious accidents. The CTW was trained to safely check for gas leaks, put out 486
uncontrolled flames on the burner, and protect against improper use accidents by training the 487
households. Additionally, CTWs provided the households confidence in LPG, as compared to 488
previous studies that noted fear of LPG use [9]. 489
The consistent need for sterilized water prohibited full LPG adoption in 25% of all 490
households (35% Kubwana and 15% Michire). The Food and Agricultural Organization’s 491
review of firewood and charcoal use in developing countries revealed that a third of all biomass 492
collection is used on heating and boiling water [46]. Masera et al. found that in mixed fuel 493
households 60% of households used LPG for boiling water [44], so LPG could be used instead of 494
water guard, but based on the stated preference of the households, we chose to pursue water 495
guard. Although the CTW’s main role was to increase LPG adoption, in parallel, they also play a 496
role to stop all biomass burning. Households did not want to boil water with LPG, as they 497
preferred to use it for cooking, therefore, the CTW educated the households on Water Guard, a 498
purification tablet, to help eliminate biomass burning for water purification. After 10 months, no 499
households in the program were using biomass to boil. 500
Families appreciated and encouraged the CTW visits to promote education, but mostly to 501
remind them to save for the next cylinder. Households noted the friendship and trust that they 502
had built with the CTWs. Households suggested the use of phone calls for emergency situations, 503

30
but implied that they may not be honest about their LPG use over the phone. Overall, the role of 504
the CTW was holistic engaging many aspects of household fuel consumption. 505
506
Importance of Community 507
One of the benefits of the CTW program is the close connection with the community and 508
the CTW. Thirteen of 30 interviews expressed an appreciation for education and for the 509
knowledge that we did not foresee as an effect of the program. These families appreciated 510
learning and gaining the education about the gas stove. A woman in Michire said, “There is 511
nothing that has passed me...I have memorized it.” Women in Kubwana asked “if there were any 512
more teachings.” A woman in Michire offered “I do welcome you anytime if there is anything 513
else that you want to teach me.” The CTWs also enjoyed providing education as Michire’s CTW 514
said, “My favorite part of my job is teaching families how to use the stove.” The CTWs feel a 515
desire to help the community. 516
Households also alluded to a continued relationship with the CTW in a positive light. 517
Many families wanted to continue and sustain the relationship with the Community Technology 518
Worker. For example, one Kubwanan woman, when asked about CTW visits, said “Come in the 519
morning, afternoon, evening. Wake me up. There is no problem.” Another woman in Michire 520
revealed the intimacy of the program and the importance of proximity. When asked if she felt 521
comfortable contacting the CTW, she responded “yes and if she does not answer, I will send a 522
kid to her house.” 523

31
The focus group reiterated the importance of community between the CTW and the 524
households. For example, one woman from Kubwana said, “we have become friends, we greet 525
each other, you find out what the problem is and you help. If there is a problem, we find a 526
solution.” The CTW model takes advantage of the strength in grassroots solutions 527
All families suggested the expansion or continuation of the project. They wanted to 528
include other community members and even expand it to other topics such as HIV, orphans, and 529
solar lights. A main cook in Michire said, “This project should not just focus on cooking.” This 530
speaks to the need for community involvement for any project for sustainable change. In 531
Kubwana, one woman suggested “expand the program to bringing electricity,” which indicates 532
that further expanding the project to other forms of technology may be a natural transition. This 533
narrative demonstrates the importance of community in achieving solutions. 534
Necessary but Insufficient 535
The barriers to adoption that arose from interviews were the fluctuating LPG prices and 536
an organized mechanism for saving. Households noted that it was hard to save that large of a 537
lump sum compared to spending smaller sums more frequently on biomass, especially when the 538
price changes month to month. If we factor in the opportunity cost of the time and the 0.8 hours a 539
day the households were collecting firewood, gas also becomes a more attractive option as 540
women could use that time for economic activity. However, the pattern of the spending remained 541
a challenge. The survey did not collect any direct household income information, but Tanzania 542
reported in 2015 that the GDP pc was 834 USD (1,918,928 TSH) or 70 USD (159,910 TSH) per 543
month [47]. Fuel is therefore a large part of household expenditure. Refilling the gas stove 544
32
monthly is 13% of that average monthly income. This is a large percentage of monthly income to 545
accumulate at one time. 546
Despite these financial hardships, 86.6% of families overall (80% in Kubwana and 93.3% 547
in Michire) reported feeling confident about being able to refill their cylinder. The families did 548
not experience an overbearing economic burden in refilling the stove. The Christmas holiday 549
lead to the lowest levels of confidence at 50% (n=15), 93.3% (n=15), and 73% (n=30) for 550
Kubwana, Michire, and overall respectively. 551
With the CTWs visits, families in Kubwana saved, on average, from ~ 2- 8 USD 552
(5,000TSH-18000TSH) for the refill, which cost ~9 USD (21,000 TSH). It is interesting to note 553
that the families in Michire claimed they were able to save for the next cylinder, but then 554
revealed that they had no amount saved. The CTW in Michire reported that families were not 555
saving incrementally as the weeks continued, but rather were relying on business incomes or 556
pensions. Michire families seemed to have more stable sources of income and did not need to 557
save money little by little. Therefore, CTW may be more useful as financial advisers in areas 558
without steady flows of income, like Kubwana. 559
We acknowledge that we are unable to isolate the effect of the CTW. However, these 560
barriers of adoption overlap and cover a range of disciplines, and thus may be best addressed 561
together. Households are financial managers, but also have educational, social, cultural facets 562
that shape their ultimate behavior. This feasibility study suggests that the CTW is helpful in 563
addressing LPG adoption in the context of all the barriers. However, the financial barriers still 564
remain, which implies that the CTW model is necessary, but still insufficient in removing every 565

33
barrier. Therefore, we will now discuss further areas for research to achieve sufficient support for 566
the households to exclusively adopt LPG. 567
Discussion 568
The CTW does not remove all barriers to gas adoption, specifically the economic aspects. 569
Additionally, on the supply side, it stretches the private sector’s business models to work with 570
customers who consume small amounts of gas. However, these results suggest that a CTW does 571
mitigate a wide range of barriers through education and maintenance support. These results 572
imply that the CTW program simply should adjust and continually strive for holistic 573
programming to overcome all barriers to LPG adoption. 574
There are a multitude of opportunities to combine the CTW model with programs to 575
address the economic barriers. A possibility would be to pair the CTW with a savings bank or 576
pay-as-you-go technology. These technologies do not negate the need for the local worker for 577
behavioral, safety, education, and maintenance issues. Bboxx in Rwanda recently launched 578
Bboxx Cook, which combines IoT (Internet of Things) technology to remotely manage financial 579
payments, financial products, and technicians and employees. East African companies such as 580
Envirofit that focus on widespread improved stove deployment are interested in further research 581
into the ability for education and maintenance assistance through cellphone technology [28]. 582
This could potentially prove to be a financially efficient model for the CTW program to provide 583
support and education through text messages; however, in addition to the concerns on honesty 584
over the phone, the households were hesitant to use texts and calls due to the added cost. Despite 585
this, there is a financial incentive for the program implementers to reduce the physical visits. 586

34
Even reducing the physical visits to once a month (coupled with a weekly text message), 587
compared to physical visit on a bi-weekly basis could cut CTW costs in half. The program could 588
provide phone credit, an inexpensive alternative to an additional visit. Further research into 589
comparison studies between a physical visiting model and a remote check in system could assist 590
policy makers decide if the financial burden of the CTW salaries was necessary to provide this 591
support for adoption. From interviews, the community and personable aspect of the CTW proved 592
to be very important, but further research is advised. Even companies like Envirofit admit that 593
“while investing in training resources increases costs, it also increases adoption” [28]. Further 594
research could also compare pay-as-you-go technology, which removes the challenge of the 595
lump sum refill, to the CTW model with a savings bank which financially manages the lump 596
sum. 597
The CTW financial management model does not require that the private sector offer a 598
new product. The private sector has the challenge of supplying a dispersed customer base, while 599
still providing the maintenance, repair, and sales support. The safety of LPG distribution 600
networks is often also a challenge for the private sector; the CTW also provides further 601
confidence that safety issues will not pop up at the household level. The CTW lessens the burden 602
on the private sector, while simultaneously addressing household adoption. 603
Further research should be pursued regarding the families that shifted towards exclusive 604
use of gas, which is necessary to realize the full health benefits. It will be important to 605
understand why certain families were able to completely abandon biomass. However, even 606
partial adoption is an admirable goal. Steenland et al reviewed the existing LPG literature to 607
create likely particulate matter exposure levels accounting for both exposure and exposure 608

35
response uncertainty. Partial adoption of LPG results in exposure rates of 70 𝜇𝑔𝑚3 compared to 270 609
𝜇𝑔𝑚3 from biomass [48]. These ranges were then utilized to model associated LPG health 610
outcomes. Their work found that a transition to LPG (even a partial transition) would result in a 611
37% decrease in severe childhood pneumonia and a 5-10% decrease in the death rates of women 612
over 50. It would decrease the 32/1000 rate of infant mortality by 4-11 deaths per 1000. Further 613
research comparing self-reported health data as well as spirometry and carbon monoxide 614
monitoring to gauge lung function and particulate matter exposure would add to the credibility of 615
the intervention and weight of the argument for policy change. 616
There is also an opportunity to study the feasibility of a private-public partnership. A 617
CTW Program could partner with the LPG companies to compromise on a lower price of gas for 618
the families within the program. This local worker program not only acts as advertising for their 619
company, but also promotes the expansion of their markets and distribution networks. Overall, 620
there are a multitude of future research directions that should be pursued to fully understand the 621
possibilities to ensure clean fuel adoption. 622
Conclusions 623
These results from the CTW model in Tanzania suggest that this approach would be best 624
pursued in tightknit communities that are reliant on and devoted to traditional modes of cooking, 625
compared to urban areas that may be more open to modern cooking technology. Additionally, 626
this CTW model is most effective in resource scarce areas requiring constant support and 627
reminders to save to refill and change their household financial structure. This model may not be 628
as cost effective in these urban setting where IT-based solutions may suffice, but rural, 629

36
traditional settings require the intra-community support. This model stresses the need of 630
community empowerment and programming to support community transitions. 631
Our results encourage a partnership of the CTW model with the private LPG sector or 632
financial institutions to couple the community infrastructure with decreasing the economic 633
hardships. Policy makers should train local workers and address the realities of cash strapped 634
households who do not have formal incomes to purchase LPG. This could include a savings bank 635
or pay-as-you-go on the demand side, or a financial incentive for the private sector to work with 636
these poor customers. Social and economic support are critical to achieving exclusive LPG use. 637
Based on the discussion of expanding the CTW project, this model may be most cost 638
effective in areas where you could pair the role of this local outreach worker with other rural 639
community needs. As rural communities are being exposed to new technologies, the CTWs 640
could play a wider role in supporting renewable energy technologies as well as other 641
technologies (mobile phones, IT systems, water and waste related technologies). This local 642
worker could also address lighting, water pumps, mini grids, etc. to holistically support rural 643
household energy infrastructure. There is an opportunity for the CTW to play a wider role in 644
energy access, but also development goals in general. Turning back to the literature on 645
Community Health Workers, we recognize the need to support these local workers, with funding, 646
transport, and education, especially as they take on expanding roles in their communities. 647
Community based outreach is invaluable in the effort to provide access and ensure adoption of 648
clean energy for cooking and beyond.649

37
650
Acknowledgements 651 We would like to first thank Nayome Aguttu and Mary Frances as without their excellent 652
work and expertise as Community Technology Workers this project would not have been 653
possible. We would also like to thank Fred Chacha, the In-Country Director of ReachShirati for 654
the logistical support throughout my two summers in Shirati and throughout the pilot. We are 655
grateful to each and every household in the pilot that offered their time and opened their families 656
to this research team. We would like to thank Mama Randa for feeding and housing Gill-Wiehl 657
for both summers. We also thank Luke Maillie for his friendship, advice and for connecting us to 658
ReachShirati and the Shirati community. We’d specifically like to acknowledge Holly Rivers, 659
Rachel Thiel, Fr. Bob Dowd, and Professor Ilaria Schnyder vW for their support and guidance at 660
the Kellogg Institute. 661
662
Authors’ contributions 663
AGW and SS designed the research and conducted the analysis. AGW and DK developed the 664
discussions and wrote the manuscript. 665
Funding 666
This work was supported by the Kellogg Institute for International Studies at the 667
University of Notre Dame under a Summer Research Grant. We gratefully acknowledge support 668
from a NRT training grant from the National Science Foundation Innovation in Food, Energy, 669
Water systems program (NSF-1633740). 670
Availability of Data & Materials 671
The datasets used and/or analyzed during the current study are available from the corresponding 672
author on reasonable request. 673
38
Ethics approval and consent to participate 674
This work was approved under Exempt Research under the University of Notre Dame’s 675
IRB Protocol ID:18-02-4425. 676
Consent for publication 677
Not Applicable 678
Competing Interests 679
The authors declare no competing financial interest. 680
681
682
References 683
684 1. Clean Cooking Alliance (2019) Tanzania. https://www.cleancookingalliance.org/country-685
profiles/41-tanzania.html. Accessed 30 Oct 2019 686
2. Ezzati M, Kammen DM (2002) Evaluating the health benefits of transitions in household 687
energy technologies in Kenya 688
3. Van Leeuwen R, Evans A, Hyseni B (2017) Increasing the Use of Liquefied Petroleum 689
Gas in Cooking in Developing Countries. Washington, DC 690
4. Jagger P, Das I (2018) Implementation and scale-up of a biomass pellet and improved 691
cookstove enterprise in Rwanda. Energy Sustain Dev 46:32–41 692
5. Bailis, R.,Ezzati, M., Kammen DM (2005) Mortality and greenhouse gas impacts of 693
biomass and petroleum energy futures in Africa. Science (80- ) 308:98–103 694
6. Heft-Neal S, Burney J, Bendavid E, Burke M (2018) Robust relationship between air 695
quality and infant mortality in Africa. Nature 559:254–258. 696
https://doi.org/10.1038/s41586-018-0263-3 697
7. Quetchenbach TG, Harper MJ, Robinson Iv J, et al (2013) The GridShare solution: A 698
smart grid approach to improve service provision on a renewable energy mini-grid in 699
Bhutan. Environ Res Lett 8:. https://doi.org/10.1088/1748-9326/8/1/014018 700
8. Puzzolo E, Pope D, Stanistreet D, et al (2016) Clean fuels for resource-poor settings: A 701
systematic review of barriers and enablers to adoption and sustained use 702
9. Kimemia D, Annegarn H (2016) Domestic LPG interventions in South Africa: Challenges 703
and lessons. Energy Policy 93:150–156 704
10. Bruce NG, Aunan K, Rehfuess EA, Development Bank K (2017) Liquefied Petroleum 705
Gas as a Clean Cooking Fuel for Developing Countries: Implications for Climate, Forests, 706
and Affordability Materials on Development Financing | KfW Development Bank-707
Materials on Development Financing, No. 7 2 Content 708
11. Clasen T, Checkley W, Peel JL, et al (2020) Design and rationale of the HAPIN study: A 709
multicountry randomized controlled trial to assess the effect of liquefied petroleum gas 710
stove and continuous fuel distribution. Environ Health Perspect 128:. 711

39
https://doi.org/10.1289/EHP6407 712
12. Budya H, Arofat M (2011) Providing cleaner energy access in Indonesia through the 713
megaproject of kerosene conversion to LPG. Energy Policy - ENERG POLICY 39:7575–714
7586. https://doi.org/10.1016/j.enpol.2011.02.061 715
13. Asante KP, Afari-Asiedu S, Abdulai MA, et al (2018) Ghana’s rural liquefied petroleum 716
gas program scale up: A case study. Energy Sustain Dev 46:94–102 717
14. Hollada J, Williams KN, Miele CH, et al (2017) Perceptions of improved biomass and 718
liquefied petroleum gas stoves in Puno, Peru: Implications for promoting sustained and 719
exclusive adoption of clean cooking technologies. Int J Environ Res Public Health 14:. 720
https://doi.org/10.3390/ijerph14020182 721
15. Pollard SL, Williams KN, O’Brien CJ, et al (2018) An evaluation of the Fondo de 722
Inclusión Social Energético program to promote access to liquefied petroleum gas in Peru. 723
Energy Sustain Dev 46:82–93. https://doi.org/10.1016/J.ESD.2018.06.001 724
16. Kopa Gas Kopa Gas: About. https://www.kopagas.com/about. Accessed 17 Jul 2020 725
17. Alem Y, Ruhinduka R, Berck P, Bluffstone R (2015) Final report Credit, LPG stove 726
adoption and charcoal consumption: Evidence from a randomised controlled trial Credit, 727
LPG Stove Adoption and Charcoal Consumption: Evidence from a Randomised 728
Controlled Trial * 729
18. Hsu E, Gan M, Puzzolo E (2019) Microfinance for clean cooking What lessons can be 730
learned for scaling up LPG adoption in Kenya through managed loans? 731
19. Labriet M (2015) Scaling Up Demand for LPG in Guatemala: Motivators, Barriers and 732
Opportunities FINAL REPORT 733
20. Ronzi S, Puzzolo E, Hyseni L, et al (2019) Using photovoice methods as a community-734
based participatory research tool to advance uptake of clean cooking and improve health: 735
The LPG adoption in Cameroon evaluation studies. Soc Sci Med 228:30–40. 736
https://doi.org/10.1016/J.SOCSCIMED.2019.02.044 737
21. Quinn AK, Puzzolo E, Dickinson K, et al (2018) An analysis of efforts to scale up clean 738
household energy for cooking around the world. Energy Sustain Dev 46:1–10. 739
https://doi.org/10.1016/J.ESD.2018.06.011 740
22. Matthews WG, Zeissig HR (2011) Residential Market for LPG: A Review of Experience 741
of 20 Developing Countries 742
23. Nexant I (2005) LPG Market Assessment Study for Mozambique 743
24. (2005) Pilot Commercialization of Improved Cookstoves in Nicaragua 744
25. Budya H, Arofat M, Yasir Arofat M (2011) Providing cleaner energy access in Indonesia 745
through the megaproject of kerosene conversion to LPG. Energy Policy - ENERG 746
POLICY 39:7575–7586. https://doi.org/10.1016/j.enpol.2011.02.061 747
26. Rai K, McDonald J (2009) Cookstoves and Markets: Experiences, Successes and 748
Opportunities 749
27. Barstow CK, Ngabo F, Rosa G, et al (2014) Designing and piloting a program to provide 750
water filters and improved cookstoves in Rwanda. PLoS One 9:. 751
https://doi.org/10.1371/journal.pone.0092403 752
28. Envirofit (2015) Cooking in one million kitchens: Lessons Learned in Scaling a Clean 753
Cookstove Business 754
29. Smith K, Sagar A (2016) LPG Subsidy: analysing the “give it up” scheme. Econ. Times 755
Times India 756
30. Smith KR (2010) What’s Cooking? A Brief Update. Energy Sustain Dev 14:251–252 757

40
31. Haines A, Sanders D, Lehmann U, et al (2007) Achieving child survival goals: potential 758
contribution of community health workers. Lancet 369:2121–2131 759
32. Health G (2012) Community and Formal Health System Support for Enhanced 760
Community Health Worker Performance A U.S. Government Evidence Summit FINAL 761
REPORT Content 762
33. Lehmann U, Sanders D (2007) Community Health Workers: What do we know about 763
them? Geneva 764
34. Bhutta ZA, Lassi ZS, Pariyo G, Huicho L Global Evidence of Community Health Workers 765
Global Experience of Community Health Workers for Delivery of Health Related 766
Millennium Development Goals: A Systematic Review, Country Case Studies, and 767
Recommendations for Integration into National Health Systems 768
35. Tani K, Stone A, Exavery A, et al (2016) A time-use study of community health worker 769
service activities in three rural districts of Tanzania (Rufiji, Ulanga and Kilombero). BMC 770
Health Serv Res 16:. https://doi.org/10.1186/s12913-016-1718-6 771
36. Mpembeni RNM, Bhatnagar A, LeFevre A, et al (2015) Motivation and satisfaction 772
among community health workers in Morogoro Region, Tanzania: Nuanced needs and 773
varied ambitions. Hum Resour Health 13:. https://doi.org/10.1186/s12960-015-0035-1 774
37. Rafiq MY, Wheatley H, Mushi HP, Baynes C (2019) Who are CHWs? An ethnographic 775
study of the multiple identities of community health workers in three rural Districts in 776
Tanzania. BMC Health Serv Res 19:. https://doi.org/10.1186/s12913-019-4563-6 777
38. Developing and Strengthening Community Health Worker Programs at Scale A Reference 778
Guide for Program Managers and Policy Makers 779
39. Faris S (2015) The Solar Company Making a Profit on Poor Africans. Bloom. 780
Businessweek 781
40. Feroz A, Jabeen R, Saleem S (2020) Using mobile phones to improve community health 782
workers performance in low-and-middle-income countries. BMC Public Health 20 783
41. Jeuland M, Pattanayak SK, Tan Soo J-S (2014) Preference Heterogeneity and Adoption of 784
Environmental Health Improvements: Evidence from a Cookstove Promotion Experiment 785
The role of preference heterogeneity in adoption of environmental health improvements: 786
Evidence from a randomized cookstove promotion experiment 787
42. Ezzati M, Bailis R, Kammen DM, et al (2004) ENERGY MANAGEMENT AND 788
GLOBAL HEALTH. Annu Rev Environ Resour 29:383–419. 789
https://doi.org/10.1146/annurev.energy.29.062103.121246 790
43. Corbin J, Strauss A (1990) Grounded Theory Research: Procedures, Canons, and 791
Evaluative Criteria 792
44. Masera OR, Saatkamp BD, Kammen DM From Linear Fuel Switching to Multiple 793
Cooking Strategies: A Critique and Alternative to the Energy Ladder Model. Pergamon 794
45. Hanna R, Duflo E, Greenstone M (2016) Up in smoke: The influence of household 795
behavior on the long-run impact of improved cooking stoves. Am Econ J Econ Policy 796
8:80–114. https://doi.org/10.1257/pol.20140008 797
46. Arnold JE., Jongma J (1978) Fuelwood and charcoal in developing countries: An 798
economic survey 799
47. Tanzania UR of (2016) THE UNITED REPUBLIC OF TANZANIA National Bureau of 800
Statistics Ministry of Finance and Planning Dar-es-Salaam PREFACE 801
48. Steenland K, Pillarisetti A, Kirby M, et al (2018) Modeling the potential health benefits of 802
lower household air pollution after a hypothetical liquified petroleum gas (LPG) 803

41
cookstove intervention. Environ Int 111:71–79. 804
https://doi.org/10.1016/j.envint.2017.11.018 805
806

Figures
Figure 1
Sample of the initial survey that gauged the family’s energy consumption in regard to cooking, lighting,and other appliances.
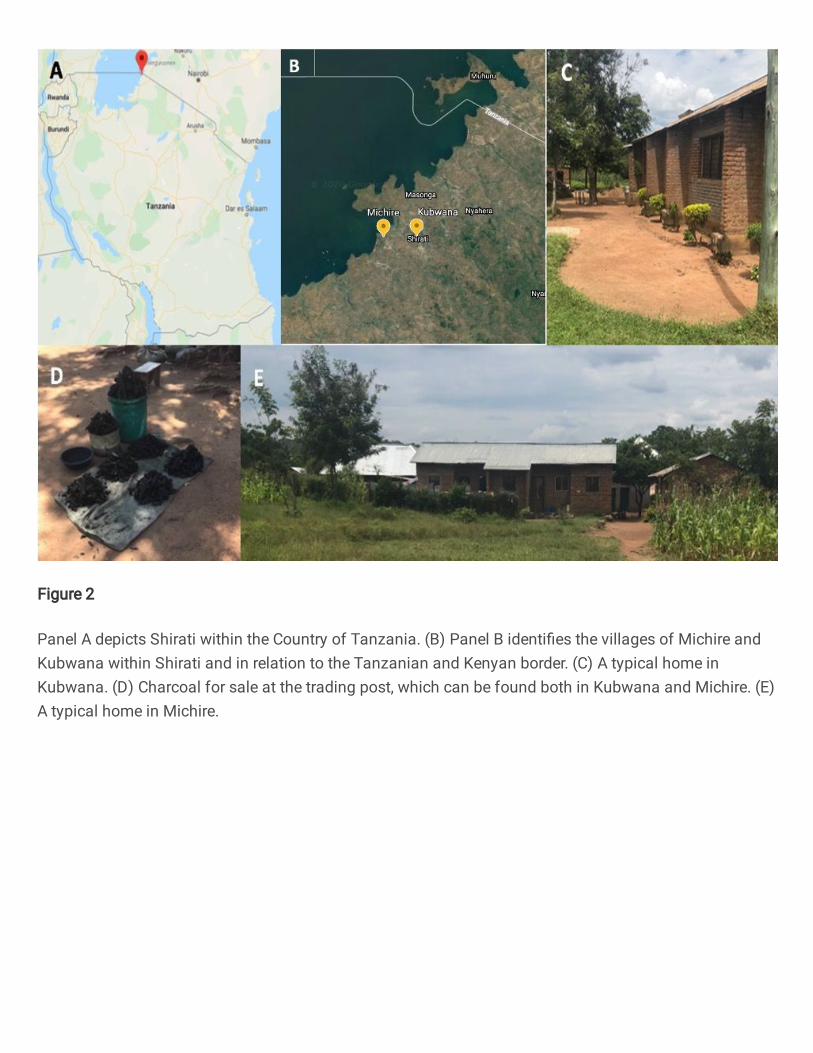
Figure 2
Panel A depicts Shirati within the Country of Tanzania. (B) Panel B identi�es the villages of Michire andKubwana within Shirati and in relation to the Tanzanian and Kenyan border. (C) A typical home inKubwana. (D) Charcoal for sale at the trading post, which can be found both in Kubwana and Michire. (E)A typical home in Michire.

Figure 3
Trends in using gas for every meal. The x-axis is the number of weeks after the receival of the stove andinitial household visit; the y-axis is percent of households (30 total, 15 in Kubwana, and 15 in Michire).
Figure 4
Trends in using gas for every meal. The x-axis is the number of weeks after the receival of the stove andinitial household visit, but in the second period of the study; the y-axis is percent of households (30 total,15 in Kubwana, and 15 in Michire).

Figure 5
Trends in the continued use of �rewood or charcoal after receipt of LPG stove and education from theCTW. The x-axis is the number of weeks after the receipt of the stove and initial household visit; the y-axisis percent of households (30 total, 15 in Kubwana, and 15 in Michire).
Figure 6
Trends in the continued use of �rewood or charcoal after receipt of LPG stove and education from theCTW. The x-axis is the number of weeks after the receipt of the stove and initial household visit; the y-axisis percent of households (30 total, 15 in Kubwana, and 15 in Michire).

Figure 7
Trends in levels of LPG adoption from exclusive use to only biomass. Panel A represents Kubwanahouseholds in Kubwana (n=15); Panel B is Michire households (n=15); Panel C is all study households(n=30). The x-axis is the time since the initial intervention up until December 2018, while the y-axis is thepercent of households.

Figure 8
Trends in levels of LPG adoption from exclusive to only biomass. Panel A represents Kubwanahouseholds (n=15); Panel B is Michire households (n=15); Panel C is all study households (n=30). The x-axis is the time since the study switched to bi-weekly visits in January 2019, while the y-axis is thepercent of households.

Supplementary Files
This is a list of supplementary �les associated with this preprint. Click to download.
82020SupplementalMaterialforValueofCTW.docx