the validation of a novel surveillance system for
TRANSCRIPT

University of Calgary
PRISM University of Calgarys Digital Repository
Graduate Studies Legacy Theses
2011
The Validation of a Novel Surveillance System for
Monitoring of Bloodstream Infections in the Calgary
Health Region
Leal Jenine Rocha
Leal J R (2011) The Validation of a Novel Surveillance System for Monitoring of Bloodstream
Infections in the Calgary Health Region (Unpublished masters thesis) University of Calgary
Calgary AB doi1011575PRISM18777
httphdlhandlenet188048510
master thesis
University of Calgary graduate students retain copyright ownership and moral rights for their
thesis You may use this material in any way that is permitted by the Copyright Act or through
licensing that has been assigned to the document For uses that are not allowable under
copyright legislation or licensing you are required to seek permission
Downloaded from PRISM httpsprismucalgaryca
UNIVERSITY OF CALGARY
The Validation of a Novel Surveillance System for Monitoring of Bloodstream Infections
in the Calgary Health Region
by
Jenine Rocha Leal
A THESIS
SUBMITTED TO THE FACULTY OF GRADUATE STUDIES
IN PARTIAL FULFILMENT OF THE REQUIREMENTS FOR THE
DEGREE OF MASTER OF SCIENCE
DEPARTMENT OF COMMUNITY HEALTH SCIENCES
CALGARY ALBERTA
APRIL 2011
copy JENINE ROCHA LEAL 2011
The author of this thesis has granted the University of Calgary a non-exclusive license to reproduce and distribute copies of this thesis to users of the University of Calgary Archives
Copyright remains with the author
Theses and dissertations available in the University of Calgary Institutional Repository are solely for the purpose of private study and research They may not be copied or reproduced except as permitted by copyright laws without written authority of the copyright owner Any commercial use or re-publication is strictly prohibited
The original Partial Copyright License attesting to these terms and signed by the author of this thesis may be found in the original print version of the thesis held by the University of Calgary Archives
Please contact the University of Calgary Archives for further information E-mail uarcucalgaryca Telephone (403) 220-7271 Website httparchivesucalgaryca
Abstract
An electronic surveillance system (ESS) for bloodstream infections (BSIs) in the
Calgary Health Region (CHR) was assessed for its agreement with traditional medical
record review (MRR)
Related data from regional laboratory and hospital administrative databases were
linked Definitions for excluding contaminants and duplicate isolates were applied
Infections were classified as nosocomial (NI) healthcareshyassociated communityshyonset
(HCA) or communityshyacquired (CA) A random sample of patients from the ESS was then
compared with independent MRR
Among the 308 patients selected for comparative review the ESS identified 318
episodes of BSI while the MRR identified 313 episodes of BSI Episodes of BSI were
concordant in 304 (97) cases Agreement between the ESS and the MRR was 855 with
kappa=078 (95 confidence interval [CI] 075shy080)
This novel ESS identified and classified BSI with a high degree of accuracy This
system requires additional linkages with other related databases
ii
Preface
This thesis aims to validate a previously developed electronic surveillance system
that monitors bloodstream infections in the Calgary Health Region The process of
evaluating and revising a surveillance systemrsquos algorithms and applications is required
prior to its implementation This electronic surveillance system has the capability of
outlining which bloodstream infections occur in hospitals outpatient facilities and in the
community Infection control practitioners in the hospital or outpatient settings can use
this system to distinguish true bloodstream infections from contaminant sources of positive
blood cultures Furthermore it outlines which bloodstream infections are likely secondary
to the use of central venous catheters (ie primary infections) that require further
investigation and intervention by infection control practitioners
Prior to the commencement of this thesis I published the definitions and
discrepancies identified in the electronic surveillance system This provided the framework
for conducting my thesis For that publication I conducted the medical record review
analyzed the data and wrote the initial and final draft of the manuscript The full citation is
as follows
Jenine Leal BSc Daniel B Gregson MD Terry Ross Ward W Flemons MD
Deirdre L Church MD PhD and Kevin B Laupland MD MSc FRCPC Infection
Control and Hospital Epidemiology Vol 31 No 7 (July 2010) pp 740shy747
iii
Acknowledgements
I owe my deepest gratitude to my supervisor Dr Kevin Laupland whose
encouragement guidance and support helped me succeed in all endeavours from beginning
to end To Dr Elizabeth Henderson Mrs Terry Ross and my committee members (DG
DC WF) thank you for all your help and expertise
To Marc and my family I am indebted to you always for believing in me and for
the continued love and support throughout this project
I gratefully acknowledge the funding sources that made my work possible I was
funded by the Queen Elizabeth II Graduate Scholarship (University of Calgary 2008shy
2010) Health Quality Council of Alberta (Alberta Health Services 2009) and the Calvin
Phoebe and Joan Snyder Institute of Infection Immunity and Inflammation (2008)
I would like to thank the University of Chicago Press that granted permission on
behalf of The Society of Healthcare Epidemiology of America copy 2010 for the reuse of my
previously published work outlined in the Preface of this thesis
Lastly I offer my regards and blessings to all those who supported me in any
respect during the completion of this project
Sincerely
Jenine Leal
iv
Table of Contents
Abstract ii Preface iii Acknowledgements iv Table of Contents v List of Tables ix List of Figures xi List of Abbreviations xii
INTRODUCTION 1 Rationale 3
LITERATURE REVIEW 4 Concepts Related to Bloodstream Infections 4 Pathophysiology 6 Clinical Patterns of Bacteraemia and Fungemia 6 Epidemiology of Bloodstream Infections 8
Risk Factors for Bloodstream Infections 8 CommunityshyAcquired Bloodstream Infections 8 Nosocomial Bloodstream Infections 9 HealthcareshyAssociated CommunityshyOnset 10 Prognosis of Bacteraemia 11
Detection of MicroshyOrganisms in Blood Cultures 12 Manual Blood Culture Systems 12 Automated Blood Culture Systems 13 ContinuousshyMonitoring Blood Culture Systems 14
Interpretation of Positive Blood Cultures 15 Identity of the MicroshyOrganism 15 Number of Blood Culture Sets 17 Volume of Blood Required for Culture 20 Time to Growth (Time to Positivity) 20
Limitations of Blood Cultures 21 Surveillance 22
History of Surveillance 22 Elements of a Surveillance System 25 Types of Surveillance 27
Passive Surveillance 27 Active Surveillance 29 Sentinel Surveillance 30 Syndromic Surveillance 31
v
Conceptual Framework for Evaluating the Performance of a Surveillance System 33 Level of Usefulness 33 Simplicity 34 Flexibility 34 Data Quality 34 Acceptability 39 Sensitivity 39 Positive Predictive Value 39 Representativeness 40 Timeliness 40 Stability 41
Surveillance Systems for Bacterial Diseases 41 Canadian Surveillance Systems 41 Other Surveillance Systems 43
Surveillance Methodologies 45 HospitalshyBased Surveillance Methodology 45 Electronic Surveillance 48
Validity of Existing Electronic Surveillance Systems 49 Use of Secondary Data 51
Limitations of Secondary Data Sources 54 Advantages of Secondary Data Sources 55 LaboratoryshyBased Data Sources 56
Development of the Electronic Surveillance System in the Calgary Health Region 61
OBJECTIVES AND HYPOTHESES 65 Primary Objectives 65 Secondary Objectives 65 Research Hypotheses 65
METHODOLOGY AND DATA ANALYSIS 67 Study Design 67 Patient Population 67
Electronic Surveillance System 67 Comparison Study 67 Sample Size 68
Development of the Electronic Surveillance System 68 Definitions Applied in the Electronic Surveillance System 75 Comparison of the ESS with Medical Record Review 80 Definitions Applied in the Medical Record Review 83 Data Management and Analysis 85
Electronic Surveillance System 85
vi
Comparison Study 86 Ethical Considerations 87
RESULTS 88
Comparison between the Electronic Surveillance System and the Medical Record
Description of Discrepancies in Location of Acquisition between Medical
Comparison of the Source of Infection between the Medical Record Review and
Descriptions of Discrepancies in the Source of Infection between Medical
Comparison of the Source of BSIs among Concordant Secondary BSIs
PopulationshyBased Surveillance Based on the Application of the ESS Algorithms 88 Incident Episodes of Bloodstream Infection 88 Aetiology of Episodes of Bloodstream Infections 90 Acquisition Location of Incident Bloodstream Infections 92 Patient Outcome 94
Medical Record Review and Electronic Surveillance System Analysis 96 Aetiology 96
Medical Record Review 96 Electronic Surveillance System 101
Episodes of Bloodstream Infections 102 Medical Record Review 102 Electronic Surveillance System 103
Acquisition Location of Bloodstream Infections 103 Medical Record Review 103 Electronic Surveillance System 104
Source of Bloodstream Infections 106 Medical Record Review 106 Electronic Surveillance System 109
Patient Outcome 110 Medical Record Review 110 Electronic Surveillance System 111
Review 113 Episodes of Bloodstream Infection 113
Description of Discrepancies in Episodes of Bloodstream Infection 113 Acquisition Location of Episodes of Bloodstream Infection 114
Record Review and the ESS 115
the ESS 120
Record Review and the ESS 121
between the Medical Record Review and the ESS 123 Summary of Results 124
DISCUSSION 126
vii
Novelty of the Electronic Surveillance System 126 Validation of the Electronic Surveillance System 127
Identification of Bloodstream Infections 129 Review of the Location of Acquisition of Bloodstream Infections 133 Review of the Source of True Bloodstream Infection 138
Validity and Reliability 139 Population Based Studies on Bloodstream Infections 142 Limitations 144 Implications 150 Future Directions 156
Inclusion of ICDshy9 and ICDshy10 Codes to the ESS Algorithm 156 Evaluation of Antimicrobial Resistance 157
CONCLUSION 159
BIBLIOGRAPHY 160
APPENDIX A ADMINISTRATIVE DATABASE FIELD DESCRIPTIONS 182
APPENDIX B MEDICAL RECORD REVIEW FORM 193
APPENDIX C KAPPA CALCULATIONS 196 Measuring Observed Agreement 196 Measuring Expected Agreement 196 Measuring the Index of Agreement Kappa 196 Calculating the Standard Error 196
APPENDIX D ORGANISMS WITH INCIDENCE OF LESS THAN 1 PER 100000 ADULT POPULATION FROM TABLE 51 197
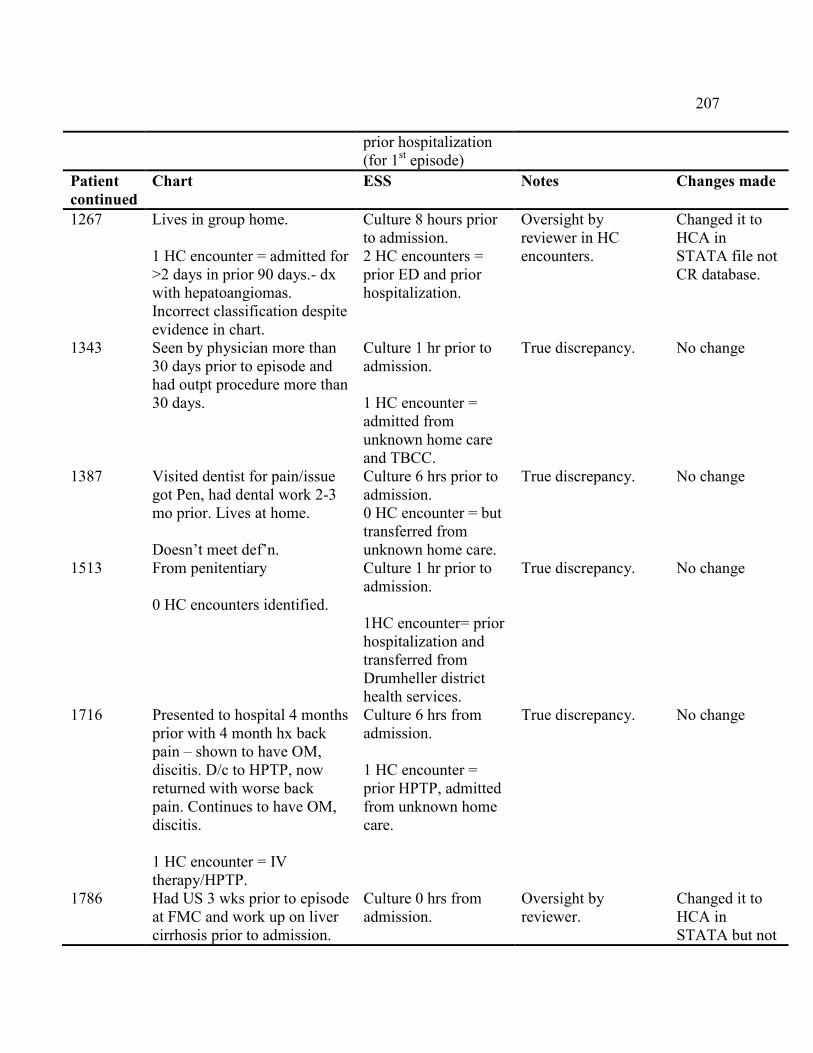
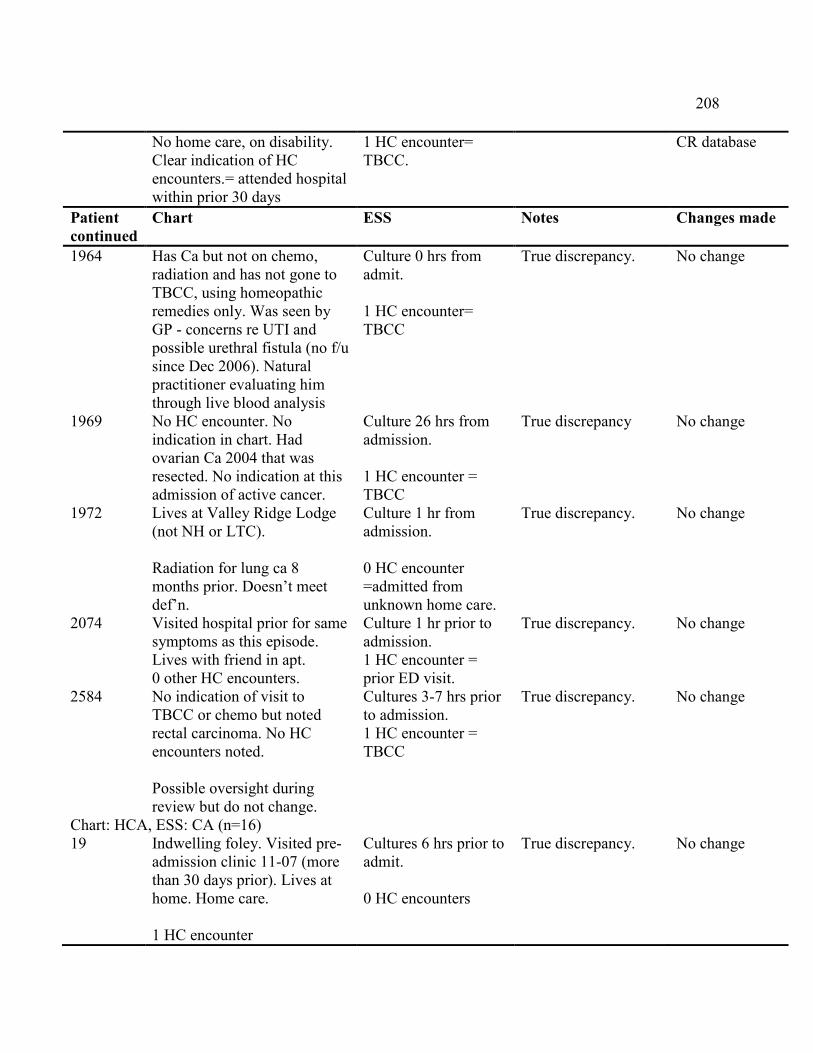
APPENDIX E DETAILED TABULATION OF DISCREPANCIES BETWEEN THE MEDICAL RECORD REVIEW AND THE ESS 199
viii
List of Tables
Table 41 Description of Fields in the ESS after Linkage of Electronic Data Sources on Microsoft Access 2003 72
Table 42 Modified Regional Health Authority Indicators 75
Table 43 Bloodstream Infection Surveillance Definitions 76
Table 44 Focal Culture Guidelines for the ESS Algorithm 79
Table 45 Description of Fields in the Medical Record Review on Microsoft Access 2003 81
Table 46 Medical Record Review Definitions for Bloodstream Infection Surveillance 84
Table 51 The 2007 SpeciesshySpecific Incidence among Adult Residents (gt18 years) of the Calgary Health Region 91
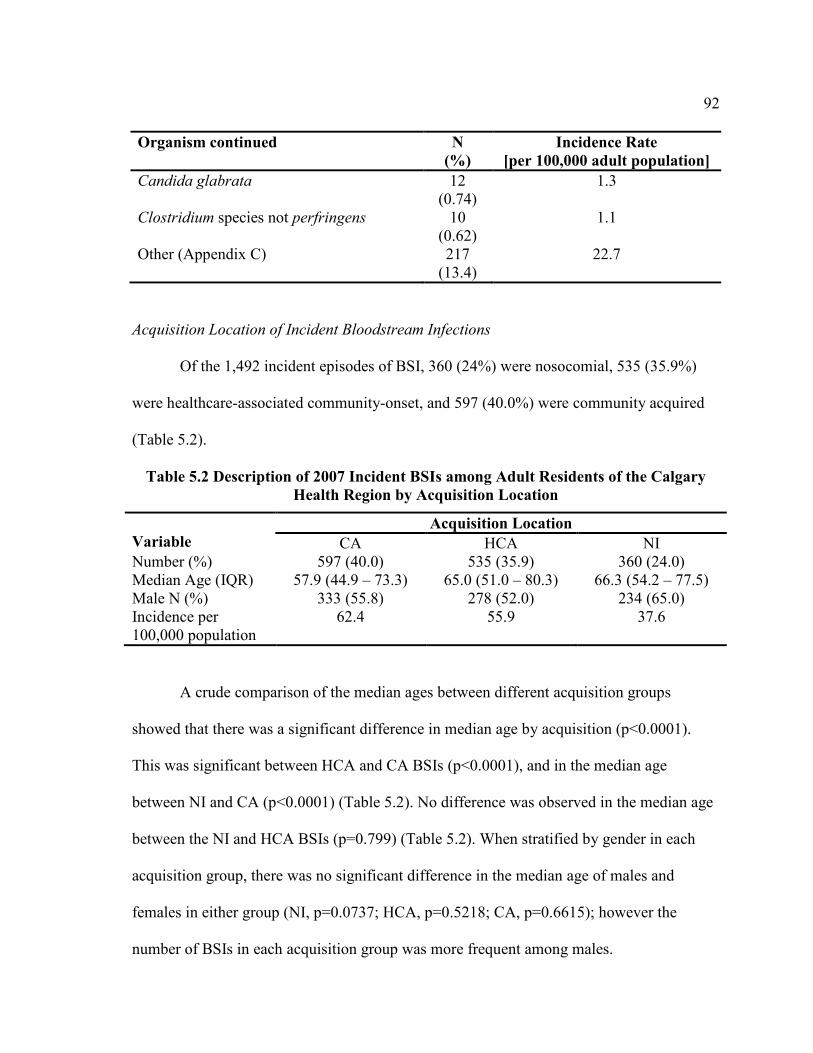
Table 52 Description of 2007 Incident BSIs among Adult Residents of the Calgary Health Region by Acquisition Location 92
Table 53 Distribution of Previous Healthcare Encounters Prior to Incident BSIs among Adult Patients in the Calgary Health Region (2007) 93
Table 54 The 2007 Organism Distribution by Acquisition Location for Incident BSIs among Adults in the Calgary Health Region 94
Table 55 InshyHospital Outcome by Location of Acquisition of Incident BSIs among Adults in the Calgary Health Region 95
Table 56 Distribution of Organisms Collected from 661 Cultures Based on the Medical Record Review 97
Table 57 Frequency of Organisms among MonoshyMicrobial Episodes of BSIs in the Medical Record Review (MRR) and the Electronic Surveillance System (ESS) 99
Table 58 Frequency of Organisms among PolyshyMicrobial Episodes of BSI in the Medical Record Review (MRR) and the Electronic Surveillance System (ESS) 101
ix
Table 59 Previous Healthcare Encounters among Patients with HealthcareshyAssociated CommunityshyOnset BSIs Based on the Medical Record Review 104
Table 510 Previous Healthcare Encounters among Patients with HealthcareshyAssociated CommunityshyOnset BSIs Based on the ESS Sample 106
Table 511 Source of Secondary BSIs Identified in the Medical Record Review and the Electronic Surveillance System 108
Table 512 Source of BSIs by Location of Acquisition for Episodes of BSIs Included in the Medical Record Review 109
Table 513 Source of BSIs by Location of Acquisition for Episodes of BSIs Included in the ESS Sample 110
Table 514 InshyHospital Outcome by Location of Acquisition of BSIs Included in the Medical Record Review 111
Table 515 InshyHospital Outcome by Location of Acquisition of BSIs Included in the ESS Sample 112
Table 516 Comparison of Location Acquisition of BSIs between the Medical Record Review and the ESS 115
Table 517 Source of BSIs between Medical Record Review and the ESS 121
Table E1 Description of Discrepancies between ESS and Medical Record Review in the Identification of True BSIs 199
Table E2 Description of Discrepancies between ESS and Medical Record Review in the Identification of True BSIs 201
Table E3 Description of Discrepancies in the Location of Acquisition Between the Medical Record Review and the ESS 203
Table E4 Discrepancies in the Focal Body Site for the Concordant Secondary BSIs between the ESS and the Medical Record Review 211
x
List of Figures
Figure 41 Computer Flow Diagram of the Development of the ESS 71
Figure 51 Flow Diagram of Incident Episodes of Bloodstream Infection by the ESS 89
xi
List of Abbreviations
Abbreviation Definition ABC Active Bacterial Core AHS Alberta Health Services BSI Bloodstream Infection CA Communityshyacquired CANWARD Canadian Ward Surveillance Study CASPER Calgary Area Streptococcus pneumonia Epidemiology Research CBSN Canadian Bacterial Surveillance Network CDAD Clostridium difficile associated diarrhoea CDC Centers for Disease Control and Prevention CFU Colony forming units CHEC Canadian Healthcare Education Committee CHR Calgary Health Region CI Confidence Interval CIPARS Canadian Integrated Program for Antimicrobial Resistance Surveillance CLS Calgary Laboratory Services CLSI Clinical and Laboratory Standards Institute CNISP Canadian Nosocomial Infection Surveillance Program CO2 Carbon dioxide CoNS Coagulaseshynegative staphylococci CQI Continuous quality improvement CVC Central vascular catheter DDHS Didsbury District Health Services ED Emergency department ESBL Extended spectrum betashylactamases ESS Electronic surveillance system FMC Foothills Medical Centre GAS Group A Streptococcus HCA Healthcareshyassociated communityshyonset HPTP Home parenteral therapy program ICDshy10shyCA International Classification of Diseases Tenth Revision Canadian Edition ICDshy9shyCM International Classification of Diseases Ninth Revision Clinical
Modifiction ICU Intensive care unit IMPACT Immunization Monitoring Program ACTive IQR Interquartile range ISCPs Infection surveillance and control programs IV Intravenous
xii
LIS Laboratory information system MI Myocardial infarction mmHg Millimetre of mercury MRR Medical record review MRSA Methicillinshyresistant Staphylococus aureus MSSA Methicillinshysusceptible Staphylococcus aureus NHSN National Healthcare Safety Network NI Nosocomial bloodstream infection NML National Microbiology Laboratory NNIS National Nosocomial Infection Surveillance system NPV Negative predictive value PaCO2 Partial pressure of carbon dioxide PCV7 Sevenshyvalent pneumococcal conjugate vaccine PHAC Public Health Agency of Canada PHN Primary healthcare number PLC Peter Lougheed Hospital PPV Positive predictive value RCR Retrospective chart review RHA Regional health authority RHRN Regional health record number SARP Southern Alberta Renal Program SDHS Strathmore District Health Services SE Standard error SENIC Study on the Efficacy of Nosocomial Infection Control SIRS Systemic inflammatory response syndrome SSTI Skin and soft tissue infection TBCC Tom Baker Cancer Centre TIBDN Toronto Invasive Bacterial Disease Network TPN Total parenteral nutrition UTI Urinary tract infection VMS Virtual memory system VRE Vancomycinshyresistant enterococci
xiii
1
INTRODUCTION
Bloodstream infections (BSI) constitute an important health problem with a high
caseshyfatality rate in severe cases (1) Infectious disease surveillance is defined as the
ongoing systematic collection of data regarding an infectious disease event for use in
public health action to reduce morbidity and mortality and to improve health (1)
Surveillance for BSIs is important to measure and monitor the burden of disease evaluate
risk factors for acquisition monitor temporal trends in occurrence and to identify emerging
and reshyemerging infections with changing severity It is an area of growing interest because
the incidence of antibiotic resistant bacteria is rising and new resistant strains are emerging
(2) As part of an overall prevention and control strategy the Centers for Disease Control
and Preventionrsquos (CDC) Healthcare Infection Control Practices Advisory Committee
recommends ongoing surveillance for bloodstream infections (3) However traditional
surveillance methods are dependent on manual collection of clinical data from the medical
record clinical laboratory and pharmacy by trained infection control professionals This
approach is timeshyconsuming and costly and focuses infection control resources on counting
rather than preventing infections (3)
Automated or electronic surveillance of infectious diseases is the process of
obtaining information from intershyrelated electronic databases for identifying infection
distributions within a particular setting (4) With increasing use and availability of
electronic patient data within healthcare institutions and in community settings the
potential for automated surveillance has been increasingly realized (4 5)
Administrative and laboratoryshybased data may be linked for streamlined data
collection on patient admission demographic and diagnostic information as well as
2
microbiologic detail species distribution and antibiotic resistance rates Since these
electronic data are usually routinely collected for other primary purposes electronic
surveillance systems may be developed and implemented with a potentially minimal
incremental expense (5)
As a result of uncertainty surrounding its accuracy electronic surveillance has not
been widely adopted Traditional labourshyintensive manual infection surveillance methods
remain the principal means of surveillance in most jurisdictions (5)
Consequently there are few studies that have reported on the accuracy of
ldquoelectronic surveillancerdquo as compared to traditional manual methods An electronic
surveillance system (ESS) was developed in the Calgary Health Region (CHR) to monitor
bloodstream infections and was assessed to determine whether data obtained from the ESS
were in agreement with data obtained by manual medical record review (MRR) Definitions
were created to identify episodes of bloodstream infection and the location of acquisition of
the BSIs That ESS had a high degree of accuracy when compared to the MRR
Discrepancies in identifying episodes of bloodstream infection and in the location of
acquisition of BSIs were described and definitions were revised to improve the overall
accuracy of the ESS However there was incomplete evaluation of the developed and
revised definitions
The objective of this study was to evaluate the developed active electronic
information populationshybased surveillance system for bloodstream infection in the CHR by
comparing it to traditional manual medical record review
3
Rationale
This study aimed to validate a developed efficient active electronic information
populationshybased surveillance system to evaluate the occurrence and classify the acquisition
of all bloodstream infections among adult residents of the Calgary Health Region This
system will be a valuable adjunct to support quality improvement infection prevention and
control and research activities The electronic surveillance system will be novel in a
number of ways
1) All bloodstream infections occurring among adult residents of the CHR will
be included in the surveillance system Sampling will not be performed and
therefore selection bias will be minimized
2) Unlike other surveillance systems that only include a selected pathogen(s) a
broad range of pathogens will be included such that infrequently observed or
potentially emerging pathogens may be recognized
3) Infections will be classified as nosocomial healthcareshyassociated
communityshyonset or community acquired Studies to date have focused on
restricted populations No studies investigating electronic surveillance have
attempted to utilize electronic surveillance definitions to classify infections
according to the criteria of Friedman et al (6)
4) A multishystep methodology that involves the initial development revision
and validation of electronic definitions will be utilized
4
LITERATURE REVIEW
Concepts Related to Bloodstream Infections
Bacteraemia or fungemia entails the presence of viable bacteria or fungi identified
in a positive blood culture respectively (7 8) Contamination is a falsely positive blood
culture when microshyorganisms that are not actually present in a blood sample are grown in
culture and there is no clinical consequence as a result (ie no infection) (9) Infection is
characterized by the inflammatory response to the presence of microshyorganisms such as
bacteria or fungi in normally sterile tissue bodily spaces or fluids (8 10) A bloodstream
infection is therefore defined as the presence of bacteria or fungi in blood resulting in signs
and symptoms of infection such as fever (gt38degC) chills malaise andor hypotension (11)
Sepsis is the systemic inflammatory response syndrome (SIRS) resulting from an
infection manifested by two or more clinical criteria (ie body temperature greater than
38ordmC or less than 30ordmC heart rate greater than 90 beats per minute respiratory rate of
greater than 20 breaths per minute or a PaCO2 of less than 32 mmHg or white blood cell
count greater than 12000 per cubic millimetre or less than 4000 per cubic millimetre or
greater than 10 immature forms) but with a clearly documented inciting infectious
process with or without positive blood cultures (8 10 12) The signs and symptoms of
sepsis are nonshyspecific Often there is acute onset of fever associated rigors malaise
apprehension and hyperventilation Symptoms and signs associated with the primary
source of infection are present in the majority of patients with some patients having
coetaneous manifestations such as rash septic emboli or ecthyma gangrenosum (7)
5
Furthermore some patients with bacteraemia or fungemia may be hypothermic often a
poor prognostic sign (7)
The various combinations of sites organisms and host responses associated with
sepsis have made it difficult to develop a single simple definition to facilitate clinical
decision making and clinical research (8 10 13) One of the first attempts to establish a set
of clinical parameters to define patients with sepsis occurred in 1989 when Roger Bone and
colleagues proposed the term ldquosepsis syndromerdquo It included clinical signs and symptoms
such as hypothermia or hyperthermia tachycardia tachypnea hypoxemia and clinical
evidence of an infection (10 12) Following this the American College of Chest Physicians
and the Society of Critical Care Medicine convened in 1991 to create a set of standardized
definitions for future research and diagnostic ability (8 10) They introduced a new
framework for the definition of systemic inflammatory responses to infection the sequelae
of sepsis and the SIRS (8 10) As a result terms such as septicaemia and septic syndrome
were eliminated due to their ambiguity and replaced with sepsis severe sepsis and septic
shock (8 10)
The continued dissatisfaction with available definitions of sepsis led to a Consensus
Sepsis Definitions Conference which convened in 2001 The participants of the conference
concluded that the 1991 definitions for sepsis severe sepsis and septic shock were still
useful in clinical practice and for research purposes (10) The changes were in the use of
the SIRS criteria which were considered too sensitive and nonshyspecific They suggested
other signs and symptoms be added to reflect the clinical response to infection (10)
Reflecting on these changes to the definition of sepsis due to its complexity and variation
suggests that a single simple definition for sepsis may never be possible and as such focus
6
should be placed on types of infection that are clearly defined (ie bacteraemia or BSIs)
(10)
Pathophysiology
Invasion of the blood by microshyorganisms usually occurs by one of two
mechanisms The first often termed ldquoprimaryrdquo BSI occurs through direct entry from
needles (eg in intravenous [IV] drug users) or other contaminated intravascular devices
such as catheters or graft material (7 13) The second termed ldquosecondaryrdquo BSI occurs as
an infection that is secondary to a preshyexisting infection occurring elsewhere in the body
such as pneumonia meningitis surgical site infections (SSI) urinary tract infections (UTI)
or infections of soft tissue bones and joints or deep body spaces (7 14shy16) Secondary
BSIs occur either because an individualrsquos host defences fails to localize an infection at its
primary site or because a healthcare provider fails to remove drain or otherwise sterilize
the focus (7 17)
Clinical Patterns of Bacteraemia and Fungemia
Bacteraemia can be categorized as transient intermittent or continuous Transient
bacteraemia lasting minutes or hours is the most common and occurs after the
manipulation of infected tissues (eg abscesses furuncles) during certain surgical
procedures when procedures are undertaken that involve contaminated or colonized
mucosal surfaces (eg dental manipulation cytoscopy and gastrointestinal endoscopies)
and at the onset of acute bacterial infections such as pneumonia meningitis septic
arthritis and acute haematogenous osteomyelitis Intermittent bacteraemia occurs clears
and then recurs in the same patient and it is caused by the same microshyorganism (7)
Typically this type of bacteraemia occurs because the blood is being seeded intermittently
7
by an unshydrained closedshyspace infection such as intrashyabdominal abscesses or focal
infections such as pneumonia or osteomyelitis (7) Continuous bacteraemia is characteristic
of infective endocarditis as well as other endovascular infections (eg suppurative
thrombophlebitis) (7)
Bloodstream infections can also be categorized as monoshymicrobial or polyshy
microbial Monoshymicrobial BSIs are marked by the presence of a single species of microshy
organisms in the bloodstream Polyshymicrobial infections refer to infections in which more
than one species of microshyorganisms is recovered from either a single set of blood cultures
or in different sets within a 48shyhour window after another had been isolated (18 19) Polyshy
microbial bacteraemia comprises between six percent and 21 of episodes in hospital
based cohorts (7 19shy22) Polyshymicrobial BSIs are associated with increased 28shyday
mortality and inshyhospital mortality (19 22)
The term ldquobreakthrough bacteraemiardquo is used to describe the occurrence of
bacteraemia in patients despite receiving appropriate therapy for the microshyorganism that is
grown from the blood (7 23) A study in two universityshyaffiliated hospitals in Spain by
Lopez Dupla et al has described the clinical characteristics of breakthrough bacteraemia
They identified that nosocomial acquisition endovascular source of infection underlying
conditions (eg neutropenia multiple trauma allogenic bone marrow and kidney
transplantation) and particular microbial aetiologies (eg Staphylococcus aureus
Pseudomonas aeruginosa and polyshymicrobial aetiologies) were independently associated
with increased risk for developing breakthrough bacteraemia (23) Other studies have
evaluated or identified breakthrough bacteraemia in specific patient populations (eg cancer
8
and neutropenic patients) or have found breakthrough bacteraemia due to particular microshy
organisms (eg Streptococcus pneumoniae Escherichia coli) (24shy27)
Epidemiology of Bloodstream Infections
Risk Factors for Bloodstream Infections
Conditions that predispose an individual to a BSI include not only age and
underlying diseases but also medications and procedures whose primary purposes are
maintenance or restoration of health (7) There is increased risk at the extremes of age with
premature infants being especially at risk for bacteraemia
Underlying illnesses associated with an increased risk of BSI include
haematological and nonshyhaematological malignancies diabetes mellitus renal failure
requiring dialysis hepatic cirrhosis immune deficiency syndromes malnutrition solid
organ transplantation and conditions associated with the loss of normal skin barriers such as
serious burns and decubitus ulcers (7 28shy31)
Therapeutic strategies associated with an increased risk of bacteraemia include
procedures such as placement of intravascular catheters as well as surgeries of all types but
especially involving the bowel and genitourinary tract and endoscopic procedures of the
genitourinary and lower gastrointestinal tracts (7 20 32) Certain medications such as
corticosteroids cytotoxic drugs used for chemotherapy and antibiotics increase the risk for
infection due to pyogenic bacteria and fungi (7 20)
CommunityshyAcquired Bloodstream Infections
Communityshyacquired (CA) BSIs are often classified as those submitted from
communityshybased collection sites or those identified within the first two days (lt48 hours)
of admission to an acute care facility (28 33)
9
Laupland et al conducted a laboratoryshybased surveillance in the Calgary Health
Region (CHR) and found that CAshyBSIs occurred at an incidence of 82 per 100000
population per year of which 80 required acute care hospital admission and 13 of
patients died (33) A study by Valles et al found that of the 581 CAshyBSI episodes 79
were hospitalized (34) The attributable mortality of BSI was 10 for communityshyonset
infections in a study by Diekema et al (35) As such it has a similar acute burden of
disease as major trauma stroke and myocardial infarction (MI) (33 36)
Finally the time between sepsis and admission to hospital was greater for patients
with CAshyinfections than those with healthcareshyassociated communityshyonset infections
(HCA 6 + 25 days vs 02 + 1 day p=0001) in a separate study (37)
Nosocomial Bloodstream Infections
Hospitalshyacquired or nosocomial (NI) BSIs are defined as a localized or systemic
condition resulting from an adverse reaction to the presence of an infectious agent(s) or its
toxin(s) There must be no evidence that the infection was present or incubating at the time
of admission to the acute care setting (ie gt48 hours after admission) (38) They represent
one of the most important complications of hospital care and are increasingly recognized as
a major safety concern (39shy42) While all patients admitted to hospital are at risk these
infections occur at highest rate in those most vulnerable including the critically ill and
immune compromised patients (18 43 44)
In one study from the CHR development of an intensive care unit (ICU)shyacquired
BSI in adults was associated with an attributable mortality of 16 [95 confidence
interval (CI) 59shy260] and a nearly 3shyfold increased risk for death [odds ratio (OR) 264
95 CI 140shy529] (45) The median excess lengths of ICU and hospital stay attributable to
10
the development of ICUshyacquired BSI were two and 135 days respectively and the
attributable cost due to ICUshyacquired BSI was 25155 Canadian dollars per case survivor
(45) The longest median length of stay (23 days IQR 135 to 45 days) and the highest
crude inpatient mortality (30) occurred among patients with nosocomial infections
compared to healthcareshyassociated and communityshyacquired infections in the study by
Friedman et al (6)
HealthcareshyAssociated CommunityshyOnset
Bloodstream infections have traditionally been classified as either nosocomial or
community acquired (46) However changes in healthcare systems have shifted many
healthcare services from hospitals to nursing homes rehabilitation centers physiciansrsquo
offices and other outpatient facilities (46) Although infections occurring in these
healthcareshyassociated settings are traditionally classified as communityshyacquired evidence
suggests that healthcareshyassociated communityshyonset (HCA) infections have a unique
epidemiology with the causative pathogens and their susceptibility patterns frequency of
coshymorbid conditions sources of infection and mortality rate at followshyup being more
similar to NIs (6 37 46shy48) As a result Friedman et al sought to devise a new
classification scheme for BSIs that distinguishes among and compares patients with CAshy
BSIs HCAshyBSIs and NIs (6) Other studies have evaluated and used varying definitions
for HCA infections (37 46shy48) However the concept of HCA infections typically
encompasses infectious diseases in patients who fulfill one or more of the following
criteria 1) resident in a nursing home or a longshyterm care facility 2) IV therapy at home or
wound care or specialized nursing care 3) having attended a hospital or haemodialysis
11
clinic or received IV chemotherapy in the past 30 days andor 4) admission to an acute care
hospital for two or more days in the preceding 90 days (49)
Valles et al found that the highest prevalence of MethicillinshyResistant S aureus
(MRSA) infections occurred in patients whose infection was HCA (5 plt00001) and a
significantly higher mortality rate was seen in the group with HCA infections (275) than
in CA infections (104 plt0001) (34) Other studies found that compared with CAshyBSIs
the mortality risk for both HCA BSI and nosocomial BSIs was higher (46 47)
It has been suggested that empirical antibiotic therapy for patients with known or
suspected HCAshyBSIs and nosocomial BSIs should be similar (6 34) In contrast patients
with CAshyBSIs are often infected with antibioticshysensitive organisms and their prescribed
therapy should reflect this pattern (6)
Prognosis of Bacteraemia
It has long been recognized that the presence of living microshyorganisms in the blood
of a patient carries with it considerable morbidity and mortality (7) In fact BSIs are among
the most important causes of death in Canada and cause increased morbidity and healthcare
cost (16 28 50) Several factors have contributed to the high incidence and mortality from
BSIs including a) the aging population often living with chronic coshymorbidities b) the
increasing survival in the ICU of patients suffering from severe trauma or acute MI only to
become predisposed to infections during their period of recovery c) the increasing reliance
on invasive procedures for the diagnosis and treatment of a wide range of conditions and
d) the growing number of medical conditions treated with immunosuppressive drugs (51)
Bloodstream infections may arise in communityshybased patients or may complicate
patientsrsquo course once admitted to hospital as nosocomial BSIs (44 52 53) In either case
12
patient suffering is high with rates of mortality approaching 60 in severe cases (7 54)
Weinstein et al reported that about half of all deaths in bacteraemia patients could be
attributed to the septicaemia episodes themselves (55 56)
Detection of MicroshyOrganisms in Blood Cultures
There are three different methodologies for detecting microshyorganisms in blood
cultures These include manual detection systems automated detection systems and
continuousshymonitoring blood culture systems
Manual Blood Culture Systems
Manual detection systems are the simplest systems and consist of bottles filled with
broth medium and with a partial vacuum in the headspace (7) To convert the bottles into
aerobic bottles the oxygen concentration is increased by transiently venting bottles to room
air after they have been inoculated with blood (7) Bottles that are not vented remain
anaerobic
After inoculation the bottles are incubated for seven days usually and are
periodically visually examined for macroscopic evidence of growth (7 57) Evidence of
growth includes haemolysis turbidity gas production ldquochocolatizationrdquo of the blood
presence of visible colonies or a layer of growth on the fluid meniscus (7 57) A terminal
subculture is usually done at the end of the incubation period to confirm that there was no
growth
Although these systems are flexible and do not require the purchase of expensive
instruments they are too labourshyintensive to be practical for most laboratories that process
a large number of blood cultures (7 57)
13
Automated Blood Culture Systems
Automated blood culture detection systems have been developed to make
processing blood cultures more efficient however they are no longer widely used These
included radiometric and nonshyradiometric blood culture systems Both systems were based
on the utilization of carbohydrate substrates in the culture media and subsequent production
of carbon dioxide (CO2) by growing microshyorganisms (57)
Bottles were loaded onto the detection portion of the instrument where needles
perforate the bottle diaphragm and sample the gas contents of the headspace once or twice
daily A bottle is flagged as positive if the amount of CO2 in the bottle exceeds a threshold
value based on a growth index (7 57) This would then prompt a Gram stain and
subcultures of the bloodshybroth mixture
The BACTEC radiometric blood culture system (Becton Dickinson Microbiology
Systems) detected microbial growth by monitoring the concentration of CO2 present in the
bottle headspace (7 57)
The BACTEC nonshyradiometric blood culture systems functioned similarly to the
radiometric system except that infrared spectrophotometers were used to detect CO2 in
samples of the bottle headspace atmosphere (7) This system could hold more bottles than
the radiometric system thereby requiring shorter monitoring times (7)
The disadvantages of these instruments included the fact that the culture bottles had
to be manually manipulated gas canisters were needed for every instrument detection
needles had to be changed periodically sterilization of the needle devices occasionally
failed resulting in the false diagnoses of bacteraemia cultures were sometimes falseshy
14
positive based on the instrument and bottle throughput was relatively slow (35 ndash 60
seconds per bottle) (57)
ContinuousshyMonitoring Blood Culture Systems
Continuousshymonitoring blood culture systems were developed in response to the
limitations of the automated blood culture systems and to the changes in health care
financing including the recognition of labour costs needed to be appropriately controlled
(57)
This detection system differs from previously automated systems in a number of
ways This system continuously monitors the blood cultures electronically for microbial
growth at ten to 24 minute intervals and data are transferred to a microcomputer where
they are stored and analyzed (7 57) Computer algorithms are used to determine when
microbial growth has occurred allowing for earlier detection of microbial growth The
algorithms also minimize falseshypositive signals
Furthermore the systems have been manufactured to remove the need for manual
manipulation of bottles once they have been placed in the instrument which eliminates the
chance of crossshycontamination between bottles (7) Finally the culture bottles each accept
the recommended 10mL of blood (57)
Commercial examples of continuousshymonitoring blood culture systems include the
BacTAlert blood culture system (Organon Teknika Corp) and the BACTEC 9000 Series
blood culture system These two systems detect the production of CO2 as change in pH by
means of colorimetric measures in the former system and by a fluorescent sensor in the
latter (57) The ESP blood culture system (Difco Laboratories) detects changes in pressure
either as gases produced during early microbial growth or later microbial growth (57)
15
These systems have detected growth sooner than earliershygeneration automated and manual
systems and have been found to be comparable in terms of performance (57)
Two other commercially available systems include the Vital blood culture system
(bioMeriex Vitek Hazelwood Mo) and the Oxoid Automated Septicaemia Investigation
System (Unipath Basingstoke United Kingdom) (7)
Interpretation of Positive Blood Cultures
A blood culture is defined as a specimen of blood obtained from a single
venipuncture or IV access device (58) The blood culture remains the ldquogold standardrdquo for
the detection of bacteraemia or fungemia Therefore it is critical that the culture results are
accurately interpreted (ie as true bacteraemia or contamination) not only from the
perspective of individual patient care but also from the view of hospital epidemiology and
public health (9) The accurate identification of the microshyorganism isolated from the blood
culture could suggest a definitive diagnosis for a patientrsquos illness could provide a microshy
organism for susceptibility testing and enable the targeting of appropriate therapy against
the specific microshyorganism (9 17 57)
Different approaches have been proposed to differentiate between contamination
and bacteraemia This has included the identity of the organism the proportion of blood
culture sets positive as a function of the number of sets obtained the number of positive
bottles within a set the volume of blood collected and the time it takes for growth to be
detected in the laboratory (9 17 59)
Identity of the MicroshyOrganism
The identity of the microshyorganism isolated from a blood culture provides some
predictive value to the clinical importance of a positive blood culture The determination of
16
whether a positive blood culture result represents a BSI is typically not difficult with
known pathogenic organisms that always or nearly always (gt90) represent true infection
such as S aureus E coli and other members of the Enterobacteriacae P aeruginosa S
pneumoniae and Candida albicans (7) However it is considerably more difficult to
determine the clinical importance of organisms that rarely (lt5) represent true bacteraemia
but rather may be contaminants or pseudoshybacteraemia such as Corynebacterium species
Bacillus sp and Proprionibacterium acnes (7) Viridians group streptococci and
coagulaseshynegative staphylococci (CoNS) have been particularly problematic as they
represent true bacteraemia between 38 to 50 and 15 to 18 of the time respectively (7
9 59)
The viridans streptococci is a heterogeneous group of low virulence alphashy
haemolytic streptococci found in the upper respiratory tract that plays a role in resistance to
colonization by other bacterial species such as staphylococci (60 61) Despite viridans
streptococci becoming increasingly important pathogens among immuneshycompromised
patients few studies have examined the significance of blood culture isolates in immuneshy
competent patients (60 61)
Due to its complexity studies have used varying definitions to classify viridans
streptococci harbouring blood as a true infection or a contaminant (60 61) Recently
however changes to the National Healthcare Safety Network (NHSN previously the
National Nosocomial Infections Surveillance System [NNIS]) criteria have included
viridans streptococci as a common skin contaminant in their laboratoryshyconfirmed
bloodstream infection definition (38 62)
17
Coagulaseshynegative staphylococci are most often contaminants but they have
become increasingly important clinically as the etiologic agents of central vascular catheter
(CVC)shyassociated bacteraemia and bacteraemia in patients with vascular devices and other
prostheses (17 59) Coagulaseshynegative staphylococci have been reported to account for
38 of cathetershyassociated bacteraemia (9 17 59) However CoNS are also common skin
contaminants that frequently contaminate blood cultures (9) In fact CoNS are the most
common blood culture contaminants typically representing 70shy80 of all contaminant
blood cultures (9) Therefore the interpretation of culture results from patients with these
devices in place is particularly challenging because while they are at higher risk for
bacteraemia such results may also indicate culture contamination or colonization of the
centralshyvascular line (9) As a result it becomes difficult to judge the clinical significance
of a CoNS isolate solely on the basis of its identity (59)
A blood culture cohort study investigating issues related to the isolation of CoNS
and other skin microshyflora was reported by Souvenir et al to determine the incidence of
significant CoNS bacteraemia vs pseudoshybacteraemia (ie contaminants) (63) They found
that 73 of cultures positive for CoNS were due to contamination (63) Similarly
Beekmann et al identified that 78 of episodes of positive blood cultures with CoNS were
contaminants (64) Another study found that CoNS grew from 38 of all positive blood
cultures but only 10 of CoNS represented true bloodstream infection among admitted
patients (65)
Number of Blood Culture Sets
A blood culture set consists of two blood culture bottles one 10mL aerobic and one
10mL anaerobic bottle for a total maximum draw of 20mL of blood (58) The number of
18
blood culture sets that grow microshyorganisms especially when measured as a function of
the total number obtained has proved to be a useful aid in interpreting the clinical
significance of positive blood cultures (55 58 59 66)
For adult patients the standard practice is to obtain two or three blood cultures per
episode (7 59) In two studies using manual blood culture methods (ie conventional nonshy
automated) 80 to 91 of the episodes of bacteraemia or fungemia were detected by the
first blood culture while gt99 were detected by the first two blood cultures (17)
More recently Weinstein et al assessed the value of the third blood culture
obtained in a series from 218 patients who had three blood cultures obtained within 24
hours using an automated continuousshymonitoring blood culture system (17) They
concluded that virtually all clinically important BSIs would be detected with two blood
cultures and that when only the third blood culture in sequence was positive there was a
high probability that the positive result represented contamination (17)
A study in 2004 from the Mayo Clinic using an automated continuousshy monitoring
blood culture system found that two blood cultures only detected 80 of BSIs that three
detected 96 of BSIs and that four were required to detect 100 of BSIs (67) This study
used nurse abstractors to ascertain whether physicians caring for patients judged that the
blood culture isolates represented true bacteraemia or contamination whereas these
decisions were made by infectious diseases physicians in the studies by Weinstein et al
(55 66 67) The authors suspected that infectious diseases physicians were more likely to
make moreshyrigorous judgements about microbial causal relations than physicians without
training and expertise in infectious diseases (68)
19
To assess the applicability of this former study Lee et al reviewed blood cultures at
two geographically unrelated university medical centers to determine the cumulative
sensitivity of blood cultures obtained sequentially during a 24 hour period (58) They
discovered that among monoshymicrobial episodes with three or more blood cultures obtained
during the 24 hour period only 73 were detected with the first blood culture 90 were
detected with the first two blood cultures 98 were detected with the first three blood
cultures and gt99 were detected with the first four blood cultures (58) Based on these
and the results by Cockerill et al they speculated that the reason for the decrease in the
cumulative yield in consecutive cultures in the current era may be that lower levels of
bacteraemia are being detected by modern systems (58) As a result detecting low level
bacteraemia or fungemia may require a greater volume of blood ie more blood cultures
Another proposed explanation was that many more patients were on effective antibiotic
therapy at the time at which blood cultures were obtained and that more blood cultures may
be required because these agents impaired microbial growth (58)
However the authors of this study purposely underestimated the sensitivity of the
blood culture system Thus if a patient had two blood cultures obtained at 8 am and two
more blood cultures obtained at 4 pm on the same day and only the 4 pm blood cultures
were positive the first positive blood culture for that 24shyhour period would be coded as
culture number three (58) It was possible that the patient was not bacteraemic at the time
of the first two blood cultures which underestimated the sensitivity of the system
Although the studies by Cockerill et al and Lee et al indicated that three or more
blood culture sets needed to be obtained to differentiate between contamination and
bacteraemia it still emphasized the need for more than one blood culture set This is
20
because the significance of a single positive result may be difficult to interpret when the
microshyorganism isolated may potentially represent a pseudoshybacteraemia As noted
previously the isolation of CoNS in a single blood culture most likely represents
contamination but may represent clinically important infection in immuneshysuppressed
patients with longshyterm IV access devices prosthetic heart valves or joint prosthesis thus
requiring further blood culture sets for a diagnosis of true bacteraemia (17 57)
Volume of Blood Required for Culture
Culturing adequate volumes of blood improves microbial recovery for both adult
and paediatric patients (7) This is because the number of microshyorganism present in blood
in adults is small usually fewer than 10 colony forming units (CFU)millilitre(mL) with a
minimum of one CFUmL (7 17 57) For adults each additional millilitre of blood
cultured increases microbial recovery by up to three percent (7) However the
recommended volume of blood per culture set for an adult is 10shy30mL and the preferred
volume is 20shy30mL Blood volumes of gt30mL does not enhance the diagnostic yield and
contribute to nosocomial anaemia in patients (57) Moreover blood may clot in the syringe
thereby making it impossible to inoculate the blood into the culture bottles (17 57)
Time to Growth (Time to Positivity)
The amount of time required for the organism to grow in the culture medium is
another factor in determining clinically significant isolates from contaminants (9 59) It has
been suggested that perhaps the blood from a bacteraemia patient will have much higher
inoculums of bacteria than a contaminated culture Consequently larger inoculums will
grow faster than smaller inoculums which have been verified in prior studies of CVCshy
associated BSIs (9 59)
21
Bates et al found that the time to growth was a useful variable in a multivariate
algorithm for predicting true bacteraemia from a positive culture result although it did not
perform as well as either the identification of the organisms or the presence of multiple
positive cultures (69) In contrast Souvenir et al found no significant difference between
the contaminant CoNS and true bacteraemia in the time to detection of the positive culture
(63) The degree of overlap in the detection times of true pathogens versus contaminants is
great such that some experts have recommended that this technological variable should not
be relied upon to distinguish contaminants from pathogens in blood cultures (9 59)
Moreover with the use of continuouslyshymonitoring blood culture systems and the decrease
in time to detection of growth there has been a narrowing in the time difference between
the detection of true pathogens and contaminants (59)
Limitations of Blood Cultures
Although blood cultures currently represent the ldquogold standardrdquo for diagnosing
bacteraemia or fungemia and differentiating between contamination and bloodstream
infection they nonetheless continue to have limitations
The time to obtain results depends on the time required for a particular bacterium to
multiply and attain a significant number of organisms which is species dependent
Therefore positive results require hours to days of incubation (57 70 71)
No one culture medium or system in use has been shown to be best suited to the
detection of all potential bloodstream pathogens Some microshyorganisms grow poorly or
not at all in conventional blood culture media and systems For example fastidious
organisms which require complex nutritional requirements for growth may not grow (70
22
71) Furthermore it lacks sensitivity when an antibiotic has been given before blood
withdrawal often despite resinshycontaining culture fluids (70 71)
Although continuousshymonitoring blood culture systems have been an improvement
from earlier systems there are many facets of blood cultures that continue to cause
problems in the interpretation of results such as volume of blood and the number of blood
cultures (70) In response to the limitations of blood culture systems researchers have
begun the investigation of molecular methods for the detection of clinically significant
pathogens in the blood (57 70 71) The aim of these systems is to identify pathogenic
microshyorganisms within minutes to hours (70) Whether cultureshybased systems will remain
the diagnostic methods of choice or will be replaced by molecular techniques or other
methods remains to be determined
Surveillance
History of Surveillance
The modern concept of surveillance has been shaped by an evolution in the way
health information has been gathered and used to guide public health practice Beginning in
the late 1600s von Leibnitz called for the analysis of mortality reports as a measure of the
health of populations and for health planning Concurrently John Graunt published Natural
and Political Observations Made upon the Bills of Mortality which defined diseaseshy
specific death counts and rates (72) In the 1800s Chadwick demonstrated the relationship
between poverty environmental conditions and disease and was followed by Shattuck who
in a report from the Massachusetts Sanitary Commission related death rates infant and
maternal mortality and communicable diseases to living conditions (72)
23
In the next century Achenwall introduced the term ldquostatisticsrdquo in referring to
surveillance data However it was not until 1839 to 1879 that William Farr as
superintendent of the statistical department of the Registrarrsquos Office of England and Wales
collected analyzed and disseminated to authorities and the public health data from vital
statistics for England and Wales (72 73) Farr combined data analysis and interpretation
with dissemination to policy makers and the public moving beyond the role of an archivist
to that of a public health advocate (72)
In the late 1800s and early 1900s health authorities in multiple countries began to
require that physicians report specific communicable diseases (eg smallpox tuberculosis
cholera plague yellow fever) to enable local prevention and control activities (72)
Eventually local reporting systems expanded into national systems for tracking certain
endemic and epidemic infectious diseases and the term ldquosurveillancerdquo evolved to describe
a populationshywide approach to monitoring health and disease (72)
In the 1960s the usefulness of outreach to physicians and laboratories by public
health officials to identify cases of disease and solicit reports was demonstrated by
poliomyelitis surveillance during the implementation of a national poliomyelitis
immunization program in the United States It was determined that cases of vaccineshy
associated poliomyelitis were limited to recipients of vaccine from one manufacturer
which enabled a targeted vaccine recall and continuation of the immunization program
(72) In 1963 Dr Alexander Langmuir formulated the modern concept of surveillance in
public health emphasizing a role in describing the health of populations (72) He defined
disease surveillance as the
24
ldquocontinued watchfulness over the distribution and trends of incidence through the systematic collection consolidation evaluation of morbidity and mortality reports and other relevant data and regular dissemination of data to all who need to knowrdquo(74)
In 1968 the 21st World Health Assembly established that surveillance was an
essential function of public health practice and identified the main features of surveillance
1) the systematic collection of pertinent data 2) the orderly consolidation and evaluation of
these data and 3) the prompt dissemination of the results to those who need to know
particularly those who are in a position to take action (75) Consequently the World Health
Organization (WHO) broadened the concept of surveillance to include a full range of public
health problems beyond communicable diseases As a result this lead to an expansion in
methods used to conduct surveillance including health surveys disease registries networks
of ldquosentinelrdquo physicians and use of health databases (72)
In 1988 the Institute of Medicine in the United States defined three essential
functions of public health 1) assessment of the health of communities 2) policy
development based on a ldquocommunity diagnosisrdquo 3) assurance that necessary services are
provided each of which depends on or can be informed by surveillance (72)
In 1986 the Centers for Disease Control and Prevention (CDC) defined
epidemiological surveillance as the
ldquoongoing systematic collection analysis and interpretation of health data essential to planning implementation and evaluation of public health practice closely integrated with the timely dissemination of these data to those who need to know The final link in the surveillance chain is the application of these data to prevention and controlrdquo (76)
25
Today surveillance is similarly defined as the ongoing systematic collection
analysis interpretation and dissemination of data about a healthshyrelated event for use in
public health action to reduce morbidity and mortality and to improve health (77 78)
Surveillance systems are important to measure and monitor the burden of an infection or
disease evaluate risk factors for acquiring infections monitor temporal trends in
occurrence and antimicrobial resistance and to identify emerging and reshyemerging
infections with changing severity (50 72 78 79) Furthermore surveillance facilitates and
guides the planning implementation and evaluation of programs to prevent and control
infections evaluation of public policy detection of changes in health practices and the
effects of these changes on infection incidence and provides a basis for epidemiologic
research (78)
Elements of a Surveillance System
Surveillance systems require an operational definition of the disease or condition
under surveillance Defining a case is fundamental and requires an assessment of the
objectives and logistics of a surveillance system Evidence of disease from diagnostic tests
may be important as well as their availability how they are used and the ability to interpret
the results Appropriate definitions vary widely based on different settings information
needs methods of reporting or data collection staff training and resources Surveillance
case definitions should both inform and reflect clinical practice However this objective
may be difficult to achieve when surveillance definitions are less inclusive than the more
intuitive criteria that clinicians often apply in diagnosing individual patients or when
surveillance accesses an information source with limited detail This challenge often arises
when monitoring diseases at a populationshylevel since there is a need for simplicity in order
26
to facilitate widespread use Additionally confusion may arise when definitions established
for surveillance are used for purposes beyond their original intent (72)
All surveillance systems target specific populations which may range from people
at specific institutions to residents of local regional or national jurisdictions to people
living in multiple nations Some surveillance programs seek to identify all occurrences or a
representative sample of specific health events within the population of a defined
geographic area (populationshybased systems) In other situations target sites may be selected
for conducting surveillance based on an a priori assessment of their representativeness a
willingness of people at the sites to participate and the feasibility of incorporating them
into a surveillance network Populationshybased surveillance systems may include notifiable
disease reporting systems the use of vital statistics surveys from a representative sample
or groups of nonshyrandom selected sites (72)
Surveillance systems encompass not only data collection but also analysis and
dissemination Information that is collected by the organization must be returned to those
who need it A surveillance loop begins with the recognition of a health event notification
of a health agency analysis and interpretation of the aggregated data and dissemination of
results The cycle of information flow in surveillance may depend on manual or
technologically advanced methods including the Internet (72)
Personal identifying information is necessary to identify duplicate reports obtain
followshyup information when necessary provide services to individuals to use surveillance
as the basis for more detailed investigations and for the linkage of data from multiple
sources Protecting the physical security and confidentiality of surveillance records is both
an ethical responsibility and a requirement for maintaining the trust of participants (72)
27
Successful surveillance systems depend on effective collaborative relationships and
on the usefulness of the information they generate Providing information back to those
who contribute to the system is the best incentive to participation Documenting how
surveillance data are used to improve services or shape policy emphasizes to participants
the importance of their cooperation (72)
Finally assuring the ethical practice of public health surveillance requires an
ongoing effort to achieve a responsible balance among competing interests and risks and
benefits Competing interests include the desire of people to protect their privacy against
government intrusion and the responsibilities of governments to protect the health of their
constituents and to obtain the information needed to direct public health interventions
Reducing individual embarrassment or discrimination and the stigmatization among groups
requires that surveillance data be collected judiciously and managed responsibly (72)
Types of Surveillance
Surveillance can be divided into four general categories passive active sentinel
and syndromic In many instances multiple approaches or surveillance methods that
complement each other are used to meet information needs (72) Generally passive and
active surveillance systems are based on conditions that are reportable to the health
jurisdiction Sentinel systems are usually designed to obtain information that is not
generally available to health departments
Passive Surveillance
In passive surveillance persons who do not have a primary surveillance role are
relied on for identification and reporting of infections The organization or public health
department conducting the surveillance does not contact potential reporters but leaves the
28
initiative of reporting with others (72 80) For example standardized reporting forms or
cards provided by or available through the local health departments are completed by
physicians or nurses when an infection is detected and returned to the health department
(72 80)
The advantages of conducting passive surveillance are that they are generally less
costly than other reporting systems data collection is not burdensome to health officials
and the data may be used to identify trends or outbreaks if providers and laboratories report
the cases of infection (81)
Limitations inherent in passive surveillance include nonshyreporting or undershy
reporting which can affect representativeness of the data and thus lead to undetected trends
and undetected outbreaks (81) A positive case may not be reported because of a lack of
awareness of reporting requirements by healthcare providers or the perception on the part
of the healthcare providers that nothing will be done (81) Furthermore incomplete
reporting may be due to lack of interest surveillance case definitions that are unclear or
have recently changed or changes in reporting requirements (81) Patients may also refuse
to have their positive results reported Some of these limitations can be attributed to the
reportersrsquo skills and knowledge being centred on patient care rather than surveillance (80)
The most commonly used passive surveillance system is notifiable disease
reporting Under public health laws certain diseases are deemed notifiable meaning that
individual physicians laboratories or the facility (ie clinic or hospital) where the patient is
treated must report cases to public health officials (72 82) Over 50 notifiable diseases are
under Canadian national surveillance through coordination with federal provincial and
territorial governments (83)
29
Active Surveillance
Active surveillance is the process of vigorously looking for infections using trained
personnel such as infection control practitioners epidemiologists and individuals whose
primary purpose is surveillance (72 80) Such personnel are more likely to remain upshytoshy
date with changes in surveillance definitions and reporting procedures (80)
The organization or public health authority conducting the surveillance initiates
procedures to obtain reports via regular telephone calls visits to laboratories hospitals and
providers to stimulate reporting of specific infections (72 80 81) Contact with clinicians
or laboratories by those conducting the surveillance occur on a regular or episodic basis to
verify case reports (81) Furthermore medical records and other alternative sources may be
used to identify diagnoses that may not have been reported (81 82)
Serial health surveys which provide a method for monitoring behaviours associated
with infectious diseases personal attributes that affect infectious disease risk knowledge or
attitudes that influence health behaviours and the use of health services can also be
classified as a form of active surveillance These are usually very expensive if practiced
routinely However as databases become better established and sophisticated it is possible
to link them for active surveillance purposes (82)
Due to the intensive demands on resources it has been suggested that the
implementation of active surveillance be limited to brief or sequential periods of time and
for specific purposes (81) As a result it is regarded as a reasonable method of surveillance
for conditions of particular importance episodic validation of representativeness of passive
reports and as a means of enhancing completeness and timeliness of reporting and for
diseases targeted for elimination or eradication (81)
30
Active surveillance was conducted by 12 centers of the Canadian Immunization
Monitoring Program Active (IMPACT) from 2000shy2007 in children 16 years of age and
younger to determine the influence of the sevenshyvalent pneumococcal conjugate vaccine
(PCV7) immunization programs on the prevalence serotype and antibiotic resistance
patterns of invasive pneumococcal disease caused by S pneumoniae (84) All centres used
the same case finding strategies case definition and report forms
The Canadian Hospital Epidemiology Committee (CHEC) in collaboration with
Health Canada in the Canadian Nosocomial Infection Surveillance Program (CNISP) has
conducted active hospital surveillance for antimicrobialshyresistant bacteria in sentinel
hospitals across the country The CNISP has continued active surveillance for MRSA
infection and colonization however since 2007 only clinically significant isolates resulting
in infection were sent to the National Microbiology Laboratory (NML) for additional
susceptibility testing and molecular typing In 2007 hospital active surveillance continued
for vancomycinshyresistant enterococci (VRE) however only those that were newly identified
in patients (85) Also as of January 1 2007 ongoing and mandatory surveillance of
Clostridium difficileshyassociated diarrhoea (CDAD) was to be done at all hospitals
participating in CNISP (86)
Sentinel Surveillance
Sentinel surveillance involves the collection of case data from only part of the total
population (from a sample of providers) to learn something about the larger population
such as trends in infectious disease (81) It may be useful in identifying the burden of
disease for conditions that are not reportable It can also be classified as a form of active
surveillance in that active systems often seek out data for specific purposes from selected
31
targeted groups or networks that usually cover a subset of the population (82) Active
sentinel sites might be a network of individual practitioners such as primary healthcare
physicians medical clinics hospitals and health centres which cover certain populations at
risk (82)
The advantages of sentinel surveillance data are that they can be less expensive to
obtain than those gained through active surveillance of the total population (81)
Furthermore the data can be of higher quality than those collected through passive systems
(81) The pitfall of using sentinel surveillance methods is that they may not be able to
ensure the total population representativeness in the sample selected (81)
Syndromic Surveillance
The fundamental objective of syndromic surveillance is to identify illness clusters
or rare cases early before diagnoses are confirmed and reported to public health agencies
and to mobilize a rapid response thereby reducing morbidity and mortality (87) It entails
the use of near ldquorealshytimerdquo data and automated tools to detect and characterize unusual
activity for public health investigation (88 89)
It was initially developed for early detection of a largeshyscale release of a biologic
agent however current syndromic surveillance goals go beyond terrorism preparedness
(87) It aims to identify a threshold number of early symptomatic cases allowing detection
of an outbreak days earlier than would conventional reporting of confirmed cases (87)
Recommended syndromes for surveillance include hemorrhagic fever acute respiratory
syndrome acute gastrointestinal syndrome neurological syndrome and a provision for
severe infectious illnesses (88)
32
Syndromic surveillance uses both clinical and alternative data sources Clinical data
sources include emergency department (ED) or clinic total patient volume total hospital or
ICU admissions from the ED ED triage log of chief complaints ED visit outcome
ambulatoryshycare clinic outcome clinical laboratory or radiology ordering volume general
practitionersrsquo house calls and others (87 90shy92) Alternative data sources include school
absenteeism work absenteeism overshytheshycounter medication sales healthcare provider
database searches volume of internetshybased health inquiries and internetshybased illness
reporting (87 93 94)
Limitations in the use of syndromic surveillance include the fact that there is a lack
of specific definitions for syndromic surveillance As a result certain programs monitor
surrogate data sources instead of specific disease syndromes Furthermore certain wellshy
defined disease or clinical syndromes are not included in syndrome definitions (87)
Another important concern is that syndromic surveillance may generate nonshy
specific alerts which if they happen regularly would lead to lack of confidence in a
syndromeshybased surveillance system (95) However Wijingaard et al demonstrated that
using data from multiple registries in parallel could make signal detection more specific by
focusing on signals that occur concurrently in more than one data source (95)
These systems benefit from the increasing timeliness scope and diversity of healthshy
related registries (95) The use of symptoms or clinical diagnoses allows clinical syndromes
to be monitored before laboratory diagnoses but also allows disease to be detected for
which no additional diagnostics were requested or available (including activity of emerging
pathogens) (95)
33
Syndromic surveillance was used for the first time in Canada in 2002 during World
Youth Days to systematically monitor communicable diseases environmentshyrelated illness
(eg heat stroke) and bioterrorism agents Many heatshyrelated illnesses occurred and a
cluster of S aureus food poisoning was identified among 18 pilgrims (96) Syndromic
surveillance identified the outbreak and resulted in rapid investigation and control (96)
Conceptual Framework for Evaluating the Performance of a Surveillance System
The CDC describes the evaluation of public health surveillance systems involving
an assessment of the systemrsquos attributes including simplicity flexibility data quality
acceptability sensitivity positive predictive value representativeness timeliness and
stability Evidence of the systemrsquos performance must be viewed as credible in that the
evidence must be reliable valid and informative for its intended use (78) The following
attributes were adapted from the CDCrsquos guidelines for evaluating public health surveillance
systems in its application to evaluate bloodstream infection surveillance
Level of Usefulness
A surveillance system is useful if it contributes to the prevention and control of
bloodstream infections including an improved understanding of the public health
implications of BSIs An assessment of the usefulness of a surveillance system should
begin with a review of the objectives of the system and should consider the systemrsquos effect
on policy decisions and infectionshycontrol programs Furthermore the system should
satisfactorily detect infections in a timely way to permit accurate diagnosis or
identification prevention or treatment provide estimates of the magnitude of morbidity
34
and mortality related to BSIs detect trends that signal changes in the occurrence of
infection permit the assessment of the effects of prevention and control programs and
stimulate research intended to lead to prevention or control
Simplicity
The simplicity of a surveillance system refers to both its structure and ease of
operation Measures considered in evaluating simplicity of a system include amount and
type of data necessary to establish that BSIs have occurred by meeting the case definition
amount and type of other data on cases number of organizations involved in receiving case
reports level of integration with other systems method of collecting the data method of
managing the data methods for analyzing and disseminating the data and time spent on
maintaining the system
Flexibility
A flexible surveillance system can adapt to changing information needs or operating
conditions with little additional time personnel or allocated funds Flexible systems can
accommodate new BSIs and changes in case definitions or technology Flexibility is
probably best evaluated retrospectively by observing how a system has responded to a new
demand
Data Quality
Data quality reflects the completeness and validity of the data recorded in the
surveillance system The performance of the laboratory data and the case definitions for the
BSIs the clarity of the electronic surveillance data entry forms the quality of training and
supervision of persons who complete these surveillance forms and the care exercised in
data management influence it Full assessment of the completeness and validity of the
35
systemrsquos data might require a special study such as a validation study by comparing data
values recorded in the surveillance system with ldquotruerdquo values
Reliability and Validity
Psychometric validation is the process by which an instrument such as a
surveillance system is assessed for reliability and validity through a series of defined tests
on the population group for whom the surveillance system is intended (97)
Reliability refers to the reproducibility and consistency of the surveillance system
Certain parameters such as testshyretest intershyrater reliability and internal consistency must
be assessed before a surveillance system can be judged reliable (97) In quality indicator
applications poor data reliability is an additional source of random error in the data This
random error makes it more difficult to detect and interpret meaningful variation (80) Data
reliability can be increased by insisting on clear unambiguous data definitions and clear
guidelines for dealing with unusual situations (80)
Validity is an assessment of whether a surveillance system measures what it aims to
measure It should have face content concurrent criterion construct and predictive
validity (97) The validity of a new surveillance system can be established by comparing it
to a perfect measure or ldquogold standardrdquo (80) However perfect measures are seldom
available It is possible to use a less than ideal measure to establish the validity of a new
surveillance system as long as the comparison measurersquos sources of error differ from the
surveillance system being evaluated (80)
Reliability is somewhat a weaker test of a surveillance systemrsquos measurements than
validity is because a highly reliable measure may still be invalid (80) However a
surveillance system can be no more valid than it is reliable Reliability in turn affects the
36
validity of a measure Reliability studies are usually easier to conduct than validity studies
are Survey participants can be interviewed twice or medical charts can be reshyabstracted
and the results compared If multiple data collectors are to be used they can each collect
data from a common source and their results can be compared (80) Reliability studies
should uncover potential problems in the data collection procedures which can direct
training efforts and the redesign of forms and data collection instruments (80)
The use of the kappa statistic has been proposed as a standard metric for evaluating
the accuracy of classifiers and is more reflective of reliability rather than validity Kappa
can be used both with nominal as well as ordinal data and it is considered statistically
robust It takes into account results that could have been caused by chance Validity
measures that quantify the probability of a correct diagnosis in affected and unaffected
individuals do not take chance agreement between the diagnostic test results and the true
disease status into account (98) Kappa is therefore preferable to just counting the number
of misses even for those cases where all errors can be treated as being of similar
importance Furthermore in most studies where kappa is used neither observer qualifies as
a gold standard and therefore two potential sets of sensitivity and specificity measurements
are available (99)
The kappa statistic is quite simple and is widely used However a number of
authors have described seeming paradoxes associated with the effects of marginal
proportions termed prevalence and bias effects (98 99) Prevalence effects occur when the
overall proportion of positive results is substantially different from 50 This is
exemplified when two 2x2 tables have an identical proportion of agreement but the kappa
coefficient is substantially lower in one example than the other (99) One study
37
demonstrated that in the presence of prevalence effects the kappa coefficient is reduced
only when the simulation model is based on an underlying continuous variable a situation
where the kappa coefficient may not be appropriate (99) When adjusting for these effects
Hoehler et al found that there was an increased likelihood of high adjusted kappa scores in
their prevalence effects simulations (99) Another study has demonstrated that the
dependence of kappa on the true prevalence becomes negligible and that this does not
constitute a major drawback of kappa (100)
Bias effects occur when the two classifiers differ on the proportion of positive
results Results from simulation studies by Hoehler et al indicate that the bias effect tends
to reduce kappa scores (99) However it is obvious that this bias (ie the tendency for
different classifiers to generate different overall prevalence rates) by definition indicates
disagreement and is a direct consequence of the definition of kappa and its aim to adjust a
raw agreement rate with respect to the expected amount of agreement under chance
conditions (99 100) It is the aim of the kappa statistic that identical agreement rates should
be judged differently in the light of the marginal prevalence which determine the expected
amount of chance agreement (100) As such studies have suggested that the ordinary
unadjusted kappa score is an excellent measure of chanceshycorrected agreement for
categorical variables and researchers should feel free to report the total percentage of
agreements
Other problems remain in the application of kappa The first is the consequence of
summarizing either a 2x2 or a 3x3 table into one number This results in the loss of
information Secondly the kappa statistic has an arbitrary definition There have been many
attempts to improve the understanding of the kappa statistic however no clear definition as
38
a certain probability exists that facilitates its interpretation (100) As such many studies are
forced to work with the recommendation of Landis and Koch to translate kappa values to
qualitative categories like ldquopoorrdquo ldquomoderaterdquo and ldquoalmost or nearly perfectrdquo although the
cut points they proposed lack a real foundation (100)
There are several other features to consider in the validity assessment of a
surveillance system First passive systems such as those that request physicians or
laboratories to report cases as they arise (but do not have a ldquocheckrdquo or audit mechanism)
run a serious risk of undershyreporting While potentially valuable for providing measures for
trends undershyreporting rates of 50shy100 are often recognized with passive systems (101)
Second ideally all microbiology laboratories in a population should be included in
surveillance to reduce the risk for selection bias (102 103) Where this is not practical or
feasible laboratories should be selected randomly from all those providing service within
the base population All too frequently surveillance is conducted using ad hoc participating
centres with a typical over representation of universityshybased tertiary care centres (60 102)
As these centres frequently have the highest rates of resistance they may result in
overestimation of the prevalence of resistance in the target population overall (102) Third
the correct establishment of the population at risk and the population under study is
important For example studies that aim to look at populations need to ensure that nonshy
residents are strictly excluded (61) Fourth sampling bias particularly with submission of
multiple samples from a patient must be avoided as patients with antibiotic resistant
organisms are more likely to both be reshytested and have repeated positive tests over time
(104) Another practice that is potentially at risk for bias is the submission of consecutive
samples If the time period that such samples are collected is influenced by other factors
39
(such as weekends) bias may also arise Finally laboratory policies and procedures should
be consistent and in the case of multishycentred studies a centralized laboratory is preferred
Acceptability
Acceptability reflects the willingness of persons and organizations to participate in
the surveillance system and is a largely subjective attribute Some factors influencing
acceptability of a surveillance system are the public health importance of BSIs
dissemination of aggregate data back to reporting sources and interested parties
responsiveness of the system to suggestions or comments burden on time relative to
available time ease and cost of data reporting federal and provincial assurance of privacy
and confidentiality and the ability of the system to protect privacy and confidentiality
Sensitivity
Sensitivity of a surveillance system has two levels First at the level of case
reporting it refers to the proportion of cases of BSIs detected by the surveillance system
Second it can refer to the ability to detect outbreaks and monitor changes in the number of
cases over time The measurement of sensitivity is affected by factors such as the likelihood
that the BSIs are occurring in the population under surveillance whether cases of BSIs are
under medical care receive laboratory testing or are coming to the attention of the
healthcare institutions whether BSIs will be diagnosed or identified reflecting the skill of
healthcare providers and the sensitivity of the case definition and whether the cases will be
reported to the system
Positive Predictive Value
Positive predictive value (PPV) is the proportion of reported cases that actually
have the BSIs under surveillance and the primary emphasis is on the confirmation of cases
40
reported through the surveillance system The PPV reflects the sensitivity and specificity of
the case definition and the prevalence of BSIs in the population under surveillance It is
important because a low value means that nonshycases may be investigated and outbreaks
may be identified that are not true but are instead artefacts of the surveillance system
Representativeness
A surveillance system that is representative describes the occurrence of BSIs over
time and its distribution in the population by place and person It is assessed by comparing
the characteristics of reported events to all actual events However since this latter
information is not generally known judgment of representativeness is based on knowledge
of characteristics of the population clinical course of the BSIs prevailing medical
practices and multiple sources of data The choice of an appropriate denominator for the
rate calculation should be carefully considered to ensure an accurate representation of BSIs
over time and by place and person The numerators and denominators must be comparable
across categories and the source for the denominator should be consistent over time when
measuring trends in rates
Timeliness
Timeliness reflects the speed between steps in the surveillance system Factors
affecting the time involved can include the patientrsquos recognition of symptoms the patientrsquos
acquisition of medical care the attending physicianrsquos diagnosis or submission of a
laboratory test and the laboratory reporting test results back to the surveillance system
Another aspect of timeliness is the time required for the identification of trends outbreaks
or the effects of control and prevention measures
41
Stability
Stability refers to the reliability (ie the ability to collect manage and provide data
properly without failure) and availability (the ability to be operational when it is needed) of
the surveillance system A stable performance is crucial to the viability of the surveillance
system Unreliable and unavailable surveillance systems can delay or prevent necessary
public health action
Surveillance Systems for Bacterial Diseases
Canadian Surveillance Systems
A number of systems exist in Canada for bacterial disease surveillance The Public
Health Agency of Canada (PHAC) collects routine passive surveillance data However
this is restricted to reportable diseases and thus may miss important nonshyreportable diseases
or unsuspected emerging infections
The Toronto Invasive Bacterial Diseases Network (TIBDN) collaborative network
of all hospitals microbiology laboratories physicians infection control practitioners and
public health units from the Metropolitan TorontoPeel region (population approximately 4
million) conduct populationshybased surveillance for invasive bacterial diseases (105)
The Calgary Streptococcus pneumoniae Epidemiology Research (CASPER)
conducts prospective populationshybased surveillance unique clinical observations and
clinical trials related to S pneumoniae infections in the Calgary Health Region and shares
many design features in common with the Centersrsquo for Disease Control and Prevention
(CDC) Active Bacterial Core (ABCs) Surveillance program (106)
The Canadian Bacterial Surveillance Network (CBSN) aims to monitor the
prevalence mechanisms and epidemiology of antibiotic resistance in Canada Each year
42
voluntary participant labs from across Canada submit isolates to the centralized study
laboratory to assess resistance trends in a number of common pathogenic bacteria (107)
However while participating centres represent a mix of laboratories providing varying
levels of hospital and community services they are not selected randomly and are therefore
subject to selection bias Furthermore duplicates from a given patient are excluded but the
range of isolates and the number of each isolate is prescribed by the coordinating centre
such that the CBSN cannot assess the occurrence of disease
The Canadian Integrated Program of Antimicrobial Resistance Surveillance
(CIPARS) monitors trends in antimicrobial use and antimicrobial resistance in selected
bacterial organisms from human animal and food sources across Canada This national
active surveillance project includes three main laboratories all employing the same
standardized susceptibility testing methodology (108) Laboratories within each province
forward all human isolates of Salmonella and its varying strains Additionally CIPARS
carries out analysis of drug sales in pharmacies across the country to look for trends in
antibiotic consumption
Other systems exist in Canada to look more specifically at hospitalshyassociated or
nosocomial infections Most notably the CNISP aims to describe the epidemiology of
selected nosocomial pathogens and syndromes or foci At present 49 sentinel hospitals
from nine provinces participate (96) While some areas are ongoing such as collection of
data on MRSA others are smaller often single projects within the system (109 110) The
CNISP also conducts active prospective surveillance in a network of Canadian hospitals of
all ICU patients who have at least one CVC The surveillance program began in January
2006 and uses NHSN CVCshyBSI definitions
43
The Canadian Ward Surveillance Studyrsquos (CANWARD) purpose is to assess the
prevalence of pathogens including the resistance genotypes of MRSA VRE and extendedshy
spectrum betashylactamase (ESBL) isolates causing infections in Canadian hospitals as well
as their antimicrobial resistance patterns (111) It is the first ongoing national prospective
surveillance study assessing antimicrobial resistance in Canadian hospitals In 2008 it
involved ten medical centers in seven provinces in Canada Each medical center collected
clinically significant bacterial isolates from blood respiratory wound and urinary
specimens (111) Some limitations of this study include the fact that they could not be
certain that all clinical specimens represent active infection Furthermore they did not have
admission data for each patient or clinical specimen and thus were not able to provide
completely accurate descriptions of community versus nosocomial onset of infection
Finally they assessed resistance in tertiary care medical centers across Canada and thus
may depict inflated rates compared to smaller community practice hospitals (111)
Other Surveillance Systems
There are a substantial number of local national and international systems
worldwide monitoring and evaluating infections However there are some key systems that
merit introduction
A widely regarded ldquogold standardrdquo bacterial surveillance system is the CDC
Division of Bacterial and Mycotic Diseases ABCs program The ABCs program determines
the burden and epidemiologic characteristics of communityshyacquired invasive bacterial
infections due to a number of selected bacterial pathogens [Streptococcus pyogenes (group
A streptococcus) Streptococcus agalactiae (group B streptococcus) S pneumoniae
Haemophilus influenzae Neisseria meningitidis and MRSA] in several large populations
44
in the United States (total population approximately 41 million) (112 113) Surveillance is
active and all laboratories in the populations under surveillance participate such that
sampling bias is minimized Only cases in residents of the base population are included
only first isolates are included per episode of clinical disease and samples are referred to a
central laboratory for confirmation The limitations of the system is that only a few
pathogens are studied a large budget is required for infrastructural support and even with
audits of participating labs case ascertainment is estimated only at approximately 85shy90
(113)
The SENTRY program was established in January 1997 to measure the
predominant pathogens and antimicrobial resistance patterns of nosocomial and
communityshyacquired infections over a broad network of sentinel hospitals in the United
States (30 sites) Canada (8 sites) South America (10 sites) and Europe (24 sites) (114)
The monitored infections included bacteraemia and fungemia outpatient respiratory
infections due to fastidious organisms pneumonia wound infections and urinary tract
infections in hospitalized patients Although comprehensive in nature by assessing
international patterns some limitations include the fact that they could not be certain that
all clinical specimens represent active infection Furthermore each site judged isolates as
clinically significant by their local criteria which make comparability of these isolates
difficult Finally the use of different sentinel laboratories suggests variability in techniques
used to identify isolates despite having a centralized laboratory to observe susceptibility
data (114)
While the ABCs and the SENTRY systems looks at all infections under
investigation whether they are community or hospital acquired other systems have been
45
developed to specifically look at hospital acquired infections The NNIS system was
developed by the CDC in the early 1970s to monitor the incidence of nosocomial infections
and their associated risk factors and pathogens (115) It is a voluntary system including
more than 300 nonshyrandomly selected acute hospitals across the United States Trained
infection control professionals using standardized and validated protocols that target
inpatients at high risk of infection and are reported routinely to the CDC at which they are
aggregated into a national database collect surveillance data uniformly (116 117)
Infection control professionals in the NNIS system collect data for selected surveillance
components such as adult and paediatric intensive care units high risk nursery and surgical
patients using standard CDC definitions that include both clinical and laboratory criteria
(117) The major goal of the NNIS is to use surveillance data to develop and evaluate
strategies to prevent and control nosocomial infections (115)
Surveillance Methodologies
HospitalshyBased Surveillance Methodology
The landmark Study on the Efficacy of Nosocomial Infection Control (SENIC)
which was conducted by the CDC in the midshy1970s identified the link between infection
surveillance and control programs (ISCPs) and the reduction of nosocomial infections in
acute care facilities The SENIC demonstrated that effective ISCPs were associated with a
32 reduction in nosocomial infections (117) Early in their design they devised a new
method for measuring the rate of nosocomial infections in individual study hospitals the
retrospective review of medical records by nonshyphysicians following a standardized
procedure This was termed the retrospective chart review (RCR) (118 119) Prior to its
46
use researchers sought to evaluate its accuracy and at the same time to refine the data
collection diagnosis and quality control methods
To measure the accuracy of RCR a team of trained surveillance personnel (a
physician epidemiologist and four to seven nurses) determined prospectively the ldquotruerdquo
numbers of infected and uninfected patients in each hospital by monitoring daily all
patients admitted during a specified time period Several weeks later when all clinical and
laboratory data had been recorded in the patientsrsquo medical records a separate team of chart
reviewers (public health professionals) were to determine retrospectively the numbers of
infected and uninfected patients by analyzing those records (119)
The sensitivity of RCR as applied by the chart reviewers averaged 74 in the four
pilot study hospitals with no statistically significant variation among hospitals The
specificity of RCR which averaged 96 ranged from 95 to 99 among the four
hospitals The reliability of RCR for individual chart reviewers ie the probability that two
reviewers will agree whether nosocomial infection was present in a given medical record
averaged at 094 among the four hospitals (119)
Haley et al reported on several factors that required consideration as a result of the
study For example when health professionals other than physicians are employed to
render diagnoses for surveillance the levels of accuracy reported cannot be expected
without adherence to similar stringent measures employed during the study These
measures include limiting the number of conditions studied providing written algorithms
and chart review procedures training and certifying chart reviewers and maintaining
quality control monitoring and feedback (119) Furthermore the results of RCR are
available only after patients have been discharged and collated which may not provide
47
information on trends soon enough to allow effective intervention Finally the costs of
RCR in individual hospitals might not compare favourably with certain prospective
approaches especially those that selectively monitor high risk patients (119)
Mulholland et al raised the possibility that implementation of an infection control
program might in addition to changing patient care increase physiciansrsquo and nursesrsquo
awareness of nosocomial infection and thereby cause them to record in patientsrsquo medical
record more information pertinent to diagnosing infection than they otherwise would (120)
If this was true chart reviewers attempting to diagnose nosocomial infection by the SENIC
technique of RCR might be able to detect infections more accurately in hospitals with an
ISCP than in those without
In response Haley et al performed a prospective intervention study to determine
whether there was an effect of ISCP on charting and RCR accuracy (118) They were
unable to demonstrate consistent statistically significant changes in the frequency of
recorded data information relevant to the diagnosis of nosocomial infection or in the
sensitivity or specificity of RCR (118) These studies provided the scientific foundation for
supporting the introduction of infection control programs and their effectiveness in
reducing nosocomial infections
Traditionally high quality surveillance systems have been similar to ABCs type for
the population level and perform best for community acquired diseases and NNIS type for
hospital based infection control However these are cumbersome and expensive Large
surveillance systems using traditional methodology (manual case identification and caseshy
byshycase clinical record review) similar to the SENIC project and as used in hospitalshybased
infection prevention and control programs have had significant difficulty in either being
48
developed or maintained as a result of its labourshyintensive nature As a result existing
programs have tended to become highly focused (121 122) The ABCs system only looks
at a few organisms provides no information about many medically important invasive
diseases (ie E coli that is the most common cause of invasive communityshyacquired
bacteraemia) and may miss emergence Similarly hospital based infection prevention and
control programs rely on manual collection of laboratory clinical and pharmacy data and
then apply a series of caseshydefinitions in order to define cases While generally often
viewed as a gold standard the application of preshyspecified criteria such as the CDCrsquos NNIS
criteria is susceptible to clinical judgment and intrashyobserver inconsistencies are well
documented (121 123 124)
Routine surveillance requires a major investment in time by experienced
practitioners and is challenging in an entire hospital population particularly in the setting
of major outbreaks where resources must be directed towards control efforts Furthermore
due to the demand on human resources routine surveillance has not been able to be
routinely performed outside acute care institutions Jarvis et al has described the change in
healthcare systems and the challenges of expanding infection prevention and control into
facilities outside the acute care centre (124)
Electronic Surveillance
Automated or electronic surveillance of infectious diseases is the process of
obtaining information from intershyrelated electronic databases for identifying infection
distributions within a particular setting (4) With increasing use and availability of
electronic patient data within healthcare institutions and in community settings the
potential for automated surveillance has been increasingly realized (4)
49
Administrative and laboratoryshybased data may be linked for streamlined data
collection on patient admission demographic and diagnostic information as well as
microbiologic detail species distribution and resistance rates An advantage of electronic
surveillance is that once the system is implemented the size and comprehensiveness of
surveillance is potentially independent of cost (5) In addition by eliminating the need for
review of paper reports and manual data entry case ascertainment and data accuracy may
be improved with electronic based systems
The major potential drawback to electronic data is that it is typically used for patient
care and administrative purposes and unless it is collected with a specific infection
definition in mind important elements may be missing leading to the misclassification of
patients and infections For example defining the presence of a true infection versus
colonization or contamination and its presumed location of acquisition (community
healthcareshyassociated communityshyonset or nosocomial) usually requires integration of
clinical laboratory and treatment information with a final adjudication that often requires
application of clinical judgment This may be difficult based on preshyexisting electronic
records alone
Validity of Existing Electronic Surveillance Systems
A systematic methodological search was conducted to identify published literature
comparing the use of routine electronic or automated surveillance systems with
conventional surveillance systems for infectious diseases (5) Both electronic and manual
searches were used the latter by scanning bibliographies of all evaluated articles and the
authorrsquos files for relevant electronic articles published from 1980 January 01 to 2007
September 30
50
Electronic surveillance was defined by the use of existing routine electronic
databases These databases were not limited to those for hospital administrative purposes
microbiology laboratory results pharmacy orders and prescribed antibiotics Traditional
surveillance systems were broadly defined as those that relied on individual caseshyfinding
through notifications andor review of clinical records by healthcare professionals These
could either be prospective or retrospective or be in any adult or paediatric populations in
primary secondary or tertiary healthcare settings Furthermore for inclusion one or more
of the following validity measures had to be reported or calculable from the data contained
in the report specificity sensitivity positive predictive value (PPV) and negative
predictive value (NPV) (5)
Twentyshyfour articles fulfilled the predetermined inclusion criteria Most (21 87)
of the included studies focused on nosocomial infections including surgical site infections
CVCshyrelated infections postpartum infections bloodstream infections pneumonia and
urinary tract infections Nosocomial outbreaks or clusters rather than individual cases
were investigated in two studies Only three articles validated automated systems that
identified communityshyacquired infections Of the 24 articles eight used laboratory eight
administrative and eight used combined laboratory and administrative data in the electronic
surveillance method
Six studies used laboratory data alone in an electronic surveillance method to detect
nosocomial infections Overall there was very good sensitivity (range 63shy91) and
excellent specificity (range 87 to gt99) for electronic compared with conventional
surveillance Administrative data including discharge coding (International Classification
of Diseases 9th edn Clinical Modification ICDshy9shyCM) pharmacy and claims databases
51
were utilized alone in seven reports These systems overall had very good sensitivity
(range 59shy95 N=5) and excellent specificity (range 95 to gt99 N=5) in detecting
nosocomial infections Six studies combined both laboratory and administrative data in a
range of infections and had higher sensitivity (range 71shy94 N=4) but lower specificity
(range 47 to gt99 N=5) than with use of either alone Only three studies looked at
unrelated communityshyonset infections with variable results Based on the reported results
electronic surveillance overall had moderate to high accuracy to detect nosocomial
infections
An additional search was conducted by JL to identify similarly published literature
evaluating electronic surveillance systems up until 2010 June 01 Only one study published
in 2008 was found that met similar criteria outlined above
Woeltje et al evaluated an automated surveillance system using existing laboratory
pharmacy and clinical electronic data to identify patients with nosocomial centralshyline
associated BSI and compared results with infection control professionalsrsquo reviews of
medical records (125) They evaluated combinations of dichotomous rules and found that
the best algorithm included identifying centralshyline use based on automated electronic
nursing documentation the isolation of nonshycommon skin commensals and the isolation of
repeat nonshycommon skin commensals within a five day period This resulted in a high
negative predictive value (992) and moderate specificity (68) (125)
Use of Secondary Data
Secondary data are data generated for a purpose different from the research activity
for which they were used (72) The person performing the analysis of such data often did
not participate in either the research design or data collection process and the data were not
52
collected to answer specific research questions (126) In contrast if the data set in question
was collected by the researcher for the specific purpose or analysis under consideration it
is primary data (126)
With the increasing development of technology there has been a parallel increase in
the number of automated individualshybased data sources registers databases and
information systems that may be used for epidemiological research (127 128) Secondary
data in these formats are often collected for 1) management claims administration and
planning 2) the evaluation of activities within healthcare 3) control functions 4)
surveillance or research (127)
Despite the initial reasons for data collected in secondary data sources most
researchers in epidemiology and public health will work with secondary data and many
research projects incorporate both primary and secondary data sources (126) If researchers
use secondary data they must be confident of the validity of those data and have a good
idea of its limitations (72) Additionally any study that is based on secondary data should
be designed with the same rigour as other studies such as specifying hypotheses and
estimating sample size to get valid answers (127)
Various factors affect the value of secondary data such as the completeness of the
data source in terms of the registration of individuals the accuracy and degree of
completeness of the registered data the size of the data source data accessibility
availability and cost data format and linkage of secondary data (127 128)
The completeness of registered individuals in the secondary data source is reflected
by the proportion of individuals in the target population which is correctly classified in the
53
data source Therefore it is important to determine whether the data source is populationshy
based or whether it has been through one or more selection procedures (127)
The completeness of a data source could be evaluated in three ways The first is to
compare the data source with one or more independent reference sources in which whole
or part of the target population is registered This comparison is made case by case and is
linked closely with the concept of sensitivity and positive predictive values described above
(127) The second method involves reviewing medical records which are used particularly
with hospital discharge systems (127) Finally aggregated methods could be used where
the total number of cases in the data source is compared with the total number of cases in
other sources or the expected number of cases is calculated by applying epidemiological
rates from demographically similar populations (127) The accuracy of secondary data
sources is therefore based on comparing them with independent external criteria which
can be found through medical records or based on evaluation As such no reference
standard for the evaluation of secondary data sources exists and it may be more important
to examine reproducibility and the degree of agreement with one or more reference data
sources (127)
The size of the data source involves knowing how many people and how many
variables are registered in the data source This will facilitate determining the appropriate
software for the management of large files and whether the use of the data is feasible (127
128) Special programs could be used to reduce the data set by eliminating superfluous
redundant and unreliable variables combining variables deleting selecting or sampling
records and aggregating records into summary records for statistical analysis (128)
54
Data accessibility availability and cost needs to be determined prior to the use of
secondary data as often it is not clear who owns the data and who has the right to use them
(127) Information on data confidentiality is also essential to ensure protection of
confidential data on individuals which are reported to the data source This can be
maintained by using secure servers multiple passwords for data access and using
abbreviated identifiers in researchersrsquo data (127)
The linkage of different data sources can help identify the same person in different
files Ideally the linkage should be completed using an unambiguous identification system
such as a unique personal number that is assigned at birth is unique permanent universal
and available (72 127) If these unique identifiers are not available other sources of
information may be used such as birth date name address or genetic markers However
these latter options are at greater risk of error If there are problems with the linkage the
study size may shrink which reduces precision Furthermore bias may be introduced
related to the migration in and out of the population if it is related to social conditions and
health Finally people may change their name later in life which may correlate with social
conditions including health (72)
Limitations of Secondary Data Sources
There are disadvantages in the use of secondary data sources The first major
disadvantage is inherent in its nature in that the data were not collected to answer the
researcherrsquos specific research questions and the selection and quality of methods of their
collection were not under the control of the researcher (72 126shy128)
Secondly individualshybased data sources usually consist of a series of records for
each individual containing several items of information much of which will not cover all
55
aspects of the researcherrsquos interest (126 127) For example most studies based on registers
have limited data on potential confounders therefore making it difficult to adjust for these
confounders (72) A related problem is that variables may have been defined or categorized
differently than what the researcher would have chosen (126)
Many databases particularly those used primarily for administrative functions are
not designed or maintained to maximize data quality or consistency More data are
collected than are actually used for the systemrsquos primary purpose resulting in infrequently
used data elements that are often incompletely and unreliably coded (128)
Hospital discharge databases may include admissions only to selected hospitals
such as universityshyaffiliated urban hospitals and may exclude admissions to smaller rural
based or federal hospitals (128) These exclusions may preclude using these data sources
for populationshybased studies since admissions of large groups of persons from some
communities would not be captured (128)
Advantages of Secondary Data Sources
The first major advantage of working with secondary data is in the savings of
money that is implicit in preshycollected data because someone else has already collected the
data so the researcher does not have to devote resources to this phase of the research (126shy
128) There is also a savings of time Because the data are already collected and frequently
cleaned and stored in electronic format the researcher can spend the majority of his or her
time analyzing the data (126shy128)
Secondly the use of secondary data sources is preferred among researchers whose
ideal focus is to think and test hypotheses of existing data sets rather than write grants to
56
finance the data collection process and supervising student interviewers and data entry
clerks (126 128)
Thirdly these data sources are particularly valuable for populationshybased studies
These databases provide economical and nearly ideal sources of information for studies that
require large numbers of subjects This reduces the likelihood of bias due to recall and nonshy
response (127 128)
Fourthly these databases often contain millions of personshyyears of experience that
would be impossible to collect in prospective studies (126 127) If a sample is required it
does not have to be restricted to patients of individual providers or facilities (128)
Secondary data sources can be used to select or enumerate cases The study may
still require primary data collection however preshyexisting databases can provide a sampling
frame a means for identifying cases or an estimate of the total number of cases in the
population of interest (128) This is especially helpful if interested in identifying and
measuring rare conditions and events (127 128) Related to this is the use of a sampling
frame to select a study population and collect information on exposure diseases and
sometimes confounders (127)
Finally the existing databases may be used to measure and define the magnitude
and distribution of a health problem prior to the development of a definitive study requiring
primary data collection (127)
LaboratoryshyBased Data Sources
Laboratoryshybased surveillance can be highly effective for some diseases including
bloodstream infections The use of laboratory data sources provides the ability to identify
patients seen by many different physicians acute care centres community healthcare
57
centres outpatient facilities long term care facilities and nursing homes especially when
diagnostic testing for bloodstream infections is centralized The use of a centralized
laboratory further promotes complete reporting through the use of a single set of laboratory
licensing procedures and the availability of detailed information about the results of the
diagnostic test (72)
Despite the inherent benefits of using laboratoryshybased data sources for surveillance
there are limitations in the use of blood cultures for accurate detection of bloodstream
infections and in the use of secondary automated databases both noted above
Surveillance systems that primarily employ laboratory systems for the identification
of BSIs may be subject to biases that may have a harmful effect For example if falsely low
or high rates of BSIs by pathogenic organisms are reported inadequate treatment or
excessively broadshyspectrum therapy may be prescribed with the adverse result of treatment
failure or emergence of resistance respectively (104)
In the case of BSIs and the use of a laboratory information system the type of bias
of greatest consideration in this study is selection bias The introduction of selection bias
may be a result of selective sampling or testing in routine clinical practices and commonly
by the failure to remove multiple repeated or duplicate isolates (104 129)
Sampling is usually based on bacteria isolated from samples submitted to a clinical
microbiology laboratory for routine diagnostic purposes and this can lead to bias (130)
Firstly laboratory requesting varies greatly among clinicians Secondly selective testing by
clinicians may bias estimates from routine diagnostic data as estimates from routine data
reflect susceptibilities for a population that can be readily identified by practitioners which
are often those patients where a decision to seek laboratory investigations has been taken
58
(131) This selective testing involves reduced isolate numbers and therefore underestimates
the prevalence of positive cultures overall
Furthermore the frequency of collection of specimens is affected not only by the
disease (ie infection) but also by other factors such as the age of the patient with
specimens being collected from elderly patients more often than from younger patients
(130 132 133) Therefore duplicate isolates pertaining to the same episode of infection
should be excluded from estimated measures of incidence to reduce the potential for bias
Selection bias is also identified in BSI reports from surveillance programs in the
literature based on surveys conducted in single institutions One of the limitations of these
studies is the geographic localization of the individual hospitals which may reflect a more
susceptible population to BSIs Many of these hospitals are at or are affiliated with medical
schools The reports are subject to misinterpretation of estimates because these hospitals
often treat patients who are more seriously ill or who have not responded to several
antimicrobial regimens tried at community hospitals which further selects for more serious
BSIs and highly resistant organisms (102) Such reporting can lead to the belief that BSIs
and resistance to antimicrobials is generated in large urban hospitals However the most
serious cases end up in these hospitals but the sources could be and most likely are other
hospitals clinics and private practices (102)
The inclusion of repeated infections with the same organisms yielding multiple
indistinguishable isolates and not clearly independent episodes introduces a form of
selection bias This has been documented in terms of antimicrobial resistance in that it is
believed that more specimens are submitted from patients with resistant organisms and the
inclusion of these duplicate isolates may bias estimates of resistance compared to those
59
infected with nonshyresistant pathogens (134 135) By including duplicate isolates in
bloodstream infections it would inaccurately increase the speciesshyspecific incidence of BSIs
and the overall incidence of BSIs The usual practice for addressing this selection bias is to
exclude duplicate isolates of the same organisms from the same patient or represent
multiple isolates by a single example in both the numerator and denominator in the
calculation of BSI rates (130)
There is no clear agreement on the time period to regard as the limit for an isolate to
be considered a duplicate (135 136) Studies have assessed a limit of 5 days and 7 days
after which repeat isolates are not considered duplicates (137 138) Five or seven days may
be too short a cutshyoff period for a single episode of infection or colonization as patients
may remain in hospital for long periods of time or require treatments that necessitate
readmission to hospital (136) In another comparison of cutshyoff periods of 5 30 and 365
days one study suggested that 365 days was the best interval for classifying isolates as
duplicates (135) A study conducted in the Calgary Health Region also suggested that a
oneshyyear duplicate removal interval be used for laboratoryshybased studies as they found that
reporting all isolates resulted in 12 to 17shyfold higher rate of resistance specifically
depending on the antimicrobial agent and pathogen (104)
Information bias may also be present in laboratoryshybased surveillance systems
particularly where there is misclassification of an organism isolated from blood cultures
and its susceptibility pattern to antimicrobial agents It is crucial for laboratories to provide
accurate methodologies for determining pathogens in blood cultures so that effective
therapy and infection control measures can be initiated Surveillance systems using
laboratoryshybased data need to ensure that blood culture testing systems are both sensitive
60
and specific in detecting bloodshyborne pathogens (139) Furthermore standardized
internationally accepted techniques need to be employed consistently with regular quality
assurance
Confounding bias may be introduced in epidemiological studies based on using
laboratoryshybased surveillance if coshymorbid illnesses are not captured The presence of coshy
morbid illnesses has a major influence on the occurrence and outcome of infectious
diseases While the presence or absence of a particular coshymorbidity is typically evaluated
as a risk factor for acquiring an infectious disease in observational research rating scales
that encompass a number of coshymorbidities are commonly used to adjust for effects on
outcome (140) The direction and magnitude of the confounding bias will depend on the
relative strengths of the association between the extraneous factors with that of exposure
and disease Stratification of data by these attributes known to be associated with BSIs can
control the confounding bias
61
Development of the Electronic Surveillance System in the Calgary Health Region
An electronic surveillance system (ESS) was developed in the Calgary Health
Region to monitor bloodstream infections among patients in the community in hospitals
and in various outpatient healthcare facilities The purpose of the ESS was to accurately
and consistently identify and report incident episodes of BSIs in various settings with the
goal of providing an efficient routine and complete source of data for surveillance and
research purposes Linking data from regional laboratory and hospital administrative
databases from years 2000 to 2008 developed the ESS Definitions for excluding isolates
representing contamination and duplicate episodes were developed based on a critical
review of literature on surveillance of infectious diseases (6 11 141 142) Bloodstream
infections were classified as nosocomial healthcareshyassociated communityshyonset
infections or communityshyacquired infections according to definitions described and
validated by Friedman et al (6) These definitions were applied to all patients in the CHR
with positive blood cultures However for surveillance of BSIs nonshyresidents of the CHR
were excluded
The ESS was assessed to determine whether data obtained from the ESS were in
agreement with data obtained by traditional manual medical record review A random
sample of patients with positive blood cultures in 2005 was selected from the ESS to
conduct retrospective medical record reviews for the comparison The definitions for
episodes of BSIs and the location of acquisition of the BSIs were compared between the
ESS and the medical record review Discrepancies were descriptively outlined and
definitions were revised based on a subjective assessment of the number of discrepancies
found between the ESS and the medical record review The discrepancies were discussed
62
with a panel of healthcare professionals including two physician microbiologists and an
infectious disease specialist No a priori rule for revising definitions was used The revised
definitions were reviewed in the same random sample of patients initially selected and were
not evaluated prospectively in a different sample of patients at the time
The ESS identified 323 true episodes of BSI while the medical record reviewers
identified only 310 true episodes of BSI The identification of incident episodes of BSI was
concordant between the ESS and medical record review in 302 (97) episodes (143) Of
the eight discordant episodes identified by the medical record review but not the ESS a
majority of the discrepancies were due to multiple episodes occurring in the same patient
which the ESS did not classify either because they were due to the same species as the first
episode or were classified as polyshymicrobial episodes which the reviewers listed them as
separate unique episodes (143) Of the 21 discordant episodes identified by the ESS but not
by the medical record review 17 (81) were classified as representing isolation of
contaminants by the medical record review (143) Most of these were due to isolates with
viridans streptococci (12 71) followed by CoNS (3 18) and one episode each of
Peptostreptococcus species and Lactobacillus species (143) Four patients had an additional
episode of disease caused by a different species within the year that was identified by the
ESS which reviewers classified as polyshymicrobial (143)
The overall independent assessment of location of acquisition by medical record
review was similar to that by the ESS The overall agreement was 85 (264 of 309
episodes) between the medical record review and the ESS (κ=078 standard error=004)
Discrepancies were due to missing information in the ESS on the presence of acute cancer
and attendance at the Tom Baker Cancer Centre (TBCC) (n=8) the occurrence of day
63
procedures performed in the community (n=7) and patientrsquos acute centre and other
healthcare system encounters (n=10) Further discrepancies occurred where the medical
record reviewers did not identify previous emergency room visits in the previous two to
thirty days prior to diagnosis of the BSI (n=6) previous healthcare encounters (n=4) and
timing of blood culture result or clinical information that suggested that the pathogen was
incubating prior to hospital admission (n=8) due to missing information in the medical
record Two episodes were discordant because the blood culture samples were obtained 48
hours or more after hospital admission which the medical record reviewers classified as
nosocomial but the ESS did not because these patients had multiple encounters with the
emergency department during their hospitalization (143)
Stepwise revisions were made to the original definitions in the ESS in an attempt to
improve their agreement with medical record review in a post hoc manner These revisions
included adding the viridans streptococci as a contaminant including International
Classification of Diseases Nine Revision Clinical Modification (ICDshy9shyCM) and
International Classification of Diseases Tenth Revision (ICDshy10) codes to identify patients
with active cancer and revising previous emergency department visits within the past two
to 30 days before the onset of BSI to specify visits within the past five to 30 days before
BSI These revisions resulted in an overall agreement of 87 with κ=081 (standard
error=004) (143)
The overall objective of this study was to evaluate the developed ESS definitions
for identifying episodes of BSI and the location where the BSIs were acquired compared to
traditional medical record review and to revise definitions as necessary to improve the
64
accuracy of the ESS However further validation of the developed and revised definitions
in a different patient sample is required
65
OBJECTIVES AND HYPOTHESES
Primary Objectives
To validate revised definitions of bloodstream infections classification of BSI
acquisition location and the focal body source of bloodstream infection in a previously
developed electronic surveillance system in the adult population of the Calgary Health
Region (CHR) Alberta in 2007 (143)
Secondary Objectives
a) If validated then to apply the electronic populationshybased surveillance system to
evaluate the 2007
a Overall and speciesshyspecific incidence of bloodstream infections to
determine disease occurrence
b Classification of bloodstream infections as nosocomial healthcareshy
associated communityshyonset or communityshyacquired
c Focal body source of bloodstream infections using microbiology laboratory
data
d Inshyhospital caseshyfatality associated with bloodstream infections
Research Hypotheses
b) The ESS will be highly concordant with retrospective medical record review in
identifying BSIs
c) The ESS will be highly concordant with retrospective medical record review in
identifying the location of acquisition of BSIs
d) The ESS will identify the primary or focal body source of BSIs when compared to
retrospective medical record review
66
e) S aureus and E coli will have the highest speciesshyspecific incidence rates in 2007
f) Healthcareshyassociated communityshyonset BSIs will be more common than
nosocomial or communityshyacquired BSIs
g) The demographics organism distribution and inshyhospital caseshyfatality will be
distinct between communityshyacquired healthcareshyassociated communityshyonset and
nosocomial BSIs
67
METHODOLOGY AND DATA ANALYSIS
Study Design
The main component of this project involved retrospective populationshybased
laboratory surveillance conducted at Calgary Laboratory Services (CLS) with linkage to the
Calgary Health Region (CHR) Data Warehousersquos hospital administrative databases from
the year 2007
Patient Population
Electronic Surveillance System
A cohort of all patient types were included ndash inshypatient outshypatient emergency
community nursing homelongshyterm care and outshyofshyregion patients with a positive blood
culture drawn at a site within the CHR The CHR (currently known as the Calgary Zone
Alberta Health Services since April 2009) provides virtually all acute medical and surgical
care to the residents of the cities of Calgary and Airdrie and a large surrounding area
(population 12 million) in the Province of Alberta Calgary Laboratory Services is a
regional laboratory that performs gt99 of all blood culture testing in the CHR All adult
(gt18 years of age) patients with positive blood cultures during 2007 were identified by
CLS
Comparison Study
Random numbers were assigned to episodes of BSI in the ESS using Microsoft
Accessrsquo 2003 (Microsoft Corp Redmond WA) autoshynumber generator From a list of
patients with positive blood cultures in 2007 a random sample of 307 patients were
selected from within the electronic surveillance system (ESS) cohort for detailed review
68
and validation of revised electronic surveillance definitions based on the results by Leal et
al (143)
Sample Size
This study was designed to 1) explore the validity of electronic surveillance 2)
report the incidence and associated inshyhospital caseshyfatality rate associated with
bloodstream infections (BSIs) For the first objective the sample size of 307 for the
validation cohort was chosen to be large enough to include a range of etiologic agents but
remain within the practical limitations of the investigators to conduct medical record
reviews Furthermore when the ESS was estimated to have an expected kappa statistic of
85 with both the manual chart review and the ESS having a 10 probability of
classifying the acquisition for true episodes of BSI then the estimated sample size would be
307 (absolute precision=01) The second objective was to report the natural incidence of
all BSIs in the CHR Since sampling was not performed for this objective determination of
sample size was not relevant
Development of the Electronic Surveillance System
The first step in the development of the ESS was to identify all adult patients (gt18
years of age) in the CHR who had a positive blood culture in 2007 The data on positive
blood cultures including all isolates susceptibilities basic demographic information and
the location of culture draw were obtained from Cernerrsquos PathNet Laboratory Information
System (LIS classic base level revision 162) which uses Open Virtual Memory System
(VMS) computer language Microbiologic data on isolates and susceptibilities were based
on standard Clinical amp Laboratory Standards Institute (CLSI) criteria Since 2002 PathNet
69
has been populated with hospital admission and discharge dates and times associated with
microbiologic culture results
The second step was to obtain additional clinical information from the regional
corporate data warehousersquos Oracle database system which used Structured Query
Language and Procedural LanguageStructured Query Language (SQL) by uploading the
patient list identified by the laboratory database which contained patient healthcare
numbers (PHN) and regional health record numbers (RHRN) Detailed demographic
diagnostic and hospital outcome information was obtained for any acute care encounter not
limited to hospitalshybased clinic visits Home Parenteral Therapy Program (HPTP)
registrations dialysis treatments from the Southern Alberta Therapy Program (SARP)
Emergency Department (ED) assessments or admissions to any acute care institution in the
CHR
Admission data were based on the time the bed order was made (which is timeshy
stamped in the data warehouse) and were linked to data on the location and time the culture
sample was obtained during that hospital stay Specifically hospital admission and
discharge dates in the data warehouse were matched with patient blood cultures from CLS
These were matched if CHR inshypatient admission dates were one day prior to seven days
after the CLSshybased admission date or the positive blood culture start date was within seven
days to the CHR inshypatient admission or discharge dates Where the patient had multiple
admissions within this time period the admission and discharge dates were determined by
the order location of the patient at the time the blood culture was drawn
These two databases (ie Cernerrsquos PathNet LIS and the data warehousersquos Oracle
database systems) were not linked as a relational database prior to the development of the
70
ESS but they were related to each other because they both contain PHNs and RHRNs The
linking of these two databases was based on the fact that they both contained PHNs and
RHRN that were validated by checking the patientrsquos last name and date of birth
The third step involved the application of study definitions in a stepwise fashion by
the use of queries and flags in Microsoft Access 2003 SQL Figure 41 outlines the stepwise
development of the ESS Table 41 lists and describes all the fields used in the ESS
following linkage of electronic data sources and exported from Access 2003
71
Figure 41 Computer Flow Diagram of the Development of the ESS
Access Cernerrsquos PathNet Laboratory Information System at Calgary Laboratory Services
Identify all adult patients (gt18 years) in the CHR with positive blood cultures during 2007
Upload patient list from lab database to data warehouse using Patient Healthcare Numberrsquos (PHN) and Regional
Record Number (RHRN)
Apply Structured Query Language (SQL) and Procedural LanguageStructured Query Language (PLSQL)
Collect demographic diagnostic and hospital outcome information for any acute care encounters
Linkage of laboratory data with regional corporate warehouse data based on PHNs RHRNs Validated by
patient last name and date of birth
Stepwise application of study definitions using Microsoft Access 2003 SQL queries and flags
Query 1 Identify incident cultures as first isolate per 365 days
Query 2 Classify incident isolates as true pathogens
Query 3 Classify incident isolates as Monoshymicrobial or PolyshyMicrobial episodes of BSI
Exclude repeat isolates
Exclude contaminant isolates
Query 4 Classify location of acquisition for incident episodes of BSI
72
Table 41 Description of Fields in the ESS after Linkage of Electronic Data Sources on Microsoft Access 2003
Field Name Field Descriptor Field Format PatSys
PHN
LastName FirstName MiddleName DOB Gender PtType
Client MedRecNum
RHA
CDR_Key
CHRSite
CHRSiteDesc
CHRAdmit
CHRDischarge
CHRAdmittedFrom
DischargeStatus PriorHospitalization
System Patient Identifier shy assigned by Cerner to identify unique patient Personnal (Provincial) Health Care Number or Cerner generated identifier if patient does not have health care Patients last name Patients first name Patients middle name Patients date of birth Patients gender Patient Type shy Inpatient Ambulatory (community) eMmergency Nursing Home Renal Doctor or hospital identifier ordering the test Regional health number for inshypatients or PHN for community patients For Alberta residents the RHA is a 2 character code that identifies the health region the patient lives in For outshyofshyprovince patients the RHA identifies the province they are from RHA is determined based on postal code or residence name if postal code is not available RHA is not available RHA in the table is current regional health authority boundary System generated number that is used to uniquely identify an inpatient discharge for each patient visit (the period from admit to discharge) Sitehospital identifier where patient was admitted Sitehospital description where patient was admitted Datetime patient was admitted to hospital (for inshypatients only) Datetime patient was discharged from hospital (for inshypatients only) Sitehospital identifier if patient was transferred in from another health care facility Deceased (D) or alive (null) Any hospital admission for 2 or more days in the previous 90 days 1=yes null = no
Text
Text
Text Text Text YYYYMMDD Text Text
Text Text
Text
Number
Text
Text
YYYYMMDD hhmm YYYYMMDD hhmm Text
Text Number
73
Field Name continued PriorRenal
Cancer
NursingHomeLong TermCare Accession CultureStart
Isolate ARO
GramVerf
Gram1 Gram2 Gram3 Gram4 A 5FC A AK A AMC A AMOX A AMP A AMPHOB A AMS A AZITH A AZT A BL A C A CAS A CC A CEPH A CFAZ A CFEP A CFIX A CFOX A CFUR A CIP A CLR A COL A CPOD A CTAX
Field Descriptor Field Format
Patient attended a renaldialysis clinic 1=yes Number null = no Patient receiving treatment for cancer 1=yes Number null = no Patient resides in a nursing home or long term Number care residence 1=yes null = no Blood culture identifier Text Datetime blood culture was received in the YYYYMMDD laboratory hhmm Isolate identified in blood culture Text Antibiotic resistant organism (MRSA VRE Text ESBL MBLhellip) Datetime gram stain was verified YYYYMMDD
hhmm Gram stain result Text Gram stain result Text Gram stain result Text Gram stain result Text 5 shy FLUOROCYTOSINE Text Amikacin Text AmoxicillinClavulanate Text AMOXICILLIN Text Ampicillin Text AMPHOTERICIN B Text AMOXICILLINCLAVULANATE Text AZITHROMYCIN Text AZTREONAM Text Beta Lactamase Text CHLORAMPHENICOL Text
Text CLINDAMYCIN Text CEPHALOTHIN Text CEFAZOLIN Text CEFEPIME Text CEFIXIME Text CEFOXITIN Text CEFUROXIME Text CIPROFLOXACIN Text CLARITHROMYCIN Text COLISTIN Text CEFPODOXIME Text CEFOTAXIME Text
74
Field Name Field Descriptor Field Format continued A CTAZ CEFTAZIDIME Text A CTRI CEFTRIAXONE Text A DOX DOXYCYCLINE Text A E ERYTHROMYCIN Text A FLUC FLUCONAZOLE Text A FUS FUSIDIC ACID Text A GAT GATIFLOXACIN Text A GM GENTAMICIN Text A GM5 GENTAMICIN 500 Text A IPM IMIPENEM Text A IT ITRACONAZOLE Text A KETO KETOCONAZOLE Text A LEV LEVOFLOXACIN Text A LIN LINEZOLID Text A MER MEROPENEM Text A MET METRONIDAZOLE Text A MIN MINOCYCLINE Text A MOXI MOXIFLOXACIN Text A MU MUPIROCIN Text A NA NALIDIXIC ACID Text A NF NITROFURANTOIN Text A NOR NORFLOXACIN Text A OFX OFLOXACIN Text A OX CLOXACILLIN Text A PEN PENICILLIN Text A PIP PIPERACILLIN Text A PTZ PIPERACILLINTAZOBACTAM Text A QUIN QUINUPRISTINDALFOPRISTIN Text A RIF RIFAMPIN Text A ST2000 STREPTOMYCIN 2000 Text A STREP STREPTOMYCIN Text A SXT TRIMETHOPRIMSULFAMETHOXAZOLE Text A SYN SYNERCID Text A TE TETRACYCLINE Text A TIM TICARCILLINCLAVULANATE Text A TOB TOBRAMYCIN Text A TROV TROVAFLOXACIN Text A VA VANCOMYCIN Text A VOR
75
Definitions Applied in the Electronic Surveillance System
Residents were defined by a postal code or residence listed within the 2003
boundaries of the Calgary Health Region Table 42 outlines modified regional health
authority (RHA) indicators from the data warehouse used to identify residents and nonshy
residents of the CHR in the ESS Both CHR residents and nonshyresidents were included in
the validation component of this study however only CHR residents were included in the
surveillance of BSIs to estimate the incidence of BSIs in the CHR
Table 42 Modified Regional Health Authority Indicators
Guidelines Notes RHA supplied by Calgary Health Region matched by primary key RHA matched by postal code
RHA by client type
RHA = 99 for out of province healthcare numbers RHA = 99 for third billing patient type RHA = 03 for XX patients
RHA supplied by Calgary Health Region Emergency visit file
Postal code list was made up of postal codes supplied by the Calgary Health Region and then manually identified by comparing to an Alberta Region map If client was within the Calgary Health Region or outside Healthcare number prefixes matched to CLS patient healthcare number prefix documents
Calgary Health Region uses XX for homeless patients so it was decided that homeless patients treated in the Calgary Health Region would be considered residents of the Calgary Health Region If patient identified by patient healthcare number attended an ED 3 months prior to 1 month before the blood culture date
Homeless patients treated in a regional institution and patients who were admitted
to the ED one to three months before collection of culture samples were considered to be
residents if other residency indicators were not available
76
Definitions to ascertain BSIs assign a likely location of acquisition and define the
focal source of the BSIs for use by the ESS are shown in Table 43
Table 43 Bloodstream Infection Surveillance Definitions
Characteristic Electronic Definition References Bloodstream Infection Pathogen recovered from gt1 set of blood
cultures or isolation of organisms commonly associated with contamination from gt2 sets of
(11)
Hospital Acquired (Nosocomial)
blood cultures within 5 days First culture positive gt48 hours after hospital admission or within 48 hours of discharge from hospital If transferred from another institution then the duration of admission calculated from
(6 11)
Healthcareshyassociated communityshyonset
admission time to first hospital First culture obtained lt48 hours of admission and at least one of 1) discharge from HPTP clinic within the prior 2shy30 days before bloodstream infection 2) attended a hospital clinic or ED within the prior 5shy30 days before bloodstream infection 3) admitted to Calgary Health Region acute care hospital for 2 or more days within the prior 90 days before bloodstream infection 4) sample submitted from or from patient who previously sent a sample from a nursing home or long term care facility 5) active dialysis 6) has an ICDshy10shyCA code for active acute cancers as an indicator of
(6 141 142)
those who likely attended or were admitted to the TBCC
Community Acquired First culture obtained lt48 hours of admission and not fulfilling criteria for healthcare associated
(6)
Primary Bloodstream Infection
No cultures obtained from any body site other than surveillance cultures or from intravascular
(11 28)
devices within + 48 hours Secondary Bloodstream Infection
At least one culture obtained from any body site other than surveillance cultures or from
(6 11)
intravascular devices within +48 hours diptheroids Bacillus species Proprionibacterium species coagulaseshynegative
staphylococci micrococci viridians group streptococci
77
Contamination of blood culture bottles was defined by a) the number of bottles
positive ndash if an isolate only grows in one of the bottles in a 4shybottles set it may have been
considered to be a contaminant if it was part of the normal flora found on the skin and b)
the type of isolate ndash bacteria that are common skin commensals may have been considered
contaminants if they were only received from a single bottle in a blood culture set
Coagulase negative staphylococci viridans streptococcus Bacillus sp Corynebacterium
sp and Propionibacterium acnes were considered some of the most common blood culture
contaminants
Polyshymicrobial infections were defined as the presence of more than one species
isolated concomitantly within a twoshyday period Given that BSIs may also be associated
with multiple positive blood cultures for the same organism from the same episode of
disease new episodes of BSIs were defined as isolation of the same organism as the first
episode gt365 days after the first or with a different organism as long as it was not related
to the first isolate as part of a polyshymicrobial infection This resulted in the exclusion of
duplicate isolates from the same or different blood cultures if they occurred within 365
days after the first isolate of the incident episode
Patients transferred from nonshyCHR institutions where the length of hospital stay
was unknown were considered to have nosocomial infection
A list of patients residing in nursing homes was created from Cernerrsquos PathNet LIS
by patient type ldquoNrdquo (referring to cultures drawn from nursing homelongshyterm care) with a
minimum culture date (based on any culture not restricted to blood) A business rule was
set based on the assumption that patients generally do not leave nursing homes or longshyterm
care facilities and return to the community Therefore for any blood cultures drawn after
78
the minimum culture date the patient was assumed to live in some type of nursing home or
longshyterm care facility Appendix A lists definitions of some variables obtained from the
CHR data warehouse which helped formulate the queries for determining the location of
acquisition of bloodstream infections
ICDshy10shyCA codes for active cancer used in the ESS as a proxy for identifying
patients who likely received some form of cancer therapy were based on the coding
algorithms by Quan et al (144) These were developed and validated in a set of 58805
patients with ICDshy10shyCA data in Calgary Alberta
The source of BSI was solely based on positive microbiologic culture data from
another body site other than blood Table 44 lists the focal culture guidelines used by the
ESSrsquos data analyst
79
Table 44 Focal Culture Guidelines for the ESS Algorithm
Focal Code Site Procedure Source Urinary Tract M URINE shy gt107 CFUmL urine cultures Infection M ANO2 shy kidney
M FLUID shy bladder shy nephrostomy drainage
Surgical Site M ANO2 shy Specimens related to heart bypass surgery Infection M WOUND shy Pacemaker pocket Pneumonia M BAL shy ETT
M BW shy lung biopsy or swab M PBS M SPUTUM
Bone and Joiny M ANO2 shy kneeshoulder M FLUID shy synovial
shy bursa shy joint fluid shy bone
Central Nervous M ANO2 shy cerebrospinal fluid System M FLUID shy brain dura matter Cardiovascular M ANO2 shy cardiac fluid System M FLUID shy valve tissue Ears Eyes Nose M BETA shy any source related to EENT and Throat M EYE shy mastoid
M EYECRIT shy sinus M EAR shy tooth sockets M MOUTH shy jaw
Gastrointestinal M ANO2 shy peritoneal M FLUID shy ascetic M STOOL shy JP Drain M WOUND shy Liver
shy Biliary shy Bile shy Gall Bladder
Lower M FLUID shy pleural Respiratory shy thoracentesis fluid Infection Reproductive Skin and Soft M WOUND shy ulcer Tissue M TISSUE shy burn
shy skin shy soft tissue shy surgical site other than bypass
80
Comparison of the ESS with Medical Record Review
For a random sample of hospitalized patients data on episodes of bloodstream
infection location of acquisition and focal body source of the BSIs were obtained from the
ESS to assess whether these data were in agreement with similar data obtained by
traditional medical record review All charts of this random sample of patients were
reviewed concurrently by a research assistant and an infectious diseases physician by
means of a standardized review form and directly entered into a Microsoft Access 2003
database Appendix B shows the layout of the standardized review form Table 45
describes the fields of information collected in the medical record review
81
Table 45 Description of Fields in the Medical Record Review on Microsoft Access 2003
Field Name Field Descriptor Field Format IICRPK Primary key AutoNumber Patient Patient identifier Number DOB Date of Birth DateTime Gender Male=1 Female=2 Unknown=3 Number City of Residence Text Episode New form for each episode Number Culture Number InfectContam Infection=1 Contamination=2 Number Etiology Isolate Text CultureComments Text Episode Diagnosis Date First Date DateTime Episode Diagnosis Time DateTime Polymicrobial Yes=1 No=2 Number Fever Yes=1 No=2 Number Chills Yes=1 No=2 Number
Hypotension Yes=1 No=2 Number BSIContam Comments Text Acquisition 1Nosocomial 2 Healthcareshyassociated 3 Number
Community acquired HCA_IVSpecialCare IV antibiotic therapy or specialized care at YesNo
home other than oxygen within the prior 30 days before BSI
HCA_HospHemoChemo Attended a hospital or haemodialysis clinic YesNo or IV chemotherapy within the prior 30 days before BSI
HCA_HospAdmit Admitted to hospital for 2 or more days YesNo within the prior 90 days before BSI
HCA_NH Resident of nursing home or long term care YesNo facility
AcquisitionComments Text InfectionFocality 1 Primary 2 Secondary Number UTI YesNo UTIsite CDC Definitions Text UTICultureConf YesNo SSI YesNo SSISite Text SSICultureConf YesNo SST YesNo SSTSite Text SSTCultureConf YesNo
82
Field Name continued Field Descriptor Field Format Pneu PneuSite PneuCultureConf BSI BSISite BSICultureConf BJ BJSite BJCultureConf CNS CBSSite CNSCultureConf CVS CVSSite CVSCultureConf EENT EENTSite EENTCultureConf GI GISite GICultureConf LRI LRISite LRICultureConf Repr ReprSite ReprCultureConf Sys SysSite SysCultureConf DiagnosisComments DischargeStatus CourseOutcomeCOmments AdmissionDate AdmissionTime DischargeDate DischargeTime Location Initials ReviewDate ReviewDateStart ReviewDateStop DrInitials
YesNo Text YesNo YesNo Text YesNo YesNo Text YesNo YesNo Text YesNo YesNo Text YesNo YesNo Text YesNo YesNO Text YesNo YesNo Text YesNo YesNo Text YesNo YesNo Text YesNo Text
Alive=1 Deceased=2 Text Text DateTime DateTime DateTime DateTime Text
Initials of Reviewer Text DateTime DateTime DateTime
Initials of doctor chart reviewer Text
83
Field Name continued Field Descriptor Field Format DrReviewDate DateTime
Medical records were requested at acute care sites based on patient name regional
health record number admission date and acute care site identified from the ESS The
reviewers were unaware of the ESS classification of isolates episodes of BSI location of
acquisition and focal body source of BSIs
Definitions Applied in the Medical Record Review
Residents were identified by the presence of their city of residence in the emergency
departmentrsquos or hospital admission forms identified in the medical record review
Proposed definitions to ascertain BSIs assign a likely location of acquisition and
define the focal source of the BSI for use by the reviewers are shown in Table 46
84
Table 46 Medical Record Review Definitions for Bloodstream Infection Surveillance
Characteristic Traditional Definition References Bloodstream Infection Patient has at least one sign or symptom fever
(gt38ordmC) chills or hypotension and at least one of 1) pathogen recovered from gt1 set of blood cultures 2) isolation of organisms commonly associated with contamination from gt2 sets of
(11)
Hospital Acquired (Nosocomial)
Healthcareshyassociated communityshyonset
Community Acquired
blood cultures within 5 days No evidence the infection was present or incubating at the hospital admission unless related to previous hospital admission First culture obtained lt48 hours of admission and at least one of 1) iv antibiotic therapy or specialized care at home other than oxygen within the prior 30 days before bloodstream infection 2) attended a hospital or hemodialysis clinic or IV chemotherapy within the prior 30 days before bloodstream infection 3) admitted to hospital for 2 or more days within the prior 90 days before bloodstream infection or 4) resident of nursing home or long term care facility Bloodstream infections not fulfilling criteria for either nosocomial or healthcare associated
(6 11)
(6 141 142)
(6)
Primary Bloodstream Infection
Bloodstream infection is not related to infection at another site other than intravascular device
(11 28)
associated Secondary Bloodstream Infection
Bloodstream infection is related to infection at another body site (other than intravascular device) as determined on the basis of all available clinical radiographic and laboratory evidence
(6 11)
diptheroids Bacillus species Proprionibacterium species coagulaseshynegative
staphylococci micrococci viridians group streptococci
Contamination of blood cultures was defined by the isolation of organisms that
were considered part of the normal skin flora and for which there was no information
supporting a classification of BSI
85
Polyshymicrobial infections were traditionally defined as a single episode of disease
caused by more than one species Given that BSI may also be associated with multiple
positive cultures with the same organism from the same episode of disease new episodes of
BSI were defined as another isolation of the same or other species not related to the first
episode through treatment failure or relapse post therapy
The definitions for location of acquisition were included in the standardized form to
ensure uniformity in the application of the definitions
Patients transferred from nonshyCHR institutions where the length of hospital stay
was unknown were considered to have nosocomial infection
The focal source of BSI was established based on all available clinical laboratory
and radiological information in the medical record as defined in the CDCrsquos Definitions of
Nosocomial Infections (11)
Data Management and Analysis
Data were managed by using Microsoft Access 2003 (Microsoft Corp Redmond
WA) and analysis was performed using Stata 100 (StataCorp College Station TX)
Electronic Surveillance System
Patientrsquos medical records were randomly chosen for retrieval by assigning random
numbers to all episodes in the ESS The ESS study data were maintained and stored on the
secure firewall and password protected server at CLS Study data for analysis were
maintained and stored on the secure firewall and password protected server at Alberta
Health Services without any patient identifiers (ie postal code patient healthcare numbers
and regional health record numbers)
86
Comparison Study
The number of incident episodes of BSI and the proportion of episodes that were
nosocomial healthcareshyassociated communityshyonset or communityshyacquired infections in
the ESS and the medical record review were determined and then compared descriptively
Concordant episodes were those in which the ESS and the medical record review classified
episodes of BSI the same and discordant episodes were those in which the ESS and the
medical record review classified episodes of BSI differently All episodes in which the
chart review and the ESS were discordant were qualitatively explored and described
Agreement and kappa statistics were calculated using standard formulas and
reported with binomial exact 95 confidence intervals (CI) andor standard errors (SE)
(Appendix C) Bootstrap methods in the statistical software were used to determine 95 CI
because the classification of acquisition consisted of three categories Kappa was used to
measure the level of agreement as a proximate measure of validity between the ESS and the
medical record review for identifying the location of acquisition for the cohort of patients
with true BSIs Categorical variables were tested for independence using the Pearsonrsquos chishy
squared test (plt005) For continuous variables medians and intershyquartile ranges (IQR)
were reported The nonshyparametric MannshyWhitney UshyTest was used to compare medians
between groups (plt005)
Overall and speciesshyspecific populationshybased incidence rates of BSIs were
calculated using as the numerator the number of incident cases and the denominator the
population of the CHR at risk as obtained from the Alberta Health Registry Duplicate
isolates were excluded based on the ESSrsquos algorithms The proportion of cases that were
nosocomial healthcareshyassociated communityshyonset or community acquired was
87
calculated Mortality was expressed by reporting the inshyhospital caseshyfatality rate per
episode of disease
Ethical Considerations
This study involved the analysis of existing databases and no patient contact or
intervention occurred as a result of the protocol Patient information was kept strictly
secure Quality Safety and Health Information and the Centre for Antimicrobial Resistance
have clinical mandates to reduce the impact of preventable infections among residents of
the Calgary Health Region The evaluation of a routine surveillance system to track
bloodstream infections will benefit residents of the Calgary Health Region Such
information will be helpful for monitoring patient safety and may improve patient care by
early identification of bloodstream infections outbreaks or emerging pathogens or resistant
organisms Individual patient consent to participate was not sought in this project for
several reasons First a large number of patients were included and therefore acquiring
consent would have been very difficult Second most of the information included in this
study came from existing databases available to the investigators and minimal clinical data
was further accessed from patient charts Third and most importantly bloodstream
infection is acutely associated with a higher mortality rate (15shy25) Contacting patients or
the representatives of those that have died years after their illness would have been highly
distressing to many This study was approved by the Conjoint Health Research Ethics
Board at the University of Calgary
88
RESULTS
PopulationshyBased Surveillance Based on the Application of the ESS Algorithms
Incident Episodes of Bloodstream Infection
In 2007 there were 4500 organisms isolated from blood cultures among adults (18
years and older) Seventyshyeight percent (n=3530 784) of these were classified as
pathogenic organisms while 215 were classified as common contaminants found in
blood Of the pathogenic organisms cultured 1834 (519) were classified as first blood
isolates within 365 days among adults of which 1626 occurred among adults in the CHR
Twelve of these pathogens were excluded because they were unshyspeciated duplicates of
pathogens isolated in the same blood culture This resulted in 1614 episodes of BSIs with
1383 (857) being monoshymicrobial and 109 (675) polyshymicrobial episodes (Figure
51) Overall there were 1492 incident episodes of BSIs among 1400 adults in the CHR
for an incidence rate of 1561 per 100000 population
89
Figure 51 Flow Diagram of Incident Episodes of Bloodstream Infection by the ESS
4500 Organisms
3530 Pathogens
970 Single Contaminants
1696 Duplicate Isolates Removed
1834 First blood isolates within 365 days
208 First Blood Isolates within 365 days among NonshyCHR Residents
1626 First Blood Isolates within 365 days among CHR Residents
12 Isolates excluded because unshyspeciated
1614 First blood isolates within 365 days among CHR Residents
1492 Incident episodes of BSI
1383 MonoshyMicrobial BSI 109 PolyshyMicrobial BSI
90
Three patients did not have a date of birth recorded but the median age among the
1397 adults with one or more incident BSIs was 626 years (IQR 484 ndash 777 years) The
incident episodes of BSI occurred among 781 (558) males The median age of males
(617 years IQR 498 ndash 767 years) was not significantly different from the median age of
females (639 years IQR 467 ndash 792) (p=0838)
Aetiology of Episodes of Bloodstream Infections
Among the 1383 monoshymicrobial episodes of BSI in adult residents of the CHR
the most common organisms isolated were E coli (329 238) S aureus (262 189) S
pneumoniae (159 115) and coagulaseshynegative staphylococci (78 56) Of the 109
polyshymicrobial episodes of incident BSIs there were 231 first blood isolates within 365
days that occurred within 5 days from each other The most common organisms isolated in
the polyshymicrobial episodes were E coli (34 147) S aureus (22 952) Klebsiella
pneumoniae (21 909) and coagulaseshynegative staphylococci (13 563) Table 51
describes the speciesshyspecific incidence rate per 100000 of the top twenty most common
organisms isolated among all incident BSIs There were 1614 first blood isolates within
365 days isolated from the incident BSIs
91
Table 51 The 2007 SpeciesshySpecific Incidence among Adult Residents (gt18 years) of the Calgary Health Region
Organism N Incidence Rate () [per 100000 adult population]
Escherichia coli
MethicillinshySusceptible Staphylococcus aureus (MSSA) MethicillinshyResistant Staphylococcus aureus (MRSA) Streptococcus pneumoniae
Klebsiella pneumoniae
Coagulaseshynegative staphylococci (CoNS)
Streptococcus pyogenes
Enterococcus faecalis
Bacteroides fragilis group
Pseudomonas aeruginosa
Enterobacter cloacae
Streptococcus agalactiae
Klebsiella oxytoca
Enterococcus faecium
Streptococcus milleri group
Streptococcus mitis group
Peptostreptococcus species
Proteus mirabilis
Candida albicans
Group G Streptococcus
363 (225) 199
(123) 87
(54) 166
(1029) 92
(570) 91
(564) 61
(378) 46
(285) 41
(254) 39
(242) 26
(161) 26
(161) 22
(136) 22
(136) 19
(118) 17
(105) 15
(093) 15
(093) 14
(087) 14
(087)
380
208
91
174
96
95
64
48
43
41
27
27
23
23
20
18
16
16
15
15
92
Organism continued N Incidence Rate () [per 100000 adult population]
Candida glabrata 12 13 (074)
Clostridium species not perfringens 10 11 (062)
Other (Appendix C) 217 227 (134)
Acquisition Location of Incident Bloodstream Infections
Of the 1492 incident episodes of BSI 360 (24) were nosocomial 535 (359)
were healthcareshyassociated communityshyonset and 597 (400) were community acquired
(Table 52)
Table 52 Description of 2007 Incident BSIs among Adult Residents of the Calgary Health Region by Acquisition Location
Acquisition Location Variable CA HCA NI Number () 597 (400) 535 (359) 360 (240) Median Age (IQR) 579 (449 ndash 733) 650 (510 ndash 803) 663 (542 ndash 775) Male N () 333 (558) 278 (520) 234 (650) Incidence per 624 559 376 100000 population
A crude comparison of the median ages between different acquisition groups
showed that there was a significant difference in median age by acquisition (plt00001)
This was significant between HCA and CA BSIs (plt00001) and in the median age
between NI and CA (plt00001) (Table 52) No difference was observed in the median age
between the NI and HCA BSIs (p=0799) (Table 52) When stratified by gender in each
acquisition group there was no significant difference in the median age of males and
females in either group (NI p=00737 HCA p=05218 CA p=06615) however the
number of BSIs in each acquisition group was more frequent among males
93
Of the 535 incident episodes of BSI that were healthcareshyassociated communityshy
onset infections 479 (895) had one or more previous healthcare encounters prior to an
admission with an incident BSI within 48 hours of the admission The 56 episodes that did
not have a classified previous healthcare encounter were among patients who were
transferred into an acute care site from an unknown home care program (35 625) a
nursing home (14 25) a senior citizen lodge (4 714) or an unknown or unclassified
health institution (3 535) Table 53 describes the distribution of previous healthcare
encounters prior to the incident BSIs The classifications are not mutually exclusive
Table 53 Distribution of Previous Healthcare Encounters Prior to Incident BSIs among Adult Patients in the Calgary Health Region (2007)
Previous Healthcare Encounter N () Prior hospitalization 245
(458) Prior ED visit within 5 days prior to the 123 incident episode of BSI (247) ICDshy10shyCA code for active cancer as proxy 105 for previous cancer therapy and attendance at (196) the Tom Baker Cancer Centre Resident of a long term care facility or 104 nursing home (194) Renal patient on haemodialysis 100
(187) Prior HPTP 29
(54) Prior day procedure 12
(224)
The median time between blood culture collection and admission was 270 hours
(1125 days IQR 521shy2656 days) for nosocomial BSIs 1 hour prior to admission (IQR 5
hours prior ndash 2 hours after admission) for HCAshyBSIs and 1 hour prior to admission (IQR 5
hours prior ndash 1 hour after admission) for CAshyBSIs
94
Among the nosocomial BSIs S aureus (99 25) E coli (55 1399) coagulaseshy
negative staphylococci (38 967) and K pneumoniae (25 636) were the most common
pathogens isolated The most common pathogens isolated among the HCAshyBSIs were E
coli (132 2264) S aureus (121 2075) S pneumoniae (39 669) and K
pneumoniae (35 60) Similarly E coli S aureus and S pneumoniae were the most
common pathogens isolated among CAshyBSIs followed instead by S pyogenes (40 627)
Table 54 outlines the pathogen distribution by acquisition group for organisms that
comprise up to 75 of all bloodstream infections in each group
Table 54 The 2007 Organism Distribution by Acquisition Location for Incident BSIs among Adults in the Calgary Health Region
Number of Bloodstream Infections (N=1614)
Organism Name NI HCA CA Total n () n () n () N ()
MSSA 64 (163) 81 (139) 50 (78) 195 (121) MRSA 36 (92) 40 (69) 15 (24) 91 (56) E coli 55 (140) 132 (226) 176 (276) 363 (225) S pyogenes 4 (10) 17 (29) 40 (63) 61 (38) S agalactiae 0 (00) 14 (24) 12 (19) 26 (16) S pneumoniae 5 (13) 39 (67) 122 (191) 166 (103) CoNS 38 (97) 33 (57) 20 (31) 91 (56) K pneumoniae 25 (64) 35 (60) 32 (50) 92 (57) E faecalis 18 (46) 19 (33) 9 (14) 46 (29) E faecium 15 (38) 4 (07) 3 (05) 22 (14) P aeruginosa 18 (46) 19 (33) 2 (031) 39 (24) B fragilis group 14 (36) 10 (17) 19 (30) 43 (27) Calbicans 12 (31) 1 (02) 1 (02) 14 (09) Other 89 (226) 139 (238) 137 (215) 365 (226) Total 393 583 638 1614
Patient Outcome
In 2007 there were 1304 admissions to an acute care centre among patients with
incident episodes of BSI Most admissions occurred among urban acute care sites such as
95
Foothills Medical Centre (FMC) (607 465) Peter Lougheed Centre (PLC) (359
2753) and Rockyview General Hospital (RGH) (308 2362) Among rural sites
Strathmore District Health Services (SDHS) had the highest number of admissions among
patients with incident episodes of BSI (181304 138) The overall median length of stay
(LOS) was 1117 days (IQR 554shy2719 days)
Patient outcome information was only available for those patients who were
admitted to an acute care centre Patients could have multiple episodes of incident BSIs
during a single admission Of the 1492 episodes 1340 had inshyhospital outcome
information available Of the 1340 inshyhospital cases 248 patients died for an inshyhospital
caseshyfatality rate of 0185 (185) Twentyshynine (117) deaths occurred after a polyshy
microbial incident episode of BSI Table 55 outlines the number of deaths following
episodes of BSI by the BSIrsquos location of acquisition (χ2 1308 plt0001)
Table 55 InshyHospital Outcome by Location of Acquisition of Incident BSIs among Adults in the Calgary Health Region
Acquisition Location N ()
InshyHospital Outcome
CA HCA NI Total N ()
Alive Deceased Total
451 (897) 52 (103)
503 (1000)
396 (830) 81 (170)
477 (1000)
245 (681) 115 (319) 360 (1000)
1092 (815) 248 (185)
1340 (1000)
96
Medical Record Review and Electronic Surveillance System Analysis
A total of 308 patients were sampled among patients identified by the ESS and
included in the analysis A total of 661 blood cultures were drawn from these patients with
a total of 693 different isolates These isolates comprised 329 episodes of bloodstream
contamination or infection in the medical record review for comparison with the electronic
surveillance system data
The 308 patients had a median age of 609 years (IQR 482shy759 years) and
comprised of 169 (55) males The median age of males (631 years IQR 532shy764 years)
was statistically different from the median age of females (578 years IQR 434shy743)
(p=0009) Almost ninety percent (899) of these patients were from the CHR
Aetiology
Medical Record Review
The pathogens most commonly isolated from the blood cultures were S aureus
(165693 238) E coli (147693 212) S pneumoniae (73693 105) and
coagulaseshynegative staphylococci (50693 72) Table 56 identifies the frequency
distribution of all the pathogens isolated Among the S aureus isolates 79 (482) were
MRSA
97
Table 56 Distribution of Organisms Collected from 661 Cultures Based on the Medical Record Review
Organism Name Number () Aeromonas species 1 (014) Alcaligenes faecalis 1 (014) Anaerobic Gram negative bacilli 5 (072) Anaerobic Gram negative cocci 1 (014) B fragilis igroup 1 (014) C albicans 5 (072) Candida famata 1 (014) C glabrata 2 (029) Candida krusei 2 (029) Capnocytophaga species 1 (014) Citrobacter freundii complex 2 (029) Clostridium species not perfringens 2 (029) Clostridium perfringens 4 (058) CoNS 50 (72) Corynebacterium species 3 (043) Coryneform bacilli 4 (058) E cloacae 8 (115) Enterobacter species 1 (014) E coli 147 (212) Fusobacterium necrophorum 2 (029) Gemella morbillorum 2 (029) Gram positive bacilli 1 (014) Group G streptococcus 5 (072) Haemophilus influenzae Type B 2 (029) Haemophilus influenzae 1 (014) Haemophilus influenzae not Type B 2 (029) K oxytoca 4 (058) K pneumoniae 35 (505) Klebsiella species 2 (029) Lactobacillus species 6 (087) Neisseria meningitidis 4 (058) Peptostreptococcus species 6 (087) P mirabilis 5 (072) Providencia rettgeri 2 (029) P aeruginosa 17 (245) Rothia mucilaginosa 1 (014) Serratia marcescens 5 (072) Staphylococcus aureus 165 (238) Stenotrophomonas maltophilia 4 (058) S agalactiae 11 (159) Streptococcus bovis group 2 (029)
98
Organism Name continued Number () Streptococcus dysgalactiae subsp Equisimilis 7 (101) S milleri group 15 (216) S mitis group 2 (029) S pneumoniae 73 (105) S pyogenes 16 (231) Streptococcus salivarius group 2 (029) Viridans streptococci 4 (058) Veillonella species 1 (014)
There were 287 (917) monoshymicrobial episodes of BSIs and 26 (83) polyshy
microbial episodes of BSIs Escherichia coli (68 237) S aureus (64 223) S
pneumoniae (40 139) K pneumoniae (14 49) and coagulaseshynegative staphylococci
(11 38) were the most common pathogens implicated in the monoshymicrobial
bloodstream infections (Table 57) Similarly E coli (214) S aureus (125) and K
pneumoniae (89) were frequently isolated in polyshymicrobial bloodstream infections
(Table 58)
99
Table 57 Frequency of Organisms among MonoshyMicrobial Episodes of BSIs in the Medical Record Review (MRR) and the Electronic Surveillance System (ESS)
Organism Name MRR ESS N () N ()
Aeromonas species 1 (04) 1 (03) A faecalis 1 (04) 1 (03) Anaerobic gram negative bacilli 1 (04) 1 (03) B fragilis group 2 (07) 3 (10) C albicans 2 (07) 2 (07) C famata 1 (04) 1 (03) C glabrata 2 (07) 2 (07) C krusei 1 (04) 2 (07) Capnocytophaga species 1 (04) 1 (03) C freundii complex 2 (07) 2 (07) Clostridium species not perfringens 1 (04) 1 (03) C perfringens 1 (04) 1 (03) CoNS 11 (38) 20 (67) Corynebacterium species 1 (04) 2 (067) E cloacae 4 (14) 4 (14) E faecalis 9 (31) 9 (30) E faecium 3 (11) 5 (17) E coli 68 (236) 66 (222) F necrophorum 1 (04) 1 (03) Group G streptococcus 2 (07) 2 (07) H influenzae Type B 1 (04) 1 (03) H influenzae 1 (04) 1 (03) H influenzae not Type B 1 (04) 1 (03) K oxytoca 2 (07) 2 (07) K pneumoniae 14 (49) 15 (51) Lactobacillus species 2 (07) 3 (10) N meningitidis 1 (04) 1 (03) Peptostreptococcus species 4 (14) 4 (14) P mirabilis 2 (07) 2 (07) P aeruginosa 6 (21) 6 (20) R mucilaginosa 0 (00) 1 (03) S marcescens 2 (07) 2 (07) S aureus 64 (223) 60 (202) S maltophilia 1 (04) 1 (03) S agalactiae 5 (17) 5 (17) S bovis group 0 (00) 1 (03) S dysgalactiae subsp Equisimilis 4 (14) 4 (14) S milleri group 8 (28) 7 (24) S mitis group 1 (04) 1 (03) S pneumoniae 40 (140) 38 (128)
100
Organism Name continued MRR ESS N () N ()
S pyogenes 10 (35) 10 (34) S salivarius group 1 (04) 1 (03) Viridans streptococcus 0 (00) 1 (03) Veillonella species 1 (04) 1 (03)
101
Table 58 Frequency of Organisms among PolyshyMicrobial Episodes of BSI in the Medical Record Review (MRR) and the Electronic Surveillance System (ESS)
Organism MRR ESS N () N ()
Anaerobic gram negative bacilli 2 (36) 1 (213) Anaerobic gram negative cocci 1 (18) 1 (213) B fragilis group 1 (18) 1 (213) C perfringens 1 (18) 1 (213) CoNS 2 (36) 2 (423) E cloacae 2 (36) 2 (423) E faecalis 1 (18) 1 (213) E faecium 3 (54) 1 (213) Enterococcus species 1 (18) 1 (213) E coli 12 (214) 10 (213) Gmorbillorum 1 (18) 1 (213) Gram negative bacilli 0 (00) 1 (213) Gram positive bacilli 1 (18) 1 (213) Group G streptococcus 1 (18) 1 (213) K oxytoca 1 (18) 1 (213) K pneumoniae 5 (89) 5 (106) Peptostreptococcus species 1 (18) 1 (213) Pmirabilis 2 (36) 2 (426) P rettgeri 1 (18) 1 (213) P aeruginosa 3 (54) 3 (638) S aureus 7 (125) 7 (149) S agalactiae 1 (18) 1 (213) S bovis group 1 (18) 0 (00) S pneumoniae 1 (18) 1 (213) Viridans Streptococcus 1 (18) 0 (00)
Electronic Surveillance System
There were 297 (934) monoshymicrobial episodes of BSIs and 21 (66) polyshy
microbial episodes identified by the ESS Of the polyshymicrobial episodes five had three
different pathogens implicating the BSIs while 16 had two different pathogens implicating
the BSIs Among the monoshymicrobial episodes of BSIs the pathogens most commonly
isolated were E coli (66297 222) S aureus (60297 202) S pneumoniae (38297
128) and coagulaseshynegative staphylococci (20297 67) (Table 57)
102
Of the 60 S aureus isolates 20 (333) were MRSA Escherichia coli (1047
213) and S aureus (747 149) were pathogens commonly isolated from polyshy
microbial episodes of BSIs however K pneumoniae was isolated in 106 of the polyshy
microbial episodes (Table 58) Of the 7 isolates of S aureus 3 (429) were MRSA
Episodes of Bloodstream Infections
Medical Record Review
Among the 329 episodes identified 313 (951) were classified as episodes of BSI
while 16 (49) were classified as episodes of bloodstream contamination This
dichotomization was based on all available microbiology and clinical information in the
patientrsquos medical chart related to that episode Of the 313 BSIs 292 (933) were first
episodes 17 (54) were second episodes and 4 (13) were third episodes Therefore the
313 BSIs occurred among 292 patients The median age of these patients was 605 years
(IQR 486shy759) and 158 (541) were males The median age of males (631 years IQR
534shy764) was statistically different from the median age of females (578 years IQR 433shy
743 years) Two hundred sixtyshytwo (897) of these patients were from the CHR
Three symptoms characteristic of an infectious process (ie fever chills and
hypotension) were collected for all recorded episodes Among the identified bloodstream
infections 12 (38) did not have any infectious symptom identified in the medical record
review 95 (303) had only one symptom 125 (399) had two symptoms and 79
(252) had all three symptoms identified and recorded Two episodes did not have any
symptoms recorded by the reviewer which has been attributed to the reviewer not actively
identifying them in the medical record Of those that had symptoms recorded fever (244
103
815) was the most frequent symptom associated with infection followed by hypotension
(171 572) and chills (143 479)
Electronic Surveillance System
The ESS identified 344 pathogens as being the first isolate of that pathogen within
365 days These first blood isolates comprised 318 episodes of bloodstream infection
among 301 of the 308 patients that had their medical records reviewed Seven patients did
not have an episode of BSI because they did not have a first blood isolate within 365 days
The median age of these patients was 612 years (IQR 489 ndash 759 years) The median age
of males (632 years IQR 534 ndash 766) was significantly higher than the median age of
females (579 years IQR 434 ndash 743 years) (p=001) Ninety percent (903) of these
patients were from the CHR
Acquisition Location of Bloodstream Infections
Medical Record Review
The location of acquisition was recorded for all episodes of bloodstream infections
Oneshyhundred thirtyshysix (434) were CAshyBSIs 97 (309) were HCAshyBSIs and 80
(256) were nosocomial BSIs There was no difference in the median ages of males and
females within each bloodstream infection acquisition group except for nosocomial BSIs
where more males acquired nosocomial infections than females (38 543 vs 32 457
respectively) and were significantly older than females (693 years IQR 574shy774 years vs
576 years IQR 386shy737 years respectively) (p=0005) When comparing median ages
between acquisition location groups the median age of patients with HCAshyBSIs (628
years IQR 510shy785 years) was significantly higher than patients with CAshyBSIs (590
104
years IQR 462shy696 years) (p=0023) There was no difference in median age between
nosocomial BSIs and CAshyBSIs (p=0071) or HCAshyBSIs (p=0677) by the median test
Among the HCAshyBSIs 76 (783) were based on the patient having only one
previous healthcare encounter 19 (196) having two previous healthcare encounters and 2
(21) having three previous healthcare encounters prior to their bloodstream infection
Table 59 specifies the healthcare encounters prior to the patientsrsquo bloodstream infection
which are not mutually exclusive Having a patient attend a hospital haemodialysis clinic
or have IV chemotherapy within the prior 30 days before the BSI was the most common
healthcare encounter prior to the BSI
Table 59 Previous Healthcare Encounters among Patients with HealthcareshyAssociated CommunityshyOnset BSIs Based on the Medical Record Review
Previous Healthcare Encounter n ()
Intravenous (IV) antibiotic therapy or specialized care at home other 19 than oxygen within the prior 30 days before the bloodstream infection (196) Patient attended a hospital or hemodialysis clinic or had IV 43 chemotherapy within the prior 30 days before the bloodstream (443) infection Patient was admitted to a hospital for 2 or more days within the prior 28 90 days before bloodstream infection (289) Patient was living in a nursing home or long term care facility prior to 30 the bloodstream infection (309)
Electronic Surveillance System
The location of acquisition was recorded for all bloodstream infections in the ESS
Of the 318 BSIs 130 (409) were CAshyBSIs 98 (308) were HCAshyBSIs and 90 (283)
were nosocomial BSIs There was no difference in the median ages of males and females
within each bloodstream infection acquisition group except for nosocomial infections
where more males acquired nosocomial infections than females (46 vs 33) and were
105
significantly older than females (682 years IQR 566shy770 years vs 578 years IQR 417shy
738 years p=00217) When comparing median ages between acquisition location groups
the median age of patients with HCAshyBSIs (669 years IQR 514 ndash 825 years) was
significantly higher than patients with CAshyBSIs (589 years IQR 453 ndash 686 years)
(p=00073) There was no difference in median age between nosocomial BSIs and CAshyBSIs
or HCAshyBSIs
Among the HCAshyBSIs 65 (663) were based on the patient having only one
previous healthcare encounters 27 (276) having two previous healthcare encounters 5
(51) having three healthcare encounters and one (10) having four healthcare
encounters prior to their BSI Table 510 shows the healthcare encounters prior to the
patientrsquos BSI which are not mutually exclusive Having a patient admitted to a hospital for
two or more days within the prior 90 days before the BSI was the most common healthcare
encounter prior to the BSI
106
Table 510 Previous Healthcare Encounters among Patients with HealthcareshyAssociated CommunityshyOnset BSIs Based on the ESS Sample
Previous Healthcare Encounter N ()
Discharge from HPTP clinic within the prior 2shy30 days before BSI 3 (31)
Active dialysis 19 (194)
Prior day procedure within the prior 2shy30 days before BSI 1 (10)
Had an ICDshy10shyCA code for active acute cancer as an indicator of having 16 attended or were admitted to the Tom Baker Cancer Centre (163) Admitted to CHR acute care hospital for 2 or more days within the prior 90 45 days before BSI (459) Attended a hospital clinic or ED within the prior 5shy30 days before BSI 21
(214) Sample submitted from or from patient who previously sent a sample from a 33 nursing home or long term care facility (337)
Source of Bloodstream Infections
Medical Record Review
Based on all available clinical data radiographic and laboratory evidence 253
(808) of the bloodstream infections were classified as secondary BSIs in that they were
related to an infection at another body site (other than an intravenous device) These
secondary BSIs were further classified based on the body site presumed to be the source of
the BSI A majority of secondary BSIs were not classified based on identifying the same
pathogen isolated from another body site 167 (66) but were primarily based on clinical
information physician diagnosis or radiographic reports Eightyshyfour (332) had one
culture positive at another body site related to their secondary source of infection and two
had two positive cultures at another body site
107
Ninetyshyeight percent 248 (98) of the secondary BSIs had at least one focal body
site identified two had no site recorded and one had two foci recorded Two of the
secondary BSIs did not have a focal body site recorded because either the patient deceased
or was discharged before supporting evidence for a secondary BSI was recorded in the
medical record The reviewers were not able to determine the focal body site based on the
information available in the medical record despite having enough clinical and laboratory
data to classify the BSI as nonetheless being related to another body site One patient had a
polyshymicrobial BSI (S aureus E coli) each of which were cultured and isolated at different
body sites (the former from a head wound the latter from a midstream urine sample) This
episode was not classified as a systemic infection because the source of each pathogen was
clearly identified Three patients had a single monoshymicrobial episode which were
classified as systemic infections because they involved multiple organs or systems without
an apparent single site of infection
The most common infections at another body site attributing to the BSIs were
pneumonia (70 277) urinary tract infections (60 237) gastrointestinal infections (42
166) skin and soft tissue infections (31 122) and cardiovascular infections (18 7)
(Table 511)
108
Table 511 Source of Secondary BSIs Identified in the Medical Record Review and the Electronic Surveillance System
Focal Body Source MRR ESS n () n ()
Urinary Tract (UTI) 60 (237) 48 (516) Surgical Site (SSI) 1 (04) 0 (00) Skin and Soft Tissue (SST) 31 (122) 16 (172) Pneumonia 70 (277) 9 (97) Bone and Joint (BJ) 9 (36) 0 (00) Central Nervous System (CNS) 5 (20) 3 (32) Cardiovascular System (CVS) 18 (71) 0 (00) Ears Eyes Nose Throat (EENT) 4 (16) 1 (11) Gastrointestinal (GI) 42 (166) 5 (54) Lower Respiratory Tract (LRI) 1 (04) 2 (215) Reproductive 6 (24) 0 (00) Systemic 3 (12) 0 (00) Unknown 3 (12) 9 (97)
S pneumoniae (38 543) and S aureus (17 243) were the most common
pathogens implicated in BSIs related to pneumonia E coli (40 672) and K pneumoniae
(7 113) among BSIs related to the urinary tract E coli (16 364) followed by both S
aureus and E faecium (each 3 73) among BSIs related to gastrointestinal sites S
aureus (12 389) and S pyogenes (group A streptococcus GAS) (6 194) among BSIs
related to skin and soft tissue sites and S aureus (10 556) and Enterococcus faecalis (3
167) related to cardiovascular site infections
Most BSIs related to another body site were infections acquired in the community
(125253 494) whereas most primary BSIs were nosocomial infections (2960 483)
(Table 512 χ2 2597 plt0001) Row percentages are included in Table 512
109
Table 512 Source of BSIs by Location of Acquisition for Episodes of BSIs Included in the Medical Record Review
Acquisition Location n ()
Source of BSI CA HCA NI Total n ()
Primary 11 20 29 60 (183) (333) (483) (100)
Secondary 125 77 51 253 (494) (304) (202) (100)
Total 136 97 80 313 (434) (310) (356) (100)
Electronic Surveillance System
Based on microbiological data in the ESS 93 (292) of the bloodstream infections
were classified as secondary BSIs in that they were related to a positive culture with the
same pathogen at another body site These secondary BSIs were further classified based on
the body site presumed to be the source of the BSI Ninety percent (8493) of the secondary
BSIs had at least one positive culture with the same pathogen at another body site and 9
(10) had two positive cultures with the same pathogen at different body sites The ESS
did not have the capability to distinguish the body sites presumed to be the source of the
BSI for those episodes with two positive cultures from different body sites
The most common infections at another body site attributing to the BSIs were
urinary tract infections (48 516) skin and soft tissue infections (16 172) and
pneumonia (9 97) (Table 511)
Escherichia coli (36 750) and K pneumoniae (2 42) were the most common
pathogens implicated in BSIs related to the urinary tract S aureus (9 562) and GAS (3
110
187) among BSIs related to skin and soft tissue sites and S pneumoniae (5 556) and
S aureus (3 333) among BSIs related to pneumonia
Most BSIs related to another body site were infections acquired in the community
(3593 376) and similarly most primary BSIs were communityshyacquired (95225
298) Row percentages are included in Table 513 There was no significant difference in
the proportion of primary or secondary BSIs among groups of acquisition location of BSIs
(χ2 0633 p=0729)
Table 513 Source of BSIs by Location of Acquisition for Episodes of BSIs Included in the ESS Sample
Acquisition Location n ()
Source of BSI CA HCA NI Total n ()
Primary 95 67 63 225 (422) (298) (280) (1000)
Secondary 35 31 27 93 (376) (333) (290) (1000)
Total 130 98 90 318 (409) (308) (283) (1000)
Patient Outcome
Medical Record Review
One patient was not admitted to a hospital among the 308 patients During their
incident BSIs patients were hospitalized at FMC (154312 494) PLC (86312 276)
RGH (66312 212) SDHS (5312 16) and Didsbury District Health Services
(DDHS 1312 03)
There were a total of 63 deaths following BSI for a caseshyfatality rate of 020 (20)
Of these 63 deaths 6 (95) occurred after a patientrsquos second episode of BSI and 2 (32)
111
occurred after a patientrsquos third episode of BSI Of these 15 of deaths followed a patient
having a polyshymicrobial BSI Table 514 shows the number of deaths following episodes of
BSI by the BSIrsquos location of acquisition (χ2150 p=0001) Column percentages are
included in Table 514
Table 514 InshyHospital Outcome by Location of Acquisition of BSIs Included in the Medical Record Review
Acquisition Location n () InshyHospital Outcome CA HCA NI Total
n () Alive 117 81 52 250
(860) (835) (650) (799) Deceased 19 16 28 63
(140) (165) (350) (201) Total 136 97 80 313
(1000) (1000) (1000) (1000)
Electronic Surveillance System
During their incident BSIs patients were hospitalized at FMC (158 498) PLC
(84 265) RGH (69 217) SDHS (5 16) and DDHS (1 03) according to the
ESS
There were a total of 65 deaths following BSIs for a caseshyfatality rate of 021 (21)
Of these 65 deaths 92 occurred after a patientrsquos second episode of BSI and 15
occurred after a patientrsquos third episode Of these 108 of deaths followed a patient having
a polyshymicrobial BSI Table 515 outlines the inshyhospital number of deaths following
episodes of BSI by the BSIrsquos location of acquisition (χ2 280 plt0001)
112
Table 515 InshyHospital Outcome by Location of Acquisition of BSIs Included in the ESS Sample
Acquisition Location n () InshyHospital Outcome CA HCA NI Total
n () Alive 119 77 56 252
(915) (794) (622) (795) Deceased 11 20 34 65
(85) (206) (378) (205) Total 130 97 80 307
(1000) (1000) (1000) (1000)
113
Comparison between the Electronic Surveillance System and the Medical Record
Review
Episodes of Bloodstream Infection
The medical record reviewers classified 313 (95) episodes as true bloodstream
infections based on all microbiologic clinical and radiographic information available in the
patientrsquos medical record Among the 313 BSIs identified in the medical record review the
ESS was concordant in 304 (97) The reviewers classified 9 additional BSIs that were not
identified in the ESS (Table E1 Appendix E) and the ESS identified 14 additional
episodes of BSIs not concordant with the medical record review (Table E2 Appendix E)
Description of Discrepancies in Episodes of Bloodstream Infection
Among the 9 additional bloodstream infections identified in the medical record
review 4 were not identified in the ESS because the pathogens were not isolated for the
first time in 365 days prior to that culture date These four were classified as a single
episode of bloodstream infection by the reviewers Two patients had 2 episodes each
according to the medical record review The ESS did not classify the second episode (2 of
9) as a separate bloodstream infection because the pathogen was not isolated for the first
time in 365 days prior to that culture date Two patientsrsquo third episode (2 of 9) identified in
the chart review was not identified in the ESS because the pathogen isolated was the same
as that of the patientsrsquo first episode and therefore the ESS only included two of the
patientsrsquo bloodstream infections One patient had 2 episodes one monoshymicrobial and the
other polyshymicrobial The first episode was not identified (1 of 9) in the ESS because the
pathogen was not isolated for the first time in 365 days prior to that culture date The
114
second episode had one of the two pathogens as a first blood isolate in the 365 days prior to
that culture date which the ESS classified as a single monoshymicrobial episode
Of the 14 additional bloodstream infections identified by the ESS 2 were additional
episodes of BSI identified in the ESS that the reviewers did not classify as separate
episodes for comparison The chart review identified one episode (1 of 2) as polyshy
microbial which the ESS classified as a separate monoshymicrobial bloodstream infection
based on the date of the positive blood cultures and because both pathogens were first
blood isolates within the prior 365 days In the other case the reviewers identified one
monoshymicrobial bloodstream infection of E coli that was contaminated with Bacteroides
fragilis whereas the ESS identified the B fragilis as a separate monoshymicrobial
bloodstream infection This was an error by the reviewers to classify B fragilis as a
contaminant
Twelve of the 14 bloodstream infections identified by the ESS were classified as
bloodstream contaminants by the medical record reviewers As such these 12 (of 316
385) were considered false positives in the ESS Nine of the 12 discrepancies were due
to there being two positive blood cultures with coagulaseshynegative staphylococci within 5
days of each other which the reviewers classified as contaminants but the ESS identified as
bloodstream infections Three episodes had only a single positive blood culture of Rothia
mucilaginosa Lactobacillus and Corynebacterium species which were all classified as
contaminants by the reviewers
Acquisition Location of Episodes of Bloodstream Infection
The agreement between the ESS and the medical record review for the location of
BSI acquisition was determined based on the BSIs that were concordant between the ESS
115
and the medical record review (n=304) The overall agreement was 855 (260304) in the
classification of acquisition between the ESS and the medical record review resulting in an
overall kappa of 078 (95 CI 075 shy080) with good overall agreement Therefore the
agreement observed was significantly greater than the amount of agreement we would
expect by chance between the reviewer and the ESS (plt00001) The table of frequencies
of the concordant and discordant episodes is shown in Table 516
Table 516 Comparison of Location Acquisition of BSIs between the Medical Record Review and the ESS
Electronic surveillance Medical system n ()
Record Review NI HCA CA Total n ()
NI 77 2 0 79 (253) (07) (00) (260)
HCA 4 72 15 92 (13) (240) (49) (303)
CA 4 19 110 133 (13) (63) (362) (438)
Total 85 94 125 304 (280) (309) (411) (1000)
Description of Discrepancies in Location of Acquisition between Medical Record Review
and the ESS
Table E3 (Appendix E) tabulates all the discrepancies observed between the ESS
and the medical record review An attempt to group and describe discrepancies has been
detailed below
The ESS misclassified four episodes as nosocomial BSIs where the medical record
reviewers classified them as healthcareshyassociated communityshyonset BSIs In three episodes
the ESS classified the episodes as NI because the blood cultures were obtained more than
116
48 hours after admission (between 52shy64 hours) The reviewers classified these as HCA
because the patients had previous healthcare encounters (ie home care chemotherapy
resident in nursing homelong term care facility and previous hospital admission) and were
believed to have the infection incubating at admission In these instances the reviewers
were able to identify admission and discharge dates but not times which resulted in an
estimation of timing between admission and blood culture collection The ESS
classification of NI took precedence over a classification of HCA because of the timing of
blood culture collection however the ESS did still identify that 2 of 3 of these patients had
previous healthcare encounters as well The fourth discrepancy was in a patient who was
transferred from another hospital and had a blood culture drawn 7 hours from admission to
the second acute care site The reviewers identified in the medical record that the patient
was hospitalized for one week was sent home with total parenteral nutrition (TPN) and
then returned to hospital for other medical reasons but then proceeded to have arm cellulitis
at or around the TPN site
In four episodes of BSI the ESS classified them as NI whereas the reviewers
classified them as CA The ESS classified three of them as NI because the blood cultures
were collected more than 48 hours after admission (between 55shy84 hours) In two of these
episodes the reviewers identified the admission date and date of blood culture collection
which was within a 2 day period and the patients had no previous healthcare encounters
therefore classifying them as communityshyacquired In one episode where the blood culture
was collected 84 hours after admission the reviewers believed that the pathogen was
incubating at admission in the patientrsquos bowel according to all clinical information in the
medical record The fourth discrepancy occurred in a homeless patient who was not
117
transferred from another acute care centre based on the information available in the medical
record however the ESS classified this episode of BSI as NI because it identified that the
patient was indeed transferred from another acute care site
Two episodes were classified as NI by the medical record reviewers while the ESS
classified them as HCA One patient was transferred from another acute care site and it was
unclear in the medical record how long the patient was admitted at the previous acute care
site The blood cultures were collected 2 days apart according to the dates of admission to
the second acute care centre and the blood culture collection in the medical record review
The ESS found that the blood culture was collected 44 hours from admission to the second
acute care site it identified that the patient was transferred from another acute care site and
that the patient had a previous healthcareshyencounter It is likely that the ESS classified this
episode as HCA because it identified that the patient was not hospitalized at the initial acute
care site long enough (ie gt 4 hours) to render a NI classification of the episode of BSI
The second discrepancy occurred where a patient had a cytoscopy the day prior to the BSI
while the patient had been admitted at an acute care site for two days The patient was sent
home and then returned the next day resulting in a second hospital admission The
reviewers classified this as NI because the BSI was understood to be part of a single
admission rather than due to a previous separate healthcare encounter prior to the episode
of BSI The ESS identified that the blood culture was taken 2 hours before the second
admission and that the patient had two previous healthcare encounters ndash a prior ED visit
and hospitalization
The largest number of discrepancies between the medical record review and the
ESS occurred where the reviewers classified episodes as CA and the ESS classified them as
118
HCA (n=19) Four episodes had no previous healthcare encounters but the patients were
transferred from an unknown home care site according to the ESS The reviewers classified
these as communityshyacquired because two of the patients lived at home either alone or with
a family relative one patient lived in an independent living centre where patients take their
own medications and only have their meals prepared and the fourth patient lived at a lodge
which the reviewers did not classify as either home care a long term care facility or a
nursing home Fourteen patients with BSIs had one healthcare encounter prior to their BSI
Six patientsrsquo BSIs were classified as HCA by the ESS because the ESS identified an ICDshy
10shyCA code for active cancer which served as a proxy for visiting a healthcare setting for
cancer therapy (ie chemotherapy radiation surgery) In five of these cases the reviewers
noted that the patient had either active cancer or a history of cancer however there was no
clear indication of whether the patient had sought treatment for the noted cancer at a
hospital or outpatient clinic In one of these instances the only treatment a patient was
receiving was homeopathic medicine which the reviewers did not identify as a healthcare
encounter that could contribute to the acquisition of a BSI The sixth patientrsquos medical
record had no indication of cancer at all and the previous healthcare encounters that the
patient did have did not meet the medical record case definition for an HCA BSI Three
patients were identified by the ESS as living in a nursing home or long term care facility
The reviewers did not find any indication in the medical record that two of these patients
lived in a nursing home or long term care facility The third patient lived in a lodge which
the reviewers did not classify as a form of home care nursing home or long term care
facility Three patientsrsquo BSIs were classified as HCA by the ESS because it identified that
the patients had previous hospitalizations In one instance the reviewers did not find any
119
indication in the medical record that the patient had a previous hospitalization A second
patient had 2 hospital admissions which the reviewers found were related to the BSI
identified in the third admission but which was acquired in the community prior to the first
admission The third patient was transferred from a penitentiary and did not have any other
previous hospitalizations recorded in the medical record at the time of his BSI One patient
had a history of being part of the Home Parenteral Therapy Program (HPTP) according to
the ESS The reviewers identified that this patient was hospitalized four months prior to his
BSI with discitis was discharged to the HPTP and then returned to hospital with worse
pain which then resulted in osteomyelitis and a BSI The reviewers determined that the
BSI was community acquired and related to the osteomyelitis rather than healthcareshy
associated communityshyonset and related to the HPTP The last patient visited an ED prior to
the episode of BSI which the ESS used to classify the episode as HCA but the reviewers
determined that the ED visit was attributed to symptoms associated with the episode of
BSI and therefore the patient acquired the BSI in the community rather than the ED
The second largest group of discrepancies occurred where the medical record
reviewers classified episodes of BSI as healthcareshyassociated communityshyonset while the
ESS classified them as communityshyacquired (n=15) Thirteen patients had one previous
healthcare encounter identified by the medical record reviewers which the ESS did not
identify and classified as CA because the blood cultures were within 48 hours of admission
Of these seven patients had a previous dayshyprocedure as an outpatient prior to their BSI
which the reviewers classified as it being a previous hospital or clinic visit within the prior
30 days prior to the BSI The day procedures were prostate biopsies (n=2) ERCP (n=1)
bone marrow aspirate biopsy (n=1) cytoscopy (n=1) stent removal (n=1) and
120
bronchoscopy (n=1) Three patients had some form of home care (ie changing indwelling
catheters by nurse [n=2] and a caregiver for a patient with developmental delay and
diabetes mellitus [n=1]) identified by the medical record reviewers which was not
identified by the ESS Two patients one on a transplant list and the other having received
an organ transplant prior to their BSI had frequent followshyup appointments with their
physicians which the medical record reviewers viewed as a previous healthcare encounter
to classify the BSI as HCA whereas the ESS did not identify these patients as having
previous healthcare encounters One patient had a previous hospital admission which the
ESS did not identify Two patients had 2 previous healthcare encounters each identified by
the reviewers which the ESS did not find Each had some form of home care prior to their
BSI as well as one being a resident at a nursing home and the other having a previous
hospital admission which was not identified by the ESS
Comparison of the Source of Infection between the Medical Record Review and the ESS
The medical record reviewers and the ESS classified BSIs according to whether
they were primary or secondary episodes of BSIs The reviewers based their classification
on microbiology laboratory data clinical information from physician and nurses notes and
radiographic reports The ESS classified these according to the presence or absence of a
positive culture of the same organism isolated in the blood at another body site The
agreement between the ESS and the medical record reviewers was low (447) resulting in
a poor overall kappa score (κ=011 91 CI 005 ndash 017) Therefore the agreement
observed was significantly less than the amount of agreement we would expect by chance
between the reviewers and the ESS (p=00004) The table of frequencies showing the
121
concordant and discordant classification of BSIs among those BSIs that were initially
concordant between the ESS and the medical record review is found in Table 517
Table 517 Source of BSIs between Medical Record Review and the ESS
Electronic Surveillance System n () Total
Medical Record Primary Secondary n Review ()
Primary 50 7 57 (164) (23) (188)
Secondary 161 86 247 (530) (283) (813)
Total 211 93 304 (694) (306) (1000)
Descriptions of Discrepancies in the Source of Infection between Medical Record Review
and the ESS
The agreement between the ESS and the medical record review was poor in the
identification of the overall source of infection as either primary or secondary with 168
(553) discrepancies between the ESS and the medical record review The majority of
these discrepancies (161 96) occurred where the ESS classified BSIs as primary
episodes while the reviewers classified them as secondary episodes of infection The
reason for this discrepancy was that the ESSrsquos laboratory data component did not have
positive cultures at another body site that would trigger the classification of a secondary
BSI The medical record reviewers based the classification primarily on clinical
information and radiographic reports in the medical record rather than solely on a positive
culture report in the medical record Only 12 (12161 75) secondary BSIs according to
the medical record review had a positive culture report from another body site in the
medical record which facilitated the confirmation of the secondary source of BSI Of the
122
149 that did not have a positive culture report from a different body site in the medical
record and which classification was solely based on clinical and radiographic information
in the record more than half of the secondary BSIs had pneumonia (50 343) or
gastrointestinal (32 215) sources of infection The diagnosis of pneumonia as the source
of the BSI was based on symptoms of purulent sputum or a change in character of sputum
or a chest radiographic examination that showed new or progressive infiltrate
consolidation cavitation or pleural effusion Of the gastrointestinal sources of infection 25
(781) were at an intrashyabdominal site which was clinically confirmed by reviewers based
on an abscess or other evidence of intrashyabdominal infection seen during a surgical
operation or histopathologic examination signs and symptoms related to this source
without another recognized cause or radiographic evidence of infection on ultrasound CT
scan MRI or an abdominal xshyray
Of the seven discrepancies where the ESS classified episodes of BSI as secondary
episodes and the medical record reviewers classified them as primary all of them had a
positive culture of the same pathogen as in the blood isolated from another body site and
recorded in the ESS Six of these episodes were classified as primary episodes of BSI
because they were not related to an infection at another body site other than being IV
device associated and they did not have a positive culture from another body site or
radiographic evidence suggestive of a secondary BSI One patientrsquos BSI was classified as a
primary infection despite having a positive culture at another body site of the same
pathogen as that in the blood because the cultures were related to an abscess or infection in
the arm that was originally due to an IV device
123
Comparison of the Source of BSIs among Concordant Secondary BSIs between the
Medical Record Review and the ESS
There were 86 concordant episodes of BSIs that were classified as secondary BSIs
by both the ESS and the medical record review Among these it was found that there was
721 agreement between the ESS and the medical record review in identifying the focal
body site as the source of the BSI (κ=062 95 CI 059 ndash 071) This resulted in an overall
good agreement between the ESS and the medical record review where the agreement
observed was significantly higher than the agreement expected by chance alone between
the ESS and the medical record review (plt00001)
There were a total of 24 discrepancies in the identification of the focal body site of
the source of secondary BSIs between the ESS and the medical record review (Table E4
Appendix E) Of these seven episodes did not have a focal body site identified by the ESS
because the patient had two positive cultures at different body sites The ESS does not have
an algorithm in place to determine which of multiple cultures takes precedence in the
classification of the main focal body site as the source of the infection The reviewers were
able to identify the severity of the infections at the different body sites to determine a single
possible source of the BSI Two were identified as pneumonia by the reviewers 2 as
cardiovascular system infections 2 as gastrointestinal and 1 as lower respiratory tract
infection other than pneumonia One patient had two foci listed by the medical record
reviewers for which a single source could not be determined nor could the reviewers
classify the source as systemic based on the available clinical and radiographic information
in the medical record The ESS classified this patient has having a urinary tract source of
infection because the patient had a single culture positive from the urinary tract
124
Summary of Results
In this study the ESS was demonstrated to be a valid measure for the identification
of incident episodes of BSIs and for the location of acquisition for BSIs The ESS had a
97 concordance with medical record review in identifying true episodes of BSI The
majority of discrepancies were due to multiple positive blood cultures of coagulaseshy
negative staphylococci being classified as true episodes of BSI by the ESS but as
contaminants by the medical record reviewers
The ESS had an overall agreement of 855 (κ=078 95 CI 075 ndash 080) in the
classification of acquisition The greater number of discrepancies occurred where the ESS
classified episodes of BSI as HCA and the reviewers classified them as CA A number of
these were attributed to the use of ICDshy10shyCA codes to identify patients with active cancer
and likely attending the Tom Baker Cancer Centre which the reviewers did not capture in
their medical record review
The ESS did not perform well in the classification of the focal body source of BSI
It had a low overall agreement of 447 (κ=011 95 CI 005 ndash 017) This was attributed
to the lack of clinical and radiological data in the ESS which classified the source of BSIs
solely based on microbiological data
The 2007 overall incidence of BSIs among adults (gt18 years) in the Calgary Health
Region was 1561 per 100000 population Escherichia coli (380 per 100000 population)
MSSA (208 per 100000 population) and S pneumoniae (174 per 100000 population)
had the highest speciesshyspecific incidence
In 2007 most incident BSIs were acquired in the community (597 40) among
patients who did not have any previous healthcare encounters prior to their incident BSI
125
and hospital admission Healthcareshyassociated communityshyonset BSIs comprised 535
(359) of incident BSIs with prior hospitalizations and visits to the emergency
department being the most frequent healthcare encounters
Most admissions related to the incident BSIs occurred in the three main CHR urban
acute care centres The inshyhospital caseshyfatality rate was 185
The ESS 2007 data set was representative of the CHR target population in terms of
the distribution of location of acquisition of incident episodes of BSI previous healthcare
encounters pathogenic organisms and the inshyhospital caseshyfatality rate
126
DISCUSSION
The work described here provide insights into 1) the novel features of the
electronic surveillance system (ESS) 2) the independent evaluation of incident episodes of
bloodstream infections (BSIs) the location of acquisition the source of bloodstream
infections and the inshyhospital caseshyfatality rate by the medical record review and the ESS
in a sample of 308 patients 3) the agreement between the medical record review and the
ESS for identifying incident episodes of bloodstream infections classifying the location of
acquisition and determining the source of bloodstream infection 4) the application of
validated definitions in the ESS to determine the overall populationshybased incidence of
bloodstream infections the speciesndashspecific incidence of bloodstream infections the
location of acquisition of bloodstream infections and the inshyhospital caseshyfatality rate
following infection in the Calgary Health Region in the 2007 year
Novelty of the Electronic Surveillance System
This study describes the validation of previously developed efficient active
electronic information populationshybased surveillance system that evaluates the occurrence
and classifies the acquisition of all bloodstream infections among adult residents in a large
Canadian healthcare region This system will be a valuable adjunct to support quality
improvement infection prevention and control and research activities
There are a number of features of this ESS that are novel Unlike previous studies
that have largely focused on nosocomial infections this study included all BSIs occurring
in both community and healthcare settings because the microbiology laboratory performs
virtually all of the blood cultures for the community physiciansrsquo offices emergency
departments nursing homes and hospitals in our region In addition unlike many other
127
ESSs that only include infections due to selected pathogens in surveillance infections due
to a full range of pathogens were included in this ESS such that infrequently observed or
potentially emerging pathogens may be recognized
Another important feature is that we classified BSIs according to location of
acquisition as nosocomial healthcareshyassociated communityshyonset or communityshyacquired
infections No studies investigating electronic surveillance have attempted to utilize
electronic surveillance definitions to classify infections according to the criteria of
Freidman et al (6)
Validation of the Electronic Surveillance System
The systematic review conducted by Leal et al identified that there are few studies
that have reported on the criterion validity of electronic surveillance as compared to
traditional manual methods (5) Trick and colleagues compared a number of different
computershybased algorithms to assess hospitalshyonset (first culture positive more than two
days after admission) bloodstream infection at two American hospitals (3)They compared
a series of computershybased algorithms with traditional infection control professional review
with the investigator review as the gold standard As compared to infection control
professional review computer algorithms performed slightly better in defining nosocomial
versus community acquisition (κ=074) For distinguishing infection from contamination in
the hospital setting they found that laboratory data as a single criterion to be less sensitive
(55) than a computer rule combining laboratory and pharmacy data (77) but both
showed similar agreement (κ=045 and κ=049 respectively) The determination of
primary central venous catheter (CVC)shyassociated BSIs versus secondary BSIs based on
the timing of nonshyblood cultures positive for the same pathogen as in the blood resulted in a
128
moderate kappa score (κ=049) These investigators excluded communityshyonset disease
developed the definitions using opinion only and did not improve their algorithms by
incrementally refining the algorithm or including additional clinical information and
therefore there is room for significant further improvement
In another study Yokoe et al compared the use of simple microbiologic definitions
alone (culture of pathogen or common skin contaminant in at least two sets of blood
cultures during a fiveshyday period) to the prospective use of traditional NNIS review as the
gold standard (145) They found that the overall agreement rate was 91 most of the
discordant results were related to single positive cultures with skin contaminants being
classified as true infections Agreement may have been much higher if manual review was
used as the gold standard because NNIS definitions classify common skin contaminants as
the cause of infection if antimicrobials are utilized even if the use of antimicrobials was not
justified (5)
Similarly Pokorny et al reported that use of any two criteria in any combination ndash
antibiotic therapy clinical diagnosis or positive microbiology report ndash maximized
sensitivity and resulted in high agreement (κ=062) between their ESS and manual chart
review for nosocomial infection (146) Leth and Moller assessed a priori defined computershy
based versus conventional hospital acquired infection surveillance and found an overall
sensitivity of 94 and specificity of 74 these parameters were each 100 for
bloodstream infection (147)
In comparison this studyrsquos ESSrsquos definitions had high concordance with medical
record review for distinguishing infection from contamination and performed slightly
better in agreement (97) than reported in other studies Furthermore many of the studies
129
to date have focussed on nosocomial or hospitalshyacquired infections whereas this studyrsquos
ESS evaluated three separate classifications of the acquisition location of bloodstream
infections specifically nosocomial healthcareshyassociated communityshyonset and
communityshyacquired Both healthcareshyassociated communityshyonset and communityshy
acquired bloodstream infections have rarely been included and validated in previous
surveillance systems This study demonstrated that the ESS had a high agreement (855)
with medical record review in the classification of acquisition location
Identification of Bloodstream Infections
This study has demonstrated that the ESS was highly concordant (97) with
medical record review in identifying true episodes of bloodstream infection by the use of
microbiological laboratory data The majority of discrepancies occurred where the ESS
overcalled the number of true episodes of bloodstream infection (14 61) which the
medical record reviewers classified as bloodstream contaminants (12 86)
In this study the focus was on establishing the presence of incident episodes of
infection as opposed to confirming bloodstream contamination The determination of
whether a positive blood culture results represents a bloodstream infection is usually not
difficult with known pathogenic organisms but it is a considerable issue with common skin
contaminants such as viridians group streptococci and coagulaseshynegative staphylococci
(CoNS)
During the early development of the ESS post hoc revisions were made to the ESS
in which the viridans streptococci were included in the list of potential contaminants The
exclusion of the viridans streptococci as a contaminant in the ESS definitions resulted in a
higher number of episodes of infections during the development phase and accounted for
130
64 of the discrepancies of classifying true episodes of infection by the ESS However
when included as a common skin contaminant the concordance of episodes was 95 and
the number of incident episodes of infections was comparable Clinically many of the
single viridans streptococci isolates in blood were classified as contaminants justifying its
inclusion in the contaminant list in the electronic definitions
Although the inclusion of this organism differs from previously established
surveillance definitions the NHSN criteria for laboratoryshyconfirmed bloodstream infection
have recently included viridans streptococci as a common skin contaminant In this study
all infections by viridans streptococci identified by the ESS were concordant with the
medical record review and the ESS has successfully demonstrated and supported the
change by the NHSN
Studies have reported that viridans streptococci represent true bacteraemia only 38shy
50 of the time (7) Tan et al assessed the proportion and clinical significance of
bacteraemia caused by viridans streptococci in immunoshycompetent adults and children
(148) They discovered that only 69 (50723) of adult communityshyacquired bacteraemia
were caused by viridans streptococci Of these 473 of the cultures were of definite or
probable clinical significance (148) In comparison the population speciesshybased
evaluation by the ESS found that 97 of the viridans streptococci were associated with
incident BSIs in the CHR in 2007
Among the twelve true BSI episodes identified by the ESS which the medical
record reviewers classified as contaminants 9 (75) were attributed to CoNS The
classification of episodes attributed to two or more cultures of CoNS but classified as
contaminants by medical record reviewers was based on information available in the
131
medical record In theory clinical criteria identify patients with a greater chance of
bacteremia in whom a positive culture result has a higher positive predictive value
however in practice it is unknown how useful these clinical criteria are for recognizing
CoNS (65) Tokars et al has suggested that the CDCrsquos definition of bloodstream infection
as applied to CoNS should be revised to exclude clinical signs and symptoms because their
diagnostic value is unknown and the positive predictive value when two or more culture
results are positive is high (65) This supports the definition of contaminants used in the
ESS but in particular that related to CoNS and suggests that it is likely that the ESS has
correctly classified episodes of bloodstream infection attributed to CoNS
Of all the CoNS isolated in the CHR population in 2007 852 (833) were
contaminants with the remaining isolates being associated with incident bloodstream
infections The populationshybased speciesshyspecific incidence of CoNS in 2007 was 952 per
100000 adult population and accounted for only 56 of all incident bloodstream
infections
Some microbiologists have used the number of culture bottles in one set that are
positive to determine the clinical significance of the isolate However recent data suggest
that this technique is flawed since the degree of overlap between one or two bottles
containing the isolate is so great that it is impossible to predict the clinical significance
based on this method (7) Usually a set of blood cultures involves one aerobic and one
anaerobic bottle in an attempt to optimize isolation of both aerobic and anaerobic
organisms Therefore it makes sense that if the growth of a given organism is more likely
in aerobic conditions than in anaerobic conditions an increased number of positive culture
bottles in a set that consists of one aerobic and one anaerobic bottle should not be used to
132
differentiate contamination from clinically significant cultures (9) In this study the ESS
classified common skin contaminants as causing true bloodstream infections when two or
more separate culture sets (by convention each set includes two bottles) were positive with
the common skin contaminant within a fiveshyday period and not based on whether only two
bottles in a single culture set contained the microshyorganism Simply requiring two positive
culture results for common contaminants led to a generally good classification of infection
in the ESS
Further to support this studies have suggested that the patterns of positivity of
blood cultures obtained in sequence can also aid in the interpretation of clinical
significance Specifically that the presence of only a single positive culture set obtained in
series strongly suggests that the positive result represents contamination when the isolate is
a common skin contaminant (7) For true bacteraemias multiple blood culture sets will
usually grow the same organism (9) Additionally since a finite percentage (3shy5) of blood
cultures are contaminated in the process of acquiring them routinely obtaining more than
three blood cultures per episode usually does not help distinguish between clinically
important and contaminant isolates (7 9)
Part of the ESSrsquos definition for classifying common skin contaminants entailed a
fiveshyday window between two cultures positive for common skin contaminants Definitions
for BSIs particularly those due to CVCs and to the contaminants listed by the NNIS do not
specify a time window between positive cultures to confirm the detection of a contaminant
or a BSI However Yokoe et al found that a similar rule for another positive blood culture
result within a fiveshyday window to classify common skin contaminants agreed (k=091)
with the NNIS definition (145)
133
Excluding all single positive blood culture results for skin contaminant organisms
from hospital surveillance can save time and may have little effect on results By efficiently
identifying and excluding those positive blood cultures most likely to be contaminants from
further analysis surveillance efforts can be concentrated on obtaining additional useful
clinical information from patients with true bloodstream infections
More importantly the misinterpretation of CoNS or other contaminants as
indicative of true BSI has implications for both patient care and hospital quality assurance
Regarding patient care unnecessary use of antimicrobials especially vancomycin raises
healthcare costs selects for antimicrobial resistant organisms and exposes the patient to
possible adverse drug effects (65) In terms of quality assurance monitoring BSIs
including cathetershyassociated BSIs has been recommended and practiced However the
commonly used definitions of BSIs may have limited capacity to exclude contaminants
resulting in inaccurate surveillance data and overestimating the role of CoNS and other
contaminants in bloodstream infections (65) Although the ESS overcalled the number of
infections due to CoNS the patients had multiple cultures of CoNS which may warrant
further clinical evaluation by infection control practitioners to confirm the presence of
infection
Review of the Location of Acquisition of Bloodstream Infections
Another important feature of the ESS is that the bloodstream infectionsrsquo location of
acquisition was defined as nososomial healthcareshyassociated communityshyonset or
communityshyacquired In the populationshybased analysis of incident bloodstream infections in
2007 24 were nosocomial 359 were healthcareshyassociated communityshyonset and 40
were communityshyacquired Other studies have found varying distribution of acquisition
134
mostly due to the difference in definitions used to classify incident BSIs as HCA (6 34 37
46 47) Nosocomial infections are typically acquired in a hospital setting and they are often
associated with a procedure or with medical instrumentation Communityshyacquired
infections presumably develop spontaneously without an association with a medical
intervention and occur in an environment with fewer resistance pressures (34) However
some infections are acquired under circumstances that do not readily allow for the infection
to be classified as belonging to either of these categories Such infections include infections
in patients with serious underlying diseases andor invasive devices receiving care at home
or in nursing homes or rehabilitation centres those undergoing haemodialysis or
chemotherapy in physiciansrsquo offices and those who frequently have contact with healthcare
services or recurrent hospital admissions (34) These infections have been attributed to
changes in healthcare systems which have shifted many healthcare services from hospitals
to nursing homes rehabilitation centres physiciansrsquo offices and other outpatient facilities
Although infections occurring in these settings are traditionally classified as communityshy
acquired in other surveillance systems evidence suggests that healthcareshyassociated
communityshyonset infections have a unique epidemiology the causative pathogens and their
susceptibility patterns the frequency of coshymorbid conditions the source of infection the
mortality rate at followshyup and the other related outcomes for these infections more closely
resemble those seen with nosocomial infections (6 37 46shy48) This has led to an increasing
recognition that the traditional binary classification of infections as either hospitalshyacquired
or communityshyacquired is insufficient (6 34 37 46shy49)
This ESS demonstrated a good overall agreement (855 k=078) in the
classification of acquisition when compared to the medical record review The majority of
135
discrepancies occurred in the classification of episodes as communityshyacquired by medical
record review but as healthcareshyassociated communityshyonset by the ESS The reason for the
ESSrsquos categorization was based on previous healthcare encounters recorded in the
administrative databases which the medical record reviewers did not identify or did not
classify as the same based on other clinical information in the patientrsquos chart During the
development of the ESS it was identified that many of these discrepancies were attributed
to the ESS not identifying patients who visited the Tom Baker Cancer Centre (TBCC) for
treatment of their active cancer As a post hoc revision ICDshy10shyCA codes were added for
active cancer to the ESS as a proxy for patients attending the TBCC and likely receiving
some form of cancer therapy Interestingly during this validation phase 32 (619) of
patients were classified as having a healthcareshyassociated communityshyonset BSI by the ESS
because it identified an ICDshy10shyCA code for active cancer but for which the medical
record reviewers classified as communityshyacquired For most cases (5 83) it was
identified in the chart that the patient had active cancer but whether they were receiving
outpatient therapy was not identified by the reviewers rendering a communityshyacquired
classification In this scenario the ESS may be viewed as performing better than medical
record review in identifying this unique group of individuals who likely have had a
significant amount of exposure to various healthcare settings with a diagnosis of cancer
A recent literature review conducted by Leal et al identified that ICDshy9 codes in
administrative databases have high pooled sensitivity (818) and pooled specificity
(992) for listing metastatic solid tumour but lower pooled sensitivity (558) and
pooled specificity (978) for listing any malignancy as defined by the Charlson coshy
morbidity index (140) Other studies that have evaluated the use of the tertiary
136
classification of infection acquisition have included ICDshy9 or ICDshy10 codes for active
cancer and pharmacyshybased databases to identify patients on immunosuppressive
medications (37 46 48) The addition of pharmacy data may have given these studies more
power to accurately identify patients at particular risk of infection in certain healthcare
settings This ESS was limited without the use of pharmacy data and therefore it may have
missed some healthcareshyassociated communityshyonset cases
When Friedman et al introduced the tertiary classification scheme for the
acquisition location of BSIs they suggested that patients with healthcareshyassociated
communityshyonset infections should be empirically treated more similarly to patients with
nosocomial infections (6) However Wunderlink et al suggested that this new
classification does not appear to be clinically helpful for empirical antimicrobial decisions
as suggested and there is a lack of clear treatment recommendations for this group of
patients (149) The reason for this is that there still exists a variable population within the
groups classified under the healthcareshyassociated communityshyonset definition each with
different risk profiles for bloodstream infection Another major problem pointed out by
Wunderlink et al was that the majority of bacteraemia are secondary As such the
suspected site of infection clearly influences the spectrum of pathogens and consequently
the empirical antimicrobial choices In general the admitting physician does not know that
a patient has bacteraemia and therefore chooses antimicrobials based on the suspected site
of infection (149) For example MRSA is suggested to be a more important issue in
healthcareshyassociated bacteraemia than in communityshyacquired pneumonia and this makes
sense when a large percentage of the HCA patient population may have indwelling CVCs
or were receiving wound care But to extrapolate these data to ambulatory nursing home
137
patients with pneumonia and misclassify them (because they fall within the same HCA
category) may lead to inappropriate antibiotic use such as overly aggressive broadershy
spectrum antimicrobials with possible adverse consequences (47 149) Despite the
potential misclassification of patients within the HCA category there still exists a
continuous shift in healthcare services being provided outside the acute care centre which
clearly introduces patients to a higher risk of exposure to infection when compared with
communityshybased patients This has led to the observation that traditional infection control
practices aimed at decreasing hospitalshyacquired infection need to be extended to all
healthcare facilities because healthcareshyassociated infections occur in diverse settings and
not only during inpatient stays Also patients using many of the outpatient healthcare
services never truly return to the community but only cycle from these outpatient care
centres back to either the hospital or the ICU (46 48 150)
The application of a tertiary definition for the acquisition location of incident BSIs
in this ESS will prove to be a valuable adjunct to the body of knowledge on this issue
Conducting continuous surveillance on these infections will provide insight to their
occurrence and the levels of risk associated with them Where this is really important is in
tracking infections over time If hospitalshybased infection control programs continue to use
the traditional definitions one may see gradually decreasing rates of nosocomial disease
because an increasing number of patients are being treated as outpatients Concomitantly
however communityshyacquired infections would increase By classifying bloodstream
infections into the three locations of acquisition the total number of BSIs would be the
same if overall rates remain unchanged
138
Review of the Source of True Bloodstream Infection
During the development phase of the ESS BSIs were not distinguished between
primary and secondary (or focal source) episodes of infection however an exploratory
evaluation of the source of episodes of BSI was included in this validation study
as a secondary objective The agreement between the ESS and the medical record reviewers
was low (447 k=011) in identifying primary versus secondary BSIs and therefore
considered inaccurate for the application of assessing the source of BSIs The medical
record reviewers classified 81 of true BSIs as secondary whereas the ESS classified only
29 Defining secondary episodes of infection usually involves clinical evidence from
direct observation of the infection site or review of other sources of data such as patient
charts diagnostic studies or clinical judgment which the ESS does not include The
identification of secondary BSIs by the medical record reviewers were mostly (66) based
on clinical information physician diagnosis or radiographic reports and not by a positive
culture of the same pathogen at another body site The identification of these infections by
the ESS would be based solely on the recovery of pathogens from different infection sites
Although the ESS did not perform well in identifying the source of infection medical
record or patient review do not always perform well in this classification either
Systematic studies have shown that despite the best efforts of clinicians the source
of bacteraemia or fungemia cannot be determined in oneshyquarter to oneshythird of patients (9
151) Also of the identifiable ones only 25 were confirmed by localized clinical findings
while another 32 were cultureshyproven Further investigation is required to determine
optimal data sources or methodologies to improve the classification of the sources of BSI in
this ESS This limitation hinders the ESSrsquos application in determining primary BSIs
139
specifically if deviceshyassociated and the ability to accurately determine outcome and
severity of primary or secondary BSIs
Validity and Reliability
The ESS is designed to identify and include first blood isolates per 365 days only if
the pathogen isolated is a known pathogenic organism or if there are two or more common
skin contaminants isolated from blood cultures that are within five days from each other
The algorithms used therefore further classify only BSI and not blood culture
contamination solely based on microbiologic laboratory data The medical record review
entailed reviewing patient medical records during the admission related to each BSI or
contamination Therefore the medical record review identified episodes of both BSI and
contamination whereas the ESS only had episodes of BSI The initial step in the
comparison entailed identifying the total episodes in the medical record review which had a
corresponding first blood isolate per 365 days classified in the ESS for which further
comparisons could be made The medical record reviewers classified 313 true bloodstream
infections which the ESS identified 304 concordant incident episodes of BSI for a close to
perfect agreement (97) between the two Additionally the ESS had an overall good
agreement and kappa score (κ=078) for classifying the location of acquisition among the
concordant incident episodes of bloodstream infection Based on these findings the ESS
proved to have excellent data quality by utilizing case definitions that were accurate in
identifying incident episodes and their location of acquisition
The methodology employed which excluded single blood cultures of common
contaminants if they do not fall within a fiveshyday window of each other precluded
calculating criterion validity measures such as sensitivity specificity and positive and
140
negative predictive values These measures are often used to evaluate how well certain
methods of diagnoses identify a patientrsquos true health status The ESS sample consisted of
patients only with positive blood cultures that comprised true episodes of BSI whereas the
medical record sample evaluated these positive episodes to determine which BSIs were
true Assessing for validity would result in a high sensitivity based on these results since
the number of false negatives was low or close to null Additionally specificity the
proportion of negatives that would be correctly identified by the ESS would be extremely
low or close to null because the sample does not consist of patients with negative blood
cultures or those with less than two blood cultures of common skin contaminants The
methodology employed for comparing the ESS with the medical record review hindered the
ability to evaluate validity as these measures start to breakshydown due to the ESS excluding
the negative cases as a comparator group
Furthermore in order to assess the criterion validity of an electronic surveillance
system a gold standard that is accepted as a valid measure is required This is challenging
because there is no gold standard available to compare the ESS to since traditional manual
surveillance is highly subjective biased and inconsistent and therefore is not considered the
gold standard (152) However many studies have used traditional manual surveillance as
accepted proximate measures of a gold standard
When there is no gold standard the kappa statistic is commonly used to assess
agreement between two methods for estimating validity Reporting on the agreement and
the corresponding kappa statistics between the ESS and the medical record reviewers was
chosen for it was believed to be more appropriate as it can apply to studies that compare
two alternative categorization schemes (ie ESS versus manual record review) (153)
141
Additionally the consequence of summarizing a 3x3 table into one number as in
this study ultimately resulted in the loss of information As a result the table of
frequencies were provided in this study and the discrepancies between the two methods of
classification were described for readers to comprehend the basis for the resulting
agreement and kappa statistic
The ambiguity of Landis and Kochrsquos translation of kappa values to qualitative
categories further supports the decision to focus primarily on a descriptive analysis of the
discrepancies rather than solely reporting on a single estimate of agreement By doing so
future studies attempting to revise and evaluate the ESS can formulate changes to improve
the algorithms based on the discrepancies observed between the ESS and the medical
record review Since the medical record review was not considered a true gold standard the
discrepancies observed can also be used to improve current traditional methodologies for
surveillance
As noted since no true gold standard exists it becomes difficult to evaluate two
approaches using real world data and therefore there is a need to assess the tradeshyoff
between reliability and validity using these two methods Objective criteria from the
electronic data are easily automated and will result in greater reliability since the
information is reproducible and consistent In contrast it may not be as accurate in
estimating ldquotruerdquo infection rates (ie sensitive) because it draws its decisions from a smaller
pool of data and are less selective However the ESS did accurately classify true episodes
of bloodstream infection based on its algorithm and when these infections were reviewed
by the medical record reviewers
142
Population Based Studies on Bloodstream Infections
As hypothesized the ESS performed very well in both the determination of incident
episodes of BSI and in the location of acquisition of the incident BSIs As a direct result
the ESS can be used by researchers infection prevention and control and quality
improvement personnel to evaluate trends in the occurrence of bloodstream infections in
various different healthcare settings at the population level rather than in select groups of
individuals The data presented in the ESS allows for the populationshylevel speciesshyspecific
and overall incidence of BSIs the evaluation of the average risk of BSI among groups of
individuals exposed to different healthcare settings that pose different risks for BSI and it
can potentially be used by infection prevention and control as a trigger to quickly identify
and investigate the potential sources of the BSIs such as from another body cavity or from
a CVC
Conducting populationshybased surveillance of bloodstream infections has the added
advantage of having a representative sample to carry out unbiased evaluations of relations
not only of confounders to exposures and outcomes but also among any other variables of
interest Despite this few researchers or academic groups have performed populationshybased
evaluations of BSIs particularly among some of the most common pathogens implicated in
BSIs
This study identified that E coli and MSSA had the highest speciesshyspecific
incidence among adults in the Calgary area contributing to the high overall incidence of
BSIs (1561 per 100000 population) In the same region Laupland et al conducted
populationshybased surveillance for E coli between 2000 and 2006 specifically to describe
its incidence risk factors for and outcomes associated with E coli bacteraemia (154)
143
During that period the overall annual population incidence was 303 per 100000
population This study has found that the annual incidence of E coli in the CHR has
increased to 380 per 100000 population The distribution of location acquisition has also
changed between Laupland et alrsquos study and this evaluation In 2007 the proportion of E
coli acquired in the community decreased to 48 (176363) compared to the 53 that was
averaged over their sevenshyyear study (154) Concomitantly there was an increase in the
proportion of healthcareshyassociated communityshyonset BSIs in the CHR in 2007 (132363
36) compared to 32 in their seven year study (154) Other studies have also
demonstrated that E coli is more commonly acquired in the community than in other
healthcare settings (155 156)
Although not formerly evaluated in the populationshybased analysis E coli has been
found to be the most common pathogen associated with urinary tract infections and the
subsequent development of E coli bacteraemia in other studies Two studies by AlshyHasan
et al identified that urinary tract infection was the most common primary source of
infection (798 749 respectively) (155 156) In the comparison component of this
study the ESS also identified that E coli was the most common pathogen (750)
implicated in BSIs related to urinary tract infections
Methicillinshysusceptible S aureus had a speciesshyspecific incidence of 208 per
100000 population among adults in the CHR in 2007 Atrouni et al conducted a
retrospective population based cohort from 1998 to 2005 in Olmsted County Minnesota
and have seen an increase in the overall incidence of S aureus bacteraemia from 46 per
100000 in 1998shy1999 to 70 per 100000 in 2004shy2005 (157) The incidence in the Calgary
area was substantially lower than that of this population
144
Similarly there was a nonshynegligible difference between their and this study in the
proportion of S aureus bacteraemia acquired as healthcareshyassociated communityshyonset
(587 vs 207 respectively) and as community acquired (178 vs 102
respectively) (157) Their definition for healthcareshyassociated communityshyonset
bacteraemia was the same as that applied in this study
Further research is required to evaluate both speciesshyspecific and overall incidence
of BSIs risk factors associated with BSIs and various outcomes attributed to BSIs
particularly at the population level
Limitations
Although this study design is believed to be rigorous there are a number of
limitations that merit discussion
The ESS combines laboratory and administrative databases However the
numeration of incident episodes of BSI is initially and primarily based on the laboratory
information system Surveillance systems that primarily employ laboratory systems for the
identification of bloodstream infections may be subject to biases that may have a harmful
effect The type of bias of greatest consideration in this study is selection bias
Selection bias as a result of selective testing by clinicians may be difficult to
address in electronic surveillance systems however the ESS contained laboratory
information that is populationshybased in that the regional laboratory performs virtually all of
the blood cultures for the community physiciansrsquo offices emergency departments nursing
homes and hospitals in the region and therefore sampling was not performed which
reduced the potential for selection bias
145
Another form of selection bias occurs when reporting of BSIs is based out of single
institutions often being at or affiliated with medical schools Reports from these sites may
suggest that BSIs are more likely generated in large urban hospitals During the
development phase of the ESS only incident BSIs that presented to the three main urban
adult acute care centres in the Calgary Health Region were evaluated suggesting that the
above selection bias was likely to have resulted in a misinterpretation in the overall
estimates in the number of incident BSIs However the methodology used in this validation
study was improved by evaluating episodes of BSI that presented at any acute care centre in
the CHR including those in urban and rural locations Although the number of incident
BSIs in the rural centres was low in comparison to the number of incident BSIs in the urban
centres this still reduced the potential for selection bias The fact that the laboratory is a
centralized laboratory that serves the entire population in the CHR in processing blood
cultures and other microbiologic data allows for standardized methods employed among all
blood culture specimens Furthermore there is a representative balance between teaching
and district general hospitals and the population served by the laboratory is geographically
demographically and socioshyeconomically representative of the whole CHR population
which reduces sources of bias inherent in routine data
Defining recurrent relapsing or new incident episodes of BSI is similarly
challenging in any surveillance program The ESS used the very conservative definition of
an incident episode of BSI only the first episode of BSI due to a given species per patient
per year The medical record review integrated all available clinical data and microbiologic
data to define an episode However although the latter method is presumably more
accurate it should not be viewed as a gold standard because it did not include a detailed
146
typing method to establish whether new episodes were recurrences (ie same isolate) or
truly new infections (ie new isolate) (143)
The selection bias implicit in including duplicate isolates is that clinicians may
selectively collect more specimens from certain patients particularly if the patient is
infected with antibioticshyresistant organisms compared to patients without such organisms
Excluding duplicate isolates would remove this selection bias and would prevent the
overestimation of the speciesshyspecific incidence of BSIs Despite the difference in
classifying independent episodes of BSI between the ESS and the medical record review
the data on true episodes of BSI were very similar to data obtained by medical record
review by the use of the ESS definition for episodes of true bloodstream infection
Information bias can occur in laboratory based surveillance however since the
laboratory used for this studyrsquos surveillance is a centralized populationshybased laboratory
with regular quality audits and improvements variability in techniques and potential for
misclassification has been avoided
Confounding bias may also be present in epidemiological analyses of data obtained
from this ESS because there was no evaluation on the accuracy of the ESSrsquos administrative
database source for identifying coshymorbid conditions Implications for the use of inaccurate
databases include inaccurate estimation of rates of specific disease and procedural
outcomes false classification of cases and controls where diagnosis is used to determine
this designation and inadequate adjustment for coshymorbidity or severity of illness leading to
inaccurate riskshyoutcome associations
Other limitations in this study include the fact that it was retrospective and therefore
the medical record review was limited to clinical information that was previously
147
documented However most surveillance programs are retrospective in design (158) A
prospective assessment may have led to some differences in the classification of episodes
by medical record review Furthermore retrospective medical review is not frequently
employed by infection control practitioners in their identification of bloodstream and other
infections but rather they conduct prospective review of potential cases By not conducting
prospective review of medical records or by comparing the ESS to current infection
prevention and control practices this study is limited in describing the ESSrsquos accuracy in
conducting realshytime or nearshytoshyrealshytime surveillance Despite this the prospective
evaluation of healthcareshyassociated infections by infection control professionals was shown
to have large discrepancies poor accuracy and consistency when compared with
retrospective chart review and laboratory review as the gold standard (152)
Secondly this study only includes adults however if further investigations of our
ESS prove to be successful and accurate then future investigations may be designed to
develop a system that includes infants and children in surveillance The ESS already has the
potential to identify all positive blood cultures among all residents in the Calgary Health
Region including children however validation and accuracy studies need to be conducted
to ensure episodes of BSIs and their location of acquisition are correctly classified in this
particular population
Thirdly medical record reviews were conducted concurrently by a trained research
assistant and an infectious diseases physician Ideally two or more teams or reviewers with
an assessment of agreement between them would have been preferred Additionally further
assessments of intershyrater reliability between a trained medical record reviewer and an
infection control professional would have been an adjunct to the evaluation of current
148
surveillance methodologies employed by our regionrsquos infection prevention and control
departments
Fourthly the linked databases only provided surveillance data on BSIs not on other
infections This system has the potential to be further developed to evaluate other sources
of infection determined by positive laboratory test results However based on this analysis
the ESS did not perform well in classifying primary versus secondary bloodstream
infections when using laboratory based data alone Improvement in the identification of
other infectious diseases may be accomplished by the introduction of automated pharmacy
or prescription data diagnosis codes from the administrative data source andor electronic
radiographic reports As mentioned above diagnosis codes have already been introduced
into the ESS but not formally evaluated and further investigation is required to determine
the accessibility and feasibility of acquiring automated pharmacy data
Fifthly there was no attempt to determine the rate of nosocomial deviceshyassociated
BSIs or to determine qualitatively why they may have occurred As part of a national and
international emphasis on improving healthcare quality rates of healthcareshyassociated
infection have been proposed as quality measures for intershyhospital comparisons (159)
Centralshyvenous cathetershyassociated BSI rates are a good measure of a hospitalrsquos infection
control practices because these infections may be preventable (159)
Electronic rules or algorithms that detect central lines with a high positive
predictive value could be used to generate a list of patients as candidates for infection
prevention interventions such as review of dressing quality More recent studies evaluating
automated surveillance systems have focused on determining their accuracy in determining
both numerator (ie number of deviceshyassociated BSIs) and denominator (deviceshydays)
149
data For rate calculations many programs utilize numerators (infections) as defined by the
NNIS and deviceshydays are used as denominators to adjust for differences between patient
populations of various hospital practices Device days are often collected daily manually
by infection control professionals or a designated member of the nursing unit and then
tabulated into multiple time intervals (160) This methodology has the potential for errors
that can skew rates and the human ability to accurately detect significant increases or
decreases in infection rates is impaired (160)
Woeltje et al used an automated surveillance system consisting of different
combinations of dichotomous rules for BSIs (125) These rules included positive blood
cultures with pathogenic organisms and true BSI by common skin contaminants if the same
pathogen was isolated within five days from the previous culture secondary BSIs based on
positive cultures at another body site data on centralshyvascular catheter use from automated
nursing documentation system vancomycin therapy and temperature at the time of blood
culture collection They found that the best algorithm had a high negative predictive value
(992) and specificity (68) based on rules that identified nosocomial infections central
venous catheter use nonshycommon skin contaminants and the identification of common skin
contaminants in two or more cultures within a fiveshyday period from each other (125)
Other studies have focused on evaluating the automation of deviceshydays and
compared it with manual chart review A study by Wright et al (2009) found that use of an
electronic medical record with fields to document invasive devices had high sensitivity and
specificity when compared with the chart review and resulted in a reduction by 142 hours
per year for collecting denominator data in the intensive care units (160) Hota et al
developed prediction algorithms to determine the presence of a central vascular catheter in
150
hospitalized patients with the use of data present in an electronic health record (159) They
found that models that incorporated ICDshy9 codes patient demographics duration of
intensive care stay laboratory data pharmacy data and radiological data were highly
accurate and precise and predicted deviceshyuse within five percent of the daily observed rate
by manual identification They also found that denominators resulting from their prediction
models when used to calculate the incidence of central lineshyassociated BSIs yielded similar
rates to those yielded by the manual approaches (159)
This ESS currently does not include information on the use of devices which may
have put patients at risk of bloodstream infections The ESS classified episodes of BSI as
primary or secondary based on microbiological data alone and those episodes classified as
primary may be further investigated to determine if they were associated with a central line
or another device However further improvement is required in the basic identification of
primary or secondary BSIs in the ESS This further limits the ability to evaluate infection
control practices and the impact of changes in practice on the incidence of infection which
are the main objectives of surveillance
Implications
Surveillance of BSI is important for measuring and monitoring the burden of
disease evaluating risk factors for acquisition monitoring temporal trends in occurrence
identifying emerging and reshyemerging infections with changing severity (50 78 79) As
part of an overall prevention and control strategy the Centers for Disease Control and
Preventionrsquos Healthcare Infection Control Practices Advisory Committee recommend
ongoing surveillance of BSIs Traditional surveillance methods for BSI typically involve
manual review and integration of clinical data from the medical record clinical laboratory
151
and pharmacy data by trained infection control professionals This approach is timeshy
consuming and costly and focuses infection control resources on counting rather than
preventing infections (3) Nevertheless manual infection surveillance methods remain the
principal means of surveillance in most jurisdictions (5)
With the increasing use and availability of electronic data on patients in healthcare
institutions and community settings the potential for automated surveillance has been
increasingly realized (3 161 162) Administrative and laboratory data may be linked for
streamlined data collection of patient admission demographic and diagnostic information
as well as microbiologic details such as species distribution and resistance rates The
collection of information in the ESS is a valuable source for researchers conducting
retrospective observational analysis on the populationshybased incidence trends of BSIs in the
CHR over time the speciesshyspecific incidence of BSIs and the location of acquisition of
incident episodes of BSI
The use of automated electronic surveillance has further implications for infection
prevention and control and healthcare quality improvement Hospital acquired infections
are potentially preventable and have been recognized by the Institute for Healthcare
Improvement as a major safetyquality of care issue in acute care institutions The Alberta
Quality Matrix for Health has six dimensions of quality one of these is Safety with the goal
of mitigating risks to avoid unintended or harmful results which is reflected in reducing the
risk of health service organizationshyacquired infections
Establishing the occurrence and determinants of bloodstream infections is critica to
devising means to reduce their adverse impact Traditionally infection prevention and
control programs have conducted focused surveillance for these infections by caseshybyshycase
152
healthcare professional review However such surveillance has major limitations largely as
a result of the human resources required Conventional surveillance has therefore typically
not been able to be routinely performed outside acute care institutions or comprehensively
include all cases in hospitals in a timely fashion The increasing availability and quality of
electronic patient information has suggested that a new approach to infectious diseases
surveillance may be possible
Many long term care facilities do not have a dedicated infection control professional
to conduct surveillance and lead prevention education and intervention programs
Furthermore with reduced access to laboratory facilities and diagnostic testing in these
settings patients may not be evaluated for infection when they are symptomatic but rather
antimicrobial drugs may be initiated on an empiric basis (163) The CHR has a centralized
laboratory service that conducts blood culture testing for all nursing home and long term
care facilities in the region therefore physicians at these sites should not feel hindered in
collecting blood cultures due to unavailable laboratory services However the data in the
ESS provides insight into the distribution of pathogens that occur in long term care
facilities which can facilitate the development of prevention education and intervention
programs by infection control professionals dedicated to long term care facilities
Similarly few home healthcare providers have dedicated infection control
professionals and no uniform definitions of infection or protocols for infection surveillance
have been agreed upon (163)
Often healthcare delivery in the home is uncontrolled and may even be provided by
family members The identification of BSIs in these settings based on the acquisition
location algorithm in the ESS may provide a better understanding of the distribution of
153
pathogens and the incidence of BSIs originating from this healthcare service Initially
infection control practitioners may be able to target specific education programs to the
home care providers on the proper insertion and maintenance of healthcare devices and
focus efforts on preventing high risk exposures
Finally infection control in outpatient and ambulatory settings have challenges in
determining which infections to conduct surveillance on to whom the data will be reported
who will be responsible for implementing changes what populations are being seen or
what procedures are being performed This ESS is capable of identifying blood cultures
collected at these settings however some of the discrepancies in the location of acquisition
were due to the ESS being unable to identify that the patient had a procedure conducted in
an outpatient setting Despite the small number of discrepancies the ESS may initially be
able to contribute information on the overall incidence of BSIs in these settings Reporting
on infection rates to outpatient and ambulatory care will be useful for improving education
programs for healthcare workers at these sites and quality of patient care (163) As
healthcare is increasingly provided in many of these outpatient settings infection control
professionals will need to ensure that infection control education programs reach these
healthcare personnel and that active surveillance systems for detection of BSIs reach these
areas (164) By expanding epidemiological programs through the continuum of care new
prevention opportunities are opened for reducing the risk of nosocomial infections by
reducing both the patientrsquos susceptibility and risk of exposure (165) It may become
particularly important to prevent further spread of antimicrobial resistance between nursing
homes and acute care hospitals as well as within the community (165) Furthermore
expansion beyond the hospital will help improve inshyhospital care through improved data
154
upon which to base assessments (165) This ESS can provide the framework and
foundational insight to the understanding of BSIs likely to be acquired in these settings as
well as the likelihood of hospitalization supporting the importance of the new healthcareshy
associated communityshyonset acquisition category Access to a rapidly available and valid
surveillance system is an essential tool needed to reduce the impact of bloodstream
infections Such a system will be important for the detection of outbreaks and for tracking
of disease over time as a complementary tool for infection control professionals
The overall incidence of bloodstream infections and rate of antibiotic resistant
organisms may be used as measures of quality of care and as outcome measures for quality
improvement initiatives Basic concepts of continuous quality improvement (CQI) are
closely related to the same methods long practiced in epidemiology by infection control
professionals (166) Surveillance strategies used in successful infection control programs
are identical to those stressed in quality improvement ndash elements include the establishment
of continuous monitoring systems planned assessment and statistical process control
techniques (166 167) There needs to be a link between the collection of data and
continuous improvement strategies so that caregivers can improve the quality of care
Quality indicators such as nosocomial infection rates must be reliable and reproducible
An impediment to the reliability may be based on the medical model itself such that data
collection staff often defer to the opinions of clinicians about the presence or absence of an
infection rather than simply to determine whether case definitions are met (167) This
inclination to make decisions on a caseshybyshycase basis is consistent with the medical model
of individualized care and the peershyreview process but not with the epidemiological model
of populationshybased analyses (167) Clear distinctions between case definitions for
155
surveillance purposes and case definitions for clinical diagnoses and treatment are crucial
This ESS which has been proven to be reliable offers the potential to act as an important
source for quality indicator information in the form of nosocomial and healthcareshy
associated communityshyonset incidence rates Furthermore like other automated
surveillance systems the ESS consistently and objectively applied definitions for
accurately identifying true episodes of bloodstream infection and the location they were
acquired The ultimate goal is a system to regularly report these outcomes as quality of care
indicators
Because these electronic data are usually routinely collected for other primary
purposes electronic surveillance systems may be developed and implemented with
potentially minimal incremental expense (5) Furuno et al did not identify a single study
that assessed the costs or costshyeffectiveness of an automated surveillance system (168)
However they identified two studies that used economic analyses to assess infection
control interventions that used an informatics component In particular one study assessed
the costshyeffectiveness of using handheld computers and computershybased surveillance
compared with traditional surveillance to identify urinary tract infections among patients
with urinary catheters They found that if surveillance was conducted on five units the
savings by the automated surveillance system was estimated at $147 815 compared with
traditional surveillance over a fourshyyear period (168) Despite the lack of evidence
supporting the decreased cost by employing automated surveillance systems intuitively
the use of previously developed automated systems for infectious disease surveillance
would result in a costshysavings for and timeshyreduction in traditional infection prevention and
control
156
Future Directions
Inclusion of ICDshy9 and ICDshy10 Codes to the ESS Algorithm
Aggregate coshymorbidity measures in infectious disease research may be used in
three ways First they are used in caseshycontrol and cohort studies to determine the risk
factors for colonization or infection Often the coshymorbidity measure represents important
risk factors but also an important confounding variable for which adjustment is required
Second coshymorbidity measures are utilized in prediction rules to predict colonization or
infection Coshymorbidity measures are used in real time as part of infection control
interventions such as identifying patients for isolation or surveillance cultures (140) Only a
single study has compared the prognostic value of Charlson Coshymorbidity Index measures
for predicting the acquisition of nosocomial infections Their administrative data predicted
nosocomial infections better compared with singleshyday chart review In this study the
singleshyday review data were generated based on information documented at the initial stage
of hospitalization which may be incompletely documented in the chart compared with
administrative data generated after discharge therefore consisting of richer data for its
predictive ability (140) The use of ICDshy9 codes to calculate the Charlson Coshymorbidity
Index based on discharge data may be inappropriate to use in realshytime infection control
intervention or epidemiological studies as some coshymorbidities may have developed after
infection has occurred It may also be inappropriate in cases where patients are observed for
only one admission where patients have no previous admissions or where there are long
time periods between admissions making it difficult to facilitate evaluation of previous
hospitalizations (140) A third aspect is in the use of adjustment for mortality length of
157
stay and disability outcomes associated with coshymorbidity for infectious disease rate
comparisons across healthcare centres
Despite the fact that this validation study did not evaluate the accuracy of ICDshy9
and ICDshy10 codes for the identification of coshymorbid conditions the ESSrsquos administrative
data source lists each patientrsquos diagnosis codes for the admission related to the incident BSI
and those related to previous admissions dating back to 2001Therefore there is potential
for evaluating the accuracy in these codes in identifying potential risk factors for BSI
thereby improving future epidemiological research activities
Evaluation of Antimicrobial Resistance
The problem of antimicrobial resistance has snowballed into a serious public health
concern with economic social and political implications that are global in scope and cross
all environmental and ethnic boundaries (169) Antimicrobial resistance also results in
adverse consequences internationally challenging the ability of countries to control
diseases of major public health interest and to contain increasing costs of antimicrobial
therapy (170) At the individual patient level antimicrobial resistance may lead to failed
therapy and antibiotic toxicity as a result of restricted choices or failure of safer first or
second line therapies increased hospitalization the requirement for invasive interventions
increased morbidity and even death (170)
Studies have demonstrated adverse health outcomes in patients with antibioticshy
resistant organisms with higher morbidity and mortality rates and length of hospital stay
than similar infections with antibioticshysusceptible strains (171 172) The magnitude and
severity of these outcomes may vary based on the causative organism the site of isolation
158
antimicrobial resistance patterns the mechanism of resistance and patient characteristics
(172)
Quantifying the effect of antimicrobial resistance on clinical outcomes will facilitate
an understanding and approach to controlling the development and spread of antimicrobial
resistance Surveillance systems that identify resistant strains of pathogens in hospital
community and healthcareshyassociated communityshyonset settings provide key information
for effectively managing patient care and prescribing practices (173)
Knowledge about the occurrence of antibioticshyresistant pathogens and the
implications of resistance for patient outcomes may prompt hospitals and healthcare
providers to establish and support initiatives to prevent such infections Surveillance
systems that identify susceptibility data on pathogens can be used to convince healthcare
providers to follow guidelines concerning isolation and to make rational choices about the
use of antimicrobial agents Furthermore susceptibility data can guide infection control
practitioners and surveillance system managers to track and prevent the spread of
antimicrobialshyresistant organisms (171)
Although this study did not evaluate antimicrobial susceptibility of organisms the
laboratory information system used in the ESS routinely collects susceptibility data on
organisms cultured from blood As a result future studies involving the use of the ESS can
make a significant contribution to the knowledge on trends of resistant organisms and to the
efforts to reduce antimicrobial resistance through programs of antimicrobial stewardship
159
CONCLUSION
In summary surveillance data obtained with the ESS which used existing data from
regional databases agreed closely with data obtained by manual medical record review In
particular it performed very well in the identification of incident episodes of BSI and the
location of acquisition of the incident episodes of BSI In contrast it did not agree well
with medical record review in identifying the focal body sites as potential sources of the
BSIs It was chosen to report agreement measures in the form of kappa statistics and to
describe the discrepancies in categorization between the ESS and the medical record
review Despite the limitations observed and described the ESS has and can continue to
have important implications for observational research infection prevention and control
and healthcare quality improvement The applicability of the ESS to other health systems is
dependent on the types of databases that information is stored in the ability to link distinct
databases into a relational database and the quality of the data and the linkage Because it
relies on basic variables that should be available to many other health systems it is
expected that the ESS can be applied elsewhere
160
BIBLIOGRAPHY
1 Jansson A Arneborn M Ekdahl K Sensitivity of the Swedish statutory surveillance
system for communicable diseases 1998shy2002 assessed by the captureshyrecapture method
Epidemiol Infect 2005 Jun133(3)401shy7
2 Madsen KM Schonheyder HC Kristensen B Nielsen GL Sorensen HT Can
hospital discharge diagnosis be used for surveillance of bacteremia A data quality study of
a Danish hospital discharge registry Infect Control Hosp Epidemiol 1998 Mar19(3)175shy
80
3 Trick WE Zagorski BM Tokars JI Vernon MO Welbel SF Wisniewski MF et al
Computer algorithms to detect bloodstream infections Emerg Infect Dis 2004
Sep10(9)1612shy20
4 Wright MO Perencevich EN Novak C Hebden JN Standiford HC Harris AD
Preliminary assessment of an automated surveillance system for infection control Infect
Control Hosp Epidemiol 2004 Apr25(4)325shy32
5 Leal J Laupland KB Validity of electronic surveillance systems a systematic
review J Hosp Infect 2008 Jul69(3)220shy9
6 Friedman ND Kaye KS Stout JE McGarry SA Trivette SL Briggs JP et al
Health careshyshyassociated bloodstream infections in adults a reason to change the accepted
definition of communityshyacquired infections Ann Intern Med 2002 Nov 19137(10)791shy7
7 Reimer LG Wilson ML Weinstein MP Update on detection of bacteremia and
fungemia Clin Microbiol Rev 1997 Jul10(3)444shy65
8 Ferguson KL Brown L Bacteremia and Sepsis Emergency Medicine Clinics of
North America 1996 01shyFebshy199614(1)185shy95
161
9 Hall KK Lyman JA Updated review of blood culture contamination Clin
Microbiol Infect 200619(4)788shy802
10 Vincent JL Martinez EO Silva E Evolving concepts in sepsis definitions Crit
Care Clin 2009 Oct25(4)665shy75 vii
11 Garner JS Jarvis WR Emori TG Horan TC Hughes JM CDC definitions for
nosocomial infections 1988 Am J Infect Control 1988 Jun16(3)128shy40
12 Bone RC Lets agree on terminology definitions of sepsis Crit Care Med 1991
Jul19(7)973shy6
13 Calandra T Cohen J The international sepsis forum consensus conference on
definitions of infection in the intensive care unit Crit Care Med 2005 Jul33(7)1538shy48
14 Laupland KB Davies HD Kellner JD Luzod NL Karan T Ma D et al Predictors
and outcome of admission for invasive Streptococcus pneumoniae infections at a Canadian
childrens hospital Clin Infect Dis 1998 Sep27(3)597shy602
15 Laupland KB Gregson DB Church DL Ross T Elsayed S Invasive Candida
species infections a 5 year populationshybased assessment J Antimicrob Chemother 2005
Sep56(3)532shy7
16 Laupland KB Davies HD Church DL Louie TJ Dool JS Zygun DA et al
Bloodstream infectionshyassociated sepsis and septic shock in critically ill adults a
populationshybased study Infection 2004 Apr32(2)59shy64
17 Magadia RR Weinstein MP Laboratory Diagnosis of Bacteremia and Fungemia
Infect Dis Clin North Am 200115(4)1009shy24
18 Laupland KB Zygun DA Davies HD Church DL Louie TJ Doig CJ Populationshy
based assessment of intensive care unitshyacquired bloodstream infections in adults
162
Incidence risk factors and associated mortality rate Crit Care Med 2002
Nov30(11)2462shy7
19 Pittet D Davis CS Li N Wenzel RP Identifying the hospitalized patient at risk for
nosocomial bloodstream infection a populationshybased study Proc Assoc Am Physicians
1997 Jan109(1)58shy67
20 Endimiani A Tamborini A Luzzaro F Lombardi G Toniolo A A twoshyyear
analysis of risk factors and outcome in patients with bloodstream infection Jpn J Infect Dis
2003 Feb56(1)1shy7
21 Pedersen G Schoenheyder HC Sorensen HT Source of infection and other factors
associated with case fatality in communityshyacquired bacteremia shy a Danish populationshy
based cohort study from 1992 to 1997 Clin microbiol Infect 20039793shy802
22 Pittet D Li N Wenzel RP Association of Secondary and Polymicrobial
Nosocomial Bloodstream Infections with Higher Mortality Eur J Clin Microbiol Infect Dis
199312(11)813shy19
23 Lopez Dupla M Martinez JA Vidal F Almela M Lopez J Marco F et al Clinical
characterization of breakthrough bacteraemia a survey of 392 episodes Journal of Internal
Medicine 2005258172shy80
24 Buckingham SC Brown SP San Joaquin VH Breakthrough bacteremia and
meningitis during treatment with cephalosporins parenterally for pneumococcal pneumonia
J Pediatr 1998132174shy6
25 Kelley MA Weber DJ Gilligan P Cohen MS Breakthrough Pneumococcal
Bacteremia in Patients Being Treated with Azithromycin and Clarithromycin Clin Infect
Dis 2000311008shy11
163
26 Krcmery V Jr Spanik S Mrazova M Trupl J Grausova S Grey E et al
Bacteremias caused by Escherichia coli in cancer patients shy analysis of 65 episodes Int J
Infect Dis 2002669shy73
27 Kumashi P Girgawy E Tarrand JJ Rolston KV Raad II Safdar A Streptococcus
pneumoniae Bacteremia in Patients with Cancer Disease Characteristics and Outcomes in
the Era of Escalating Drug Resistance (1998shy2002) Medicine 200584303shy12
28 Laupland KB Gregson DB Zygun DA Doig CJ Mortis G Church DL Severe
bloodstream infections a populationshybased assessment Crit Care Med 2004
Apr32(4)992shy7
29 AlshyRawajfah OM Stretzer F Hewitt JB Incidence of and Risk Factors for
Nosocomial Bloodstream Infections in Adults in the United States 2003 Infect Control
Hosp Epidemiol 200930(11)1036shy44
30 Pratikaki M Platsouka E Sotiropoulou C Vassilakopoulos T Paniara O Roussos
C et al Risk factors for and influence of bloodstream infections on mortality a 1shyyear
prospective study in a Greek intensiveshycare unit Epidemiol Infect 2009137727shy35
31 Parkins MD Gregson DB Pitout JD Ross T Laupland KB Populationshybased study
of the epidemiology and the risk factors for Pseudomonas aeruginosa bloodstream
infection Infection Feb38(1)25shy32
32 Maki DG Kluger DM Crnich CJ The risk of bloodstream infection in adults with
different intravascular devices a systematic review of 200 published prospective studies
Mayo Clin Proc 2006 Sep81(9)1159shy71
164
33 Laupland KB Gregson DB Flemons WW Hawkins D Ross T Church DL
Burden of communityshyonset bloodstream infection a populationshybased assessment
Epidemiol Infect 2007 Aug135(6)1037shy42
34 Valles J Calbo E Anoro E Fontanals D Xercavins M Espejo E et al Bloodstream
infections in adults importance of healthcareshyassociated infections J Infect 2008
Jan56(1)27shy34
35 Diekema DJ Beekmann SE Chapin KC Morel KA Munson E Doern GV
Epidemiology and outcome of nosocomial and communityshyonset bloodstream infection J
Clin Microbiol 2003 Aug41(8)3655shy60
36 Laupland KB Kortbeek JB Findlay C Hameed SM A populationshybased
assessment of major trauma in a large Canadian region Am J Surg 2005 May189(5)571shy
5 discussion 6
37 Lesens O Hansmann Y Brannigan E Hopkins S Meyer P OConnel B et al
Healthcareshyassociated Staphylococcus aureus bacteremia and the risk for methicillin
resistance is the Centers for Disease Control and Prevention definition for communityshy
acquired bacteremia still appropriate Infect Control Hosp Epidemiol 2005 Feb26(2)204shy
9
38 Horan TC Andrus M Dudeck MA CDCNHSN surveillance definition of health
careshyassociated infection and criteria for specific types of infections in the acute care
setting Am J Infect Control 2008 Jun36(5)309shy32
39 Laupland KB Bagshaw SM Gregson DB Kirkpatrick AW Ross T Church DL
Intensive care unitshyacquired urinary tract infections in a regional critical care system Crit
Care 2005 Apr9(2)R60shy5
165
40 Laupland KB Church DL Gregson DB Validation of a rapid diagnostic strategy
for determination of significant bacterial counts in bronchoalveolar lavage samples Arch
Pathol Lab Med 2005 Jan129(1)78shy81
41 Samore MH Evans RS Lassen A Gould P Lloyd J Gardner RM et al
Surveillance of medical deviceshyrelated hazards and adverse events in hospitalized patients
JAMA 2004 Jan 21291(3)325shy34
42 Laupland KB Church DL Gregson DB Evaluation of a rapid bacterial ATP assay
for screening BAL samples from ICU patients submitted for quantitative bacterial cultures
Diagn Microbiol Infect Dis 2003 Nov47(3)465shy9
43 Laupland KB Kirkpatrick AW Church DL Ross T Gregson DB Intensiveshycareshy
unitshyacquired bloodstream infections in a regional critically ill population J Hosp Infect
2004 Oct58(2)137shy45
44 Laupland K Gregson DB Kirkpatrick AW Kortbeek JB Zygun DA Findlay C et
al Bloodstream infection complicating trauma Clin Invest Med 2004 Oct27(5)253shy8
45 Laupland KB Lee H Gregson DB Manns BJ Cost of intensive care unitshyacquired
bloodstream infections J Hosp Infect 2006 Jun63(2)124shy32
46 Shorr AF Tabak YP Killian AD Gupta V Liu LZ Kollef MH Healthcareshy
associated bloodstream infection A distinct entity Insights from a large US database
Crit Care Med 2006 Oct34(10)2588shy95
47 Johannes RS Epidemiology of earlyshyonset bloodstream infection and implications
for treatment Am J Infect Control 2008 Dec36(10)S171 e13shy7
166
48 Kollef MH Shorr A Tabak YP Gupta V Liu LZ Johannes RS Epidemiology and
outcomes of healthshycareshyassociated pneumonia results from a large US database of cultureshy
positive pneumonia Chest 2005 Dec128(6)3854shy62
49 Lujan M Gallego M Rello J Healthcareshyassociated infections A useful concept
Current Opinion in Critical Care 200915419shy24
50 Laupland KB Ross T Church DL Gregson DB Populationshybased surveillance of
invasive pyogenic streptococcal infection in a large Canadian region Clin Microbiol Infect
2006 Mar12(3)224shy30
51 Angus DC Pereira CA Silva E Epidemiology of severe sepsis around the world
Endocr Metab Immune Disord Drug Targets 2006 Jun6(2)207shy12
52 Laupland KB Church DL Mucenski M Sutherland LR Davies HD Populationshy
based study of the epidemiology of and the risk factors for invasive Staphylococcus aureus
infections J Infect Dis 2003 May 1187(9)1452shy9
53 Laupland KB Church DL Gregson DB Blood cultures in ambulatory outpatients
BMC Infect Dis 20055(1)35
54 Laupland KB Zygun DA Doig CJ Bagshaw SM Svenson LW Fick GH Oneshyyear
mortality of bloodstream infectionshyassociated sepsis and septic shock among patients
presenting to a regional critical care system Intensive Care Med 2005 Feb31(2)213shy9
55 Weinstein MP Towns ML Quartey SM Mirrett S Reimer LG Parmigiani G et al
The clinical significance of positive blood cultures in the 1990s a prospective
comprehensive evaluation of the microbiology epidemiology and outcome of bacteremia
and fungemia in adults Clin Infect Dis 1997 Apr24(4)584shy602
167
56 Bryan CS Clinical implications of positive blood cultures Clin Microbiol Rev 1989
Oct2(4)329shy53
57 Weinstein MP Current blood culture methods and systems clinical concepts
technology and interpretation of results Clin Infect Dis 1996 Jul23(1)40shy6
58 Lee A Mirrett S Reller LB Weinstein MP Detection of Bloodstream Infections in
Adults How Many Blood Cultures are Needed J Clin Microbiol 200745(11)3546shy48
59 Weinstein MP Blood Culture Contamination Persisting Problems and Partial
Progress J Clin Microbiol [Minireview] 200341(6)2275shy78
60 Gaynes R Surveillance of antibiotic resistance learning to live with bias Infect
Control Hosp Epidemiol 1995 Nov16(11)623shy6
61 Laupland KB Populationshybased epidemiology of intensive care critical importance
of ascertainment of residency status Crit Care 2004 Dec8(6)R431shy6
62 Garner JS Jarvis WR Emori TG Horan TC Hughes JM CDC definitions for
nosocomial infections In Olmsted RN editor APIC infection control and applied
epidemiology principles and practice St Louis Mosby 1996 p Ashy1 shy Ashy20
63 Souvenir D Anderson DE Jr Palpant S Mroch H Askin S Anderson J et al
Blood cultures positive for coagulaseshynegative staphylococci antisepsis pseudobacteremia
and therapy of patients J Clin Microbiol 1998 Jul36(7)1923shy6
64 Beekmann SE Diekema DJ Doern GV Determining the Clinical Significance of
CoagulaseshyNegative Staphylococci Isolated from Blood Cultures Infect Control Hosp
Epidemiol 200526559shy66
168
65 Tokars JI Predictive value of blood cultures positive for coagulaseshynegative
staphylococci implications for patient care and health care quality assurance Clin Infect
Dis 2004 Aug 139(3)333shy41
66 Weinstein MP Murphy JR Reller LB Lichtenstein KA The clinical significance of
positive blood cultures a comprehensive analysis of 500 episodes of bacteremia and
fungemia in adults II Clinical observations with special reference to factors influencing
prognosis Rev Infect Dis 1983 JanshyFeb5(1)54shy70
67 Cockerill FR Wilson JW Vetter EA Optimal testing parameters for blood cultures
Clin INfect Dis 200438(1724shy30)
68 Weinstein MP Reller LB Remarks Concerning Testing Parameters for Blood
Cultures Clin Infect Dis [Correspondence] 200540202
69 Bates DW Lee TH Rapid classification of positive blood cultures Prospective
validation of a multivariate algorithm JAMA 1992 Apr 8267(14)1962shy6
70 Stefani S Diagnostic techniques in bloodstream infections where are we going Int
J Antimicrob Agents 200934SS9shyS12
71 Peters RPH van Agtmael MA Danner SA Savelkoul PHM Vandenbrouckeshy
Grauls CM New developments in the diagnosis of bloodstream infections Lancet Infect
Dis 20044
72 Rothman KJ Greenland S Lash TL Modern epidemiology 3rd ed Philadelphia
Lippincott Williams amp Wilkins 2008
73 Thacker SB Stroup DF Future directions for comprehensive public health
surveillance and health information systems in the United States Am J Epidemiol 1994 Sep
1140(5)383shy97
169
74 Langmuir AD The surveillance of communicable diseases of national importance
N Engl J Med 1963 Jan 24268182shy92
75 Declich S Carter AO Public health surveillance historical origins methods and
evaluation Bull World Health Organ 199472(2)285shy304
76 Nelson KE Williams CM Graham NMH Infectious disease epidemiology theory
and practice Gaithersburg Md Aspen 2001
77 Buehler JW Hopkins RS Overhage JM Sosin DM Tong V Framework for
evaluating public health surveillance systems for early detection of outbreaks
recommendations from the CDC Working Group MMWR Recomm Rep 2004 May
753(RRshy5)1shy11
78 German RR Lee LM Horan JM Milstein RL Pertowski CA Waller MN Updated
guidelines for evaluating public health surveillance systems recommendations from the
Guidelines Working Group MMWR Recomm Rep 2001 Jul 2750(RRshy13)1shy35 quiz CE1shy
7
79 Davies HD McGeer A Schwartz B Green K Cann D Simor AE et al Invasive
group A streptococcal infections in Ontario Canada Ontario Group A Streptococcal Study
Group N Engl J Med 1996 Aug 22335(8)547shy54
80 Mayhall CG Hospital epidemiology and infection control 3rd ed Philadelphia
Lippincott Williams amp Wilkins 2004
81 Division of STD Prevention National Center for HIVAIDS Viral Hepatitis STD
and TB Prevention Methods of Surveillance Atlanta Centers for Disease Control and
Prevention 2007 [cited 2010 Oct 10 ]
170
82 Losos JZ Routine and sentinel surveillance methods Eastern Mediterranean Health
Journal 19962(1)46shy50
83 Public Health Agency of Canada Case Definitions for Communicable Diseases
under National Surveillance Supplement Health Canada2009 November 2009
84 Bettinger JA Scheifele DW Kellner JD Halperin SA Vaudry W Law B et al The
effect of routine vaccination on invasive pneumococcal infections in Canadian children
Immunization Monitoring Program Active 2000shy2007 Vaccine Feb 2528(9)2130shy6
85 Public Health Agency of Canada Canada H VancomycinshyResistant Enterococci
(VRE) Surveillance [PDF] Ottawa2007 [cited 2010 Available from httpwwwphacshy
aspcgccanoisshysinpprojectspdfvre_protocol_epdf
86 Boyd D Gardam M Gravel D Hope K Hutchinson J Kelly S et al Ongoing
Surveillance for Clostridium difficile associated diarrhea (CDAD) within AcuteshyCare
Institutions [PDF] Ottawa2007 Available from httpwwwphacshyaspcgccanoisshy
sinpprojectspdfcdad07_protocol_epdf
87 Henning KJ Overview of Syndromic Surveillance What is Syndromic
Surveillance MMWR Morb Mortal Wkly Rep [serial on the Internet] 2004 53 (Suppl)
88 May L Chretien JP Pavlin JA Beyond traditional surveillance applying syndromic
surveillance to developing settings shy opportunities and challenges BMC Public Health
20099242shy53
89 Moore KM Edgar BL McGuinness D Implementation of an automated realshytime
public health surveillance system linking emergency departments and health units rationale
and methodology CJEM 200810(2)114shy9
171
90 Betancourt JA Hakre S Polyak CS Pavlin JA Evaluation of ICDshy9 codes for
syndromic surveillance in the electronic surveillance system for the early notification of
communityshybased epidemics Mil Med 2007 Apr172(4)346shy52
91 Flamand C Larrieu S Couvy F Jouves B Josseran L Filleul L Validation of a
syndromic surveillance system using a general practitioner house calls network Bordeaux
France Euro Surveill 2008 Jun 1913(25)
92 Hripcsak G Soulakis ND Li L Morrison FP Lai AM Friedman C et al
Syndromic surveillance using ambulatory electronic health records J Am Med Inform
Assoc 2009 MayshyJun16(3)354shy61
93 Hulth A Rydevik G Linde A Web queries as a source for syndromic surveillance
PLoS One 20094(2)e4378
94 Sloane PD MacFarquhar JK SickbertshyBennett E Mitchell CM Akers R Weber
DJ et al Syndromic surveillance for emerging infections in office practice using billing
data Ann Fam Med 2006 JulshyAug4(4)351shy8
95 van den Wijngaard C van Asten L van Pelt W Nagelkerke NJ Verheij R de
Neeling AJ et al Validation of syndromic surveillance for respiratory pathogen activity
Emerg Infect Dis 2008 Jun14(6)917shy25
96 Canada PHAo Surveillance [homepage on the Internet] Ottawa Government of
Canada 2009 [updated 2009shy11shy30 cited 2009 05shy25] Available from httpwwwphacshy
aspcgccanoisshysinpsurvprogshyengphp
97 Bowling A Research methods in health investigating health and health services
3rd ed Maidenhead Berkshire England New York NY McGraw HillOpen University
Press 2009
172
98 Brenner H Kliebsch U Dependence of weighted kappa coefficients on the number
of categories Epidemiology 1996 Mar7(2)199shy202
99 Hoehler FK Bias and prevalence effects on kappa viewed in terms of sensitivity
and specificity J Clin Epidemiol 2000 May53(5)499shy503
100 Vach W The dependence of Cohens kappa on the prevalence does not matter J
Clin Epidemiol 2005 Jul58(7)655shy61
101 Vergison A Tuerlinckx D Verhaegen J Malfroot A Epidemiologic features of
invasive pneumococcal disease in Belgian children passive surveillance is not enough
Pediatrics 2006 Sep118(3)e801shy9
102 Lorian V The need for surveillance for antimicrobial resistance Infect Control
Hosp Epidemiol 1995 Nov16(11)638shy41
103 Paul SM Finelli L Crane GL Spitalny KC A statewide surveillance system for
antimicrobialshyresistant bacteria New Jersey Infect Control Hosp Epidemiol 1995
Jul16(7)385shy90
104 Laupland KB Ross T Pitout JD Church DL Gregson DB Investigation of sources
of potential bias in laboratory surveillance for antishymicrobial resistance Clin Invest Med
200730(4)E159shy66
105 Kumar D Humar A Plevneshi A Green K Prasad GV Siegal D et al Invasive
pneumococcal disease in solid organ transplant recipientsshyshy10shyyear prospective population
surveillance Am J Transplant 2007 May7(5)1209shy14
106 Kellner JD Vanderkooi OG MacDonald J Church DL Tyrrell GJ Scheifele DW
Changing epidemiology of invasive pneumococcal disease in Canada 1998shy2007 update
173
from the Calgaryshyarea Streptococcus pneumoniae research (CASPER) study Clin Infect
Dis 2009 Jul 1549(2)205shy12
107 Powis J McGeer A Green K Vanderkooi O Weiss K Zhanel G et al In vitro
antimicrobial susceptibilities of Streptococcus pneumoniae clinical isolates obtained in
Canada in 2002 Antimicrob Agents Chemother 2004 Sep48(9)3305shy11
108 Daignault D Dore K Dutil L Irwin R Leger D Mann E et al Canadian Integrated
Program for Antimicrobial Resistance Surveillance (CIPARS) 2002working towards the
preservation of effective antimicrobials for humans and animals Ottawa Her Majesty the
Queen in Right of Canada represented by the Minister of Health Health Canada 2003
[cited 2010 September 24]
109 Simor AE OfnershyAgostini M Bryce E McGeer A Paton S Mulvey MR
Laboratory characterization of methicillinshyresistant Staphylococcus aureus in Canadian
hospitals results of 5 years of National Surveillance 1995shy1999 J Infect Dis 2002 Sep
1186(5)652shy60
110 Mulvey MR Bryce E Boyd DA OfnershyAgostini M Land AM Simor AE et al
Molecular characterization of cefoxitinshyresistant Escherichia coli from Canadian hospitals
Antimicrob Agents Chemother 2005 Jan49(1)358shy65
111 Zhanel GG DeCorby M Adam H Mulvey MR McCracken M LagaceshyWiens P et
al Prevalence of antimicrobialshyresistant pathogens in Canadian hospitals results of the
Canadian Ward Surveillance Study (CANWARD 2008) Antimicrob Agents Chemother
2010 Nov54(11)4684shy93
174
112 Schuchat A Hilger T Zell E Farley MM Reingold A Harrison L et al Active
bacterial core surveillance of the emerging infections program network Emerg Infect Dis
2001 JanshyFeb7(1)92shy9
113 National Center for Immunization and Respiratory Diseases Diseases DoB Active
Bacterial Core Surveillance (ABCs) [homepage on Internet] Atlanta Centres for Disease
Control and Prevention (CDC) [updated 2006shy08shy10 cited 2009 05shy25] Available from
httpwwwcdcgovabcsmethodologyindexhtml
114 Pfaller MA Jones RN Doern GV Kugler K Bacterial pathogens isolated from
patients with bloodstream infection frequencies of occurrence and antimicrobial
susceptibility patterns from the SENTRY antimicrobial surveillance program (United States
and Canada 1997) Antimicrob Agents Chemother 1998 Jul42(7)1762shy70
115 Emori TG Culver DH Horan TC Jarvis WR White JW Olson DR et al National
nosocomial infections surveillance system (NNIS) description of surveillance methods
Am J Infect Control 1991 Feb19(1)19shy35
116 Karadag B Karakoc F Ersu R Kut A Bakac S Dagli E Nonshycysticshyfibrosis
bronchiectasis in children a persisting problem in developing countries Respiration 2005
MayshyJun72(3)233shy8
117 Goldrick BA The practice of infection control and applied epidemiology a
historical perspective Am J Infect Control 2005 Nov33(9)493shy500
118 Haley RW Hooton TM Schoenfelder JR Crossley KB Quade D Stanley RC et
al Effect of an infection surveillance and control program on the accuracy of retrospective
chart review American journal of epidemiology 1980 May111(5)543shy55
175
119 Haley RW Schaberg DR McClish DK Quade D Crossley KB Culver DH et al
The accuracy of retrospective chart review in measuring nosocomial infection rates Results
of validation studies in pilot hospitals American journal of epidemiology 1980
May111(5)516shy33
120 Mulholland SG Creed J Dierauf LA Bruun JN Blakemore WS Analysis and
significance of nosocomial infection rates Ann Surg 1974 Dec180(6)827shy30
121 Burke JP Infection control shy a problem for patient safety N Engl J Med 2003 Feb
13348(7)651shy6
122 Tokars JI Richards C Andrus M Klevens M Curtis A Horan T et al The
changing face of surveillance for health careshyassociated infections Clin Infect Dis 2004
Nov 139(9)1347shy52
123 Gastmeier P Kampf G Hauer T Schlingmann J Schumacher M Daschner F et al
Experience with two validation methods in a prevalence survey on nosocomial infections
Infect Control Hosp Epidemiol 1998 Sep19(9)668shy73
124 Ehrenkranz NJ Shultz JM Richter EL Recorded criteria as a gold standard for
sensitivity and specificity estimates of surveillance of nosocomial infection a novel method
to measure job performance Infect Control Hosp Epidemiol 1995 Dec16(12)697shy702
125 Woeltje KF Butler AM Goris AJ Tutlam NT Doherty JA Westover MB et al
Automated surveillance for central lineshyassociated bloodstream infection in intensive care
units Infect Control Hosp Epidemiol 2008 Sep29(9)842shy6
126 Boslaugh S Secondary data sources for public health a practical guide Cambridge
New York Cambridge University Press 2007
176
127 Sorensen HT Sabroe S Olsen J A framework for evaluation of secondary data
sources for epidemiological research Int J Epidemiol 1996 Apr25(2)435shy42
128 Connell FA Diehr P Hart LG The use of large data bases in health care studies
Annu Rev Public Health 1987851shy74
129 Lewis D Antimicrobial resistance surveillance methods will depend on objectives
J Antimicrob Chemother 2002 Jan49(1)3shy5
130 Bax R Bywater R Cornaglia G Goossens H Hunter P Isham V et al Surveillance
of antimicrobial resistanceshyshywhat how and whither Clin Microbiol Infect 2001
Jun7(6)316shy25
131 Heginbothom ML Magee JT Bell JL Dunstan FD Howard AJ Hillier SL et al
Laboratory testing policies and their effects on routine surveillance of community
antimicrobial resistance J Antimicrob Chemother 2004 Jun53(6)1010shy7
132 Livermore DM Macgowan AP Wale MC Surveillance of antimicrobial resistance
Centralised surveys to validate routine data offer a practical approach BMJ 1998 Sep
5317(7159)614shy5
133 MacGowan AP Bowker KE Bennett PM Lovering AM Surveillance of
antimicrobial resistance Lancet 1998 Nov 28352(9142)1783
134 Magee JT Effects of duplicate and screening isolates on surveillance of community
and hospital antibiotic resistance J Antimicrob Chemother 2004 Jul54(1)155shy62
135 Shannon KP French GL Antibiotic resistance effect of different criteria for
classifying isolates as duplicates on apparent resistance frequencies J Antimicrob
Chemother 2002 Jan49(1)201shy4
177
136 Lee SO Cho YK Kim SY Lee ES Park SY Seo YH Comparison of trends of
resistance rates over 3 years calculated from results for all isolates and for the first isolate
of a given species from a patient J Clin Microbiol 2004 Oct42(10)4776shy9
137 Sahm DF Marsilio MK Piazza G Antimicrobial resistance in key bloodstream
bacterial isolates electronic surveillance with the Surveillance Network DatabaseshyshyUSA
Clin Infect Dis 1999 Aug29(2)259shy63
138 Reacher MH Shah A Livermore DM Wale MC Graham C Johnson AP et al
Bacteraemia and antibiotic resistance of its pathogens reported in England and Wales
between 1990 and 1998 trend analysis BMJ (Clinical research ed ) 2000 Jan
22320(7229)213shy6
139 Tenover FC Tokars J Swenson J Paul S Spitalny K Jarvis W Ability of clinical
laboratories to detect antimicrobial agentshyresistant enterococci J Clin Microbiol 1993
Jul31(7)1695shy9
140 Leal JR Laupland KB Validity of ascertainment of coshymorbid illness using
administrative databases a systematic review Clinical Microbiology and Infection 2009In
press
141 Laupland KB Gill MJ Schenk L Goodwin D Davies HD Outpatient parenteral
antibiotic therapy evolution of the Calgary adult home parenteral therapy program Clin
Invest Med 2002 Oct25(5)185shy90
142 Manns BJ Mortis GP Taub KJ McLaughlin K Donaldson C Ghali WA The
Southern Alberta Renal Program database a prototype for patient management and
research initiatives Clin Invest Med 2001 Aug24(4)164shy70
178
143 Leal J Gregson DB Ross T Flemons WW Church DL Laupland KB
Development of a novel electronic surveillance system for monitoring of bloodstream
infections Infect Control Hosp Epidemiol 2010 Jul31(7)740shy7
144 Quan H Sundararajan V Halfon P Fong A Burnand B Luthi JC et al Coding
algorithms for defining comorbidities in ICDshy9shyCM and ICDshy10 administrative data Med
Care 2005 Nov43(11)1130shy9
145 Yokoe DS Anderson J Chambers R Connor M Finberg R Hopkins C et al
Simplified surveillance for nosocomial bloodstream infections Infect Control Hosp
Epidemiol 1998 Sep19(9)657shy60
146 Pokorny L Rovira A MartinshyBaranera M Gimeno C AlonsoshyTarres C Vilarasau J
Automatic detection of patients with nosocomial infection by a computershybased
surveillance system a validation study in a general hospital Infect Control Hosp Epidemiol
2006 May27(5)500shy3
147 Leth RA Moller JK Surveillance of hospitalshyacquired infections based on
electronic hospital registries J Hosp Infect 2006 Jan62(1)71shy9
148 Tan LK Lacey S Mandalia S Melzer M Hospitalshybased study of viridans
streptococcal bacteraemia in children and adults J Infect 2008 Feb56(2)103shy7
149 Wunderink RG Healthcareshyassociated bacteremia Stirring the mud Crit Care Med
2006 Oct34(10)2685shy6
150 Klompas M Yokoe DS Automated surveillance of health careshyassociated
infections Clin Infect Dis 2009 May 148(9)1268shy75
179
151 Anthony RM Brown TJ French GL Rapid diagnosis of bacteremia by universal
amplification of 23S ribosomal DNA followed by hybridization to an oligonucleotide array
J Clin Microbiol 2000 Feb38(2)781shy8
152 McBryde ES Brett J Russo PL Worth LJ Bull AL Richards MJ Validation of
statewide surveillance system data on central lineshyassociated bloodstream infection in
intensive care units in Australia Infect Control Hosp Epidemiol 2009 Nov30(11)1045shy9
153 Altman DG editor Practical Statistics for Medical Research London Chapman amp
Hall 1991
154 Laupland KB Gregson DB Church DL Ross T Pitout JD Incidence risk factors
and outcomes of Escherichia coli bloodstream infections in a large Canadian region Clin
Microbiol Infect 2008 Nov14(11)1041shy7
155 AlshyHasan MN Lahr BD EckelshyPassow JE Baddour LM Antimicrobial resistance
trends of Escherichia coli bloodstream isolates a populationshybased study 1998shy2007 J
Antimicrob Chemother 2009 Jul64(1)169shy74
156 AlshyHasan MN EckelshyPassow JE Baddour LM Bacteremia complicating gramshy
negative urinary tract infections a populationshybased study J Infect 2010 Apr60(4)278shy85
157 El Atrouni WI Knoll BM Lahr BD EckelshyPassow JE Sia IG Baddour LM
Temporal trends in the incidence of Staphylococcus aureus bacteremia in Olmsted County
Minnesota 1998 to 2005 a populationshybased study Clin Infect Dis 2009 Dec
1549(12)e130shy8
158 Bellini C Petignat C Francioli P Wenger A Bille J Klopotov A et al Comparison
of automated strategies for surveillance of nosocomial bacteremia Infect Control Hosp
Epidemiol 2007 Sep28(9)1030shy5
180
159 Hota B Harting B Weinstein RA Lyles RD Bleasdale SC Trick W Electronic
algorithmic prediction of central vascular catheter use Infect Control Hosp Epidemiol
Jan31(1)4shy11
160 Wright MO Fisher A John M Reynolds K Peterson LR Robicsek A The
electronic medical record as a tool for infection surveillance successful automation of
deviceshydays Am J Infect Control 2009 Jun37(5)364shy70
161 Baker C Luce J Chenoweth C Friedman C Comparison of caseshyfinding
methodologies for endometritis after cesarean section Am J Infect Control 1995
Feb23(1)27shy33
162 Wurtz R Cameron BJ Electronic laboratory reporting for the infectious diseases
physician and clinical microbiologist Clin Infect Dis 2005 Jun 140(11)1638shy43
163 Jarvis WR Infection control and changing healthshycare delivery systems Emerg
Infect Dis 2001 MarshyApr7(2)170shy3
164 Jarvis WR The evolving world of healthcareshyassociated bloodstream infection
surveillance and prevention is your system as good as you think Infect Control Hosp
Epidemiol 2002 May23(5)236shy8
165 Scheckler WE Brimhall D Buck AS Farr BM Friedman C Garibaldi RA et al
Requirements for infrastructure and essential activities of infection control and
epidemiology in hospitals a consensus panel report Society for Healthcare Epidemiology
of America Infect Control Hosp Epidemiol 1998 Feb19(2)114shy24
166 Brewer JH Gasser CS The affinity between continuous quality improvement and
epidemic surveillance Infect Control Hosp Epidemiol 1993 Feb14(2)95shy8
181
167 Nosocomial infection rates for interhospital comparison limitations and possible
solutions A Report from the National Nosocomial Infections Surveillance (NNIS) System
Infect Control Hosp Epidemiol 1991 Oct12(10)609shy21
168 Furuno JP Schweizer ML McGregor JC Perencevich EN Economics of infection
control surveillance technology costshyeffective or just cost Am J Infect Control 2008
Apr36(3 Suppl)S12shy7
169 Leidl P Report on Infectious Diseases Overcoming Antimicrobial Resistance
Geneva World Health Organization 2000 Available from httpwwwwhointinfectiousshy
diseaseshyreportindexhtml
170 Masterton RG Surveillance studies how can they help the management of
infection J Antimicrob Chemother 2000 Aug46 Suppl B53shy8
171 Lode HM Clinical impact of antibioticshyresistant Gramshypositive pathogens Clin
Microbiol Infect 2009 Mar15(3)212shy7
172 Cosgrove SE Kaye KS Eliopoulous GM Carmeli Y Health and economic
outcomes of the emergence of thirdshygeneration cephalosporin resistance in Enterobacter
species Arch Intern Med 2002 Jan 28162(2)185shy90
173 Conly J Antimicrobial resistance in Canada CMAJ 2002 Oct 15167(8)885shy91
182
APPENDIX A ADMINISTRATIVE DATABASE FIELD DESCRIPTIONS
Admission_Data_NosoInfcmdb
There are six tables in Admission_Data_NosoInfcmdb Inpatient_Admissions has all cases
identified by PHNs from CLS Related diagnosis information is in table
Inpatient_diagnosis The two tables can be linked by field cdr_key Emergency day
procedure and renal clinic visits are in separated tables Diagnosis_Reference is reference
table for both ICD9 and ICD10 diagnosis codes
Following are the definitions for some of the data fields
Table Inpatient Admissions
[Field Name] CDR_Key
[Definition] System generated number that is used to uniquely identify an inpatient
discharge Each patient visit (the period from admit to discharge) is assigned a unique
CDR_KEY when inpatient records are loaded from Health Records CDR_KEY is the
foreign key in various other tables in the repository and is used to link to these tables for
further visit information
[Valid Responses] Number not null no duplicate values
[Field Name] Admit Category
[Definition] Categorization of the patient at admission
[Valid Responses]
As of 01shyAPRshy2002
L = Elective
U = UrgentEmergent
N = Newborn
183
S = Stillborn
R = Cadaveric donor
Cannot be null
Prior to 01shyAPRshy2002
E = Emergent
L = Elective
U = Urgent
Null = NewbornStillborn
[Field Name] Exit Alive Code
[Definition] The disposition status of the patient when they leave the hospital
[Valid Responses]
As of 01shyAPRshy2002
01 shy Transfer to another acute care hospital
02 shy Transfer to a long term care facility
03 shy Transfer to other care facility
04 shy Discharge to home with support services
05 shy Discharged home
06 shy Signed out
07 shy Died expired
08 shy Cadaver donor admitted for organ tissue removal
09 shy Stillbirth
Prior to 01shyAPRshy2002
D shy Discharge
184
S shy Signed Out
Null shy Death
[Field Name] Regional Health Authority (RHA)
[Definition] For Alberta residents the RHA is a 2 character code that identifies the health
region the patient lives in For outshyofshyprovince patients the RHA identifies the province
they are from RHA is determined based on postal code or residence name if postal code is
not available RHA is not available RHA in the table is current regional health authority
boundary
[Valid Responses]
01shy Chinook
02shy Palliser
03shy Calgary
04shy David Thompson
05shy East Central
06shy Capital Health
07shy Aspen
08shy Mistahia
09shy Northern Lights
Provincial Abbreviations ABshy Alberta BCshy British Columbia MBshy Manitoba NBshy New
Brunswick NLshy Newfoundland NTshy Northwest Territories NSshy Nova Scotia ONshy
Ontario OCshyout of Country PEshy Prince Edward Island QEshy Quebec QCshy Quebec City
SKshy Saskatchewan USshyUSA YKshy Yukon Territories 99shyUnknown
Lookup in CDREFRHA
185
Provincial abbreviations as above except NFshy Newfoundland
[Field Name] Institution From
[Definition] The institution from number is used when a patient is transferred from
another health care facility for further treatment or hospitalization The first digit identifies
the level of care followed by the threeshydigit Alberta institution number of the sending
institution
[Valid Responses]
First digit = Level of care
0shy Acute acute psychiatric
1shy S Day Surg (Discontinued Mar 31 1997)
2shy Organized OP Clinic (Discontinued Mar 31 1997)
3shy ER (Discontinued Mar 31 1997)
4shy General rehab (Glenrose Hospital)
5shy Non acute Psychiatric
6shy Long term care
7shy Nursing Home intermediatepersonal care (when Institution Number is available)
(Added Apr 1 1997)
8shy Ambulatory Care organized outpatient department (Added Apr 1 1997)
9shy SubshyAcute
Last 3 digits = Alberta Health Institution
001shy916 Or the following generic codes
995shy Nursing Homelong term care facility
996shy Unclassified and Unkown Health Inst (97shy98 Addendum Hospice)
186
997shy Home Care
998shy Senior Citizens Lodge
999shy Out of Province or Country Acute Care
[Historical Background]
FMCshy did not begin collection of 9997 until October 1997
BVC PLC shy did not collect 1 or 2
BVC or PLC shy collected 3 transfers from Emergency to opposite site (94shy95)
[Field Name] Length of Stay in Days
[Definition] The number of days a patient has been registered as an inpatient
[Valid Responses] Whole number 1 day or greater
[Field Name] Site
[Definition] Three character site identifier
[Valid Responses]
ACH shy Alberta Childrens Hospital
BVC shy Bow Valley Centre Calgary General Hospital (closed June 1997)
FMC shy Foothills Hospital
HCH shy Holy Cross Hospital (closed March 1996)
PLC shy Peter Lougheed Centre Calgary General Hospital
RGH shy Rockyview Hospital
SAG shy Salvation Army Grace Hospital (closed November 1995)
CBA shy Crossbow Auxiliary (officially April 1 2001 closed 30shyJUNshy2004)
GPA shy Glenmore Park Auxiliary (officially April 1 2001)
VFA shy Dr Vernon Fanning Auxiliary (officially April 1 2001)
187
May not be null
Table Inpatient_Diagnosis
[Field Name] Diagnosis Code
[Definition] ICDshy9shyCMICDshy10shyCA diagnosis codes as assigned by Health Records to
classify the disease and health problems to explain the reasons the patient is in hospital
This field should be used in combination with diagnosis_type diagnosis_sequence and
diagnosis_prefix for complete diagnosis information
[Valid Responses] Cannot be null
01shyAPRshy2002 to current
ICDshy10shyCA codes (decimal places removed)
Prior to 01shyAPRshy2002
ICDshy9shyCM codes (decimal places removed)
Lookup ICDshy9shyCMICDshy10shyCA codes reference table The inpatient discharge date must
fall between VALID_FROM and VALID_TO dates for valid diagnosis codes
[Field Name] Diagnosis Prefix
[Definition] An alpha character that has been assigned to further distinguish ICD
diagnosis for study purposes
[Valid Responses]
CHR Valid Responses
Q = Questionable or query diagnoses
E = External cause of injury codes (discontinued 01shyAPRshy2002 as it is available in the
diagnosis code)
[Historical Background]
188
Site specific alphanumeric prefixes prior to 01shyAPRshy1998
PLC
ICD9CM Code 7708
A shy Apnea is documented
ICD9CM Code 7718
A shy Sepsis is confirmed
B shy Sepsis is presumed
ICD9CM Code 7730
A shy Intrauterine transfusion was performed
ICD9CM Code 7798
A shy Hypotonia present on discharge
B shy Hypertonia present on discharge
D shy Cardiac Failure
F shy Shock
Patient Service 59 and subservice 974
A shy Planned hospital birth
B shy Planned home birth w admit to hospital
Grace
A shy Type I CINVAI
RGHHCH
P shy Palliative
[Field Name] Diagnosis Sequence
189
[Definition] This field is a system assigned sequential number that when combined with
CDR_KEY uniquely identifies diagnoses for an inpatient discharge The most responsible
diagnosis is always sequence 1
[Valid Responses] Cannot be null
01shyAPRshy2002 to current shy number from 1 shy50
Prior to 01shyAPRshy2002 shy number from 1shy16
Cannot be null
[Historical Background]
Prior to 01shyAPRshy1998
shy ACH diagnosis sequences of 1 have a null diagnosis type
shy Diagnosis sequence 14 was used for the transfer diagnosis at all adult sites As a result
records may have an outshyofshysequence diagnosis (for example diagnosis sequences 1 2 then
14)
[Edit Checks Business Rules]
Diagnosis Sequence number 1 = Most responsible diagnosis
Every inpatient discharge must have a diagnosis sequence 1
[Field Name] Diagnosis Type
[Definition] The diagnosis type is a oneshydigit code used to indicate the relationship of the
diagnosis to the patients stay in hospital
HDM field name DxInfoDxType
[Valid Responses]
01shyAPRshy2002 to current (CHR valid responses)
(See ICD 10 CA Data Dictionary for full definition of types)
190
M = Most responsible diagnosis (MRDx) M diagnosis types should have a
diagnosis_sequence of 1 Exception Prior to 01shyAPRshy1998 ACH diagnosis sequence of 1
have null diagnosis types
1 = Preshyadmit comorbidity shy A diagnosis or condition that existed preshyadmission
2 = Postshyadmit comorbidity shy A diagnosis or condition that arises postshyadmission If a postshy
admit comorbidity results in being the MRDx it is recorded as the MRDx and repeated as a
diagnosis Type 2
3 = Secondary diagnosis shy A diagnosis or condition for which a patient may or may not
have received treatment
9 = An external cause of injury code
0 = Newborn born via caesarean section
0 = Optional shy Diagnosis type 0 can be used for purposes other than babies born via cshy
section Review diagnosis code to distinguish type 0
W X Y = Service transfer diagnoses (Added 01shyAPRshy2002)
W shy diagnosis associated with the first service transfer
X shy diagnosis associated with the second service transfer
Y shy diagnosis associated with the third service transfer
[Historical Background]
94shy95 Addendum
5shy8 shy Hospital Assigned
FMC 0 = All Newborns with a most responsible diagnosis of V 30
Grace 2 = Complication and 6 = V code for NB
Prior to 01shyAPRshy1998
191
shy ACH diagnosis sequence of 1 have null diagnosis types
shy Adult sites diagnosis type is null when a transfer diagnosis is entered in diagnosis
sequence 14
As of DECshy2002
Use of Diagnosis Type 3 on Newborn visits (Service 54) was discontinued All secondary
diagnoses on the newborn visit (previously typed as a 3) now have the diagnosis type of 0
[Edit Checks Business Rules]
M diagnosis types should have a diagnosis_sequence of 1 with the exception of ACH prior
to 01shyAPRshy1998 ACH diagnosis sequence of 1 have null diagnosis types
Table Emergency_Visits
Day_Procedure_Visits
Renal_Clinics_Visits
[Field Name] ABSTRACT_TSEQ
[Definition] System assigned number which uniquely identifies the record
[Field Name] Institution From
[Definition] Originating institution Institution number that is used when a patient is
transferred from another health care facility for further treatment or hospitalization
[Field Name] Visit Disposition
[Definition] Identifies the disposition (outcome) of the registration The disposition is a
one digit code which identifies the service recipients type of separation from the
ambulatory care service
1 Discharged shyvisit concluded
192
2 Discharged from program or clinic shy will not return for further care (This refers only to
the last visit of a service recipient discharged from a treatment program at which heshe has
been seen for repeat services)
3 Left against medical advice
4 Service recipient admitted as an inpatient to Critical Care Unit or OR in own facility
5 Service recipient admitted as an inpatient to other area in own facility
6 Service recipient transferred to another acute care facility (includes psychiatric rehab
oncology and pediatric facilities)
7 DAA shy Service recipient expired in ambulatory care service
8 DOA shy Service recipient dead on arrival to ambulatory care service
9 Left without being seen (Not seen by a care provider Discontinued April 1 2001 as per
Alberta Health These patients will now be assigned Disposition Code 3 shy Left Against
Medical Advice with a Most Responsible Diagnosis of V642 shy Surgical or Other Procedure
Not Carried Out Because of Patients Decision)
193
APPENDIX B MEDICAL RECORD REVIEW FORM
A Demographics
Patient____________ Date of Birth _______________ Episode _________
Yy mm dd (complete new form for each episode)
Initials____________ Gender F M City of Residence______________________
B Bloodstream Infection vs Contamination (List all isolates in the table ndash only for first episode)
Culture Infected (I) or Contaminant ( C)
Etiology Comment
(For this episode diagnosis) First date _______________ First Time (24 hr) ____ ____ Polymicrobial Y N
Yy mm dd
Does the patient have Fever Y N Chills Y N Hypotension Y N
Comments
C Acquisition (Circle one of)
1 Y N No evidence infection was present or incubating at the hospital admission Nosocomial unless related to previous hospital admission
194
2 Healthshycare associated
Y N First culture obtained lt48 hours of admission and at least one of
Y N IV antibiotic therapy or specialized care at home other than oxygen within the prior 30 days before bloodstream infection
Y N Attended a hospital or hemodialysis clinic or IV chemotherapy within the prior 30 days before bloodstream infection
Y N Admitted to hospital for 2 or more days within the prior 90 days before bloodstream infection
Y N Resident of nursing home or long term care facility
3 Community Acquired
Y N Bloodstream infections not fulfilling criteria for either nosocomial or healthcare associated
D Focality of Infection (Circle one of)
1 Primary
Y N Bloodstream infection is not related to infection at another site other than intravascular device associated
2 Secondary
Y N Bloodstream infection is related to infection at another body site (other than intravascular device) as determined on the basis of all available clinical radiographic and laboratory evidence
E Sites of Secondary Infections (Check off all that apply)
Major Code Specific Site Code
Culture Confirmed
UTI Y N SSI Y N SST Y N PNEU Y N BSI Y N BJ Y N CNS Y N CVS Y N EENT Y N GI Y N LRI Y N REPR Y N SYS Y N
195
Comment
F Course and Outcome
Admission Date yy mm dd
Admission Time (24 Hr)
Discharge Date yy mm dd
Discharge Time (24 Hr)
Location (ED Ward ICU)
Discharge Status (Circle one) Alive Deceased
196
APPENDIX C KAPPA CALCULATIONS
Measuring Observed Agreement
Observed agreement is the sum of values along the diagonal of the frequency 3x3
table divided by the table total
Measuring Expected Agreement
The expected frequency in a cell of a frequency 3x3 table is the product of the total
of the relevant column and the total of the relevant row divided by the table total
Measuring the Index of Agreement Kappa
Kappa has a maximum agreement of 100 so the agreement is a proportion of the
possible scope for doing better than chance which is 1 ndash Pe
Calculating the Standard Error
197
APPENDIX D ORGANISMS WITH INCIDENCE OF LESS THAN 1 PER 100000
ADULT POPULATION FROM TABLE 51
The following organisms had a speciesshyspecific incidence of less than 1 per 100000
adult population and were classified as ldquoOtherrdquo in Table 51 Abiotrophia spp
Acinetobacter baumanni Acinetobacter lwoffi Actinomyces spp Aerobic gram positive
bacilli Aerococcus spp Aerococcus urinae Aerococcus viridans Aeromonas spp
Alcaligenes faecalis Anaerobic gram negative bacilli Anaerobic gram negative cocci
Bacteroides fragilis Bacteroides spp Bacteroides ureolyticus Bacteroides ureolyticus
group Candida famata Candida krusei Candida lusitaniae Candida parapsilosis
Candida tropicalis Capnocytophaga spp Citrobacter braakii Citrobacter freundii
complex Citrobacter koseri (diversus) Clostridium cadaveris Clostridium clostridiiforme
Clostridium perfringens Clostridium ramosum Clostridium spp Clostridium symbiosum
Clostridium tertium Corynebacterium sp Coryneform bacilli Eggerthella lenta Eikenella
corrodens Enterobacter aerogenes Enterococcus casseliflavus Enterococcus spp
Fusobacterium necrophorum Fusobacterium nucleatum Fusobacterium spp Gram
positive bacilli resembling lactobacillus Gram positive cocci resembling Staphylococcus
Gram negative bacilli Gram negative cocci Gram negative enteric bacilli Gram positive
bacilli Gram positive bacilli not Clostridium perfringens Granulicatella adiacens
Streptococcus dysgalactiae subsp equisimilis Haemophilus influenzae Type B
Haemophilus influenzae Klebsiella ozaenae Klebsiella spp Listeria monocytogenes
Morganella morganii Mycobacterium spp Neisseria meningitidis Nocardia farcinica
Pleomorphic gram positive bacilli Porphyromonas spp Prevotella spp Proteus vulgaris
group Providencia rettgeri Pseudomonas spp Raoul ornithinolytica Salmonella
198
enteritidis Salmonella oranienburg Salmonella paratyphi A Salmonella spp Salmonella
spp Group B Salmonella spp Group C1 Salmonella typhi Serratian marcescens
Staphylococcus lugdunensis Staphylococcus schleiferi Stenotrophomanas maltophilia
Streptococcus bovis group Streptococcus constellatus Streptococcus dysgalactiae
Streptococcus mutans Streptococcus salivarius Streptococcus sanguis group viridans
Streptococcus Sutterella wadsworthensis Veillonella spp Yeast species not C albicans
199
APPENDIX E DETAILED TABULATION OF DISCREPANCIES BETWEEN THE
MEDICAL RECORD REVIEW AND THE ESS
Table E1 Description of Discrepancies between ESS and Medical Record Review in the Identification of True BSIs
Patient Chart ESS Notes 9 Additional Incidents of BSI by Chart review 298 3 episodes ndash all MM 2 Episodes ndash all MM Chart ndash 1 extra
S aureus Ecoli Saureus episode No 3rd episode bc isolate not firstbldper365d considered part of episode 1 therefore not counted
556 2 episodes ndash MM PM 1 episode shy MM Chart ndash 1 extra episode
Isolate of first episode (CR) not firstbldper365d therefore not counted 1 isolate of CR 2nd
episode a firstbldper365d 584 1 episode 0 Episode Chart ndash 1 extra
episode No episode bc isolate not firstbldper365d therefore not counted
616 1 episode 0 Episode Chart shy1 extra episode
No episode bc isolate not firstbldper365d therefore not counted
827 1 episode 0 Episode Chart ndash 1 extra episode
No episode bc isolate not firstbldper365d therefore not counted
1307 1 episode 0 Episode Chart shy1 extra episode
no episode bc isolate not firstbldper365d therefore not counted
1582 2 episodes ndash all MM 1 Episode shy MM Chart ndash 1 extra episode
No 2nd episode bc isolate not firstbldper365d not counted
200
Patient Chart ESS Notes continued 1861 3 episodes ndash all MM 2 Episodes ndash all MM
No 3rd episode bc isolate not firsbldper365d considered part of episode 1 therefore not counted
Chart ndash 1 extra episode
2135 2 episodes ndash all MM 1 Episode ndash MM
No 2nd episode bc isolate not firstbldper365d considered part of episode 1 therefore not counted
Chart ndash 1 extra episode
14 Additional incident episodes by ESS not by chart
201
Table E2 Description of Discrepancies between ESS and Medical Record Review in the Identification of True BSIs
Patient Chart ESS Notes 2 Additional episodes by ESS 46 1 Episodeshy PM 2 episodes ndash all MM ESS ndash 1 extra
episode 3rd 3rd isolate part of polymicrobial isolate Firstbloodper365d episode classified as separate 2nd
episode 2584 1 episode ndash MM 2 episodes ndash MM ESS ndash 1 extra
episode Ecoli episode Bacteroides Ecoli and Bacteroides =contam fragilis
12 Additional episodes by ESS classified as contams by chart review 40 2 episodes
CoNS x2 = contam E cloacae x2= infxn
149 1 episode CoNS x2 = contam
485 1 episode CoNS x2 = contam
668 1 episode Rothia Mucilaginosa x1 = contam
710 1 episode CoNS x2 = contam
836 1 episode CoNS x2 = contam
1094 1 episode CoNS x2 = contam
1305 1 episode LAC x1 = contam
1412 1 episode Corynebacterium sp x1 = contam
1841 1 episode CoNS x2=contam
2 episodes
CoNs x2 within 5 days = infxn E cloacae = infxn 1 episode CoNS x2 within 5 days = infxn 1 episode CoNs x2 within 5 days = infxn 1 episode Rothia mucilaginosa x1 = infxn 1 episode CoNS x2 within 5 days = infxn 1 episode CoNS x2 within 5 days = infxn 1 episode CoNS x2 within 5 days = infxn 1 episode LAC x1 = infxn 1 episode Corynebacterium sp x1 = infxn 1 episode CoNS x2 within 5 days=infxn
202
Patient Chart ESS Notes continued 2432 1 episode
CoNS x2 = contam 1 episode CoNS x2 within 5 days = infxn
2474 1 episode CoNS x 2 =contam
1 episode CoNS x2 within 5 days = infxn
203
Table E3 Description of Discrepancies in the Location of Acquisition Between the Medical Record Review and the ESS
Patient Chart ESS Notes Changes made Chart HCA ESS NI (n=9) 81 Special care at home ndash has Culture 53 hours from Culture time vs No change
ileostomycolectomy bag admission date Clinical data (admit 02shy12 culture 02shy14) 0 HC encounters prior
987 Previous hospital admission Culture 328 hrs from Oversight by Changed to NI Has home care to check BP admission date reviewer of culture in STATA file
and admission time not CR Should have been classified as 1 HC encounter = database NI bc episode date is clearly Prior hospitalization gt2 days after admission date Oversight by reviewer
1001 Patient in nursing home Culture 98 hrs from Oversight by Changed to NI admission date reviewer of culture in STATA file
Should have been classified as and admission time not CR NI bc episode date is clearly 3 HC encounters= database gt2 days after admission date prior hospitalization Oversight by reviewer nursingLTC resident
prior ED 1279 Patient in nursing home and Culture 64 hrs from Culture time vs No change
had previous hospital visit admission date Clinical data (27days)
Admission to unit 05shy15 culture 05shy17 (unsure times) 2 HC encounters=
prior hospitalization prior emergency
1610 Prior hospital admission Culture 4 hours prior Oversight by Changed it to to admission date reviewer of culture NI in STATA
Should have been classified as and admission time but not CR NI bc LOS at previous Classified as NI bc database hospital was gt2 days before transferred from acute transfer Pt dx with ETOH care site pancreatitis (not infection) then got dx with Ecoli pancreatic abscess
2276 Prior hospital visit Culture 211 hrs from Oversight by Changed it to chemohemodialysis admission reviewer of culture NI in STATA Should have been classified as and admission time not CR NI as notes clearly show 2 HC encounters = Database culture date gt2 days after prior hospitalization admission (8 days later) TBCC Patient had a failed ERCP
204
cholangial tube at other hospital dc 17 days prior to this admission
Patient Chart ESS Notes Changes made continued 2279 Patient has specialized care at
home (TPN from previous admission) Prior hospital visitchemohemodialysis
Admitted for 1 wk 6 wks prior to this admit had
Culture 7 hrs from admission
0 HC encounters Classified as NI bc transferred from another acute care
True discrepancy No change
colonoscopy went home 1 wk later returned to hospital transferred to PLC Episode of arm cellulitis related to TPN
site
from previous admission and not IBD
2536 Patient visited TBCC for chemotherapy
Culture 290 hrs from admission
Oversight by reviewer of culture and admission time
Changed it in the STATA file but not the CR
Should have been classified as 1 HC encounter = database NI bc episode date is clearly gt2 days after admission date (admit 11shy24 culture 12shy06) Oversight by reviewer
TBCC
ChartCA ESS NI (n=5) 417 On home O2 Lives
independently
Culture 0123 admitted to unit 0122
No clear indication of cancer in chart
946 KBL classified as CA likely it was in bowel prior to admission 0 HC encounters
1953 Homeless 0 HC encounters No indication of previous hospital visit or transfer
Culture 57 hrs from Discrepancy in dates No change admission and classification
Culture 0124 admit True discrepancy 0121
Identified 1 HC encounter = TBCC Culture 84 hrs from True discrepancy No change admission 0 HC encounters
Culture 4 hours prior True discrepancy No change to admission Transferred from another acute care site 0 HC encounters
205
Patient Chart ESS Notes Changes made continued 2050 Hit by car Had a direct ICU
admit
Admit 0331 Culture 0402 2122 Lives with family
Admit 07shy14 Culture 07shy21 No clear indication why classified as CA Should have been NI based on dates
Cultures 55 amp 57 hours from admission
Culture 184 hours from admit 1 HC encounter
True discrepancy No change
0 HC encounters
Oversight by Changed it in reviewer of culture STATA file not and admission time CR database
Chart NI ESS HCA (n=2) 1563 Transferred from other
hospital Unsure of how much time at other site Admit 12shy13 Culture 12shy15
1848 Had cytoscopy day prior for kidney stone (was in hospital for 2 days went home then returned next day and was hospitalized)
Not a prior HC encounter but considered all part of the same admission=NI
Chart CA ESS HCA (n=21) 60 Has home O2 lives at home
with spouse
No indication in chart of other HC encounter
93 From independent living home Meals are prepared but takes own meds
0 HC encounters 256 Lives at home with husband
Uses cane Had bilateral amputation 4 months prior
Culture 44 hours from admission 1 HC encountershyTBCC Identified pt transferred from other site so not sure why didnrsquot classify as NI Cultures 1shy2 hours before admission
2 HC encounters ndash Prior ED and hospitalization
Cultures 9shy11 hrs before admission 1 HC encounter= Nursing home
Culture 4 hours from admission 0 HC encounters but has unknown home care Culture 0 hrs from admission
2 HC encounters =
True discrepancy No Change
True discrepancy No change
True discrepancy No change
True discrepancy No Change
True discrepancy No Change
206
prior hospitalization nursing home
Patient Chart ESS Notes Changes made continued 351 Lives alone
0 HC encounters
640 2 recent hospital admissions for similar symptoms ndash IVDU Hep C poor dentition necrotic wounds to legs
698 Lives with daughter Visited ED with symptoms had cultures drawn sent home called back bc + cultures
712 Lives independently in own home Chart noted CML as coshymorbidity but did not note if patient visited TBCC
725 Lives at home Chart noted Hodgkinrsquos lymphoma 30 yrs prior but not indication of TBCC prior to admission
1207 Lives in Trinity Lodge (not a NH or LTC) No other HC encounter
1221 Lives alone with wife 1st
episode was CA 2nd=HCA 3rd=NI
No HC encounters prior to 1st
episode
Culture 4 hrs before admission 1 HC encounter = Nursing home and unknown home care Cultures 0shy3 hours before admission
1 HC encounter = prior hospitalization Cultures 92 hrs prior to admission and 12 hrs after admission
0 HC encounter but admitted from unknown home care Cultures 5 hrs prior to admission
1 HC encounter= TBCC Cultures 0 hrs from admission 1 HC encounter=TBCC Culture 20 hrs prior to admission
1 HC encounter = NH or LTC and admitted from unknown home care Cultures 5 hrs prior to 1276 hrs from admission (3 episodes)shy 1st=HCA 2nd ndash HCA 3rdshy NI
1 HC encounter=
True discrepancy No change
True discrepancy No change
True discrepancy No change
True discrepancy No change
True discrepancy No change
True discrepancy No change
True discrepancy No change
207
prior hospitalization (for 1st episode)
Patient continued
Chart ESS Notes Changes made
1267 Lives in group home Culture 8 hours prior to admission
Oversight by reviewer in HC
Changed it to HCA in
1 HC encounter = admitted for 2 HC encounters = encounters STATA file not gt2 days in prior 90 daysshy dx with hepatoangiomas Incorrect classification despite evidence in chart
prior ED and prior hospitalization
CR database
1343 Seen by physician more than 30 days prior to episode and had outpt procedure more than 30 days
Culture 1 hr prior to admission
1 HC encounter = admitted from
True discrepancy No change
unknown home care and TBCC
1387 Visited dentist for painissue got Pen had dental work 2shy3 mo prior Lives at home
Culture 6 hrs prior to admission 0 HC encounter = but transferred from
True discrepancy No change
Doesnrsquot meet defrsquon unknown home care 1513 From penitentiary Culture 1 hr prior to
admission True discrepancy No change
0 HC encounters identified 1HC encounter= prior hospitalization and transferred from Drumheller district health services
1716 Presented to hospital 4 months prior with 4 month hx back pain ndash shown to have OM discitis Dc to HPTP now returned with worse back pain Continues to have OM discitis
Culture 6 hrs from admission
1 HC encounter = prior HPTP admitted from unknown home care
True discrepancy No change
1 HC encounter = IV
1786 therapyHPTP Had US 3 wks prior to episode at FMC and work up on liver cirrhosis prior to admission
Culture 0 hrs from admission
Oversight by reviewer
Changed it to HCA in STATA but not
208
No home care on disability 1 HC encounter= CR database Clear indication of HC TBCC encounters= attended hospital within prior 30 days
Patient Chart ESS Notes Changes made continued 1964 Has Ca but not on chemo
radiation and has not gone to TBCC using homeopathic remedies only Was seen by GP shy concerns re UTI and possible urethral fistula (no fu since Dec 2006) Natural practitioner evaluating him through live blood analysis
1969 No HC encounter No indication in chart Had ovarian Ca 2004 that was resected No indication at this admission of active cancer
1972 Lives at Valley Ridge Lodge (not NH or LTC)
Radiation for lung ca 8 months prior Doesnrsquot meet defrsquon
2074 Visited hospital prior for same symptoms as this episode Lives with friend in apt 0 other HC encounters
2584 No indication of visit to TBCC or chemo but noted rectal carcinoma No HC encounters noted
Possible oversight during review but do not change
Chart HCA ESS CA (n=16) Indwelling foley Visited preshyadmission clinic 11shy07 (more than 30 days prior) Lives at home Home care
1 HC encounter
Culture 0 hrs from admit
1 HC encounter= TBCC
Culture 26 hrs from admission
1 HC encounter = TBCC Culture 1 hr from admission
0 HC encounter =admitted from unknown home care Culture 1 hr prior to admission 1 HC encounter = prior ED visit Cultures 3shy7 hrs prior to admission 1 HC encounter = TBCC
Cultures 6 hrs prior to admit
0 HC encounters
True discrepancy No change
True discrepancy No change
True discrepancy No change
True discrepancy No change
True discrepancy No change
True discrepancy No change 19
209
Patient Chart ESS Notes Changes made continued 33 Had ERCP just over 1 month
prior
1 HC encounter = visited a hospital in 30 days prior
85 Living with daughter Attended Day medicine within 30 days prior for abd US and BM aspirate biopsy
92 In nursing home for approx one month attended TBCC until May 2006 Received homecare before placed in nursing home
2 HC encounters 184 Lives with family Had
cytoscopy 1 wk prior to admission
1 HC encounter 269 Nn Transplant list due to liver
failure 4 months prior Admitted nov 29 2006 Following up with physician (admission more than 90 days but considered HCA bc unsure of focus and cannot determine if from the liver which would make it CA likely)
439 Lives at home has home care nurse and was admitted prior
2 HC encounters 561 Indwelling catheter changed
by home care 1xwk 1HC encounter
880 Had prostate biopsy 2 days prior 1 HC encounter
902 10 wks post partumVaginal
Cultures 6 hrs prior to admit
0 HC encounters
Cultures 3 hrs before admit 0 HC encounters
Culture 5 hrs prior to admit 0 HC encounters
Pt transferred to LTCgt
Cultures 3 hrs prior to admit 0 HC encounters
Culture 1 hr prior to admit
0 HC encounter
Culture16 hrs from admission 0 HC encounter
Cultures 11 hrs from admit 0 HC encounter Culture 20 hrs from admit 0 HC encounter Culture 6 hrs from
True discrepancy No change
True discrepancy No change
True discrepancy No change
True discrepancy No change
True discrepancy No change
True discrepancy No change
True discrepancy No change
True discrepancy No change
True discrepancy No change
210
delivery tear Admitted to admit hospital for delivery 0 HC encounter
Patient Chart ESS Notes Changes made continued 955 Had prostate biopsy 3 days
prior developed symptoms 1 HC encounter
1660 Stent removal 10days prior 1 HC encounter
1711 Homeless Dc 20 days prior from PLC with pneumonia but continues to have symptoms Dx with pneumonia
Should have been classified as CA based on info bc admitted to previous hospital with same condition Didnrsquot acquire it at PLC
1919 Lives with sister and care giverPt has dvp delay amp DM 1 HC encounter = home care
2030 Had MRI 1 month prior liver tx recipient 9 months prior
1 HC encounter 2261 Had bronchoscopy 1 wk prior
1 HC encounter
Culture 33 hrs prior to admit
0 HC encounter Culture 0 hrs from admit 0 HC encounter Culture 1 hr prior to admit 0 HC encounter
Culture 5 hrs prior to admit
0 HC encounter Culture 5 hrs prior to admit 0 HC encounter
Culture 1 hr prior to admit
True discrepancy No change
True discrepancy No change
Oversight by Changed it to reviewer CA in STATA
file but not CR database
True discrepancy No change
True discrepancy No change
True discrepancy No change
211
Table E4 Discrepancies in the Focal Body Site for the Concordant Secondary BSIs between the ESS and the Medical Record Review
Patient Chart ESS Notes Chart Pneu ESS 0 (n=2) 1579 Pneu Culture conf Xray conf Pneu positive 2 cultures
LRI positive positive in ESS unclear focus
2050 Pneu Culture conf CT conf Pneu positive 2 cultures LRI positive positive in ESS
unclear focus Chart CVS ESS0 (n=2) 624 Med Surgical wound positive
from sternum (drainage and swab) CT conf mediastinitis
1739 ENDO Xray and ECG conf Urine and wound +
Chart GI ESS 0 (n=2) 1786 IAB Culture conf (sputum amp
peritoneal fluid) Ct confshypancreatitis
2259 IAB Culture conf (urine amp peritoneal fluid) CT confshypancreatitis
SSI positive SST positive Clinical focus==LRT UTI positive SST positive No clinical focus listed
Pneu + GI + No clinical focus listed UTI + GI + (Clinical focus= GI)
2 cultures positive in ESS unclear focus 2 cultures positive in ESS Unclear focus
2 cultures positive in ESS Unclear focus 2 cultures positive in ESS Unclear focus
Chart LRI ESS 0 (n=1) 1662 LUNG Culture conf (pleural (Clinical focus= 2 cultures
fluid) CTshypneu Empyema LRT) Pneu + LRI positive in ESS + Unclear focus
Chart 0 ESS UTI (n=1) 784 2 foci listed Unsure of focus
Wound culture 1 month prior to bld Urine + (2 foci= ASB UTI SKIN) MRI brainshy Lesions parietal lobe rep brain mets CNS lymphoma)
Chart BJ ESS UTI (n=2)
No clinical focus UTI +
217 Bone Culture conf (cutaneous ulcer) pathology conf osteomyelitis
1111 Bone Not culture conf Urine + Notes= osteo
Chart CVS ESS UTI (n=1)
No clinical focus listed UTI +
UTI + (Clinical focus listed=SST)
212
Patient Chart ESS Notes continued 763 ENDO TEE confirmed
Wound urine +
Chart Repr ESS UTI (N=1)
UTI + SST + (clinical notes = ENDO)
2125 OREP Urine +CT conf Had DampC
Chart SSI ESS SST (n=1)
No clinical focus listed UTI +
2528 SSI SKIN Surgical wound drainage + Post CABG CTshystranding assoc with chest wadefect
ChartPneu ESS SST (n=2)
ST ll
No clinical focus SST +
843 Pneu Cath tip dialysis cath tip No clinical focus pleural fluid + CTshy empyema listed SST +
1732 Pneu Pleural fluid + Wound + No clinical focus Empyema listed SST +
Chart BJ ESS SST (n=3) 997 Bone Deep wound swab +
Xrayshyosteomy myositis Autopsyshyfasciitis assoc with OM
1221 Bone Wound + anaerobic culture NM conf osteo
1350 JNT Wound + Dcshy septic arthritis
Chart CNS ESS SST (n=1)
Clinical focus = JNT SST +
Clinical focus = JNT SST + No clinical focus listed SST +
895 IC CNS + maxillary swab + Clinical focus MR conf ndashsinusitis bilateral listed = JNT SST subdural empyemas meningitis +
Chart EENT ESS SST (n=1) 1387 ORAL Mandible abscess +
CTshyosteoy of hemimandible Chart CVS ESSPneu (n=1)
Clinical focus = URT SST +
202 ENDO Sputum + Echo= possible endo treated as endo
Chart SST ESS EENT (n=1)
Clinical focus listed = GI Pneu +
1861 Skin Clinical dx Cellulitis impetigo ear bact cult +
ChartPneu ESS LRI (n=2)
Clinical focus = SST EENT +
1445 Pneu Pleural fluid + xray conf Clinical focus =
213
Empyema LRT LRI + Patient Chart ESS Notes continued 2230 Pneu Pleural fluid + Empyema No clinical focus
listed LRI +

UNIVERSITY OF CALGARY
The Validation of a Novel Surveillance System for Monitoring of Bloodstream Infections
in the Calgary Health Region
by
Jenine Rocha Leal
A THESIS
SUBMITTED TO THE FACULTY OF GRADUATE STUDIES
IN PARTIAL FULFILMENT OF THE REQUIREMENTS FOR THE
DEGREE OF MASTER OF SCIENCE
DEPARTMENT OF COMMUNITY HEALTH SCIENCES
CALGARY ALBERTA
APRIL 2011
copy JENINE ROCHA LEAL 2011
The author of this thesis has granted the University of Calgary a non-exclusive license to reproduce and distribute copies of this thesis to users of the University of Calgary Archives
Copyright remains with the author
Theses and dissertations available in the University of Calgary Institutional Repository are solely for the purpose of private study and research They may not be copied or reproduced except as permitted by copyright laws without written authority of the copyright owner Any commercial use or re-publication is strictly prohibited
The original Partial Copyright License attesting to these terms and signed by the author of this thesis may be found in the original print version of the thesis held by the University of Calgary Archives
Please contact the University of Calgary Archives for further information E-mail uarcucalgaryca Telephone (403) 220-7271 Website httparchivesucalgaryca
Abstract
An electronic surveillance system (ESS) for bloodstream infections (BSIs) in the
Calgary Health Region (CHR) was assessed for its agreement with traditional medical
record review (MRR)
Related data from regional laboratory and hospital administrative databases were
linked Definitions for excluding contaminants and duplicate isolates were applied
Infections were classified as nosocomial (NI) healthcareshyassociated communityshyonset
(HCA) or communityshyacquired (CA) A random sample of patients from the ESS was then
compared with independent MRR
Among the 308 patients selected for comparative review the ESS identified 318
episodes of BSI while the MRR identified 313 episodes of BSI Episodes of BSI were
concordant in 304 (97) cases Agreement between the ESS and the MRR was 855 with
kappa=078 (95 confidence interval [CI] 075shy080)
This novel ESS identified and classified BSI with a high degree of accuracy This
system requires additional linkages with other related databases
ii
Preface
This thesis aims to validate a previously developed electronic surveillance system
that monitors bloodstream infections in the Calgary Health Region The process of
evaluating and revising a surveillance systemrsquos algorithms and applications is required
prior to its implementation This electronic surveillance system has the capability of
outlining which bloodstream infections occur in hospitals outpatient facilities and in the
community Infection control practitioners in the hospital or outpatient settings can use
this system to distinguish true bloodstream infections from contaminant sources of positive
blood cultures Furthermore it outlines which bloodstream infections are likely secondary
to the use of central venous catheters (ie primary infections) that require further
investigation and intervention by infection control practitioners
Prior to the commencement of this thesis I published the definitions and
discrepancies identified in the electronic surveillance system This provided the framework
for conducting my thesis For that publication I conducted the medical record review
analyzed the data and wrote the initial and final draft of the manuscript The full citation is
as follows
Jenine Leal BSc Daniel B Gregson MD Terry Ross Ward W Flemons MD
Deirdre L Church MD PhD and Kevin B Laupland MD MSc FRCPC Infection
Control and Hospital Epidemiology Vol 31 No 7 (July 2010) pp 740shy747
iii
Acknowledgements
I owe my deepest gratitude to my supervisor Dr Kevin Laupland whose
encouragement guidance and support helped me succeed in all endeavours from beginning
to end To Dr Elizabeth Henderson Mrs Terry Ross and my committee members (DG
DC WF) thank you for all your help and expertise
To Marc and my family I am indebted to you always for believing in me and for
the continued love and support throughout this project
I gratefully acknowledge the funding sources that made my work possible I was
funded by the Queen Elizabeth II Graduate Scholarship (University of Calgary 2008shy
2010) Health Quality Council of Alberta (Alberta Health Services 2009) and the Calvin
Phoebe and Joan Snyder Institute of Infection Immunity and Inflammation (2008)
I would like to thank the University of Chicago Press that granted permission on
behalf of The Society of Healthcare Epidemiology of America copy 2010 for the reuse of my
previously published work outlined in the Preface of this thesis
Lastly I offer my regards and blessings to all those who supported me in any
respect during the completion of this project
Sincerely
Jenine Leal
iv
Table of Contents
Abstract ii Preface iii Acknowledgements iv Table of Contents v List of Tables ix List of Figures xi List of Abbreviations xii
INTRODUCTION 1 Rationale 3
LITERATURE REVIEW 4 Concepts Related to Bloodstream Infections 4 Pathophysiology 6 Clinical Patterns of Bacteraemia and Fungemia 6 Epidemiology of Bloodstream Infections 8
Risk Factors for Bloodstream Infections 8 CommunityshyAcquired Bloodstream Infections 8 Nosocomial Bloodstream Infections 9 HealthcareshyAssociated CommunityshyOnset 10 Prognosis of Bacteraemia 11
Detection of MicroshyOrganisms in Blood Cultures 12 Manual Blood Culture Systems 12 Automated Blood Culture Systems 13 ContinuousshyMonitoring Blood Culture Systems 14
Interpretation of Positive Blood Cultures 15 Identity of the MicroshyOrganism 15 Number of Blood Culture Sets 17 Volume of Blood Required for Culture 20 Time to Growth (Time to Positivity) 20
Limitations of Blood Cultures 21 Surveillance 22
History of Surveillance 22 Elements of a Surveillance System 25 Types of Surveillance 27
Passive Surveillance 27 Active Surveillance 29 Sentinel Surveillance 30 Syndromic Surveillance 31
v
Conceptual Framework for Evaluating the Performance of a Surveillance System 33 Level of Usefulness 33 Simplicity 34 Flexibility 34 Data Quality 34 Acceptability 39 Sensitivity 39 Positive Predictive Value 39 Representativeness 40 Timeliness 40 Stability 41
Surveillance Systems for Bacterial Diseases 41 Canadian Surveillance Systems 41 Other Surveillance Systems 43
Surveillance Methodologies 45 HospitalshyBased Surveillance Methodology 45 Electronic Surveillance 48
Validity of Existing Electronic Surveillance Systems 49 Use of Secondary Data 51
Limitations of Secondary Data Sources 54 Advantages of Secondary Data Sources 55 LaboratoryshyBased Data Sources 56
Development of the Electronic Surveillance System in the Calgary Health Region 61
OBJECTIVES AND HYPOTHESES 65 Primary Objectives 65 Secondary Objectives 65 Research Hypotheses 65
METHODOLOGY AND DATA ANALYSIS 67 Study Design 67 Patient Population 67
Electronic Surveillance System 67 Comparison Study 67 Sample Size 68
Development of the Electronic Surveillance System 68 Definitions Applied in the Electronic Surveillance System 75 Comparison of the ESS with Medical Record Review 80 Definitions Applied in the Medical Record Review 83 Data Management and Analysis 85
Electronic Surveillance System 85
vi
Comparison Study 86 Ethical Considerations 87
RESULTS 88
Comparison between the Electronic Surveillance System and the Medical Record
Description of Discrepancies in Location of Acquisition between Medical
Comparison of the Source of Infection between the Medical Record Review and
Descriptions of Discrepancies in the Source of Infection between Medical
Comparison of the Source of BSIs among Concordant Secondary BSIs
PopulationshyBased Surveillance Based on the Application of the ESS Algorithms 88 Incident Episodes of Bloodstream Infection 88 Aetiology of Episodes of Bloodstream Infections 90 Acquisition Location of Incident Bloodstream Infections 92 Patient Outcome 94
Medical Record Review and Electronic Surveillance System Analysis 96 Aetiology 96
Medical Record Review 96 Electronic Surveillance System 101
Episodes of Bloodstream Infections 102 Medical Record Review 102 Electronic Surveillance System 103
Acquisition Location of Bloodstream Infections 103 Medical Record Review 103 Electronic Surveillance System 104
Source of Bloodstream Infections 106 Medical Record Review 106 Electronic Surveillance System 109
Patient Outcome 110 Medical Record Review 110 Electronic Surveillance System 111
Review 113 Episodes of Bloodstream Infection 113
Description of Discrepancies in Episodes of Bloodstream Infection 113 Acquisition Location of Episodes of Bloodstream Infection 114
Record Review and the ESS 115
the ESS 120
Record Review and the ESS 121
between the Medical Record Review and the ESS 123 Summary of Results 124
DISCUSSION 126
vii
Novelty of the Electronic Surveillance System 126 Validation of the Electronic Surveillance System 127
Identification of Bloodstream Infections 129 Review of the Location of Acquisition of Bloodstream Infections 133 Review of the Source of True Bloodstream Infection 138
Validity and Reliability 139 Population Based Studies on Bloodstream Infections 142 Limitations 144 Implications 150 Future Directions 156
Inclusion of ICDshy9 and ICDshy10 Codes to the ESS Algorithm 156 Evaluation of Antimicrobial Resistance 157
CONCLUSION 159
BIBLIOGRAPHY 160
APPENDIX A ADMINISTRATIVE DATABASE FIELD DESCRIPTIONS 182
APPENDIX B MEDICAL RECORD REVIEW FORM 193
APPENDIX C KAPPA CALCULATIONS 196 Measuring Observed Agreement 196 Measuring Expected Agreement 196 Measuring the Index of Agreement Kappa 196 Calculating the Standard Error 196
APPENDIX D ORGANISMS WITH INCIDENCE OF LESS THAN 1 PER 100000 ADULT POPULATION FROM TABLE 51 197
APPENDIX E DETAILED TABULATION OF DISCREPANCIES BETWEEN THE MEDICAL RECORD REVIEW AND THE ESS 199
viii
List of Tables
Table 41 Description of Fields in the ESS after Linkage of Electronic Data Sources on Microsoft Access 2003 72
Table 42 Modified Regional Health Authority Indicators 75
Table 43 Bloodstream Infection Surveillance Definitions 76
Table 44 Focal Culture Guidelines for the ESS Algorithm 79
Table 45 Description of Fields in the Medical Record Review on Microsoft Access 2003 81
Table 46 Medical Record Review Definitions for Bloodstream Infection Surveillance 84
Table 51 The 2007 SpeciesshySpecific Incidence among Adult Residents (gt18 years) of the Calgary Health Region 91
Table 52 Description of 2007 Incident BSIs among Adult Residents of the Calgary Health Region by Acquisition Location 92
Table 53 Distribution of Previous Healthcare Encounters Prior to Incident BSIs among Adult Patients in the Calgary Health Region (2007) 93
Table 54 The 2007 Organism Distribution by Acquisition Location for Incident BSIs among Adults in the Calgary Health Region 94
Table 55 InshyHospital Outcome by Location of Acquisition of Incident BSIs among Adults in the Calgary Health Region 95
Table 56 Distribution of Organisms Collected from 661 Cultures Based on the Medical Record Review 97
Table 57 Frequency of Organisms among MonoshyMicrobial Episodes of BSIs in the Medical Record Review (MRR) and the Electronic Surveillance System (ESS) 99
Table 58 Frequency of Organisms among PolyshyMicrobial Episodes of BSI in the Medical Record Review (MRR) and the Electronic Surveillance System (ESS) 101
ix
Table 59 Previous Healthcare Encounters among Patients with HealthcareshyAssociated CommunityshyOnset BSIs Based on the Medical Record Review 104
Table 510 Previous Healthcare Encounters among Patients with HealthcareshyAssociated CommunityshyOnset BSIs Based on the ESS Sample 106
Table 511 Source of Secondary BSIs Identified in the Medical Record Review and the Electronic Surveillance System 108
Table 512 Source of BSIs by Location of Acquisition for Episodes of BSIs Included in the Medical Record Review 109
Table 513 Source of BSIs by Location of Acquisition for Episodes of BSIs Included in the ESS Sample 110
Table 514 InshyHospital Outcome by Location of Acquisition of BSIs Included in the Medical Record Review 111
Table 515 InshyHospital Outcome by Location of Acquisition of BSIs Included in the ESS Sample 112
Table 516 Comparison of Location Acquisition of BSIs between the Medical Record Review and the ESS 115
Table 517 Source of BSIs between Medical Record Review and the ESS 121
Table E1 Description of Discrepancies between ESS and Medical Record Review in the Identification of True BSIs 199
Table E2 Description of Discrepancies between ESS and Medical Record Review in the Identification of True BSIs 201
Table E3 Description of Discrepancies in the Location of Acquisition Between the Medical Record Review and the ESS 203
Table E4 Discrepancies in the Focal Body Site for the Concordant Secondary BSIs between the ESS and the Medical Record Review 211
x
List of Figures
Figure 41 Computer Flow Diagram of the Development of the ESS 71
Figure 51 Flow Diagram of Incident Episodes of Bloodstream Infection by the ESS 89
xi
List of Abbreviations
Abbreviation Definition ABC Active Bacterial Core AHS Alberta Health Services BSI Bloodstream Infection CA Communityshyacquired CANWARD Canadian Ward Surveillance Study CASPER Calgary Area Streptococcus pneumonia Epidemiology Research CBSN Canadian Bacterial Surveillance Network CDAD Clostridium difficile associated diarrhoea CDC Centers for Disease Control and Prevention CFU Colony forming units CHEC Canadian Healthcare Education Committee CHR Calgary Health Region CI Confidence Interval CIPARS Canadian Integrated Program for Antimicrobial Resistance Surveillance CLS Calgary Laboratory Services CLSI Clinical and Laboratory Standards Institute CNISP Canadian Nosocomial Infection Surveillance Program CO2 Carbon dioxide CoNS Coagulaseshynegative staphylococci CQI Continuous quality improvement CVC Central vascular catheter DDHS Didsbury District Health Services ED Emergency department ESBL Extended spectrum betashylactamases ESS Electronic surveillance system FMC Foothills Medical Centre GAS Group A Streptococcus HCA Healthcareshyassociated communityshyonset HPTP Home parenteral therapy program ICDshy10shyCA International Classification of Diseases Tenth Revision Canadian Edition ICDshy9shyCM International Classification of Diseases Ninth Revision Clinical
Modifiction ICU Intensive care unit IMPACT Immunization Monitoring Program ACTive IQR Interquartile range ISCPs Infection surveillance and control programs IV Intravenous
xii
LIS Laboratory information system MI Myocardial infarction mmHg Millimetre of mercury MRR Medical record review MRSA Methicillinshyresistant Staphylococus aureus MSSA Methicillinshysusceptible Staphylococcus aureus NHSN National Healthcare Safety Network NI Nosocomial bloodstream infection NML National Microbiology Laboratory NNIS National Nosocomial Infection Surveillance system NPV Negative predictive value PaCO2 Partial pressure of carbon dioxide PCV7 Sevenshyvalent pneumococcal conjugate vaccine PHAC Public Health Agency of Canada PHN Primary healthcare number PLC Peter Lougheed Hospital PPV Positive predictive value RCR Retrospective chart review RHA Regional health authority RHRN Regional health record number SARP Southern Alberta Renal Program SDHS Strathmore District Health Services SE Standard error SENIC Study on the Efficacy of Nosocomial Infection Control SIRS Systemic inflammatory response syndrome SSTI Skin and soft tissue infection TBCC Tom Baker Cancer Centre TIBDN Toronto Invasive Bacterial Disease Network TPN Total parenteral nutrition UTI Urinary tract infection VMS Virtual memory system VRE Vancomycinshyresistant enterococci
xiii
1
INTRODUCTION
Bloodstream infections (BSI) constitute an important health problem with a high
caseshyfatality rate in severe cases (1) Infectious disease surveillance is defined as the
ongoing systematic collection of data regarding an infectious disease event for use in
public health action to reduce morbidity and mortality and to improve health (1)
Surveillance for BSIs is important to measure and monitor the burden of disease evaluate
risk factors for acquisition monitor temporal trends in occurrence and to identify emerging
and reshyemerging infections with changing severity It is an area of growing interest because
the incidence of antibiotic resistant bacteria is rising and new resistant strains are emerging
(2) As part of an overall prevention and control strategy the Centers for Disease Control
and Preventionrsquos (CDC) Healthcare Infection Control Practices Advisory Committee
recommends ongoing surveillance for bloodstream infections (3) However traditional
surveillance methods are dependent on manual collection of clinical data from the medical
record clinical laboratory and pharmacy by trained infection control professionals This
approach is timeshyconsuming and costly and focuses infection control resources on counting
rather than preventing infections (3)
Automated or electronic surveillance of infectious diseases is the process of
obtaining information from intershyrelated electronic databases for identifying infection
distributions within a particular setting (4) With increasing use and availability of
electronic patient data within healthcare institutions and in community settings the
potential for automated surveillance has been increasingly realized (4 5)
Administrative and laboratoryshybased data may be linked for streamlined data
collection on patient admission demographic and diagnostic information as well as
2
microbiologic detail species distribution and antibiotic resistance rates Since these
electronic data are usually routinely collected for other primary purposes electronic
surveillance systems may be developed and implemented with a potentially minimal
incremental expense (5)
As a result of uncertainty surrounding its accuracy electronic surveillance has not
been widely adopted Traditional labourshyintensive manual infection surveillance methods
remain the principal means of surveillance in most jurisdictions (5)
Consequently there are few studies that have reported on the accuracy of
ldquoelectronic surveillancerdquo as compared to traditional manual methods An electronic
surveillance system (ESS) was developed in the Calgary Health Region (CHR) to monitor
bloodstream infections and was assessed to determine whether data obtained from the ESS
were in agreement with data obtained by manual medical record review (MRR) Definitions
were created to identify episodes of bloodstream infection and the location of acquisition of
the BSIs That ESS had a high degree of accuracy when compared to the MRR
Discrepancies in identifying episodes of bloodstream infection and in the location of
acquisition of BSIs were described and definitions were revised to improve the overall
accuracy of the ESS However there was incomplete evaluation of the developed and
revised definitions
The objective of this study was to evaluate the developed active electronic
information populationshybased surveillance system for bloodstream infection in the CHR by
comparing it to traditional manual medical record review
3
Rationale
This study aimed to validate a developed efficient active electronic information
populationshybased surveillance system to evaluate the occurrence and classify the acquisition
of all bloodstream infections among adult residents of the Calgary Health Region This
system will be a valuable adjunct to support quality improvement infection prevention and
control and research activities The electronic surveillance system will be novel in a
number of ways
1) All bloodstream infections occurring among adult residents of the CHR will
be included in the surveillance system Sampling will not be performed and
therefore selection bias will be minimized
2) Unlike other surveillance systems that only include a selected pathogen(s) a
broad range of pathogens will be included such that infrequently observed or
potentially emerging pathogens may be recognized
3) Infections will be classified as nosocomial healthcareshyassociated
communityshyonset or community acquired Studies to date have focused on
restricted populations No studies investigating electronic surveillance have
attempted to utilize electronic surveillance definitions to classify infections
according to the criteria of Friedman et al (6)
4) A multishystep methodology that involves the initial development revision
and validation of electronic definitions will be utilized
4
LITERATURE REVIEW
Concepts Related to Bloodstream Infections
Bacteraemia or fungemia entails the presence of viable bacteria or fungi identified
in a positive blood culture respectively (7 8) Contamination is a falsely positive blood
culture when microshyorganisms that are not actually present in a blood sample are grown in
culture and there is no clinical consequence as a result (ie no infection) (9) Infection is
characterized by the inflammatory response to the presence of microshyorganisms such as
bacteria or fungi in normally sterile tissue bodily spaces or fluids (8 10) A bloodstream
infection is therefore defined as the presence of bacteria or fungi in blood resulting in signs
and symptoms of infection such as fever (gt38degC) chills malaise andor hypotension (11)
Sepsis is the systemic inflammatory response syndrome (SIRS) resulting from an
infection manifested by two or more clinical criteria (ie body temperature greater than
38ordmC or less than 30ordmC heart rate greater than 90 beats per minute respiratory rate of
greater than 20 breaths per minute or a PaCO2 of less than 32 mmHg or white blood cell
count greater than 12000 per cubic millimetre or less than 4000 per cubic millimetre or
greater than 10 immature forms) but with a clearly documented inciting infectious
process with or without positive blood cultures (8 10 12) The signs and symptoms of
sepsis are nonshyspecific Often there is acute onset of fever associated rigors malaise
apprehension and hyperventilation Symptoms and signs associated with the primary
source of infection are present in the majority of patients with some patients having
coetaneous manifestations such as rash septic emboli or ecthyma gangrenosum (7)
5
Furthermore some patients with bacteraemia or fungemia may be hypothermic often a
poor prognostic sign (7)
The various combinations of sites organisms and host responses associated with
sepsis have made it difficult to develop a single simple definition to facilitate clinical
decision making and clinical research (8 10 13) One of the first attempts to establish a set
of clinical parameters to define patients with sepsis occurred in 1989 when Roger Bone and
colleagues proposed the term ldquosepsis syndromerdquo It included clinical signs and symptoms
such as hypothermia or hyperthermia tachycardia tachypnea hypoxemia and clinical
evidence of an infection (10 12) Following this the American College of Chest Physicians
and the Society of Critical Care Medicine convened in 1991 to create a set of standardized
definitions for future research and diagnostic ability (8 10) They introduced a new
framework for the definition of systemic inflammatory responses to infection the sequelae
of sepsis and the SIRS (8 10) As a result terms such as septicaemia and septic syndrome
were eliminated due to their ambiguity and replaced with sepsis severe sepsis and septic
shock (8 10)
The continued dissatisfaction with available definitions of sepsis led to a Consensus
Sepsis Definitions Conference which convened in 2001 The participants of the conference
concluded that the 1991 definitions for sepsis severe sepsis and septic shock were still
useful in clinical practice and for research purposes (10) The changes were in the use of
the SIRS criteria which were considered too sensitive and nonshyspecific They suggested
other signs and symptoms be added to reflect the clinical response to infection (10)
Reflecting on these changes to the definition of sepsis due to its complexity and variation
suggests that a single simple definition for sepsis may never be possible and as such focus
6
should be placed on types of infection that are clearly defined (ie bacteraemia or BSIs)
(10)
Pathophysiology
Invasion of the blood by microshyorganisms usually occurs by one of two
mechanisms The first often termed ldquoprimaryrdquo BSI occurs through direct entry from
needles (eg in intravenous [IV] drug users) or other contaminated intravascular devices
such as catheters or graft material (7 13) The second termed ldquosecondaryrdquo BSI occurs as
an infection that is secondary to a preshyexisting infection occurring elsewhere in the body
such as pneumonia meningitis surgical site infections (SSI) urinary tract infections (UTI)
or infections of soft tissue bones and joints or deep body spaces (7 14shy16) Secondary
BSIs occur either because an individualrsquos host defences fails to localize an infection at its
primary site or because a healthcare provider fails to remove drain or otherwise sterilize
the focus (7 17)
Clinical Patterns of Bacteraemia and Fungemia
Bacteraemia can be categorized as transient intermittent or continuous Transient
bacteraemia lasting minutes or hours is the most common and occurs after the
manipulation of infected tissues (eg abscesses furuncles) during certain surgical
procedures when procedures are undertaken that involve contaminated or colonized
mucosal surfaces (eg dental manipulation cytoscopy and gastrointestinal endoscopies)
and at the onset of acute bacterial infections such as pneumonia meningitis septic
arthritis and acute haematogenous osteomyelitis Intermittent bacteraemia occurs clears
and then recurs in the same patient and it is caused by the same microshyorganism (7)
Typically this type of bacteraemia occurs because the blood is being seeded intermittently
7
by an unshydrained closedshyspace infection such as intrashyabdominal abscesses or focal
infections such as pneumonia or osteomyelitis (7) Continuous bacteraemia is characteristic
of infective endocarditis as well as other endovascular infections (eg suppurative
thrombophlebitis) (7)
Bloodstream infections can also be categorized as monoshymicrobial or polyshy
microbial Monoshymicrobial BSIs are marked by the presence of a single species of microshy
organisms in the bloodstream Polyshymicrobial infections refer to infections in which more
than one species of microshyorganisms is recovered from either a single set of blood cultures
or in different sets within a 48shyhour window after another had been isolated (18 19) Polyshy
microbial bacteraemia comprises between six percent and 21 of episodes in hospital
based cohorts (7 19shy22) Polyshymicrobial BSIs are associated with increased 28shyday
mortality and inshyhospital mortality (19 22)
The term ldquobreakthrough bacteraemiardquo is used to describe the occurrence of
bacteraemia in patients despite receiving appropriate therapy for the microshyorganism that is
grown from the blood (7 23) A study in two universityshyaffiliated hospitals in Spain by
Lopez Dupla et al has described the clinical characteristics of breakthrough bacteraemia
They identified that nosocomial acquisition endovascular source of infection underlying
conditions (eg neutropenia multiple trauma allogenic bone marrow and kidney
transplantation) and particular microbial aetiologies (eg Staphylococcus aureus
Pseudomonas aeruginosa and polyshymicrobial aetiologies) were independently associated
with increased risk for developing breakthrough bacteraemia (23) Other studies have
evaluated or identified breakthrough bacteraemia in specific patient populations (eg cancer
8
and neutropenic patients) or have found breakthrough bacteraemia due to particular microshy
organisms (eg Streptococcus pneumoniae Escherichia coli) (24shy27)
Epidemiology of Bloodstream Infections
Risk Factors for Bloodstream Infections
Conditions that predispose an individual to a BSI include not only age and
underlying diseases but also medications and procedures whose primary purposes are
maintenance or restoration of health (7) There is increased risk at the extremes of age with
premature infants being especially at risk for bacteraemia
Underlying illnesses associated with an increased risk of BSI include
haematological and nonshyhaematological malignancies diabetes mellitus renal failure
requiring dialysis hepatic cirrhosis immune deficiency syndromes malnutrition solid
organ transplantation and conditions associated with the loss of normal skin barriers such as
serious burns and decubitus ulcers (7 28shy31)
Therapeutic strategies associated with an increased risk of bacteraemia include
procedures such as placement of intravascular catheters as well as surgeries of all types but
especially involving the bowel and genitourinary tract and endoscopic procedures of the
genitourinary and lower gastrointestinal tracts (7 20 32) Certain medications such as
corticosteroids cytotoxic drugs used for chemotherapy and antibiotics increase the risk for
infection due to pyogenic bacteria and fungi (7 20)
CommunityshyAcquired Bloodstream Infections
Communityshyacquired (CA) BSIs are often classified as those submitted from
communityshybased collection sites or those identified within the first two days (lt48 hours)
of admission to an acute care facility (28 33)
9
Laupland et al conducted a laboratoryshybased surveillance in the Calgary Health
Region (CHR) and found that CAshyBSIs occurred at an incidence of 82 per 100000
population per year of which 80 required acute care hospital admission and 13 of
patients died (33) A study by Valles et al found that of the 581 CAshyBSI episodes 79
were hospitalized (34) The attributable mortality of BSI was 10 for communityshyonset
infections in a study by Diekema et al (35) As such it has a similar acute burden of
disease as major trauma stroke and myocardial infarction (MI) (33 36)
Finally the time between sepsis and admission to hospital was greater for patients
with CAshyinfections than those with healthcareshyassociated communityshyonset infections
(HCA 6 + 25 days vs 02 + 1 day p=0001) in a separate study (37)
Nosocomial Bloodstream Infections
Hospitalshyacquired or nosocomial (NI) BSIs are defined as a localized or systemic
condition resulting from an adverse reaction to the presence of an infectious agent(s) or its
toxin(s) There must be no evidence that the infection was present or incubating at the time
of admission to the acute care setting (ie gt48 hours after admission) (38) They represent
one of the most important complications of hospital care and are increasingly recognized as
a major safety concern (39shy42) While all patients admitted to hospital are at risk these
infections occur at highest rate in those most vulnerable including the critically ill and
immune compromised patients (18 43 44)
In one study from the CHR development of an intensive care unit (ICU)shyacquired
BSI in adults was associated with an attributable mortality of 16 [95 confidence
interval (CI) 59shy260] and a nearly 3shyfold increased risk for death [odds ratio (OR) 264
95 CI 140shy529] (45) The median excess lengths of ICU and hospital stay attributable to
10
the development of ICUshyacquired BSI were two and 135 days respectively and the
attributable cost due to ICUshyacquired BSI was 25155 Canadian dollars per case survivor
(45) The longest median length of stay (23 days IQR 135 to 45 days) and the highest
crude inpatient mortality (30) occurred among patients with nosocomial infections
compared to healthcareshyassociated and communityshyacquired infections in the study by
Friedman et al (6)
HealthcareshyAssociated CommunityshyOnset
Bloodstream infections have traditionally been classified as either nosocomial or
community acquired (46) However changes in healthcare systems have shifted many
healthcare services from hospitals to nursing homes rehabilitation centers physiciansrsquo
offices and other outpatient facilities (46) Although infections occurring in these
healthcareshyassociated settings are traditionally classified as communityshyacquired evidence
suggests that healthcareshyassociated communityshyonset (HCA) infections have a unique
epidemiology with the causative pathogens and their susceptibility patterns frequency of
coshymorbid conditions sources of infection and mortality rate at followshyup being more
similar to NIs (6 37 46shy48) As a result Friedman et al sought to devise a new
classification scheme for BSIs that distinguishes among and compares patients with CAshy
BSIs HCAshyBSIs and NIs (6) Other studies have evaluated and used varying definitions
for HCA infections (37 46shy48) However the concept of HCA infections typically
encompasses infectious diseases in patients who fulfill one or more of the following
criteria 1) resident in a nursing home or a longshyterm care facility 2) IV therapy at home or
wound care or specialized nursing care 3) having attended a hospital or haemodialysis
11
clinic or received IV chemotherapy in the past 30 days andor 4) admission to an acute care
hospital for two or more days in the preceding 90 days (49)
Valles et al found that the highest prevalence of MethicillinshyResistant S aureus
(MRSA) infections occurred in patients whose infection was HCA (5 plt00001) and a
significantly higher mortality rate was seen in the group with HCA infections (275) than
in CA infections (104 plt0001) (34) Other studies found that compared with CAshyBSIs
the mortality risk for both HCA BSI and nosocomial BSIs was higher (46 47)
It has been suggested that empirical antibiotic therapy for patients with known or
suspected HCAshyBSIs and nosocomial BSIs should be similar (6 34) In contrast patients
with CAshyBSIs are often infected with antibioticshysensitive organisms and their prescribed
therapy should reflect this pattern (6)
Prognosis of Bacteraemia
It has long been recognized that the presence of living microshyorganisms in the blood
of a patient carries with it considerable morbidity and mortality (7) In fact BSIs are among
the most important causes of death in Canada and cause increased morbidity and healthcare
cost (16 28 50) Several factors have contributed to the high incidence and mortality from
BSIs including a) the aging population often living with chronic coshymorbidities b) the
increasing survival in the ICU of patients suffering from severe trauma or acute MI only to
become predisposed to infections during their period of recovery c) the increasing reliance
on invasive procedures for the diagnosis and treatment of a wide range of conditions and
d) the growing number of medical conditions treated with immunosuppressive drugs (51)
Bloodstream infections may arise in communityshybased patients or may complicate
patientsrsquo course once admitted to hospital as nosocomial BSIs (44 52 53) In either case
12
patient suffering is high with rates of mortality approaching 60 in severe cases (7 54)
Weinstein et al reported that about half of all deaths in bacteraemia patients could be
attributed to the septicaemia episodes themselves (55 56)
Detection of MicroshyOrganisms in Blood Cultures
There are three different methodologies for detecting microshyorganisms in blood
cultures These include manual detection systems automated detection systems and
continuousshymonitoring blood culture systems
Manual Blood Culture Systems
Manual detection systems are the simplest systems and consist of bottles filled with
broth medium and with a partial vacuum in the headspace (7) To convert the bottles into
aerobic bottles the oxygen concentration is increased by transiently venting bottles to room
air after they have been inoculated with blood (7) Bottles that are not vented remain
anaerobic
After inoculation the bottles are incubated for seven days usually and are
periodically visually examined for macroscopic evidence of growth (7 57) Evidence of
growth includes haemolysis turbidity gas production ldquochocolatizationrdquo of the blood
presence of visible colonies or a layer of growth on the fluid meniscus (7 57) A terminal
subculture is usually done at the end of the incubation period to confirm that there was no
growth
Although these systems are flexible and do not require the purchase of expensive
instruments they are too labourshyintensive to be practical for most laboratories that process
a large number of blood cultures (7 57)
13
Automated Blood Culture Systems
Automated blood culture detection systems have been developed to make
processing blood cultures more efficient however they are no longer widely used These
included radiometric and nonshyradiometric blood culture systems Both systems were based
on the utilization of carbohydrate substrates in the culture media and subsequent production
of carbon dioxide (CO2) by growing microshyorganisms (57)
Bottles were loaded onto the detection portion of the instrument where needles
perforate the bottle diaphragm and sample the gas contents of the headspace once or twice
daily A bottle is flagged as positive if the amount of CO2 in the bottle exceeds a threshold
value based on a growth index (7 57) This would then prompt a Gram stain and
subcultures of the bloodshybroth mixture
The BACTEC radiometric blood culture system (Becton Dickinson Microbiology
Systems) detected microbial growth by monitoring the concentration of CO2 present in the
bottle headspace (7 57)
The BACTEC nonshyradiometric blood culture systems functioned similarly to the
radiometric system except that infrared spectrophotometers were used to detect CO2 in
samples of the bottle headspace atmosphere (7) This system could hold more bottles than
the radiometric system thereby requiring shorter monitoring times (7)
The disadvantages of these instruments included the fact that the culture bottles had
to be manually manipulated gas canisters were needed for every instrument detection
needles had to be changed periodically sterilization of the needle devices occasionally
failed resulting in the false diagnoses of bacteraemia cultures were sometimes falseshy
14
positive based on the instrument and bottle throughput was relatively slow (35 ndash 60
seconds per bottle) (57)
ContinuousshyMonitoring Blood Culture Systems
Continuousshymonitoring blood culture systems were developed in response to the
limitations of the automated blood culture systems and to the changes in health care
financing including the recognition of labour costs needed to be appropriately controlled
(57)
This detection system differs from previously automated systems in a number of
ways This system continuously monitors the blood cultures electronically for microbial
growth at ten to 24 minute intervals and data are transferred to a microcomputer where
they are stored and analyzed (7 57) Computer algorithms are used to determine when
microbial growth has occurred allowing for earlier detection of microbial growth The
algorithms also minimize falseshypositive signals
Furthermore the systems have been manufactured to remove the need for manual
manipulation of bottles once they have been placed in the instrument which eliminates the
chance of crossshycontamination between bottles (7) Finally the culture bottles each accept
the recommended 10mL of blood (57)
Commercial examples of continuousshymonitoring blood culture systems include the
BacTAlert blood culture system (Organon Teknika Corp) and the BACTEC 9000 Series
blood culture system These two systems detect the production of CO2 as change in pH by
means of colorimetric measures in the former system and by a fluorescent sensor in the
latter (57) The ESP blood culture system (Difco Laboratories) detects changes in pressure
either as gases produced during early microbial growth or later microbial growth (57)
15
These systems have detected growth sooner than earliershygeneration automated and manual
systems and have been found to be comparable in terms of performance (57)
Two other commercially available systems include the Vital blood culture system
(bioMeriex Vitek Hazelwood Mo) and the Oxoid Automated Septicaemia Investigation
System (Unipath Basingstoke United Kingdom) (7)
Interpretation of Positive Blood Cultures
A blood culture is defined as a specimen of blood obtained from a single
venipuncture or IV access device (58) The blood culture remains the ldquogold standardrdquo for
the detection of bacteraemia or fungemia Therefore it is critical that the culture results are
accurately interpreted (ie as true bacteraemia or contamination) not only from the
perspective of individual patient care but also from the view of hospital epidemiology and
public health (9) The accurate identification of the microshyorganism isolated from the blood
culture could suggest a definitive diagnosis for a patientrsquos illness could provide a microshy
organism for susceptibility testing and enable the targeting of appropriate therapy against
the specific microshyorganism (9 17 57)
Different approaches have been proposed to differentiate between contamination
and bacteraemia This has included the identity of the organism the proportion of blood
culture sets positive as a function of the number of sets obtained the number of positive
bottles within a set the volume of blood collected and the time it takes for growth to be
detected in the laboratory (9 17 59)
Identity of the MicroshyOrganism
The identity of the microshyorganism isolated from a blood culture provides some
predictive value to the clinical importance of a positive blood culture The determination of
16
whether a positive blood culture result represents a BSI is typically not difficult with
known pathogenic organisms that always or nearly always (gt90) represent true infection
such as S aureus E coli and other members of the Enterobacteriacae P aeruginosa S
pneumoniae and Candida albicans (7) However it is considerably more difficult to
determine the clinical importance of organisms that rarely (lt5) represent true bacteraemia
but rather may be contaminants or pseudoshybacteraemia such as Corynebacterium species
Bacillus sp and Proprionibacterium acnes (7) Viridians group streptococci and
coagulaseshynegative staphylococci (CoNS) have been particularly problematic as they
represent true bacteraemia between 38 to 50 and 15 to 18 of the time respectively (7
9 59)
The viridans streptococci is a heterogeneous group of low virulence alphashy
haemolytic streptococci found in the upper respiratory tract that plays a role in resistance to
colonization by other bacterial species such as staphylococci (60 61) Despite viridans
streptococci becoming increasingly important pathogens among immuneshycompromised
patients few studies have examined the significance of blood culture isolates in immuneshy
competent patients (60 61)
Due to its complexity studies have used varying definitions to classify viridans
streptococci harbouring blood as a true infection or a contaminant (60 61) Recently
however changes to the National Healthcare Safety Network (NHSN previously the
National Nosocomial Infections Surveillance System [NNIS]) criteria have included
viridans streptococci as a common skin contaminant in their laboratoryshyconfirmed
bloodstream infection definition (38 62)
17
Coagulaseshynegative staphylococci are most often contaminants but they have
become increasingly important clinically as the etiologic agents of central vascular catheter
(CVC)shyassociated bacteraemia and bacteraemia in patients with vascular devices and other
prostheses (17 59) Coagulaseshynegative staphylococci have been reported to account for
38 of cathetershyassociated bacteraemia (9 17 59) However CoNS are also common skin
contaminants that frequently contaminate blood cultures (9) In fact CoNS are the most
common blood culture contaminants typically representing 70shy80 of all contaminant
blood cultures (9) Therefore the interpretation of culture results from patients with these
devices in place is particularly challenging because while they are at higher risk for
bacteraemia such results may also indicate culture contamination or colonization of the
centralshyvascular line (9) As a result it becomes difficult to judge the clinical significance
of a CoNS isolate solely on the basis of its identity (59)
A blood culture cohort study investigating issues related to the isolation of CoNS
and other skin microshyflora was reported by Souvenir et al to determine the incidence of
significant CoNS bacteraemia vs pseudoshybacteraemia (ie contaminants) (63) They found
that 73 of cultures positive for CoNS were due to contamination (63) Similarly
Beekmann et al identified that 78 of episodes of positive blood cultures with CoNS were
contaminants (64) Another study found that CoNS grew from 38 of all positive blood
cultures but only 10 of CoNS represented true bloodstream infection among admitted
patients (65)
Number of Blood Culture Sets
A blood culture set consists of two blood culture bottles one 10mL aerobic and one
10mL anaerobic bottle for a total maximum draw of 20mL of blood (58) The number of
18
blood culture sets that grow microshyorganisms especially when measured as a function of
the total number obtained has proved to be a useful aid in interpreting the clinical
significance of positive blood cultures (55 58 59 66)
For adult patients the standard practice is to obtain two or three blood cultures per
episode (7 59) In two studies using manual blood culture methods (ie conventional nonshy
automated) 80 to 91 of the episodes of bacteraemia or fungemia were detected by the
first blood culture while gt99 were detected by the first two blood cultures (17)
More recently Weinstein et al assessed the value of the third blood culture
obtained in a series from 218 patients who had three blood cultures obtained within 24
hours using an automated continuousshymonitoring blood culture system (17) They
concluded that virtually all clinically important BSIs would be detected with two blood
cultures and that when only the third blood culture in sequence was positive there was a
high probability that the positive result represented contamination (17)
A study in 2004 from the Mayo Clinic using an automated continuousshy monitoring
blood culture system found that two blood cultures only detected 80 of BSIs that three
detected 96 of BSIs and that four were required to detect 100 of BSIs (67) This study
used nurse abstractors to ascertain whether physicians caring for patients judged that the
blood culture isolates represented true bacteraemia or contamination whereas these
decisions were made by infectious diseases physicians in the studies by Weinstein et al
(55 66 67) The authors suspected that infectious diseases physicians were more likely to
make moreshyrigorous judgements about microbial causal relations than physicians without
training and expertise in infectious diseases (68)
19
To assess the applicability of this former study Lee et al reviewed blood cultures at
two geographically unrelated university medical centers to determine the cumulative
sensitivity of blood cultures obtained sequentially during a 24 hour period (58) They
discovered that among monoshymicrobial episodes with three or more blood cultures obtained
during the 24 hour period only 73 were detected with the first blood culture 90 were
detected with the first two blood cultures 98 were detected with the first three blood
cultures and gt99 were detected with the first four blood cultures (58) Based on these
and the results by Cockerill et al they speculated that the reason for the decrease in the
cumulative yield in consecutive cultures in the current era may be that lower levels of
bacteraemia are being detected by modern systems (58) As a result detecting low level
bacteraemia or fungemia may require a greater volume of blood ie more blood cultures
Another proposed explanation was that many more patients were on effective antibiotic
therapy at the time at which blood cultures were obtained and that more blood cultures may
be required because these agents impaired microbial growth (58)
However the authors of this study purposely underestimated the sensitivity of the
blood culture system Thus if a patient had two blood cultures obtained at 8 am and two
more blood cultures obtained at 4 pm on the same day and only the 4 pm blood cultures
were positive the first positive blood culture for that 24shyhour period would be coded as
culture number three (58) It was possible that the patient was not bacteraemic at the time
of the first two blood cultures which underestimated the sensitivity of the system
Although the studies by Cockerill et al and Lee et al indicated that three or more
blood culture sets needed to be obtained to differentiate between contamination and
bacteraemia it still emphasized the need for more than one blood culture set This is
20
because the significance of a single positive result may be difficult to interpret when the
microshyorganism isolated may potentially represent a pseudoshybacteraemia As noted
previously the isolation of CoNS in a single blood culture most likely represents
contamination but may represent clinically important infection in immuneshysuppressed
patients with longshyterm IV access devices prosthetic heart valves or joint prosthesis thus
requiring further blood culture sets for a diagnosis of true bacteraemia (17 57)
Volume of Blood Required for Culture
Culturing adequate volumes of blood improves microbial recovery for both adult
and paediatric patients (7) This is because the number of microshyorganism present in blood
in adults is small usually fewer than 10 colony forming units (CFU)millilitre(mL) with a
minimum of one CFUmL (7 17 57) For adults each additional millilitre of blood
cultured increases microbial recovery by up to three percent (7) However the
recommended volume of blood per culture set for an adult is 10shy30mL and the preferred
volume is 20shy30mL Blood volumes of gt30mL does not enhance the diagnostic yield and
contribute to nosocomial anaemia in patients (57) Moreover blood may clot in the syringe
thereby making it impossible to inoculate the blood into the culture bottles (17 57)
Time to Growth (Time to Positivity)
The amount of time required for the organism to grow in the culture medium is
another factor in determining clinically significant isolates from contaminants (9 59) It has
been suggested that perhaps the blood from a bacteraemia patient will have much higher
inoculums of bacteria than a contaminated culture Consequently larger inoculums will
grow faster than smaller inoculums which have been verified in prior studies of CVCshy
associated BSIs (9 59)
21
Bates et al found that the time to growth was a useful variable in a multivariate
algorithm for predicting true bacteraemia from a positive culture result although it did not
perform as well as either the identification of the organisms or the presence of multiple
positive cultures (69) In contrast Souvenir et al found no significant difference between
the contaminant CoNS and true bacteraemia in the time to detection of the positive culture
(63) The degree of overlap in the detection times of true pathogens versus contaminants is
great such that some experts have recommended that this technological variable should not
be relied upon to distinguish contaminants from pathogens in blood cultures (9 59)
Moreover with the use of continuouslyshymonitoring blood culture systems and the decrease
in time to detection of growth there has been a narrowing in the time difference between
the detection of true pathogens and contaminants (59)
Limitations of Blood Cultures
Although blood cultures currently represent the ldquogold standardrdquo for diagnosing
bacteraemia or fungemia and differentiating between contamination and bloodstream
infection they nonetheless continue to have limitations
The time to obtain results depends on the time required for a particular bacterium to
multiply and attain a significant number of organisms which is species dependent
Therefore positive results require hours to days of incubation (57 70 71)
No one culture medium or system in use has been shown to be best suited to the
detection of all potential bloodstream pathogens Some microshyorganisms grow poorly or
not at all in conventional blood culture media and systems For example fastidious
organisms which require complex nutritional requirements for growth may not grow (70
22
71) Furthermore it lacks sensitivity when an antibiotic has been given before blood
withdrawal often despite resinshycontaining culture fluids (70 71)
Although continuousshymonitoring blood culture systems have been an improvement
from earlier systems there are many facets of blood cultures that continue to cause
problems in the interpretation of results such as volume of blood and the number of blood
cultures (70) In response to the limitations of blood culture systems researchers have
begun the investigation of molecular methods for the detection of clinically significant
pathogens in the blood (57 70 71) The aim of these systems is to identify pathogenic
microshyorganisms within minutes to hours (70) Whether cultureshybased systems will remain
the diagnostic methods of choice or will be replaced by molecular techniques or other
methods remains to be determined
Surveillance
History of Surveillance
The modern concept of surveillance has been shaped by an evolution in the way
health information has been gathered and used to guide public health practice Beginning in
the late 1600s von Leibnitz called for the analysis of mortality reports as a measure of the
health of populations and for health planning Concurrently John Graunt published Natural
and Political Observations Made upon the Bills of Mortality which defined diseaseshy
specific death counts and rates (72) In the 1800s Chadwick demonstrated the relationship
between poverty environmental conditions and disease and was followed by Shattuck who
in a report from the Massachusetts Sanitary Commission related death rates infant and
maternal mortality and communicable diseases to living conditions (72)
23
In the next century Achenwall introduced the term ldquostatisticsrdquo in referring to
surveillance data However it was not until 1839 to 1879 that William Farr as
superintendent of the statistical department of the Registrarrsquos Office of England and Wales
collected analyzed and disseminated to authorities and the public health data from vital
statistics for England and Wales (72 73) Farr combined data analysis and interpretation
with dissemination to policy makers and the public moving beyond the role of an archivist
to that of a public health advocate (72)
In the late 1800s and early 1900s health authorities in multiple countries began to
require that physicians report specific communicable diseases (eg smallpox tuberculosis
cholera plague yellow fever) to enable local prevention and control activities (72)
Eventually local reporting systems expanded into national systems for tracking certain
endemic and epidemic infectious diseases and the term ldquosurveillancerdquo evolved to describe
a populationshywide approach to monitoring health and disease (72)
In the 1960s the usefulness of outreach to physicians and laboratories by public
health officials to identify cases of disease and solicit reports was demonstrated by
poliomyelitis surveillance during the implementation of a national poliomyelitis
immunization program in the United States It was determined that cases of vaccineshy
associated poliomyelitis were limited to recipients of vaccine from one manufacturer
which enabled a targeted vaccine recall and continuation of the immunization program
(72) In 1963 Dr Alexander Langmuir formulated the modern concept of surveillance in
public health emphasizing a role in describing the health of populations (72) He defined
disease surveillance as the
24
ldquocontinued watchfulness over the distribution and trends of incidence through the systematic collection consolidation evaluation of morbidity and mortality reports and other relevant data and regular dissemination of data to all who need to knowrdquo(74)
In 1968 the 21st World Health Assembly established that surveillance was an
essential function of public health practice and identified the main features of surveillance
1) the systematic collection of pertinent data 2) the orderly consolidation and evaluation of
these data and 3) the prompt dissemination of the results to those who need to know
particularly those who are in a position to take action (75) Consequently the World Health
Organization (WHO) broadened the concept of surveillance to include a full range of public
health problems beyond communicable diseases As a result this lead to an expansion in
methods used to conduct surveillance including health surveys disease registries networks
of ldquosentinelrdquo physicians and use of health databases (72)
In 1988 the Institute of Medicine in the United States defined three essential
functions of public health 1) assessment of the health of communities 2) policy
development based on a ldquocommunity diagnosisrdquo 3) assurance that necessary services are
provided each of which depends on or can be informed by surveillance (72)
In 1986 the Centers for Disease Control and Prevention (CDC) defined
epidemiological surveillance as the
ldquoongoing systematic collection analysis and interpretation of health data essential to planning implementation and evaluation of public health practice closely integrated with the timely dissemination of these data to those who need to know The final link in the surveillance chain is the application of these data to prevention and controlrdquo (76)
25
Today surveillance is similarly defined as the ongoing systematic collection
analysis interpretation and dissemination of data about a healthshyrelated event for use in
public health action to reduce morbidity and mortality and to improve health (77 78)
Surveillance systems are important to measure and monitor the burden of an infection or
disease evaluate risk factors for acquiring infections monitor temporal trends in
occurrence and antimicrobial resistance and to identify emerging and reshyemerging
infections with changing severity (50 72 78 79) Furthermore surveillance facilitates and
guides the planning implementation and evaluation of programs to prevent and control
infections evaluation of public policy detection of changes in health practices and the
effects of these changes on infection incidence and provides a basis for epidemiologic
research (78)
Elements of a Surveillance System
Surveillance systems require an operational definition of the disease or condition
under surveillance Defining a case is fundamental and requires an assessment of the
objectives and logistics of a surveillance system Evidence of disease from diagnostic tests
may be important as well as their availability how they are used and the ability to interpret
the results Appropriate definitions vary widely based on different settings information
needs methods of reporting or data collection staff training and resources Surveillance
case definitions should both inform and reflect clinical practice However this objective
may be difficult to achieve when surveillance definitions are less inclusive than the more
intuitive criteria that clinicians often apply in diagnosing individual patients or when
surveillance accesses an information source with limited detail This challenge often arises
when monitoring diseases at a populationshylevel since there is a need for simplicity in order
26
to facilitate widespread use Additionally confusion may arise when definitions established
for surveillance are used for purposes beyond their original intent (72)
All surveillance systems target specific populations which may range from people
at specific institutions to residents of local regional or national jurisdictions to people
living in multiple nations Some surveillance programs seek to identify all occurrences or a
representative sample of specific health events within the population of a defined
geographic area (populationshybased systems) In other situations target sites may be selected
for conducting surveillance based on an a priori assessment of their representativeness a
willingness of people at the sites to participate and the feasibility of incorporating them
into a surveillance network Populationshybased surveillance systems may include notifiable
disease reporting systems the use of vital statistics surveys from a representative sample
or groups of nonshyrandom selected sites (72)
Surveillance systems encompass not only data collection but also analysis and
dissemination Information that is collected by the organization must be returned to those
who need it A surveillance loop begins with the recognition of a health event notification
of a health agency analysis and interpretation of the aggregated data and dissemination of
results The cycle of information flow in surveillance may depend on manual or
technologically advanced methods including the Internet (72)
Personal identifying information is necessary to identify duplicate reports obtain
followshyup information when necessary provide services to individuals to use surveillance
as the basis for more detailed investigations and for the linkage of data from multiple
sources Protecting the physical security and confidentiality of surveillance records is both
an ethical responsibility and a requirement for maintaining the trust of participants (72)
27
Successful surveillance systems depend on effective collaborative relationships and
on the usefulness of the information they generate Providing information back to those
who contribute to the system is the best incentive to participation Documenting how
surveillance data are used to improve services or shape policy emphasizes to participants
the importance of their cooperation (72)
Finally assuring the ethical practice of public health surveillance requires an
ongoing effort to achieve a responsible balance among competing interests and risks and
benefits Competing interests include the desire of people to protect their privacy against
government intrusion and the responsibilities of governments to protect the health of their
constituents and to obtain the information needed to direct public health interventions
Reducing individual embarrassment or discrimination and the stigmatization among groups
requires that surveillance data be collected judiciously and managed responsibly (72)
Types of Surveillance
Surveillance can be divided into four general categories passive active sentinel
and syndromic In many instances multiple approaches or surveillance methods that
complement each other are used to meet information needs (72) Generally passive and
active surveillance systems are based on conditions that are reportable to the health
jurisdiction Sentinel systems are usually designed to obtain information that is not
generally available to health departments
Passive Surveillance
In passive surveillance persons who do not have a primary surveillance role are
relied on for identification and reporting of infections The organization or public health
department conducting the surveillance does not contact potential reporters but leaves the
28
initiative of reporting with others (72 80) For example standardized reporting forms or
cards provided by or available through the local health departments are completed by
physicians or nurses when an infection is detected and returned to the health department
(72 80)
The advantages of conducting passive surveillance are that they are generally less
costly than other reporting systems data collection is not burdensome to health officials
and the data may be used to identify trends or outbreaks if providers and laboratories report
the cases of infection (81)
Limitations inherent in passive surveillance include nonshyreporting or undershy
reporting which can affect representativeness of the data and thus lead to undetected trends
and undetected outbreaks (81) A positive case may not be reported because of a lack of
awareness of reporting requirements by healthcare providers or the perception on the part
of the healthcare providers that nothing will be done (81) Furthermore incomplete
reporting may be due to lack of interest surveillance case definitions that are unclear or
have recently changed or changes in reporting requirements (81) Patients may also refuse
to have their positive results reported Some of these limitations can be attributed to the
reportersrsquo skills and knowledge being centred on patient care rather than surveillance (80)
The most commonly used passive surveillance system is notifiable disease
reporting Under public health laws certain diseases are deemed notifiable meaning that
individual physicians laboratories or the facility (ie clinic or hospital) where the patient is
treated must report cases to public health officials (72 82) Over 50 notifiable diseases are
under Canadian national surveillance through coordination with federal provincial and
territorial governments (83)
29
Active Surveillance
Active surveillance is the process of vigorously looking for infections using trained
personnel such as infection control practitioners epidemiologists and individuals whose
primary purpose is surveillance (72 80) Such personnel are more likely to remain upshytoshy
date with changes in surveillance definitions and reporting procedures (80)
The organization or public health authority conducting the surveillance initiates
procedures to obtain reports via regular telephone calls visits to laboratories hospitals and
providers to stimulate reporting of specific infections (72 80 81) Contact with clinicians
or laboratories by those conducting the surveillance occur on a regular or episodic basis to
verify case reports (81) Furthermore medical records and other alternative sources may be
used to identify diagnoses that may not have been reported (81 82)
Serial health surveys which provide a method for monitoring behaviours associated
with infectious diseases personal attributes that affect infectious disease risk knowledge or
attitudes that influence health behaviours and the use of health services can also be
classified as a form of active surveillance These are usually very expensive if practiced
routinely However as databases become better established and sophisticated it is possible
to link them for active surveillance purposes (82)
Due to the intensive demands on resources it has been suggested that the
implementation of active surveillance be limited to brief or sequential periods of time and
for specific purposes (81) As a result it is regarded as a reasonable method of surveillance
for conditions of particular importance episodic validation of representativeness of passive
reports and as a means of enhancing completeness and timeliness of reporting and for
diseases targeted for elimination or eradication (81)
30
Active surveillance was conducted by 12 centers of the Canadian Immunization
Monitoring Program Active (IMPACT) from 2000shy2007 in children 16 years of age and
younger to determine the influence of the sevenshyvalent pneumococcal conjugate vaccine
(PCV7) immunization programs on the prevalence serotype and antibiotic resistance
patterns of invasive pneumococcal disease caused by S pneumoniae (84) All centres used
the same case finding strategies case definition and report forms
The Canadian Hospital Epidemiology Committee (CHEC) in collaboration with
Health Canada in the Canadian Nosocomial Infection Surveillance Program (CNISP) has
conducted active hospital surveillance for antimicrobialshyresistant bacteria in sentinel
hospitals across the country The CNISP has continued active surveillance for MRSA
infection and colonization however since 2007 only clinically significant isolates resulting
in infection were sent to the National Microbiology Laboratory (NML) for additional
susceptibility testing and molecular typing In 2007 hospital active surveillance continued
for vancomycinshyresistant enterococci (VRE) however only those that were newly identified
in patients (85) Also as of January 1 2007 ongoing and mandatory surveillance of
Clostridium difficileshyassociated diarrhoea (CDAD) was to be done at all hospitals
participating in CNISP (86)
Sentinel Surveillance
Sentinel surveillance involves the collection of case data from only part of the total
population (from a sample of providers) to learn something about the larger population
such as trends in infectious disease (81) It may be useful in identifying the burden of
disease for conditions that are not reportable It can also be classified as a form of active
surveillance in that active systems often seek out data for specific purposes from selected
31
targeted groups or networks that usually cover a subset of the population (82) Active
sentinel sites might be a network of individual practitioners such as primary healthcare
physicians medical clinics hospitals and health centres which cover certain populations at
risk (82)
The advantages of sentinel surveillance data are that they can be less expensive to
obtain than those gained through active surveillance of the total population (81)
Furthermore the data can be of higher quality than those collected through passive systems
(81) The pitfall of using sentinel surveillance methods is that they may not be able to
ensure the total population representativeness in the sample selected (81)
Syndromic Surveillance
The fundamental objective of syndromic surveillance is to identify illness clusters
or rare cases early before diagnoses are confirmed and reported to public health agencies
and to mobilize a rapid response thereby reducing morbidity and mortality (87) It entails
the use of near ldquorealshytimerdquo data and automated tools to detect and characterize unusual
activity for public health investigation (88 89)
It was initially developed for early detection of a largeshyscale release of a biologic
agent however current syndromic surveillance goals go beyond terrorism preparedness
(87) It aims to identify a threshold number of early symptomatic cases allowing detection
of an outbreak days earlier than would conventional reporting of confirmed cases (87)
Recommended syndromes for surveillance include hemorrhagic fever acute respiratory
syndrome acute gastrointestinal syndrome neurological syndrome and a provision for
severe infectious illnesses (88)
32
Syndromic surveillance uses both clinical and alternative data sources Clinical data
sources include emergency department (ED) or clinic total patient volume total hospital or
ICU admissions from the ED ED triage log of chief complaints ED visit outcome
ambulatoryshycare clinic outcome clinical laboratory or radiology ordering volume general
practitionersrsquo house calls and others (87 90shy92) Alternative data sources include school
absenteeism work absenteeism overshytheshycounter medication sales healthcare provider
database searches volume of internetshybased health inquiries and internetshybased illness
reporting (87 93 94)
Limitations in the use of syndromic surveillance include the fact that there is a lack
of specific definitions for syndromic surveillance As a result certain programs monitor
surrogate data sources instead of specific disease syndromes Furthermore certain wellshy
defined disease or clinical syndromes are not included in syndrome definitions (87)
Another important concern is that syndromic surveillance may generate nonshy
specific alerts which if they happen regularly would lead to lack of confidence in a
syndromeshybased surveillance system (95) However Wijingaard et al demonstrated that
using data from multiple registries in parallel could make signal detection more specific by
focusing on signals that occur concurrently in more than one data source (95)
These systems benefit from the increasing timeliness scope and diversity of healthshy
related registries (95) The use of symptoms or clinical diagnoses allows clinical syndromes
to be monitored before laboratory diagnoses but also allows disease to be detected for
which no additional diagnostics were requested or available (including activity of emerging
pathogens) (95)
33
Syndromic surveillance was used for the first time in Canada in 2002 during World
Youth Days to systematically monitor communicable diseases environmentshyrelated illness
(eg heat stroke) and bioterrorism agents Many heatshyrelated illnesses occurred and a
cluster of S aureus food poisoning was identified among 18 pilgrims (96) Syndromic
surveillance identified the outbreak and resulted in rapid investigation and control (96)
Conceptual Framework for Evaluating the Performance of a Surveillance System
The CDC describes the evaluation of public health surveillance systems involving
an assessment of the systemrsquos attributes including simplicity flexibility data quality
acceptability sensitivity positive predictive value representativeness timeliness and
stability Evidence of the systemrsquos performance must be viewed as credible in that the
evidence must be reliable valid and informative for its intended use (78) The following
attributes were adapted from the CDCrsquos guidelines for evaluating public health surveillance
systems in its application to evaluate bloodstream infection surveillance
Level of Usefulness
A surveillance system is useful if it contributes to the prevention and control of
bloodstream infections including an improved understanding of the public health
implications of BSIs An assessment of the usefulness of a surveillance system should
begin with a review of the objectives of the system and should consider the systemrsquos effect
on policy decisions and infectionshycontrol programs Furthermore the system should
satisfactorily detect infections in a timely way to permit accurate diagnosis or
identification prevention or treatment provide estimates of the magnitude of morbidity
34
and mortality related to BSIs detect trends that signal changes in the occurrence of
infection permit the assessment of the effects of prevention and control programs and
stimulate research intended to lead to prevention or control
Simplicity
The simplicity of a surveillance system refers to both its structure and ease of
operation Measures considered in evaluating simplicity of a system include amount and
type of data necessary to establish that BSIs have occurred by meeting the case definition
amount and type of other data on cases number of organizations involved in receiving case
reports level of integration with other systems method of collecting the data method of
managing the data methods for analyzing and disseminating the data and time spent on
maintaining the system
Flexibility
A flexible surveillance system can adapt to changing information needs or operating
conditions with little additional time personnel or allocated funds Flexible systems can
accommodate new BSIs and changes in case definitions or technology Flexibility is
probably best evaluated retrospectively by observing how a system has responded to a new
demand
Data Quality
Data quality reflects the completeness and validity of the data recorded in the
surveillance system The performance of the laboratory data and the case definitions for the
BSIs the clarity of the electronic surveillance data entry forms the quality of training and
supervision of persons who complete these surveillance forms and the care exercised in
data management influence it Full assessment of the completeness and validity of the
35
systemrsquos data might require a special study such as a validation study by comparing data
values recorded in the surveillance system with ldquotruerdquo values
Reliability and Validity
Psychometric validation is the process by which an instrument such as a
surveillance system is assessed for reliability and validity through a series of defined tests
on the population group for whom the surveillance system is intended (97)
Reliability refers to the reproducibility and consistency of the surveillance system
Certain parameters such as testshyretest intershyrater reliability and internal consistency must
be assessed before a surveillance system can be judged reliable (97) In quality indicator
applications poor data reliability is an additional source of random error in the data This
random error makes it more difficult to detect and interpret meaningful variation (80) Data
reliability can be increased by insisting on clear unambiguous data definitions and clear
guidelines for dealing with unusual situations (80)
Validity is an assessment of whether a surveillance system measures what it aims to
measure It should have face content concurrent criterion construct and predictive
validity (97) The validity of a new surveillance system can be established by comparing it
to a perfect measure or ldquogold standardrdquo (80) However perfect measures are seldom
available It is possible to use a less than ideal measure to establish the validity of a new
surveillance system as long as the comparison measurersquos sources of error differ from the
surveillance system being evaluated (80)
Reliability is somewhat a weaker test of a surveillance systemrsquos measurements than
validity is because a highly reliable measure may still be invalid (80) However a
surveillance system can be no more valid than it is reliable Reliability in turn affects the
36
validity of a measure Reliability studies are usually easier to conduct than validity studies
are Survey participants can be interviewed twice or medical charts can be reshyabstracted
and the results compared If multiple data collectors are to be used they can each collect
data from a common source and their results can be compared (80) Reliability studies
should uncover potential problems in the data collection procedures which can direct
training efforts and the redesign of forms and data collection instruments (80)
The use of the kappa statistic has been proposed as a standard metric for evaluating
the accuracy of classifiers and is more reflective of reliability rather than validity Kappa
can be used both with nominal as well as ordinal data and it is considered statistically
robust It takes into account results that could have been caused by chance Validity
measures that quantify the probability of a correct diagnosis in affected and unaffected
individuals do not take chance agreement between the diagnostic test results and the true
disease status into account (98) Kappa is therefore preferable to just counting the number
of misses even for those cases where all errors can be treated as being of similar
importance Furthermore in most studies where kappa is used neither observer qualifies as
a gold standard and therefore two potential sets of sensitivity and specificity measurements
are available (99)
The kappa statistic is quite simple and is widely used However a number of
authors have described seeming paradoxes associated with the effects of marginal
proportions termed prevalence and bias effects (98 99) Prevalence effects occur when the
overall proportion of positive results is substantially different from 50 This is
exemplified when two 2x2 tables have an identical proportion of agreement but the kappa
coefficient is substantially lower in one example than the other (99) One study
37
demonstrated that in the presence of prevalence effects the kappa coefficient is reduced
only when the simulation model is based on an underlying continuous variable a situation
where the kappa coefficient may not be appropriate (99) When adjusting for these effects
Hoehler et al found that there was an increased likelihood of high adjusted kappa scores in
their prevalence effects simulations (99) Another study has demonstrated that the
dependence of kappa on the true prevalence becomes negligible and that this does not
constitute a major drawback of kappa (100)
Bias effects occur when the two classifiers differ on the proportion of positive
results Results from simulation studies by Hoehler et al indicate that the bias effect tends
to reduce kappa scores (99) However it is obvious that this bias (ie the tendency for
different classifiers to generate different overall prevalence rates) by definition indicates
disagreement and is a direct consequence of the definition of kappa and its aim to adjust a
raw agreement rate with respect to the expected amount of agreement under chance
conditions (99 100) It is the aim of the kappa statistic that identical agreement rates should
be judged differently in the light of the marginal prevalence which determine the expected
amount of chance agreement (100) As such studies have suggested that the ordinary
unadjusted kappa score is an excellent measure of chanceshycorrected agreement for
categorical variables and researchers should feel free to report the total percentage of
agreements
Other problems remain in the application of kappa The first is the consequence of
summarizing either a 2x2 or a 3x3 table into one number This results in the loss of
information Secondly the kappa statistic has an arbitrary definition There have been many
attempts to improve the understanding of the kappa statistic however no clear definition as
38
a certain probability exists that facilitates its interpretation (100) As such many studies are
forced to work with the recommendation of Landis and Koch to translate kappa values to
qualitative categories like ldquopoorrdquo ldquomoderaterdquo and ldquoalmost or nearly perfectrdquo although the
cut points they proposed lack a real foundation (100)
There are several other features to consider in the validity assessment of a
surveillance system First passive systems such as those that request physicians or
laboratories to report cases as they arise (but do not have a ldquocheckrdquo or audit mechanism)
run a serious risk of undershyreporting While potentially valuable for providing measures for
trends undershyreporting rates of 50shy100 are often recognized with passive systems (101)
Second ideally all microbiology laboratories in a population should be included in
surveillance to reduce the risk for selection bias (102 103) Where this is not practical or
feasible laboratories should be selected randomly from all those providing service within
the base population All too frequently surveillance is conducted using ad hoc participating
centres with a typical over representation of universityshybased tertiary care centres (60 102)
As these centres frequently have the highest rates of resistance they may result in
overestimation of the prevalence of resistance in the target population overall (102) Third
the correct establishment of the population at risk and the population under study is
important For example studies that aim to look at populations need to ensure that nonshy
residents are strictly excluded (61) Fourth sampling bias particularly with submission of
multiple samples from a patient must be avoided as patients with antibiotic resistant
organisms are more likely to both be reshytested and have repeated positive tests over time
(104) Another practice that is potentially at risk for bias is the submission of consecutive
samples If the time period that such samples are collected is influenced by other factors
39
(such as weekends) bias may also arise Finally laboratory policies and procedures should
be consistent and in the case of multishycentred studies a centralized laboratory is preferred
Acceptability
Acceptability reflects the willingness of persons and organizations to participate in
the surveillance system and is a largely subjective attribute Some factors influencing
acceptability of a surveillance system are the public health importance of BSIs
dissemination of aggregate data back to reporting sources and interested parties
responsiveness of the system to suggestions or comments burden on time relative to
available time ease and cost of data reporting federal and provincial assurance of privacy
and confidentiality and the ability of the system to protect privacy and confidentiality
Sensitivity
Sensitivity of a surveillance system has two levels First at the level of case
reporting it refers to the proportion of cases of BSIs detected by the surveillance system
Second it can refer to the ability to detect outbreaks and monitor changes in the number of
cases over time The measurement of sensitivity is affected by factors such as the likelihood
that the BSIs are occurring in the population under surveillance whether cases of BSIs are
under medical care receive laboratory testing or are coming to the attention of the
healthcare institutions whether BSIs will be diagnosed or identified reflecting the skill of
healthcare providers and the sensitivity of the case definition and whether the cases will be
reported to the system
Positive Predictive Value
Positive predictive value (PPV) is the proportion of reported cases that actually
have the BSIs under surveillance and the primary emphasis is on the confirmation of cases
40
reported through the surveillance system The PPV reflects the sensitivity and specificity of
the case definition and the prevalence of BSIs in the population under surveillance It is
important because a low value means that nonshycases may be investigated and outbreaks
may be identified that are not true but are instead artefacts of the surveillance system
Representativeness
A surveillance system that is representative describes the occurrence of BSIs over
time and its distribution in the population by place and person It is assessed by comparing
the characteristics of reported events to all actual events However since this latter
information is not generally known judgment of representativeness is based on knowledge
of characteristics of the population clinical course of the BSIs prevailing medical
practices and multiple sources of data The choice of an appropriate denominator for the
rate calculation should be carefully considered to ensure an accurate representation of BSIs
over time and by place and person The numerators and denominators must be comparable
across categories and the source for the denominator should be consistent over time when
measuring trends in rates
Timeliness
Timeliness reflects the speed between steps in the surveillance system Factors
affecting the time involved can include the patientrsquos recognition of symptoms the patientrsquos
acquisition of medical care the attending physicianrsquos diagnosis or submission of a
laboratory test and the laboratory reporting test results back to the surveillance system
Another aspect of timeliness is the time required for the identification of trends outbreaks
or the effects of control and prevention measures
41
Stability
Stability refers to the reliability (ie the ability to collect manage and provide data
properly without failure) and availability (the ability to be operational when it is needed) of
the surveillance system A stable performance is crucial to the viability of the surveillance
system Unreliable and unavailable surveillance systems can delay or prevent necessary
public health action
Surveillance Systems for Bacterial Diseases
Canadian Surveillance Systems
A number of systems exist in Canada for bacterial disease surveillance The Public
Health Agency of Canada (PHAC) collects routine passive surveillance data However
this is restricted to reportable diseases and thus may miss important nonshyreportable diseases
or unsuspected emerging infections
The Toronto Invasive Bacterial Diseases Network (TIBDN) collaborative network
of all hospitals microbiology laboratories physicians infection control practitioners and
public health units from the Metropolitan TorontoPeel region (population approximately 4
million) conduct populationshybased surveillance for invasive bacterial diseases (105)
The Calgary Streptococcus pneumoniae Epidemiology Research (CASPER)
conducts prospective populationshybased surveillance unique clinical observations and
clinical trials related to S pneumoniae infections in the Calgary Health Region and shares
many design features in common with the Centersrsquo for Disease Control and Prevention
(CDC) Active Bacterial Core (ABCs) Surveillance program (106)
The Canadian Bacterial Surveillance Network (CBSN) aims to monitor the
prevalence mechanisms and epidemiology of antibiotic resistance in Canada Each year
42
voluntary participant labs from across Canada submit isolates to the centralized study
laboratory to assess resistance trends in a number of common pathogenic bacteria (107)
However while participating centres represent a mix of laboratories providing varying
levels of hospital and community services they are not selected randomly and are therefore
subject to selection bias Furthermore duplicates from a given patient are excluded but the
range of isolates and the number of each isolate is prescribed by the coordinating centre
such that the CBSN cannot assess the occurrence of disease
The Canadian Integrated Program of Antimicrobial Resistance Surveillance
(CIPARS) monitors trends in antimicrobial use and antimicrobial resistance in selected
bacterial organisms from human animal and food sources across Canada This national
active surveillance project includes three main laboratories all employing the same
standardized susceptibility testing methodology (108) Laboratories within each province
forward all human isolates of Salmonella and its varying strains Additionally CIPARS
carries out analysis of drug sales in pharmacies across the country to look for trends in
antibiotic consumption
Other systems exist in Canada to look more specifically at hospitalshyassociated or
nosocomial infections Most notably the CNISP aims to describe the epidemiology of
selected nosocomial pathogens and syndromes or foci At present 49 sentinel hospitals
from nine provinces participate (96) While some areas are ongoing such as collection of
data on MRSA others are smaller often single projects within the system (109 110) The
CNISP also conducts active prospective surveillance in a network of Canadian hospitals of
all ICU patients who have at least one CVC The surveillance program began in January
2006 and uses NHSN CVCshyBSI definitions
43
The Canadian Ward Surveillance Studyrsquos (CANWARD) purpose is to assess the
prevalence of pathogens including the resistance genotypes of MRSA VRE and extendedshy
spectrum betashylactamase (ESBL) isolates causing infections in Canadian hospitals as well
as their antimicrobial resistance patterns (111) It is the first ongoing national prospective
surveillance study assessing antimicrobial resistance in Canadian hospitals In 2008 it
involved ten medical centers in seven provinces in Canada Each medical center collected
clinically significant bacterial isolates from blood respiratory wound and urinary
specimens (111) Some limitations of this study include the fact that they could not be
certain that all clinical specimens represent active infection Furthermore they did not have
admission data for each patient or clinical specimen and thus were not able to provide
completely accurate descriptions of community versus nosocomial onset of infection
Finally they assessed resistance in tertiary care medical centers across Canada and thus
may depict inflated rates compared to smaller community practice hospitals (111)
Other Surveillance Systems
There are a substantial number of local national and international systems
worldwide monitoring and evaluating infections However there are some key systems that
merit introduction
A widely regarded ldquogold standardrdquo bacterial surveillance system is the CDC
Division of Bacterial and Mycotic Diseases ABCs program The ABCs program determines
the burden and epidemiologic characteristics of communityshyacquired invasive bacterial
infections due to a number of selected bacterial pathogens [Streptococcus pyogenes (group
A streptococcus) Streptococcus agalactiae (group B streptococcus) S pneumoniae
Haemophilus influenzae Neisseria meningitidis and MRSA] in several large populations
44
in the United States (total population approximately 41 million) (112 113) Surveillance is
active and all laboratories in the populations under surveillance participate such that
sampling bias is minimized Only cases in residents of the base population are included
only first isolates are included per episode of clinical disease and samples are referred to a
central laboratory for confirmation The limitations of the system is that only a few
pathogens are studied a large budget is required for infrastructural support and even with
audits of participating labs case ascertainment is estimated only at approximately 85shy90
(113)
The SENTRY program was established in January 1997 to measure the
predominant pathogens and antimicrobial resistance patterns of nosocomial and
communityshyacquired infections over a broad network of sentinel hospitals in the United
States (30 sites) Canada (8 sites) South America (10 sites) and Europe (24 sites) (114)
The monitored infections included bacteraemia and fungemia outpatient respiratory
infections due to fastidious organisms pneumonia wound infections and urinary tract
infections in hospitalized patients Although comprehensive in nature by assessing
international patterns some limitations include the fact that they could not be certain that
all clinical specimens represent active infection Furthermore each site judged isolates as
clinically significant by their local criteria which make comparability of these isolates
difficult Finally the use of different sentinel laboratories suggests variability in techniques
used to identify isolates despite having a centralized laboratory to observe susceptibility
data (114)
While the ABCs and the SENTRY systems looks at all infections under
investigation whether they are community or hospital acquired other systems have been
45
developed to specifically look at hospital acquired infections The NNIS system was
developed by the CDC in the early 1970s to monitor the incidence of nosocomial infections
and their associated risk factors and pathogens (115) It is a voluntary system including
more than 300 nonshyrandomly selected acute hospitals across the United States Trained
infection control professionals using standardized and validated protocols that target
inpatients at high risk of infection and are reported routinely to the CDC at which they are
aggregated into a national database collect surveillance data uniformly (116 117)
Infection control professionals in the NNIS system collect data for selected surveillance
components such as adult and paediatric intensive care units high risk nursery and surgical
patients using standard CDC definitions that include both clinical and laboratory criteria
(117) The major goal of the NNIS is to use surveillance data to develop and evaluate
strategies to prevent and control nosocomial infections (115)
Surveillance Methodologies
HospitalshyBased Surveillance Methodology
The landmark Study on the Efficacy of Nosocomial Infection Control (SENIC)
which was conducted by the CDC in the midshy1970s identified the link between infection
surveillance and control programs (ISCPs) and the reduction of nosocomial infections in
acute care facilities The SENIC demonstrated that effective ISCPs were associated with a
32 reduction in nosocomial infections (117) Early in their design they devised a new
method for measuring the rate of nosocomial infections in individual study hospitals the
retrospective review of medical records by nonshyphysicians following a standardized
procedure This was termed the retrospective chart review (RCR) (118 119) Prior to its
46
use researchers sought to evaluate its accuracy and at the same time to refine the data
collection diagnosis and quality control methods
To measure the accuracy of RCR a team of trained surveillance personnel (a
physician epidemiologist and four to seven nurses) determined prospectively the ldquotruerdquo
numbers of infected and uninfected patients in each hospital by monitoring daily all
patients admitted during a specified time period Several weeks later when all clinical and
laboratory data had been recorded in the patientsrsquo medical records a separate team of chart
reviewers (public health professionals) were to determine retrospectively the numbers of
infected and uninfected patients by analyzing those records (119)
The sensitivity of RCR as applied by the chart reviewers averaged 74 in the four
pilot study hospitals with no statistically significant variation among hospitals The
specificity of RCR which averaged 96 ranged from 95 to 99 among the four
hospitals The reliability of RCR for individual chart reviewers ie the probability that two
reviewers will agree whether nosocomial infection was present in a given medical record
averaged at 094 among the four hospitals (119)
Haley et al reported on several factors that required consideration as a result of the
study For example when health professionals other than physicians are employed to
render diagnoses for surveillance the levels of accuracy reported cannot be expected
without adherence to similar stringent measures employed during the study These
measures include limiting the number of conditions studied providing written algorithms
and chart review procedures training and certifying chart reviewers and maintaining
quality control monitoring and feedback (119) Furthermore the results of RCR are
available only after patients have been discharged and collated which may not provide
47
information on trends soon enough to allow effective intervention Finally the costs of
RCR in individual hospitals might not compare favourably with certain prospective
approaches especially those that selectively monitor high risk patients (119)
Mulholland et al raised the possibility that implementation of an infection control
program might in addition to changing patient care increase physiciansrsquo and nursesrsquo
awareness of nosocomial infection and thereby cause them to record in patientsrsquo medical
record more information pertinent to diagnosing infection than they otherwise would (120)
If this was true chart reviewers attempting to diagnose nosocomial infection by the SENIC
technique of RCR might be able to detect infections more accurately in hospitals with an
ISCP than in those without
In response Haley et al performed a prospective intervention study to determine
whether there was an effect of ISCP on charting and RCR accuracy (118) They were
unable to demonstrate consistent statistically significant changes in the frequency of
recorded data information relevant to the diagnosis of nosocomial infection or in the
sensitivity or specificity of RCR (118) These studies provided the scientific foundation for
supporting the introduction of infection control programs and their effectiveness in
reducing nosocomial infections
Traditionally high quality surveillance systems have been similar to ABCs type for
the population level and perform best for community acquired diseases and NNIS type for
hospital based infection control However these are cumbersome and expensive Large
surveillance systems using traditional methodology (manual case identification and caseshy
byshycase clinical record review) similar to the SENIC project and as used in hospitalshybased
infection prevention and control programs have had significant difficulty in either being
48
developed or maintained as a result of its labourshyintensive nature As a result existing
programs have tended to become highly focused (121 122) The ABCs system only looks
at a few organisms provides no information about many medically important invasive
diseases (ie E coli that is the most common cause of invasive communityshyacquired
bacteraemia) and may miss emergence Similarly hospital based infection prevention and
control programs rely on manual collection of laboratory clinical and pharmacy data and
then apply a series of caseshydefinitions in order to define cases While generally often
viewed as a gold standard the application of preshyspecified criteria such as the CDCrsquos NNIS
criteria is susceptible to clinical judgment and intrashyobserver inconsistencies are well
documented (121 123 124)
Routine surveillance requires a major investment in time by experienced
practitioners and is challenging in an entire hospital population particularly in the setting
of major outbreaks where resources must be directed towards control efforts Furthermore
due to the demand on human resources routine surveillance has not been able to be
routinely performed outside acute care institutions Jarvis et al has described the change in
healthcare systems and the challenges of expanding infection prevention and control into
facilities outside the acute care centre (124)
Electronic Surveillance
Automated or electronic surveillance of infectious diseases is the process of
obtaining information from intershyrelated electronic databases for identifying infection
distributions within a particular setting (4) With increasing use and availability of
electronic patient data within healthcare institutions and in community settings the
potential for automated surveillance has been increasingly realized (4)
49
Administrative and laboratoryshybased data may be linked for streamlined data
collection on patient admission demographic and diagnostic information as well as
microbiologic detail species distribution and resistance rates An advantage of electronic
surveillance is that once the system is implemented the size and comprehensiveness of
surveillance is potentially independent of cost (5) In addition by eliminating the need for
review of paper reports and manual data entry case ascertainment and data accuracy may
be improved with electronic based systems
The major potential drawback to electronic data is that it is typically used for patient
care and administrative purposes and unless it is collected with a specific infection
definition in mind important elements may be missing leading to the misclassification of
patients and infections For example defining the presence of a true infection versus
colonization or contamination and its presumed location of acquisition (community
healthcareshyassociated communityshyonset or nosocomial) usually requires integration of
clinical laboratory and treatment information with a final adjudication that often requires
application of clinical judgment This may be difficult based on preshyexisting electronic
records alone
Validity of Existing Electronic Surveillance Systems
A systematic methodological search was conducted to identify published literature
comparing the use of routine electronic or automated surveillance systems with
conventional surveillance systems for infectious diseases (5) Both electronic and manual
searches were used the latter by scanning bibliographies of all evaluated articles and the
authorrsquos files for relevant electronic articles published from 1980 January 01 to 2007
September 30
50
Electronic surveillance was defined by the use of existing routine electronic
databases These databases were not limited to those for hospital administrative purposes
microbiology laboratory results pharmacy orders and prescribed antibiotics Traditional
surveillance systems were broadly defined as those that relied on individual caseshyfinding
through notifications andor review of clinical records by healthcare professionals These
could either be prospective or retrospective or be in any adult or paediatric populations in
primary secondary or tertiary healthcare settings Furthermore for inclusion one or more
of the following validity measures had to be reported or calculable from the data contained
in the report specificity sensitivity positive predictive value (PPV) and negative
predictive value (NPV) (5)
Twentyshyfour articles fulfilled the predetermined inclusion criteria Most (21 87)
of the included studies focused on nosocomial infections including surgical site infections
CVCshyrelated infections postpartum infections bloodstream infections pneumonia and
urinary tract infections Nosocomial outbreaks or clusters rather than individual cases
were investigated in two studies Only three articles validated automated systems that
identified communityshyacquired infections Of the 24 articles eight used laboratory eight
administrative and eight used combined laboratory and administrative data in the electronic
surveillance method
Six studies used laboratory data alone in an electronic surveillance method to detect
nosocomial infections Overall there was very good sensitivity (range 63shy91) and
excellent specificity (range 87 to gt99) for electronic compared with conventional
surveillance Administrative data including discharge coding (International Classification
of Diseases 9th edn Clinical Modification ICDshy9shyCM) pharmacy and claims databases
51
were utilized alone in seven reports These systems overall had very good sensitivity
(range 59shy95 N=5) and excellent specificity (range 95 to gt99 N=5) in detecting
nosocomial infections Six studies combined both laboratory and administrative data in a
range of infections and had higher sensitivity (range 71shy94 N=4) but lower specificity
(range 47 to gt99 N=5) than with use of either alone Only three studies looked at
unrelated communityshyonset infections with variable results Based on the reported results
electronic surveillance overall had moderate to high accuracy to detect nosocomial
infections
An additional search was conducted by JL to identify similarly published literature
evaluating electronic surveillance systems up until 2010 June 01 Only one study published
in 2008 was found that met similar criteria outlined above
Woeltje et al evaluated an automated surveillance system using existing laboratory
pharmacy and clinical electronic data to identify patients with nosocomial centralshyline
associated BSI and compared results with infection control professionalsrsquo reviews of
medical records (125) They evaluated combinations of dichotomous rules and found that
the best algorithm included identifying centralshyline use based on automated electronic
nursing documentation the isolation of nonshycommon skin commensals and the isolation of
repeat nonshycommon skin commensals within a five day period This resulted in a high
negative predictive value (992) and moderate specificity (68) (125)
Use of Secondary Data
Secondary data are data generated for a purpose different from the research activity
for which they were used (72) The person performing the analysis of such data often did
not participate in either the research design or data collection process and the data were not
52
collected to answer specific research questions (126) In contrast if the data set in question
was collected by the researcher for the specific purpose or analysis under consideration it
is primary data (126)
With the increasing development of technology there has been a parallel increase in
the number of automated individualshybased data sources registers databases and
information systems that may be used for epidemiological research (127 128) Secondary
data in these formats are often collected for 1) management claims administration and
planning 2) the evaluation of activities within healthcare 3) control functions 4)
surveillance or research (127)
Despite the initial reasons for data collected in secondary data sources most
researchers in epidemiology and public health will work with secondary data and many
research projects incorporate both primary and secondary data sources (126) If researchers
use secondary data they must be confident of the validity of those data and have a good
idea of its limitations (72) Additionally any study that is based on secondary data should
be designed with the same rigour as other studies such as specifying hypotheses and
estimating sample size to get valid answers (127)
Various factors affect the value of secondary data such as the completeness of the
data source in terms of the registration of individuals the accuracy and degree of
completeness of the registered data the size of the data source data accessibility
availability and cost data format and linkage of secondary data (127 128)
The completeness of registered individuals in the secondary data source is reflected
by the proportion of individuals in the target population which is correctly classified in the
53
data source Therefore it is important to determine whether the data source is populationshy
based or whether it has been through one or more selection procedures (127)
The completeness of a data source could be evaluated in three ways The first is to
compare the data source with one or more independent reference sources in which whole
or part of the target population is registered This comparison is made case by case and is
linked closely with the concept of sensitivity and positive predictive values described above
(127) The second method involves reviewing medical records which are used particularly
with hospital discharge systems (127) Finally aggregated methods could be used where
the total number of cases in the data source is compared with the total number of cases in
other sources or the expected number of cases is calculated by applying epidemiological
rates from demographically similar populations (127) The accuracy of secondary data
sources is therefore based on comparing them with independent external criteria which
can be found through medical records or based on evaluation As such no reference
standard for the evaluation of secondary data sources exists and it may be more important
to examine reproducibility and the degree of agreement with one or more reference data
sources (127)
The size of the data source involves knowing how many people and how many
variables are registered in the data source This will facilitate determining the appropriate
software for the management of large files and whether the use of the data is feasible (127
128) Special programs could be used to reduce the data set by eliminating superfluous
redundant and unreliable variables combining variables deleting selecting or sampling
records and aggregating records into summary records for statistical analysis (128)
54
Data accessibility availability and cost needs to be determined prior to the use of
secondary data as often it is not clear who owns the data and who has the right to use them
(127) Information on data confidentiality is also essential to ensure protection of
confidential data on individuals which are reported to the data source This can be
maintained by using secure servers multiple passwords for data access and using
abbreviated identifiers in researchersrsquo data (127)
The linkage of different data sources can help identify the same person in different
files Ideally the linkage should be completed using an unambiguous identification system
such as a unique personal number that is assigned at birth is unique permanent universal
and available (72 127) If these unique identifiers are not available other sources of
information may be used such as birth date name address or genetic markers However
these latter options are at greater risk of error If there are problems with the linkage the
study size may shrink which reduces precision Furthermore bias may be introduced
related to the migration in and out of the population if it is related to social conditions and
health Finally people may change their name later in life which may correlate with social
conditions including health (72)
Limitations of Secondary Data Sources
There are disadvantages in the use of secondary data sources The first major
disadvantage is inherent in its nature in that the data were not collected to answer the
researcherrsquos specific research questions and the selection and quality of methods of their
collection were not under the control of the researcher (72 126shy128)
Secondly individualshybased data sources usually consist of a series of records for
each individual containing several items of information much of which will not cover all
55
aspects of the researcherrsquos interest (126 127) For example most studies based on registers
have limited data on potential confounders therefore making it difficult to adjust for these
confounders (72) A related problem is that variables may have been defined or categorized
differently than what the researcher would have chosen (126)
Many databases particularly those used primarily for administrative functions are
not designed or maintained to maximize data quality or consistency More data are
collected than are actually used for the systemrsquos primary purpose resulting in infrequently
used data elements that are often incompletely and unreliably coded (128)
Hospital discharge databases may include admissions only to selected hospitals
such as universityshyaffiliated urban hospitals and may exclude admissions to smaller rural
based or federal hospitals (128) These exclusions may preclude using these data sources
for populationshybased studies since admissions of large groups of persons from some
communities would not be captured (128)
Advantages of Secondary Data Sources
The first major advantage of working with secondary data is in the savings of
money that is implicit in preshycollected data because someone else has already collected the
data so the researcher does not have to devote resources to this phase of the research (126shy
128) There is also a savings of time Because the data are already collected and frequently
cleaned and stored in electronic format the researcher can spend the majority of his or her
time analyzing the data (126shy128)
Secondly the use of secondary data sources is preferred among researchers whose
ideal focus is to think and test hypotheses of existing data sets rather than write grants to
56
finance the data collection process and supervising student interviewers and data entry
clerks (126 128)
Thirdly these data sources are particularly valuable for populationshybased studies
These databases provide economical and nearly ideal sources of information for studies that
require large numbers of subjects This reduces the likelihood of bias due to recall and nonshy
response (127 128)
Fourthly these databases often contain millions of personshyyears of experience that
would be impossible to collect in prospective studies (126 127) If a sample is required it
does not have to be restricted to patients of individual providers or facilities (128)
Secondary data sources can be used to select or enumerate cases The study may
still require primary data collection however preshyexisting databases can provide a sampling
frame a means for identifying cases or an estimate of the total number of cases in the
population of interest (128) This is especially helpful if interested in identifying and
measuring rare conditions and events (127 128) Related to this is the use of a sampling
frame to select a study population and collect information on exposure diseases and
sometimes confounders (127)
Finally the existing databases may be used to measure and define the magnitude
and distribution of a health problem prior to the development of a definitive study requiring
primary data collection (127)
LaboratoryshyBased Data Sources
Laboratoryshybased surveillance can be highly effective for some diseases including
bloodstream infections The use of laboratory data sources provides the ability to identify
patients seen by many different physicians acute care centres community healthcare
57
centres outpatient facilities long term care facilities and nursing homes especially when
diagnostic testing for bloodstream infections is centralized The use of a centralized
laboratory further promotes complete reporting through the use of a single set of laboratory
licensing procedures and the availability of detailed information about the results of the
diagnostic test (72)
Despite the inherent benefits of using laboratoryshybased data sources for surveillance
there are limitations in the use of blood cultures for accurate detection of bloodstream
infections and in the use of secondary automated databases both noted above
Surveillance systems that primarily employ laboratory systems for the identification
of BSIs may be subject to biases that may have a harmful effect For example if falsely low
or high rates of BSIs by pathogenic organisms are reported inadequate treatment or
excessively broadshyspectrum therapy may be prescribed with the adverse result of treatment
failure or emergence of resistance respectively (104)
In the case of BSIs and the use of a laboratory information system the type of bias
of greatest consideration in this study is selection bias The introduction of selection bias
may be a result of selective sampling or testing in routine clinical practices and commonly
by the failure to remove multiple repeated or duplicate isolates (104 129)
Sampling is usually based on bacteria isolated from samples submitted to a clinical
microbiology laboratory for routine diagnostic purposes and this can lead to bias (130)
Firstly laboratory requesting varies greatly among clinicians Secondly selective testing by
clinicians may bias estimates from routine diagnostic data as estimates from routine data
reflect susceptibilities for a population that can be readily identified by practitioners which
are often those patients where a decision to seek laboratory investigations has been taken
58
(131) This selective testing involves reduced isolate numbers and therefore underestimates
the prevalence of positive cultures overall
Furthermore the frequency of collection of specimens is affected not only by the
disease (ie infection) but also by other factors such as the age of the patient with
specimens being collected from elderly patients more often than from younger patients
(130 132 133) Therefore duplicate isolates pertaining to the same episode of infection
should be excluded from estimated measures of incidence to reduce the potential for bias
Selection bias is also identified in BSI reports from surveillance programs in the
literature based on surveys conducted in single institutions One of the limitations of these
studies is the geographic localization of the individual hospitals which may reflect a more
susceptible population to BSIs Many of these hospitals are at or are affiliated with medical
schools The reports are subject to misinterpretation of estimates because these hospitals
often treat patients who are more seriously ill or who have not responded to several
antimicrobial regimens tried at community hospitals which further selects for more serious
BSIs and highly resistant organisms (102) Such reporting can lead to the belief that BSIs
and resistance to antimicrobials is generated in large urban hospitals However the most
serious cases end up in these hospitals but the sources could be and most likely are other
hospitals clinics and private practices (102)
The inclusion of repeated infections with the same organisms yielding multiple
indistinguishable isolates and not clearly independent episodes introduces a form of
selection bias This has been documented in terms of antimicrobial resistance in that it is
believed that more specimens are submitted from patients with resistant organisms and the
inclusion of these duplicate isolates may bias estimates of resistance compared to those
59
infected with nonshyresistant pathogens (134 135) By including duplicate isolates in
bloodstream infections it would inaccurately increase the speciesshyspecific incidence of BSIs
and the overall incidence of BSIs The usual practice for addressing this selection bias is to
exclude duplicate isolates of the same organisms from the same patient or represent
multiple isolates by a single example in both the numerator and denominator in the
calculation of BSI rates (130)
There is no clear agreement on the time period to regard as the limit for an isolate to
be considered a duplicate (135 136) Studies have assessed a limit of 5 days and 7 days
after which repeat isolates are not considered duplicates (137 138) Five or seven days may
be too short a cutshyoff period for a single episode of infection or colonization as patients
may remain in hospital for long periods of time or require treatments that necessitate
readmission to hospital (136) In another comparison of cutshyoff periods of 5 30 and 365
days one study suggested that 365 days was the best interval for classifying isolates as
duplicates (135) A study conducted in the Calgary Health Region also suggested that a
oneshyyear duplicate removal interval be used for laboratoryshybased studies as they found that
reporting all isolates resulted in 12 to 17shyfold higher rate of resistance specifically
depending on the antimicrobial agent and pathogen (104)
Information bias may also be present in laboratoryshybased surveillance systems
particularly where there is misclassification of an organism isolated from blood cultures
and its susceptibility pattern to antimicrobial agents It is crucial for laboratories to provide
accurate methodologies for determining pathogens in blood cultures so that effective
therapy and infection control measures can be initiated Surveillance systems using
laboratoryshybased data need to ensure that blood culture testing systems are both sensitive
60
and specific in detecting bloodshyborne pathogens (139) Furthermore standardized
internationally accepted techniques need to be employed consistently with regular quality
assurance
Confounding bias may be introduced in epidemiological studies based on using
laboratoryshybased surveillance if coshymorbid illnesses are not captured The presence of coshy
morbid illnesses has a major influence on the occurrence and outcome of infectious
diseases While the presence or absence of a particular coshymorbidity is typically evaluated
as a risk factor for acquiring an infectious disease in observational research rating scales
that encompass a number of coshymorbidities are commonly used to adjust for effects on
outcome (140) The direction and magnitude of the confounding bias will depend on the
relative strengths of the association between the extraneous factors with that of exposure
and disease Stratification of data by these attributes known to be associated with BSIs can
control the confounding bias
61
Development of the Electronic Surveillance System in the Calgary Health Region
An electronic surveillance system (ESS) was developed in the Calgary Health
Region to monitor bloodstream infections among patients in the community in hospitals
and in various outpatient healthcare facilities The purpose of the ESS was to accurately
and consistently identify and report incident episodes of BSIs in various settings with the
goal of providing an efficient routine and complete source of data for surveillance and
research purposes Linking data from regional laboratory and hospital administrative
databases from years 2000 to 2008 developed the ESS Definitions for excluding isolates
representing contamination and duplicate episodes were developed based on a critical
review of literature on surveillance of infectious diseases (6 11 141 142) Bloodstream
infections were classified as nosocomial healthcareshyassociated communityshyonset
infections or communityshyacquired infections according to definitions described and
validated by Friedman et al (6) These definitions were applied to all patients in the CHR
with positive blood cultures However for surveillance of BSIs nonshyresidents of the CHR
were excluded
The ESS was assessed to determine whether data obtained from the ESS were in
agreement with data obtained by traditional manual medical record review A random
sample of patients with positive blood cultures in 2005 was selected from the ESS to
conduct retrospective medical record reviews for the comparison The definitions for
episodes of BSIs and the location of acquisition of the BSIs were compared between the
ESS and the medical record review Discrepancies were descriptively outlined and
definitions were revised based on a subjective assessment of the number of discrepancies
found between the ESS and the medical record review The discrepancies were discussed
62
with a panel of healthcare professionals including two physician microbiologists and an
infectious disease specialist No a priori rule for revising definitions was used The revised
definitions were reviewed in the same random sample of patients initially selected and were
not evaluated prospectively in a different sample of patients at the time
The ESS identified 323 true episodes of BSI while the medical record reviewers
identified only 310 true episodes of BSI The identification of incident episodes of BSI was
concordant between the ESS and medical record review in 302 (97) episodes (143) Of
the eight discordant episodes identified by the medical record review but not the ESS a
majority of the discrepancies were due to multiple episodes occurring in the same patient
which the ESS did not classify either because they were due to the same species as the first
episode or were classified as polyshymicrobial episodes which the reviewers listed them as
separate unique episodes (143) Of the 21 discordant episodes identified by the ESS but not
by the medical record review 17 (81) were classified as representing isolation of
contaminants by the medical record review (143) Most of these were due to isolates with
viridans streptococci (12 71) followed by CoNS (3 18) and one episode each of
Peptostreptococcus species and Lactobacillus species (143) Four patients had an additional
episode of disease caused by a different species within the year that was identified by the
ESS which reviewers classified as polyshymicrobial (143)
The overall independent assessment of location of acquisition by medical record
review was similar to that by the ESS The overall agreement was 85 (264 of 309
episodes) between the medical record review and the ESS (κ=078 standard error=004)
Discrepancies were due to missing information in the ESS on the presence of acute cancer
and attendance at the Tom Baker Cancer Centre (TBCC) (n=8) the occurrence of day
63
procedures performed in the community (n=7) and patientrsquos acute centre and other
healthcare system encounters (n=10) Further discrepancies occurred where the medical
record reviewers did not identify previous emergency room visits in the previous two to
thirty days prior to diagnosis of the BSI (n=6) previous healthcare encounters (n=4) and
timing of blood culture result or clinical information that suggested that the pathogen was
incubating prior to hospital admission (n=8) due to missing information in the medical
record Two episodes were discordant because the blood culture samples were obtained 48
hours or more after hospital admission which the medical record reviewers classified as
nosocomial but the ESS did not because these patients had multiple encounters with the
emergency department during their hospitalization (143)
Stepwise revisions were made to the original definitions in the ESS in an attempt to
improve their agreement with medical record review in a post hoc manner These revisions
included adding the viridans streptococci as a contaminant including International
Classification of Diseases Nine Revision Clinical Modification (ICDshy9shyCM) and
International Classification of Diseases Tenth Revision (ICDshy10) codes to identify patients
with active cancer and revising previous emergency department visits within the past two
to 30 days before the onset of BSI to specify visits within the past five to 30 days before
BSI These revisions resulted in an overall agreement of 87 with κ=081 (standard
error=004) (143)
The overall objective of this study was to evaluate the developed ESS definitions
for identifying episodes of BSI and the location where the BSIs were acquired compared to
traditional medical record review and to revise definitions as necessary to improve the
64
accuracy of the ESS However further validation of the developed and revised definitions
in a different patient sample is required
65
OBJECTIVES AND HYPOTHESES
Primary Objectives
To validate revised definitions of bloodstream infections classification of BSI
acquisition location and the focal body source of bloodstream infection in a previously
developed electronic surveillance system in the adult population of the Calgary Health
Region (CHR) Alberta in 2007 (143)
Secondary Objectives
a) If validated then to apply the electronic populationshybased surveillance system to
evaluate the 2007
a Overall and speciesshyspecific incidence of bloodstream infections to
determine disease occurrence
b Classification of bloodstream infections as nosocomial healthcareshy
associated communityshyonset or communityshyacquired
c Focal body source of bloodstream infections using microbiology laboratory
data
d Inshyhospital caseshyfatality associated with bloodstream infections
Research Hypotheses
b) The ESS will be highly concordant with retrospective medical record review in
identifying BSIs
c) The ESS will be highly concordant with retrospective medical record review in
identifying the location of acquisition of BSIs
d) The ESS will identify the primary or focal body source of BSIs when compared to
retrospective medical record review
66
e) S aureus and E coli will have the highest speciesshyspecific incidence rates in 2007
f) Healthcareshyassociated communityshyonset BSIs will be more common than
nosocomial or communityshyacquired BSIs
g) The demographics organism distribution and inshyhospital caseshyfatality will be
distinct between communityshyacquired healthcareshyassociated communityshyonset and
nosocomial BSIs
67
METHODOLOGY AND DATA ANALYSIS
Study Design
The main component of this project involved retrospective populationshybased
laboratory surveillance conducted at Calgary Laboratory Services (CLS) with linkage to the
Calgary Health Region (CHR) Data Warehousersquos hospital administrative databases from
the year 2007
Patient Population
Electronic Surveillance System
A cohort of all patient types were included ndash inshypatient outshypatient emergency
community nursing homelongshyterm care and outshyofshyregion patients with a positive blood
culture drawn at a site within the CHR The CHR (currently known as the Calgary Zone
Alberta Health Services since April 2009) provides virtually all acute medical and surgical
care to the residents of the cities of Calgary and Airdrie and a large surrounding area
(population 12 million) in the Province of Alberta Calgary Laboratory Services is a
regional laboratory that performs gt99 of all blood culture testing in the CHR All adult
(gt18 years of age) patients with positive blood cultures during 2007 were identified by
CLS
Comparison Study
Random numbers were assigned to episodes of BSI in the ESS using Microsoft
Accessrsquo 2003 (Microsoft Corp Redmond WA) autoshynumber generator From a list of
patients with positive blood cultures in 2007 a random sample of 307 patients were
selected from within the electronic surveillance system (ESS) cohort for detailed review
68
and validation of revised electronic surveillance definitions based on the results by Leal et
al (143)
Sample Size
This study was designed to 1) explore the validity of electronic surveillance 2)
report the incidence and associated inshyhospital caseshyfatality rate associated with
bloodstream infections (BSIs) For the first objective the sample size of 307 for the
validation cohort was chosen to be large enough to include a range of etiologic agents but
remain within the practical limitations of the investigators to conduct medical record
reviews Furthermore when the ESS was estimated to have an expected kappa statistic of
85 with both the manual chart review and the ESS having a 10 probability of
classifying the acquisition for true episodes of BSI then the estimated sample size would be
307 (absolute precision=01) The second objective was to report the natural incidence of
all BSIs in the CHR Since sampling was not performed for this objective determination of
sample size was not relevant
Development of the Electronic Surveillance System
The first step in the development of the ESS was to identify all adult patients (gt18
years of age) in the CHR who had a positive blood culture in 2007 The data on positive
blood cultures including all isolates susceptibilities basic demographic information and
the location of culture draw were obtained from Cernerrsquos PathNet Laboratory Information
System (LIS classic base level revision 162) which uses Open Virtual Memory System
(VMS) computer language Microbiologic data on isolates and susceptibilities were based
on standard Clinical amp Laboratory Standards Institute (CLSI) criteria Since 2002 PathNet
69
has been populated with hospital admission and discharge dates and times associated with
microbiologic culture results
The second step was to obtain additional clinical information from the regional
corporate data warehousersquos Oracle database system which used Structured Query
Language and Procedural LanguageStructured Query Language (SQL) by uploading the
patient list identified by the laboratory database which contained patient healthcare
numbers (PHN) and regional health record numbers (RHRN) Detailed demographic
diagnostic and hospital outcome information was obtained for any acute care encounter not
limited to hospitalshybased clinic visits Home Parenteral Therapy Program (HPTP)
registrations dialysis treatments from the Southern Alberta Therapy Program (SARP)
Emergency Department (ED) assessments or admissions to any acute care institution in the
CHR
Admission data were based on the time the bed order was made (which is timeshy
stamped in the data warehouse) and were linked to data on the location and time the culture
sample was obtained during that hospital stay Specifically hospital admission and
discharge dates in the data warehouse were matched with patient blood cultures from CLS
These were matched if CHR inshypatient admission dates were one day prior to seven days
after the CLSshybased admission date or the positive blood culture start date was within seven
days to the CHR inshypatient admission or discharge dates Where the patient had multiple
admissions within this time period the admission and discharge dates were determined by
the order location of the patient at the time the blood culture was drawn
These two databases (ie Cernerrsquos PathNet LIS and the data warehousersquos Oracle
database systems) were not linked as a relational database prior to the development of the
70
ESS but they were related to each other because they both contain PHNs and RHRNs The
linking of these two databases was based on the fact that they both contained PHNs and
RHRN that were validated by checking the patientrsquos last name and date of birth
The third step involved the application of study definitions in a stepwise fashion by
the use of queries and flags in Microsoft Access 2003 SQL Figure 41 outlines the stepwise
development of the ESS Table 41 lists and describes all the fields used in the ESS
following linkage of electronic data sources and exported from Access 2003
71
Figure 41 Computer Flow Diagram of the Development of the ESS
Access Cernerrsquos PathNet Laboratory Information System at Calgary Laboratory Services
Identify all adult patients (gt18 years) in the CHR with positive blood cultures during 2007
Upload patient list from lab database to data warehouse using Patient Healthcare Numberrsquos (PHN) and Regional
Record Number (RHRN)
Apply Structured Query Language (SQL) and Procedural LanguageStructured Query Language (PLSQL)
Collect demographic diagnostic and hospital outcome information for any acute care encounters
Linkage of laboratory data with regional corporate warehouse data based on PHNs RHRNs Validated by
patient last name and date of birth
Stepwise application of study definitions using Microsoft Access 2003 SQL queries and flags
Query 1 Identify incident cultures as first isolate per 365 days
Query 2 Classify incident isolates as true pathogens
Query 3 Classify incident isolates as Monoshymicrobial or PolyshyMicrobial episodes of BSI
Exclude repeat isolates
Exclude contaminant isolates
Query 4 Classify location of acquisition for incident episodes of BSI
72
Table 41 Description of Fields in the ESS after Linkage of Electronic Data Sources on Microsoft Access 2003
Field Name Field Descriptor Field Format PatSys
PHN
LastName FirstName MiddleName DOB Gender PtType
Client MedRecNum
RHA
CDR_Key
CHRSite
CHRSiteDesc
CHRAdmit
CHRDischarge
CHRAdmittedFrom
DischargeStatus PriorHospitalization
System Patient Identifier shy assigned by Cerner to identify unique patient Personnal (Provincial) Health Care Number or Cerner generated identifier if patient does not have health care Patients last name Patients first name Patients middle name Patients date of birth Patients gender Patient Type shy Inpatient Ambulatory (community) eMmergency Nursing Home Renal Doctor or hospital identifier ordering the test Regional health number for inshypatients or PHN for community patients For Alberta residents the RHA is a 2 character code that identifies the health region the patient lives in For outshyofshyprovince patients the RHA identifies the province they are from RHA is determined based on postal code or residence name if postal code is not available RHA is not available RHA in the table is current regional health authority boundary System generated number that is used to uniquely identify an inpatient discharge for each patient visit (the period from admit to discharge) Sitehospital identifier where patient was admitted Sitehospital description where patient was admitted Datetime patient was admitted to hospital (for inshypatients only) Datetime patient was discharged from hospital (for inshypatients only) Sitehospital identifier if patient was transferred in from another health care facility Deceased (D) or alive (null) Any hospital admission for 2 or more days in the previous 90 days 1=yes null = no
Text
Text
Text Text Text YYYYMMDD Text Text
Text Text
Text
Number
Text
Text
YYYYMMDD hhmm YYYYMMDD hhmm Text
Text Number
73
Field Name continued PriorRenal
Cancer
NursingHomeLong TermCare Accession CultureStart
Isolate ARO
GramVerf
Gram1 Gram2 Gram3 Gram4 A 5FC A AK A AMC A AMOX A AMP A AMPHOB A AMS A AZITH A AZT A BL A C A CAS A CC A CEPH A CFAZ A CFEP A CFIX A CFOX A CFUR A CIP A CLR A COL A CPOD A CTAX
Field Descriptor Field Format
Patient attended a renaldialysis clinic 1=yes Number null = no Patient receiving treatment for cancer 1=yes Number null = no Patient resides in a nursing home or long term Number care residence 1=yes null = no Blood culture identifier Text Datetime blood culture was received in the YYYYMMDD laboratory hhmm Isolate identified in blood culture Text Antibiotic resistant organism (MRSA VRE Text ESBL MBLhellip) Datetime gram stain was verified YYYYMMDD
hhmm Gram stain result Text Gram stain result Text Gram stain result Text Gram stain result Text 5 shy FLUOROCYTOSINE Text Amikacin Text AmoxicillinClavulanate Text AMOXICILLIN Text Ampicillin Text AMPHOTERICIN B Text AMOXICILLINCLAVULANATE Text AZITHROMYCIN Text AZTREONAM Text Beta Lactamase Text CHLORAMPHENICOL Text
Text CLINDAMYCIN Text CEPHALOTHIN Text CEFAZOLIN Text CEFEPIME Text CEFIXIME Text CEFOXITIN Text CEFUROXIME Text CIPROFLOXACIN Text CLARITHROMYCIN Text COLISTIN Text CEFPODOXIME Text CEFOTAXIME Text
74
Field Name Field Descriptor Field Format continued A CTAZ CEFTAZIDIME Text A CTRI CEFTRIAXONE Text A DOX DOXYCYCLINE Text A E ERYTHROMYCIN Text A FLUC FLUCONAZOLE Text A FUS FUSIDIC ACID Text A GAT GATIFLOXACIN Text A GM GENTAMICIN Text A GM5 GENTAMICIN 500 Text A IPM IMIPENEM Text A IT ITRACONAZOLE Text A KETO KETOCONAZOLE Text A LEV LEVOFLOXACIN Text A LIN LINEZOLID Text A MER MEROPENEM Text A MET METRONIDAZOLE Text A MIN MINOCYCLINE Text A MOXI MOXIFLOXACIN Text A MU MUPIROCIN Text A NA NALIDIXIC ACID Text A NF NITROFURANTOIN Text A NOR NORFLOXACIN Text A OFX OFLOXACIN Text A OX CLOXACILLIN Text A PEN PENICILLIN Text A PIP PIPERACILLIN Text A PTZ PIPERACILLINTAZOBACTAM Text A QUIN QUINUPRISTINDALFOPRISTIN Text A RIF RIFAMPIN Text A ST2000 STREPTOMYCIN 2000 Text A STREP STREPTOMYCIN Text A SXT TRIMETHOPRIMSULFAMETHOXAZOLE Text A SYN SYNERCID Text A TE TETRACYCLINE Text A TIM TICARCILLINCLAVULANATE Text A TOB TOBRAMYCIN Text A TROV TROVAFLOXACIN Text A VA VANCOMYCIN Text A VOR
75
Definitions Applied in the Electronic Surveillance System
Residents were defined by a postal code or residence listed within the 2003
boundaries of the Calgary Health Region Table 42 outlines modified regional health
authority (RHA) indicators from the data warehouse used to identify residents and nonshy
residents of the CHR in the ESS Both CHR residents and nonshyresidents were included in
the validation component of this study however only CHR residents were included in the
surveillance of BSIs to estimate the incidence of BSIs in the CHR
Table 42 Modified Regional Health Authority Indicators
Guidelines Notes RHA supplied by Calgary Health Region matched by primary key RHA matched by postal code
RHA by client type
RHA = 99 for out of province healthcare numbers RHA = 99 for third billing patient type RHA = 03 for XX patients
RHA supplied by Calgary Health Region Emergency visit file
Postal code list was made up of postal codes supplied by the Calgary Health Region and then manually identified by comparing to an Alberta Region map If client was within the Calgary Health Region or outside Healthcare number prefixes matched to CLS patient healthcare number prefix documents
Calgary Health Region uses XX for homeless patients so it was decided that homeless patients treated in the Calgary Health Region would be considered residents of the Calgary Health Region If patient identified by patient healthcare number attended an ED 3 months prior to 1 month before the blood culture date
Homeless patients treated in a regional institution and patients who were admitted
to the ED one to three months before collection of culture samples were considered to be
residents if other residency indicators were not available
76
Definitions to ascertain BSIs assign a likely location of acquisition and define the
focal source of the BSIs for use by the ESS are shown in Table 43
Table 43 Bloodstream Infection Surveillance Definitions
Characteristic Electronic Definition References Bloodstream Infection Pathogen recovered from gt1 set of blood
cultures or isolation of organisms commonly associated with contamination from gt2 sets of
(11)
Hospital Acquired (Nosocomial)
blood cultures within 5 days First culture positive gt48 hours after hospital admission or within 48 hours of discharge from hospital If transferred from another institution then the duration of admission calculated from
(6 11)
Healthcareshyassociated communityshyonset
admission time to first hospital First culture obtained lt48 hours of admission and at least one of 1) discharge from HPTP clinic within the prior 2shy30 days before bloodstream infection 2) attended a hospital clinic or ED within the prior 5shy30 days before bloodstream infection 3) admitted to Calgary Health Region acute care hospital for 2 or more days within the prior 90 days before bloodstream infection 4) sample submitted from or from patient who previously sent a sample from a nursing home or long term care facility 5) active dialysis 6) has an ICDshy10shyCA code for active acute cancers as an indicator of
(6 141 142)
those who likely attended or were admitted to the TBCC
Community Acquired First culture obtained lt48 hours of admission and not fulfilling criteria for healthcare associated
(6)
Primary Bloodstream Infection
No cultures obtained from any body site other than surveillance cultures or from intravascular
(11 28)
devices within + 48 hours Secondary Bloodstream Infection
At least one culture obtained from any body site other than surveillance cultures or from
(6 11)
intravascular devices within +48 hours diptheroids Bacillus species Proprionibacterium species coagulaseshynegative
staphylococci micrococci viridians group streptococci
77
Contamination of blood culture bottles was defined by a) the number of bottles
positive ndash if an isolate only grows in one of the bottles in a 4shybottles set it may have been
considered to be a contaminant if it was part of the normal flora found on the skin and b)
the type of isolate ndash bacteria that are common skin commensals may have been considered
contaminants if they were only received from a single bottle in a blood culture set
Coagulase negative staphylococci viridans streptococcus Bacillus sp Corynebacterium
sp and Propionibacterium acnes were considered some of the most common blood culture
contaminants
Polyshymicrobial infections were defined as the presence of more than one species
isolated concomitantly within a twoshyday period Given that BSIs may also be associated
with multiple positive blood cultures for the same organism from the same episode of
disease new episodes of BSIs were defined as isolation of the same organism as the first
episode gt365 days after the first or with a different organism as long as it was not related
to the first isolate as part of a polyshymicrobial infection This resulted in the exclusion of
duplicate isolates from the same or different blood cultures if they occurred within 365
days after the first isolate of the incident episode
Patients transferred from nonshyCHR institutions where the length of hospital stay
was unknown were considered to have nosocomial infection
A list of patients residing in nursing homes was created from Cernerrsquos PathNet LIS
by patient type ldquoNrdquo (referring to cultures drawn from nursing homelongshyterm care) with a
minimum culture date (based on any culture not restricted to blood) A business rule was
set based on the assumption that patients generally do not leave nursing homes or longshyterm
care facilities and return to the community Therefore for any blood cultures drawn after
78
the minimum culture date the patient was assumed to live in some type of nursing home or
longshyterm care facility Appendix A lists definitions of some variables obtained from the
CHR data warehouse which helped formulate the queries for determining the location of
acquisition of bloodstream infections
ICDshy10shyCA codes for active cancer used in the ESS as a proxy for identifying
patients who likely received some form of cancer therapy were based on the coding
algorithms by Quan et al (144) These were developed and validated in a set of 58805
patients with ICDshy10shyCA data in Calgary Alberta
The source of BSI was solely based on positive microbiologic culture data from
another body site other than blood Table 44 lists the focal culture guidelines used by the
ESSrsquos data analyst
79
Table 44 Focal Culture Guidelines for the ESS Algorithm
Focal Code Site Procedure Source Urinary Tract M URINE shy gt107 CFUmL urine cultures Infection M ANO2 shy kidney
M FLUID shy bladder shy nephrostomy drainage
Surgical Site M ANO2 shy Specimens related to heart bypass surgery Infection M WOUND shy Pacemaker pocket Pneumonia M BAL shy ETT
M BW shy lung biopsy or swab M PBS M SPUTUM
Bone and Joiny M ANO2 shy kneeshoulder M FLUID shy synovial
shy bursa shy joint fluid shy bone
Central Nervous M ANO2 shy cerebrospinal fluid System M FLUID shy brain dura matter Cardiovascular M ANO2 shy cardiac fluid System M FLUID shy valve tissue Ears Eyes Nose M BETA shy any source related to EENT and Throat M EYE shy mastoid
M EYECRIT shy sinus M EAR shy tooth sockets M MOUTH shy jaw
Gastrointestinal M ANO2 shy peritoneal M FLUID shy ascetic M STOOL shy JP Drain M WOUND shy Liver
shy Biliary shy Bile shy Gall Bladder
Lower M FLUID shy pleural Respiratory shy thoracentesis fluid Infection Reproductive Skin and Soft M WOUND shy ulcer Tissue M TISSUE shy burn
shy skin shy soft tissue shy surgical site other than bypass
80
Comparison of the ESS with Medical Record Review
For a random sample of hospitalized patients data on episodes of bloodstream
infection location of acquisition and focal body source of the BSIs were obtained from the
ESS to assess whether these data were in agreement with similar data obtained by
traditional medical record review All charts of this random sample of patients were
reviewed concurrently by a research assistant and an infectious diseases physician by
means of a standardized review form and directly entered into a Microsoft Access 2003
database Appendix B shows the layout of the standardized review form Table 45
describes the fields of information collected in the medical record review
81
Table 45 Description of Fields in the Medical Record Review on Microsoft Access 2003
Field Name Field Descriptor Field Format IICRPK Primary key AutoNumber Patient Patient identifier Number DOB Date of Birth DateTime Gender Male=1 Female=2 Unknown=3 Number City of Residence Text Episode New form for each episode Number Culture Number InfectContam Infection=1 Contamination=2 Number Etiology Isolate Text CultureComments Text Episode Diagnosis Date First Date DateTime Episode Diagnosis Time DateTime Polymicrobial Yes=1 No=2 Number Fever Yes=1 No=2 Number Chills Yes=1 No=2 Number
Hypotension Yes=1 No=2 Number BSIContam Comments Text Acquisition 1Nosocomial 2 Healthcareshyassociated 3 Number
Community acquired HCA_IVSpecialCare IV antibiotic therapy or specialized care at YesNo
home other than oxygen within the prior 30 days before BSI
HCA_HospHemoChemo Attended a hospital or haemodialysis clinic YesNo or IV chemotherapy within the prior 30 days before BSI
HCA_HospAdmit Admitted to hospital for 2 or more days YesNo within the prior 90 days before BSI
HCA_NH Resident of nursing home or long term care YesNo facility
AcquisitionComments Text InfectionFocality 1 Primary 2 Secondary Number UTI YesNo UTIsite CDC Definitions Text UTICultureConf YesNo SSI YesNo SSISite Text SSICultureConf YesNo SST YesNo SSTSite Text SSTCultureConf YesNo
82
Field Name continued Field Descriptor Field Format Pneu PneuSite PneuCultureConf BSI BSISite BSICultureConf BJ BJSite BJCultureConf CNS CBSSite CNSCultureConf CVS CVSSite CVSCultureConf EENT EENTSite EENTCultureConf GI GISite GICultureConf LRI LRISite LRICultureConf Repr ReprSite ReprCultureConf Sys SysSite SysCultureConf DiagnosisComments DischargeStatus CourseOutcomeCOmments AdmissionDate AdmissionTime DischargeDate DischargeTime Location Initials ReviewDate ReviewDateStart ReviewDateStop DrInitials
YesNo Text YesNo YesNo Text YesNo YesNo Text YesNo YesNo Text YesNo YesNo Text YesNo YesNo Text YesNo YesNO Text YesNo YesNo Text YesNo YesNo Text YesNo YesNo Text YesNo Text
Alive=1 Deceased=2 Text Text DateTime DateTime DateTime DateTime Text
Initials of Reviewer Text DateTime DateTime DateTime
Initials of doctor chart reviewer Text
83
Field Name continued Field Descriptor Field Format DrReviewDate DateTime
Medical records were requested at acute care sites based on patient name regional
health record number admission date and acute care site identified from the ESS The
reviewers were unaware of the ESS classification of isolates episodes of BSI location of
acquisition and focal body source of BSIs
Definitions Applied in the Medical Record Review
Residents were identified by the presence of their city of residence in the emergency
departmentrsquos or hospital admission forms identified in the medical record review
Proposed definitions to ascertain BSIs assign a likely location of acquisition and
define the focal source of the BSI for use by the reviewers are shown in Table 46
84
Table 46 Medical Record Review Definitions for Bloodstream Infection Surveillance
Characteristic Traditional Definition References Bloodstream Infection Patient has at least one sign or symptom fever
(gt38ordmC) chills or hypotension and at least one of 1) pathogen recovered from gt1 set of blood cultures 2) isolation of organisms commonly associated with contamination from gt2 sets of
(11)
Hospital Acquired (Nosocomial)
Healthcareshyassociated communityshyonset
Community Acquired
blood cultures within 5 days No evidence the infection was present or incubating at the hospital admission unless related to previous hospital admission First culture obtained lt48 hours of admission and at least one of 1) iv antibiotic therapy or specialized care at home other than oxygen within the prior 30 days before bloodstream infection 2) attended a hospital or hemodialysis clinic or IV chemotherapy within the prior 30 days before bloodstream infection 3) admitted to hospital for 2 or more days within the prior 90 days before bloodstream infection or 4) resident of nursing home or long term care facility Bloodstream infections not fulfilling criteria for either nosocomial or healthcare associated
(6 11)
(6 141 142)
(6)
Primary Bloodstream Infection
Bloodstream infection is not related to infection at another site other than intravascular device
(11 28)
associated Secondary Bloodstream Infection
Bloodstream infection is related to infection at another body site (other than intravascular device) as determined on the basis of all available clinical radiographic and laboratory evidence
(6 11)
diptheroids Bacillus species Proprionibacterium species coagulaseshynegative
staphylococci micrococci viridians group streptococci
Contamination of blood cultures was defined by the isolation of organisms that
were considered part of the normal skin flora and for which there was no information
supporting a classification of BSI
85
Polyshymicrobial infections were traditionally defined as a single episode of disease
caused by more than one species Given that BSI may also be associated with multiple
positive cultures with the same organism from the same episode of disease new episodes of
BSI were defined as another isolation of the same or other species not related to the first
episode through treatment failure or relapse post therapy
The definitions for location of acquisition were included in the standardized form to
ensure uniformity in the application of the definitions
Patients transferred from nonshyCHR institutions where the length of hospital stay
was unknown were considered to have nosocomial infection
The focal source of BSI was established based on all available clinical laboratory
and radiological information in the medical record as defined in the CDCrsquos Definitions of
Nosocomial Infections (11)
Data Management and Analysis
Data were managed by using Microsoft Access 2003 (Microsoft Corp Redmond
WA) and analysis was performed using Stata 100 (StataCorp College Station TX)
Electronic Surveillance System
Patientrsquos medical records were randomly chosen for retrieval by assigning random
numbers to all episodes in the ESS The ESS study data were maintained and stored on the
secure firewall and password protected server at CLS Study data for analysis were
maintained and stored on the secure firewall and password protected server at Alberta
Health Services without any patient identifiers (ie postal code patient healthcare numbers
and regional health record numbers)
86
Comparison Study
The number of incident episodes of BSI and the proportion of episodes that were
nosocomial healthcareshyassociated communityshyonset or communityshyacquired infections in
the ESS and the medical record review were determined and then compared descriptively
Concordant episodes were those in which the ESS and the medical record review classified
episodes of BSI the same and discordant episodes were those in which the ESS and the
medical record review classified episodes of BSI differently All episodes in which the
chart review and the ESS were discordant were qualitatively explored and described
Agreement and kappa statistics were calculated using standard formulas and
reported with binomial exact 95 confidence intervals (CI) andor standard errors (SE)
(Appendix C) Bootstrap methods in the statistical software were used to determine 95 CI
because the classification of acquisition consisted of three categories Kappa was used to
measure the level of agreement as a proximate measure of validity between the ESS and the
medical record review for identifying the location of acquisition for the cohort of patients
with true BSIs Categorical variables were tested for independence using the Pearsonrsquos chishy
squared test (plt005) For continuous variables medians and intershyquartile ranges (IQR)
were reported The nonshyparametric MannshyWhitney UshyTest was used to compare medians
between groups (plt005)
Overall and speciesshyspecific populationshybased incidence rates of BSIs were
calculated using as the numerator the number of incident cases and the denominator the
population of the CHR at risk as obtained from the Alberta Health Registry Duplicate
isolates were excluded based on the ESSrsquos algorithms The proportion of cases that were
nosocomial healthcareshyassociated communityshyonset or community acquired was
87
calculated Mortality was expressed by reporting the inshyhospital caseshyfatality rate per
episode of disease
Ethical Considerations
This study involved the analysis of existing databases and no patient contact or
intervention occurred as a result of the protocol Patient information was kept strictly
secure Quality Safety and Health Information and the Centre for Antimicrobial Resistance
have clinical mandates to reduce the impact of preventable infections among residents of
the Calgary Health Region The evaluation of a routine surveillance system to track
bloodstream infections will benefit residents of the Calgary Health Region Such
information will be helpful for monitoring patient safety and may improve patient care by
early identification of bloodstream infections outbreaks or emerging pathogens or resistant
organisms Individual patient consent to participate was not sought in this project for
several reasons First a large number of patients were included and therefore acquiring
consent would have been very difficult Second most of the information included in this
study came from existing databases available to the investigators and minimal clinical data
was further accessed from patient charts Third and most importantly bloodstream
infection is acutely associated with a higher mortality rate (15shy25) Contacting patients or
the representatives of those that have died years after their illness would have been highly
distressing to many This study was approved by the Conjoint Health Research Ethics
Board at the University of Calgary
88
RESULTS
PopulationshyBased Surveillance Based on the Application of the ESS Algorithms
Incident Episodes of Bloodstream Infection
In 2007 there were 4500 organisms isolated from blood cultures among adults (18
years and older) Seventyshyeight percent (n=3530 784) of these were classified as
pathogenic organisms while 215 were classified as common contaminants found in
blood Of the pathogenic organisms cultured 1834 (519) were classified as first blood
isolates within 365 days among adults of which 1626 occurred among adults in the CHR
Twelve of these pathogens were excluded because they were unshyspeciated duplicates of
pathogens isolated in the same blood culture This resulted in 1614 episodes of BSIs with
1383 (857) being monoshymicrobial and 109 (675) polyshymicrobial episodes (Figure
51) Overall there were 1492 incident episodes of BSIs among 1400 adults in the CHR
for an incidence rate of 1561 per 100000 population
89
Figure 51 Flow Diagram of Incident Episodes of Bloodstream Infection by the ESS
4500 Organisms
3530 Pathogens
970 Single Contaminants
1696 Duplicate Isolates Removed
1834 First blood isolates within 365 days
208 First Blood Isolates within 365 days among NonshyCHR Residents
1626 First Blood Isolates within 365 days among CHR Residents
12 Isolates excluded because unshyspeciated
1614 First blood isolates within 365 days among CHR Residents
1492 Incident episodes of BSI
1383 MonoshyMicrobial BSI 109 PolyshyMicrobial BSI
90
Three patients did not have a date of birth recorded but the median age among the
1397 adults with one or more incident BSIs was 626 years (IQR 484 ndash 777 years) The
incident episodes of BSI occurred among 781 (558) males The median age of males
(617 years IQR 498 ndash 767 years) was not significantly different from the median age of
females (639 years IQR 467 ndash 792) (p=0838)
Aetiology of Episodes of Bloodstream Infections
Among the 1383 monoshymicrobial episodes of BSI in adult residents of the CHR
the most common organisms isolated were E coli (329 238) S aureus (262 189) S
pneumoniae (159 115) and coagulaseshynegative staphylococci (78 56) Of the 109
polyshymicrobial episodes of incident BSIs there were 231 first blood isolates within 365
days that occurred within 5 days from each other The most common organisms isolated in
the polyshymicrobial episodes were E coli (34 147) S aureus (22 952) Klebsiella
pneumoniae (21 909) and coagulaseshynegative staphylococci (13 563) Table 51
describes the speciesshyspecific incidence rate per 100000 of the top twenty most common
organisms isolated among all incident BSIs There were 1614 first blood isolates within
365 days isolated from the incident BSIs
91
Table 51 The 2007 SpeciesshySpecific Incidence among Adult Residents (gt18 years) of the Calgary Health Region
Organism N Incidence Rate () [per 100000 adult population]
Escherichia coli
MethicillinshySusceptible Staphylococcus aureus (MSSA) MethicillinshyResistant Staphylococcus aureus (MRSA) Streptococcus pneumoniae
Klebsiella pneumoniae
Coagulaseshynegative staphylococci (CoNS)
Streptococcus pyogenes
Enterococcus faecalis
Bacteroides fragilis group
Pseudomonas aeruginosa
Enterobacter cloacae
Streptococcus agalactiae
Klebsiella oxytoca
Enterococcus faecium
Streptococcus milleri group
Streptococcus mitis group
Peptostreptococcus species
Proteus mirabilis
Candida albicans
Group G Streptococcus
363 (225) 199
(123) 87
(54) 166
(1029) 92
(570) 91
(564) 61
(378) 46
(285) 41
(254) 39
(242) 26
(161) 26
(161) 22
(136) 22
(136) 19
(118) 17
(105) 15
(093) 15
(093) 14
(087) 14
(087)
380
208
91
174
96
95
64
48
43
41
27
27
23
23
20
18
16
16
15
15
92
Organism continued N Incidence Rate () [per 100000 adult population]
Candida glabrata 12 13 (074)
Clostridium species not perfringens 10 11 (062)
Other (Appendix C) 217 227 (134)
Acquisition Location of Incident Bloodstream Infections
Of the 1492 incident episodes of BSI 360 (24) were nosocomial 535 (359)
were healthcareshyassociated communityshyonset and 597 (400) were community acquired
(Table 52)
Table 52 Description of 2007 Incident BSIs among Adult Residents of the Calgary Health Region by Acquisition Location
Acquisition Location Variable CA HCA NI Number () 597 (400) 535 (359) 360 (240) Median Age (IQR) 579 (449 ndash 733) 650 (510 ndash 803) 663 (542 ndash 775) Male N () 333 (558) 278 (520) 234 (650) Incidence per 624 559 376 100000 population
A crude comparison of the median ages between different acquisition groups
showed that there was a significant difference in median age by acquisition (plt00001)
This was significant between HCA and CA BSIs (plt00001) and in the median age
between NI and CA (plt00001) (Table 52) No difference was observed in the median age
between the NI and HCA BSIs (p=0799) (Table 52) When stratified by gender in each
acquisition group there was no significant difference in the median age of males and
females in either group (NI p=00737 HCA p=05218 CA p=06615) however the
number of BSIs in each acquisition group was more frequent among males
93
Of the 535 incident episodes of BSI that were healthcareshyassociated communityshy
onset infections 479 (895) had one or more previous healthcare encounters prior to an
admission with an incident BSI within 48 hours of the admission The 56 episodes that did
not have a classified previous healthcare encounter were among patients who were
transferred into an acute care site from an unknown home care program (35 625) a
nursing home (14 25) a senior citizen lodge (4 714) or an unknown or unclassified
health institution (3 535) Table 53 describes the distribution of previous healthcare
encounters prior to the incident BSIs The classifications are not mutually exclusive
Table 53 Distribution of Previous Healthcare Encounters Prior to Incident BSIs among Adult Patients in the Calgary Health Region (2007)
Previous Healthcare Encounter N () Prior hospitalization 245
(458) Prior ED visit within 5 days prior to the 123 incident episode of BSI (247) ICDshy10shyCA code for active cancer as proxy 105 for previous cancer therapy and attendance at (196) the Tom Baker Cancer Centre Resident of a long term care facility or 104 nursing home (194) Renal patient on haemodialysis 100
(187) Prior HPTP 29
(54) Prior day procedure 12
(224)
The median time between blood culture collection and admission was 270 hours
(1125 days IQR 521shy2656 days) for nosocomial BSIs 1 hour prior to admission (IQR 5
hours prior ndash 2 hours after admission) for HCAshyBSIs and 1 hour prior to admission (IQR 5
hours prior ndash 1 hour after admission) for CAshyBSIs
94
Among the nosocomial BSIs S aureus (99 25) E coli (55 1399) coagulaseshy
negative staphylococci (38 967) and K pneumoniae (25 636) were the most common
pathogens isolated The most common pathogens isolated among the HCAshyBSIs were E
coli (132 2264) S aureus (121 2075) S pneumoniae (39 669) and K
pneumoniae (35 60) Similarly E coli S aureus and S pneumoniae were the most
common pathogens isolated among CAshyBSIs followed instead by S pyogenes (40 627)
Table 54 outlines the pathogen distribution by acquisition group for organisms that
comprise up to 75 of all bloodstream infections in each group
Table 54 The 2007 Organism Distribution by Acquisition Location for Incident BSIs among Adults in the Calgary Health Region
Number of Bloodstream Infections (N=1614)
Organism Name NI HCA CA Total n () n () n () N ()
MSSA 64 (163) 81 (139) 50 (78) 195 (121) MRSA 36 (92) 40 (69) 15 (24) 91 (56) E coli 55 (140) 132 (226) 176 (276) 363 (225) S pyogenes 4 (10) 17 (29) 40 (63) 61 (38) S agalactiae 0 (00) 14 (24) 12 (19) 26 (16) S pneumoniae 5 (13) 39 (67) 122 (191) 166 (103) CoNS 38 (97) 33 (57) 20 (31) 91 (56) K pneumoniae 25 (64) 35 (60) 32 (50) 92 (57) E faecalis 18 (46) 19 (33) 9 (14) 46 (29) E faecium 15 (38) 4 (07) 3 (05) 22 (14) P aeruginosa 18 (46) 19 (33) 2 (031) 39 (24) B fragilis group 14 (36) 10 (17) 19 (30) 43 (27) Calbicans 12 (31) 1 (02) 1 (02) 14 (09) Other 89 (226) 139 (238) 137 (215) 365 (226) Total 393 583 638 1614
Patient Outcome
In 2007 there were 1304 admissions to an acute care centre among patients with
incident episodes of BSI Most admissions occurred among urban acute care sites such as
95
Foothills Medical Centre (FMC) (607 465) Peter Lougheed Centre (PLC) (359
2753) and Rockyview General Hospital (RGH) (308 2362) Among rural sites
Strathmore District Health Services (SDHS) had the highest number of admissions among
patients with incident episodes of BSI (181304 138) The overall median length of stay
(LOS) was 1117 days (IQR 554shy2719 days)
Patient outcome information was only available for those patients who were
admitted to an acute care centre Patients could have multiple episodes of incident BSIs
during a single admission Of the 1492 episodes 1340 had inshyhospital outcome
information available Of the 1340 inshyhospital cases 248 patients died for an inshyhospital
caseshyfatality rate of 0185 (185) Twentyshynine (117) deaths occurred after a polyshy
microbial incident episode of BSI Table 55 outlines the number of deaths following
episodes of BSI by the BSIrsquos location of acquisition (χ2 1308 plt0001)
Table 55 InshyHospital Outcome by Location of Acquisition of Incident BSIs among Adults in the Calgary Health Region
Acquisition Location N ()
InshyHospital Outcome
CA HCA NI Total N ()
Alive Deceased Total
451 (897) 52 (103)
503 (1000)
396 (830) 81 (170)
477 (1000)
245 (681) 115 (319) 360 (1000)
1092 (815) 248 (185)
1340 (1000)
96
Medical Record Review and Electronic Surveillance System Analysis
A total of 308 patients were sampled among patients identified by the ESS and
included in the analysis A total of 661 blood cultures were drawn from these patients with
a total of 693 different isolates These isolates comprised 329 episodes of bloodstream
contamination or infection in the medical record review for comparison with the electronic
surveillance system data
The 308 patients had a median age of 609 years (IQR 482shy759 years) and
comprised of 169 (55) males The median age of males (631 years IQR 532shy764 years)
was statistically different from the median age of females (578 years IQR 434shy743)
(p=0009) Almost ninety percent (899) of these patients were from the CHR
Aetiology
Medical Record Review
The pathogens most commonly isolated from the blood cultures were S aureus
(165693 238) E coli (147693 212) S pneumoniae (73693 105) and
coagulaseshynegative staphylococci (50693 72) Table 56 identifies the frequency
distribution of all the pathogens isolated Among the S aureus isolates 79 (482) were
MRSA
97
Table 56 Distribution of Organisms Collected from 661 Cultures Based on the Medical Record Review
Organism Name Number () Aeromonas species 1 (014) Alcaligenes faecalis 1 (014) Anaerobic Gram negative bacilli 5 (072) Anaerobic Gram negative cocci 1 (014) B fragilis igroup 1 (014) C albicans 5 (072) Candida famata 1 (014) C glabrata 2 (029) Candida krusei 2 (029) Capnocytophaga species 1 (014) Citrobacter freundii complex 2 (029) Clostridium species not perfringens 2 (029) Clostridium perfringens 4 (058) CoNS 50 (72) Corynebacterium species 3 (043) Coryneform bacilli 4 (058) E cloacae 8 (115) Enterobacter species 1 (014) E coli 147 (212) Fusobacterium necrophorum 2 (029) Gemella morbillorum 2 (029) Gram positive bacilli 1 (014) Group G streptococcus 5 (072) Haemophilus influenzae Type B 2 (029) Haemophilus influenzae 1 (014) Haemophilus influenzae not Type B 2 (029) K oxytoca 4 (058) K pneumoniae 35 (505) Klebsiella species 2 (029) Lactobacillus species 6 (087) Neisseria meningitidis 4 (058) Peptostreptococcus species 6 (087) P mirabilis 5 (072) Providencia rettgeri 2 (029) P aeruginosa 17 (245) Rothia mucilaginosa 1 (014) Serratia marcescens 5 (072) Staphylococcus aureus 165 (238) Stenotrophomonas maltophilia 4 (058) S agalactiae 11 (159) Streptococcus bovis group 2 (029)
98
Organism Name continued Number () Streptococcus dysgalactiae subsp Equisimilis 7 (101) S milleri group 15 (216) S mitis group 2 (029) S pneumoniae 73 (105) S pyogenes 16 (231) Streptococcus salivarius group 2 (029) Viridans streptococci 4 (058) Veillonella species 1 (014)
There were 287 (917) monoshymicrobial episodes of BSIs and 26 (83) polyshy
microbial episodes of BSIs Escherichia coli (68 237) S aureus (64 223) S
pneumoniae (40 139) K pneumoniae (14 49) and coagulaseshynegative staphylococci
(11 38) were the most common pathogens implicated in the monoshymicrobial
bloodstream infections (Table 57) Similarly E coli (214) S aureus (125) and K
pneumoniae (89) were frequently isolated in polyshymicrobial bloodstream infections
(Table 58)
99
Table 57 Frequency of Organisms among MonoshyMicrobial Episodes of BSIs in the Medical Record Review (MRR) and the Electronic Surveillance System (ESS)
Organism Name MRR ESS N () N ()
Aeromonas species 1 (04) 1 (03) A faecalis 1 (04) 1 (03) Anaerobic gram negative bacilli 1 (04) 1 (03) B fragilis group 2 (07) 3 (10) C albicans 2 (07) 2 (07) C famata 1 (04) 1 (03) C glabrata 2 (07) 2 (07) C krusei 1 (04) 2 (07) Capnocytophaga species 1 (04) 1 (03) C freundii complex 2 (07) 2 (07) Clostridium species not perfringens 1 (04) 1 (03) C perfringens 1 (04) 1 (03) CoNS 11 (38) 20 (67) Corynebacterium species 1 (04) 2 (067) E cloacae 4 (14) 4 (14) E faecalis 9 (31) 9 (30) E faecium 3 (11) 5 (17) E coli 68 (236) 66 (222) F necrophorum 1 (04) 1 (03) Group G streptococcus 2 (07) 2 (07) H influenzae Type B 1 (04) 1 (03) H influenzae 1 (04) 1 (03) H influenzae not Type B 1 (04) 1 (03) K oxytoca 2 (07) 2 (07) K pneumoniae 14 (49) 15 (51) Lactobacillus species 2 (07) 3 (10) N meningitidis 1 (04) 1 (03) Peptostreptococcus species 4 (14) 4 (14) P mirabilis 2 (07) 2 (07) P aeruginosa 6 (21) 6 (20) R mucilaginosa 0 (00) 1 (03) S marcescens 2 (07) 2 (07) S aureus 64 (223) 60 (202) S maltophilia 1 (04) 1 (03) S agalactiae 5 (17) 5 (17) S bovis group 0 (00) 1 (03) S dysgalactiae subsp Equisimilis 4 (14) 4 (14) S milleri group 8 (28) 7 (24) S mitis group 1 (04) 1 (03) S pneumoniae 40 (140) 38 (128)
100
Organism Name continued MRR ESS N () N ()
S pyogenes 10 (35) 10 (34) S salivarius group 1 (04) 1 (03) Viridans streptococcus 0 (00) 1 (03) Veillonella species 1 (04) 1 (03)
101
Table 58 Frequency of Organisms among PolyshyMicrobial Episodes of BSI in the Medical Record Review (MRR) and the Electronic Surveillance System (ESS)
Organism MRR ESS N () N ()
Anaerobic gram negative bacilli 2 (36) 1 (213) Anaerobic gram negative cocci 1 (18) 1 (213) B fragilis group 1 (18) 1 (213) C perfringens 1 (18) 1 (213) CoNS 2 (36) 2 (423) E cloacae 2 (36) 2 (423) E faecalis 1 (18) 1 (213) E faecium 3 (54) 1 (213) Enterococcus species 1 (18) 1 (213) E coli 12 (214) 10 (213) Gmorbillorum 1 (18) 1 (213) Gram negative bacilli 0 (00) 1 (213) Gram positive bacilli 1 (18) 1 (213) Group G streptococcus 1 (18) 1 (213) K oxytoca 1 (18) 1 (213) K pneumoniae 5 (89) 5 (106) Peptostreptococcus species 1 (18) 1 (213) Pmirabilis 2 (36) 2 (426) P rettgeri 1 (18) 1 (213) P aeruginosa 3 (54) 3 (638) S aureus 7 (125) 7 (149) S agalactiae 1 (18) 1 (213) S bovis group 1 (18) 0 (00) S pneumoniae 1 (18) 1 (213) Viridans Streptococcus 1 (18) 0 (00)
Electronic Surveillance System
There were 297 (934) monoshymicrobial episodes of BSIs and 21 (66) polyshy
microbial episodes identified by the ESS Of the polyshymicrobial episodes five had three
different pathogens implicating the BSIs while 16 had two different pathogens implicating
the BSIs Among the monoshymicrobial episodes of BSIs the pathogens most commonly
isolated were E coli (66297 222) S aureus (60297 202) S pneumoniae (38297
128) and coagulaseshynegative staphylococci (20297 67) (Table 57)
102
Of the 60 S aureus isolates 20 (333) were MRSA Escherichia coli (1047
213) and S aureus (747 149) were pathogens commonly isolated from polyshy
microbial episodes of BSIs however K pneumoniae was isolated in 106 of the polyshy
microbial episodes (Table 58) Of the 7 isolates of S aureus 3 (429) were MRSA
Episodes of Bloodstream Infections
Medical Record Review
Among the 329 episodes identified 313 (951) were classified as episodes of BSI
while 16 (49) were classified as episodes of bloodstream contamination This
dichotomization was based on all available microbiology and clinical information in the
patientrsquos medical chart related to that episode Of the 313 BSIs 292 (933) were first
episodes 17 (54) were second episodes and 4 (13) were third episodes Therefore the
313 BSIs occurred among 292 patients The median age of these patients was 605 years
(IQR 486shy759) and 158 (541) were males The median age of males (631 years IQR
534shy764) was statistically different from the median age of females (578 years IQR 433shy
743 years) Two hundred sixtyshytwo (897) of these patients were from the CHR
Three symptoms characteristic of an infectious process (ie fever chills and
hypotension) were collected for all recorded episodes Among the identified bloodstream
infections 12 (38) did not have any infectious symptom identified in the medical record
review 95 (303) had only one symptom 125 (399) had two symptoms and 79
(252) had all three symptoms identified and recorded Two episodes did not have any
symptoms recorded by the reviewer which has been attributed to the reviewer not actively
identifying them in the medical record Of those that had symptoms recorded fever (244
103
815) was the most frequent symptom associated with infection followed by hypotension
(171 572) and chills (143 479)
Electronic Surveillance System
The ESS identified 344 pathogens as being the first isolate of that pathogen within
365 days These first blood isolates comprised 318 episodes of bloodstream infection
among 301 of the 308 patients that had their medical records reviewed Seven patients did
not have an episode of BSI because they did not have a first blood isolate within 365 days
The median age of these patients was 612 years (IQR 489 ndash 759 years) The median age
of males (632 years IQR 534 ndash 766) was significantly higher than the median age of
females (579 years IQR 434 ndash 743 years) (p=001) Ninety percent (903) of these
patients were from the CHR
Acquisition Location of Bloodstream Infections
Medical Record Review
The location of acquisition was recorded for all episodes of bloodstream infections
Oneshyhundred thirtyshysix (434) were CAshyBSIs 97 (309) were HCAshyBSIs and 80
(256) were nosocomial BSIs There was no difference in the median ages of males and
females within each bloodstream infection acquisition group except for nosocomial BSIs
where more males acquired nosocomial infections than females (38 543 vs 32 457
respectively) and were significantly older than females (693 years IQR 574shy774 years vs
576 years IQR 386shy737 years respectively) (p=0005) When comparing median ages
between acquisition location groups the median age of patients with HCAshyBSIs (628
years IQR 510shy785 years) was significantly higher than patients with CAshyBSIs (590
104
years IQR 462shy696 years) (p=0023) There was no difference in median age between
nosocomial BSIs and CAshyBSIs (p=0071) or HCAshyBSIs (p=0677) by the median test
Among the HCAshyBSIs 76 (783) were based on the patient having only one
previous healthcare encounter 19 (196) having two previous healthcare encounters and 2
(21) having three previous healthcare encounters prior to their bloodstream infection
Table 59 specifies the healthcare encounters prior to the patientsrsquo bloodstream infection
which are not mutually exclusive Having a patient attend a hospital haemodialysis clinic
or have IV chemotherapy within the prior 30 days before the BSI was the most common
healthcare encounter prior to the BSI
Table 59 Previous Healthcare Encounters among Patients with HealthcareshyAssociated CommunityshyOnset BSIs Based on the Medical Record Review
Previous Healthcare Encounter n ()
Intravenous (IV) antibiotic therapy or specialized care at home other 19 than oxygen within the prior 30 days before the bloodstream infection (196) Patient attended a hospital or hemodialysis clinic or had IV 43 chemotherapy within the prior 30 days before the bloodstream (443) infection Patient was admitted to a hospital for 2 or more days within the prior 28 90 days before bloodstream infection (289) Patient was living in a nursing home or long term care facility prior to 30 the bloodstream infection (309)
Electronic Surveillance System
The location of acquisition was recorded for all bloodstream infections in the ESS
Of the 318 BSIs 130 (409) were CAshyBSIs 98 (308) were HCAshyBSIs and 90 (283)
were nosocomial BSIs There was no difference in the median ages of males and females
within each bloodstream infection acquisition group except for nosocomial infections
where more males acquired nosocomial infections than females (46 vs 33) and were
105
significantly older than females (682 years IQR 566shy770 years vs 578 years IQR 417shy
738 years p=00217) When comparing median ages between acquisition location groups
the median age of patients with HCAshyBSIs (669 years IQR 514 ndash 825 years) was
significantly higher than patients with CAshyBSIs (589 years IQR 453 ndash 686 years)
(p=00073) There was no difference in median age between nosocomial BSIs and CAshyBSIs
or HCAshyBSIs
Among the HCAshyBSIs 65 (663) were based on the patient having only one
previous healthcare encounters 27 (276) having two previous healthcare encounters 5
(51) having three healthcare encounters and one (10) having four healthcare
encounters prior to their BSI Table 510 shows the healthcare encounters prior to the
patientrsquos BSI which are not mutually exclusive Having a patient admitted to a hospital for
two or more days within the prior 90 days before the BSI was the most common healthcare
encounter prior to the BSI
106
Table 510 Previous Healthcare Encounters among Patients with HealthcareshyAssociated CommunityshyOnset BSIs Based on the ESS Sample
Previous Healthcare Encounter N ()
Discharge from HPTP clinic within the prior 2shy30 days before BSI 3 (31)
Active dialysis 19 (194)
Prior day procedure within the prior 2shy30 days before BSI 1 (10)
Had an ICDshy10shyCA code for active acute cancer as an indicator of having 16 attended or were admitted to the Tom Baker Cancer Centre (163) Admitted to CHR acute care hospital for 2 or more days within the prior 90 45 days before BSI (459) Attended a hospital clinic or ED within the prior 5shy30 days before BSI 21
(214) Sample submitted from or from patient who previously sent a sample from a 33 nursing home or long term care facility (337)
Source of Bloodstream Infections
Medical Record Review
Based on all available clinical data radiographic and laboratory evidence 253
(808) of the bloodstream infections were classified as secondary BSIs in that they were
related to an infection at another body site (other than an intravenous device) These
secondary BSIs were further classified based on the body site presumed to be the source of
the BSI A majority of secondary BSIs were not classified based on identifying the same
pathogen isolated from another body site 167 (66) but were primarily based on clinical
information physician diagnosis or radiographic reports Eightyshyfour (332) had one
culture positive at another body site related to their secondary source of infection and two
had two positive cultures at another body site
107
Ninetyshyeight percent 248 (98) of the secondary BSIs had at least one focal body
site identified two had no site recorded and one had two foci recorded Two of the
secondary BSIs did not have a focal body site recorded because either the patient deceased
or was discharged before supporting evidence for a secondary BSI was recorded in the
medical record The reviewers were not able to determine the focal body site based on the
information available in the medical record despite having enough clinical and laboratory
data to classify the BSI as nonetheless being related to another body site One patient had a
polyshymicrobial BSI (S aureus E coli) each of which were cultured and isolated at different
body sites (the former from a head wound the latter from a midstream urine sample) This
episode was not classified as a systemic infection because the source of each pathogen was
clearly identified Three patients had a single monoshymicrobial episode which were
classified as systemic infections because they involved multiple organs or systems without
an apparent single site of infection
The most common infections at another body site attributing to the BSIs were
pneumonia (70 277) urinary tract infections (60 237) gastrointestinal infections (42
166) skin and soft tissue infections (31 122) and cardiovascular infections (18 7)
(Table 511)
108
Table 511 Source of Secondary BSIs Identified in the Medical Record Review and the Electronic Surveillance System
Focal Body Source MRR ESS n () n ()
Urinary Tract (UTI) 60 (237) 48 (516) Surgical Site (SSI) 1 (04) 0 (00) Skin and Soft Tissue (SST) 31 (122) 16 (172) Pneumonia 70 (277) 9 (97) Bone and Joint (BJ) 9 (36) 0 (00) Central Nervous System (CNS) 5 (20) 3 (32) Cardiovascular System (CVS) 18 (71) 0 (00) Ears Eyes Nose Throat (EENT) 4 (16) 1 (11) Gastrointestinal (GI) 42 (166) 5 (54) Lower Respiratory Tract (LRI) 1 (04) 2 (215) Reproductive 6 (24) 0 (00) Systemic 3 (12) 0 (00) Unknown 3 (12) 9 (97)
S pneumoniae (38 543) and S aureus (17 243) were the most common
pathogens implicated in BSIs related to pneumonia E coli (40 672) and K pneumoniae
(7 113) among BSIs related to the urinary tract E coli (16 364) followed by both S
aureus and E faecium (each 3 73) among BSIs related to gastrointestinal sites S
aureus (12 389) and S pyogenes (group A streptococcus GAS) (6 194) among BSIs
related to skin and soft tissue sites and S aureus (10 556) and Enterococcus faecalis (3
167) related to cardiovascular site infections
Most BSIs related to another body site were infections acquired in the community
(125253 494) whereas most primary BSIs were nosocomial infections (2960 483)
(Table 512 χ2 2597 plt0001) Row percentages are included in Table 512
109
Table 512 Source of BSIs by Location of Acquisition for Episodes of BSIs Included in the Medical Record Review
Acquisition Location n ()
Source of BSI CA HCA NI Total n ()
Primary 11 20 29 60 (183) (333) (483) (100)
Secondary 125 77 51 253 (494) (304) (202) (100)
Total 136 97 80 313 (434) (310) (356) (100)
Electronic Surveillance System
Based on microbiological data in the ESS 93 (292) of the bloodstream infections
were classified as secondary BSIs in that they were related to a positive culture with the
same pathogen at another body site These secondary BSIs were further classified based on
the body site presumed to be the source of the BSI Ninety percent (8493) of the secondary
BSIs had at least one positive culture with the same pathogen at another body site and 9
(10) had two positive cultures with the same pathogen at different body sites The ESS
did not have the capability to distinguish the body sites presumed to be the source of the
BSI for those episodes with two positive cultures from different body sites
The most common infections at another body site attributing to the BSIs were
urinary tract infections (48 516) skin and soft tissue infections (16 172) and
pneumonia (9 97) (Table 511)
Escherichia coli (36 750) and K pneumoniae (2 42) were the most common
pathogens implicated in BSIs related to the urinary tract S aureus (9 562) and GAS (3
110
187) among BSIs related to skin and soft tissue sites and S pneumoniae (5 556) and
S aureus (3 333) among BSIs related to pneumonia
Most BSIs related to another body site were infections acquired in the community
(3593 376) and similarly most primary BSIs were communityshyacquired (95225
298) Row percentages are included in Table 513 There was no significant difference in
the proportion of primary or secondary BSIs among groups of acquisition location of BSIs
(χ2 0633 p=0729)
Table 513 Source of BSIs by Location of Acquisition for Episodes of BSIs Included in the ESS Sample
Acquisition Location n ()
Source of BSI CA HCA NI Total n ()
Primary 95 67 63 225 (422) (298) (280) (1000)
Secondary 35 31 27 93 (376) (333) (290) (1000)
Total 130 98 90 318 (409) (308) (283) (1000)
Patient Outcome
Medical Record Review
One patient was not admitted to a hospital among the 308 patients During their
incident BSIs patients were hospitalized at FMC (154312 494) PLC (86312 276)
RGH (66312 212) SDHS (5312 16) and Didsbury District Health Services
(DDHS 1312 03)
There were a total of 63 deaths following BSI for a caseshyfatality rate of 020 (20)
Of these 63 deaths 6 (95) occurred after a patientrsquos second episode of BSI and 2 (32)
111
occurred after a patientrsquos third episode of BSI Of these 15 of deaths followed a patient
having a polyshymicrobial BSI Table 514 shows the number of deaths following episodes of
BSI by the BSIrsquos location of acquisition (χ2150 p=0001) Column percentages are
included in Table 514
Table 514 InshyHospital Outcome by Location of Acquisition of BSIs Included in the Medical Record Review
Acquisition Location n () InshyHospital Outcome CA HCA NI Total
n () Alive 117 81 52 250
(860) (835) (650) (799) Deceased 19 16 28 63
(140) (165) (350) (201) Total 136 97 80 313
(1000) (1000) (1000) (1000)
Electronic Surveillance System
During their incident BSIs patients were hospitalized at FMC (158 498) PLC
(84 265) RGH (69 217) SDHS (5 16) and DDHS (1 03) according to the
ESS
There were a total of 65 deaths following BSIs for a caseshyfatality rate of 021 (21)
Of these 65 deaths 92 occurred after a patientrsquos second episode of BSI and 15
occurred after a patientrsquos third episode Of these 108 of deaths followed a patient having
a polyshymicrobial BSI Table 515 outlines the inshyhospital number of deaths following
episodes of BSI by the BSIrsquos location of acquisition (χ2 280 plt0001)
112
Table 515 InshyHospital Outcome by Location of Acquisition of BSIs Included in the ESS Sample
Acquisition Location n () InshyHospital Outcome CA HCA NI Total
n () Alive 119 77 56 252
(915) (794) (622) (795) Deceased 11 20 34 65
(85) (206) (378) (205) Total 130 97 80 307
(1000) (1000) (1000) (1000)
113
Comparison between the Electronic Surveillance System and the Medical Record
Review
Episodes of Bloodstream Infection
The medical record reviewers classified 313 (95) episodes as true bloodstream
infections based on all microbiologic clinical and radiographic information available in the
patientrsquos medical record Among the 313 BSIs identified in the medical record review the
ESS was concordant in 304 (97) The reviewers classified 9 additional BSIs that were not
identified in the ESS (Table E1 Appendix E) and the ESS identified 14 additional
episodes of BSIs not concordant with the medical record review (Table E2 Appendix E)
Description of Discrepancies in Episodes of Bloodstream Infection
Among the 9 additional bloodstream infections identified in the medical record
review 4 were not identified in the ESS because the pathogens were not isolated for the
first time in 365 days prior to that culture date These four were classified as a single
episode of bloodstream infection by the reviewers Two patients had 2 episodes each
according to the medical record review The ESS did not classify the second episode (2 of
9) as a separate bloodstream infection because the pathogen was not isolated for the first
time in 365 days prior to that culture date Two patientsrsquo third episode (2 of 9) identified in
the chart review was not identified in the ESS because the pathogen isolated was the same
as that of the patientsrsquo first episode and therefore the ESS only included two of the
patientsrsquo bloodstream infections One patient had 2 episodes one monoshymicrobial and the
other polyshymicrobial The first episode was not identified (1 of 9) in the ESS because the
pathogen was not isolated for the first time in 365 days prior to that culture date The
114
second episode had one of the two pathogens as a first blood isolate in the 365 days prior to
that culture date which the ESS classified as a single monoshymicrobial episode
Of the 14 additional bloodstream infections identified by the ESS 2 were additional
episodes of BSI identified in the ESS that the reviewers did not classify as separate
episodes for comparison The chart review identified one episode (1 of 2) as polyshy
microbial which the ESS classified as a separate monoshymicrobial bloodstream infection
based on the date of the positive blood cultures and because both pathogens were first
blood isolates within the prior 365 days In the other case the reviewers identified one
monoshymicrobial bloodstream infection of E coli that was contaminated with Bacteroides
fragilis whereas the ESS identified the B fragilis as a separate monoshymicrobial
bloodstream infection This was an error by the reviewers to classify B fragilis as a
contaminant
Twelve of the 14 bloodstream infections identified by the ESS were classified as
bloodstream contaminants by the medical record reviewers As such these 12 (of 316
385) were considered false positives in the ESS Nine of the 12 discrepancies were due
to there being two positive blood cultures with coagulaseshynegative staphylococci within 5
days of each other which the reviewers classified as contaminants but the ESS identified as
bloodstream infections Three episodes had only a single positive blood culture of Rothia
mucilaginosa Lactobacillus and Corynebacterium species which were all classified as
contaminants by the reviewers
Acquisition Location of Episodes of Bloodstream Infection
The agreement between the ESS and the medical record review for the location of
BSI acquisition was determined based on the BSIs that were concordant between the ESS
115
and the medical record review (n=304) The overall agreement was 855 (260304) in the
classification of acquisition between the ESS and the medical record review resulting in an
overall kappa of 078 (95 CI 075 shy080) with good overall agreement Therefore the
agreement observed was significantly greater than the amount of agreement we would
expect by chance between the reviewer and the ESS (plt00001) The table of frequencies
of the concordant and discordant episodes is shown in Table 516
Table 516 Comparison of Location Acquisition of BSIs between the Medical Record Review and the ESS
Electronic surveillance Medical system n ()
Record Review NI HCA CA Total n ()
NI 77 2 0 79 (253) (07) (00) (260)
HCA 4 72 15 92 (13) (240) (49) (303)
CA 4 19 110 133 (13) (63) (362) (438)
Total 85 94 125 304 (280) (309) (411) (1000)
Description of Discrepancies in Location of Acquisition between Medical Record Review
and the ESS
Table E3 (Appendix E) tabulates all the discrepancies observed between the ESS
and the medical record review An attempt to group and describe discrepancies has been
detailed below
The ESS misclassified four episodes as nosocomial BSIs where the medical record
reviewers classified them as healthcareshyassociated communityshyonset BSIs In three episodes
the ESS classified the episodes as NI because the blood cultures were obtained more than
116
48 hours after admission (between 52shy64 hours) The reviewers classified these as HCA
because the patients had previous healthcare encounters (ie home care chemotherapy
resident in nursing homelong term care facility and previous hospital admission) and were
believed to have the infection incubating at admission In these instances the reviewers
were able to identify admission and discharge dates but not times which resulted in an
estimation of timing between admission and blood culture collection The ESS
classification of NI took precedence over a classification of HCA because of the timing of
blood culture collection however the ESS did still identify that 2 of 3 of these patients had
previous healthcare encounters as well The fourth discrepancy was in a patient who was
transferred from another hospital and had a blood culture drawn 7 hours from admission to
the second acute care site The reviewers identified in the medical record that the patient
was hospitalized for one week was sent home with total parenteral nutrition (TPN) and
then returned to hospital for other medical reasons but then proceeded to have arm cellulitis
at or around the TPN site
In four episodes of BSI the ESS classified them as NI whereas the reviewers
classified them as CA The ESS classified three of them as NI because the blood cultures
were collected more than 48 hours after admission (between 55shy84 hours) In two of these
episodes the reviewers identified the admission date and date of blood culture collection
which was within a 2 day period and the patients had no previous healthcare encounters
therefore classifying them as communityshyacquired In one episode where the blood culture
was collected 84 hours after admission the reviewers believed that the pathogen was
incubating at admission in the patientrsquos bowel according to all clinical information in the
medical record The fourth discrepancy occurred in a homeless patient who was not
117
transferred from another acute care centre based on the information available in the medical
record however the ESS classified this episode of BSI as NI because it identified that the
patient was indeed transferred from another acute care site
Two episodes were classified as NI by the medical record reviewers while the ESS
classified them as HCA One patient was transferred from another acute care site and it was
unclear in the medical record how long the patient was admitted at the previous acute care
site The blood cultures were collected 2 days apart according to the dates of admission to
the second acute care centre and the blood culture collection in the medical record review
The ESS found that the blood culture was collected 44 hours from admission to the second
acute care site it identified that the patient was transferred from another acute care site and
that the patient had a previous healthcareshyencounter It is likely that the ESS classified this
episode as HCA because it identified that the patient was not hospitalized at the initial acute
care site long enough (ie gt 4 hours) to render a NI classification of the episode of BSI
The second discrepancy occurred where a patient had a cytoscopy the day prior to the BSI
while the patient had been admitted at an acute care site for two days The patient was sent
home and then returned the next day resulting in a second hospital admission The
reviewers classified this as NI because the BSI was understood to be part of a single
admission rather than due to a previous separate healthcare encounter prior to the episode
of BSI The ESS identified that the blood culture was taken 2 hours before the second
admission and that the patient had two previous healthcare encounters ndash a prior ED visit
and hospitalization
The largest number of discrepancies between the medical record review and the
ESS occurred where the reviewers classified episodes as CA and the ESS classified them as
118
HCA (n=19) Four episodes had no previous healthcare encounters but the patients were
transferred from an unknown home care site according to the ESS The reviewers classified
these as communityshyacquired because two of the patients lived at home either alone or with
a family relative one patient lived in an independent living centre where patients take their
own medications and only have their meals prepared and the fourth patient lived at a lodge
which the reviewers did not classify as either home care a long term care facility or a
nursing home Fourteen patients with BSIs had one healthcare encounter prior to their BSI
Six patientsrsquo BSIs were classified as HCA by the ESS because the ESS identified an ICDshy
10shyCA code for active cancer which served as a proxy for visiting a healthcare setting for
cancer therapy (ie chemotherapy radiation surgery) In five of these cases the reviewers
noted that the patient had either active cancer or a history of cancer however there was no
clear indication of whether the patient had sought treatment for the noted cancer at a
hospital or outpatient clinic In one of these instances the only treatment a patient was
receiving was homeopathic medicine which the reviewers did not identify as a healthcare
encounter that could contribute to the acquisition of a BSI The sixth patientrsquos medical
record had no indication of cancer at all and the previous healthcare encounters that the
patient did have did not meet the medical record case definition for an HCA BSI Three
patients were identified by the ESS as living in a nursing home or long term care facility
The reviewers did not find any indication in the medical record that two of these patients
lived in a nursing home or long term care facility The third patient lived in a lodge which
the reviewers did not classify as a form of home care nursing home or long term care
facility Three patientsrsquo BSIs were classified as HCA by the ESS because it identified that
the patients had previous hospitalizations In one instance the reviewers did not find any
119
indication in the medical record that the patient had a previous hospitalization A second
patient had 2 hospital admissions which the reviewers found were related to the BSI
identified in the third admission but which was acquired in the community prior to the first
admission The third patient was transferred from a penitentiary and did not have any other
previous hospitalizations recorded in the medical record at the time of his BSI One patient
had a history of being part of the Home Parenteral Therapy Program (HPTP) according to
the ESS The reviewers identified that this patient was hospitalized four months prior to his
BSI with discitis was discharged to the HPTP and then returned to hospital with worse
pain which then resulted in osteomyelitis and a BSI The reviewers determined that the
BSI was community acquired and related to the osteomyelitis rather than healthcareshy
associated communityshyonset and related to the HPTP The last patient visited an ED prior to
the episode of BSI which the ESS used to classify the episode as HCA but the reviewers
determined that the ED visit was attributed to symptoms associated with the episode of
BSI and therefore the patient acquired the BSI in the community rather than the ED
The second largest group of discrepancies occurred where the medical record
reviewers classified episodes of BSI as healthcareshyassociated communityshyonset while the
ESS classified them as communityshyacquired (n=15) Thirteen patients had one previous
healthcare encounter identified by the medical record reviewers which the ESS did not
identify and classified as CA because the blood cultures were within 48 hours of admission
Of these seven patients had a previous dayshyprocedure as an outpatient prior to their BSI
which the reviewers classified as it being a previous hospital or clinic visit within the prior
30 days prior to the BSI The day procedures were prostate biopsies (n=2) ERCP (n=1)
bone marrow aspirate biopsy (n=1) cytoscopy (n=1) stent removal (n=1) and
120
bronchoscopy (n=1) Three patients had some form of home care (ie changing indwelling
catheters by nurse [n=2] and a caregiver for a patient with developmental delay and
diabetes mellitus [n=1]) identified by the medical record reviewers which was not
identified by the ESS Two patients one on a transplant list and the other having received
an organ transplant prior to their BSI had frequent followshyup appointments with their
physicians which the medical record reviewers viewed as a previous healthcare encounter
to classify the BSI as HCA whereas the ESS did not identify these patients as having
previous healthcare encounters One patient had a previous hospital admission which the
ESS did not identify Two patients had 2 previous healthcare encounters each identified by
the reviewers which the ESS did not find Each had some form of home care prior to their
BSI as well as one being a resident at a nursing home and the other having a previous
hospital admission which was not identified by the ESS
Comparison of the Source of Infection between the Medical Record Review and the ESS
The medical record reviewers and the ESS classified BSIs according to whether
they were primary or secondary episodes of BSIs The reviewers based their classification
on microbiology laboratory data clinical information from physician and nurses notes and
radiographic reports The ESS classified these according to the presence or absence of a
positive culture of the same organism isolated in the blood at another body site The
agreement between the ESS and the medical record reviewers was low (447) resulting in
a poor overall kappa score (κ=011 91 CI 005 ndash 017) Therefore the agreement
observed was significantly less than the amount of agreement we would expect by chance
between the reviewers and the ESS (p=00004) The table of frequencies showing the
121
concordant and discordant classification of BSIs among those BSIs that were initially
concordant between the ESS and the medical record review is found in Table 517
Table 517 Source of BSIs between Medical Record Review and the ESS
Electronic Surveillance System n () Total
Medical Record Primary Secondary n Review ()
Primary 50 7 57 (164) (23) (188)
Secondary 161 86 247 (530) (283) (813)
Total 211 93 304 (694) (306) (1000)
Descriptions of Discrepancies in the Source of Infection between Medical Record Review
and the ESS
The agreement between the ESS and the medical record review was poor in the
identification of the overall source of infection as either primary or secondary with 168
(553) discrepancies between the ESS and the medical record review The majority of
these discrepancies (161 96) occurred where the ESS classified BSIs as primary
episodes while the reviewers classified them as secondary episodes of infection The
reason for this discrepancy was that the ESSrsquos laboratory data component did not have
positive cultures at another body site that would trigger the classification of a secondary
BSI The medical record reviewers based the classification primarily on clinical
information and radiographic reports in the medical record rather than solely on a positive
culture report in the medical record Only 12 (12161 75) secondary BSIs according to
the medical record review had a positive culture report from another body site in the
medical record which facilitated the confirmation of the secondary source of BSI Of the
122
149 that did not have a positive culture report from a different body site in the medical
record and which classification was solely based on clinical and radiographic information
in the record more than half of the secondary BSIs had pneumonia (50 343) or
gastrointestinal (32 215) sources of infection The diagnosis of pneumonia as the source
of the BSI was based on symptoms of purulent sputum or a change in character of sputum
or a chest radiographic examination that showed new or progressive infiltrate
consolidation cavitation or pleural effusion Of the gastrointestinal sources of infection 25
(781) were at an intrashyabdominal site which was clinically confirmed by reviewers based
on an abscess or other evidence of intrashyabdominal infection seen during a surgical
operation or histopathologic examination signs and symptoms related to this source
without another recognized cause or radiographic evidence of infection on ultrasound CT
scan MRI or an abdominal xshyray
Of the seven discrepancies where the ESS classified episodes of BSI as secondary
episodes and the medical record reviewers classified them as primary all of them had a
positive culture of the same pathogen as in the blood isolated from another body site and
recorded in the ESS Six of these episodes were classified as primary episodes of BSI
because they were not related to an infection at another body site other than being IV
device associated and they did not have a positive culture from another body site or
radiographic evidence suggestive of a secondary BSI One patientrsquos BSI was classified as a
primary infection despite having a positive culture at another body site of the same
pathogen as that in the blood because the cultures were related to an abscess or infection in
the arm that was originally due to an IV device
123
Comparison of the Source of BSIs among Concordant Secondary BSIs between the
Medical Record Review and the ESS
There were 86 concordant episodes of BSIs that were classified as secondary BSIs
by both the ESS and the medical record review Among these it was found that there was
721 agreement between the ESS and the medical record review in identifying the focal
body site as the source of the BSI (κ=062 95 CI 059 ndash 071) This resulted in an overall
good agreement between the ESS and the medical record review where the agreement
observed was significantly higher than the agreement expected by chance alone between
the ESS and the medical record review (plt00001)
There were a total of 24 discrepancies in the identification of the focal body site of
the source of secondary BSIs between the ESS and the medical record review (Table E4
Appendix E) Of these seven episodes did not have a focal body site identified by the ESS
because the patient had two positive cultures at different body sites The ESS does not have
an algorithm in place to determine which of multiple cultures takes precedence in the
classification of the main focal body site as the source of the infection The reviewers were
able to identify the severity of the infections at the different body sites to determine a single
possible source of the BSI Two were identified as pneumonia by the reviewers 2 as
cardiovascular system infections 2 as gastrointestinal and 1 as lower respiratory tract
infection other than pneumonia One patient had two foci listed by the medical record
reviewers for which a single source could not be determined nor could the reviewers
classify the source as systemic based on the available clinical and radiographic information
in the medical record The ESS classified this patient has having a urinary tract source of
infection because the patient had a single culture positive from the urinary tract
124
Summary of Results
In this study the ESS was demonstrated to be a valid measure for the identification
of incident episodes of BSIs and for the location of acquisition for BSIs The ESS had a
97 concordance with medical record review in identifying true episodes of BSI The
majority of discrepancies were due to multiple positive blood cultures of coagulaseshy
negative staphylococci being classified as true episodes of BSI by the ESS but as
contaminants by the medical record reviewers
The ESS had an overall agreement of 855 (κ=078 95 CI 075 ndash 080) in the
classification of acquisition The greater number of discrepancies occurred where the ESS
classified episodes of BSI as HCA and the reviewers classified them as CA A number of
these were attributed to the use of ICDshy10shyCA codes to identify patients with active cancer
and likely attending the Tom Baker Cancer Centre which the reviewers did not capture in
their medical record review
The ESS did not perform well in the classification of the focal body source of BSI
It had a low overall agreement of 447 (κ=011 95 CI 005 ndash 017) This was attributed
to the lack of clinical and radiological data in the ESS which classified the source of BSIs
solely based on microbiological data
The 2007 overall incidence of BSIs among adults (gt18 years) in the Calgary Health
Region was 1561 per 100000 population Escherichia coli (380 per 100000 population)
MSSA (208 per 100000 population) and S pneumoniae (174 per 100000 population)
had the highest speciesshyspecific incidence
In 2007 most incident BSIs were acquired in the community (597 40) among
patients who did not have any previous healthcare encounters prior to their incident BSI
125
and hospital admission Healthcareshyassociated communityshyonset BSIs comprised 535
(359) of incident BSIs with prior hospitalizations and visits to the emergency
department being the most frequent healthcare encounters
Most admissions related to the incident BSIs occurred in the three main CHR urban
acute care centres The inshyhospital caseshyfatality rate was 185
The ESS 2007 data set was representative of the CHR target population in terms of
the distribution of location of acquisition of incident episodes of BSI previous healthcare
encounters pathogenic organisms and the inshyhospital caseshyfatality rate
126
DISCUSSION
The work described here provide insights into 1) the novel features of the
electronic surveillance system (ESS) 2) the independent evaluation of incident episodes of
bloodstream infections (BSIs) the location of acquisition the source of bloodstream
infections and the inshyhospital caseshyfatality rate by the medical record review and the ESS
in a sample of 308 patients 3) the agreement between the medical record review and the
ESS for identifying incident episodes of bloodstream infections classifying the location of
acquisition and determining the source of bloodstream infection 4) the application of
validated definitions in the ESS to determine the overall populationshybased incidence of
bloodstream infections the speciesndashspecific incidence of bloodstream infections the
location of acquisition of bloodstream infections and the inshyhospital caseshyfatality rate
following infection in the Calgary Health Region in the 2007 year
Novelty of the Electronic Surveillance System
This study describes the validation of previously developed efficient active
electronic information populationshybased surveillance system that evaluates the occurrence
and classifies the acquisition of all bloodstream infections among adult residents in a large
Canadian healthcare region This system will be a valuable adjunct to support quality
improvement infection prevention and control and research activities
There are a number of features of this ESS that are novel Unlike previous studies
that have largely focused on nosocomial infections this study included all BSIs occurring
in both community and healthcare settings because the microbiology laboratory performs
virtually all of the blood cultures for the community physiciansrsquo offices emergency
departments nursing homes and hospitals in our region In addition unlike many other
127
ESSs that only include infections due to selected pathogens in surveillance infections due
to a full range of pathogens were included in this ESS such that infrequently observed or
potentially emerging pathogens may be recognized
Another important feature is that we classified BSIs according to location of
acquisition as nosocomial healthcareshyassociated communityshyonset or communityshyacquired
infections No studies investigating electronic surveillance have attempted to utilize
electronic surveillance definitions to classify infections according to the criteria of
Freidman et al (6)
Validation of the Electronic Surveillance System
The systematic review conducted by Leal et al identified that there are few studies
that have reported on the criterion validity of electronic surveillance as compared to
traditional manual methods (5) Trick and colleagues compared a number of different
computershybased algorithms to assess hospitalshyonset (first culture positive more than two
days after admission) bloodstream infection at two American hospitals (3)They compared
a series of computershybased algorithms with traditional infection control professional review
with the investigator review as the gold standard As compared to infection control
professional review computer algorithms performed slightly better in defining nosocomial
versus community acquisition (κ=074) For distinguishing infection from contamination in
the hospital setting they found that laboratory data as a single criterion to be less sensitive
(55) than a computer rule combining laboratory and pharmacy data (77) but both
showed similar agreement (κ=045 and κ=049 respectively) The determination of
primary central venous catheter (CVC)shyassociated BSIs versus secondary BSIs based on
the timing of nonshyblood cultures positive for the same pathogen as in the blood resulted in a
128
moderate kappa score (κ=049) These investigators excluded communityshyonset disease
developed the definitions using opinion only and did not improve their algorithms by
incrementally refining the algorithm or including additional clinical information and
therefore there is room for significant further improvement
In another study Yokoe et al compared the use of simple microbiologic definitions
alone (culture of pathogen or common skin contaminant in at least two sets of blood
cultures during a fiveshyday period) to the prospective use of traditional NNIS review as the
gold standard (145) They found that the overall agreement rate was 91 most of the
discordant results were related to single positive cultures with skin contaminants being
classified as true infections Agreement may have been much higher if manual review was
used as the gold standard because NNIS definitions classify common skin contaminants as
the cause of infection if antimicrobials are utilized even if the use of antimicrobials was not
justified (5)
Similarly Pokorny et al reported that use of any two criteria in any combination ndash
antibiotic therapy clinical diagnosis or positive microbiology report ndash maximized
sensitivity and resulted in high agreement (κ=062) between their ESS and manual chart
review for nosocomial infection (146) Leth and Moller assessed a priori defined computershy
based versus conventional hospital acquired infection surveillance and found an overall
sensitivity of 94 and specificity of 74 these parameters were each 100 for
bloodstream infection (147)
In comparison this studyrsquos ESSrsquos definitions had high concordance with medical
record review for distinguishing infection from contamination and performed slightly
better in agreement (97) than reported in other studies Furthermore many of the studies
129
to date have focussed on nosocomial or hospitalshyacquired infections whereas this studyrsquos
ESS evaluated three separate classifications of the acquisition location of bloodstream
infections specifically nosocomial healthcareshyassociated communityshyonset and
communityshyacquired Both healthcareshyassociated communityshyonset and communityshy
acquired bloodstream infections have rarely been included and validated in previous
surveillance systems This study demonstrated that the ESS had a high agreement (855)
with medical record review in the classification of acquisition location
Identification of Bloodstream Infections
This study has demonstrated that the ESS was highly concordant (97) with
medical record review in identifying true episodes of bloodstream infection by the use of
microbiological laboratory data The majority of discrepancies occurred where the ESS
overcalled the number of true episodes of bloodstream infection (14 61) which the
medical record reviewers classified as bloodstream contaminants (12 86)
In this study the focus was on establishing the presence of incident episodes of
infection as opposed to confirming bloodstream contamination The determination of
whether a positive blood culture results represents a bloodstream infection is usually not
difficult with known pathogenic organisms but it is a considerable issue with common skin
contaminants such as viridians group streptococci and coagulaseshynegative staphylococci
(CoNS)
During the early development of the ESS post hoc revisions were made to the ESS
in which the viridans streptococci were included in the list of potential contaminants The
exclusion of the viridans streptococci as a contaminant in the ESS definitions resulted in a
higher number of episodes of infections during the development phase and accounted for
130
64 of the discrepancies of classifying true episodes of infection by the ESS However
when included as a common skin contaminant the concordance of episodes was 95 and
the number of incident episodes of infections was comparable Clinically many of the
single viridans streptococci isolates in blood were classified as contaminants justifying its
inclusion in the contaminant list in the electronic definitions
Although the inclusion of this organism differs from previously established
surveillance definitions the NHSN criteria for laboratoryshyconfirmed bloodstream infection
have recently included viridans streptococci as a common skin contaminant In this study
all infections by viridans streptococci identified by the ESS were concordant with the
medical record review and the ESS has successfully demonstrated and supported the
change by the NHSN
Studies have reported that viridans streptococci represent true bacteraemia only 38shy
50 of the time (7) Tan et al assessed the proportion and clinical significance of
bacteraemia caused by viridans streptococci in immunoshycompetent adults and children
(148) They discovered that only 69 (50723) of adult communityshyacquired bacteraemia
were caused by viridans streptococci Of these 473 of the cultures were of definite or
probable clinical significance (148) In comparison the population speciesshybased
evaluation by the ESS found that 97 of the viridans streptococci were associated with
incident BSIs in the CHR in 2007
Among the twelve true BSI episodes identified by the ESS which the medical
record reviewers classified as contaminants 9 (75) were attributed to CoNS The
classification of episodes attributed to two or more cultures of CoNS but classified as
contaminants by medical record reviewers was based on information available in the
131
medical record In theory clinical criteria identify patients with a greater chance of
bacteremia in whom a positive culture result has a higher positive predictive value
however in practice it is unknown how useful these clinical criteria are for recognizing
CoNS (65) Tokars et al has suggested that the CDCrsquos definition of bloodstream infection
as applied to CoNS should be revised to exclude clinical signs and symptoms because their
diagnostic value is unknown and the positive predictive value when two or more culture
results are positive is high (65) This supports the definition of contaminants used in the
ESS but in particular that related to CoNS and suggests that it is likely that the ESS has
correctly classified episodes of bloodstream infection attributed to CoNS
Of all the CoNS isolated in the CHR population in 2007 852 (833) were
contaminants with the remaining isolates being associated with incident bloodstream
infections The populationshybased speciesshyspecific incidence of CoNS in 2007 was 952 per
100000 adult population and accounted for only 56 of all incident bloodstream
infections
Some microbiologists have used the number of culture bottles in one set that are
positive to determine the clinical significance of the isolate However recent data suggest
that this technique is flawed since the degree of overlap between one or two bottles
containing the isolate is so great that it is impossible to predict the clinical significance
based on this method (7) Usually a set of blood cultures involves one aerobic and one
anaerobic bottle in an attempt to optimize isolation of both aerobic and anaerobic
organisms Therefore it makes sense that if the growth of a given organism is more likely
in aerobic conditions than in anaerobic conditions an increased number of positive culture
bottles in a set that consists of one aerobic and one anaerobic bottle should not be used to
132
differentiate contamination from clinically significant cultures (9) In this study the ESS
classified common skin contaminants as causing true bloodstream infections when two or
more separate culture sets (by convention each set includes two bottles) were positive with
the common skin contaminant within a fiveshyday period and not based on whether only two
bottles in a single culture set contained the microshyorganism Simply requiring two positive
culture results for common contaminants led to a generally good classification of infection
in the ESS
Further to support this studies have suggested that the patterns of positivity of
blood cultures obtained in sequence can also aid in the interpretation of clinical
significance Specifically that the presence of only a single positive culture set obtained in
series strongly suggests that the positive result represents contamination when the isolate is
a common skin contaminant (7) For true bacteraemias multiple blood culture sets will
usually grow the same organism (9) Additionally since a finite percentage (3shy5) of blood
cultures are contaminated in the process of acquiring them routinely obtaining more than
three blood cultures per episode usually does not help distinguish between clinically
important and contaminant isolates (7 9)
Part of the ESSrsquos definition for classifying common skin contaminants entailed a
fiveshyday window between two cultures positive for common skin contaminants Definitions
for BSIs particularly those due to CVCs and to the contaminants listed by the NNIS do not
specify a time window between positive cultures to confirm the detection of a contaminant
or a BSI However Yokoe et al found that a similar rule for another positive blood culture
result within a fiveshyday window to classify common skin contaminants agreed (k=091)
with the NNIS definition (145)
133
Excluding all single positive blood culture results for skin contaminant organisms
from hospital surveillance can save time and may have little effect on results By efficiently
identifying and excluding those positive blood cultures most likely to be contaminants from
further analysis surveillance efforts can be concentrated on obtaining additional useful
clinical information from patients with true bloodstream infections
More importantly the misinterpretation of CoNS or other contaminants as
indicative of true BSI has implications for both patient care and hospital quality assurance
Regarding patient care unnecessary use of antimicrobials especially vancomycin raises
healthcare costs selects for antimicrobial resistant organisms and exposes the patient to
possible adverse drug effects (65) In terms of quality assurance monitoring BSIs
including cathetershyassociated BSIs has been recommended and practiced However the
commonly used definitions of BSIs may have limited capacity to exclude contaminants
resulting in inaccurate surveillance data and overestimating the role of CoNS and other
contaminants in bloodstream infections (65) Although the ESS overcalled the number of
infections due to CoNS the patients had multiple cultures of CoNS which may warrant
further clinical evaluation by infection control practitioners to confirm the presence of
infection
Review of the Location of Acquisition of Bloodstream Infections
Another important feature of the ESS is that the bloodstream infectionsrsquo location of
acquisition was defined as nososomial healthcareshyassociated communityshyonset or
communityshyacquired In the populationshybased analysis of incident bloodstream infections in
2007 24 were nosocomial 359 were healthcareshyassociated communityshyonset and 40
were communityshyacquired Other studies have found varying distribution of acquisition
134
mostly due to the difference in definitions used to classify incident BSIs as HCA (6 34 37
46 47) Nosocomial infections are typically acquired in a hospital setting and they are often
associated with a procedure or with medical instrumentation Communityshyacquired
infections presumably develop spontaneously without an association with a medical
intervention and occur in an environment with fewer resistance pressures (34) However
some infections are acquired under circumstances that do not readily allow for the infection
to be classified as belonging to either of these categories Such infections include infections
in patients with serious underlying diseases andor invasive devices receiving care at home
or in nursing homes or rehabilitation centres those undergoing haemodialysis or
chemotherapy in physiciansrsquo offices and those who frequently have contact with healthcare
services or recurrent hospital admissions (34) These infections have been attributed to
changes in healthcare systems which have shifted many healthcare services from hospitals
to nursing homes rehabilitation centres physiciansrsquo offices and other outpatient facilities
Although infections occurring in these settings are traditionally classified as communityshy
acquired in other surveillance systems evidence suggests that healthcareshyassociated
communityshyonset infections have a unique epidemiology the causative pathogens and their
susceptibility patterns the frequency of coshymorbid conditions the source of infection the
mortality rate at followshyup and the other related outcomes for these infections more closely
resemble those seen with nosocomial infections (6 37 46shy48) This has led to an increasing
recognition that the traditional binary classification of infections as either hospitalshyacquired
or communityshyacquired is insufficient (6 34 37 46shy49)
This ESS demonstrated a good overall agreement (855 k=078) in the
classification of acquisition when compared to the medical record review The majority of
135
discrepancies occurred in the classification of episodes as communityshyacquired by medical
record review but as healthcareshyassociated communityshyonset by the ESS The reason for the
ESSrsquos categorization was based on previous healthcare encounters recorded in the
administrative databases which the medical record reviewers did not identify or did not
classify as the same based on other clinical information in the patientrsquos chart During the
development of the ESS it was identified that many of these discrepancies were attributed
to the ESS not identifying patients who visited the Tom Baker Cancer Centre (TBCC) for
treatment of their active cancer As a post hoc revision ICDshy10shyCA codes were added for
active cancer to the ESS as a proxy for patients attending the TBCC and likely receiving
some form of cancer therapy Interestingly during this validation phase 32 (619) of
patients were classified as having a healthcareshyassociated communityshyonset BSI by the ESS
because it identified an ICDshy10shyCA code for active cancer but for which the medical
record reviewers classified as communityshyacquired For most cases (5 83) it was
identified in the chart that the patient had active cancer but whether they were receiving
outpatient therapy was not identified by the reviewers rendering a communityshyacquired
classification In this scenario the ESS may be viewed as performing better than medical
record review in identifying this unique group of individuals who likely have had a
significant amount of exposure to various healthcare settings with a diagnosis of cancer
A recent literature review conducted by Leal et al identified that ICDshy9 codes in
administrative databases have high pooled sensitivity (818) and pooled specificity
(992) for listing metastatic solid tumour but lower pooled sensitivity (558) and
pooled specificity (978) for listing any malignancy as defined by the Charlson coshy
morbidity index (140) Other studies that have evaluated the use of the tertiary
136
classification of infection acquisition have included ICDshy9 or ICDshy10 codes for active
cancer and pharmacyshybased databases to identify patients on immunosuppressive
medications (37 46 48) The addition of pharmacy data may have given these studies more
power to accurately identify patients at particular risk of infection in certain healthcare
settings This ESS was limited without the use of pharmacy data and therefore it may have
missed some healthcareshyassociated communityshyonset cases
When Friedman et al introduced the tertiary classification scheme for the
acquisition location of BSIs they suggested that patients with healthcareshyassociated
communityshyonset infections should be empirically treated more similarly to patients with
nosocomial infections (6) However Wunderlink et al suggested that this new
classification does not appear to be clinically helpful for empirical antimicrobial decisions
as suggested and there is a lack of clear treatment recommendations for this group of
patients (149) The reason for this is that there still exists a variable population within the
groups classified under the healthcareshyassociated communityshyonset definition each with
different risk profiles for bloodstream infection Another major problem pointed out by
Wunderlink et al was that the majority of bacteraemia are secondary As such the
suspected site of infection clearly influences the spectrum of pathogens and consequently
the empirical antimicrobial choices In general the admitting physician does not know that
a patient has bacteraemia and therefore chooses antimicrobials based on the suspected site
of infection (149) For example MRSA is suggested to be a more important issue in
healthcareshyassociated bacteraemia than in communityshyacquired pneumonia and this makes
sense when a large percentage of the HCA patient population may have indwelling CVCs
or were receiving wound care But to extrapolate these data to ambulatory nursing home
137
patients with pneumonia and misclassify them (because they fall within the same HCA
category) may lead to inappropriate antibiotic use such as overly aggressive broadershy
spectrum antimicrobials with possible adverse consequences (47 149) Despite the
potential misclassification of patients within the HCA category there still exists a
continuous shift in healthcare services being provided outside the acute care centre which
clearly introduces patients to a higher risk of exposure to infection when compared with
communityshybased patients This has led to the observation that traditional infection control
practices aimed at decreasing hospitalshyacquired infection need to be extended to all
healthcare facilities because healthcareshyassociated infections occur in diverse settings and
not only during inpatient stays Also patients using many of the outpatient healthcare
services never truly return to the community but only cycle from these outpatient care
centres back to either the hospital or the ICU (46 48 150)
The application of a tertiary definition for the acquisition location of incident BSIs
in this ESS will prove to be a valuable adjunct to the body of knowledge on this issue
Conducting continuous surveillance on these infections will provide insight to their
occurrence and the levels of risk associated with them Where this is really important is in
tracking infections over time If hospitalshybased infection control programs continue to use
the traditional definitions one may see gradually decreasing rates of nosocomial disease
because an increasing number of patients are being treated as outpatients Concomitantly
however communityshyacquired infections would increase By classifying bloodstream
infections into the three locations of acquisition the total number of BSIs would be the
same if overall rates remain unchanged
138
Review of the Source of True Bloodstream Infection
During the development phase of the ESS BSIs were not distinguished between
primary and secondary (or focal source) episodes of infection however an exploratory
evaluation of the source of episodes of BSI was included in this validation study
as a secondary objective The agreement between the ESS and the medical record reviewers
was low (447 k=011) in identifying primary versus secondary BSIs and therefore
considered inaccurate for the application of assessing the source of BSIs The medical
record reviewers classified 81 of true BSIs as secondary whereas the ESS classified only
29 Defining secondary episodes of infection usually involves clinical evidence from
direct observation of the infection site or review of other sources of data such as patient
charts diagnostic studies or clinical judgment which the ESS does not include The
identification of secondary BSIs by the medical record reviewers were mostly (66) based
on clinical information physician diagnosis or radiographic reports and not by a positive
culture of the same pathogen at another body site The identification of these infections by
the ESS would be based solely on the recovery of pathogens from different infection sites
Although the ESS did not perform well in identifying the source of infection medical
record or patient review do not always perform well in this classification either
Systematic studies have shown that despite the best efforts of clinicians the source
of bacteraemia or fungemia cannot be determined in oneshyquarter to oneshythird of patients (9
151) Also of the identifiable ones only 25 were confirmed by localized clinical findings
while another 32 were cultureshyproven Further investigation is required to determine
optimal data sources or methodologies to improve the classification of the sources of BSI in
this ESS This limitation hinders the ESSrsquos application in determining primary BSIs
139
specifically if deviceshyassociated and the ability to accurately determine outcome and
severity of primary or secondary BSIs
Validity and Reliability
The ESS is designed to identify and include first blood isolates per 365 days only if
the pathogen isolated is a known pathogenic organism or if there are two or more common
skin contaminants isolated from blood cultures that are within five days from each other
The algorithms used therefore further classify only BSI and not blood culture
contamination solely based on microbiologic laboratory data The medical record review
entailed reviewing patient medical records during the admission related to each BSI or
contamination Therefore the medical record review identified episodes of both BSI and
contamination whereas the ESS only had episodes of BSI The initial step in the
comparison entailed identifying the total episodes in the medical record review which had a
corresponding first blood isolate per 365 days classified in the ESS for which further
comparisons could be made The medical record reviewers classified 313 true bloodstream
infections which the ESS identified 304 concordant incident episodes of BSI for a close to
perfect agreement (97) between the two Additionally the ESS had an overall good
agreement and kappa score (κ=078) for classifying the location of acquisition among the
concordant incident episodes of bloodstream infection Based on these findings the ESS
proved to have excellent data quality by utilizing case definitions that were accurate in
identifying incident episodes and their location of acquisition
The methodology employed which excluded single blood cultures of common
contaminants if they do not fall within a fiveshyday window of each other precluded
calculating criterion validity measures such as sensitivity specificity and positive and
140
negative predictive values These measures are often used to evaluate how well certain
methods of diagnoses identify a patientrsquos true health status The ESS sample consisted of
patients only with positive blood cultures that comprised true episodes of BSI whereas the
medical record sample evaluated these positive episodes to determine which BSIs were
true Assessing for validity would result in a high sensitivity based on these results since
the number of false negatives was low or close to null Additionally specificity the
proportion of negatives that would be correctly identified by the ESS would be extremely
low or close to null because the sample does not consist of patients with negative blood
cultures or those with less than two blood cultures of common skin contaminants The
methodology employed for comparing the ESS with the medical record review hindered the
ability to evaluate validity as these measures start to breakshydown due to the ESS excluding
the negative cases as a comparator group
Furthermore in order to assess the criterion validity of an electronic surveillance
system a gold standard that is accepted as a valid measure is required This is challenging
because there is no gold standard available to compare the ESS to since traditional manual
surveillance is highly subjective biased and inconsistent and therefore is not considered the
gold standard (152) However many studies have used traditional manual surveillance as
accepted proximate measures of a gold standard
When there is no gold standard the kappa statistic is commonly used to assess
agreement between two methods for estimating validity Reporting on the agreement and
the corresponding kappa statistics between the ESS and the medical record reviewers was
chosen for it was believed to be more appropriate as it can apply to studies that compare
two alternative categorization schemes (ie ESS versus manual record review) (153)
141
Additionally the consequence of summarizing a 3x3 table into one number as in
this study ultimately resulted in the loss of information As a result the table of
frequencies were provided in this study and the discrepancies between the two methods of
classification were described for readers to comprehend the basis for the resulting
agreement and kappa statistic
The ambiguity of Landis and Kochrsquos translation of kappa values to qualitative
categories further supports the decision to focus primarily on a descriptive analysis of the
discrepancies rather than solely reporting on a single estimate of agreement By doing so
future studies attempting to revise and evaluate the ESS can formulate changes to improve
the algorithms based on the discrepancies observed between the ESS and the medical
record review Since the medical record review was not considered a true gold standard the
discrepancies observed can also be used to improve current traditional methodologies for
surveillance
As noted since no true gold standard exists it becomes difficult to evaluate two
approaches using real world data and therefore there is a need to assess the tradeshyoff
between reliability and validity using these two methods Objective criteria from the
electronic data are easily automated and will result in greater reliability since the
information is reproducible and consistent In contrast it may not be as accurate in
estimating ldquotruerdquo infection rates (ie sensitive) because it draws its decisions from a smaller
pool of data and are less selective However the ESS did accurately classify true episodes
of bloodstream infection based on its algorithm and when these infections were reviewed
by the medical record reviewers
142
Population Based Studies on Bloodstream Infections
As hypothesized the ESS performed very well in both the determination of incident
episodes of BSI and in the location of acquisition of the incident BSIs As a direct result
the ESS can be used by researchers infection prevention and control and quality
improvement personnel to evaluate trends in the occurrence of bloodstream infections in
various different healthcare settings at the population level rather than in select groups of
individuals The data presented in the ESS allows for the populationshylevel speciesshyspecific
and overall incidence of BSIs the evaluation of the average risk of BSI among groups of
individuals exposed to different healthcare settings that pose different risks for BSI and it
can potentially be used by infection prevention and control as a trigger to quickly identify
and investigate the potential sources of the BSIs such as from another body cavity or from
a CVC
Conducting populationshybased surveillance of bloodstream infections has the added
advantage of having a representative sample to carry out unbiased evaluations of relations
not only of confounders to exposures and outcomes but also among any other variables of
interest Despite this few researchers or academic groups have performed populationshybased
evaluations of BSIs particularly among some of the most common pathogens implicated in
BSIs
This study identified that E coli and MSSA had the highest speciesshyspecific
incidence among adults in the Calgary area contributing to the high overall incidence of
BSIs (1561 per 100000 population) In the same region Laupland et al conducted
populationshybased surveillance for E coli between 2000 and 2006 specifically to describe
its incidence risk factors for and outcomes associated with E coli bacteraemia (154)
143
During that period the overall annual population incidence was 303 per 100000
population This study has found that the annual incidence of E coli in the CHR has
increased to 380 per 100000 population The distribution of location acquisition has also
changed between Laupland et alrsquos study and this evaluation In 2007 the proportion of E
coli acquired in the community decreased to 48 (176363) compared to the 53 that was
averaged over their sevenshyyear study (154) Concomitantly there was an increase in the
proportion of healthcareshyassociated communityshyonset BSIs in the CHR in 2007 (132363
36) compared to 32 in their seven year study (154) Other studies have also
demonstrated that E coli is more commonly acquired in the community than in other
healthcare settings (155 156)
Although not formerly evaluated in the populationshybased analysis E coli has been
found to be the most common pathogen associated with urinary tract infections and the
subsequent development of E coli bacteraemia in other studies Two studies by AlshyHasan
et al identified that urinary tract infection was the most common primary source of
infection (798 749 respectively) (155 156) In the comparison component of this
study the ESS also identified that E coli was the most common pathogen (750)
implicated in BSIs related to urinary tract infections
Methicillinshysusceptible S aureus had a speciesshyspecific incidence of 208 per
100000 population among adults in the CHR in 2007 Atrouni et al conducted a
retrospective population based cohort from 1998 to 2005 in Olmsted County Minnesota
and have seen an increase in the overall incidence of S aureus bacteraemia from 46 per
100000 in 1998shy1999 to 70 per 100000 in 2004shy2005 (157) The incidence in the Calgary
area was substantially lower than that of this population
144
Similarly there was a nonshynegligible difference between their and this study in the
proportion of S aureus bacteraemia acquired as healthcareshyassociated communityshyonset
(587 vs 207 respectively) and as community acquired (178 vs 102
respectively) (157) Their definition for healthcareshyassociated communityshyonset
bacteraemia was the same as that applied in this study
Further research is required to evaluate both speciesshyspecific and overall incidence
of BSIs risk factors associated with BSIs and various outcomes attributed to BSIs
particularly at the population level
Limitations
Although this study design is believed to be rigorous there are a number of
limitations that merit discussion
The ESS combines laboratory and administrative databases However the
numeration of incident episodes of BSI is initially and primarily based on the laboratory
information system Surveillance systems that primarily employ laboratory systems for the
identification of bloodstream infections may be subject to biases that may have a harmful
effect The type of bias of greatest consideration in this study is selection bias
Selection bias as a result of selective testing by clinicians may be difficult to
address in electronic surveillance systems however the ESS contained laboratory
information that is populationshybased in that the regional laboratory performs virtually all of
the blood cultures for the community physiciansrsquo offices emergency departments nursing
homes and hospitals in the region and therefore sampling was not performed which
reduced the potential for selection bias
145
Another form of selection bias occurs when reporting of BSIs is based out of single
institutions often being at or affiliated with medical schools Reports from these sites may
suggest that BSIs are more likely generated in large urban hospitals During the
development phase of the ESS only incident BSIs that presented to the three main urban
adult acute care centres in the Calgary Health Region were evaluated suggesting that the
above selection bias was likely to have resulted in a misinterpretation in the overall
estimates in the number of incident BSIs However the methodology used in this validation
study was improved by evaluating episodes of BSI that presented at any acute care centre in
the CHR including those in urban and rural locations Although the number of incident
BSIs in the rural centres was low in comparison to the number of incident BSIs in the urban
centres this still reduced the potential for selection bias The fact that the laboratory is a
centralized laboratory that serves the entire population in the CHR in processing blood
cultures and other microbiologic data allows for standardized methods employed among all
blood culture specimens Furthermore there is a representative balance between teaching
and district general hospitals and the population served by the laboratory is geographically
demographically and socioshyeconomically representative of the whole CHR population
which reduces sources of bias inherent in routine data
Defining recurrent relapsing or new incident episodes of BSI is similarly
challenging in any surveillance program The ESS used the very conservative definition of
an incident episode of BSI only the first episode of BSI due to a given species per patient
per year The medical record review integrated all available clinical data and microbiologic
data to define an episode However although the latter method is presumably more
accurate it should not be viewed as a gold standard because it did not include a detailed
146
typing method to establish whether new episodes were recurrences (ie same isolate) or
truly new infections (ie new isolate) (143)
The selection bias implicit in including duplicate isolates is that clinicians may
selectively collect more specimens from certain patients particularly if the patient is
infected with antibioticshyresistant organisms compared to patients without such organisms
Excluding duplicate isolates would remove this selection bias and would prevent the
overestimation of the speciesshyspecific incidence of BSIs Despite the difference in
classifying independent episodes of BSI between the ESS and the medical record review
the data on true episodes of BSI were very similar to data obtained by medical record
review by the use of the ESS definition for episodes of true bloodstream infection
Information bias can occur in laboratory based surveillance however since the
laboratory used for this studyrsquos surveillance is a centralized populationshybased laboratory
with regular quality audits and improvements variability in techniques and potential for
misclassification has been avoided
Confounding bias may also be present in epidemiological analyses of data obtained
from this ESS because there was no evaluation on the accuracy of the ESSrsquos administrative
database source for identifying coshymorbid conditions Implications for the use of inaccurate
databases include inaccurate estimation of rates of specific disease and procedural
outcomes false classification of cases and controls where diagnosis is used to determine
this designation and inadequate adjustment for coshymorbidity or severity of illness leading to
inaccurate riskshyoutcome associations
Other limitations in this study include the fact that it was retrospective and therefore
the medical record review was limited to clinical information that was previously
147
documented However most surveillance programs are retrospective in design (158) A
prospective assessment may have led to some differences in the classification of episodes
by medical record review Furthermore retrospective medical review is not frequently
employed by infection control practitioners in their identification of bloodstream and other
infections but rather they conduct prospective review of potential cases By not conducting
prospective review of medical records or by comparing the ESS to current infection
prevention and control practices this study is limited in describing the ESSrsquos accuracy in
conducting realshytime or nearshytoshyrealshytime surveillance Despite this the prospective
evaluation of healthcareshyassociated infections by infection control professionals was shown
to have large discrepancies poor accuracy and consistency when compared with
retrospective chart review and laboratory review as the gold standard (152)
Secondly this study only includes adults however if further investigations of our
ESS prove to be successful and accurate then future investigations may be designed to
develop a system that includes infants and children in surveillance The ESS already has the
potential to identify all positive blood cultures among all residents in the Calgary Health
Region including children however validation and accuracy studies need to be conducted
to ensure episodes of BSIs and their location of acquisition are correctly classified in this
particular population
Thirdly medical record reviews were conducted concurrently by a trained research
assistant and an infectious diseases physician Ideally two or more teams or reviewers with
an assessment of agreement between them would have been preferred Additionally further
assessments of intershyrater reliability between a trained medical record reviewer and an
infection control professional would have been an adjunct to the evaluation of current
148
surveillance methodologies employed by our regionrsquos infection prevention and control
departments
Fourthly the linked databases only provided surveillance data on BSIs not on other
infections This system has the potential to be further developed to evaluate other sources
of infection determined by positive laboratory test results However based on this analysis
the ESS did not perform well in classifying primary versus secondary bloodstream
infections when using laboratory based data alone Improvement in the identification of
other infectious diseases may be accomplished by the introduction of automated pharmacy
or prescription data diagnosis codes from the administrative data source andor electronic
radiographic reports As mentioned above diagnosis codes have already been introduced
into the ESS but not formally evaluated and further investigation is required to determine
the accessibility and feasibility of acquiring automated pharmacy data
Fifthly there was no attempt to determine the rate of nosocomial deviceshyassociated
BSIs or to determine qualitatively why they may have occurred As part of a national and
international emphasis on improving healthcare quality rates of healthcareshyassociated
infection have been proposed as quality measures for intershyhospital comparisons (159)
Centralshyvenous cathetershyassociated BSI rates are a good measure of a hospitalrsquos infection
control practices because these infections may be preventable (159)
Electronic rules or algorithms that detect central lines with a high positive
predictive value could be used to generate a list of patients as candidates for infection
prevention interventions such as review of dressing quality More recent studies evaluating
automated surveillance systems have focused on determining their accuracy in determining
both numerator (ie number of deviceshyassociated BSIs) and denominator (deviceshydays)
149
data For rate calculations many programs utilize numerators (infections) as defined by the
NNIS and deviceshydays are used as denominators to adjust for differences between patient
populations of various hospital practices Device days are often collected daily manually
by infection control professionals or a designated member of the nursing unit and then
tabulated into multiple time intervals (160) This methodology has the potential for errors
that can skew rates and the human ability to accurately detect significant increases or
decreases in infection rates is impaired (160)
Woeltje et al used an automated surveillance system consisting of different
combinations of dichotomous rules for BSIs (125) These rules included positive blood
cultures with pathogenic organisms and true BSI by common skin contaminants if the same
pathogen was isolated within five days from the previous culture secondary BSIs based on
positive cultures at another body site data on centralshyvascular catheter use from automated
nursing documentation system vancomycin therapy and temperature at the time of blood
culture collection They found that the best algorithm had a high negative predictive value
(992) and specificity (68) based on rules that identified nosocomial infections central
venous catheter use nonshycommon skin contaminants and the identification of common skin
contaminants in two or more cultures within a fiveshyday period from each other (125)
Other studies have focused on evaluating the automation of deviceshydays and
compared it with manual chart review A study by Wright et al (2009) found that use of an
electronic medical record with fields to document invasive devices had high sensitivity and
specificity when compared with the chart review and resulted in a reduction by 142 hours
per year for collecting denominator data in the intensive care units (160) Hota et al
developed prediction algorithms to determine the presence of a central vascular catheter in
150
hospitalized patients with the use of data present in an electronic health record (159) They
found that models that incorporated ICDshy9 codes patient demographics duration of
intensive care stay laboratory data pharmacy data and radiological data were highly
accurate and precise and predicted deviceshyuse within five percent of the daily observed rate
by manual identification They also found that denominators resulting from their prediction
models when used to calculate the incidence of central lineshyassociated BSIs yielded similar
rates to those yielded by the manual approaches (159)
This ESS currently does not include information on the use of devices which may
have put patients at risk of bloodstream infections The ESS classified episodes of BSI as
primary or secondary based on microbiological data alone and those episodes classified as
primary may be further investigated to determine if they were associated with a central line
or another device However further improvement is required in the basic identification of
primary or secondary BSIs in the ESS This further limits the ability to evaluate infection
control practices and the impact of changes in practice on the incidence of infection which
are the main objectives of surveillance
Implications
Surveillance of BSI is important for measuring and monitoring the burden of
disease evaluating risk factors for acquisition monitoring temporal trends in occurrence
identifying emerging and reshyemerging infections with changing severity (50 78 79) As
part of an overall prevention and control strategy the Centers for Disease Control and
Preventionrsquos Healthcare Infection Control Practices Advisory Committee recommend
ongoing surveillance of BSIs Traditional surveillance methods for BSI typically involve
manual review and integration of clinical data from the medical record clinical laboratory
151
and pharmacy data by trained infection control professionals This approach is timeshy
consuming and costly and focuses infection control resources on counting rather than
preventing infections (3) Nevertheless manual infection surveillance methods remain the
principal means of surveillance in most jurisdictions (5)
With the increasing use and availability of electronic data on patients in healthcare
institutions and community settings the potential for automated surveillance has been
increasingly realized (3 161 162) Administrative and laboratory data may be linked for
streamlined data collection of patient admission demographic and diagnostic information
as well as microbiologic details such as species distribution and resistance rates The
collection of information in the ESS is a valuable source for researchers conducting
retrospective observational analysis on the populationshybased incidence trends of BSIs in the
CHR over time the speciesshyspecific incidence of BSIs and the location of acquisition of
incident episodes of BSI
The use of automated electronic surveillance has further implications for infection
prevention and control and healthcare quality improvement Hospital acquired infections
are potentially preventable and have been recognized by the Institute for Healthcare
Improvement as a major safetyquality of care issue in acute care institutions The Alberta
Quality Matrix for Health has six dimensions of quality one of these is Safety with the goal
of mitigating risks to avoid unintended or harmful results which is reflected in reducing the
risk of health service organizationshyacquired infections
Establishing the occurrence and determinants of bloodstream infections is critica to
devising means to reduce their adverse impact Traditionally infection prevention and
control programs have conducted focused surveillance for these infections by caseshybyshycase
152
healthcare professional review However such surveillance has major limitations largely as
a result of the human resources required Conventional surveillance has therefore typically
not been able to be routinely performed outside acute care institutions or comprehensively
include all cases in hospitals in a timely fashion The increasing availability and quality of
electronic patient information has suggested that a new approach to infectious diseases
surveillance may be possible
Many long term care facilities do not have a dedicated infection control professional
to conduct surveillance and lead prevention education and intervention programs
Furthermore with reduced access to laboratory facilities and diagnostic testing in these
settings patients may not be evaluated for infection when they are symptomatic but rather
antimicrobial drugs may be initiated on an empiric basis (163) The CHR has a centralized
laboratory service that conducts blood culture testing for all nursing home and long term
care facilities in the region therefore physicians at these sites should not feel hindered in
collecting blood cultures due to unavailable laboratory services However the data in the
ESS provides insight into the distribution of pathogens that occur in long term care
facilities which can facilitate the development of prevention education and intervention
programs by infection control professionals dedicated to long term care facilities
Similarly few home healthcare providers have dedicated infection control
professionals and no uniform definitions of infection or protocols for infection surveillance
have been agreed upon (163)
Often healthcare delivery in the home is uncontrolled and may even be provided by
family members The identification of BSIs in these settings based on the acquisition
location algorithm in the ESS may provide a better understanding of the distribution of
153
pathogens and the incidence of BSIs originating from this healthcare service Initially
infection control practitioners may be able to target specific education programs to the
home care providers on the proper insertion and maintenance of healthcare devices and
focus efforts on preventing high risk exposures
Finally infection control in outpatient and ambulatory settings have challenges in
determining which infections to conduct surveillance on to whom the data will be reported
who will be responsible for implementing changes what populations are being seen or
what procedures are being performed This ESS is capable of identifying blood cultures
collected at these settings however some of the discrepancies in the location of acquisition
were due to the ESS being unable to identify that the patient had a procedure conducted in
an outpatient setting Despite the small number of discrepancies the ESS may initially be
able to contribute information on the overall incidence of BSIs in these settings Reporting
on infection rates to outpatient and ambulatory care will be useful for improving education
programs for healthcare workers at these sites and quality of patient care (163) As
healthcare is increasingly provided in many of these outpatient settings infection control
professionals will need to ensure that infection control education programs reach these
healthcare personnel and that active surveillance systems for detection of BSIs reach these
areas (164) By expanding epidemiological programs through the continuum of care new
prevention opportunities are opened for reducing the risk of nosocomial infections by
reducing both the patientrsquos susceptibility and risk of exposure (165) It may become
particularly important to prevent further spread of antimicrobial resistance between nursing
homes and acute care hospitals as well as within the community (165) Furthermore
expansion beyond the hospital will help improve inshyhospital care through improved data
154
upon which to base assessments (165) This ESS can provide the framework and
foundational insight to the understanding of BSIs likely to be acquired in these settings as
well as the likelihood of hospitalization supporting the importance of the new healthcareshy
associated communityshyonset acquisition category Access to a rapidly available and valid
surveillance system is an essential tool needed to reduce the impact of bloodstream
infections Such a system will be important for the detection of outbreaks and for tracking
of disease over time as a complementary tool for infection control professionals
The overall incidence of bloodstream infections and rate of antibiotic resistant
organisms may be used as measures of quality of care and as outcome measures for quality
improvement initiatives Basic concepts of continuous quality improvement (CQI) are
closely related to the same methods long practiced in epidemiology by infection control
professionals (166) Surveillance strategies used in successful infection control programs
are identical to those stressed in quality improvement ndash elements include the establishment
of continuous monitoring systems planned assessment and statistical process control
techniques (166 167) There needs to be a link between the collection of data and
continuous improvement strategies so that caregivers can improve the quality of care
Quality indicators such as nosocomial infection rates must be reliable and reproducible
An impediment to the reliability may be based on the medical model itself such that data
collection staff often defer to the opinions of clinicians about the presence or absence of an
infection rather than simply to determine whether case definitions are met (167) This
inclination to make decisions on a caseshybyshycase basis is consistent with the medical model
of individualized care and the peershyreview process but not with the epidemiological model
of populationshybased analyses (167) Clear distinctions between case definitions for
155
surveillance purposes and case definitions for clinical diagnoses and treatment are crucial
This ESS which has been proven to be reliable offers the potential to act as an important
source for quality indicator information in the form of nosocomial and healthcareshy
associated communityshyonset incidence rates Furthermore like other automated
surveillance systems the ESS consistently and objectively applied definitions for
accurately identifying true episodes of bloodstream infection and the location they were
acquired The ultimate goal is a system to regularly report these outcomes as quality of care
indicators
Because these electronic data are usually routinely collected for other primary
purposes electronic surveillance systems may be developed and implemented with
potentially minimal incremental expense (5) Furuno et al did not identify a single study
that assessed the costs or costshyeffectiveness of an automated surveillance system (168)
However they identified two studies that used economic analyses to assess infection
control interventions that used an informatics component In particular one study assessed
the costshyeffectiveness of using handheld computers and computershybased surveillance
compared with traditional surveillance to identify urinary tract infections among patients
with urinary catheters They found that if surveillance was conducted on five units the
savings by the automated surveillance system was estimated at $147 815 compared with
traditional surveillance over a fourshyyear period (168) Despite the lack of evidence
supporting the decreased cost by employing automated surveillance systems intuitively
the use of previously developed automated systems for infectious disease surveillance
would result in a costshysavings for and timeshyreduction in traditional infection prevention and
control
156
Future Directions
Inclusion of ICDshy9 and ICDshy10 Codes to the ESS Algorithm
Aggregate coshymorbidity measures in infectious disease research may be used in
three ways First they are used in caseshycontrol and cohort studies to determine the risk
factors for colonization or infection Often the coshymorbidity measure represents important
risk factors but also an important confounding variable for which adjustment is required
Second coshymorbidity measures are utilized in prediction rules to predict colonization or
infection Coshymorbidity measures are used in real time as part of infection control
interventions such as identifying patients for isolation or surveillance cultures (140) Only a
single study has compared the prognostic value of Charlson Coshymorbidity Index measures
for predicting the acquisition of nosocomial infections Their administrative data predicted
nosocomial infections better compared with singleshyday chart review In this study the
singleshyday review data were generated based on information documented at the initial stage
of hospitalization which may be incompletely documented in the chart compared with
administrative data generated after discharge therefore consisting of richer data for its
predictive ability (140) The use of ICDshy9 codes to calculate the Charlson Coshymorbidity
Index based on discharge data may be inappropriate to use in realshytime infection control
intervention or epidemiological studies as some coshymorbidities may have developed after
infection has occurred It may also be inappropriate in cases where patients are observed for
only one admission where patients have no previous admissions or where there are long
time periods between admissions making it difficult to facilitate evaluation of previous
hospitalizations (140) A third aspect is in the use of adjustment for mortality length of
157
stay and disability outcomes associated with coshymorbidity for infectious disease rate
comparisons across healthcare centres
Despite the fact that this validation study did not evaluate the accuracy of ICDshy9
and ICDshy10 codes for the identification of coshymorbid conditions the ESSrsquos administrative
data source lists each patientrsquos diagnosis codes for the admission related to the incident BSI
and those related to previous admissions dating back to 2001Therefore there is potential
for evaluating the accuracy in these codes in identifying potential risk factors for BSI
thereby improving future epidemiological research activities
Evaluation of Antimicrobial Resistance
The problem of antimicrobial resistance has snowballed into a serious public health
concern with economic social and political implications that are global in scope and cross
all environmental and ethnic boundaries (169) Antimicrobial resistance also results in
adverse consequences internationally challenging the ability of countries to control
diseases of major public health interest and to contain increasing costs of antimicrobial
therapy (170) At the individual patient level antimicrobial resistance may lead to failed
therapy and antibiotic toxicity as a result of restricted choices or failure of safer first or
second line therapies increased hospitalization the requirement for invasive interventions
increased morbidity and even death (170)
Studies have demonstrated adverse health outcomes in patients with antibioticshy
resistant organisms with higher morbidity and mortality rates and length of hospital stay
than similar infections with antibioticshysusceptible strains (171 172) The magnitude and
severity of these outcomes may vary based on the causative organism the site of isolation
158
antimicrobial resistance patterns the mechanism of resistance and patient characteristics
(172)
Quantifying the effect of antimicrobial resistance on clinical outcomes will facilitate
an understanding and approach to controlling the development and spread of antimicrobial
resistance Surveillance systems that identify resistant strains of pathogens in hospital
community and healthcareshyassociated communityshyonset settings provide key information
for effectively managing patient care and prescribing practices (173)
Knowledge about the occurrence of antibioticshyresistant pathogens and the
implications of resistance for patient outcomes may prompt hospitals and healthcare
providers to establish and support initiatives to prevent such infections Surveillance
systems that identify susceptibility data on pathogens can be used to convince healthcare
providers to follow guidelines concerning isolation and to make rational choices about the
use of antimicrobial agents Furthermore susceptibility data can guide infection control
practitioners and surveillance system managers to track and prevent the spread of
antimicrobialshyresistant organisms (171)
Although this study did not evaluate antimicrobial susceptibility of organisms the
laboratory information system used in the ESS routinely collects susceptibility data on
organisms cultured from blood As a result future studies involving the use of the ESS can
make a significant contribution to the knowledge on trends of resistant organisms and to the
efforts to reduce antimicrobial resistance through programs of antimicrobial stewardship
159
CONCLUSION
In summary surveillance data obtained with the ESS which used existing data from
regional databases agreed closely with data obtained by manual medical record review In
particular it performed very well in the identification of incident episodes of BSI and the
location of acquisition of the incident episodes of BSI In contrast it did not agree well
with medical record review in identifying the focal body sites as potential sources of the
BSIs It was chosen to report agreement measures in the form of kappa statistics and to
describe the discrepancies in categorization between the ESS and the medical record
review Despite the limitations observed and described the ESS has and can continue to
have important implications for observational research infection prevention and control
and healthcare quality improvement The applicability of the ESS to other health systems is
dependent on the types of databases that information is stored in the ability to link distinct
databases into a relational database and the quality of the data and the linkage Because it
relies on basic variables that should be available to many other health systems it is
expected that the ESS can be applied elsewhere
160
BIBLIOGRAPHY
1 Jansson A Arneborn M Ekdahl K Sensitivity of the Swedish statutory surveillance
system for communicable diseases 1998shy2002 assessed by the captureshyrecapture method
Epidemiol Infect 2005 Jun133(3)401shy7
2 Madsen KM Schonheyder HC Kristensen B Nielsen GL Sorensen HT Can
hospital discharge diagnosis be used for surveillance of bacteremia A data quality study of
a Danish hospital discharge registry Infect Control Hosp Epidemiol 1998 Mar19(3)175shy
80
3 Trick WE Zagorski BM Tokars JI Vernon MO Welbel SF Wisniewski MF et al
Computer algorithms to detect bloodstream infections Emerg Infect Dis 2004
Sep10(9)1612shy20
4 Wright MO Perencevich EN Novak C Hebden JN Standiford HC Harris AD
Preliminary assessment of an automated surveillance system for infection control Infect
Control Hosp Epidemiol 2004 Apr25(4)325shy32
5 Leal J Laupland KB Validity of electronic surveillance systems a systematic
review J Hosp Infect 2008 Jul69(3)220shy9
6 Friedman ND Kaye KS Stout JE McGarry SA Trivette SL Briggs JP et al
Health careshyshyassociated bloodstream infections in adults a reason to change the accepted
definition of communityshyacquired infections Ann Intern Med 2002 Nov 19137(10)791shy7
7 Reimer LG Wilson ML Weinstein MP Update on detection of bacteremia and
fungemia Clin Microbiol Rev 1997 Jul10(3)444shy65
8 Ferguson KL Brown L Bacteremia and Sepsis Emergency Medicine Clinics of
North America 1996 01shyFebshy199614(1)185shy95
161
9 Hall KK Lyman JA Updated review of blood culture contamination Clin
Microbiol Infect 200619(4)788shy802
10 Vincent JL Martinez EO Silva E Evolving concepts in sepsis definitions Crit
Care Clin 2009 Oct25(4)665shy75 vii
11 Garner JS Jarvis WR Emori TG Horan TC Hughes JM CDC definitions for
nosocomial infections 1988 Am J Infect Control 1988 Jun16(3)128shy40
12 Bone RC Lets agree on terminology definitions of sepsis Crit Care Med 1991
Jul19(7)973shy6
13 Calandra T Cohen J The international sepsis forum consensus conference on
definitions of infection in the intensive care unit Crit Care Med 2005 Jul33(7)1538shy48
14 Laupland KB Davies HD Kellner JD Luzod NL Karan T Ma D et al Predictors
and outcome of admission for invasive Streptococcus pneumoniae infections at a Canadian
childrens hospital Clin Infect Dis 1998 Sep27(3)597shy602
15 Laupland KB Gregson DB Church DL Ross T Elsayed S Invasive Candida
species infections a 5 year populationshybased assessment J Antimicrob Chemother 2005
Sep56(3)532shy7
16 Laupland KB Davies HD Church DL Louie TJ Dool JS Zygun DA et al
Bloodstream infectionshyassociated sepsis and septic shock in critically ill adults a
populationshybased study Infection 2004 Apr32(2)59shy64
17 Magadia RR Weinstein MP Laboratory Diagnosis of Bacteremia and Fungemia
Infect Dis Clin North Am 200115(4)1009shy24
18 Laupland KB Zygun DA Davies HD Church DL Louie TJ Doig CJ Populationshy
based assessment of intensive care unitshyacquired bloodstream infections in adults
162
Incidence risk factors and associated mortality rate Crit Care Med 2002
Nov30(11)2462shy7
19 Pittet D Davis CS Li N Wenzel RP Identifying the hospitalized patient at risk for
nosocomial bloodstream infection a populationshybased study Proc Assoc Am Physicians
1997 Jan109(1)58shy67
20 Endimiani A Tamborini A Luzzaro F Lombardi G Toniolo A A twoshyyear
analysis of risk factors and outcome in patients with bloodstream infection Jpn J Infect Dis
2003 Feb56(1)1shy7
21 Pedersen G Schoenheyder HC Sorensen HT Source of infection and other factors
associated with case fatality in communityshyacquired bacteremia shy a Danish populationshy
based cohort study from 1992 to 1997 Clin microbiol Infect 20039793shy802
22 Pittet D Li N Wenzel RP Association of Secondary and Polymicrobial
Nosocomial Bloodstream Infections with Higher Mortality Eur J Clin Microbiol Infect Dis
199312(11)813shy19
23 Lopez Dupla M Martinez JA Vidal F Almela M Lopez J Marco F et al Clinical
characterization of breakthrough bacteraemia a survey of 392 episodes Journal of Internal
Medicine 2005258172shy80
24 Buckingham SC Brown SP San Joaquin VH Breakthrough bacteremia and
meningitis during treatment with cephalosporins parenterally for pneumococcal pneumonia
J Pediatr 1998132174shy6
25 Kelley MA Weber DJ Gilligan P Cohen MS Breakthrough Pneumococcal
Bacteremia in Patients Being Treated with Azithromycin and Clarithromycin Clin Infect
Dis 2000311008shy11
163
26 Krcmery V Jr Spanik S Mrazova M Trupl J Grausova S Grey E et al
Bacteremias caused by Escherichia coli in cancer patients shy analysis of 65 episodes Int J
Infect Dis 2002669shy73
27 Kumashi P Girgawy E Tarrand JJ Rolston KV Raad II Safdar A Streptococcus
pneumoniae Bacteremia in Patients with Cancer Disease Characteristics and Outcomes in
the Era of Escalating Drug Resistance (1998shy2002) Medicine 200584303shy12
28 Laupland KB Gregson DB Zygun DA Doig CJ Mortis G Church DL Severe
bloodstream infections a populationshybased assessment Crit Care Med 2004
Apr32(4)992shy7
29 AlshyRawajfah OM Stretzer F Hewitt JB Incidence of and Risk Factors for
Nosocomial Bloodstream Infections in Adults in the United States 2003 Infect Control
Hosp Epidemiol 200930(11)1036shy44
30 Pratikaki M Platsouka E Sotiropoulou C Vassilakopoulos T Paniara O Roussos
C et al Risk factors for and influence of bloodstream infections on mortality a 1shyyear
prospective study in a Greek intensiveshycare unit Epidemiol Infect 2009137727shy35
31 Parkins MD Gregson DB Pitout JD Ross T Laupland KB Populationshybased study
of the epidemiology and the risk factors for Pseudomonas aeruginosa bloodstream
infection Infection Feb38(1)25shy32
32 Maki DG Kluger DM Crnich CJ The risk of bloodstream infection in adults with
different intravascular devices a systematic review of 200 published prospective studies
Mayo Clin Proc 2006 Sep81(9)1159shy71
164
33 Laupland KB Gregson DB Flemons WW Hawkins D Ross T Church DL
Burden of communityshyonset bloodstream infection a populationshybased assessment
Epidemiol Infect 2007 Aug135(6)1037shy42
34 Valles J Calbo E Anoro E Fontanals D Xercavins M Espejo E et al Bloodstream
infections in adults importance of healthcareshyassociated infections J Infect 2008
Jan56(1)27shy34
35 Diekema DJ Beekmann SE Chapin KC Morel KA Munson E Doern GV
Epidemiology and outcome of nosocomial and communityshyonset bloodstream infection J
Clin Microbiol 2003 Aug41(8)3655shy60
36 Laupland KB Kortbeek JB Findlay C Hameed SM A populationshybased
assessment of major trauma in a large Canadian region Am J Surg 2005 May189(5)571shy
5 discussion 6
37 Lesens O Hansmann Y Brannigan E Hopkins S Meyer P OConnel B et al
Healthcareshyassociated Staphylococcus aureus bacteremia and the risk for methicillin
resistance is the Centers for Disease Control and Prevention definition for communityshy
acquired bacteremia still appropriate Infect Control Hosp Epidemiol 2005 Feb26(2)204shy
9
38 Horan TC Andrus M Dudeck MA CDCNHSN surveillance definition of health
careshyassociated infection and criteria for specific types of infections in the acute care
setting Am J Infect Control 2008 Jun36(5)309shy32
39 Laupland KB Bagshaw SM Gregson DB Kirkpatrick AW Ross T Church DL
Intensive care unitshyacquired urinary tract infections in a regional critical care system Crit
Care 2005 Apr9(2)R60shy5
165
40 Laupland KB Church DL Gregson DB Validation of a rapid diagnostic strategy
for determination of significant bacterial counts in bronchoalveolar lavage samples Arch
Pathol Lab Med 2005 Jan129(1)78shy81
41 Samore MH Evans RS Lassen A Gould P Lloyd J Gardner RM et al
Surveillance of medical deviceshyrelated hazards and adverse events in hospitalized patients
JAMA 2004 Jan 21291(3)325shy34
42 Laupland KB Church DL Gregson DB Evaluation of a rapid bacterial ATP assay
for screening BAL samples from ICU patients submitted for quantitative bacterial cultures
Diagn Microbiol Infect Dis 2003 Nov47(3)465shy9
43 Laupland KB Kirkpatrick AW Church DL Ross T Gregson DB Intensiveshycareshy
unitshyacquired bloodstream infections in a regional critically ill population J Hosp Infect
2004 Oct58(2)137shy45
44 Laupland K Gregson DB Kirkpatrick AW Kortbeek JB Zygun DA Findlay C et
al Bloodstream infection complicating trauma Clin Invest Med 2004 Oct27(5)253shy8
45 Laupland KB Lee H Gregson DB Manns BJ Cost of intensive care unitshyacquired
bloodstream infections J Hosp Infect 2006 Jun63(2)124shy32
46 Shorr AF Tabak YP Killian AD Gupta V Liu LZ Kollef MH Healthcareshy
associated bloodstream infection A distinct entity Insights from a large US database
Crit Care Med 2006 Oct34(10)2588shy95
47 Johannes RS Epidemiology of earlyshyonset bloodstream infection and implications
for treatment Am J Infect Control 2008 Dec36(10)S171 e13shy7
166
48 Kollef MH Shorr A Tabak YP Gupta V Liu LZ Johannes RS Epidemiology and
outcomes of healthshycareshyassociated pneumonia results from a large US database of cultureshy
positive pneumonia Chest 2005 Dec128(6)3854shy62
49 Lujan M Gallego M Rello J Healthcareshyassociated infections A useful concept
Current Opinion in Critical Care 200915419shy24
50 Laupland KB Ross T Church DL Gregson DB Populationshybased surveillance of
invasive pyogenic streptococcal infection in a large Canadian region Clin Microbiol Infect
2006 Mar12(3)224shy30
51 Angus DC Pereira CA Silva E Epidemiology of severe sepsis around the world
Endocr Metab Immune Disord Drug Targets 2006 Jun6(2)207shy12
52 Laupland KB Church DL Mucenski M Sutherland LR Davies HD Populationshy
based study of the epidemiology of and the risk factors for invasive Staphylococcus aureus
infections J Infect Dis 2003 May 1187(9)1452shy9
53 Laupland KB Church DL Gregson DB Blood cultures in ambulatory outpatients
BMC Infect Dis 20055(1)35
54 Laupland KB Zygun DA Doig CJ Bagshaw SM Svenson LW Fick GH Oneshyyear
mortality of bloodstream infectionshyassociated sepsis and septic shock among patients
presenting to a regional critical care system Intensive Care Med 2005 Feb31(2)213shy9
55 Weinstein MP Towns ML Quartey SM Mirrett S Reimer LG Parmigiani G et al
The clinical significance of positive blood cultures in the 1990s a prospective
comprehensive evaluation of the microbiology epidemiology and outcome of bacteremia
and fungemia in adults Clin Infect Dis 1997 Apr24(4)584shy602
167
56 Bryan CS Clinical implications of positive blood cultures Clin Microbiol Rev 1989
Oct2(4)329shy53
57 Weinstein MP Current blood culture methods and systems clinical concepts
technology and interpretation of results Clin Infect Dis 1996 Jul23(1)40shy6
58 Lee A Mirrett S Reller LB Weinstein MP Detection of Bloodstream Infections in
Adults How Many Blood Cultures are Needed J Clin Microbiol 200745(11)3546shy48
59 Weinstein MP Blood Culture Contamination Persisting Problems and Partial
Progress J Clin Microbiol [Minireview] 200341(6)2275shy78
60 Gaynes R Surveillance of antibiotic resistance learning to live with bias Infect
Control Hosp Epidemiol 1995 Nov16(11)623shy6
61 Laupland KB Populationshybased epidemiology of intensive care critical importance
of ascertainment of residency status Crit Care 2004 Dec8(6)R431shy6
62 Garner JS Jarvis WR Emori TG Horan TC Hughes JM CDC definitions for
nosocomial infections In Olmsted RN editor APIC infection control and applied
epidemiology principles and practice St Louis Mosby 1996 p Ashy1 shy Ashy20
63 Souvenir D Anderson DE Jr Palpant S Mroch H Askin S Anderson J et al
Blood cultures positive for coagulaseshynegative staphylococci antisepsis pseudobacteremia
and therapy of patients J Clin Microbiol 1998 Jul36(7)1923shy6
64 Beekmann SE Diekema DJ Doern GV Determining the Clinical Significance of
CoagulaseshyNegative Staphylococci Isolated from Blood Cultures Infect Control Hosp
Epidemiol 200526559shy66
168
65 Tokars JI Predictive value of blood cultures positive for coagulaseshynegative
staphylococci implications for patient care and health care quality assurance Clin Infect
Dis 2004 Aug 139(3)333shy41
66 Weinstein MP Murphy JR Reller LB Lichtenstein KA The clinical significance of
positive blood cultures a comprehensive analysis of 500 episodes of bacteremia and
fungemia in adults II Clinical observations with special reference to factors influencing
prognosis Rev Infect Dis 1983 JanshyFeb5(1)54shy70
67 Cockerill FR Wilson JW Vetter EA Optimal testing parameters for blood cultures
Clin INfect Dis 200438(1724shy30)
68 Weinstein MP Reller LB Remarks Concerning Testing Parameters for Blood
Cultures Clin Infect Dis [Correspondence] 200540202
69 Bates DW Lee TH Rapid classification of positive blood cultures Prospective
validation of a multivariate algorithm JAMA 1992 Apr 8267(14)1962shy6
70 Stefani S Diagnostic techniques in bloodstream infections where are we going Int
J Antimicrob Agents 200934SS9shyS12
71 Peters RPH van Agtmael MA Danner SA Savelkoul PHM Vandenbrouckeshy
Grauls CM New developments in the diagnosis of bloodstream infections Lancet Infect
Dis 20044
72 Rothman KJ Greenland S Lash TL Modern epidemiology 3rd ed Philadelphia
Lippincott Williams amp Wilkins 2008
73 Thacker SB Stroup DF Future directions for comprehensive public health
surveillance and health information systems in the United States Am J Epidemiol 1994 Sep
1140(5)383shy97
169
74 Langmuir AD The surveillance of communicable diseases of national importance
N Engl J Med 1963 Jan 24268182shy92
75 Declich S Carter AO Public health surveillance historical origins methods and
evaluation Bull World Health Organ 199472(2)285shy304
76 Nelson KE Williams CM Graham NMH Infectious disease epidemiology theory
and practice Gaithersburg Md Aspen 2001
77 Buehler JW Hopkins RS Overhage JM Sosin DM Tong V Framework for
evaluating public health surveillance systems for early detection of outbreaks
recommendations from the CDC Working Group MMWR Recomm Rep 2004 May
753(RRshy5)1shy11
78 German RR Lee LM Horan JM Milstein RL Pertowski CA Waller MN Updated
guidelines for evaluating public health surveillance systems recommendations from the
Guidelines Working Group MMWR Recomm Rep 2001 Jul 2750(RRshy13)1shy35 quiz CE1shy
7
79 Davies HD McGeer A Schwartz B Green K Cann D Simor AE et al Invasive
group A streptococcal infections in Ontario Canada Ontario Group A Streptococcal Study
Group N Engl J Med 1996 Aug 22335(8)547shy54
80 Mayhall CG Hospital epidemiology and infection control 3rd ed Philadelphia
Lippincott Williams amp Wilkins 2004
81 Division of STD Prevention National Center for HIVAIDS Viral Hepatitis STD
and TB Prevention Methods of Surveillance Atlanta Centers for Disease Control and
Prevention 2007 [cited 2010 Oct 10 ]
170
82 Losos JZ Routine and sentinel surveillance methods Eastern Mediterranean Health
Journal 19962(1)46shy50
83 Public Health Agency of Canada Case Definitions for Communicable Diseases
under National Surveillance Supplement Health Canada2009 November 2009
84 Bettinger JA Scheifele DW Kellner JD Halperin SA Vaudry W Law B et al The
effect of routine vaccination on invasive pneumococcal infections in Canadian children
Immunization Monitoring Program Active 2000shy2007 Vaccine Feb 2528(9)2130shy6
85 Public Health Agency of Canada Canada H VancomycinshyResistant Enterococci
(VRE) Surveillance [PDF] Ottawa2007 [cited 2010 Available from httpwwwphacshy
aspcgccanoisshysinpprojectspdfvre_protocol_epdf
86 Boyd D Gardam M Gravel D Hope K Hutchinson J Kelly S et al Ongoing
Surveillance for Clostridium difficile associated diarrhea (CDAD) within AcuteshyCare
Institutions [PDF] Ottawa2007 Available from httpwwwphacshyaspcgccanoisshy
sinpprojectspdfcdad07_protocol_epdf
87 Henning KJ Overview of Syndromic Surveillance What is Syndromic
Surveillance MMWR Morb Mortal Wkly Rep [serial on the Internet] 2004 53 (Suppl)
88 May L Chretien JP Pavlin JA Beyond traditional surveillance applying syndromic
surveillance to developing settings shy opportunities and challenges BMC Public Health
20099242shy53
89 Moore KM Edgar BL McGuinness D Implementation of an automated realshytime
public health surveillance system linking emergency departments and health units rationale
and methodology CJEM 200810(2)114shy9
171
90 Betancourt JA Hakre S Polyak CS Pavlin JA Evaluation of ICDshy9 codes for
syndromic surveillance in the electronic surveillance system for the early notification of
communityshybased epidemics Mil Med 2007 Apr172(4)346shy52
91 Flamand C Larrieu S Couvy F Jouves B Josseran L Filleul L Validation of a
syndromic surveillance system using a general practitioner house calls network Bordeaux
France Euro Surveill 2008 Jun 1913(25)
92 Hripcsak G Soulakis ND Li L Morrison FP Lai AM Friedman C et al
Syndromic surveillance using ambulatory electronic health records J Am Med Inform
Assoc 2009 MayshyJun16(3)354shy61
93 Hulth A Rydevik G Linde A Web queries as a source for syndromic surveillance
PLoS One 20094(2)e4378
94 Sloane PD MacFarquhar JK SickbertshyBennett E Mitchell CM Akers R Weber
DJ et al Syndromic surveillance for emerging infections in office practice using billing
data Ann Fam Med 2006 JulshyAug4(4)351shy8
95 van den Wijngaard C van Asten L van Pelt W Nagelkerke NJ Verheij R de
Neeling AJ et al Validation of syndromic surveillance for respiratory pathogen activity
Emerg Infect Dis 2008 Jun14(6)917shy25
96 Canada PHAo Surveillance [homepage on the Internet] Ottawa Government of
Canada 2009 [updated 2009shy11shy30 cited 2009 05shy25] Available from httpwwwphacshy
aspcgccanoisshysinpsurvprogshyengphp
97 Bowling A Research methods in health investigating health and health services
3rd ed Maidenhead Berkshire England New York NY McGraw HillOpen University
Press 2009
172
98 Brenner H Kliebsch U Dependence of weighted kappa coefficients on the number
of categories Epidemiology 1996 Mar7(2)199shy202
99 Hoehler FK Bias and prevalence effects on kappa viewed in terms of sensitivity
and specificity J Clin Epidemiol 2000 May53(5)499shy503
100 Vach W The dependence of Cohens kappa on the prevalence does not matter J
Clin Epidemiol 2005 Jul58(7)655shy61
101 Vergison A Tuerlinckx D Verhaegen J Malfroot A Epidemiologic features of
invasive pneumococcal disease in Belgian children passive surveillance is not enough
Pediatrics 2006 Sep118(3)e801shy9
102 Lorian V The need for surveillance for antimicrobial resistance Infect Control
Hosp Epidemiol 1995 Nov16(11)638shy41
103 Paul SM Finelli L Crane GL Spitalny KC A statewide surveillance system for
antimicrobialshyresistant bacteria New Jersey Infect Control Hosp Epidemiol 1995
Jul16(7)385shy90
104 Laupland KB Ross T Pitout JD Church DL Gregson DB Investigation of sources
of potential bias in laboratory surveillance for antishymicrobial resistance Clin Invest Med
200730(4)E159shy66
105 Kumar D Humar A Plevneshi A Green K Prasad GV Siegal D et al Invasive
pneumococcal disease in solid organ transplant recipientsshyshy10shyyear prospective population
surveillance Am J Transplant 2007 May7(5)1209shy14
106 Kellner JD Vanderkooi OG MacDonald J Church DL Tyrrell GJ Scheifele DW
Changing epidemiology of invasive pneumococcal disease in Canada 1998shy2007 update
173
from the Calgaryshyarea Streptococcus pneumoniae research (CASPER) study Clin Infect
Dis 2009 Jul 1549(2)205shy12
107 Powis J McGeer A Green K Vanderkooi O Weiss K Zhanel G et al In vitro
antimicrobial susceptibilities of Streptococcus pneumoniae clinical isolates obtained in
Canada in 2002 Antimicrob Agents Chemother 2004 Sep48(9)3305shy11
108 Daignault D Dore K Dutil L Irwin R Leger D Mann E et al Canadian Integrated
Program for Antimicrobial Resistance Surveillance (CIPARS) 2002working towards the
preservation of effective antimicrobials for humans and animals Ottawa Her Majesty the
Queen in Right of Canada represented by the Minister of Health Health Canada 2003
[cited 2010 September 24]
109 Simor AE OfnershyAgostini M Bryce E McGeer A Paton S Mulvey MR
Laboratory characterization of methicillinshyresistant Staphylococcus aureus in Canadian
hospitals results of 5 years of National Surveillance 1995shy1999 J Infect Dis 2002 Sep
1186(5)652shy60
110 Mulvey MR Bryce E Boyd DA OfnershyAgostini M Land AM Simor AE et al
Molecular characterization of cefoxitinshyresistant Escherichia coli from Canadian hospitals
Antimicrob Agents Chemother 2005 Jan49(1)358shy65
111 Zhanel GG DeCorby M Adam H Mulvey MR McCracken M LagaceshyWiens P et
al Prevalence of antimicrobialshyresistant pathogens in Canadian hospitals results of the
Canadian Ward Surveillance Study (CANWARD 2008) Antimicrob Agents Chemother
2010 Nov54(11)4684shy93
174
112 Schuchat A Hilger T Zell E Farley MM Reingold A Harrison L et al Active
bacterial core surveillance of the emerging infections program network Emerg Infect Dis
2001 JanshyFeb7(1)92shy9
113 National Center for Immunization and Respiratory Diseases Diseases DoB Active
Bacterial Core Surveillance (ABCs) [homepage on Internet] Atlanta Centres for Disease
Control and Prevention (CDC) [updated 2006shy08shy10 cited 2009 05shy25] Available from
httpwwwcdcgovabcsmethodologyindexhtml
114 Pfaller MA Jones RN Doern GV Kugler K Bacterial pathogens isolated from
patients with bloodstream infection frequencies of occurrence and antimicrobial
susceptibility patterns from the SENTRY antimicrobial surveillance program (United States
and Canada 1997) Antimicrob Agents Chemother 1998 Jul42(7)1762shy70
115 Emori TG Culver DH Horan TC Jarvis WR White JW Olson DR et al National
nosocomial infections surveillance system (NNIS) description of surveillance methods
Am J Infect Control 1991 Feb19(1)19shy35
116 Karadag B Karakoc F Ersu R Kut A Bakac S Dagli E Nonshycysticshyfibrosis
bronchiectasis in children a persisting problem in developing countries Respiration 2005
MayshyJun72(3)233shy8
117 Goldrick BA The practice of infection control and applied epidemiology a
historical perspective Am J Infect Control 2005 Nov33(9)493shy500
118 Haley RW Hooton TM Schoenfelder JR Crossley KB Quade D Stanley RC et
al Effect of an infection surveillance and control program on the accuracy of retrospective
chart review American journal of epidemiology 1980 May111(5)543shy55
175
119 Haley RW Schaberg DR McClish DK Quade D Crossley KB Culver DH et al
The accuracy of retrospective chart review in measuring nosocomial infection rates Results
of validation studies in pilot hospitals American journal of epidemiology 1980
May111(5)516shy33
120 Mulholland SG Creed J Dierauf LA Bruun JN Blakemore WS Analysis and
significance of nosocomial infection rates Ann Surg 1974 Dec180(6)827shy30
121 Burke JP Infection control shy a problem for patient safety N Engl J Med 2003 Feb
13348(7)651shy6
122 Tokars JI Richards C Andrus M Klevens M Curtis A Horan T et al The
changing face of surveillance for health careshyassociated infections Clin Infect Dis 2004
Nov 139(9)1347shy52
123 Gastmeier P Kampf G Hauer T Schlingmann J Schumacher M Daschner F et al
Experience with two validation methods in a prevalence survey on nosocomial infections
Infect Control Hosp Epidemiol 1998 Sep19(9)668shy73
124 Ehrenkranz NJ Shultz JM Richter EL Recorded criteria as a gold standard for
sensitivity and specificity estimates of surveillance of nosocomial infection a novel method
to measure job performance Infect Control Hosp Epidemiol 1995 Dec16(12)697shy702
125 Woeltje KF Butler AM Goris AJ Tutlam NT Doherty JA Westover MB et al
Automated surveillance for central lineshyassociated bloodstream infection in intensive care
units Infect Control Hosp Epidemiol 2008 Sep29(9)842shy6
126 Boslaugh S Secondary data sources for public health a practical guide Cambridge
New York Cambridge University Press 2007
176
127 Sorensen HT Sabroe S Olsen J A framework for evaluation of secondary data
sources for epidemiological research Int J Epidemiol 1996 Apr25(2)435shy42
128 Connell FA Diehr P Hart LG The use of large data bases in health care studies
Annu Rev Public Health 1987851shy74
129 Lewis D Antimicrobial resistance surveillance methods will depend on objectives
J Antimicrob Chemother 2002 Jan49(1)3shy5
130 Bax R Bywater R Cornaglia G Goossens H Hunter P Isham V et al Surveillance
of antimicrobial resistanceshyshywhat how and whither Clin Microbiol Infect 2001
Jun7(6)316shy25
131 Heginbothom ML Magee JT Bell JL Dunstan FD Howard AJ Hillier SL et al
Laboratory testing policies and their effects on routine surveillance of community
antimicrobial resistance J Antimicrob Chemother 2004 Jun53(6)1010shy7
132 Livermore DM Macgowan AP Wale MC Surveillance of antimicrobial resistance
Centralised surveys to validate routine data offer a practical approach BMJ 1998 Sep
5317(7159)614shy5
133 MacGowan AP Bowker KE Bennett PM Lovering AM Surveillance of
antimicrobial resistance Lancet 1998 Nov 28352(9142)1783
134 Magee JT Effects of duplicate and screening isolates on surveillance of community
and hospital antibiotic resistance J Antimicrob Chemother 2004 Jul54(1)155shy62
135 Shannon KP French GL Antibiotic resistance effect of different criteria for
classifying isolates as duplicates on apparent resistance frequencies J Antimicrob
Chemother 2002 Jan49(1)201shy4
177
136 Lee SO Cho YK Kim SY Lee ES Park SY Seo YH Comparison of trends of
resistance rates over 3 years calculated from results for all isolates and for the first isolate
of a given species from a patient J Clin Microbiol 2004 Oct42(10)4776shy9
137 Sahm DF Marsilio MK Piazza G Antimicrobial resistance in key bloodstream
bacterial isolates electronic surveillance with the Surveillance Network DatabaseshyshyUSA
Clin Infect Dis 1999 Aug29(2)259shy63
138 Reacher MH Shah A Livermore DM Wale MC Graham C Johnson AP et al
Bacteraemia and antibiotic resistance of its pathogens reported in England and Wales
between 1990 and 1998 trend analysis BMJ (Clinical research ed ) 2000 Jan
22320(7229)213shy6
139 Tenover FC Tokars J Swenson J Paul S Spitalny K Jarvis W Ability of clinical
laboratories to detect antimicrobial agentshyresistant enterococci J Clin Microbiol 1993
Jul31(7)1695shy9
140 Leal JR Laupland KB Validity of ascertainment of coshymorbid illness using
administrative databases a systematic review Clinical Microbiology and Infection 2009In
press
141 Laupland KB Gill MJ Schenk L Goodwin D Davies HD Outpatient parenteral
antibiotic therapy evolution of the Calgary adult home parenteral therapy program Clin
Invest Med 2002 Oct25(5)185shy90
142 Manns BJ Mortis GP Taub KJ McLaughlin K Donaldson C Ghali WA The
Southern Alberta Renal Program database a prototype for patient management and
research initiatives Clin Invest Med 2001 Aug24(4)164shy70
178
143 Leal J Gregson DB Ross T Flemons WW Church DL Laupland KB
Development of a novel electronic surveillance system for monitoring of bloodstream
infections Infect Control Hosp Epidemiol 2010 Jul31(7)740shy7
144 Quan H Sundararajan V Halfon P Fong A Burnand B Luthi JC et al Coding
algorithms for defining comorbidities in ICDshy9shyCM and ICDshy10 administrative data Med
Care 2005 Nov43(11)1130shy9
145 Yokoe DS Anderson J Chambers R Connor M Finberg R Hopkins C et al
Simplified surveillance for nosocomial bloodstream infections Infect Control Hosp
Epidemiol 1998 Sep19(9)657shy60
146 Pokorny L Rovira A MartinshyBaranera M Gimeno C AlonsoshyTarres C Vilarasau J
Automatic detection of patients with nosocomial infection by a computershybased
surveillance system a validation study in a general hospital Infect Control Hosp Epidemiol
2006 May27(5)500shy3
147 Leth RA Moller JK Surveillance of hospitalshyacquired infections based on
electronic hospital registries J Hosp Infect 2006 Jan62(1)71shy9
148 Tan LK Lacey S Mandalia S Melzer M Hospitalshybased study of viridans
streptococcal bacteraemia in children and adults J Infect 2008 Feb56(2)103shy7
149 Wunderink RG Healthcareshyassociated bacteremia Stirring the mud Crit Care Med
2006 Oct34(10)2685shy6
150 Klompas M Yokoe DS Automated surveillance of health careshyassociated
infections Clin Infect Dis 2009 May 148(9)1268shy75
179
151 Anthony RM Brown TJ French GL Rapid diagnosis of bacteremia by universal
amplification of 23S ribosomal DNA followed by hybridization to an oligonucleotide array
J Clin Microbiol 2000 Feb38(2)781shy8
152 McBryde ES Brett J Russo PL Worth LJ Bull AL Richards MJ Validation of
statewide surveillance system data on central lineshyassociated bloodstream infection in
intensive care units in Australia Infect Control Hosp Epidemiol 2009 Nov30(11)1045shy9
153 Altman DG editor Practical Statistics for Medical Research London Chapman amp
Hall 1991
154 Laupland KB Gregson DB Church DL Ross T Pitout JD Incidence risk factors
and outcomes of Escherichia coli bloodstream infections in a large Canadian region Clin
Microbiol Infect 2008 Nov14(11)1041shy7
155 AlshyHasan MN Lahr BD EckelshyPassow JE Baddour LM Antimicrobial resistance
trends of Escherichia coli bloodstream isolates a populationshybased study 1998shy2007 J
Antimicrob Chemother 2009 Jul64(1)169shy74
156 AlshyHasan MN EckelshyPassow JE Baddour LM Bacteremia complicating gramshy
negative urinary tract infections a populationshybased study J Infect 2010 Apr60(4)278shy85
157 El Atrouni WI Knoll BM Lahr BD EckelshyPassow JE Sia IG Baddour LM
Temporal trends in the incidence of Staphylococcus aureus bacteremia in Olmsted County
Minnesota 1998 to 2005 a populationshybased study Clin Infect Dis 2009 Dec
1549(12)e130shy8
158 Bellini C Petignat C Francioli P Wenger A Bille J Klopotov A et al Comparison
of automated strategies for surveillance of nosocomial bacteremia Infect Control Hosp
Epidemiol 2007 Sep28(9)1030shy5
180
159 Hota B Harting B Weinstein RA Lyles RD Bleasdale SC Trick W Electronic
algorithmic prediction of central vascular catheter use Infect Control Hosp Epidemiol
Jan31(1)4shy11
160 Wright MO Fisher A John M Reynolds K Peterson LR Robicsek A The
electronic medical record as a tool for infection surveillance successful automation of
deviceshydays Am J Infect Control 2009 Jun37(5)364shy70
161 Baker C Luce J Chenoweth C Friedman C Comparison of caseshyfinding
methodologies for endometritis after cesarean section Am J Infect Control 1995
Feb23(1)27shy33
162 Wurtz R Cameron BJ Electronic laboratory reporting for the infectious diseases
physician and clinical microbiologist Clin Infect Dis 2005 Jun 140(11)1638shy43
163 Jarvis WR Infection control and changing healthshycare delivery systems Emerg
Infect Dis 2001 MarshyApr7(2)170shy3
164 Jarvis WR The evolving world of healthcareshyassociated bloodstream infection
surveillance and prevention is your system as good as you think Infect Control Hosp
Epidemiol 2002 May23(5)236shy8
165 Scheckler WE Brimhall D Buck AS Farr BM Friedman C Garibaldi RA et al
Requirements for infrastructure and essential activities of infection control and
epidemiology in hospitals a consensus panel report Society for Healthcare Epidemiology
of America Infect Control Hosp Epidemiol 1998 Feb19(2)114shy24
166 Brewer JH Gasser CS The affinity between continuous quality improvement and
epidemic surveillance Infect Control Hosp Epidemiol 1993 Feb14(2)95shy8
181
167 Nosocomial infection rates for interhospital comparison limitations and possible
solutions A Report from the National Nosocomial Infections Surveillance (NNIS) System
Infect Control Hosp Epidemiol 1991 Oct12(10)609shy21
168 Furuno JP Schweizer ML McGregor JC Perencevich EN Economics of infection
control surveillance technology costshyeffective or just cost Am J Infect Control 2008
Apr36(3 Suppl)S12shy7
169 Leidl P Report on Infectious Diseases Overcoming Antimicrobial Resistance
Geneva World Health Organization 2000 Available from httpwwwwhointinfectiousshy
diseaseshyreportindexhtml
170 Masterton RG Surveillance studies how can they help the management of
infection J Antimicrob Chemother 2000 Aug46 Suppl B53shy8
171 Lode HM Clinical impact of antibioticshyresistant Gramshypositive pathogens Clin
Microbiol Infect 2009 Mar15(3)212shy7
172 Cosgrove SE Kaye KS Eliopoulous GM Carmeli Y Health and economic
outcomes of the emergence of thirdshygeneration cephalosporin resistance in Enterobacter
species Arch Intern Med 2002 Jan 28162(2)185shy90
173 Conly J Antimicrobial resistance in Canada CMAJ 2002 Oct 15167(8)885shy91
182
APPENDIX A ADMINISTRATIVE DATABASE FIELD DESCRIPTIONS
Admission_Data_NosoInfcmdb
There are six tables in Admission_Data_NosoInfcmdb Inpatient_Admissions has all cases
identified by PHNs from CLS Related diagnosis information is in table
Inpatient_diagnosis The two tables can be linked by field cdr_key Emergency day
procedure and renal clinic visits are in separated tables Diagnosis_Reference is reference
table for both ICD9 and ICD10 diagnosis codes
Following are the definitions for some of the data fields
Table Inpatient Admissions
[Field Name] CDR_Key
[Definition] System generated number that is used to uniquely identify an inpatient
discharge Each patient visit (the period from admit to discharge) is assigned a unique
CDR_KEY when inpatient records are loaded from Health Records CDR_KEY is the
foreign key in various other tables in the repository and is used to link to these tables for
further visit information
[Valid Responses] Number not null no duplicate values
[Field Name] Admit Category
[Definition] Categorization of the patient at admission
[Valid Responses]
As of 01shyAPRshy2002
L = Elective
U = UrgentEmergent
N = Newborn
183
S = Stillborn
R = Cadaveric donor
Cannot be null
Prior to 01shyAPRshy2002
E = Emergent
L = Elective
U = Urgent
Null = NewbornStillborn
[Field Name] Exit Alive Code
[Definition] The disposition status of the patient when they leave the hospital
[Valid Responses]
As of 01shyAPRshy2002
01 shy Transfer to another acute care hospital
02 shy Transfer to a long term care facility
03 shy Transfer to other care facility
04 shy Discharge to home with support services
05 shy Discharged home
06 shy Signed out
07 shy Died expired
08 shy Cadaver donor admitted for organ tissue removal
09 shy Stillbirth
Prior to 01shyAPRshy2002
D shy Discharge
184
S shy Signed Out
Null shy Death
[Field Name] Regional Health Authority (RHA)
[Definition] For Alberta residents the RHA is a 2 character code that identifies the health
region the patient lives in For outshyofshyprovince patients the RHA identifies the province
they are from RHA is determined based on postal code or residence name if postal code is
not available RHA is not available RHA in the table is current regional health authority
boundary
[Valid Responses]
01shy Chinook
02shy Palliser
03shy Calgary
04shy David Thompson
05shy East Central
06shy Capital Health
07shy Aspen
08shy Mistahia
09shy Northern Lights
Provincial Abbreviations ABshy Alberta BCshy British Columbia MBshy Manitoba NBshy New
Brunswick NLshy Newfoundland NTshy Northwest Territories NSshy Nova Scotia ONshy
Ontario OCshyout of Country PEshy Prince Edward Island QEshy Quebec QCshy Quebec City
SKshy Saskatchewan USshyUSA YKshy Yukon Territories 99shyUnknown
Lookup in CDREFRHA
185
Provincial abbreviations as above except NFshy Newfoundland
[Field Name] Institution From
[Definition] The institution from number is used when a patient is transferred from
another health care facility for further treatment or hospitalization The first digit identifies
the level of care followed by the threeshydigit Alberta institution number of the sending
institution
[Valid Responses]
First digit = Level of care
0shy Acute acute psychiatric
1shy S Day Surg (Discontinued Mar 31 1997)
2shy Organized OP Clinic (Discontinued Mar 31 1997)
3shy ER (Discontinued Mar 31 1997)
4shy General rehab (Glenrose Hospital)
5shy Non acute Psychiatric
6shy Long term care
7shy Nursing Home intermediatepersonal care (when Institution Number is available)
(Added Apr 1 1997)
8shy Ambulatory Care organized outpatient department (Added Apr 1 1997)
9shy SubshyAcute
Last 3 digits = Alberta Health Institution
001shy916 Or the following generic codes
995shy Nursing Homelong term care facility
996shy Unclassified and Unkown Health Inst (97shy98 Addendum Hospice)
186
997shy Home Care
998shy Senior Citizens Lodge
999shy Out of Province or Country Acute Care
[Historical Background]
FMCshy did not begin collection of 9997 until October 1997
BVC PLC shy did not collect 1 or 2
BVC or PLC shy collected 3 transfers from Emergency to opposite site (94shy95)
[Field Name] Length of Stay in Days
[Definition] The number of days a patient has been registered as an inpatient
[Valid Responses] Whole number 1 day or greater
[Field Name] Site
[Definition] Three character site identifier
[Valid Responses]
ACH shy Alberta Childrens Hospital
BVC shy Bow Valley Centre Calgary General Hospital (closed June 1997)
FMC shy Foothills Hospital
HCH shy Holy Cross Hospital (closed March 1996)
PLC shy Peter Lougheed Centre Calgary General Hospital
RGH shy Rockyview Hospital
SAG shy Salvation Army Grace Hospital (closed November 1995)
CBA shy Crossbow Auxiliary (officially April 1 2001 closed 30shyJUNshy2004)
GPA shy Glenmore Park Auxiliary (officially April 1 2001)
VFA shy Dr Vernon Fanning Auxiliary (officially April 1 2001)
187
May not be null
Table Inpatient_Diagnosis
[Field Name] Diagnosis Code
[Definition] ICDshy9shyCMICDshy10shyCA diagnosis codes as assigned by Health Records to
classify the disease and health problems to explain the reasons the patient is in hospital
This field should be used in combination with diagnosis_type diagnosis_sequence and
diagnosis_prefix for complete diagnosis information
[Valid Responses] Cannot be null
01shyAPRshy2002 to current
ICDshy10shyCA codes (decimal places removed)
Prior to 01shyAPRshy2002
ICDshy9shyCM codes (decimal places removed)
Lookup ICDshy9shyCMICDshy10shyCA codes reference table The inpatient discharge date must
fall between VALID_FROM and VALID_TO dates for valid diagnosis codes
[Field Name] Diagnosis Prefix
[Definition] An alpha character that has been assigned to further distinguish ICD
diagnosis for study purposes
[Valid Responses]
CHR Valid Responses
Q = Questionable or query diagnoses
E = External cause of injury codes (discontinued 01shyAPRshy2002 as it is available in the
diagnosis code)
[Historical Background]
188
Site specific alphanumeric prefixes prior to 01shyAPRshy1998
PLC
ICD9CM Code 7708
A shy Apnea is documented
ICD9CM Code 7718
A shy Sepsis is confirmed
B shy Sepsis is presumed
ICD9CM Code 7730
A shy Intrauterine transfusion was performed
ICD9CM Code 7798
A shy Hypotonia present on discharge
B shy Hypertonia present on discharge
D shy Cardiac Failure
F shy Shock
Patient Service 59 and subservice 974
A shy Planned hospital birth
B shy Planned home birth w admit to hospital
Grace
A shy Type I CINVAI
RGHHCH
P shy Palliative
[Field Name] Diagnosis Sequence
189
[Definition] This field is a system assigned sequential number that when combined with
CDR_KEY uniquely identifies diagnoses for an inpatient discharge The most responsible
diagnosis is always sequence 1
[Valid Responses] Cannot be null
01shyAPRshy2002 to current shy number from 1 shy50
Prior to 01shyAPRshy2002 shy number from 1shy16
Cannot be null
[Historical Background]
Prior to 01shyAPRshy1998
shy ACH diagnosis sequences of 1 have a null diagnosis type
shy Diagnosis sequence 14 was used for the transfer diagnosis at all adult sites As a result
records may have an outshyofshysequence diagnosis (for example diagnosis sequences 1 2 then
14)
[Edit Checks Business Rules]
Diagnosis Sequence number 1 = Most responsible diagnosis
Every inpatient discharge must have a diagnosis sequence 1
[Field Name] Diagnosis Type
[Definition] The diagnosis type is a oneshydigit code used to indicate the relationship of the
diagnosis to the patients stay in hospital
HDM field name DxInfoDxType
[Valid Responses]
01shyAPRshy2002 to current (CHR valid responses)
(See ICD 10 CA Data Dictionary for full definition of types)
190
M = Most responsible diagnosis (MRDx) M diagnosis types should have a
diagnosis_sequence of 1 Exception Prior to 01shyAPRshy1998 ACH diagnosis sequence of 1
have null diagnosis types
1 = Preshyadmit comorbidity shy A diagnosis or condition that existed preshyadmission
2 = Postshyadmit comorbidity shy A diagnosis or condition that arises postshyadmission If a postshy
admit comorbidity results in being the MRDx it is recorded as the MRDx and repeated as a
diagnosis Type 2
3 = Secondary diagnosis shy A diagnosis or condition for which a patient may or may not
have received treatment
9 = An external cause of injury code
0 = Newborn born via caesarean section
0 = Optional shy Diagnosis type 0 can be used for purposes other than babies born via cshy
section Review diagnosis code to distinguish type 0
W X Y = Service transfer diagnoses (Added 01shyAPRshy2002)
W shy diagnosis associated with the first service transfer
X shy diagnosis associated with the second service transfer
Y shy diagnosis associated with the third service transfer
[Historical Background]
94shy95 Addendum
5shy8 shy Hospital Assigned
FMC 0 = All Newborns with a most responsible diagnosis of V 30
Grace 2 = Complication and 6 = V code for NB
Prior to 01shyAPRshy1998
191
shy ACH diagnosis sequence of 1 have null diagnosis types
shy Adult sites diagnosis type is null when a transfer diagnosis is entered in diagnosis
sequence 14
As of DECshy2002
Use of Diagnosis Type 3 on Newborn visits (Service 54) was discontinued All secondary
diagnoses on the newborn visit (previously typed as a 3) now have the diagnosis type of 0
[Edit Checks Business Rules]
M diagnosis types should have a diagnosis_sequence of 1 with the exception of ACH prior
to 01shyAPRshy1998 ACH diagnosis sequence of 1 have null diagnosis types
Table Emergency_Visits
Day_Procedure_Visits
Renal_Clinics_Visits
[Field Name] ABSTRACT_TSEQ
[Definition] System assigned number which uniquely identifies the record
[Field Name] Institution From
[Definition] Originating institution Institution number that is used when a patient is
transferred from another health care facility for further treatment or hospitalization
[Field Name] Visit Disposition
[Definition] Identifies the disposition (outcome) of the registration The disposition is a
one digit code which identifies the service recipients type of separation from the
ambulatory care service
1 Discharged shyvisit concluded
192
2 Discharged from program or clinic shy will not return for further care (This refers only to
the last visit of a service recipient discharged from a treatment program at which heshe has
been seen for repeat services)
3 Left against medical advice
4 Service recipient admitted as an inpatient to Critical Care Unit or OR in own facility
5 Service recipient admitted as an inpatient to other area in own facility
6 Service recipient transferred to another acute care facility (includes psychiatric rehab
oncology and pediatric facilities)
7 DAA shy Service recipient expired in ambulatory care service
8 DOA shy Service recipient dead on arrival to ambulatory care service
9 Left without being seen (Not seen by a care provider Discontinued April 1 2001 as per
Alberta Health These patients will now be assigned Disposition Code 3 shy Left Against
Medical Advice with a Most Responsible Diagnosis of V642 shy Surgical or Other Procedure
Not Carried Out Because of Patients Decision)
193
APPENDIX B MEDICAL RECORD REVIEW FORM
A Demographics
Patient____________ Date of Birth _______________ Episode _________
Yy mm dd (complete new form for each episode)
Initials____________ Gender F M City of Residence______________________
B Bloodstream Infection vs Contamination (List all isolates in the table ndash only for first episode)
Culture Infected (I) or Contaminant ( C)
Etiology Comment
(For this episode diagnosis) First date _______________ First Time (24 hr) ____ ____ Polymicrobial Y N
Yy mm dd
Does the patient have Fever Y N Chills Y N Hypotension Y N
Comments
C Acquisition (Circle one of)
1 Y N No evidence infection was present or incubating at the hospital admission Nosocomial unless related to previous hospital admission
194
2 Healthshycare associated
Y N First culture obtained lt48 hours of admission and at least one of
Y N IV antibiotic therapy or specialized care at home other than oxygen within the prior 30 days before bloodstream infection
Y N Attended a hospital or hemodialysis clinic or IV chemotherapy within the prior 30 days before bloodstream infection
Y N Admitted to hospital for 2 or more days within the prior 90 days before bloodstream infection
Y N Resident of nursing home or long term care facility
3 Community Acquired
Y N Bloodstream infections not fulfilling criteria for either nosocomial or healthcare associated
D Focality of Infection (Circle one of)
1 Primary
Y N Bloodstream infection is not related to infection at another site other than intravascular device associated
2 Secondary
Y N Bloodstream infection is related to infection at another body site (other than intravascular device) as determined on the basis of all available clinical radiographic and laboratory evidence
E Sites of Secondary Infections (Check off all that apply)
Major Code Specific Site Code
Culture Confirmed
UTI Y N SSI Y N SST Y N PNEU Y N BSI Y N BJ Y N CNS Y N CVS Y N EENT Y N GI Y N LRI Y N REPR Y N SYS Y N
195
Comment
F Course and Outcome
Admission Date yy mm dd
Admission Time (24 Hr)
Discharge Date yy mm dd
Discharge Time (24 Hr)
Location (ED Ward ICU)
Discharge Status (Circle one) Alive Deceased
196
APPENDIX C KAPPA CALCULATIONS
Measuring Observed Agreement
Observed agreement is the sum of values along the diagonal of the frequency 3x3
table divided by the table total
Measuring Expected Agreement
The expected frequency in a cell of a frequency 3x3 table is the product of the total
of the relevant column and the total of the relevant row divided by the table total
Measuring the Index of Agreement Kappa
Kappa has a maximum agreement of 100 so the agreement is a proportion of the
possible scope for doing better than chance which is 1 ndash Pe
Calculating the Standard Error
197
APPENDIX D ORGANISMS WITH INCIDENCE OF LESS THAN 1 PER 100000
ADULT POPULATION FROM TABLE 51
The following organisms had a speciesshyspecific incidence of less than 1 per 100000
adult population and were classified as ldquoOtherrdquo in Table 51 Abiotrophia spp
Acinetobacter baumanni Acinetobacter lwoffi Actinomyces spp Aerobic gram positive
bacilli Aerococcus spp Aerococcus urinae Aerococcus viridans Aeromonas spp
Alcaligenes faecalis Anaerobic gram negative bacilli Anaerobic gram negative cocci
Bacteroides fragilis Bacteroides spp Bacteroides ureolyticus Bacteroides ureolyticus
group Candida famata Candida krusei Candida lusitaniae Candida parapsilosis
Candida tropicalis Capnocytophaga spp Citrobacter braakii Citrobacter freundii
complex Citrobacter koseri (diversus) Clostridium cadaveris Clostridium clostridiiforme
Clostridium perfringens Clostridium ramosum Clostridium spp Clostridium symbiosum
Clostridium tertium Corynebacterium sp Coryneform bacilli Eggerthella lenta Eikenella
corrodens Enterobacter aerogenes Enterococcus casseliflavus Enterococcus spp
Fusobacterium necrophorum Fusobacterium nucleatum Fusobacterium spp Gram
positive bacilli resembling lactobacillus Gram positive cocci resembling Staphylococcus
Gram negative bacilli Gram negative cocci Gram negative enteric bacilli Gram positive
bacilli Gram positive bacilli not Clostridium perfringens Granulicatella adiacens
Streptococcus dysgalactiae subsp equisimilis Haemophilus influenzae Type B
Haemophilus influenzae Klebsiella ozaenae Klebsiella spp Listeria monocytogenes
Morganella morganii Mycobacterium spp Neisseria meningitidis Nocardia farcinica
Pleomorphic gram positive bacilli Porphyromonas spp Prevotella spp Proteus vulgaris
group Providencia rettgeri Pseudomonas spp Raoul ornithinolytica Salmonella
198
enteritidis Salmonella oranienburg Salmonella paratyphi A Salmonella spp Salmonella
spp Group B Salmonella spp Group C1 Salmonella typhi Serratian marcescens
Staphylococcus lugdunensis Staphylococcus schleiferi Stenotrophomanas maltophilia
Streptococcus bovis group Streptococcus constellatus Streptococcus dysgalactiae
Streptococcus mutans Streptococcus salivarius Streptococcus sanguis group viridans
Streptococcus Sutterella wadsworthensis Veillonella spp Yeast species not C albicans
199
APPENDIX E DETAILED TABULATION OF DISCREPANCIES BETWEEN THE
MEDICAL RECORD REVIEW AND THE ESS
Table E1 Description of Discrepancies between ESS and Medical Record Review in the Identification of True BSIs
Patient Chart ESS Notes 9 Additional Incidents of BSI by Chart review 298 3 episodes ndash all MM 2 Episodes ndash all MM Chart ndash 1 extra
S aureus Ecoli Saureus episode No 3rd episode bc isolate not firstbldper365d considered part of episode 1 therefore not counted
556 2 episodes ndash MM PM 1 episode shy MM Chart ndash 1 extra episode
Isolate of first episode (CR) not firstbldper365d therefore not counted 1 isolate of CR 2nd
episode a firstbldper365d 584 1 episode 0 Episode Chart ndash 1 extra
episode No episode bc isolate not firstbldper365d therefore not counted
616 1 episode 0 Episode Chart shy1 extra episode
No episode bc isolate not firstbldper365d therefore not counted
827 1 episode 0 Episode Chart ndash 1 extra episode
No episode bc isolate not firstbldper365d therefore not counted
1307 1 episode 0 Episode Chart shy1 extra episode
no episode bc isolate not firstbldper365d therefore not counted
1582 2 episodes ndash all MM 1 Episode shy MM Chart ndash 1 extra episode
No 2nd episode bc isolate not firstbldper365d not counted
200
Patient Chart ESS Notes continued 1861 3 episodes ndash all MM 2 Episodes ndash all MM
No 3rd episode bc isolate not firsbldper365d considered part of episode 1 therefore not counted
Chart ndash 1 extra episode
2135 2 episodes ndash all MM 1 Episode ndash MM
No 2nd episode bc isolate not firstbldper365d considered part of episode 1 therefore not counted
Chart ndash 1 extra episode
14 Additional incident episodes by ESS not by chart
201
Table E2 Description of Discrepancies between ESS and Medical Record Review in the Identification of True BSIs
Patient Chart ESS Notes 2 Additional episodes by ESS 46 1 Episodeshy PM 2 episodes ndash all MM ESS ndash 1 extra
episode 3rd 3rd isolate part of polymicrobial isolate Firstbloodper365d episode classified as separate 2nd
episode 2584 1 episode ndash MM 2 episodes ndash MM ESS ndash 1 extra
episode Ecoli episode Bacteroides Ecoli and Bacteroides =contam fragilis
12 Additional episodes by ESS classified as contams by chart review 40 2 episodes
CoNS x2 = contam E cloacae x2= infxn
149 1 episode CoNS x2 = contam
485 1 episode CoNS x2 = contam
668 1 episode Rothia Mucilaginosa x1 = contam
710 1 episode CoNS x2 = contam
836 1 episode CoNS x2 = contam
1094 1 episode CoNS x2 = contam
1305 1 episode LAC x1 = contam
1412 1 episode Corynebacterium sp x1 = contam
1841 1 episode CoNS x2=contam
2 episodes
CoNs x2 within 5 days = infxn E cloacae = infxn 1 episode CoNS x2 within 5 days = infxn 1 episode CoNs x2 within 5 days = infxn 1 episode Rothia mucilaginosa x1 = infxn 1 episode CoNS x2 within 5 days = infxn 1 episode CoNS x2 within 5 days = infxn 1 episode CoNS x2 within 5 days = infxn 1 episode LAC x1 = infxn 1 episode Corynebacterium sp x1 = infxn 1 episode CoNS x2 within 5 days=infxn
202
Patient Chart ESS Notes continued 2432 1 episode
CoNS x2 = contam 1 episode CoNS x2 within 5 days = infxn
2474 1 episode CoNS x 2 =contam
1 episode CoNS x2 within 5 days = infxn
203
Table E3 Description of Discrepancies in the Location of Acquisition Between the Medical Record Review and the ESS
Patient Chart ESS Notes Changes made Chart HCA ESS NI (n=9) 81 Special care at home ndash has Culture 53 hours from Culture time vs No change
ileostomycolectomy bag admission date Clinical data (admit 02shy12 culture 02shy14) 0 HC encounters prior
987 Previous hospital admission Culture 328 hrs from Oversight by Changed to NI Has home care to check BP admission date reviewer of culture in STATA file
and admission time not CR Should have been classified as 1 HC encounter = database NI bc episode date is clearly Prior hospitalization gt2 days after admission date Oversight by reviewer
1001 Patient in nursing home Culture 98 hrs from Oversight by Changed to NI admission date reviewer of culture in STATA file
Should have been classified as and admission time not CR NI bc episode date is clearly 3 HC encounters= database gt2 days after admission date prior hospitalization Oversight by reviewer nursingLTC resident
prior ED 1279 Patient in nursing home and Culture 64 hrs from Culture time vs No change
had previous hospital visit admission date Clinical data (27days)
Admission to unit 05shy15 culture 05shy17 (unsure times) 2 HC encounters=
prior hospitalization prior emergency
1610 Prior hospital admission Culture 4 hours prior Oversight by Changed it to to admission date reviewer of culture NI in STATA
Should have been classified as and admission time but not CR NI bc LOS at previous Classified as NI bc database hospital was gt2 days before transferred from acute transfer Pt dx with ETOH care site pancreatitis (not infection) then got dx with Ecoli pancreatic abscess
2276 Prior hospital visit Culture 211 hrs from Oversight by Changed it to chemohemodialysis admission reviewer of culture NI in STATA Should have been classified as and admission time not CR NI as notes clearly show 2 HC encounters = Database culture date gt2 days after prior hospitalization admission (8 days later) TBCC Patient had a failed ERCP
204
cholangial tube at other hospital dc 17 days prior to this admission
Patient Chart ESS Notes Changes made continued 2279 Patient has specialized care at
home (TPN from previous admission) Prior hospital visitchemohemodialysis
Admitted for 1 wk 6 wks prior to this admit had
Culture 7 hrs from admission
0 HC encounters Classified as NI bc transferred from another acute care
True discrepancy No change
colonoscopy went home 1 wk later returned to hospital transferred to PLC Episode of arm cellulitis related to TPN
site
from previous admission and not IBD
2536 Patient visited TBCC for chemotherapy
Culture 290 hrs from admission
Oversight by reviewer of culture and admission time
Changed it in the STATA file but not the CR
Should have been classified as 1 HC encounter = database NI bc episode date is clearly gt2 days after admission date (admit 11shy24 culture 12shy06) Oversight by reviewer
TBCC
ChartCA ESS NI (n=5) 417 On home O2 Lives
independently
Culture 0123 admitted to unit 0122
No clear indication of cancer in chart
946 KBL classified as CA likely it was in bowel prior to admission 0 HC encounters
1953 Homeless 0 HC encounters No indication of previous hospital visit or transfer
Culture 57 hrs from Discrepancy in dates No change admission and classification
Culture 0124 admit True discrepancy 0121
Identified 1 HC encounter = TBCC Culture 84 hrs from True discrepancy No change admission 0 HC encounters
Culture 4 hours prior True discrepancy No change to admission Transferred from another acute care site 0 HC encounters
205
Patient Chart ESS Notes Changes made continued 2050 Hit by car Had a direct ICU
admit
Admit 0331 Culture 0402 2122 Lives with family
Admit 07shy14 Culture 07shy21 No clear indication why classified as CA Should have been NI based on dates
Cultures 55 amp 57 hours from admission
Culture 184 hours from admit 1 HC encounter
True discrepancy No change
0 HC encounters
Oversight by Changed it in reviewer of culture STATA file not and admission time CR database
Chart NI ESS HCA (n=2) 1563 Transferred from other
hospital Unsure of how much time at other site Admit 12shy13 Culture 12shy15
1848 Had cytoscopy day prior for kidney stone (was in hospital for 2 days went home then returned next day and was hospitalized)
Not a prior HC encounter but considered all part of the same admission=NI
Chart CA ESS HCA (n=21) 60 Has home O2 lives at home
with spouse
No indication in chart of other HC encounter
93 From independent living home Meals are prepared but takes own meds
0 HC encounters 256 Lives at home with husband
Uses cane Had bilateral amputation 4 months prior
Culture 44 hours from admission 1 HC encountershyTBCC Identified pt transferred from other site so not sure why didnrsquot classify as NI Cultures 1shy2 hours before admission
2 HC encounters ndash Prior ED and hospitalization
Cultures 9shy11 hrs before admission 1 HC encounter= Nursing home
Culture 4 hours from admission 0 HC encounters but has unknown home care Culture 0 hrs from admission
2 HC encounters =
True discrepancy No Change
True discrepancy No change
True discrepancy No change
True discrepancy No Change
True discrepancy No Change
206
prior hospitalization nursing home
Patient Chart ESS Notes Changes made continued 351 Lives alone
0 HC encounters
640 2 recent hospital admissions for similar symptoms ndash IVDU Hep C poor dentition necrotic wounds to legs
698 Lives with daughter Visited ED with symptoms had cultures drawn sent home called back bc + cultures
712 Lives independently in own home Chart noted CML as coshymorbidity but did not note if patient visited TBCC
725 Lives at home Chart noted Hodgkinrsquos lymphoma 30 yrs prior but not indication of TBCC prior to admission
1207 Lives in Trinity Lodge (not a NH or LTC) No other HC encounter
1221 Lives alone with wife 1st
episode was CA 2nd=HCA 3rd=NI
No HC encounters prior to 1st
episode
Culture 4 hrs before admission 1 HC encounter = Nursing home and unknown home care Cultures 0shy3 hours before admission
1 HC encounter = prior hospitalization Cultures 92 hrs prior to admission and 12 hrs after admission
0 HC encounter but admitted from unknown home care Cultures 5 hrs prior to admission
1 HC encounter= TBCC Cultures 0 hrs from admission 1 HC encounter=TBCC Culture 20 hrs prior to admission
1 HC encounter = NH or LTC and admitted from unknown home care Cultures 5 hrs prior to 1276 hrs from admission (3 episodes)shy 1st=HCA 2nd ndash HCA 3rdshy NI
1 HC encounter=
True discrepancy No change
True discrepancy No change
True discrepancy No change
True discrepancy No change
True discrepancy No change
True discrepancy No change
True discrepancy No change
207
prior hospitalization (for 1st episode)
Patient continued
Chart ESS Notes Changes made
1267 Lives in group home Culture 8 hours prior to admission
Oversight by reviewer in HC
Changed it to HCA in
1 HC encounter = admitted for 2 HC encounters = encounters STATA file not gt2 days in prior 90 daysshy dx with hepatoangiomas Incorrect classification despite evidence in chart
prior ED and prior hospitalization
CR database
1343 Seen by physician more than 30 days prior to episode and had outpt procedure more than 30 days
Culture 1 hr prior to admission
1 HC encounter = admitted from
True discrepancy No change
unknown home care and TBCC
1387 Visited dentist for painissue got Pen had dental work 2shy3 mo prior Lives at home
Culture 6 hrs prior to admission 0 HC encounter = but transferred from
True discrepancy No change
Doesnrsquot meet defrsquon unknown home care 1513 From penitentiary Culture 1 hr prior to
admission True discrepancy No change
0 HC encounters identified 1HC encounter= prior hospitalization and transferred from Drumheller district health services
1716 Presented to hospital 4 months prior with 4 month hx back pain ndash shown to have OM discitis Dc to HPTP now returned with worse back pain Continues to have OM discitis
Culture 6 hrs from admission
1 HC encounter = prior HPTP admitted from unknown home care
True discrepancy No change
1 HC encounter = IV
1786 therapyHPTP Had US 3 wks prior to episode at FMC and work up on liver cirrhosis prior to admission
Culture 0 hrs from admission
Oversight by reviewer
Changed it to HCA in STATA but not
208
No home care on disability 1 HC encounter= CR database Clear indication of HC TBCC encounters= attended hospital within prior 30 days
Patient Chart ESS Notes Changes made continued 1964 Has Ca but not on chemo
radiation and has not gone to TBCC using homeopathic remedies only Was seen by GP shy concerns re UTI and possible urethral fistula (no fu since Dec 2006) Natural practitioner evaluating him through live blood analysis
1969 No HC encounter No indication in chart Had ovarian Ca 2004 that was resected No indication at this admission of active cancer
1972 Lives at Valley Ridge Lodge (not NH or LTC)
Radiation for lung ca 8 months prior Doesnrsquot meet defrsquon
2074 Visited hospital prior for same symptoms as this episode Lives with friend in apt 0 other HC encounters
2584 No indication of visit to TBCC or chemo but noted rectal carcinoma No HC encounters noted
Possible oversight during review but do not change
Chart HCA ESS CA (n=16) Indwelling foley Visited preshyadmission clinic 11shy07 (more than 30 days prior) Lives at home Home care
1 HC encounter
Culture 0 hrs from admit
1 HC encounter= TBCC
Culture 26 hrs from admission
1 HC encounter = TBCC Culture 1 hr from admission
0 HC encounter =admitted from unknown home care Culture 1 hr prior to admission 1 HC encounter = prior ED visit Cultures 3shy7 hrs prior to admission 1 HC encounter = TBCC
Cultures 6 hrs prior to admit
0 HC encounters
True discrepancy No change
True discrepancy No change
True discrepancy No change
True discrepancy No change
True discrepancy No change
True discrepancy No change 19
209
Patient Chart ESS Notes Changes made continued 33 Had ERCP just over 1 month
prior
1 HC encounter = visited a hospital in 30 days prior
85 Living with daughter Attended Day medicine within 30 days prior for abd US and BM aspirate biopsy
92 In nursing home for approx one month attended TBCC until May 2006 Received homecare before placed in nursing home
2 HC encounters 184 Lives with family Had
cytoscopy 1 wk prior to admission
1 HC encounter 269 Nn Transplant list due to liver
failure 4 months prior Admitted nov 29 2006 Following up with physician (admission more than 90 days but considered HCA bc unsure of focus and cannot determine if from the liver which would make it CA likely)
439 Lives at home has home care nurse and was admitted prior
2 HC encounters 561 Indwelling catheter changed
by home care 1xwk 1HC encounter
880 Had prostate biopsy 2 days prior 1 HC encounter
902 10 wks post partumVaginal
Cultures 6 hrs prior to admit
0 HC encounters
Cultures 3 hrs before admit 0 HC encounters
Culture 5 hrs prior to admit 0 HC encounters
Pt transferred to LTCgt
Cultures 3 hrs prior to admit 0 HC encounters
Culture 1 hr prior to admit
0 HC encounter
Culture16 hrs from admission 0 HC encounter
Cultures 11 hrs from admit 0 HC encounter Culture 20 hrs from admit 0 HC encounter Culture 6 hrs from
True discrepancy No change
True discrepancy No change
True discrepancy No change
True discrepancy No change
True discrepancy No change
True discrepancy No change
True discrepancy No change
True discrepancy No change
True discrepancy No change
210
delivery tear Admitted to admit hospital for delivery 0 HC encounter
Patient Chart ESS Notes Changes made continued 955 Had prostate biopsy 3 days
prior developed symptoms 1 HC encounter
1660 Stent removal 10days prior 1 HC encounter
1711 Homeless Dc 20 days prior from PLC with pneumonia but continues to have symptoms Dx with pneumonia
Should have been classified as CA based on info bc admitted to previous hospital with same condition Didnrsquot acquire it at PLC
1919 Lives with sister and care giverPt has dvp delay amp DM 1 HC encounter = home care
2030 Had MRI 1 month prior liver tx recipient 9 months prior
1 HC encounter 2261 Had bronchoscopy 1 wk prior
1 HC encounter
Culture 33 hrs prior to admit
0 HC encounter Culture 0 hrs from admit 0 HC encounter Culture 1 hr prior to admit 0 HC encounter
Culture 5 hrs prior to admit
0 HC encounter Culture 5 hrs prior to admit 0 HC encounter
Culture 1 hr prior to admit
True discrepancy No change
True discrepancy No change
Oversight by Changed it to reviewer CA in STATA
file but not CR database
True discrepancy No change
True discrepancy No change
True discrepancy No change
211
Table E4 Discrepancies in the Focal Body Site for the Concordant Secondary BSIs between the ESS and the Medical Record Review
Patient Chart ESS Notes Chart Pneu ESS 0 (n=2) 1579 Pneu Culture conf Xray conf Pneu positive 2 cultures
LRI positive positive in ESS unclear focus
2050 Pneu Culture conf CT conf Pneu positive 2 cultures LRI positive positive in ESS
unclear focus Chart CVS ESS0 (n=2) 624 Med Surgical wound positive
from sternum (drainage and swab) CT conf mediastinitis
1739 ENDO Xray and ECG conf Urine and wound +
Chart GI ESS 0 (n=2) 1786 IAB Culture conf (sputum amp
peritoneal fluid) Ct confshypancreatitis
2259 IAB Culture conf (urine amp peritoneal fluid) CT confshypancreatitis
SSI positive SST positive Clinical focus==LRT UTI positive SST positive No clinical focus listed
Pneu + GI + No clinical focus listed UTI + GI + (Clinical focus= GI)
2 cultures positive in ESS unclear focus 2 cultures positive in ESS Unclear focus
2 cultures positive in ESS Unclear focus 2 cultures positive in ESS Unclear focus
Chart LRI ESS 0 (n=1) 1662 LUNG Culture conf (pleural (Clinical focus= 2 cultures
fluid) CTshypneu Empyema LRT) Pneu + LRI positive in ESS + Unclear focus
Chart 0 ESS UTI (n=1) 784 2 foci listed Unsure of focus
Wound culture 1 month prior to bld Urine + (2 foci= ASB UTI SKIN) MRI brainshy Lesions parietal lobe rep brain mets CNS lymphoma)
Chart BJ ESS UTI (n=2)
No clinical focus UTI +
217 Bone Culture conf (cutaneous ulcer) pathology conf osteomyelitis
1111 Bone Not culture conf Urine + Notes= osteo
Chart CVS ESS UTI (n=1)
No clinical focus listed UTI +
UTI + (Clinical focus listed=SST)
212
Patient Chart ESS Notes continued 763 ENDO TEE confirmed
Wound urine +
Chart Repr ESS UTI (N=1)
UTI + SST + (clinical notes = ENDO)
2125 OREP Urine +CT conf Had DampC
Chart SSI ESS SST (n=1)
No clinical focus listed UTI +
2528 SSI SKIN Surgical wound drainage + Post CABG CTshystranding assoc with chest wadefect
ChartPneu ESS SST (n=2)
ST ll
No clinical focus SST +
843 Pneu Cath tip dialysis cath tip No clinical focus pleural fluid + CTshy empyema listed SST +
1732 Pneu Pleural fluid + Wound + No clinical focus Empyema listed SST +
Chart BJ ESS SST (n=3) 997 Bone Deep wound swab +
Xrayshyosteomy myositis Autopsyshyfasciitis assoc with OM
1221 Bone Wound + anaerobic culture NM conf osteo
1350 JNT Wound + Dcshy septic arthritis
Chart CNS ESS SST (n=1)
Clinical focus = JNT SST +
Clinical focus = JNT SST + No clinical focus listed SST +
895 IC CNS + maxillary swab + Clinical focus MR conf ndashsinusitis bilateral listed = JNT SST subdural empyemas meningitis +
Chart EENT ESS SST (n=1) 1387 ORAL Mandible abscess +
CTshyosteoy of hemimandible Chart CVS ESSPneu (n=1)
Clinical focus = URT SST +
202 ENDO Sputum + Echo= possible endo treated as endo
Chart SST ESS EENT (n=1)
Clinical focus listed = GI Pneu +
1861 Skin Clinical dx Cellulitis impetigo ear bact cult +
ChartPneu ESS LRI (n=2)
Clinical focus = SST EENT +
1445 Pneu Pleural fluid + xray conf Clinical focus =
213
Empyema LRT LRI + Patient Chart ESS Notes continued 2230 Pneu Pleural fluid + Empyema No clinical focus
listed LRI +