the u.s.–israel innovation index: comparing international ... · ms. cathy campbell president and...
TRANSCRIPT
The U.S.–Israel Innovation Index:Comparing International Linkages In Innovation
Developed by the US–Israel Science and Technology Foundation2013

This Page Intentionally Left Blank

i
Ms. Maria Andrews Commercial Counselor U.S. Embassy, Tel Aviv, Israel
Dr. Ruth Arnon President of the Israel Academy of Sciences and Humanities
Dr. Kathryn Atchison DDS, MPH Vice Provost, New Collaborative Initiatives UCLA
Dr. Dan Breznitz Associate Professor, Scheller College of Business, Georgia Institute of Technology
Dr. Giulio Busulini Science Attaché Embassy of Italy
Ms. Cathy Campbell President and CEO, CRDF Global
Mr. Ohad Cohen Deputy Director General and Director, Foreign Trade Administration, Ministry of Economy, Israel
Dr. Ora Dar Head of the Life Sciences Sector, Office of the Chief Scientist, Ministry of Economy, Israel
Dr. Miriam Erez Founder and Chair of the Knowledge Center for Innovation, Technion Israel
Mr. Stephen Ezell Senior Analyst, Information Technology Innovation Foundation
Dr. Yali Friedman Chief Editor and Publisher, Journal of Commercial Biotechnology; Editor, Scientific American Worldview Scorecard
Mrs. Tamar Guy Former Executive Director, U.S.-Israel Chamber of Commerce
Prof. Yehuda Hayuth Former President, Professor Emeritus University of Haifa
Mr. Jonathan Heimer Former Senior Commercial Officer, U.S. Embassy, Tel Aviv, Israel
Prof. Eugene Kandel Head of The National Economic Council, Prime Minister’s Office
Ms. Anat Katz Head of Commercial Mission, Embassy of Israel, United States
Dr. Alan Leshner CEO, AAAS
Dr. Jonathan Margolis Deputy Assistant Secretary for Science, Space, and Health, U.S. Department of State
Mrs. Limor Nakar-Vincent Director of East Coast and Midwest, BIRD Foundation
Dr. Solveig Roschier Head of Tekes Office, Embassy of Finland in Washington DC
The U.S.–Israel Science and Technology Foundation would like to thank its Advisory Committee for their significant contributions to the U.S.–Israel Innovation Index (USI3). The Advisory
Committee comprised of academic, industry, and policy thought leaders provided crucial feedback and insight throughout the entire process of planning, researching, and producing the Index.
The USI3 Advisory Committee generously dedicated their time and expertise to support the development of the USI3. While they informed the USI3 development process, specific outcomes and conclusions may not reflect the positions of the individual Advisory Committee Members.
U.S.–Israel Innovation Index Advisory Committee

Secti
on 2
ii
The U.S.–Israel Innovation Index: Comparing International Linkages In Innovation
Dr. Yair Rotstein Executive Director, Binational Science Foundation
Ms. Susan Sauer Sloan Director, Government-University-Industry Research Roundtable (GUIRR), The National Academies
Mr. Israel Shamay Executive Director, Head of Americas Operations, MATIMOP Office of the Chief Scientist, Ministry of Economy, Israel
Mr. Saul Singer Co-author of Start-Up Nation: The Story of Israel’s Economic Miracle
Prof. Manuel Trajtenberg Chairman of the Planning and Budgeting Committee, Israel Council for Higher Education
Ms. Debra Van Opstal Executive Director, US Resilience Project
Mr. Dan Vilenski Former President, Chairman, Applied Materials (FP), Israel National Nanotechnology Initiative (Chairman)
Mr. Michael Vorländer Counselor, Science and Technology, Embassy of theFederal Republic of Germany
Dr. Glenn Yago Senior Director/Founder, Financial Innovations Labs®, Milken Institute
Dr. Eitan Yudelivich Executive Director, BIRD Foundation
U.S.–Israel Innovation Index Advisory Committee (Cont’d)

iii
*Appointed to the U.S.–Israel Science and Technology Commission
*
*
About the U.S.–Israel Science and Technology Foundation
The U.S.–Israel Science and Technology Foundation (USISTF) is a Washington, D.C. based nonprofit organization, created by an initiative of the U.S. Department of Commerce and Israel’s Ministry of Industry, Trade and Labor. The mission of the USISTF is to facilitate research and development cooperation between the U.S. and Israel’s industry, government and universities in order to enable science and technology based economic growth for the benefit of both nations. The USISTF achieves its mission through producing research and information, convening scientific workshops and industry events, and helping to facilitate new R&D framework agreements among existing government programs.
USISTFAnn Liebschutz, Executive Director David Miron-Wapner, Israel Director Charlie Swartz, USISTF Program Manager
USISTF Board of DirectorsEric Benhamou Arnold Brenner Steven Friedman Uzia Galil Avi Hasson, Chair Kenneth Rind Denis Simon Zehev Tadmor Yoram Yahav

Secti
on 2
iv
The U.S.–Israel Innovation Index: Comparing International Linkages In Innovation
Developed by the U.S.–Israel Science and Technology FoundationPrepared by Futron Corporation
Copyright © 2013
U.S.–Israel Science and Technology Foundation1300 Pennsylvania Ave., NWSuite 700Washington, DC 20004
Telephone: 202.204.3102 • Fax: 202.289.7322http://www.usistf.org
The U.S.–Israel Innovation Index: Comparing International Linkages In Innovation

1
Table of ContentsExecutive Summary . . . . . . . . . . . . . . . . . . . . . . . . . . . . . . . . . . . . . . . . . . . . .2
1. Introduction and Objectives . . . . . . . . . . . . . . . . . . . . . . . . . . . . . . . . . . . .31.1. Why Benchmark Linkages Between the United States and Israel? . . . 41.2. What Is an Index . . . . . . . . . . . . . . . . . . . . . . . . . . . . . . . . . . . . . 41.3. Index Structure: Choosing Indicators and Countries . . . . . . . . . . . . . 51.4. Methodology . . . . . . . . . . . . . . . . . . . . . . . . . . . . . . . . . . . . . . . 71.5. Summary of Findings . . . . . . . . . . . . . . . . . . . . . . . . . . . . . . . . . . 8
2. Benchmarking the U.S.–Israel Relationship Against Other Nations . . . . . . .112.1. Government Category . . . . . . . . . . . . . . . . . . . . . . . . . . . . . . . . 122.2. Human Capital Category . . . . . . . . . . . . . . . . . . . . . . . . . . . . . . 152.3. Private Sector and Industry Category . . . . . . . . . . . . . . . . . . . . . . 192.4. Research and Development Category . . . . . . . . . . . . . . . . . . . . . 232.5. Future Directions . . . . . . . . . . . . . . . . . . . . . . . . . . . . . . . . . . . . 26
3. Conclusion . . . . . . . . . . . . . . . . . . . . . . . . . . . . . . . . . . . . . . . . . . . . . . .27
ANNEX 1: Israel's Iron Dome Defense Battled to Get Off Ground . . . . . . . . . . .29ANNEX 2: Summary Results by Indicator Category. . . . . . . . . . . . . . . . . . . . .33
List of ExhibitsExhibit 1: Aggregate Index Findings . . . . . . . . . . . . . . . . . . . . . . . . . . . . . . . . . . . 2Exhibit 2: Comparator Countries and Indicator Categories Used in the Index . . . . . . 6Exhibit 3: Methodology Steps. . . . . . . . . . . . . . . . . . . . . . . . . . . . . . . . . . . . . . . . 7Exhibit 4: Summary Results by Indicator Category . . . . . . . . . . . . . . . . . . . . . . . . . 9Exhibit 5: Index Structure . . . . . . . . . . . . . . . . . . . . . . . . . . . . . . . . . . . . . . . . . . 10Exhibit 6: U.S.–Israel Innovation Index Results Compared with Similar Index Products . . 11Exhibit 7: Aggregate Government Category Results . . . . . . . . . . . . . . . . . . . . . . . 12Exhibit 8: Summary Results – Government Category Indicators . . . . . . . . . . . . . . . 13Exhibit 9: Aggregate Government Results . . . . . . . . . . . . . . . . . . . . . . . . . . . . . . 14Exhibit 10: Aggregate Human Capital Category Results . . . . . . . . . . . . . . . . . . . . 15Exhibit 11: Summary Results – Human Capital Indicators Category . . . . . . . . . . . . 16Exhibit 12: Aggregate Human Capital Results . . . . . . . . . . . . . . . . . . . . . . . . . . . 17Exhibit 13: Indicator HC-4, H1-B Entries, in Time Series . . . . . . . . . . . . . . . . . . . . 18Exhibit 14: Aggregate Private Sector and Industry Category Results . . . . . . . . . . . . 19Exhibit 15: Summary Results – Private Sector and Industry Category Indicators . . . . 20Exhibit 16: Aggregate Private Sector and Industry Results . . . . . . . . . . . . . . . . . . . 21Exhibit 17: U.S.–Israel Trade in High-Technology Merchandise (2011) . . . . . . . . . . 22Exhibit 18: Research and Development Category Results. . . . . . . . . . . . . . . . . . . . 23Exhibit 19: Summary Results – Research and Development Indicator Category . . . . 24Exhibit 20: Aggregate Research and Development Results. . . . . . . . . . . . . . . . . . . 25Exhibit 21: Results – Government Category Indicators . . . . . . . . . . . . . . . . . . . . . 33Exhibit 22: Results – Human Capital Category Indicators . . . . . . . . . . . . . . . . . . . 34Exhibit 23: Results – Private Sector and Industry Category Indicators . . . . . . . . . . . 35Exhibit 24: Results – Research and Development Category Indicators . . . . . . . . . . . 36

2
The U.S.–Israel Innovation Index: Comparing International Linkages In Innovation
Exec
utive
Sum
mar
y
Executive Summary
The U.S.–Israel Science and Technology Foundation (USISTF) has developed the U.S.–Israel Innovation Index ("the Index") to assess scientific and technology (S&T) collaboration between the United States (U.S.) and Israel, and to compare and benchmark this relationship to similar collaboration that exists between the U.S. and a select number of comparator countries identified as high technology (hi-tech) innovators. The Index measures innovation-related collaboration by tracking activity that directly or indirectly promotes, or results in, the exchange of ideas, goods, or services that stimulate binational collaboration in technology, science, engineering, and other areas related to innovation. The metrics quantify the intensity of cooperation with the U.S. to
compare the U.S.–Israel relationship with the relationship the U.S. maintains with other innovative nations. The Index, therefore, provides insight into the benefits of U.S.–Israel science and research cooperation, as well as provides a framework to compare and contrast the U.S.–Israel relationship relative to U.S. S&T collaboration with other high technology nations.
The Index indicates that the U.S. and Israel have strong and consistent linkages that cross the four areas assessed in this study: government, human capital, industry, and research and development (R&D). The Index has identified a number of themes that characterize the U.S.–Israel S&T relationship, and broadly tie international collaboration to innovation. These trends include:
Exhibit 1: Aggregate Index Findings
Brazil
Canada
Finland
Germany
Israel
Japan
Russia
Singapore
SwedenSouth Korea
Switzerland
Turkey
20
40
60
80
100
120
140
0
Stre
ngth
of
Rela
tions
hip
�� The U.S.–Israel technology relationship clearly benefits from the unique political relationship between the two countries.
�� Israel is viewed as an R&D destination of choice among many U.S. companies, while many Israeli companies enter the U.S. market to obtain capital and penetrate a large economic market.
�� U.S.–Israel cultural and societal ties cover a large variety of non-scientific and non-technological elements of the relationship, which in turn, may further stimulate innovative interaction between the two countries in the hi-tech arena.
�� The U.S.–Israel relationship is balanced and broad-based, where Israel compares well in most metrics; the U.S. relationship with the comparator countries generally displays wider variation.

3
1. Introduction and Objectives
The U.S.–Israel Innovation Index measures quantitative and qualitative aspects of the U.S.–Israel relationship in innovation-related, knowledge-intensive activities. This study adapts a definition of innovation developed by the Advisory Committee on Measuring Innovation in the 21st Century Economy in its 2008 report to the U.S. Secretary of Commerce. The Index, however, extends the definition used by that Advisory Committee to binational collaboration rather than country-level and firm-level activity. Within the context of the U.S.–Israel Innovation Index, innovation is considered as:
"The design, invention, development and/or implementation of new or altered technology, processes, systems, organization structures, or business models for the purpose of creating new value and economic returns for the country, it’s firms, and/or its citizens.1"
The Index sets out to measure linkages that contribute to innovation: those elements of binational collaboration that contribute to the development of knowledge, scientific, and/or technological advancement for economic or societal development. The publication:
�� Represents an original framework for evaluating binational scientific, technology, and business relationships that cross government, society, academia, and industry.
�� Provides a quantitative analysis that can be tracked year-over-year going forward.
�� Produces an annual report on U.S.–Israel collaboration with respect to S&T, which aims to support and stimulate industry, government, media, and civil society discourse.
�� Includes a Data Annex providing details and source information for all data used in this study.
In essence, the Index measures the intensity of innovation-related linkages between the U.S. and Israel, and statistically compares this relationship to the relationships that the U.S. has with other innovative and high technology nations.
1 Adapted from: The Advisory Committee on Measuring Innovation in the 21st Century Economy. Innovation Measurement: Tracking the State of Innovation in the American Economy. January 2008. http://www.kauffman.org/uploadedFiles/ innovation_measurement_11808.pdf
The first edition of the Index was released in December 2011.
At the time of publication of the 2011 Index, it was intended that subsequent editions of the Index would discuss year-over-year changes in rankings. However, as the result of structural changes made in the 2013 Index (addition of indicators and countries), a year-over-year comparison will not be possible in this year’s publication.
The 2013 Index vs. the 2011 Index

4
The U.S.–Israel Innovation Index: Comparing International Linkages In Innovation
Secti
on 2
In
trodu
ction
and O
bjecti
ves
Secti
on 1
1.1. Why Benchmark Linkages Between the United States and Israel?Leveraging innovation-related international collaboration is one vector toward achieving socioeconomic advancement goals. Israel has an ideas-driven economy where high technology collaboration with the U.S. has generated benefits for both countries. The U.S. is the single most important strategic relationship for Israel, not only in terms of security, but in trade as well. As a much larger economy, the U.S. maintains a number of robust trading relationships with numerous countries around the world. Benchmarking the U.S.–Israel relationship vis-à-vis the relationships the U.S. holds with other nations enables us to better understand how the S&T relationship between the U.S. and Israel measures against the S&T relationships other nations also maintain with the United States. This benchmark also identifies relative strengths and weaknesses exhibited in those relationships, and provide a framework for international comparison, discourse, and additional analysis.
At its core, the U.S–Israel Innovation Index is a benchmarking tool designed to track progress, maintain and enhance linkages between the U.S. and Israel, and provide a statistical foundation to understand the collaborative relationship between government, industry, and the people of the U.S. and Israel. The framework is designed to gather, organize, and standardize S&T data to facilitate analysis and evaluate information. The output of the Index focuses on understanding areas where U.S.–Israel collaboration is strong relative to its peers, and likewise, where this relationship is relatively weak. The statistical output of the model provides underlying insight into U.S.–Israel collaboration, and compares this to relationships the U.S. has with other nations. The statistical findings of the Index, therefore, provide a baseline to assess U.S. S&T collaboration across multiple countries, and over time. In future years, the data which makes up the 2013 U.S.–Israel Innovation Index will be used as a baseline to compare annual changes.
1.2. What Is an IndexThe concept of indexing is often used in economics and finance to develop a common statistical measurement to represent a group of individual data points distilled down to a simplified comparison. This data can include diverse types of information derived from different sources. Commonly recognized indexes include stock indices, e.g., the Dow Jones Industrial Average or the Standard & Poor’s 500; or economic measures such as the Consumer Price Index. There are also a number of indices focused on competitiveness, high technology, R&D, or information communications technology (ICT). A few relevant examples include: The Global Competitiveness Index produced by the World Economic Forum; The Global Innovation Index developed by INSEAD, and the World Intellectual Property Organization (WIPO); and The ICT Development Index calculated by the International Telecommunication Union (ITU). Each of these indexes incorporates disparate datasets to develop a common benchmark to provide insight about the relevant topics.
The 2011 U.S.–Israel Innovation Index showed
that Israel’s innovation-related relationship with the U.S. is consistently strong in most indicators included in the Index, suggesting an expansive S&T collaboration environment.
The 2011 Index Findings Revisited
5
1.3. Index Structure: Choosing Indicators and CountriesThe U.S.–Israel Innovation Index has been developed to assess innovation-related collaboration between the U.S. and Israel, and compare and benchmark that relationship to the collaboration that exists between the U.S and a set of selected comparator countries. The Index measures innovation-related collaboration by tracking metrics measuring activities and relationships in the following categories: Government (GOV), Human Capital (HC), Private Sector and Industry (PSI), and Research and Development (R&D). The Index includes data covering the relationship between 16 countries and the United States. Countries included as comparators in the Index were selected based on criteria for evaluation which emphasized standardized data availability and comparability, (e.g., supporting apples to apples comparison) and qualitative similarities in the nature of the relationship between the country and the United States. The following factors were used in determining the countries to be included.
�� Important trade relationship with the United States.
�� Similar knowledge-intensive industries to Israel.
�� Organisation for Economic Co-operation and Development (OECD) membership or engagement.
�� A desire to include geographic diversity in the Index.
Innovation in Action: Iron Dome
Israel’s Iron Dome rocket-defense system has demonstrated remarkable success in defending Israeli lives from rocket attacks. The development of the system highlights U.S.–Israel ties in technology development and funding linkages which are often especially prevalent in defense-sector projects. While the development of the Iron Dome defense system was led by Israeli scientists and engineers, and the system was manufactured in Israel, U.S. intellectual and financial capital was involved. The project received attention at the highest levels of the Department of Defense and the White House. Department of Defense officials visited Israel during the program’s development to conduct a technical evaluation of the system. During this visit the officials compared the Iron Dome system’s effectiveness to a comparable U.S. system, and found it to be more effective. Between 2010 and 2012, the U.S. has provided $275M in funding to the Iron Dome program. For the U.S, contribution to the program was an element of the overall U.S. efforts to promote security and stability in the region, representing an innovative R&D effort which lead to an effective system for saving lives. The Israeli company responsible for the development of the Iron Dome, Rafael Advanced Defense Systems, has partnered with U.S. firm Raytheon to market the system to the U.S. defense sector, a partnership that may result in additional lives saved.
An article describing in more detail the U.S.–Israel collaborative linkages demonstrated in the Iron Dome system is included following the conclusion of the Index.
Sources: 1) Charles Levinson and Adam Entous, "Israel's Iron Dome Defense Battled to Get Off Ground," The Wall Street Journal, November 26, 2012 2) Marc Selinger, "The Road to Iron Dome," Aerospace America, April 2013.

6
The U.S.–Israel Innovation Index: Comparing International Linkages In Innovation
Secti
on 2
In
trodu
ction
and O
bjecti
ves
Secti
on 1
Not all of the selected countries exhibit all of the selection factors.
As mentioned, the metrics (sometimes also referred to as indicators) used to compose the Index were organized into four categories, with five indicators in each category, for a total of 20 indicators used in the Index. Factors governing the selection of indicators included:
�� Metrics should be available in time series to support repeated annual evaluation.
�� Metrics should, to the extent practicable, be quantitative in order to reduce the possibility of bias (qualitative metrics are more open to debate and interpretation).
�� Data and sources should be transparent and publically available and/or replicable; where possible, open source information was used.
Most metrics used in the Index primarily measure linkages or collaboration between countries, but selected indicators also assess baseline S&T-related resources within a given country. Exhibit 1, below, provides an overview of the countries and indicator categories used in the Index.
Overall, the indicators used in this study aim to measure bilateral linkages; however, each category includes a single indicator which does not measure linkages. Instead, these four indicators measure resources or assets in place within an individual country. These inward-focused indicators are intended to measure the baseline resources base from which the comparator countries built collaboration. A complete list of indicators used in the Index is found in Exhibit 5 at the conclusion of this section.
Exhibit 2: Comparator Countries and Indicator Categories Used in the Index
Comparator Countries Indicator Categories
• Brazil
• Canada
• Chile
• Finland
• Germany
• Hong Kong
• Israel
• Japan
• Russia
Government
Indicators measure and analyze the extent of government-to-government treaties, funding, and diplomatic linkages related to S&T activity.
Private Sector and Industry
Indicators measure knowledge-intensive industry commercialization, and coordination, including investment patterns and trade relationships.
Human Capital
Indicators assess the degree of linkages in human capital in S&T-related fields, including educational exchanges, and academic literature co-authorship.
Research and Development
Indicators quantify both input activities such as R&D spending, and output metrics such as patents granted.
• Singapore
• South Africa
• South Korea
• Sweden
• Switzerland
• Turkey
• United Arab Emirates
Four new indicators added, one in each category,
for a total of 20 metrics.
Seven new comparator countries added, for a total of 16 nations. New additions include:
Additions to the 2013 Index
• Brazil• Canada• Hong Kong• Japan
• Russia• South Africa• Turkey

7
1.4. Methodology
1.4.1. Methodology Overview
The U.S–Israel Innovation Index collects information on specific metrics, which individually provide insight into aspects of the collaborative relationship. The framework uses metrics which are normalized to ensure an appropriate comparison among nations that have vastly different sizes, populations, and economic output. Metrics are aggregated into categories to provide a larger viewpoint; the categories are then combined into an overall score. Metrics and categories are not weighted in the Index; in other words no one indicator is assigned an initial value greater than any other, and scores are derived directly from the underlying data. In order to create an index, the various data points need be consistent and reflect a common standard, or base value, to facilitate comparisons. For simplicity, the 2013 Index established the baseline value at 100 which permits all other information to be expressed relative to this number. Exhibit 3, below, outlines the steps taken to create the Index.
1.4.2. Methodology Steps
Step 1: Collect Raw Data
The first step in the methodology is the collection of raw data for each indicator. The raw data is collected for each country, in time series where available, and tabulated in a table format. The Data Annex contains information about the metrics’ source, units, and notes about the collection process.
Step 2: Normalize Data by Size of Economy or Population
The next step is the normalization of data. In order to compare data across the peer group, the raw data must be normalized in order to make realistic comparisons. For example, Germany has a significantly larger population and economy than Israel, so a direct statistical comparison of indicators doesn’t account for the countries’ relative differences. Not every indicator dataset is normalized (e.g., number of relevant treaties), and some data is normalized at its source so additional adjustment is not required. As a general rule, data is normalized by one of several factors: population, e.g., per capita; size of the economy using Gross Domestic Product (GDP) adjusted for Purchasing Power Parity (PPP) in U.S. dollars (US$); or, percent of overall investment, e.g., percentage of government expenditure.
Exhibit 3: Methodology Steps
Benchmark Against the
U.S.–Israel Position
Normalize Data by GDP or Population
Collect Raw Data

8
The U.S.–Israel Innovation Index: Comparing International Linkages In Innovation
Secti
on 2
In
trodu
ction
and O
bjecti
ves
Secti
on 1
Step 3: Benchmark against the U.S.–Israel Position
The final step in the methodology is to benchmark data against the U.S.–Israel position in order to create the Index rankings. Benchmarking, or comparison to a standard reference point, allows for direct comparison of data across the peer group. The Index uses the U.S.–Israel data as the standard reference point. For the one metric in each category that does not measure relationships, data for Israel is used as the reference point. Therefore, for each indicator the normalized data uses the U.S.–Israel (or only Israel) value as a common denominator for each metric across the entire dataset. In the 2013 Index, as the initial year with an expanded dataset, Israel is baselined at 100 points, meaning Israel always receives 5 points per metric. In other words, there are 20 indicators in the Index and 100 points assigned to the U.S.–Israel relationship (100/20=5, or 25 points per category). In each individual metric, the comparator countries will be above or below 5 based on their relative position vis-à-vis the U.S.–Israel data. Thus, the scores of other countries represent a relative comparison to the U.S.–Israel relationship. Indicators are not compared directly to other indicators, and no weighting is used in the Index. It is important to note that there is no maximum score, either in the Index in its entirety or in individual indicators.
1.4.3. Interpreting The Results
As mentioned, the U.S.–Israel score is set to 100; all other relationships are benchmarked against (compared to) this position. The 2013 U.S.–Israel represents the "baseline value" for the Index. A hypothetical example may prove illustrative. If a country receives a total Index value of 110 (compared to the baseline value of 100), this represents a 10% difference above the U.S.–Israel relationship. In general terms, this suggests that this country has a stronger S&T relationship with the U.S. than Israel, and provides a factor by which one can understand the level of difference. Likewise, if a country scores an aggregate value below 100, the data suggests that the country’s relationship, again only relevant to S&T collaboration, is less intense than that of Israel. Similar interpretations could be made for individual metric and/or categories as well.
1.5. Summary of FindingsThe U.S.–Israel Innovation Index shows that Israel’s innovation-related relationship with the U.S. is consistently strong in most indicators included in the Index. Tracking these results over time will show whether that strength is maintained. The strength of the U.S.–Israel relationship is comparatively strong in government and private sector indicators, and comparatively weak among human capital metrics. Exhibit 4, on page 9, provides the Index results for each of the four categories assessed, followed by key take-aways for the U.S.–Israel relationship in each of the categories.

9
�� Government: the U.S.–Israel relationship is the strongest among countries included in the Index.
�� Human Capital: the relative strength of the U.S.–Israel relationship is a mid-range performer, trailing Canada, Switzerland, Finland and Sweden.
�� Private Sector and Industry: the relative strength of the U.S.–Israel relationship trails only that of the U.S. and Switzerland.
�� Research and Development: the relative strength of the U.S.–Israel relationship is in the top tier, but follows the U.S. relationships with Switzerland and Singapore.
While the aggregate Index results reveal key themes, analyzing the underlying data in each category provides insight into developments and issues within specific areas of collaboration. The following exhibit summarizes the details of each metric providing a description and source to provide background for the subsequent analysis that evaluates the data category by category.
Aggregate Private Sector Metrics
Aggregate Human Capital MetricsAggregate Government Metrics
Aggregate R&D Metrics
4.858.309.909.9411.2113.1313.33
16.8317.57
19.9020.11
25.00
0 10 20 30 40 50
RussiaTurkey
FinlandBrazil
SwedenSingapore
SwitzerlandGermanyCanada
JapanSouth Korea
Israel
3.673.674.09
8.659.6410.32
13.4713.68
15.8823.8525.00
34.87
0 10 20 30 40 50
BrazilRussiaTurkey
South KoreaFinlandJapan
SwedenGermanyCanada
SingaporeIsrael
Switzerland
1.853.01
7.758.36
20.6920.86
23.4225.0026.23
32.4946.79
50.23
0 10 20 30 40 50
BrazilRussiaTurkeyJapan
SingaporeSouth Korea
GermanyIsrael
SwedenFinland
SwitzerlandCanada
2.077.23
14.4015.1516.82
20.4120.8122.3422.65
25.0027.93
36.06
0 10 20 30 40 50
RussiaTurkeyBrazil
FinlandCanada
GermanySweden
JapanSouth Korea
IsraelSingapore
Switzerland
Exhibit 4: Summary Results by Indicator Category
Benchmarking U.S.–Israel Hi-tech Collaboration

10
The U.S.–Israel Innovation Index: Comparing International Linkages In Innovation
Secti
on 2
In
trodu
ction
and O
bjecti
ves
Secti
on 1
Shaded indicators measure baseline resources present in the country.
The Data Annex (a separate document) provides a listing and description of sources used to compile the data used in the Index.
Exhibit 5: Index Structure
Code Metric Target Measurement SourceGOV-1 Government Budget Appropriations on R&D
(GBAORD) Compares government investment in R&D, indicative of policy support for S&T
OECD
GOV-2 Inventory of Bilateral Treaties with S&T Focus Quantifies the number of international agreements in effect in technology-related areas
DoS
GOV-3 Foreign Operations Account Spending by U.S. Department of State (DoS)
Measures U.S. government funds flowing to target countries DoS
GOV-4 Existence of Bilateral S&T Commissions or Similar Organizations
Identifies whether a bilateral S&T commissions, or similar organization, exists between target countries
U.S. Internal Revenue Service (IRS), et al.
GOV-5 Inventory of Trade and Investment Agreements with S&T Chapters
Quantifies the number of active bilateral Trade and Investment Framework Agreements (TIFAs) and Free Trade Agreements (FTAs) with technology-related chapters
USTR
HC-1 Higher Education Expenditure on R&D (HERD) Compares education sector expenditures on R&D OECDHC-2 Article Co-Authorship Counts article co-authorship between the U.S. and comparator
countries in S&E fieldsU.S. National Science Foundation (NSF)
HC-3 U.S. Doctorates Awarded to Foreign Students in the Science and Engineering (S&E) Fields
Measures academic exchange between target countries NSF
HC-4 Entries under U.S. H1-B Temporary Work Visas
Counts country of citizenship of visa recipients U.S. Department of Homeland Security (DHS)
HC-5 Participation in Distributed Computing Projects
Measures public participation in distributed computing projects by country for U.S. hosted projects, and U.S.-based participation in projects hosted by comparator country
boincstats.com
PSI-1 Industry Financed Gross Domestic Expenditure on R&D (I-GERD)
Compares industry investment in R&D, indicative of private sector activity
OECD
PSI-2 U.S. Exports and Imports in Knowledge-Intensive Industries
Tracks magnitude of trade relationship with U.S. (both imports and exports) in key knowledge-intensive industries by four digit NAICS codes
U.S. Department of Commerce (DoC)
PSI-3 Hi-tech Activity of Multinational Corporations (MNCs) and Minority-Owned Foreign Affiliates (MOFAs)
Measures services supplied to foreign persons by U.S. MNCs through MOFAs, and vice versa
DoC
PSI-4 Number of Knowledge-Intensive Industry Companies Cross-listed on National Stock Exchanges
1) Measures foreign knowledge-intensive companies listed on U.S. exchanges, and2) Measures U.S. knowledge-intensive companies listed on foreign exchanges
Various Open
PSI-5 Foreign Direct Investment (FDI) In Selected North American Industrial Classification System (NAICS) Codes
1) Measures U.S. FDI abroad 2) Measures FDI into the United States
DoC
R&D-1 Gross Domestic Expenditure on R&D (GERD) as a Percent of GDP
Compares actual expenditures on R&D activities, by broad sector of activity
OECD
R&D-2 R&D Expenditure of MOFAs Measures R&D investment by country from which bilateral R&D investment is originating
DoC
R&D-3 U.S. Patent and Trademark Office (USPTO) Co-Patent Applications
Measures collaborative patent applications (i.e. applications from multinational teams including target country) to the USPTO
USPTO
R&D-4 Global Patent Applications, and USPTO Patents Granted
Quantifies patent activity by country of first listed inventor WIPO USPTO
R&D-5 U.S. Trade Representative (USTR) 301 Watch List Report
Compares countries based on U.S. ranking of national intellectual property (IP) protection
USTR

11
2. Benchmarking the U.S.–Israel Relationship Against Other Nations
The U.S.–Israel Innovation Index provides a statistical foundation to understand the collaborative relationship among government, people, and industry in the hi-tech fields of science, technology, engineering, et al. The Index focuses on understanding U.S.–Israel collaboration in innovation-related activity, and compares this to relationships the U.S. has with other nations. The scores presented characterize the relationship between the included countries and the United States. The data is indexed to the U.S.–Israel score. By definition, the U.S.–Israel score is set at 5 basis points per indicator, or 100 points total across the Index. In understanding the results of the Index, it is important to note that 100 basis points is not the maximum score on the Index. For individual indicators, relationships that are more concentrated than the U.S.–Israel relationship will score higher than 5 for a specific metric, and hence, can obtain an aggregate score above 100.
Exhibit 6, below, compares the 2013 Index with the top-level results of two other indexing projects which measure innovative activities on a national basis. Although these other two indices do not measure linkages between countries, it is expected that top performers in the U.S.–Israel Innovation Index would also perform well in these other comparisons. Indeed, Exhibit 6 shows that the top (and bottom) performers in the Index, generally place in similar ranking ranges in the other two comparator indices.
Exhibit 6: U.S.–Israel Innovation Index Results Compared with Similar Index Products
2013 U.S.–Israel Innovation Index Other Indices
Points Rank
Global Innovation Index 2012 Rank(out of 141)
Global Competitiveness Index 2012-2013 Rank
(out of 144)
131.05 1 1 1
100.50 2 12 14
100.00 3 17 26
85.60 4 3 2
74.34 5 15 6
72.27 6 2 4
71.71 7 21 19
67.19 8 4 3
60.92 9 25 10
29.86 10 58 48
27.37 11 74 43
13.60 12 51 6713.60
27.37
29.86
60.92
67.19
71.71
72.27
74.34
85.60
100.00
100.50
131.05
Russia
Turkey
Brazil
Japan
Finland
Sweden
South Korea
Germany
Singapore
Israel
Canada
Switzerland
2012 U.S.–Israel Innovation Index Results

12
The U.S.–Israel Innovation Index: Comparing International Linkages In Innovation
Secti
on 2
Be
nchm
arkin
g the
U.S.
– Is
rael
Rela
tions
hip A
gains
t Oth
er N
ation
sSe
ction
2
2.1. Government Category
Metrics in the Government category measure and analyze the impact of legislation, regulation, and diplomacy on the extent of innovation-related collaboration between the U.S. and the target countries. Exhibit 7, below, presents summary results for the Government section of the Index, showing the full range of assessed scores.
The U.S.–Israel relationship leads in government metrics compared to other countries. The assessed intensity of the U.S.–Israel relationship is approximately 25% stronger than that of the nearest peer, South Korea, and more than five times stronger than that between the U.S. and the lowest-ranking country in this category, Russia.
Israel’s strength in this category reflects the traditional special relationship between the governments of the U.S. and Israel, where Israel leads three of the five individual indicators which make up this category.
Exhibit 7: Aggregate Government Category Results
Russia
Turkey
0
5
10
15
20
25
30
Israel
South KoreaJapan
CanadaGermany
SwitzerlandSingapore
SwedenFinlandBrazil
Stre
ngth
of
Rela
tions
hip
Results as Compared to the 2011 Index
�� Israel leads the category in the 2013 Index, as it did in the 2011 Index.
�� New comparator countries fall into two groups in the 2013 Index:
– Japan and Canada exhibit strong relationships with the U.S., as would be expected based on historical alliances.
– By contrast, Brazil, Turkey and Russia fall into the bottom three scores, showing the least concentrated S&T relations of the compared countries.

13
Exhibit 8: Summary Results – Government Category Indicators
Raw Data
GOV-1 GOV-2 GOV-3 GOV-4 GOV-5
GBAORD(US$M, PPP)
S&T Treaties (2011)
U.S. Foreign Spending Accounts(FY2011 Actuals)
Bilateral S&T Organizations
(2011)
S&T Trade and Investment
Agreements (2011)Brazil $13,700.90 (2010) 14 treaties $25,099,000 0 0 Agreements
Canada $6,422.00 (2010) 26 treaties $0 0 1 AgreementChile -- 13 treaties $1,950,000 0 1 Agreement
Finland $2,091.25 (2012) 4 treaties $0 0 0 AgreementsGermany $29,365.73 (2011) 23 treaties $0 1 0 Agreements
Hong Kong $597.00 (2010) 1 treaty $0 0 0 AgreementsIsrael $1,300.08 (2010) 14 treaties $2,775,000,000 5 1 AgreementJapan $35,228.29 (2012) 37 treaties $0 0 0 AgreementsRussia $16,276.89 (2011) 1 treaty $71,595,000 0 0 Agreements
Singapore $2,500.00 (2010) 4 treaties $500,000,000 0 1 AgreementSouth Africa -- 8 treaties $577,560,000 0 1 AgreementSouth Korea $15,855.56 (2011) 15 treaties $0 1 1 Agreement
Sweden $3,250.54 (2011) 12 treaties $0 0 0 AgreementsSwitzerland $3,059.27 (2010) 5 treaties $0 0 1 Agreement
Turkey $1,060.68 (2010) 7 treaties $7,995,000 0 1 AgreementUnited Arab Emirates -- 4 treaties $240,000 0 1 Agreement
Benchmarked Data
GOV-1
Normalization Factor: GDP Raw Data Used Population
South Korea
Japan
Israel Israel Israel
Hong KongHong Kong,Russia Many Many Many
Israel Israel
-1
10
3
5
7
9
11
13
15GOV-2 GOV-3GOV-3 GOV-4 GOV-5
Leading Lagging Israel
Raw Data Used Raw Data Used
Stre
ngth
of
Rela
tions
hip
14
The U.S.–Israel Innovation Index: Comparing International Linkages In Innovation
Secti
on 2
Be
nchm
arkin
g the
U.S.
– Is
rael
Rela
tions
hip A
gains
t Oth
er N
ation
sSe
ction
2
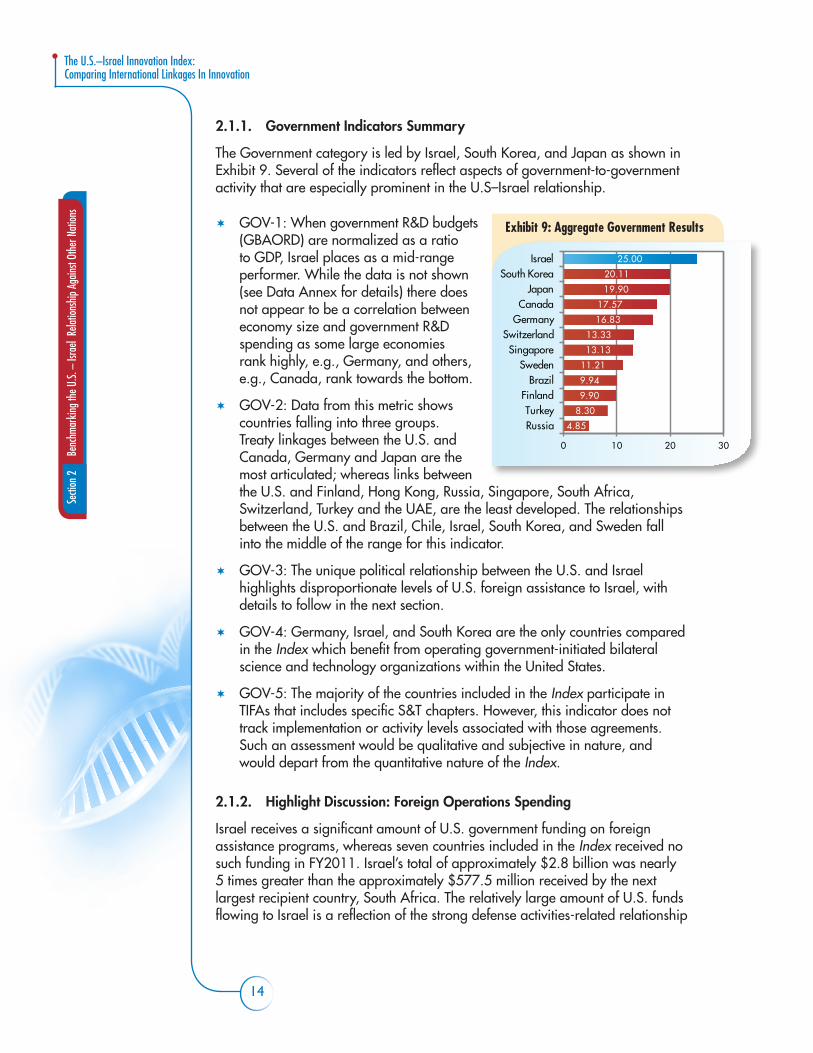
2.1.1. Government Indicators Summary
The Government category is led by Israel, South Korea, and Japan as shown in Exhibit 9. Several of the indicators reflect aspects of government-to-government activity that are especially prominent in the U.S–Israel relationship.
�� GOV-1: When government R&D budgets (GBAORD) are normalized as a ratio to GDP, Israel places as a mid-range performer. While the data is not shown (see Data Annex for details) there does not appear to be a correlation between economy size and government R&D spending as some large economies rank highly, e.g., Germany, and others, e.g., Canada, rank towards the bottom.
�� GOV-2: Data from this metric shows countries falling into three groups. Treaty linkages between the U.S. and Canada, Germany and Japan are the most articulated; whereas links between the U.S. and Finland, Hong Kong, Russia, Singapore, South Africa, Switzerland, Turkey and the UAE, are the least developed. The relationships between the U.S. and Brazil, Chile, Israel, South Korea, and Sweden fall into the middle of the range for this indicator.
�� GOV-3: The unique political relationship between the U.S. and Israel highlights disproportionate levels of U.S. foreign assistance to Israel, with details to follow in the next section.
�� GOV-4: Germany, Israel, and South Korea are the only countries compared in the Index which benefit from operating government-initiated bilateral science and technology organizations within the United States.
�� GOV-5: The majority of the countries included in the Index participate in TIFAs that includes specific S&T chapters. However, this indicator does not track implementation or activity levels associated with those agreements. Such an assessment would be qualitative and subjective in nature, and would depart from the quantitative nature of the Index.
2.1.2. Highlight Discussion: Foreign Operations Spending
Israel receives a significant amount of U.S. government funding on foreign assistance programs, whereas seven countries included in the Index received no such funding in FY2011. Israel’s total of approximately $2.8 billion was nearly 5 times greater than the approximately $577.5 million received by the next largest recipient country, South Africa. The relatively large amount of U.S. funds flowing to Israel is a reflection of the strong defense activities-related relationship
8.30
9.90
9.94
11.21
13.13
13.33
16.83
17.57
19.90
20.11
25.00
0 10 20 30
RussiaTurkey
FinlandBrazil
SwedenSingapore
SwitzerlandGermanyCanada
JapanSouth Korea
Israel
4.85
Exhibit 9: Aggregate Government Results

15
between the two countries. The State Department argues that the funding for programs in Israel represents sustained commitment to a key U.S. partner for peace in the region. While defense obligations represent a significant component of the overall relationship between the U.S. and Israel, R&D support and other innovative activities are imbedded within the defense linkage.
2.2. Human Capital CategoryMetrics in the Human Capital category quantify the extent and significance of human resources-related linkages between the U.S. and comparator countries in S&T-related fields. Exhibit 10, below, presents summary results for the Human Capital section of the Index, showing the full range of assessed scores.
The U.S.–Israel human capital relationship falls within a mid-tier group of countries. Canada and Switzerland’s leadership position is associated with particularly strong links, albeit different, to one indicator. The U.S.–Canada relationship is heavily impacted by HC-4, the number of H1-B visas, which in turn, is linked to the immigration policies between the two countries. The U.S.–Switzerland relationship is significantly and positively impacted by binational activity related to physics and pharmaceuticals activities tied to co-authorship and distributed computer projects.
Results as Compared to the 2011 Index
�� Canada, a new addition to the 2013 Index, holds the leadership position, showing strong human capital links to the United States.
�� Strong positioning in the new human capital indicator, HC-5, by Switzerland, Finland and Germany has reordered the placement of these countries vis-à-vis Israel, with these countries now showing more intense relationships with the U.S. than Israel.
�� Israel does not hold the leadership position as it did in the 2011 version of the Index.
Exhibit 10: Aggregate Human Capital Category Results
BrazilRussia
TurkeyJapan
SingaporeSouth KoreaGermany
Canada
0
5
10
15
20
25
30
35
40
45
50
55
Switzerland
Finland
SwedenIsrael
Stre
ngth
of
Rela
tions
hip

16
The U.S.–Israel Innovation Index: Comparing International Linkages In Innovation
Secti
on 2
Be
nchm
arkin
g the
U.S.
– Is
rael
Rela
tions
hip A
gains
t Oth
er N
ation
sSe
ction
2
Exhibit 11: Summary Results – Human Capital Indicators Category
Raw Data
HC-1 HC-2 HC-3 HC-4 HC-5
HERD as % GDP S&E Co-authorship U.S. S&E Doctorates H1-B Visas
Distributed Computing Participants
Brazil 0.02% (2010) 2,235 (2010) 131 (2010) 7,852 (FY2011) 30,200Canada 0.65% (2010) 129 (2010) 339 (2010) 88,236 (FY2011) 94,363
Chile -- 761 (2010) 44 (2010) 2331 (FY2011) 5,827Finland 0.79% (2010) 1,183 (2010) 7 (2010) 599 (FY2011) 24,892
Germany 0.51% (2010) 10,615 (2010) 156 (2010) 8,344 (FY2011) 275,364Hong Kong 0.40% (2010) -- -- -- 5,574
Israel 0.58% (2010) 2,259 (2010) 67 (2010) 3,599 (FY2011) 8,707Japan 0.42% (2010) 5,587 (2010) 172 (2010) 11,503 (FY2011) 67,271Russia 0.10% (2010) 1,840 (2010) 108 (2010) 2,490 (FY2011) 42,901
Singapore 0.60% (2010) 1,062 (2010) 53 (2010) 1,993 (FY2011) 2,967South Africa 0.18% (2008) 35 (2010) 15 (2010) 1,429 (FY2011) 6,725South Korea 0.40% (2010) 4,342 (2010) 1,077 (2010) 11,728 (FY2011) 10,647
Sweden 0.90% (2010) 2,624 (2010) 16 (2010) 1,795 (FY2011) 23,501Switzerland 0.80% (2010) 3,509 (2010) 18 (2009) 1,470 (FY2011) 52,281
Turkey 0.39% (2010) 901 (2010) 404 (2010) 4,739 (FY2011) 7,029United Arab Emirates -- -- 5 (2010) 7 (FY2011) 851
Benchmarked Data
Sweden Switzerland
South Korea
CanadaSwitzerland
Brazil South Africa South Africa UAE Turkey
Israel Israel Israel Israel Israel
0
5
10
15
20
25
30 HC-1 HC-2 HC-4 HC-5HC-3
Leading Lagging Israel
Normalization Factor:
Raw Data is % GDP
Population Population Population Population
Stre
ngth
of
Rela
tions
hip

17
2.2.1. Human Capital Indicators Summary
The Human Capital category is led by Canada and Switzerland; with a secondary group of Finland, Sweden, Israel, Germany, South Korea, and Singapore trailing the leaders as shown in Exhibit 12. Details for each indicator are illustrated in Exhibit 11.
�� HC-1: When data on higher education R&D (HERD) – a baseline resources indicator – is normalized and expressed as a ratio to GDP, all countries in the Index are grouped somewhat closely. Israel places in the middle of the range.
�� HC-2: Per capita tallies of co-authored scientific journal articles between the U.S. and the target countries are also closely grouped, with the U.S.– Israel relationship in the upper half of the range.
�� HC-3: The U.S. and South Korea have a strong relationship in academic exchange in S&E fields. The South Korea–U.S. relationship leads the benchmarked results for U.S. doctoral degrees awarded to students from the target countries, on a per capita basis. The U.S–Israel relationship places fourth in this indicator, closely grouped with Canada and Singapore.
�� HC-4: Benchmarked results for H1-B entries into the U.S., on a per capita basis, are closely grouped for all countries included in the Index, with the exception of Canada, which holds a strong leadership position in this indicator. Israel holds the second position in this indicator; however, flows of H1-B holders from Israel to the U.S. are comparatively closer to the lagging country in this category – South Africa – than they are to flows from Canada to the United States. Canada’s dominant position in this indicator is likely linked to the strong trade and policy links between the U.S and Canada as a as result of the North American Free Trade Agreement (NAFTA).
�� HC-5: When participation in distributed computing projects – measuring the number of U.S.-based participants in projects hosted in the target countries combined with participants from the target countries taking part in U.S.-hosted projects – is compared on a per capita basis, Switzerland emerges as a clear leader. This position is based on strong Swiss participation in projects associated with biomedical and particle physics research. Israel falls in the mid-range of participation in this indicator. Participation in distributed computing projects represents an indirect indicator of general public interest levels in large-scale scientific research.
3.01
7.75
8.36
20.69
20.86
23.42
25.00
26.23
32.49
46.79
50.23
0 10 20 30 40 50
BrazilRussiaTurkeyJapan
SingaporeSouth Korea
GermanyIsrael
SwedenFinland
SwitzerlandCanada
1.85
Exhibit 12: Aggregate Human Capital Results

18
The U.S.–Israel Innovation Index: Comparing International Linkages In Innovation
Secti
on 2
Be
nchm
arkin
g the
U.S.
– Is
rael
Rela
tions
hip A
gains
t Oth
er N
ation
sSe
ction
2
2.2.2. Highlight Discussion: H1-B Entries
The U.S. H1-B visa allows temporary entry into the U.S., on a non-immigrant basis, for employment in specialty occupations. A "specialty occupation" is defined as one requiring theoretical and practical application of a body of highly specialized knowledge in a field of human endeavor.2 Example fields covered under H1-B visas include: architecture, engineering, mathematics, physical sciences, social sciences, biotechnology, and medicine. Tracking entries under H1-B visas provides an indicator to track flows of highly-skilled workforce into the U.S. from comparator countries. Canada is a clear outlier in this dataset. Of the remaining countries included in the Index, South Korea, Germany, and Israel are the countries from which the largest number of H1-B entries into the U.S. originate.
Exhibit 13, below, plots the number of H1-B entries into the U.S. from Index countries over the most recent four years. Overall, entries under H1-B visas have declined – for all included countries except South Korea and Canada – over the last five years for which data is available. In the most recent years, the decline shows signs of stabilizing. When expressed as a percent share of total H1-B entries, declines in entries are slight for most countries, except Germany, which shows a sharp decline; South Korea, which shows an increase, and Canada which shows a sharp increase since 2009. Canada’s activity under the H1-B program shows a large uptick in both percent and overall totals since 2009,
2 United States Code, Title 12, § 1184. Admission of Nonimmigrants
As Percent of Total H1-B EntriesEntries to the U.S. Under H1-B Visas
0
10000
20000
30000
40000
50000
60000
70000
80000
90000
FiscalYear2007
FiscalYear2008
FiscalYear2009
FiscalYear2010
FiscalYear2011
0%
2%
4%
6%
8%
10%
12%
14%
16%
18%
FiscalYear2007
FiscalYear2008
FiscalYear2009
FiscalYear2010
FiscalYear2011
ChileFinlandGermanyIsraelSingaporeSouth KoreaSwedenSwitzerlandUnited Arab EmiratesBrazilCanadaJapanRussiaSouth AfricaTurkey
Exhibit 13: Indicator HC-4, H1-B Entries, in Time Series
19
and demonstrates an overall level of activity in this indicator that is dramatically higher than any of the other countries included in the Index.
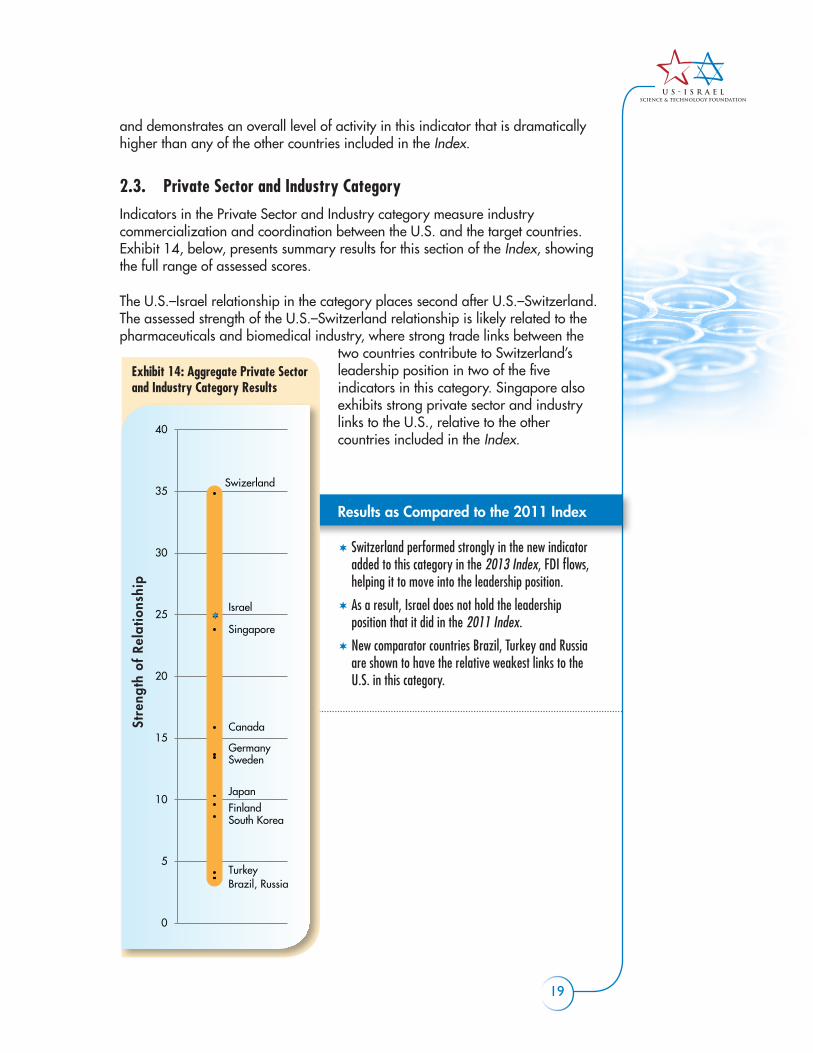
2.3. Private Sector and Industry CategoryIndicators in the Private Sector and Industry category measure industry commercialization and coordination between the U.S. and the target countries. Exhibit 14, below, presents summary results for this section of the Index, showing the full range of assessed scores.
The U.S.–Israel relationship in the category places second after U.S.–Switzerland. The assessed strength of the U.S.–Switzerland relationship is likely related to the pharmaceuticals and biomedical industry, where strong trade links between the
two countries contribute to Switzerland’s leadership position in two of the five indicators in this category. Singapore also exhibits strong private sector and industry links to the U.S., relative to the other countries included in the Index.
Results as Compared to the 2011 Index
�� Switzerland performed strongly in the new indicator added to this category in the 2013 Index, FDI flows, helping it to move into the leadership position.
�� As a result, Israel does not hold the leadership position that it did in the 2011 Index.
�� New comparator countries Brazil, Turkey and Russia are shown to have the relative weakest links to the U.S. in this category.
Exhibit 14: Aggregate Private Sector and Industry Category Results
Brazil, RussiaTurkey
South KoreaFinlandJapan
SwedenGermany
Canada
Singapore
Israel
Swizerland
0
5
10
15
20
25
30
35
40
Stre
ngth
of
Rela
tions
hip

20
The U.S.–Israel Innovation Index: Comparing International Linkages In Innovation
Secti
on 2
Be
nchm
arkin
g the
U.S.
– Is
rael
Rela
tions
hip A
gains
t Oth
er N
ation
sSe
ction
2
Exhibit 15: Summary Results – Private Sector and Industry Category Indicators
Raw Data
PSI-1 PSI-2 PSI-3 PSI-4 PSI-5
I-GERD as % GDPHi-tech US imports/export
(2011, million US$)
Hi-tech U.S. MNC and MOFA trade balance (2010, million US$)
Cross Listed Stocks
Hi-tech FDI (2011, US$M)
Imports Exports Imports ExportsBrazil 0.55% (2010) $1,825.74 $14,637.58 $463.0 $602.0 22 $16,634.00
Canada 0.82% (2011) $14,813.13 $25,387.91 $2,790.0 $4,463.0 46 $52,162.00Chile 0.17% (2008) $21.26 $2,799.29 $70.0 $79.0 0 $1,540.50
Finland 2.56% (2010) $1,284.31 $915.37 -- -- 2 $271.00Germany 1.87% (2009) $27,184.29 $19,688.33 $1,689.0 $3,330.0 385 $63,594.00
Hong Kong 0.33% (2010) $986.22 $12,974.54 266.0 $150.0 2 $5,347.50Israel 2.46% (2008) $9,126.81 $3,126.42 $226.0 $1,108.0 33 $6,338.00Japan 2.47% (2010) $30,668.41 $21,680.34 $3,640.0 $1,989.0 6 $81,367.00Russia 0.30% (2010) $288.40 $1,943.33 -- -- 0 $818.00
Singapore 1.11% (2010) $10,452.16 $12,146.00 $1,362.0 $455.0 4 $19,012.57South Africa -- $135.87 $1,231.08 $219.0 $118.0 0 $2,022.00South Korea 2.68% (2010) $19,544.03 $11,781.09 $667.0 $204.0 1 $7,709.00
Sweden 2.12% (2009) $3,260.09 $2,440.50 $1,457.0 $810.0 2 $6,860.00Switzerland 2.04% (2008) $14,449.59 $4,976.37 $4,161.0 $1,518.0 1 $32,777.00
Turkey 0.38% (2010) $383.63 $3,931.58 $463.0 $602.0 0 $527.00United Arab Emirates -- $33.14 $6,183.57 $2,790.0 $4,463.0 1 $434.00
Benchmarked Data
South KoreaSingapore
Switzerland
Switzerland
Chile Russia UAE Several Russia
Israel Israel Israel Israel Israel
-1
1
0
3
5
7
9
11
13
15PSI-1 PSI-2 PSI-4 PSI-5PSI-3
Leading Lagging Israel
Normalization Factor:
Raw Data is % GDP
GDP GDP GDP GDP
Stre
ngth
of
Rela
tions
hip

21
2.3.1. Private Sector and Industry Indicators Summary
The Private Sector and Industry category is led by the relationship between the U.S. and Switzerland as shown in Exhibit 15 and Exhibit 16. To compare, the U.S.– Israeli relationship falls in second position in terms of relative intensity. On average, the relative assessed concentration of the relationship between the U.S. and the target countries is lowest in this category as compared to the other three indicator categories. This perhaps suggests that private sector collaborative linkages have the most potential for growth from a U.S. perspective.
�� PSI-1: When data industry R&D (I-GERD) is normalized and expressed as a ratio to GDP, countries fall into a relatively narrow range of investment intensity. Nonetheless, South Korean and Israeli industries invest more heavily in R&D relative to the other countries in the Index.
�� PSI-2: The magnitude of U.S.–Israel trade in hi-tech goods is significant, placing the U.S–Israel relationship in hi-tech trade near the top of the benchmarked results for this indictor, and trailing only the trade between the U.S. and Singapore.
�� PSI-3: Switzerland’s strength as an industry hub is highlighted by its significant leadership position based on balance of the trade in the transactions of affiliates of multinational companies. An affiliate is a subsidiary or office of a U.S. company located in a foreign country or conversely a subsidiary or office of a non-U.S. company located in the U.S. Affiliate transactions measures the total balance of trade in goods and services between affiliates. Between the 2011 Index and the 2013 Index Switzerland has increased the gap between it and second-place Israel in this indicator.
�� PSI-4: This indicator tracks the number of dual-listed or cross-listed stocks on exchanges in the U.S. and target countries. Amongst the group of countries included in the Index there is a wide difference in the concentration of the relationship with the U.S. for this indicator. Germany is well ahead of the
3.67
3.67
4.09
8.65
9.64
10.32
13.47
13.68
15.88
23.85
25.00
34.87
0 10 20 30
BrazilRussiaTurkey
South KoreaFinland
JapanSweden
GermanyCanada
SingaporeIsrael
Switzerland
Exhibit 16: Aggregate Private Sector and Industry Results

22
The U.S.–Israel Innovation Index: Comparing International Linkages In Innovation
Secti
on 2
Be
nchm
arkin
g the
U.S.
– Is
rael
Rela
tions
hip A
gains
t Oth
er N
ation
sSe
ction
2
other included countries, with nearly 400 dual-listed stocks (German stock on U.S. markets or vice versa). Canada, Israel, and Brazil are closely grouped with around 50 such stocks; while none of the remaining countries total more than six cross-listed stocks. However, when this indicator is compared relative to GDP, Israel is positioned above Germany.
�� PSI-5: The data indicates a relatively high level of FDI activity flowing between Switzerland and the United States. This activity is dominated by the chemicals industry, which includes pharmaceuticals.
2.3.2. Highlight Discussion: High Technology Trade
The Private Sector and Industry category of the Index includes two indicators, PSI-2 and PSI-3, which measures trade flows in technology goods and/or services between the U.S. and the included countries. Data for both indicators suggests that Israel shows strength (relative to other included countries) as an exporter of high-technology goods and services to the United States. The trade balance in overall hi-tech goods between the U.S and Israel distinctly leans towards Israeli exports (U.S. imports). Data for indicator PSI-2 shows that Israel has the largest surplus of trade with the U.S. amongst the included countries based on the normalized data. In raw numbers, Israel had a surplus totaling approximately $6.2 billion in 2011. In absolute terms (raw data) the country with the largest trade surplus with the U.S. was South Korea, which had a positive high-technology trade balance with the U.S. of approximately $9.5 billion in 2012.
Indicator PSI-3 measures trade flows in affiliate transactions within multinational companies in hi-tech goods and services. Within affiliate transactions, Israel had a positive trade balance in 2008 with the U.S. of more than $880 million – the highest raw total within the group of included countries. Canada and Germany both registered a positive balance of more than $1.6 billion, while Switzerland registered a negative balance of more than $2.6 billion. By comparison the Canadian economy was approximately 6.5 times larger than Israel’s, the German more than 14 times larger, and the Swiss approximately twice as large.
Exhibit 17: U.S.–Israel Trade in High-Technology Merchandise (2011)
Industry Category U.S. Imports from Israel U.S. Exports to Israel
COMPUTER and ELECTRONIC PRODUCTS $2,112,428,371 $1,917,216,204
PHARMACEUTICALS and MEDICINES $5,818,967,263 $160,462,394
ELECTRICAL EQUIPMENT & COMPONENTS $315,651,872 $188,544,406
AEROSPACE PRODUCTS and PARTS $692,844,529 $739,474,576
MEDICAL EQUIPMENT and SUPPLIES $186,916,998 $120,723,924

23
2.4. Research and Development CategoryMetrics in the Research and Development category assess technical research, product development, and commercialization across government, private, and academic collaboration and binational activity. The statistics, thus, are cross-cutting, quantifying activity levels across government, industry and academia. Exhibit 18, below, presents summary results for this section of the Index, showing the full range of assessed scores by country, noting the U.S.–Switzerland S&T relationship tops the category. The U.S.–Israel relationship for this category falls into third place, also behind the U.S.–Singaporean relationship.
Switzerland’s leadership in this category is based on strong performance in the indicator which assesses R&D development performed by foreign commercial affiliates (MNCs and MOFAs), in a two-way relationship that generates significant benefit to the two countries. Both Switzerland and Singapore also fared well in the indicator covering IP protections.
Results as Compared to the 2011 Index
�� Singapore increased its relative strength, overtaking Israel, South Korea, Sweden and Germany, in part due to strong performance in the newly added indicator assessing intellectual property (IP) protection regimes.
�� Israel retains the third place position it held in the 2011 Index.
Exhibit 18: Research and Development Category Results
Russia
Turkey
BrazilFinlandCanada
GermanySwedenJapanSouth Korea
Israel
Singapore
Switzerland
0
5
10
15
20
25
30
35
40
Stre
ngth
of
Rela
tions
hip
24
The U.S.–Israel Innovation Index: Comparing International Linkages In Innovation
Secti
on 2
Be
nchm
arkin
g the
U.S.
– Is
rael
Rela
tions
hip A
gains
t Oth
er N
ation
sSe
ction
2
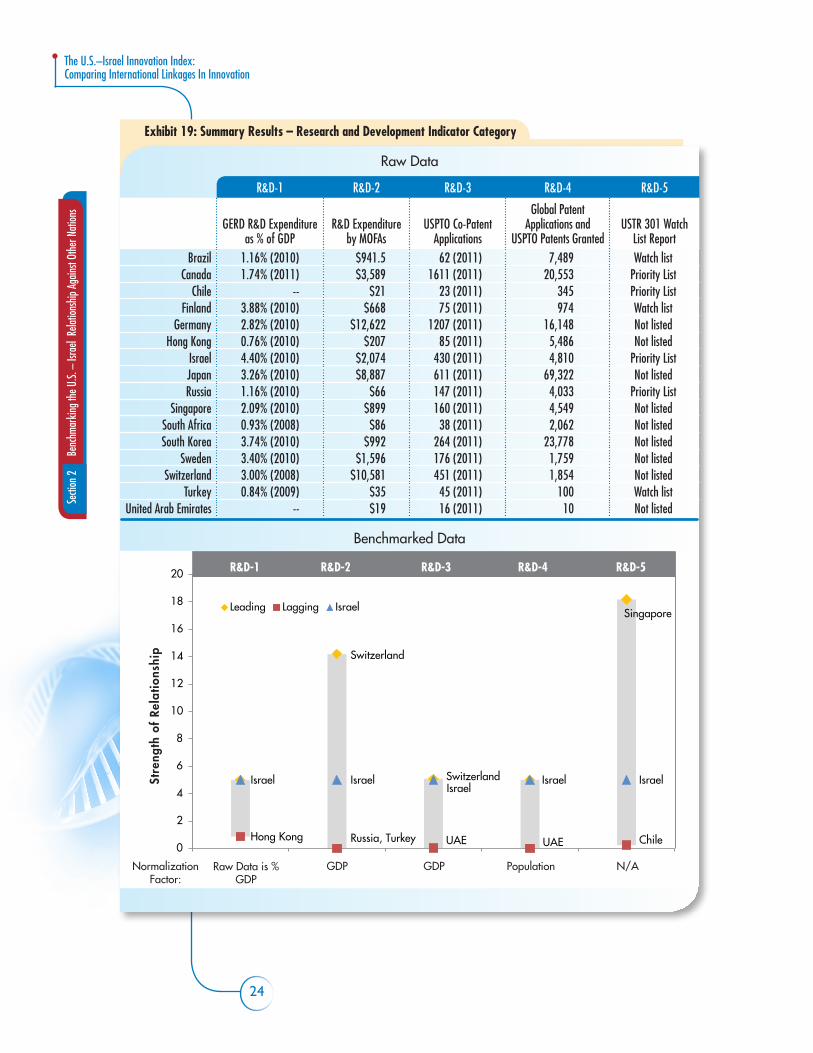
Exhibit 19: Summary Results – Research and Development Indicator Category
Raw Data
R&D-1 R&D-2 R&D-3 R&D-4 R&D-5
GERD R&D Expenditure as % of GDP
R&D Expenditure by MOFAs
USPTO Co-Patent Applications
Global Patent Applications and
USPTO Patents GrantedUSTR 301 Watch
List ReportBrazil 1.16% (2010) $941.5 62 (2011) 7,489 Watch list
Canada 1.74% (2011) $3,589 1611 (2011) 20,553 Priority ListChile -- $21 23 (2011) 345 Priority List
Finland 3.88% (2010) $668 75 (2011) 974 Watch listGermany 2.82% (2010) $12,622 1207 (2011) 16,148 Not listed
Hong Kong 0.76% (2010) $207 85 (2011) 5,486 Not listedIsrael 4.40% (2010) $2,074 430 (2011) 4,810 Priority ListJapan 3.26% (2010) $8,887 611 (2011) 69,322 Not listedRussia 1.16% (2010) $66 147 (2011) 4,033 Priority List
Singapore 2.09% (2010) $899 160 (2011) 4,549 Not listedSouth Africa 0.93% (2008) $86 38 (2011) 2,062 Not listedSouth Korea 3.74% (2010) $992 264 (2011) 23,778 Not listed
Sweden 3.40% (2010) $1,596 176 (2011) 1,759 Not listedSwitzerland 3.00% (2008) $10,581 451 (2011) 1,854 Not listed
Turkey 0.84% (2009) $35 45 (2011) 100 Watch listUnited Arab Emirates -- $19 16 (2011) 10 Not listed
Benchmarked Data
Switzerland
Switzerland
Singapore
Hong Kong Russia, Turkey UAE UAE Chile
Israel IsraelIsrael
Israel Israel
0
2
4
6
8
10
12
14
16
18
20 R&D-1 R&D-2 R&D-4 R&D-5R&D-3
Leading Lagging Israel
Normalization Factor:
Raw Data is % GDP
GDP GDP Population N/A
Stre
ngth
of
Rela
tions
hip
25
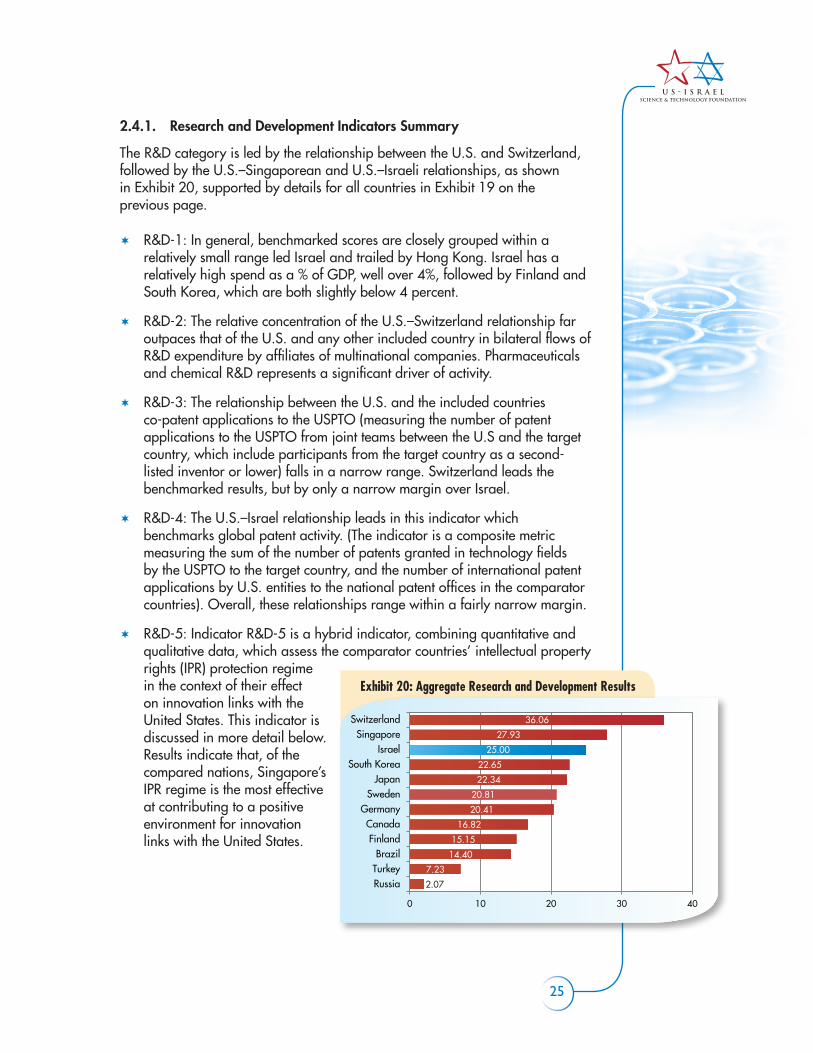
2.4.1. Research and Development Indicators Summary
The R&D category is led by the relationship between the U.S. and Switzerland, followed by the U.S.–Singaporean and U.S.–Israeli relationships, as shown in Exhibit 20, supported by details for all countries in Exhibit 19 on the previous page.
�� R&D-1: In general, benchmarked scores are closely grouped within a relatively small range led Israel and trailed by Hong Kong. Israel has a relatively high spend as a % of GDP, well over 4%, followed by Finland and South Korea, which are both slightly below 4 percent.
�� R&D-2: The relative concentration of the U.S.–Switzerland relationship far outpaces that of the U.S. and any other included country in bilateral flows of R&D expenditure by affiliates of multinational companies. Pharmaceuticals and chemical R&D represents a significant driver of activity.
�� R&D-3: The relationship between the U.S. and the included countries co-patent applications to the USPTO (measuring the number of patent applications to the USPTO from joint teams between the U.S and the target country, which include participants from the target country as a second-listed inventor or lower) falls in a narrow range. Switzerland leads the benchmarked results, but by only a narrow margin over Israel.
�� R&D-4: The U.S.–Israel relationship leads in this indicator which benchmarks global patent activity. (The indicator is a composite metric measuring the sum of the number of patents granted in technology fields by the USPTO to the target country, and the number of international patent applications by U.S. entities to the national patent offices in the comparator countries). Overall, these relationships range within a fairly narrow margin.
�� R&D-5: Indicator R&D-5 is a hybrid indicator, combining quantitative and qualitative data, which assess the comparator countries’ intellectual property rights (IPR) protection regime in the context of their effect on innovation links with the United States. This indicator is discussed in more detail below. Results indicate that, of the compared nations, Singapore’s IPR regime is the most effective at contributing to a positive environment for innovation links with the United States.
7.23
14.40
15.15
16.82
20.41
20.81
22.34
22.65
25.00
27.93
36.06
0 10 20 30 40
RussiaTurkeyBrazil
FinlandCanada
GermanySweden
JapanSouth Korea
IsraelSingapore
Switzerland
2.07
Exhibit 20: Aggregate Research and Development Results

26
The U.S.–Israel Innovation Index: Comparing International Linkages In Innovation
Secti
on 2
Be
nchm
arkin
g the
U.S.
– Is
rael
Rela
tions
hip A
gains
t Oth
er N
ation
sSe
ction
2
2.4.2. Highlight Discussion: Intellectual Property Protection Regimes
The R&D -5 indicator is based on the country’s categorization in the Special 301 Report produced annually by the USTR, and the number of technology patents granted by the USPTO to inventors from the comparator nations. The 301 Report identifies U.S. concerns over how the individual countries protecting and enforcing IPR affect U.S entities’ ability to conduct innovation in those countries. The report organizes countries into a Priority Watch List, and separately, a Watch List, of which the Priority List represents the highest level of U.S. concern. Using these two lists (as well as a third category of countries which are deemed to not require mention in the report) the comparator countries are categorized in three tiers. The 301 Report, however, only qualitatively discusses IPR issues for each county, so there is no way to determine relative import of issues or differences among countries within each tier. For example, Israel, Canada and Russia are all on the Priority Watch List, but for broadly different reasons. There isn’t any guidance on the relative severity or importance of any one issue, potential resolution, or way to provide any comparative analysis between countries within each tier.
To provide a more nuanced assessment of countries within each tier (Priority Watch List, Watch List, Not on the List), the Index overlays a second dataset, technology patents issued, to provide some relative insight and comparison. This second dataset is used to statistically differentiate the comparator nations within each tier so while Israel, Canada and Russia are all Priority Watch List countries, the level of technology patenting is relatively highest among Canadian inventors and significantly lower for Russian inventors. So, while the USTR report provides a high-level assessment of IPR, the number of patents offers insight into the actual level of cooperation. By merging patent activity into qualitative USTR reporting, the Index uses both the generalized USTR assessment as well as actual patent activity to provide a more robust metric to understand cooperation with the United States.
2.5. Future DirectionsThe U.S.–Israel Innovation Index and its corresponding report is to be produced on an ongoing basis. This year the Index has produced comparative statistical rankings of the S&T relationships between the U.S. and 16 countries. Rankings provide a basis for qualitative discussion of findings, supported by quantitative information derived from the individual indicators used to compile the Index. However, rankings do not, in and of themselves, provide identification of trends that might underlie the rankings. The USISTF hopes to improve upon this analysis by tracking and benchmarking these S&T relationships over time.
As we produce multiple editions of the Index, time-series data will emerge showing trends in the measured relationships. Time-series data will also be

27
developed on the individual indicators used to compile the Index. Time-series data was presented and/or included in the underlying dataset where available. A compete Data Annex is also available separately. In future yearly editions of the Index, annual updates to the existing indicator dataset will result in the development of time-series data that allows a more holistic discussion of trends within the individual indicators than was possible with one year of data.
3. Conclusion
The U.S.–Israel innovation-related relationship is strong and dynamic, underpinned by broad-based S&T relationships. The data indicate that these binational relationships crisscross governmental, commercial, academic, and human capital activities. While there is significant U.S.–Israel hi-tech collaboration, the data also provide insight and comparisons of the U.S. relationship with other leading technology and innovative nations. Most importantly, the Index provides an independent source of data and analysis that can support additional research and policy-making around international collaboration to stimulate hi-tech, scientific, and innovation-related cooperation.
The Index has also identified a number of themes that characterize the U.S.–Israel relationship, but there are several underlying features of this partnership that distinguish U.S. and Israel S&T activities.
�� Israel’s position as the world’s second-largest recipient of U.S. foreign assistance in FY2011 provides a distinct benefit in our analysis. While U.S. foreign aid contributes to innovative activities within Israel, overall, this factor is reflective of the historic and strategic relationship between the two countries. As one of the metrics utilized in the Index, the impact is particularly favorable to Israel given that five of the comparator countries received zero assistance. Other U.S. strategic partners, such as South Korea, have received sizeable assistance packages from the U.S. at previous points in time, but currently do not. The large foreign assistance package from the U.S. to Israel may have a distorting effect on the relationship measured by the Index, and may indirectly or directly drive binational activity within other indicators as well. Nonetheless, this dynamic is an important facet of the overall relationship between the U.S. and Israel, and cannot be ignored.
�� While not directly included in this analysis, long-standing and deep military-to-military ties support (and justify) many of the civilian and commercial activities between the U.S. and Israel. This relationship is replicated to some extent with South Korea and Germany, but less so with the other comparator countries. Israel's position as a leader in security and defense technology further reinforces this aspect of the relationship and has knock-on implications across many areas of S&T collaboration.

28
The U.S.–Israel Innovation Index: Comparing International Linkages In Innovation
Secti
on 2
Co
nclus
ionSe
ction
3
�� The United States and Israel maintain a set of unique bilateral organizations focused on science and technology collaboration that is not mirrored by any other country compared in this study, with the exception of The Korea–U.S. Science Cooperation Center (KUSCO) and the German Center for Research and Innovation (GCRI). These organizations and their objectives provide a unique lever to promote binational science and technology activity.
An inherent element of measuring linkages in innovation is accounting for the intangible factors that characterize a country’s approach to, and environment for, innovation. For example, within the countries analyzed in this study, Israel, and to a lesser extent South Korea, are characterized by a state of being on a 'war footing' where defense considerations are a prominent driving factor in many government and societal decisions. The Index aims to take these intangible factors into account, but doing so poses difficulties since our analysis is data-centric. Accordingly the Index is intended to be a living document, with annual improvements and updates to address the challenges raised.
Beyond the specific metrics tracked by the Index, U.S.–Israel cultural and societal ties transcend a large variety of non-scientific and non-technological elements. This underlying relationship and goodwill, while not evaluated in this study, permeates many of the countries’ technology and innovation activities. This deep relationship broadly impacts how the U.S. and Israel interact, and surely stimulate S&T activity that is capture and analyzed in the Index. Efforts to continue to support and develop the cultural relationship between the two countries will have positive impact on supporting the countries’ innovation-related linkages – a dynamic that also holds true for the other relationships examined in the Index.
The Index is intended to be a strong information resource for the public, governments, and industry. The USISTF welcomes comments and ideas for improvements to increase the utility for decision makers.

29
By CHARLES LEVINSON and ADAM ENTOUS, The Wall Street Journal, November 26, 2012
Israeli soldiers, above, this month watched the launch of an Iron Dome antimissile weapon designed to blast Hamas rockets out of the air.
TEL AVIV—Israel's Iron Dome rocket-defense system spent the past two weeks successfully blasting Hamas rockets out of the sky—many in dramatic nighttime explosions—helping to end the recent hostilities between Israel and Hamas in just seven days.
The battle to build Iron Dome, however, lasted years and provided fireworks of its own.
The Israeli Iron Dome missile defense system intercepts an incoming rocket on November 14, 2012. Courtesy Associated Press.
Before Wednesday's cease-fire, Iron Dome knocked down 421 rockets launched from Gaza and bound for Israeli cities, an 84% success rate, according to the Israeli military. The system limited Israeli fatalities to six during the seven days of bombardment. As a result, there was markedly less political pressure on Israel's decision makers to invade Gaza.
"If it was not for Iron Dome, for sure you would have seen a more aggressive action in Gaza by air and ground," said an Israel general and member of Israel's joint chiefs of staff.
For Israel's primary foes Iran, Hezbollah and Hamas, their weapon of choice—rockets and missiles—could soon prove nearly obsolete. That could alter the strategic calculation for Israel and its enemies alike. Despite initial Pentagon misgivings, President Barack Obama has given $275 million to the project since 2010 with the aim of reducing the rocket threat and eventually bolstering chances of a peace deal by making Israel feel more secure to agree to territorial concessions.
For years, Pentagon experts dismissed Iron Dome as doomed to fail and urged Israel to instead try a cheaper U.S. approach. Iron Dome faced similar skepticism at home. But an Israeli mathematician-general, along with a labor-organizer-turned-defense-minister, pushed the project through, overcoming the opposition of some of Israel's most powerful military voices.
In 2004, then-Brig. Gen. Daniel Gold was named director of the Ministry of Defense's Research and Development department, responsible for overseeing the development of new weapons systems. Mr. Gold, who also has a Ph.D. in mathematics, took up the rocket challenge with a zealot's gusto, according to people involved in the project.
That August, he put out a call to defense companies for proposed antirocket systems. Few took notice within the defense establishment.
Israel's Hezbollah foes in Lebanon first turned to short-range rockets in the mid-1990s. The first Hamas-fired Palestinian rocket hit Israel in early 2001. The crude projectiles rarely hit their intended targets, yet over the years they rained down by the thousands—some 4,000 by 2008.
Almost no one in Israel's military brass believed rocket defense could work. Palestinian rockets from Gaza fly erratically and can hit Israeli communities within seconds. Most are just a few feet long and a few inches wide.
ANNEX 1: Israel's Iron Dome Defense Battled to Get Off Ground

30
The U.S.–Israel Innovation Index: Comparing International Linkages In Innovation
Secti
on 2
Isr
ael's
Iron
Dom
e Def
ense
Bat
tled t
o Get
Off G
roun
dAn
nex
1
Gen. Gold and his team, deep in the bowels of the Defense Ministry in central Tel Aviv, reviewed the options. They considered lasers and giant shotguns. In March 2005, they agreed on a patched-together concept for the system that would become Iron Dome, drawing on technologies from three Israeli defense companies.
He called up Rafael Advanced Defense Systems Ltd., an Israeli weapons maker, and asked the company to head the project. A 2008 audit by the Israeli state comptroller, an independent government-oversight office, criticized this step, saying he bypassed required approvals from the military's general staff, the defense minister and the Israeli government.
That report didn't lead to formal charges of wrongdoing. But it fueled years of heated political criticism of the project and its backers—showing how close the highly controversial Iron Dome idea came to never happening at all.
Gen. Gold said in an interview that the auditor's report misrepresented some facts, declining to be more specific. He disputes any allegation that he broke rules, saying he simply sidestepped red tape.
"I just canceled all the unnecessary bureaucracy," Gen. Gold said. "I left only the most crucial bureaucracy needed for success."
At the time, according to Gen. Gold as well as to the auditor's report, he told Rafael's chairman of the problem that no one in the government had agreed to pay for the project. Rafael's chairman, Ilan Biran, confirms that account.
In an interview, Gen. Gold said he told Mr. Biran he could use $5 million to $6 million from his research budget to get the project started if Rafael would agree to match. Mr. Biran said in an interview that he agreed to take the risk after his engineers assured him they could pull off the feat.
It was no ordinary feat. The project's specs demanded a system that could continuously scan all of Gaza, detect a rocket the instant it was fired, no matter how big or small, pinpoint its likely strike location, and finally, if it was going to hit a city, blast it out of the sky with a missile. The system needed to do all that within about 15 seconds.
Gen. Gold also said the interceptor missiles would need to cost about one-tenth of what your average air-to-air missile costs, or else Israel's rocket-flinging foes would be able to bankrupt Israel. And instead of taking 10 years or more to develop, typical for new weapons systems, Iron Dome needed to deploy in half that.
In the summer of 2006, war broke out with Hezbollah in Lebanon. Over the 33 days, Hezbollah fired more than 4,200 rockets into northern Israel, killing 44 Israelis. Suddenly, stopping rockets was a government priority.
So in August 2006, Gen. Gold and his team briefed the man who was then Israel's minister of defense, Amir Peretz, on Iron Dome. Mr. Peretz had spent most of his career as a labor organizer. As a civilian with little military experience, he had been an unlikely choice as defense minister. He hails from Sderot, a southern Israeli town that borders Gaza and has borne the brunt of Palestinian rocket fire.
During his brief stint as Defense Minister from 2006 to 2007, Mr. Peretz was well known for a photograph during the Lebanon War of him reviewing the battlefield through binoculars with lens caps on. When he resigned as defense minister in 2007 over his handling of that war, his political career seemed doomed.
In the weeks following the Lebanon War, then-Prime Minister Ehud Olmert was briefed on Iron Dome for the first time. Nearly all the military advisers in the room slammed

31
the project, Mr. Peretz recalled. Mr. Olmert refused to divert government funds for Iron Dome, according to Mr. Peretz.
Mr. Olmert didn't return calls seeking comment. In an interview with the Israeli newspaper Yediot Ahranot, Mr. Olmert praised Mr. Peretz's persistence in pushing Iron Dome.
Instead of scaling back the program, Gen. Gold upped the ante. In November 2006, he "directed Rafael to begin full-scale development of the Iron Dome project when Rafael had no order to do so," according to the Israeli comptroller's audit report. "The directive was not under his authority," the report concluded.
"I cannot say that the report is wrong," said Yossi Drucker, who headed the team at Rafael overseeing the system's development. "But if you want to achieve something in a very short time…you have sometimes to bypass the bureaucracy."
The gamble paid off. In early 2007, Mr. Peretz threw his full ministerial weight behind the project, committing another $10 million in Ministry of Defense funds to keep Iron Dome alive. The government's auditors later found he violated regulations by committing the funds without military or government approval for the project.
But if the government hoped to have enough Iron Dome batteries to provide meaningful protection against rockets, it would need more money than that. Israel's Defense Ministry approached the U.S. administration of President George W. Bush with a request for hundreds of millions of dollars for the system. The reception at the Pentagon was frosty, according to current and former U.S. defense officials.
Mary Beth Long, the assistant secretary of defense who oversaw the Iron Dome review process, sent a team of U.S. military engineers to Israel to meet with the developers. After the trip, in a meeting in her office, the team voiced skepticism about the technology, citing poor performance in initial testing, Ms. Long said in an interview.
Rafael's Mr. Drucker recalls an even harsher U.S. response. He said the U.S. team told them: "This is something that cannot be done."
Some U.S. military officials argued that Israel should instead consider using a version of the U.S.'s Vulcan Phalanx system, which the Army was deploying in Iraq to try to shoot down incoming rockets, current and former defense officials say. Gen. Gold's team had already considered and dismissed the Phalanx system.
By the end of 2007, Mr. Olmert and Mr. Peretz's successor as defense minister, Ehud Barak, had both come around to backing Iron Dome. That December, the government gave the project its first big cash infusion of roughly $200 million.
As it became clear that Israel was going to be spending hundreds of millions of dollars on rocket defense, the industry scrambled. Rafael's rivals lobbied for their proposals to be reconsidered.
Israel's government auditors began investigating the project and issued a report singling out Gen. Gold for launching a billion-dollar project without the necessary approvals. "Brig. Gen. Gold decided on the development of Iron Dome, determined the timetables and ordered predevelopment and full development before the relevant authorities had approved the project," the report said.
But Iron Dome was making lightning progress. An all-star team of engineers assembled from across Israeli defense companies worked around the clock. Pensioners were called out of retirement. The contest to design the warhead for the interceptor missile pitted a 25-year-old woman, fresh out of university, against a 30-year veteran of Rafael.

32
The U.S.–Israel Innovation Index: Comparing International Linkages In Innovation
Secti
on 2
Isr
ael's
Iron
Dom
e Def
ense
Bat
tled t
o Get
Off G
roun
dAn
nex
1
And in 2009, during the first field test, an Iron Dome prototype successfully intercepted an incoming rocket.
Iron Dome got a significant boost soon after President Obama came to office in 2009. Mr. Obama visited Sderot as a presidential candidate and told his aides to find a way to help boost Israel's defenses from the makeshift rockets, his aides said, although defense officials at the time still doubted Iron Dome was the way.
As president, Mr. Obama tapped Colin Kahl to run the Pentagon office overseeing U.S. military policy in the Middle East. Mr. Kahl found the Iron Dome request on his desk, decided to take another look and had what he later described as a light-bulb moment. "Ding, ding, ding. It just made sense," Mr. Kahl said.
In 2009, the peace process topped Mr. Obama's foreign-policy agenda. But the administration's call for a freeze in Jewish settlement growth badly strained ties with Israel's right-wing prime minister, Benjamin Netanyahu. Top Obama administration advisers saw supporting Iron Dome as a chance to shore up U.S.–Israel security relations and balance some of the political strains.
At the direction of a White House working group headed by then-National Security Council senior director Dan Shapiro (who today is the U.S. ambassador to Israel), the Pentagon sent a team of missile-defense experts to Israel in September 2009 to re-evaluate Iron Dome. The decision raised eyebrows in some Pentagon circles. Iron Dome was still seen as a rival to the Phalanx system, and previous assessment teams had deemed Iron Dome inferior.
In its final report, presented to the White House in October, the team declared Iron Dome a success, and in many respects, superior to Phalanx. Tests showed it was hitting 80% of the targets, up from the low teens in the earlier U.S. assessment. "They came in and basically said, 'This looks much more promising…than our system,'" said Dennis Ross, who at the time was one of Mr. Obama's top Middle East advisers.
That summer, Mr. Kahl's office drafted a policy paper recommending that the administration support the Israeli request for roughly $200 million in Iron Dome funding.
Mr. Ross said the threat posed by Iran was also part of the calculation to invest in Iron Dome. By showing how seriously the U.S. took Israel's security needs, the administration hoped Israel would "provide us the time and space to see if there was a diplomatic way out of the Iranian issue," Mr. Ross said.
The system went operational in March 2011. It shot down its first Palestinian rocket on April 7. Within three days it had shot down eight more rockets. But it wasn't until the recent Gaza flare-up that the system made its mark on the public consciousness.
Mr. Peretz went to a bar mitzvah earlier this week. When the onetime political pariah walked into the reception hall, 200 people rose to give him a spontaneous standing ovation, according to aides in his office. On the fourth day of the war, Gen. Gold, now retired, sat at a cafe in central Tel Aviv. Two women stopped and asked to have their photographs taken with him.
Reprinted by permission of The Wall Street Journal, Copyright © 2012 Dow Jones & Company, Inc. All Rights Reserved Worldwide. License number 3122040909648

33
ANNEX 2: Summary Results by Indicator Category
Exhibit 21: Results – Government Category Indicators
BR
CA
FI
DE
HK
IL
RU
SGSE
JP, CH
TR
KR
US-IL, -BR
US-CA
US-CL
US-FI, -AE, -SG
US-DE
US-RU, -HK
US-JP
US-ZA
US-SK
US-CH
US-SE
US-TR
US-BR
US-IL
All Others
US-RUUS-SG
US-ZA
US-TR
US-SE
All Others
US-IL
All Others
US-CA, -CL-IL, -SG, -ZA, -SE,-CH, AE
0
2
4
6
8
10
12
14
Stre
ngth
of
Rela
tions
hip
GOV-2: S&T Treaties
GOV-1: R&D Budget
Appropriations
GOV-3: U.S. Foreign Ops
Spending
GOV-4: U.S. S&T
CommissionsGOV-5:
Trade Agreements
Benchmark
Countries’ Abbreviation: AE (United Arab Emirates), BR (Brazil), CA (Canada), CH (Switzerland), CL (Chile), DE (Germany), FI (Finland), HK (Hong Kong), IL (Israel), JP (Japan), KR (South Korea), RU (Russia), SE (Sweden), SG (Singapore), TR (Turkey), ZA (South Africa)
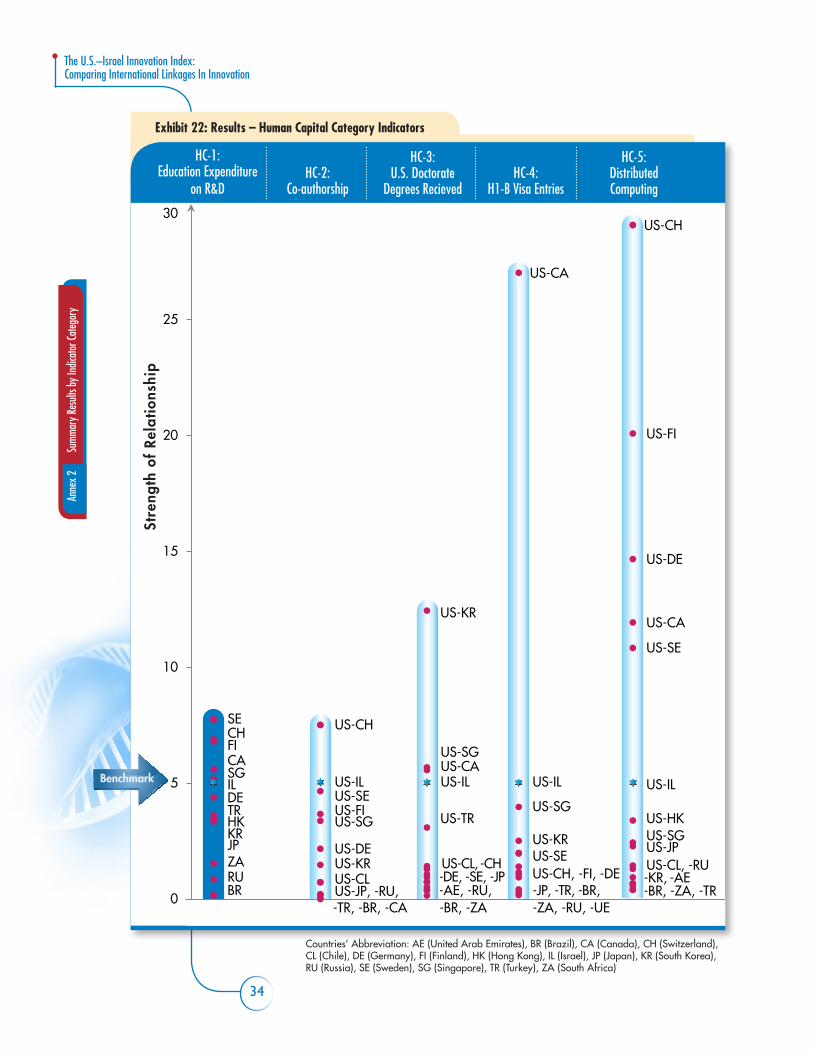
34
The U.S.–Israel Innovation Index: Comparing International Linkages In Innovation
Secti
on 2
Su
mmar
y Res
ults b
y Ind
icato
r Cat
egor
yAn
nex
2
Exhibit 22: Results – Human Capital Category Indicators
CAFI
DE
HK
IL
TR
RU
SG
ZA
KR
SECH
JP
BR US-JP, -RU,
US-FI
US-DE
US-IL
US-CL
US-SG
US-KR
US-SE
US-CH
US-CA
US-CL, -CH
US-IL
US-SG
US-KR
US-TR
US-CA
US-IL
US-SG
US-KR
US-CH, -FI, -DE-JP, -TR, -BR,
US-CA
US-CL, -RU
US-FI
US-DE
US-HK
US-IL
US-JP
-KR, -AE
US-SG
US-SE
US-CH
0
5
10
15
20
25
30
-DE, -SE, -JP-AE, -RU, -BR, -ZA, -TR
US-SE
-TR, -BR, -CA -BR, -ZA -ZA, -RU, -UE
Stre
ngth
of
Rela
tions
hip
HC-2: Co-authorship
HC-1: Education Expenditure
on R&D
HC-3: U.S. Doctorate
Degrees RecievedHC-4:
H1-B Visa Entries
HC-5: Distributed Computing
Benchmark
Countries’ Abbreviation: AE (United Arab Emirates), BR (Brazil), CA (Canada), CH (Switzerland), CL (Chile), DE (Germany), FI (Finland), HK (Hong Kong), IL (Israel), JP (Japan), KR (South Korea), RU (Russia), SE (Sweden), SG (Singapore), TR (Turkey), ZA (South Africa)

35
Exhibit 23: Results – Private Sector and Industry Category Indicators
BRCA
FI
DE
HK
ILJP
RU
SG
SECH
TR
KR
CL US-RU
US-CA
US-CLUS-FI
US-DE, -SE
US-HK
US-IL
US-JP
US-KR
US-CH
US-AE
US-SG
US-CA
US-CL, -BR
US-FI, -RU, -TR
US-DE
US-HK
US-IL
US-JP
US-ZA, -KR
US-SE, -SG
US-CH
US-All Others
US-CA
US-DE
US-IL
US-BR
US-CA
US-CL,-KR
US-AE, -FI
US-DE
US-HK
US-IL
US-JP
US-SG
US-ZA
US-SE
US-CH
0
2
4
6
8
10
12
14
US-ZAUS-TR
US-AE US-TR, -RU
Stre
ngth
of
Rela
tions
hip
PSI-2: U.S. Hi-Tech
Trade
PSI-1: Industry R&D Expenditure
PSI-3: Foriegn Affliates
Activity
Benchmark
PSI-4: Cross-listed Companies
PSI-4: FDI By
NAICS Codes
Countries’ Abbreviation: AE (United Arab Emirates), BR (Brazil), CA (Canada), CH (Switzerland), CL (Chile), DE (Germany), FI (Finland), HK (Hong Kong), IL (Israel), JP (Japan), KR (South Korea), RU (Russia), SE (Sweden), SG (Singapore), TR (Turkey), ZA (South Africa)

36
The U.S.–Israel Innovation Index: Comparing International Linkages In Innovation
Secti
on 2
Su
mmar
y Res
ults b
y Ind
icato
r Cat
egor
yAn
nex
2
Exhibit 24: Results – Research and Development Category Indicators
CA
FI
DE
HK
IL
JP
BR, RU
SG
ZA
KRSE
TR
TK
US-CL
US-FIUS-DE
US-IL
US-JP
US-SG
US-SE
US-CH
US-CA
US-FIUS-DE
US-HK
US-IL
US-SG
US-SE
US-CH
US-All Others
US-SG
US-TR
US-HK
US-IL
US-AE
US-CL
US-JP,KR
US-CA
US-FI
US-DE
US-HK
US-IL
US-JP
US-RU
US-SG
US-ZA
US-KR
US-SEUS-CH
US-TR
US-AE,
US-CL0
2
4
6
8
10
12
14
16
18
US-All OthersUS-All Others
-BR
Stre
ngth
of
Rela
tions
hip
R&D-2: R&D Spend of
Foreign Affliates
R&D-1: R&D as
Percent GDPR&D-3:
USPTO Co-patentsR&D-4:
Total PatentR&D-5:
301 Watch List
Benchmark
Countries’ Abbreviation: AE (United Arab Emirates), BR (Brazil), CA (Canada), CH (Switzerland), CL (Chile), DE (Germany), FI (Finland), HK (Hong Kong), IL (Israel), JP (Japan), KR (South Korea), RU (Russia), SE (Sweden), SG (Singapore), TR (Turkey), ZA (South Africa)

This Page Intentionally Left Blank
