the use of securities holdings statistics (shs) for
TRANSCRIPT

IFC Bulletin No 39 1
The use of Securities Holdings Statistics (SHS) for designing new euro area financial integration indicators1
Linda Fache Rousová2 and Antonio Rodríguez Caloca3
Abstract
Since the start of 2014, the European System of Central Banks (ESCB) has been compiling new security-by-security data on holdings of debt securities and shares by euro area residents on a quarterly basis – the Securities Holdings Statistics (SHS). This paper illustrates the value added of this new data source for measuring the degree of financial integration in the euro area. More specifically, using the first collected quarter (with the reference date of 2013 Q4), the paper presents new indicators for cross-border securities holdings for different holding and issuing sectors as well as different types of securities. Furthermore, it explains how these new indicators expand (and differ from) the set of previously available quantity-based indicators of financial integration in the euro area.
Keywords: Securities Holdings Statistics, security-by-security data, micro data, financial integration, quantity-based indicators, securities, international financial markets.
JEL classification: F36, G1, G10, G15.
1 The authors thank to Maciej Anacki, Andreas Bauman, Stefano Borgioli, Ioannis Ganoulis, Mauro
Grande, Jani Matilainen, Carlos Sánchez Muñoz, Pierre Sola, Jörg Reddig, Maria Luisa Viticchiè and the participants to the Irving Fischer Committee (IFC) conference on 4 and 5 September 2014 as well as colleagues in the internal DG-S/SDC seminar for their useful comments but the authors remain solely responsible for any remaining errors or omissions.
The views expressed in this paper are solely those of the authors and do not necessarily reflect the opinion of the European Central Bank.
2 European Central Bank (ECB): [email protected]. 3 European Central Bank (ECB): [email protected].

2 IFC Bulletin No 39
Introduction
The recent financial crisis has highlighted the importance of granular information about the financial system, which would help policy-makers to implement effective policies and tailor-made solutions for the specific needs of ailing market segments. As a result, several central banks all over the world are setting up or expanding several micro-databases such as securities databases with issuances and holdings information, credit register information, supervisory information as well as surveys on households and small and medium enterprises (SMEs).
This paper uses one such new data source – the Securities Holdings Statistics (SHS), which has been collected by the Eurosystem/European System of Central Banks (ESCB) since the beginning of 2014 on the basis of regulation ECB/2012/24. It includes quarterly information on holdings of individual debt securities and shares by institutional sectors in the euro area. The high granularity of the data, which are collected on a security-by-security basis, allows for the development of a wide range of new indicators.
This paper presents new quantity-based financial integration indicators using the new SHS data.4 More specifically, using the first collected quarter (with the reference date of 2013 Q4), we present new indicators for cross-border securities holdings for different holding and issuing sectors as well as different types of securities. The latter is particularly important from a theoretical point of view because a pre-requisite for any measurement of financial integration is the identification of same assets in terms of risk-adjusted returns. In a perfectly integrated market, when controlling for the same (type of) asset, the location of both the issuer and the holder should not play a role (see, e.g., Adam et al., 2002).
We focus on quantity-based indicators of financial integration, since the currently available indicators for the euro area are rather limited. Notably, the set of the quantity-based indicators that are regularly used in the ECB’s Financial Integration Report (ECB, 2014a) is only limited to two individual holder sectors (banks and investment funds) or aggregated for all holder sectors, as well as limited to a few types of securities. Moreover, the distinction between individual issuer countries is usually restricted to those of the euro area.
In this respect, the SHS indicators provide high value added to the previously available indicators as they cover all main holder sectors in the euro area and provide information on holdings of individual securities, so that any breakdown by issuer country, issuer sector or type of security is available. Moreover, as the new indicators are based on one harmonized data collection rather than several different data sources, the degree of integration captured by these indicators is comparable across the different holder sectors and types of securities as no conceptual, methodological or measurement differences arise within this data collection.
The development of new financial integration indicators for the euro area, which are specific to individual sectors and/or market segments, as done in this paper, is particularly important from a monetary policy perspective in recent times.
4 Quantity-based indicators refer to indicators that are based on asset quantities (stocks or flows) as
opposed to price-based indicators that focus on asset prices. Most quantity-based indicators of financial integration show the quantity of cross-border investment as a share of total investment.

IFC Bulletin No 39 3
This is because significant financial fragmentation remains in the euro area, which in turn hinders the smooth implementation of the single monetary policy and the balanced transmission of its effects across different countries/regions and sectors, as recently pointed out by Draghi (2014). Therefore, it is of crucial importance to identify and to monitor the most ailing market segments with the help of indicators that cover all economic sectors in a comparable way, so that policy makers can implement effective policies that would be tailor-made for the needs of these market segments.
The rest of the paper is organized as follows. Section 2 introduces the SHS data. Section 3 highlights its value added for the measurement of the degree of financial integration, analysing the available quantity-based indicators. Section 4 presents the new indicators of financial integration using the first collected quarter of 2013 Q4 SHS data, while Section 5 briefly concludes.
“Who holds what” – Securities Holdings Statistics (SHS) as a new data source
In the wake of the financial crisis of 2008, the Eurosystem/ESCB launched a project towards the development of a new type of granular and harmonised statistics on holdings of securities, the Securities Holdings Statistics (SHS). After the assessment of the merits and costs, the European Central Bank (ECB) issued a new regulation (Regulation ECB/2012/24) in 2012 (ECB, 2012), further accompanied by the corresponding ECB guideline (Guideline ECB/2013/7) in 2013 (ECB, 2013),5 which provide a sound legal basis for this data collection (see Sola and Strobbe, 2010, for more details).
The scope and content of the SHS data collection
The SHS project covers three distinct sets of data on holdings of securities, which are grouped in two modules by the type of holder. The SHS Sector data module (SHSS) provides information on the holdings by each sector in each country such as households in Germany or Monetary Financial Institutions (MFIs6) in France. It includes two sets of data: (i) holdings of securities by investors resident in the euro area, and (ii) holdings of euro area securities by investors resident outside the euro area and deposited with a euro area custodian.7 Furthermore, the SHS Group data module (SHSG) contains individual holdings by the 25 largest banking groups with head offices in the euro area. See Chart 1 for a schematic overview.
5 The ECB Regulation puts forward the rules for the data reporting by the reporting agents (e.g.,
commercial banks), while the ECB guideline contains the rules on how the national central banks (e.g., Banque de France) shall report the data to the European Central Bank (ECB).
6 The MFIs sector comprises deposit taking corporations and money market funds, excluding national central banks, unless indicated otherwise.
7 Most non-euro area EU countries (except for UK, SE and HR) also collect the SHSS data, though only on a voluntary (best effort) basis.

4 IFC Bulletin No 39
Overview of the two SHS modules Chart 1
SHS module Type of data
The main feature of the SHS data is the security-by-security collection and compilation of the data on holdings of securities with ISIN codes8 of four instrument types: short- and long-term debt securities, quoted shares and investment funds shares/units9. The collected information focusses on the information on the holder side (e.g., amount held of a particular ISIN), while the data are enriched during the compilation process with reference data from the Centralised Securities Database (ECB, 2010), which contains rich information on individual securities such as the type of security, the name and sector of the issuer, the maturity and issue dates, price, outstanding amount/market capitalisation. Additional attributes and/or dimensions can be obtained by linking the SHS data with other databases (e.g., Dealogic or European DataWarehouse)10 using a common identifier (ISIN or the name of the issuer are one of the most common options). See Table 1, for an overview of the main dimensions available in the SHS data.
8 Holdings of securities without ISIN codes are collected on a voluntary basis with limited
breakdowns available and are not yet included in the SHS data compiled for the 2013 Q4 period. 9 The investment funds shares/units are further broken down into money market and non-money
market funds shares/units. ECB (2012) provides a more comprehensive overview of the different instruments and sectors included.
10 See http://www.dealogic.com/ and https://eurodw.eu/ respectively.

IFC Bulletin No 39 5
The SHS data used in this paper – holdings by euro area sectors (SHSS) in 2013 Q4
The two legal acts for SHS data collection inter-alia set the beginning of the collection to the data referring to end-2013 (i.e., 2013 Q4). The data are reported by the national central banks (NCBs) to the ECB with a lag of 70 days after the reference period, while the compilation of the first quarter took around one more month (i.e., until end-April of 2014 for 2013 Q4 data).11 Therefore, this paper presents cross-sectional data (rather than time-series data) as only the first quarter of SHS data was available at the time when writing this paper.12 Furthermore, since the previously available quantity-based financial integration indicators can be replicated by information in the SHSS module (see next section), this paper uses this module with information on holdings by institutional sectors.
SHS added value: Comparison with previously available financial integration indicators
The set of previously available quantity-based indicators of financial integration is rather limited. For instance, the latest issue of the ECB’s annual publication on financial integration (ECB, 2014a) presents five charts with quantity-based financial integration indicators (see Annex 1), in which the holder information is only limited
11 The duration of the data compilation process is expected to improve over the first year. 12 Prior to 2013, the E(S)CB ran an ‘experimental’ phase of this type of data collection for holdings by
euro area sectors. The ‘experimental’ SHS data were provided to the ECB by the NCBs on a voluntary basis, where available, and thus suffered from several caveats in the quality of the data such as the lack of harmonization and completeness.
Main breakdowns in the SHS dataset
(when enriched with data on ratings) Table 1
Holder data Who holds?
Security data What is held?
Issuer data Who has issued?
Holding value How much is it worth?
SHSS ISIN Issuer name Positions
–Sector Instrument type Issuer sector Transactions
–Country Currency Issuer country Nominal value
–Sector in a country Maturity date NACE classification Market value
SHSG Market capitalisation Issuer MFI code Accrued income
–Individual banking groups Outstanding amount Issuer rating
Price
Eligibility
Security rating
Note: Information not yet available in the first compiled quarter of 2013 Q4 is in italics.

6 IFC Bulletin No 39
to two holder sectors (banks and investment funds) or it is aggregated for all sectors. In addition, only a few types of securities in terms of instrument class, issuer sector and country are distinguished.
Although the set of all quantity-based financial integration indicators for the euro area is likely to be somewhat wider (European Commission, 2014), the three underlying data sources for these charts are the most widely used in this context – at least to our knowledge. These three data sources are (i) the ECB’s Monetary Financial Institutions’ (MFIs’) Balance Sheet Items (BSI), (ii) the ECB’s Investment Funds (IVF) statistics and (iii) the IMF’s Coordinated Portfolio Investment Survey (CPIS) data. For completeness, we note that information on cross-border holdings by the ICPF sector is also available – from the ECB’s Insurance Corporation and Pension Funds (ICPFs) statistics, though with a shorter time span (since 2009).
In Charts 2 to 4, we show that the comprehensiveness of the new SHSS data allows us to replicate to a large extent all the afore-mentioned indicators using this alternative data source, although currently only for one data point (end-2013) given that the SHS data collection has just started. In particular, we point out that the new SHSS data as a single data source can serve all these indicators, whereas for the initial set of indicators three different data sources are used (BSI, IVF and CPIS). Hence, the SHSS data allow capturing the degree of financial integration in a comparable way across the different holder sectors and types of securities, as no conceptual, methodological or measurement differences arise within this data collection.
On the contrary, when comparing the actual figures obtained from the SHSS data with those from the previously available data sources, the vast range of possible differences between the statistics (data collection, compilation, coverage and derogations, measurement, valuation, sector classification, etc.) have to be carefully considered. In particular, the SHSS data presented in this paper only include holdings of securities with ISIN codes and are thus likely to have a somewhat lower coverage than other (aggregated) statistics. For instance, the comparison with national accounts data for the analysed period (ECB, 2014b) suggests that the total SHSS data cover around 80% holdings of debt securities and shares by euro area residents.13
Despite the various conceptual and measurement differences between the BSI and SHSS statistics, notably differences in valuation and coverage,14 Chart 2 shows similar profiles for the SHSS and BSI indicators of financial integration for holdings by euro area MFIs, with only small differences between the obtained figures (around two percentage points for most of the bars). The similar results are reinforced by the fact that both the BSI and SHSS statistics follow the “locational” approach and thus rely on the same definition of the reporting population, which consists of MFIs located in a given country (including foreign branches).15, 16
13 For more information on the links between national accounts and the SHS data, see Lavrador et al.
(2012). 14 Colangelo and Fache Rousová (2012) provide an analysis of the differences between BSI and SHES
statistics, where SHES refer to the “Experimental SHS data” collected prior to 2014. 15 See the 6th recital of ECB (2012).

IFC Bulletin No 39 7
One exception is the share of domestic holdings, which is significantly higher in the SHSS data than in the BSI data. The difference is particularly pronounced for the holdings of debt securities issued by MFIs (67.5% and 57.2% for SHSS and BSI data, respectively, see Chart 2B). A possible explanation for this difference stems from the treatment of “own” holdings (i.e. MFI holdings of their own securities) since the BSI reporting framework requires MFIs to report securities data net of their own holdings, whereas the SHS reporting framework includes all holdings.
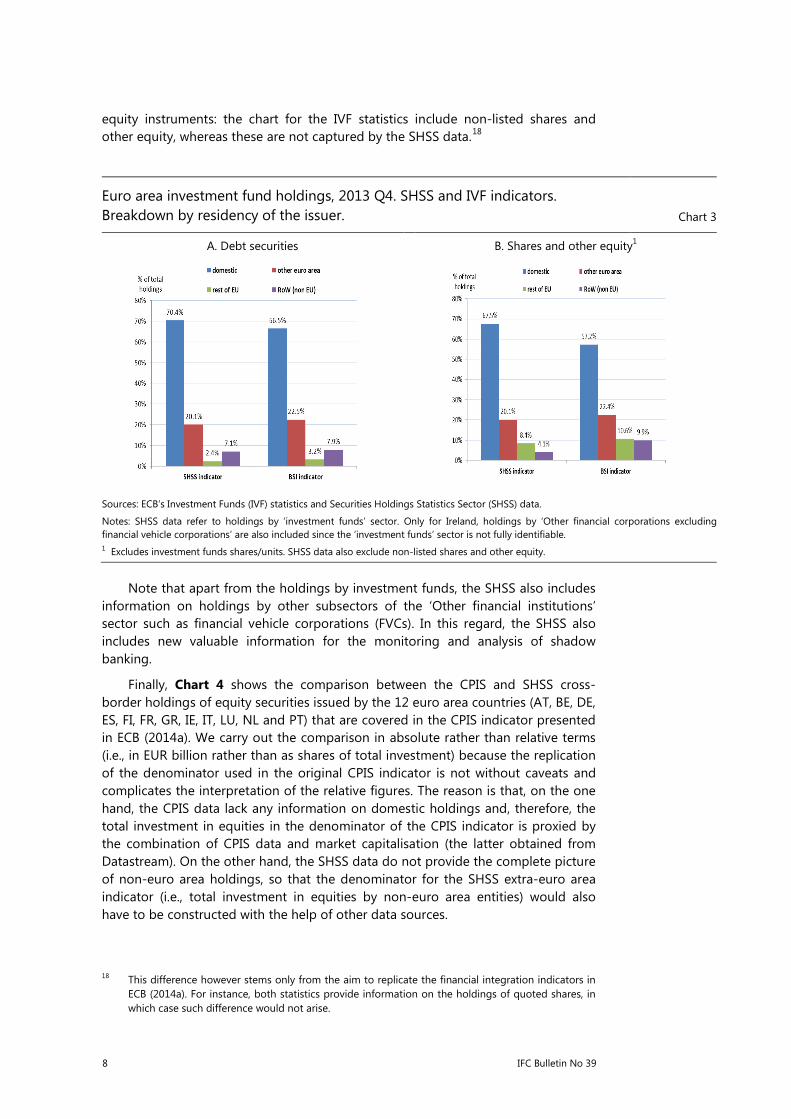
The IVF and SHSS indicators for holdings by euro area investment funds (Chart 3) take on similar values for all bars (the differences stay below three percentage points). The high degree of similarity is likely to stem from the way the data are collected, since the collection of the IVF statistics relies to a large extent on a security-by-security reporting, which in turn is the building block of all SHSS data. In addition, as in case of MFIs, the definition of the reporting population in the two statistics is the same.17
Still, many conceptual differences remain between the two statistics including discrepancies in valuation, derogations and the treatment of information on securities without ISIN codes. For instance, although the IVF statistics is subject to derogations (up to 5% of smallest investment funds in a country), the missing tail of the distribution is estimated and thus included in the resulting aggregates. On the other hand, given the high level of detail in the SHSS data, the derogations are not corrected for in SHSS. In addition, the comparison for holdings of shares and other equity (Chart 3B) suffers from another caveat, which is the different coverage of
16 Note that the fact that foreign branches (which are not separate legal entities) are included in the
domestic MFI sector may lead to seemingly higher cross-border holdings in both statistics and thus to an overestimation of the degree of financial integration, though the impact is likely to be limited.
17 See the 4th recital of ECB (2012).
Euro area MFIs holdings of debt securities, 2013 Q4. SHSS and BSI indicators. Breakdown by residency of the issuer. Chart 2
A. Debt securities issued by corporates and sovereigns. B. Debt securities issued by MFIs.
Sources: ECB’s MFI Balance Sheet Items (BSI) statistics and Securities Holdings Statistics Sector (SHSS) data.
8 IFC Bulletin No 39
equity instruments: the chart for the IVF statistics include non-listed shares and other equity, whereas these are not captured by the SHSS data.18
Note that apart from the holdings by investment funds, the SHSS also includes information on holdings by other subsectors of the ‘Other financial institutions’ sector such as financial vehicle corporations (FVCs). In this regard, the SHSS also includes new valuable information for the monitoring and analysis of shadow banking.
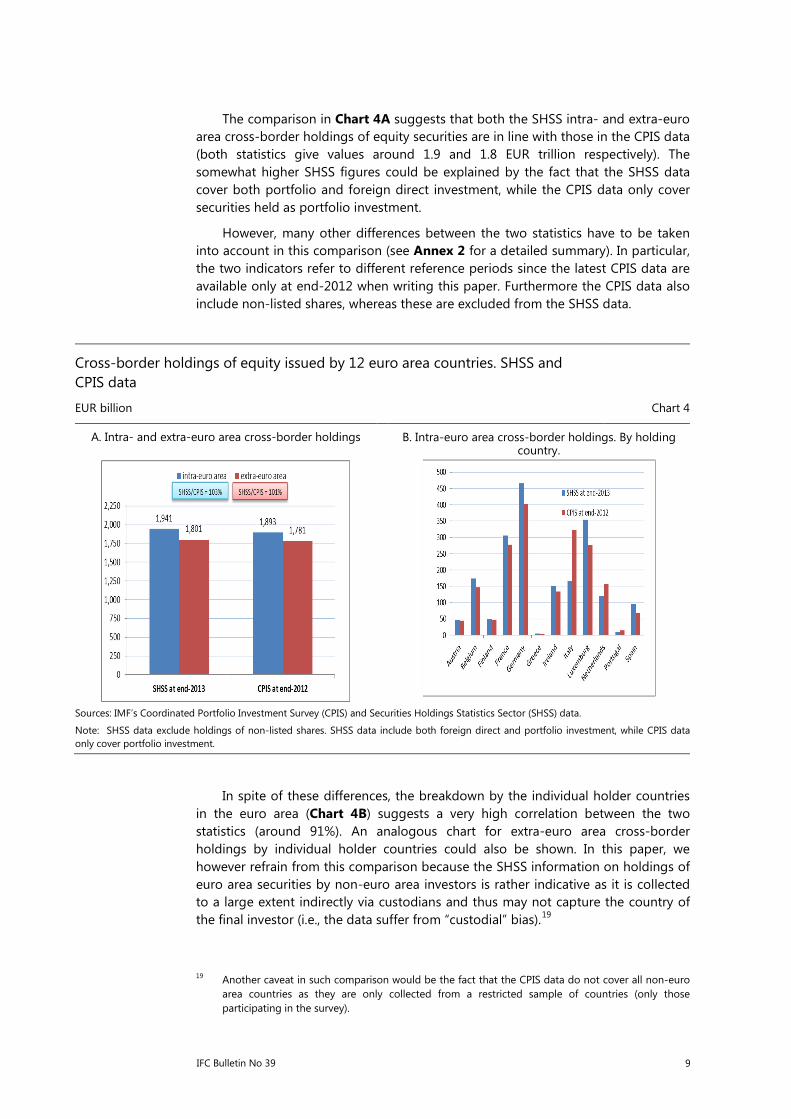
Finally, Chart 4 shows the comparison between the CPIS and SHSS cross-border holdings of equity securities issued by the 12 euro area countries (AT, BE, DE, ES, FI, FR, GR, IE, IT, LU, NL and PT) that are covered in the CPIS indicator presented in ECB (2014a). We carry out the comparison in absolute rather than relative terms (i.e., in EUR billion rather than as shares of total investment) because the replication of the denominator used in the original CPIS indicator is not without caveats and complicates the interpretation of the relative figures. The reason is that, on the one hand, the CPIS data lack any information on domestic holdings and, therefore, the total investment in equities in the denominator of the CPIS indicator is proxied by the combination of CPIS data and market capitalisation (the latter obtained from Datastream). On the other hand, the SHSS data do not provide the complete picture of non-euro area holdings, so that the denominator for the SHSS extra-euro area indicator (i.e., total investment in equities by non-euro area entities) would also have to be constructed with the help of other data sources.
18 This difference however stems only from the aim to replicate the financial integration indicators in
ECB (2014a). For instance, both statistics provide information on the holdings of quoted shares, in which case such difference would not arise.
Euro area investment fund holdings, 2013 Q4. SHSS and IVF indicators. Breakdown by residency of the issuer. Chart 3
A. Debt securities B. Shares and other equity1
Sources: ECB’s Investment Funds (IVF) statistics and Securities Holdings Statistics Sector (SHSS) data.
Notes: SHSS data refer to holdings by ‘investment funds’ sector. Only for Ireland, holdings by ‘Other financial corporations excluding financial vehicle corporations’ are also included since the ‘investment funds’ sector is not fully identifiable. 1 Excludes investment funds shares/units. SHSS data also exclude non-listed shares and other equity.
IFC Bulletin No 39 9
The comparison in Chart 4A suggests that both the SHSS intra- and extra-euro area cross-border holdings of equity securities are in line with those in the CPIS data (both statistics give values around 1.9 and 1.8 EUR trillion respectively). The somewhat higher SHSS figures could be explained by the fact that the SHSS data cover both portfolio and foreign direct investment, while the CPIS data only cover securities held as portfolio investment.
However, many other differences between the two statistics have to be taken into account in this comparison (see Annex 2 for a detailed summary). In particular, the two indicators refer to different reference periods since the latest CPIS data are available only at end-2012 when writing this paper. Furthermore the CPIS data also include non-listed shares, whereas these are excluded from the SHSS data.
In spite of these differences, the breakdown by the individual holder countries in the euro area (Chart 4B) suggests a very high correlation between the two statistics (around 91%). An analogous chart for extra-euro area cross-border holdings by individual holder countries could also be shown. In this paper, we however refrain from this comparison because the SHSS information on holdings of euro area securities by non-euro area investors is rather indicative as it is collected to a large extent indirectly via custodians and thus may not capture the country of the final investor (i.e., the data suffer from “custodial” bias).19
19 Another caveat in such comparison would be the fact that the CPIS data do not cover all non-euro
area countries as they are only collected from a restricted sample of countries (only those participating in the survey).
Cross-border holdings of equity issued by 12 euro area countries. SHSS and CPIS data
EUR billion Chart 4
A. Intra- and extra-euro area cross-border holdings B. Intra-euro area cross-border holdings. By holding country.
Sources: IMF’s Coordinated Portfolio Investment Survey (CPIS) and Securities Holdings Statistics Sector (SHSS) data.
Note: SHSS data exclude holdings of non-listed shares. SHSS data include both foreign direct and portfolio investment, while CPIS data only cover portfolio investment.

10 IFC Bulletin No 39
SHS opportunities: The new (unlimited) set of SHSS financial integration indicators
The richness of the SHSS data allow us to design euro area financial integration indicators covering a much wider set of holding sectors and instruments types than those presented in the previous section. At extreme, the security-by-security nature of the data provides us with the possibility to build quantitative indicators of financial integration for any security held in the euro area and for any combination (group) of these securities. Given that the number of securities covered in the SHS data is more than half million, the set of new SHSS quantity-based indicators that can be constructed is in practice unlimited.20
Rather than being comprehensive in this section, we illustrate the value added of the SHS data by only focussing on a few selected financial integration indicators. In line with previous section, all the indicators show the breakdown by the residency of the issuer in order to distinguish domestic from cross-border holdings, while the latter is further broken down into intra-euro area and extra-euro area cross-border holdings. We present the indicators using a top-down drilling approach, i.e. by going from more to less aggregated levels.
SHSS euro area securities holdings. By main instrument types and residency of the issuer. Chart 5
A. In percentage of total holdings B. In EUR trillion
Source: Securities Holdings Statistics Sector (SHSS) data.
Note: MMF=money market funds shares/units, non-MMF = non-money market funds shares/units.
Chart 5 with the highest aggregation level of total euro area securities holdings shows the breakdown of domestic and cross-border securities holdings by the main
20 The number of all (non-empty) subsets that can be created from a set of 500,000 securities is equal
to (2^500,000)-1, which in turn is a number that cannot be easily calculated with current computational power – it has more than 150 000 decimal digits. See, e.g. http://www.mathsisfun.com/activity/subsets.html.

IFC Bulletin No 39 11
instrument types in SHS data. In particular, compared to the previously available indicators, the chart shows that investment funds shares/units can be split into money market funds (MMF) and non-money market funds (non-MMF).
MMF shares are found to be the least integrated instrument type, as the domestic share exceeds 80% (Chart 5A). Moreover, nearly no euro area investors invest into the MMF shares issued in non-euro area countries. On the other hand, quoted shares, followed by debt securities are found to be the most integrated instrument types as the domestic share stays below 50% for both instruments. There is however a significant difference between the two instruments regarding the intra- vs. extra-euro area cross-border holdings. Euro area investors invests around 30% of total debt securities held in those issued by other euro area countries, whereas the corresponding share for quoted shares is only around 16%.
SHSS euro area holdings of debt securities. By holder sectors and residency of the issuer. Chart 6
A. In percentage of total holdings B. In EUR trillion
Source: Securities Holdings Statistics Sector (SHSS) data.
Note: NFCs=non-financial corporations, MFIs=monetary financial institutions, OFIs=other financial institutions, ICPFs=Insurance corporations and pension funds, GG=general government, HHs=households.
In addition, Chart 5B shows the absolute holdings amounts of euro area investors recorded in the SHSS data, which sum up to around 22 trillion EUR at end-2013. Debt securities with volumes of nearly 13 trillion EUR are by far the most important instrument held by euro area investors. Given its dominance, we focus on this market segment in the following and drill down into the next main breakdowns available, namely into the main holder and issuer sectors.21, 22
21 We distinguish the main six holder sectors and the main five issuer sectors. However, the SHS data
allow for a more detailed distinction on both sides. On the holder side, the SHS Regulation (Regulation ECB/2012/24) distinguishes further sub-sectors within all the main holder sectors up to one (the non-financial corporations sector), so that 15 different holder sectors could in principle be available for the euro area holdings data. The reporting of some of the subsectors is however not available in some countries.
12 IFC Bulletin No 39
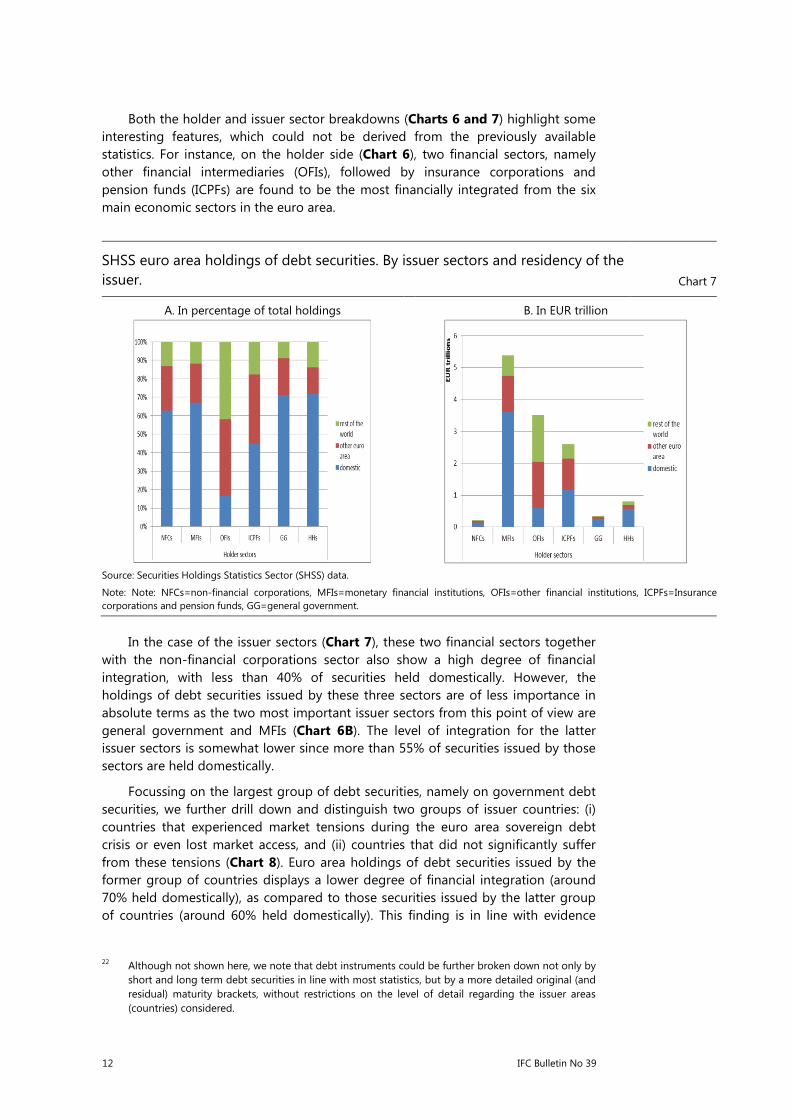
Both the holder and issuer sector breakdowns (Charts 6 and 7) highlight some interesting features, which could not be derived from the previously available statistics. For instance, on the holder side (Chart 6), two financial sectors, namely other financial intermediaries (OFIs), followed by insurance corporations and pension funds (ICPFs) are found to be the most financially integrated from the six main economic sectors in the euro area.
SHSS euro area holdings of debt securities. By issuer sectors and residency of the issuer. Chart 7
A. In percentage of total holdings B. In EUR trillion
Source: Securities Holdings Statistics Sector (SHSS) data.
Note: Note: NFCs=non-financial corporations, MFIs=monetary financial institutions, OFIs=other financial institutions, ICPFs=Insurance corporations and pension funds, GG=general government.
In the case of the issuer sectors (Chart 7), these two financial sectors together with the non-financial corporations sector also show a high degree of financial integration, with less than 40% of securities held domestically. However, the holdings of debt securities issued by these three sectors are of less importance in absolute terms as the two most important issuer sectors from this point of view are general government and MFIs (Chart 6B). The level of integration for the latter issuer sectors is somewhat lower since more than 55% of securities issued by those sectors are held domestically.
Focussing on the largest group of debt securities, namely on government debt securities, we further drill down and distinguish two groups of issuer countries: (i) countries that experienced market tensions during the euro area sovereign debt crisis or even lost market access, and (ii) countries that did not significantly suffer from these tensions (Chart 8). Euro area holdings of debt securities issued by the former group of countries displays a lower degree of financial integration (around 70% held domestically), as compared to those securities issued by the latter group of countries (around 60% held domestically). This finding is in line with evidence
22 Although not shown here, we note that debt instruments could be further broken down not only by
short and long term debt securities in line with most statistics, but by a more detailed original (and residual) maturity brackets, without restrictions on the level of detail regarding the issuer areas (countries) considered.

IFC Bulletin No 39 13
from the available price-based indicators in the last ECB’s Financial Integration Report (ECB, 2014a).23 The lower degree of integration for the former group of countries can be explained, to a large extent, by the home bias recorded by the financial sector, notably by the MFI sector (Chart 9).
SHSS euro area holdings of government debt securities. By groups of issuer countries and by the residency of the issuer. Chart 8
A. In percentage of total holdings B. In EUR trillion
Source: Securities Holdings Statistics Sector (SHSS) data.
SHSS euro area holdings of government debt securities. By holder sector, groups of issuer countries and the residency of the issuer. Chart 9
A. In percentage of total holdings B. In EUR trillion
Source: Securities Holdings Statistics Sector (SHSS) data.
Note: NFCs=non-financial corporations, MFIs=monetary financial institutions, OFIs=other financial institutions, ICPFs=Insurance corporations and pension funds, GG=general government, HHs: households.
23 Note that no such comparison with quantity-based indicators is possible given that, to our
knowledge, no other data source allows constructing such indicators.
14 IFC Bulletin No 39
Conclusions
The recent financial crisis has highlighted the importance of granular information about the financial system, which would help policy-makers to implement effective policies that are tailor-made for the specific needs of ailing market segments. The SHS data, by providing security-by-security information on holding of securities, significantly help to fill this informational gap for the euro area financial system.
This paper shows that the SHS data can inter-alia be used for the design of new quantity-based financial integration indicators in the euro area, which in turn enhance the monitoring of the degree of financial integration within (and beyond) the single monetary union. The comparison with the previously available indicators confirms the validity of the SHS data as a new data source for the design of these indicators. In particular, the results show that the SHS data provide aggregated figures, which are by and large in line with the previously available statistics, but that can now be obtained from one single data collection.
Moreover, the examples provided in this paper illustrate that the granularity and the broad scope of the SHS data allow for a significant enlargement of the current toolkit of financial integration indicators. In particular, the security-by-security nature of the data allows for an unlimited drilling-down regarding the different types of securities until an individual security is reached. Regarding the holding side, the SHS Sector (SHSS) data are also of high added value as they provide information on the holdings by all main holding sectors, while previously available statistics only covered holdings by some (mainly financial) sectors or provided aggregates for all holding sectors.

IFC Bulletin No 39 15
Annex 1: Quantity-based indicators of financial integration in ECB’s Financial Integration Report (ECB, 2014a)
Source: ECB’s MFI Balance Sheet Items (BSI) statistics. For more information, see here.
Note: The numbering of the chart in this Annex is as in ECB (2014a). The last data points of end-2013 are used in Chart 1 in the main text of this paper.

16 IFC Bulletin No 39
Source: ECB’s Investment Funds Balance Sheet Statistics (IVF). For more information, see here.
Note: The numbering of the chart in this Annex is as in ECB (2014a). The last data points of end-2013 are used in Chart 2 in the main text of this paper.
Source: IMF’s Coordinated Portfolio Investment Survey (CPIS) and Datastream. For more information on CPIS data, see here.
Note: Intra-euro area cross-border holdings are based on CPIS data for 12 euro area countries (AT, BE, DE, ES, FI, FR, GR, IE, IT, LU, NL and PT). The numbering of the chart in this Annex is as in ECB (2014a). The nominators of the last two data points at end-2012 are used in Chart 4 in the main text of this paper.

IFC Bulletin No 39 17
Annex 2: SHSS and CPIS statistics. Methodological summary
Securities Holding Statistics
by Sector (SHSS) Coordinated Portfolio
Investment Survey (CPIS)
Source ECB IMF
Brief description of the dataset
The SHSS data, collected on a security-by-security basis (based on Regulation ECB/2012/24), and subsequently linked to the Centralised Securities Database (CSDB), regards securities held by euro area institutional sectors, and securities issued by euro area residents and held by non-euro area institutional sectors. The reporting agents (MFIs, IFs, FVCs and custodians) provide positions and transactions over the covered quarter (or the statistical information needed to derive such transactions).
The CPIS provides information on economies' cross-border holdings of portfolio investment securities (based on the Coordinated Portfolio Investment Survey Guide, second edition). The coverage of the CPIS is augmented with information from two other surveys, namely Securities Held as Foreign Exchange Reserves, and Securities Held by International Organizations. The concepts and principles underlying the CPIS are aligned with the IMF’s Balance of Payments (BOP) and International Investment Position Manual, sixth edition (BPM6). For more information by reporting country, see the CPIS Metadata Questionnaire.
Frequency Quarterly Semi-annual (since 2013), annual (since 2001)
Timeliness Data disseminated to the users with a lag of around 112 calendar days
Data disseminated to the users with a lag of around 270 calendar days
Valuation Both market values (including accrued income for debt securities) and nominal values are available.
Market values. The accrued income for debt securities is not included for all countries.
Instrument types covered Short- and long-term debt, quoted and investment funds shares. Non-listed shares are excluded. Securities classified as Foreign Direct Investment (FDI) according to the balance of payments data are included.
Equity securities and long- and short-term debt securities. Non-listed shares are included. Only securities that are not part of the balance of payments data categories of direct investment, reserve assets, or financial derivatives, are included.
Reporting countries 18 euro area countries and 7 EU non-euro area countries (excl. UK, SE and HR), the latter on a voluntary (best effort) basis.
74 economies submitted end-December 2013 data.
Non-ISIN data Not yet included for 2013-Q4 Included
Third Party Holdings (TPH) data
Collected to complement holdings by euro area non-financial sectors and to estimate holdings of euro area securities by non-euro area investors.
Not directly collected, may be estimated for selected countries
Note: TPH refer to holdings by non-resident investors reported by resident custodians.

18 IFC Bulletin No 39
References
Adam, K., Jappelli T., Menichini A. M., Padula M., and M. Pagano (2002), Analyse, Compare, and Apply Alternative Indicators and Monitoring Methodologies to Measure the Evolution of Capital Market Integration in the European Union, Report to the European Union.
Colangelo, A. and L. Fache Rousová (2012), Holdings of MFI securities: A comparison between securities holdings experimental statistics and MFI balance sheet items statistics, mimeo.
Draghi, M. (2014), Financial Integration and Financial Union, speech at the conference for the 20th anniversary of the establishment of the European Monetary Institute, Brussels 12 February 2014. http://www.ecb.europa.eu/press/key/date-/2014/html/sp140212.en.html.
European Central Bank (2010), The Centralised Securities Database in brief. http://www.ecb.europa.eu/pub/pdf/other/centralisedsecuritiesdatabase201002en.pdf.
European Central Bank (2012), Regulation (EU) No 1011/2012 of the European Central Bank of October 2012 concerning statistics on holdings of securities (ECB/2012/24), Official Journal of the European Union. http://www.ecb.europa.eu-/ecb/legal/pdf/l_30520121101en00060024.pdf.
European Central Bank (2013), Guideline of the European Central Bank of 22 March 2013 concerning statistics on holdings of securities (ECB/2013/7), Official Journal of the European Union. http://www.ecb.europa.eu/ecb/legal/pdf/l_12520130507en-00170033.pdf.
European Central Bank (2014a), Financial Integration in Europe. http://www.ecb.europa.eu/pub/pdf/other/financialintegrationineurope201404en.pdf?761c6bda155e07247154d37621973262.
European Central Bank (2014b), Quality assessment of from-whom-to-whom tables derived from securities holding statistics: 2013 Q4 data, mimeo.
European Commission (2014), European Financial Stability and Integration Report (EFSIR). http://ec.europa.eu/internal_market/economic_analysis/docs/efsir/140428-efsir-2013_en.pdf.
Lavrador, I., Peronaci, R. and N. Silva (2012), Security-by-security Data on Holdings of Securities: The Importance for Euro Area and National Accounts, Irving Fisher Committee on Central-Bank Statistics, IFC Bulletin No. 36: Proceedings of the Sixth IFC Conference on “Statistical issues and activities in a changing environment”, Bank for International Settlements, Basel, August 2012.
Sola, P. and F. Strobbe (2010), Addressing data gaps revealed by the financial crisis: European Central Bank statistics on holdings of securities, Irving Fisher Committee on Central-Bank Statistics, IFC Bulletin No. 34: Proceedings of the IFC Conference on “Initiatives to address data gaps revealed by the financial crisis”, Bank for International Settlements, Basel, August 2010.